Abstract
Occupational health risk assessments of exposure to VOCs still need to be extensively studied to improve the safety standards in the industry. Based on the monitoring of organic pollutants at various workstations in a truck tire factory in Jiangsu Province, both semi-quantitative and quantitative health risk assessment methods were employed to assess health risk levels. The findings indicated that VOCs were categorized into five classes, which included alkanes, aromatics, halocarbons, carbon disulfide, and oxygenated volatile organic compounds (OVOCs). The highest concentration of total volatile organic compounds (TVOCs) was found in shaping workshop; alkanes were the most abundant class (74.2%), followed by aromatics (24.02%) and OVOCs (1.96%). Although the results of the semi-quantitative risk assessment showed that most of the organic compounds had low R values, various kinds of VOCs were detected; particularly, many harmful organic compounds (such as toluene, ethyl benzene) were detected in all the sampling sites. The quantitative risk in the calendering and vulcanizing workshop exceeded the acceptable level; both the carcinogenic risk of ethylbenzene in the tire-strip storage room, and trichloroethylene and perchloroethylene in the calendering workshop were unacceptable. Thus, the calendering and vulcanizing processes in rubber tire manufacturing should be priority-controlled processes.
1. Introduction
Volatile organic compounds (VOCs) encompass a variety of chemical species, such as hydrocarbons, halocarbon, and oxygenated hydrocarbons [1]. Some of the VOC species, such as benzene, 1,3-butadiene, and formaldehyde, are toxic and adversely affect human health [2]. Direct exposure to VOCs may cause irritation of the eyes, nose, throat, and lungs as well as damage to the liver, kidney, and central nervous system. Long-term exposure to even low levels could cause asthma, cardiovascular disease, and serious cancers [3,4,5]. It was reported that various VOCs, including aromatic VOCs, have the potential to seep into the cytoplasm, where they can target organs or organelles within body. This can result in oxidative damage to proteins, polyunsaturated fatty acids, and DNA, ultimately leading to age-related diseases such as cancer [6]. It was reported that exposure to 10 ppb ethene can lead to a lifetime risk of cancer death amounting to about 70 per 100,000 [7].
Inhaled air is a primary route for exposure to volatile organic compounds in workshops. Various agencies, including the World Health Organization (WHO), US Environmental Protection Agency (USEPA), Office of Environmental Health Hazard Assessment (OEHHA) in California, and Agency for Toxic Substances and Disease Registry (ATSDR), have developed quantitative estimates of the carcinogenic and non-carcinogenic risk from inhalation exposure to VOCs [2,8,9,10,11]. The potency values of the reference concentrations (RfCs) for non-cancer risk assessments, and the inhalation cancer unit risk (UR) values for cancer-risk assessments are summarized, which provide the data foundation for the quantitative assessment of health risks from VOCs exposure.
Using a four-level VOC emission source categorization system, the total anthropogenic VOC emission in China is estimated to be approximately 117.4 × 10⁴ t [12]. Motor vehicles are identified as the primary source of VOC emissions, with industries following closely behind. Previous research has primarily investigated VOC emissions from typical and large-scale pollution industries like the paint coating and petroleum industry in China [13,14,15]. The health risk assessment of exposure to VOCs has been extensively studied in different environments in China [16,17,18,19]. On this basis, corresponding pollution prevention and control measures have been proposed. Green development is highly significant for the tire industry.
With the rapid increase in car ownership in China, the demand for tires is increasing year by year, which leads to the rapid growth of tire production. In order to solve the problem of pollution in the tire production process, this paper analyzes the emission characteristics of the main processing stages. The main purpose of this study is to evaluate the health risk of VOC exposure to occupational workers under normal working conditions. Ambient samples were collected from different workshops in the tire factory, namely the refining workshop, the calendering workshop, the shaping workshop, and the vulcanizing workshop. The spectrum of VOC components and their toxic effect potency values were examined. A previous study on the rubber product manufacturing process was conducted in southwestern China [20]; both semi-quantitative health risk assessments and quantitative health risk assessments of exposure to VOCs were estimated for employees in different indoor workshops. We anticipate that this study will enhance the comprehension of the pollution levels and emission characteristics of VOCs in rubber tire factories, aiding in the development of appropriate control measurements.
2. Materials and Methods
2.1. Sampling
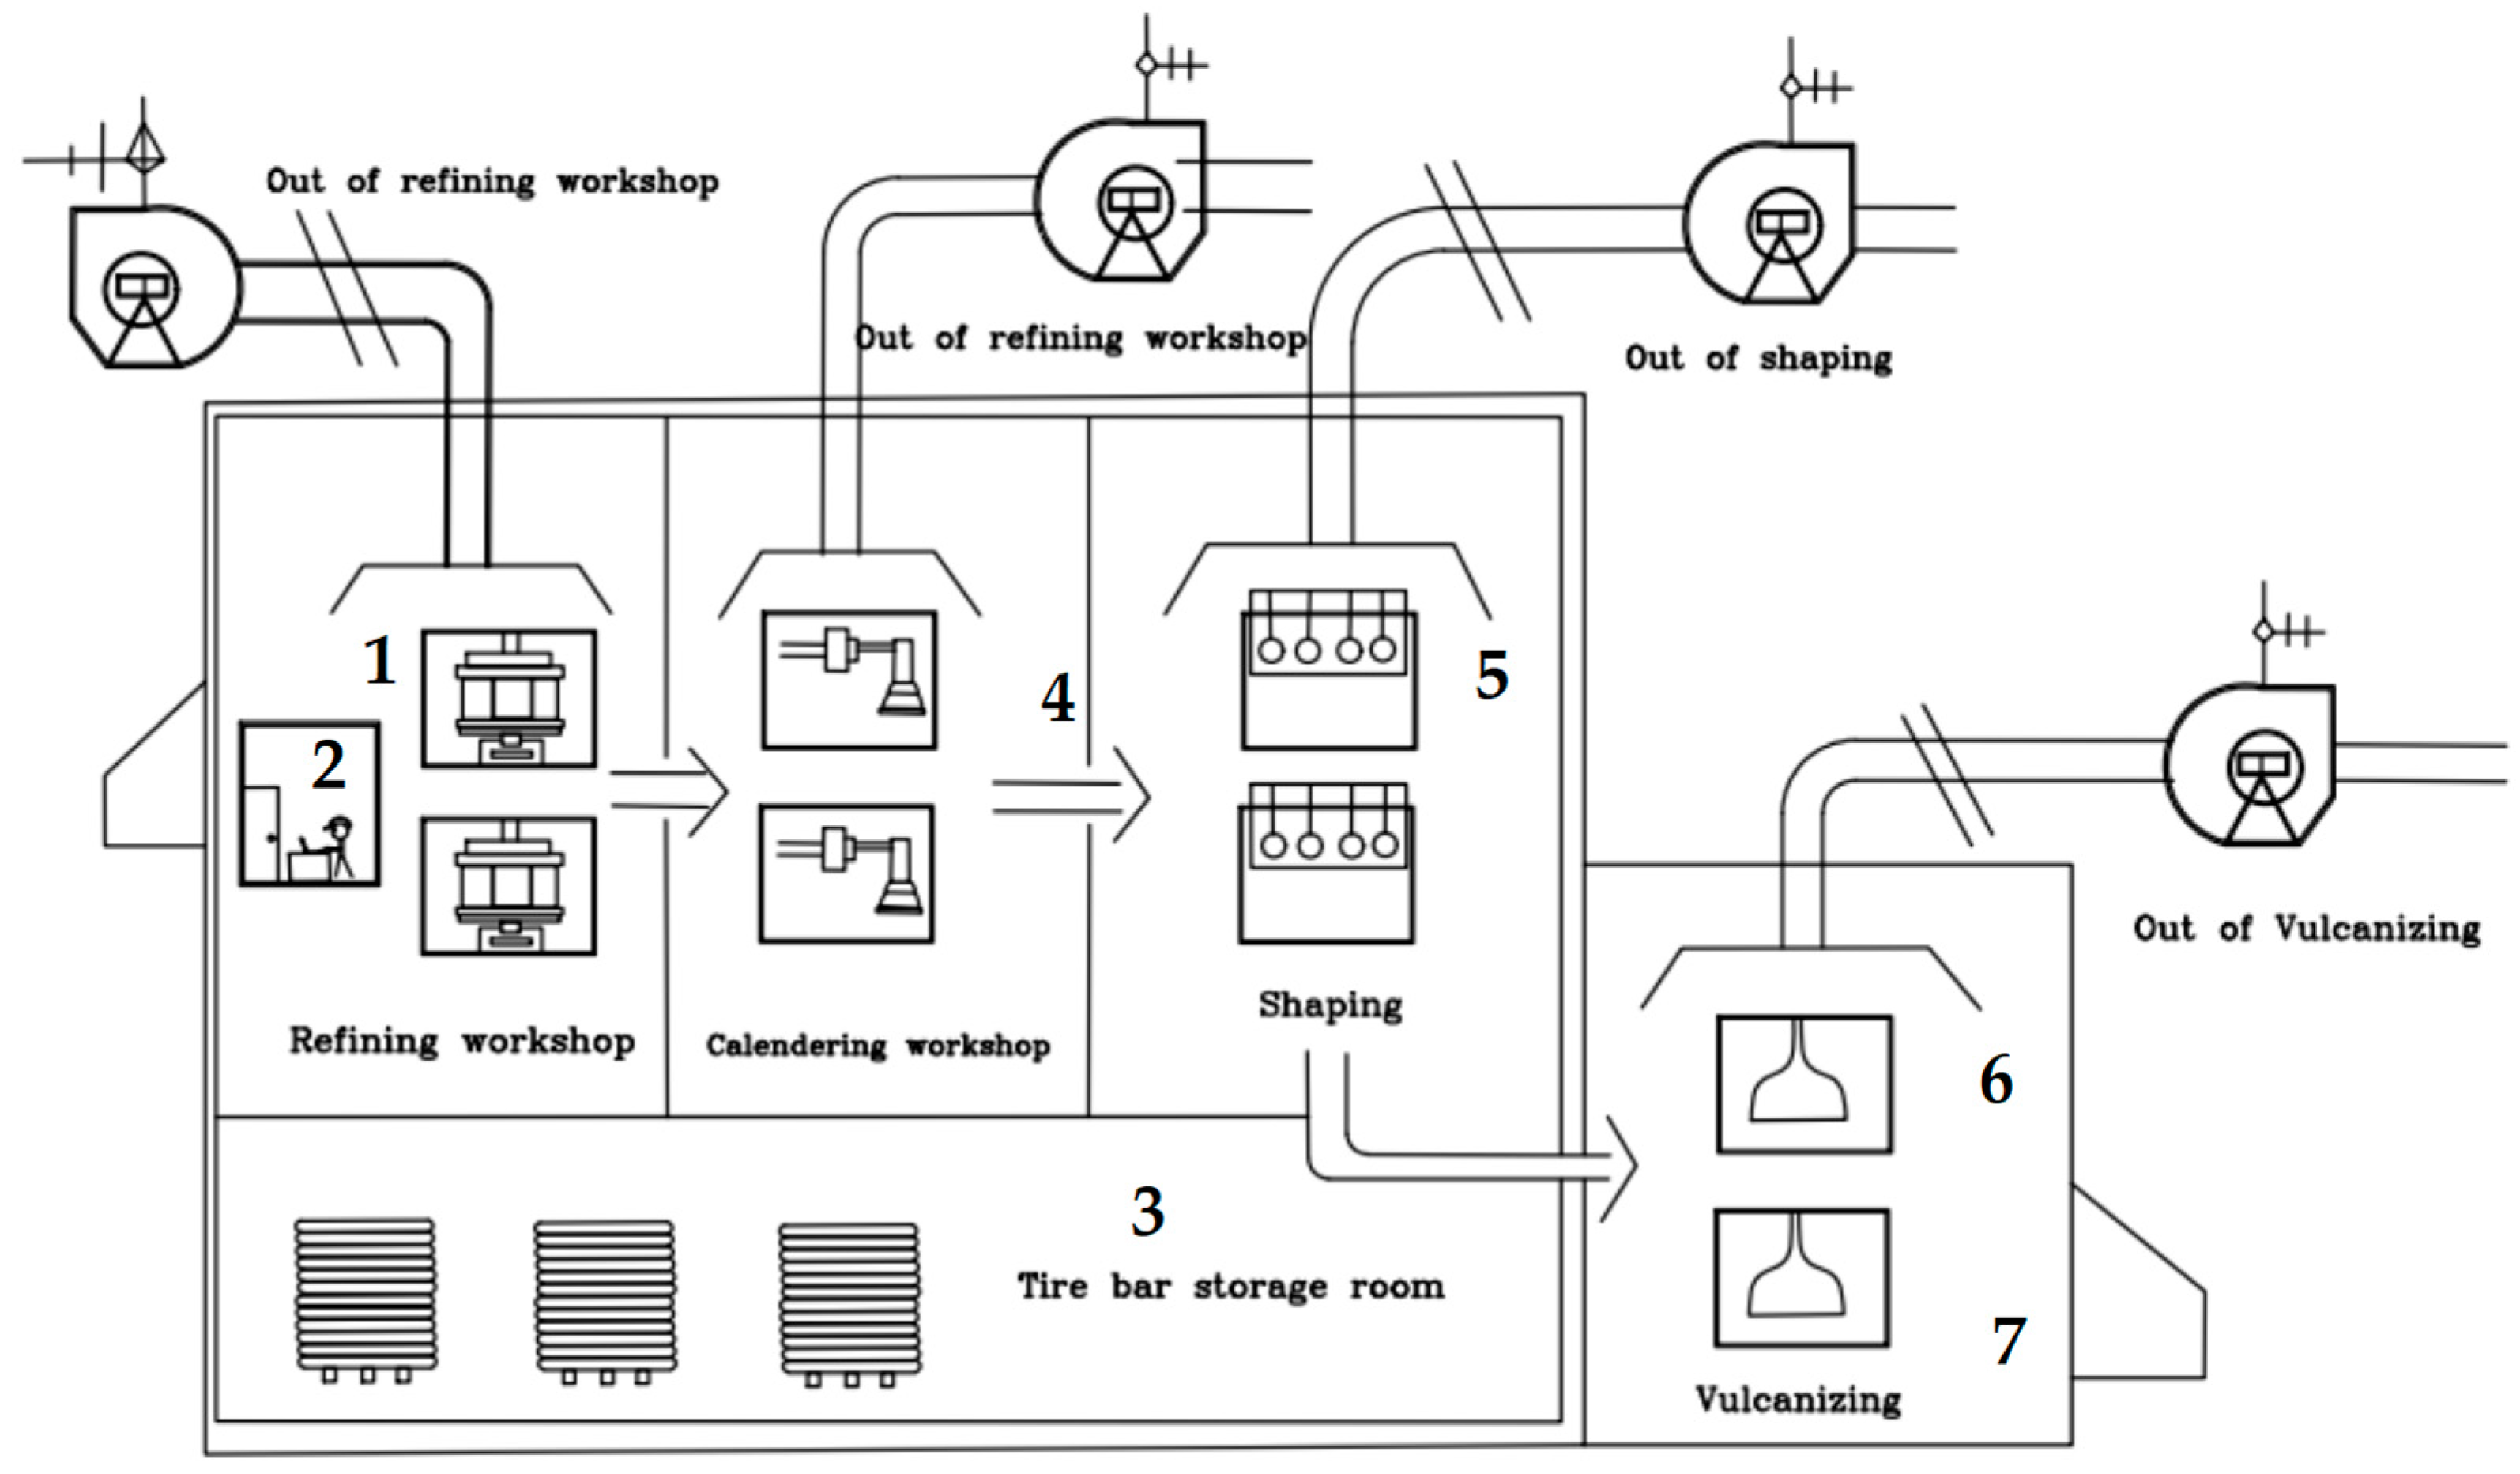
The chosen rubber tire factory in Jiangsu Province, China, produces 3.6 million sets of all-wire load radial wheels and 50,000 sets of all-wire radial engineering tires annually. The manufacturing process mainly consists of four main processing stages, including refining, calendering, shaping, and vulcanizing, with the majority of workers stationed in the shaping workshop. To assess the emission characteristics of VOCs in the factory, VOC monitoring procedures were carried out across these four stages with sampling locations depicted in Figure 1 and Figure 2. Sites 1, 2, 3, 4, 5, and 6 represent the refining workshop, employer’s work room, tire bar storage, shaping workshop, calendering workshop, shaping workshop, and vulcanizing workshop, respectively. Site 7 represents the vulcanizing workshop during the process of vulcanizing. In this factory, there are more than 2000 employees, mainly for working in the refining workshop, calendering workshop, shaping workshop, and vulcanization workshop; these employees, who usually work 12 h per day.
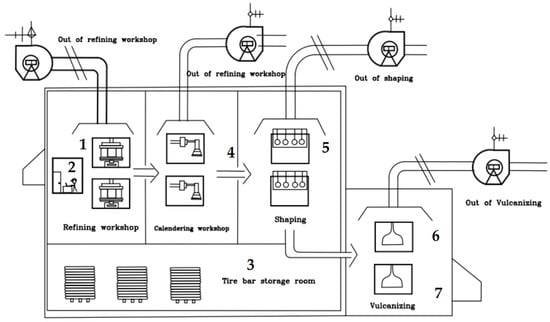
Figure 1.
Schematic of sampling location in this study. Note: sampling site 1 is refining workshop, sampling site 2 is the worker’s workshop, sampling site 3 is the tire bar storage room, sampling sites 4–6 are the calendering, shaping, and vulcanizing workshops, and sampling site 7 is the vulcanizing workshop during the process of mold opening.

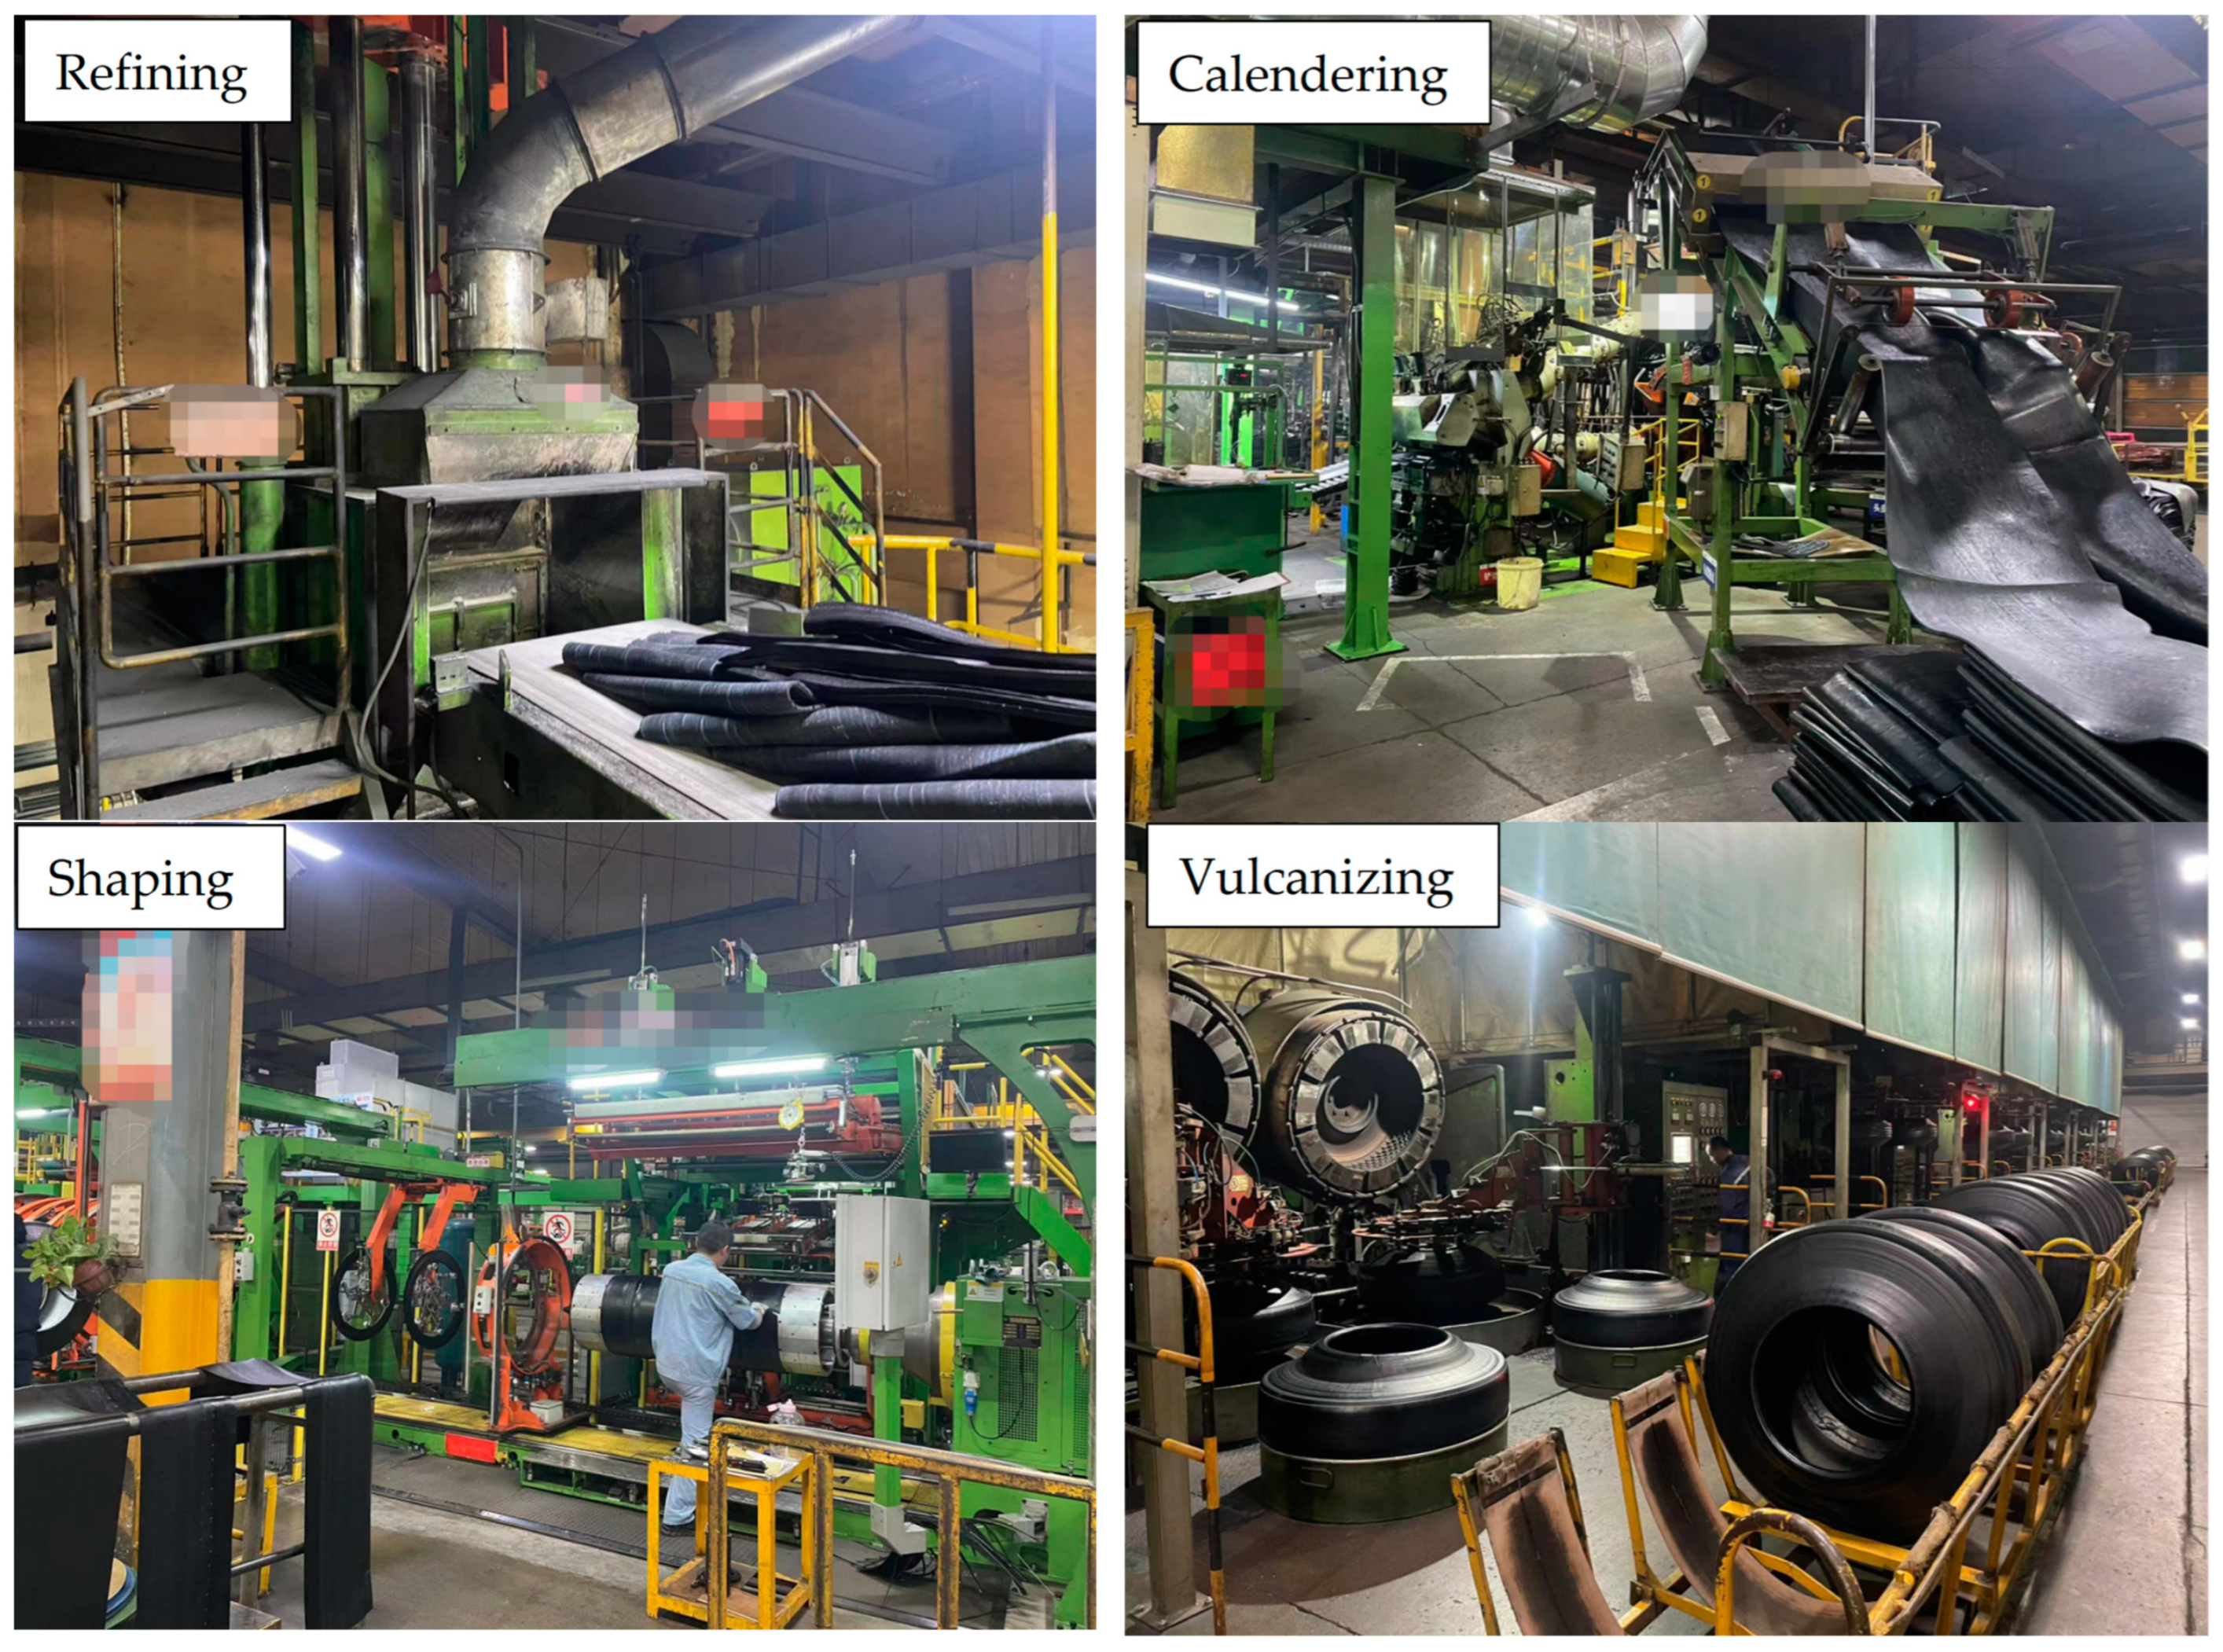
Figure 2.
Four workshops in this factory.
The standard deviations of VOC concentrations, the replicate samples, and injections in comparison with average readings were analyzed using Microsoft Excel 2021.
2.2. Monitoring of Organic Pollutants
2.2.1. Monitoring Indicators
The monitoring indicators are the organic compounds specified in the Classification Catalog of Occupational Disease Hazardous Factors (National Health and Disease Control Development (2015) No. 92) and Occupational exposure limits for hazardous agents in the workplace—Part 1: Chemical hazardous agents (GBZ 2.1-2019) [21].
2.2.2. Monitoring Methods
According to the national standard sampling specification for Monitoring Hazardous Substances in the workplace (GBZ 159-2004) [22], short time sampling methods were applied for the VOC measurements, and representative workplaces were chosen for sampling. In this study, seven sampling points were set up in the four workshops of the enterprise, namely, the refining workshop, the calendering workshop, the molding workshop, and the vulcanizing workshop. Each sampling point was measured three times. The sampling temperature was 22.3–24.6 °C, the relative humidity was 59.8–68.1%, and the sampling air pressure was 101.3–101.7 kPa.
Measurements were conducted during working hours, from 10:00 a.m. to 14:00 p.m., in the winter of 2023. Air samples were directly extracted at a height of approximately 1.5 m (i.e., breathing zone) and were determined online using commercial portable GC-MS (type:3500S, Hangzhou PuYu Technology Co., Ltd., Hangzhou China). During the measuring period, the ambient air at a flow rate of 100 mL·min−1 was withdrawn into the sampling train, where VOCs were first collected onto the Tenax GR-coated denuder, and after 15 min sampling, VOCs were desorbed at 280 °C. The details are described in a previous study [23]. The instrument routinely undergoes external manual tests using standard gas before measurement.
2.3. Health Risk Assessment
2.3.1. Semi-Quantitative Health Risk Assessment
According to the national guidelines for the occupational health risk assessment of chemicals in the workplace (GBZ/T 298-2017) [24], a risk index (R) is used to define the risk level, which is categorized into 5 levels. The numbers 1 to 5 correspond to the risk level of negligible risk, low risk, moderate risk, high risk, and very high risk, respectively. The R value is calculated by the following equation:
where HR represents the hazard rating and ER represents the exposure rating. HR is typically categorized into 5 levels based on the toxicity of pollutants and toxicity test LD50 and LC50, using guidelines from the American Association of Governmental Industrial Hygienists (ACGIH), the International Agency for Research on Cancer (IARC), and other international organizations. The ER can be calculated by using the exposure concentration (E) and the occupational exposure limit (OEL); when E/OEL < 0.1, ER is 1; 0.1 ≤ E/OEL < 0.5, ER is 2; 0.5 ≤ E/OEL < 1.0, ER is 3; 1.0 ≤ E/OEL < 2.0, ER is 4; and E/OEL ≥ 2.0, ER is 5.
In this study, the exposure concentration (E) is measured in mg/m3, the weekly exposure frequency (F) is 6 days per week, and the average time of each exposure (D) is 12 h per day. The detection of exposure concentration is denoted by M in mg/m3, and the average weekly working time (W) is in hours per week. When W exceeds 40 h per week, the occupational exposure limit (OEL) is adjusted using a Reduction Factor (RF), which was determined to be 0.42 in this study.
2.3.2. Quantitative Health Risk Assessment
In this study, the methodology recommended by USEPA was used to assess the human health risk based on workers’ exposure to VOCs through inhalation [11,18]. The maximum exposure concentration for an individual volatile compound ‘ECi’ (expressed in milligram per cubic meter) was calculated by the following equation:
In each workshop, Cair represents the concentration of each volatile compound in the ambient air (μg/m3). DET refers to the daily exposure time, which, in this study, was set at 12 h per day for workers exposed to harmful chemicals. EF refers to exposure frequency, and 300 days per year were considered. ED represents the exposure duration, which was set at 10 years, while AT represents the average exposure time in hours. For non-carcinogenic risk calculation, AT is derived from ED × 365 days per year × 24 h per day. For carcinogenic risk calculation, AT is determined by multiplying 83.73 years (life expectancy) by 365 days per year and then by 24 h per day.
The non-carcinogenic risk was expressed by the hazard quotients (HQ) indicator, estimated using the EC and reference concentration (RfC) (seen in Equation (4)), and the excess personal risk (IR) for inhalation (seen in Equation (5)) is used to define the risk level. When HQ > 1, the risk of harm to human health is unacceptable and vice versa. If the IR falls between 10−6 and 10−4, the cancer risk is deemed acceptable; when the IR is <10−6, the cancer risk is considered negligible; and if the IR is >10−4, the cancer risk is seen as unacceptable. When multiple hazardous factors were involved, the total hazard quotient (THQ) (as shown in Equation (6)), represented by the sum of the hazard quotients for each VOC, was utilized to assess the non-carcinogenic risk; when THQ > 1, the risk posed to the human body is deemed unacceptable, and otherwise, it is considered acceptable.
where RfCi is the reference exposure concentration of the ith hazardous factor, μg/m3, and IUR is the inhalation unit risk, (μg/m3).
3. Results and Discussion
3.1. VOCs Concentration
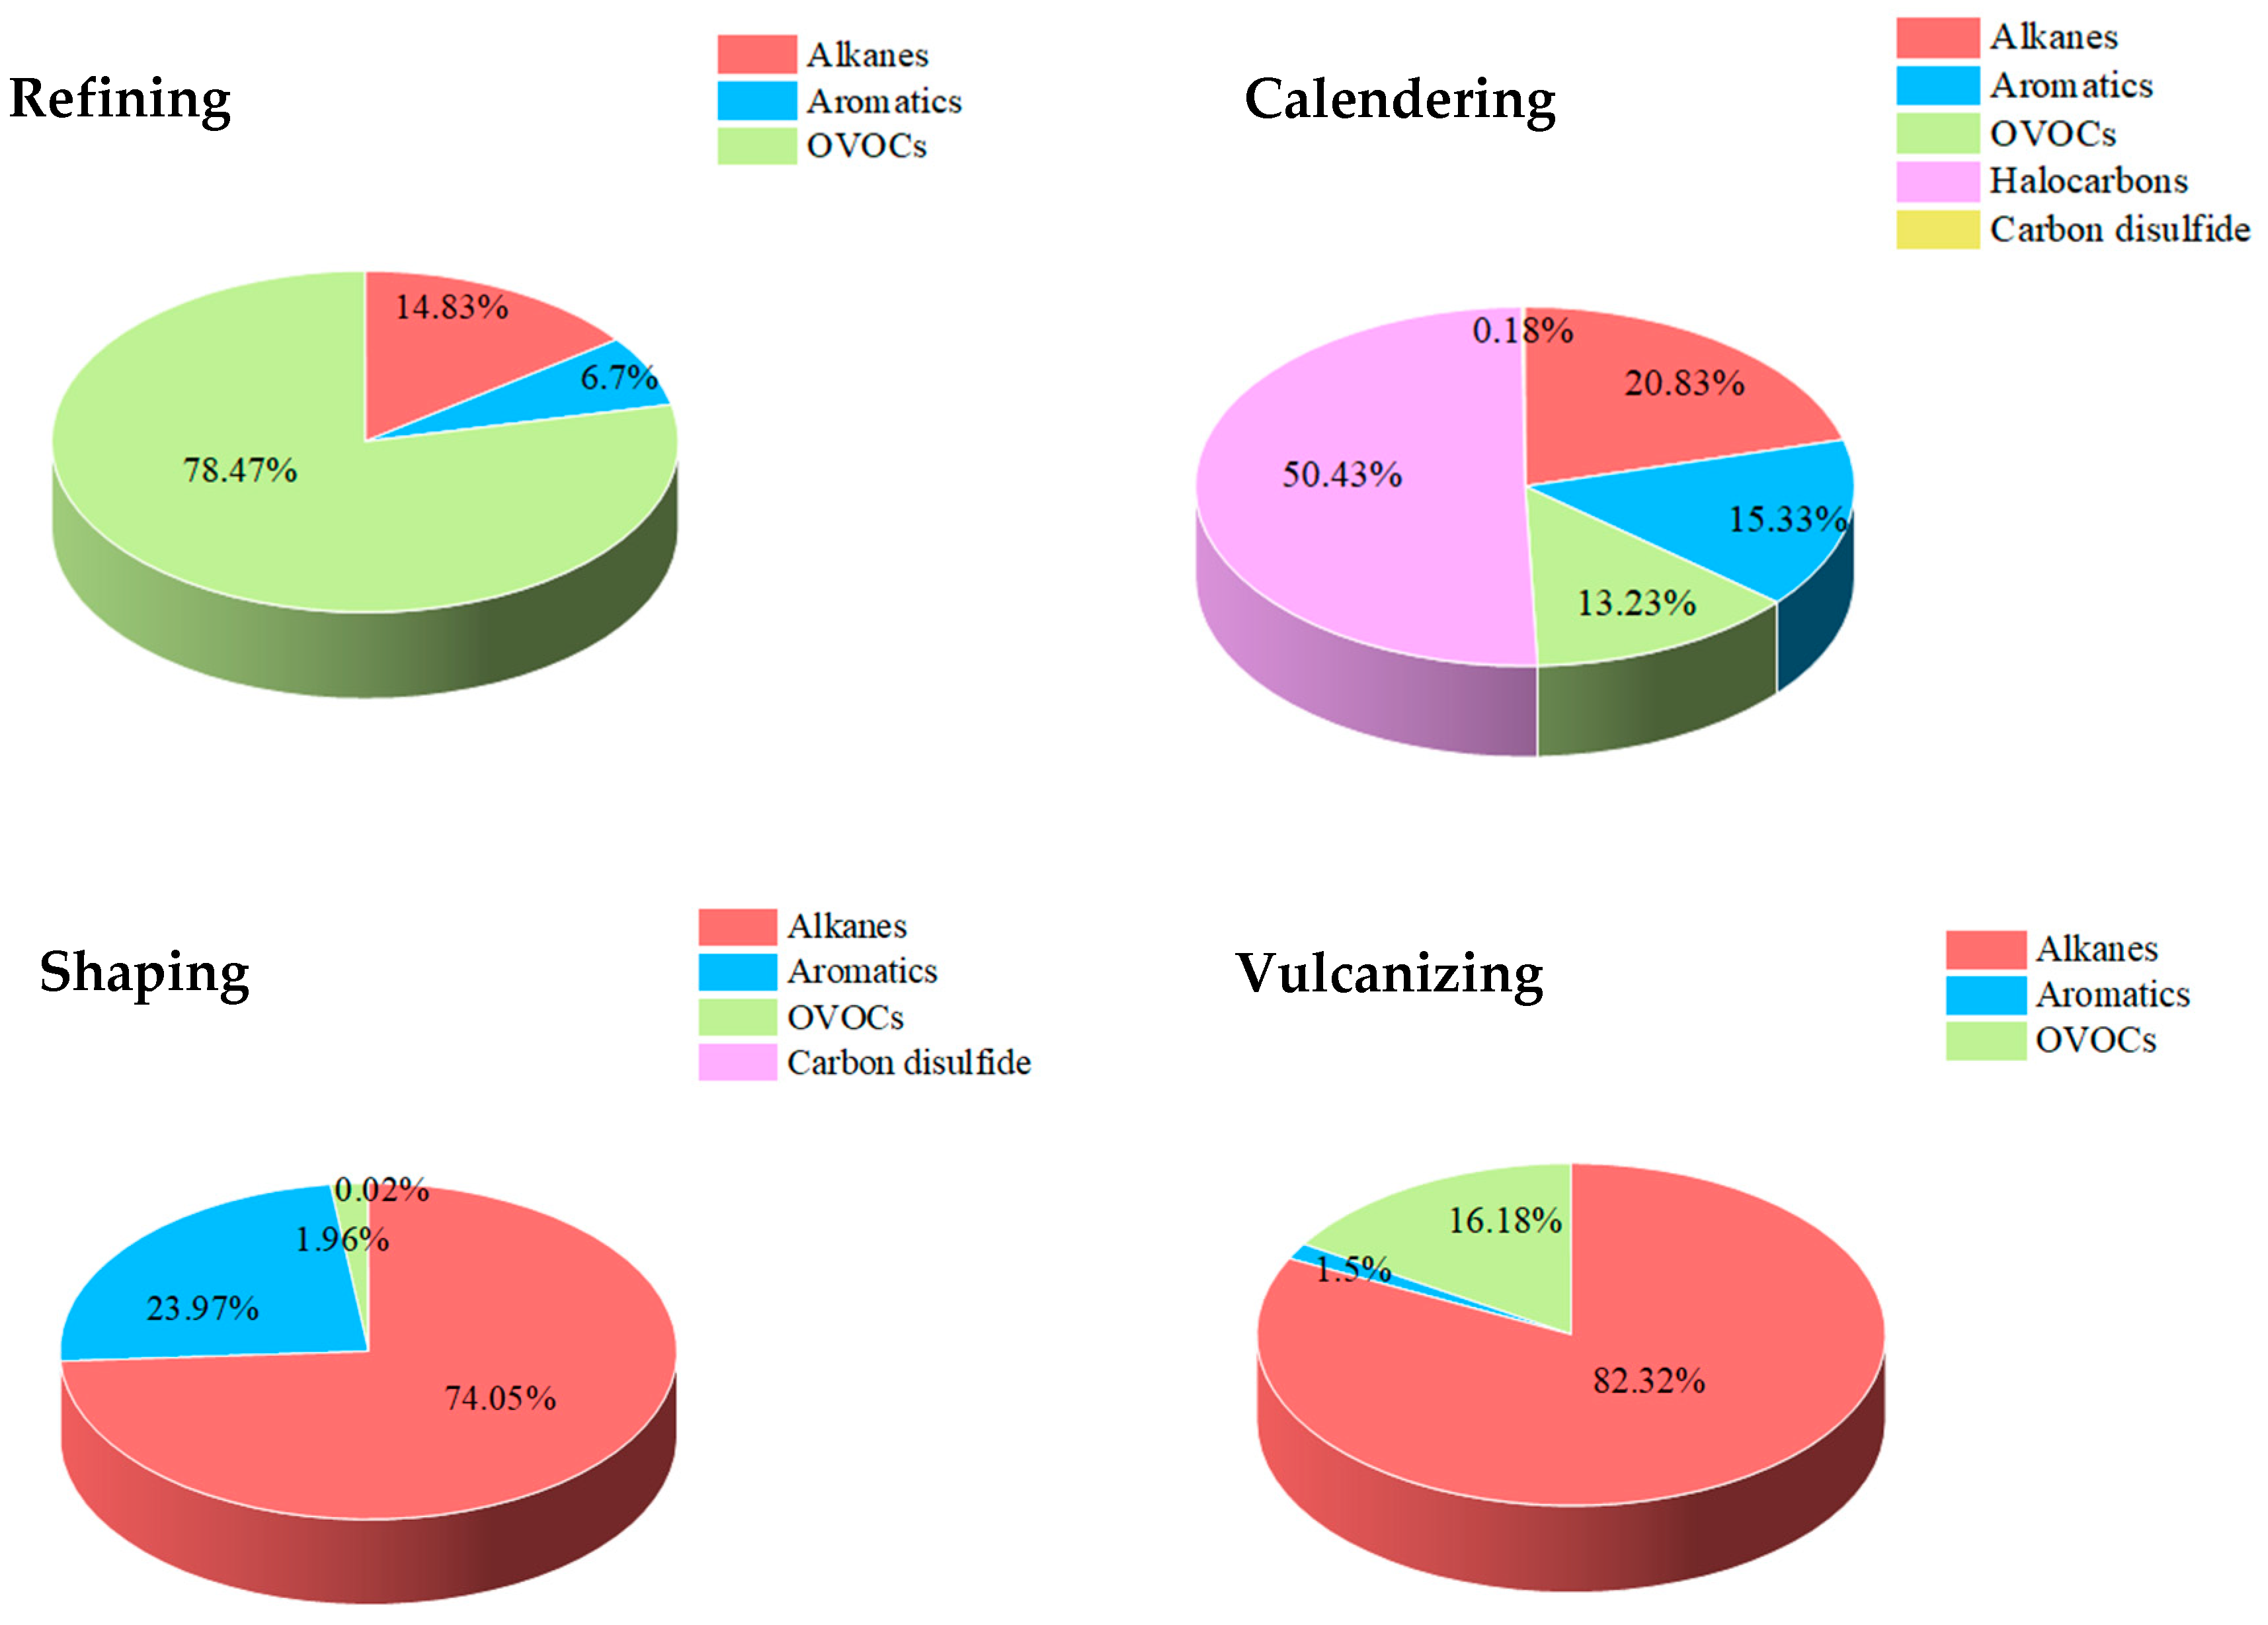
Herein, a total of 68 VOC compounds were analyzed at four distinct processing stages. These VOCs were categorized into five classes according to their functional groups, including alkanes, halocarbons, aromatics, carbon disulfide, and oxygenated compounds (OVOCs). These species were also found to be abundant in rubber footwear industries in China [25]. The distribution of five classes of VOCs in those stages is illustrated in Figure 3.
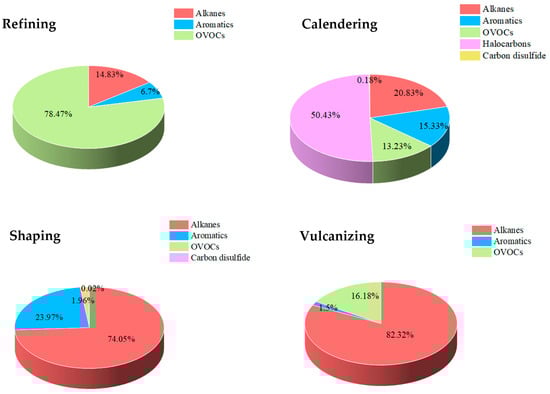
Figure 3.
Composition of organic species in four workshops and their contribution to TVOCs.
At the refining workshop, the largest number of VOCs were detected and the concentration of TVOCs was 2.09 ± 0.52 mg/m3. Ethanol was the most abundant VOC, with 1.23 ± 0.13 mg/m3, followed by benzol and methyl isobutylketone, with 0.21 ± 0.05 and 0.21 ± 0.03 mg/m3, respectively. OVOCs were the most abundant VOC class, followed by alkanes and aromatic hydrocarbons. They contributed 78.47%, 14.83%, and 6.7% of the TVOCs, respectively. In particular, butane and isobutane were found to be the most prevalent alkanes, with average measured concentrations of 0.21 ± and 0.09 ± mg/m3, respectively, contributing 70% and 30%, respectively, to the total amount of alkanes. Ethanol and methyl isobutyl ketone were the most abundant of the OVOCs, with 1.23 ± 0.03 and 0.21 ± 0.01 mg/m3, respectively, accounting for 77.8% and 13% of total OVOCs. Furthermore, 1-Ethyl-3-methylbenzene and 1,2,4-Trimethylbenzene were predominant aromatics with concentrations of 0.03 ± 0.01 mg/m3 and 0.02 ± 0.01 mg/m3, contributing 20% and 18.5% to the total aromatics. No carbon disulfide and halocarbons were detected in the refining workshop.
At the calendering workshop, the concentration of TVOCs was 3.84 ± 0.39 mg/m3. As the top six VOCs, 1,1,2,2-Tetrachloroethane was the most abundant VOC with 0.81 ± 0.02 mg/m3, followed by trichloroethylene, 1,1,2-Trichloroethane, heptane, tetrachloroethylene, and 2-Hexanone with 0.37 ± 0.02, 0.36 ± 0.06, 0.31 ± 0.06, 0.29 ± 0.07, and 0.28 ± 0.06 mg/m3, respectively. Halocarbons were the most abundant VOC class, followed by alkanes, aromatic hydrocarbons, OVOCs, and carbon disulfide. They contributed 50.43%, 20.83%, 15.33%, 13.23%, and 0.18% of the TVOCs, respectively. More specifically, heptane and 3-Methylhexane were found to be the most abundant alkanes, with measured average concentrations of 0.31 and 0.15 mg/m3, respectively. They contributed 40% and 19.1%, respectively, to the total amount of alkanes. The concentration of halocarbons decreased in the following order: 1,2,2-Tetrachloroethane (0.81 ± 0.09 mg/m3) > trichloroethylene (0.37 ± 0.03 mg/m3) > 1,1,2Trichloroethane (0.36 ± 0.02 mg/m3) > tetrachloroethylene (0.29 ± 0.06 mg/m3), accounting for 41.7%, 18.9%, 18.3%, and 15.1% of the total halocarbon concentrations, respectively. Among the OVOCs, 2-Hexanone and ethyl acetate were the most abundant, with concentrations of 0.28 ± 0.05 and 0.07 ± 0.01 mg/m3, representing 55% and 14.4% of the total OVOCs, respectively. Furthermore, m-p-Xylenol and 1, 2, 3-Trimethylbenzene were found to be the most prevalent aromatic compounds, with a concentration of 0.08 ± 0.01 mg/m3 and 0.08 ± 0.01 mg/m3, making up 14.3% and 12.9% of the total aromatics, respectively. The concentration of carbon disulfide was low, with 0.01 ± mg/m3.
The TVOC concentration at the shaping workshop was 44.3 ± 8.22 mg/m3. The top seven VOCs detected in the air samples were heptane, 3-Pentanone, 2-Methylhexane, 2-Methylheptane, 3-Methylheptane, Butyl acetate, and hexane, with concentrations of 15.25 ± 2.56, 7.9 ± 3.13, 4.53 ± 1.11, 3.04 ± 1.12, 2.41 ± 0.79, 2.39 ± 1.22, and 2.34 ± 0.52 mg/m3, respectively. Alkanes were the most prevalent class, accounting for 74.2% of the TVOCs, followed by aromatics (24.02%), OVOCs (1.96%), and a minor amount of carbon disulfide (0.02%). In particular, heptane, 2-Methylhexane, 2-Methylheptane, 3-Methylheptane, and hexane were the alkanes with the highest abundance. They each contributed 46%, 13.8%, 9.3%, 7.3%, and 7.1% to the total alkane concentrations. 1,3-Xylene and 1,2-Xylene were the dominant aromatic compounds, accounting for 22.6% and 19.5% of the total aromatic concentrations, respectively. The concentration of OVOCs decreased in the following order: 3-Pentanone > Butyl acetate > 2-Ethylhexanol > Isobutyl acetate > acetophenone. The concentration of carbon disulfide was low at 0.01 ± 0.01 mg/m3. On the contrary, no halocarbons were found in the shaping workshop.
At the vulcanizing workshop, the concentration of TVOCs was 4.84 ± 1.18 mg/m3. Among the top eight VOCs, heptane stood out as the most abundant VOC, with a concentration of 2.01 ± 0.08 mg/m3, followed by 3-Methylhexane, 2-Methylhexane, 2-Hexanone, 2-Methylheptane, ethyl acetate, Butyl acetate, and 3-Methylheptane, at concentrations of 0.90 ± 0.14, 0.45 ± 0.10, 0.27 ± 0.04, 0.26 ± 0.03, 0.24 ± 0.06, 0.23 ± 0.04, and 0.23 ± 0.07 mg/m3, respectively. Alkanes were the predominant VOC class, followed by OVOCs and aromatic hydrocarbons. They made up 82.32%, 16.18%, and 1.5% of the TVOCs, respectively. Heptane, 3-Methylhexane, 2-Methylhexane, 2-Methylhexane, and 3-Methylheptane were found to be the most prevalent, with average measured concentrations of 2.03 ± 0.24, 0.9 ± 0.17, 0.45 ± 0.05, 0.26 ± 0.07, and 0.23 ± 0.03 mg/m3, respectively. They each contributed 50.2%, 22.5%, 11.2%, 6.6%, and 5.7% of the total alkanes. Among the OVOCs, Ethyl acetate and Butyl acetate were the most abundant of the OVOCs, at 0.24 ± 0.07, and 0.23 ± 0.09 mg/m3, respectively, making up 30.4% and 29.6% of the total OVOCs. Furthermore, 1,2-Xylene had the highest abundance among the aromatics, with a concentration of 0.02 ± 0.01 mg/m3, constituting 31.5% of the total aromatics. In contrast, no carbon disulfide and halocarbons were detected in vulcanizing workshop.
3.2. Semi-Quantitative Health Risk Assessment
Risk index values were calculated to assess the semi-quantitative health risk assessment; the results were listed in Table 1. As shown in Table 1, the health risk of all the detected organic compounds at all sampling sites is low; even ethyl acetate, which was detected in the three workshops, had a negligible risk level. Although the results of the semi-quantitative risk assessment showed that most of the organic compounds had low R values, various kinds of VOCs were detected; particularly, many harmful organic compounds (such as toluene, ethyl benzene) were detected in all the sampling sites. Therefore, the occupational semi-quantitative health risk of VOCs to employees in the tire factory still needs continued attention.

Table 1.
Results of semi-quantitative health risk assessment.
3.3. Quantitative Health Risk Assessment
The results of the quantitative risk assessment (Table 2) show that the non-cancer health risks in the calendering workshop, shaping workshop, and vulcanizing workshop exceeded the acceptable level, with HIs of 79.988, 2.76, and 1.28, respectively. Trichloroethylene, tetrachloroethylene, and naphthalene are the main organic compounds causing non-cancer health risks in the calendering workshop, with HQ values of 75.325, 3.0185, and 1.5, respectively; n-hexane and naphthalene are the main organic compounds causing non-cancer health risks in the shaping workshop, with HQ values of 1.375357 and 1.23, respectively; naphthalene is the main organic compound causing non-cancer health risks in the vulcanizing workshop during the process of mold opening, with an HQ value of 1.09. These organic compounds are unacceptable in terms of their risks to human health. Thus, the calendering and vulcanizing processes in the rubber tire manufacturing factory should be the priority, which is consistent with the results reported by Huang et al. [20].
Table 2.
Quantitative risk assessment results.
The results of the carcinogenic health risk assessment (Table 2) show that the average IR value for ethylbenzene in the tire storage room was 3.7%, the average IR value for trichloroethylene and perchloroethylene in the calendering workshop was 6.2 × 10⁻⁴, and the average IR values for trichloroethylene and perchloroethylene in the calendering workshop were 6.2 × 10⁻⁴ and 7.2 × 10⁻⁴, which exceeded the acceptable level. The IR value for the rest of the pollutants ranged from 10−6 to 10−4, and the carcinogenicity risk was acceptable.
4. Conclusions
In this study, 68 VOCs were measured during different processing stages in a rubber tire industry. The total VOCs (TVOCs) were categorized in five classes of compounds based on their functional groups, which include alkanes, aromatics, halocarbons, carbon disulfide, and oxygenated compounds (OVOCs). The highest concentration of TVOCs was found in the shaping workshop; alkanes were the most abundant class (74.2%), followed by aromatics (24.02%) and OVOCs (1.96%). In addition, this study also focused on the health risk level of each organic compound in the different workshops of the rubber tire factory. The semi-quantitative risk level R values in the seven workstations monitored were all low risk; however, since low risk is not the same as zero risk, these compounds may still have a potential health impact on the workers. Although the results of the semi-quantitative risk assessment showed that most of the organic compounds had low R values, various kinds of VOCs were detected, and many harmful organic compounds (such as toluene, ethyl benzene) were detected in all the sampling sites. The quantitative risk in the calendering and vulcanizing workshops exceeded the acceptable level, especially the carcinogenic risk of ethylbenzene in the tire-strip storage room, and trichloroethylene and perchloroethylene in the calendering workshop. The use of only one assessment method may lead to increased uncertainty in health risk judgment results. The interchangeable use of both semi-quantitative and quantitative health risk assessment methods is recommended to achieve more comprehensive and objective assessment results. Factors such as the purpose of the assessment and available data resources should be considered when deciding which method to apply.
Author Contributions
Conceptualization, S.H. and Y.W.; methodology, S.H.; validation, S.H., Y.W. and L.D.; formal analysis, S.H.; investigation, S.H. and Y.W.; resources, S.H.; data curation, S.H. and Y.W.; writing—original draft preparation, S.H.; writing—review and editing, G.X.; visualization, G.X.; supervision, G.X.; project administration, L.D.; funding acquisition, L.D. All authors have read and agreed to the published version of the manuscript.
Funding
This publication was financially supported by the National Natural Science Foundation of China (Grant Nos. 21906055).
Institutional Review Board Statement
Not applicable.
Informed Consent Statement
Not applicable.
Data Availability Statement
The data presented in this study are available upon request from the corresponding author. The data are not publicly available due to privacy.
Acknowledgments
We would like to express our gratitude to Hangzhou PuYu Technology Co., Ltd. for providing instruments. We also wish to thank the reviewers and the editor for their thorough review and valuable suggestions, which have significantly improved the quality of our paper.
Conflicts of Interest
Author Songtao Hou was employed by the company Huntsman Polyurethane Shanghai Ltd., Shanghai 200237, China. The remaining authors declare that the research was conducted in the absence of any commercial or financial relationships that could be construed as a potential conflict of interest.
References
- Atkinson, R. Atmospheric chemistry of VOCs and NOx. Atmos. Environ. 2000, 34, 2063–2101. [Google Scholar] [CrossRef]
- World Health Organization Regional Office for Europe. Air Quality Guidelines for Europe. WHO Regional Publications; European Series; WHO: Geneva, Switzerland, 1987; p. 23. [Google Scholar]
- US EPA; Oar; Indoor Environments Division. An Introduction to Indoor Air Quality: Volatile Organic Compounds (VOCs); EPA: Washington, DC, USA, 1991.
- Soni, V.; Singh, P.; Shree, V.; Goel, V. Effects of VOCs on Human Health; Springer: Berlin/Heidelberg, Germany, 2018. [Google Scholar]
- US EPA (U.S. Environmental Protection Agency). Available online: https://www.epa.gov/indoor-air-quality-iaq/volatile-organic-compounds-impact-indoor-airquality#introe (accessed on 12 July 2020).
- Hakim, M.; Broza, Y.Y.; Barash, O.; Peled, N.; Phillips, M.; Amann, A.; Haick, H. Volatile organic compounds of lung cancer and possible biochemical pathways. Chem. Rev. 2012, 112, 5949–5966. [Google Scholar] [CrossRef] [PubMed]
- Tornqvist, M.; Ehrenberg, L. On cancer risk-estimation of urban air-pollution. Environ. Health Perspect. 1994, 102, 173–182. [Google Scholar]
- IARC (International Agency for Research on Cancer). List of Classifications by Alphabetical Order. 2017. Available online: http://monographs.iarc.fr/ENG/Classification/index.php. (accessed on 8 August 2017).
- ATSDR (Agency for Toxic Substances and Disease Registry). 2017. Available online: http://www.atsdr.cdc.gov/substances/indexAZ.asp#B (accessed on 8 August 2017).
- OEHHA (Office of Environmental Health Hazard Assessment). 2017. Available online: http://oehha.ca.gov/risk/ChemicalDB/index.asp (accessed on 8 August 2017).
- Mo, Z.; Lu, S.; Shao, M. Volatile Organic Compound (VOC) Emissions and Health Risk Assessment in Paint and Coatings Industry in the Yangtze River Delta, China. Environ. Pollut. 2020, 269, 115740. [Google Scholar] [CrossRef]
- Yin, S.; Zheng, J.; Lu, Q.; Yuan, Z.; Huang, Z.; Zhong, L.; Lin, H. A refined 2010-based VOC emission inventory and its improvement on modeling regional ozone in the Pearl River Delta Region, China. Sci. Total Environ. 2015, 514, 426–438. [Google Scholar] [CrossRef]
- Yan, Y.; Peng, L.; Li, R.; Li, Y.; Li, L.; Bai, H. Concentration, ozone formation potential and source analysis of volatile organic compounds (VOCs) in a thermal power station centralized area: A study in Shuozhou, China. Environ. Pollut. 2017, 223, 295–304. [Google Scholar] [CrossRef] [PubMed]
- Wei, W.; Cheng, S.; Li, G.; Wang, G.; Wang, H. Characteristics of volatile organic compounds (VOCs) emitted from a petroleum refinery in Beijing, China. Atmos. Environ. 2014, 89, 358–366. [Google Scholar] [CrossRef]
- Zhong, Z.; Zheng, J.; Yuan, Z.; Gao, Z.; Ou, J.; Zheng, Z.; Li, C.; Huang, Z. Sector-based VOCs emission factors and source profiles for the surface coating industry in the Pearl River Delta region of China. Sci. Total Environ. 2017, 583, 19–28. [Google Scholar] [CrossRef] [PubMed]
- Mustafa, M.F.; Liu, Y.; Duan, Z.; Guo, H.; Xu, S.; Wang, H.; Lu, W. Volatile compounds emission and health risk assessment during composting of organic fraction of municipal solid waste. J. Hazard. Mater. 2017, 327, 35–43. [Google Scholar] [CrossRef] [PubMed]
- Guo, H.; Lee, S.C.; Chan, L.Y.; Li, W.M. Risk assessment of exposure to volatile organic compounds in different indoor environments. Environ. Res. 2004, 94, 57–66. [Google Scholar] [CrossRef] [PubMed]
- Mo, Z.; Shao, M.; Lu, S.; Qu, H.; Zhou, M.; Sun, J.; Gou, B. Process-specific emission characteristics of volatile organic compounds (VOCs) from petrochemical facilities in the Yangtze River Delta, China. Sci. Total Environ. 2015, 533, 422–431. [Google Scholar] [CrossRef] [PubMed]
- Tong, R.; Zhang, L.; Yang, X.; Liu, J.; Zhou, P.; Li, J. Emission characteristics and probabilistic health risk of volatile organic compounds from solvents in wooden furniture manufacturing. J. Clean. Prod. 2019, 208, 1096–1108. [Google Scholar] [CrossRef]
- Huang, H.; Wang, Z.; Dai, C.; Guo, J.; Zhang, X. Volatile organic compounds emission in the rubber products manufacturing processes. Environ. Res. 2022, 212, 113485. [Google Scholar] [CrossRef] [PubMed]
- Occupational Exposure Limits for Hazardous Agents in the Workplace Part 1:Chemical Hazardous Agents, National Health Commission of the People’s Republic of China. Available online: http://www.nhc.gov.cn/fzs/s7852d/201909/7abe11973e2149678e4419f36298a89a.shtml (accessed on 27 August 2019).
- Specifications of Air Sampling for Hazardous Substances Monitoring in the Workplace, National Health Commission of the People’s Republic of China. Available online: http://www.nhc.gov.cn/zwgkzt/pyl/201412/23d80783145a44b998bd0a0f122e9f87.shtml (accessed on 21 May 2004).
- Chen, W.; Zou, Y.; Mo, W.; Di, D.; Wang, B.; Wu, M.; Huang, Z.; Hu, B. Onsite Identification and Spatial Distribution of Air Pollutants Using a Drone-Based Solid-Phase Microextraction Array Coupled with Portable Gas Chromatography-Mass Spectrometry via Continuous-Airflow Sampling. Environ. Sci. Technol. 2022, 56, 17100–17107. [Google Scholar] [CrossRef]
- Guidelines for Occupational Health Risk Assessment of Chemicals in the Workplace, National Health Commission of the People’s Republic of China. Available online: http://www.nhc.gov.cn/wjw/pyl/201710/2df59f0c918d4be6bf4e62907bc89e42.shtml (accessed on 30 September 2017).
- Li, Q.; Su, G.; Li, C.; Wang, M.; Tan, L.; Gao, L.; Mingge, W.; Wang, Q. Emission profiles, ozone formation potential and health-risk assessment of volatile organic compounds in rubber footwear industries in China. J. Hazard. Mater. 2019, 375, 52–60. [Google Scholar] [CrossRef] [PubMed]
Disclaimer/Publisher’s Note: The statements, opinions and data contained in all publications are solely those of the individual author(s) and contributor(s) and not of MDPI and/or the editor(s). MDPI and/or the editor(s) disclaim responsibility for any injury to people or property resulting from any ideas, methods, instructions or products referred to in the content. |
© 2024 by the authors. Licensee MDPI, Basel, Switzerland. This article is an open access article distributed under the terms and conditions of the Creative Commons Attribution (CC BY) license (https://creativecommons.org/licenses/by/4.0/).