Article

Analyzing the Microscopic Production Characteristics of CO2 Flooding after Water Flooding in Tight Oil Sandstone Reservoirs Utilizing NMR and Microscopic Visualization Apparatus

1
School of Petroleum Engineering, Xi’an Shiyou University, Xi’an 710065, China
2
Engineering Research Center of Development and Management for Low to Ultra-Low Permeability Oil & Gas Reservoirs in West China, Ministry of Education, Xi’an 710065, China
3
Xi’an Key Laboratory of Tight Oil (Shale Oil) Development, Xi’an 710065, China
4
Oil & Gas Technology Research Institute of Changqing Oilfield Company, PetroChina, Xi’an 710021, China
5
National Engineering Laboratory for Exploration and Development of Low-Permeability Oil & Gas Fields, Xi’an 710018, China
6
Shaanxi Key Laboratory of Lackluster Shale Gas Accumulation and Exploration, Xi’an 710065, China
7
Department of Electrical Engineering and Computer Science, University of Stavanger, 4036 Stavanger, Norway
*
Author to whom correspondence should be addressed.
Atmosphere 2024, 15(4), 487; https://doi.org/10.3390/atmos15040487
Submission received: 29 February 2024 / Revised: 9 April 2024 / Accepted: 10 April 2024 / Published: 15 April 2024
(This article belongs to the Special Issue CO2 Geological Storage and Utilization (2nd Edition))

Abstract

:
The microscopic pore structure of tight sandstone reservoirs significantly influences the characteristics of CO2 flooding after water flooding. This research was conducted using various techniques such as casting thin sections, high-pressure mercury injection, scanning electron microscopy, nuclear magnetic resonance (NMR) testing, and a self-designed high-temperature and high-pressure microscopic visualization displacement system. Three types of cores with different pore structures were selected for the flooding experiments and the microscopic visualization displacement experiments, including CO2 immiscible flooding, near-miscible flooding, and miscible flooding after conventional water flooding. The characteristics of CO2 flooding and the residual oil distribution after water flooding were quantitatively analyzed and evaluated. The results show the following: (1) During the water flooding process, the oil produced from type I and type III samples mainly comes from large and some medium pores. Oil utilization of all pores is significant for type II samples. The physical properties and pore types have a greater impact on water flooding. Type I and II samples are more suitable for near-miscible flooding after water flooding. Type III samples are more suitable for miscible flooding after water flooding. (2) In CO2 flooding, oil recovery increases gradually with increasing pressure for all three types of samples. Type II core samples have the highest recovery. Before miscibility, the oil recovered from type I and type II samples is primarily from large pores; however, oil recovery mainly comes from medium pores when reaching miscibility. As for the type III samples, the oil produced in the immiscible state mainly comes from large and medium pores, and the enhanced oil recovery mainly comes from medium and small pores after reaching the near-miscible phase. (3) It can be seen from the microscopic residual oil distribution that oil recovery will increase as the petrophysical properties of the rock model improve. The oil recovery rate of near-miscible flooding after water flooding using the type II model is up to 68.11%. The oil recovery of miscible flooding after water flooding with the type III model is the highest at 74.57%. With increasing pressure, the proportion of flake residual oil gradually decreases, while the proportion of droplet-like and film-like residual oil gradually increases. Type II samples have a relatively large percentage of reticulated residual oil in the near-miscible stage.

1. Introduction

With the ongoing advancements in exploration and development technology, the global energy landscape has undergone a corresponding transformation. There has been a gradual shift from traditional methods of energy extraction toward the cultivation of unconventional sources of energy [1,2,3].
As a type of unconventional energy, low-permeability tight sandstone reservoirs have gained significant attention in recent years. These reservoirs exhibit poor physical properties, intricate pore throat structures, high heterogeneity, and limited seepage capacity [4,5], making their extraction significantly more challenging compared to conventional oil reservoirs. These reservoirs have low overlying formation pressure and poor physical properties [6], which further complicate the mining process. Due to the low oil recovery rate of primary depletion mining and secondary water injection development, the overall oil recovery of low-permeability tight sandstone reservoirs is significantly lower than that of conventional oil reservoirs [7]. Water flooding has a limited impact on the improvement in tight oil reservoir yields [8,9]. To further enhance the oil recovery of tight oil formations, petroleum researchers must identify and implement innovative strategies.
In recent years, petroleum scientists have discovered that gas injection can greatly enhance the oil recovery from tight reservoirs [10,11]. Due to its unique properties, CO2 injection not only improves oil recovery from the reservoir [12,13], but also enables the geological storage of CO2 [14,15,16]. CO2 can dissolve oil, thereby reducing its viscosity and increasing its fluidity within the reservoir [17,18]. When CO2 reaches a supercritical state, it is allowed to penetrate smaller pores more easily in tight reservoirs and drive out the oil [19,20,21]. When CO2 reaches a miscible phase with oil, the displacement effect significantly increases due to the formation of a single-phase system [22,23], and the interfacial tension between the gas and liquid phases disappears, which results in a significant reduction in capillary resistance within the reservoir; this will greatly improve oil recovery. In summary, CO2 injection can be an effective method to improve oil recovery from tight reservoirs while simultaneously addressing the issue of greenhouse gas emissions by storing CO2 underground.
Currently, there are several ways to develop tight sandstone reservoirs. In the early stage, many scholars conducted much more research on water flooding development [24,25]. Liu et al. [26] used the Chang8 reservoirs’ and Chang9 reservoirs’ dense sandstones of the Honghe Oilfield as a study object and investigated the effect of pore structure on oil saturation. It was concluded that the affected area of most low-permeability samples is larger than that of hyperpermeable samples after water flooding. The main source of oil flooding efficiency is mainly from the presence of intergranular pores, as the connectivity of pores is a key factor affecting oil saturation. Zhou et al. [27] studied the effect of micropore structure on tight sandstone reservoirs, considering that type II oil reservoirs are the main targets for subsequent exploration and development. Water flooding methods mainly include network flooding and finger flooding, with residual oil separated by water in the form of oil drops. Pore size and oil distribution characteristics are key determinants of oil recovery. Jiang et al. [28] used dense sandstones with different wettability in the Chang6 and Chang8 reservoirs in the Ordos Basin as a study object, calculating and measuring the T2 spectra of the applied gradient magnetic field for different callback times. Eventually, they constructed a residual oil index based on the T2 spectra to evaluate water flooding grades in tight water flooding reservoirs. Chen et al. [8] used typical dense sandstones with different permeabilities in the Junge Basin as the study object, simulating water flooding reservoirs by varying injection pressure, injection rate, and injection volume. Based on NMR measurements, it was found that increasing the injection rate significantly improves the oil recovery rate, mainly from medium-sized pores and micropores.
Li et al. [29] selected three cores with different permeability classes and analyzed the oil recovery rate of CO2 injection under five pressure points in an immiscible state, supercritical state, and miscible state, respectively. They also studied the effect of CO2 oil drive on core wettability. Wang et al. [30] calculated the oil recovery rate after CO2 miscible flooding and the volume of residual oil. They found that when the throat radius is less than 0.26 μm, CO2 miscible phase flooding leads to throat blockage. Gao et al. [31] analyzed CO2 flooding experiments using a self-developed high-temperature and high-pressure microscopic visualization displacement system. They quantitatively analyzed the oil mobilization patterns of different pore structures and evaluated the residual oil characteristics and distribution patterns. They explained the CO2 flooding microscopic mechanism and the mechanism of residual oil formation. They only singularly studied the residual oil distribution after CO2 flooding but did not study the residual oil distribution of gas flooding after water flooding.
The study of microscopic visualization of displacement in tight sandstone reservoirs is crucial for improving oil recovery [32]. Currently, various models are used for this purpose, including the non-consolidated filling model [33,34], capillary model [35], simulation two-dimensional model [36,37,38], and real three-dimensional core model [39,40,41]. However, each model has its limitations.
The filling model is not suitable for simulating the effects of capillary force and wettability on oil production characteristics due to the size of the filling pore-throat is larger. The capillary model is a simplification of the real porous medium model and cannot simulate the effects of related mechanisms such as tortuosity. The simulated 2D model can only simulate strongly hydrophilic or strongly lipophilic networks but cannot simulate flooding under intermediate wettability conditions. Realistic 3D core models are currently limited by low pressure and cannot simulate oil production characteristics under reservoir conditions with high pressure and high temperature.
Tight sandstone reservoirs with poor physical properties have higher capillary resistance in the microporous throat, making them inaccessible to water flooding and resulting in poor effective oil utilization. After water flooding, the pressure of low permeability reservoirs drops rapidly, energy recovery is difficult, and water flooding is prone to finger-like breakthroughs. Single CO2 flooding is prone to gas kicks, which results in a smaller CO2 flooding area and poorer oil recovery. CO2 flooding after water flooding can effectively solve these problems by entering the small pore space with high resistance to drive out the oil and prevent gas kicks. This method can increase the gas flooding wave area, better replenish the formation of energy, and enhance oil recovery.
To address the issue of higher water content in tight reservoirs after water flooding, this paper conducts indoor simulation experiments on tight sandstone reservoirs through water flooding. The simulated reservoir enters a high-water content stage, followed by gas flooding experiments after water flooding to simulate CO2 gas flooding oil recovery. This study aims to provide a more in-depth understanding of microscopic oil utilization characteristics in gas flooding reservoirs after water flooding.
Currently, there is a significant amount of research on water and CO2 injection in tight sandstone reservoirs. This consists mainly of indoor experiments and field experiments. However, limited research has been conducted on the microscopic utilization characteristics of CO2 flooding after water flooding. and the factors affecting the efficiency of oil recovery in different pore structures. To solve this issue, we developed a real core displacement apparatus; the high-temperature and high-pressure microscopic visualization displacement system can be conditioned to visualize the characteristics of oil movement. This study focused on the Ordos Basin of tight sandstone reservoirs and uses three types of typical core samples for analysis. A combination of NMR technology and microscopic visualization was employed to quantitatively analyze CO2 flooding after water flooding from a microscopic perspective. Comparative experiments were conducted using an independently designed microscopic visualization flooding system to study the influence of pore structure on the microscopic utilization characteristics of oil. This study analyzed the distribution regularity and the characteristics of residual oil during CO2 flooding after water flooding in different phases. The findings of this research study will provide theoretical support for the efficient development of tight sandstone reservoirs with CO2 flooding after water flooding.

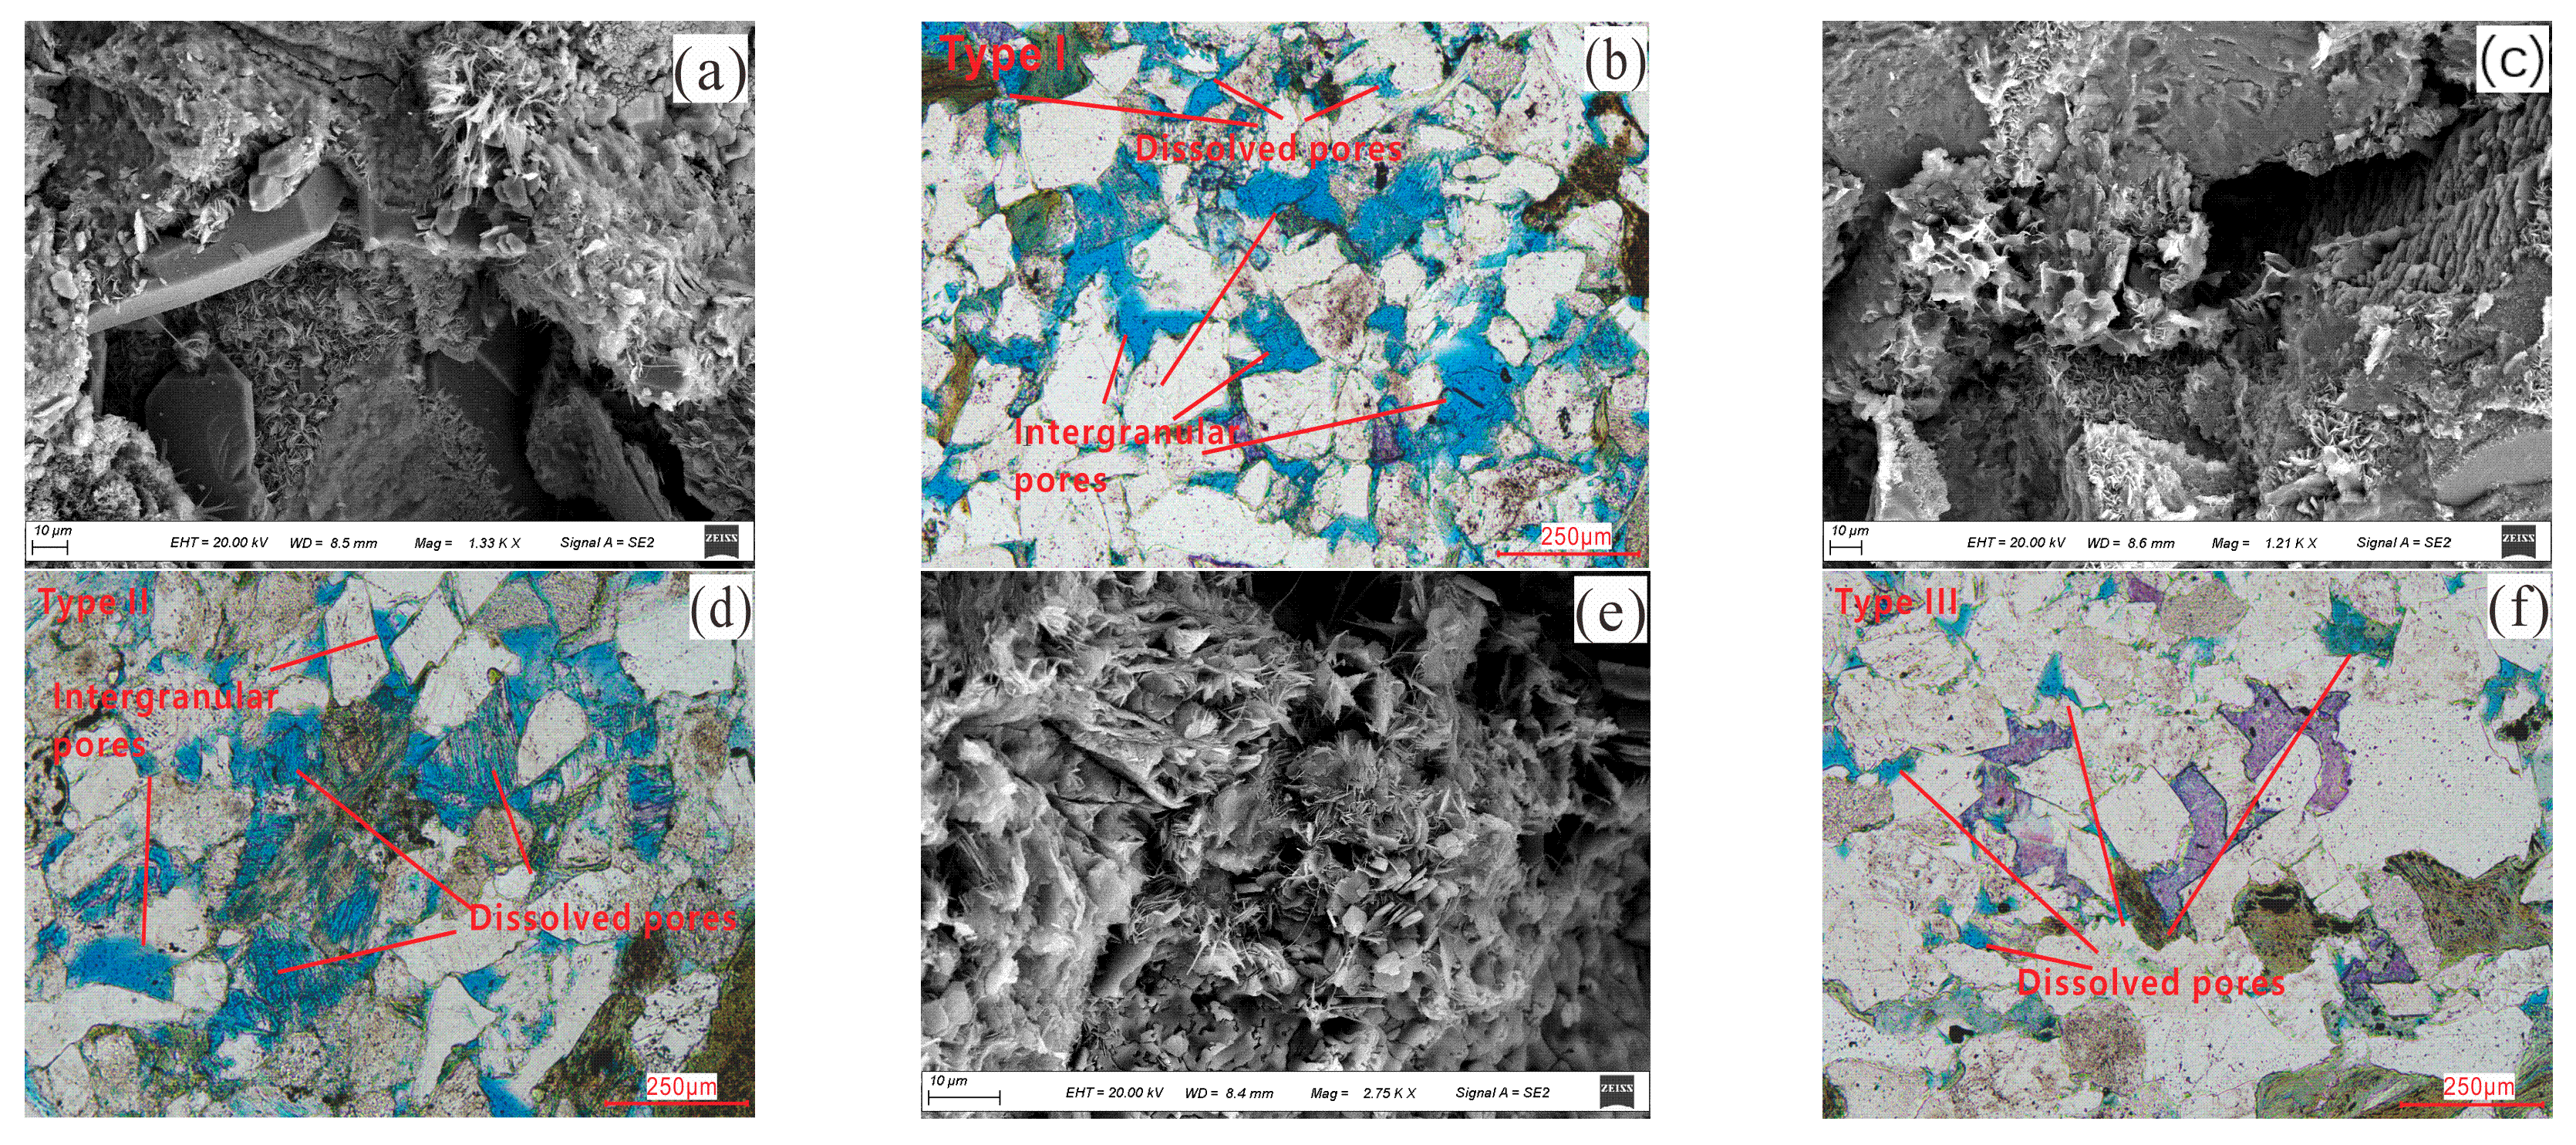
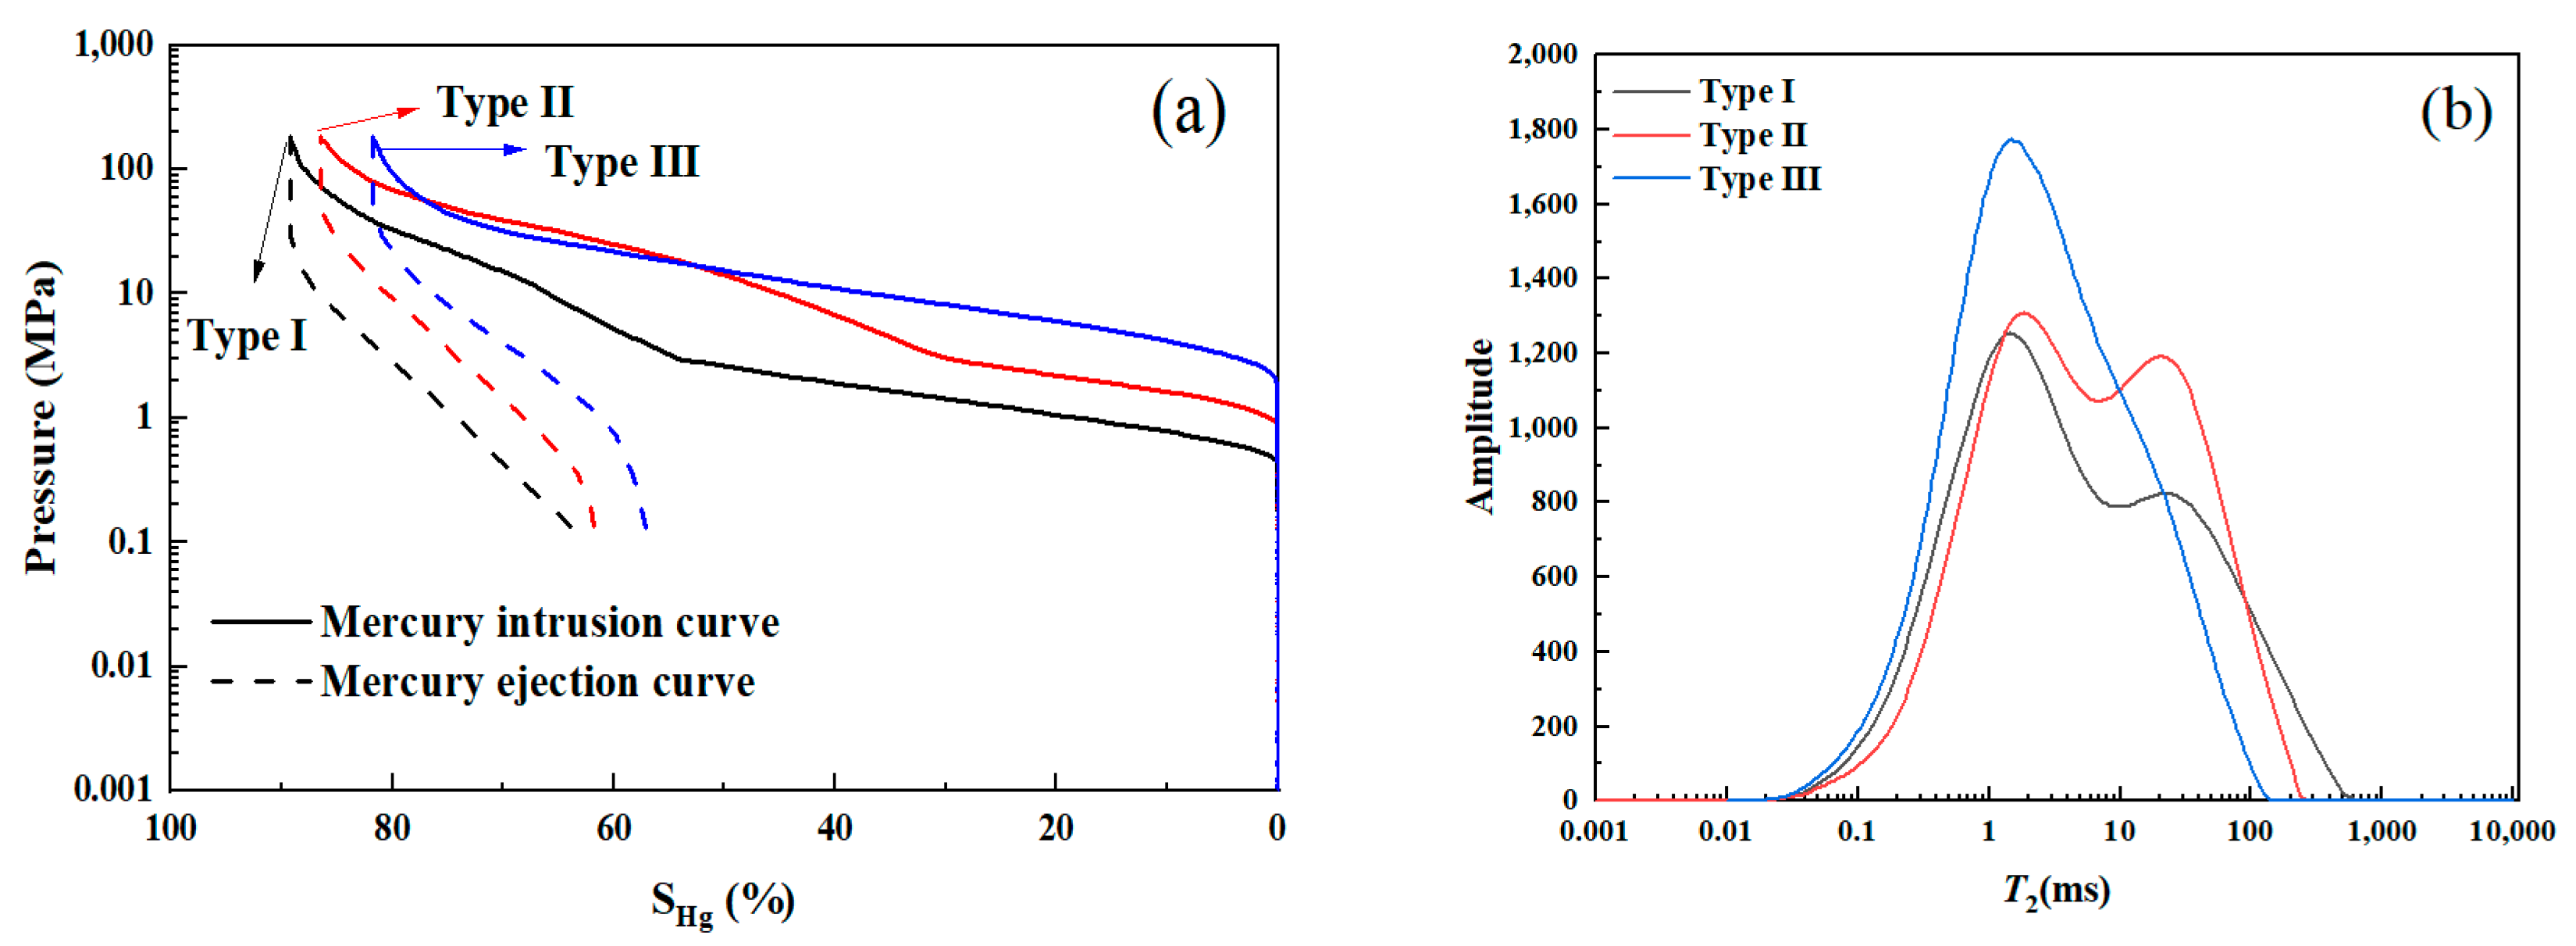
2. Microscopic Pore Structure Characteristics of Typical Tight Sandstone

This article analyzed 50 samples of dense sandstone from the Ordos Basin of the Chang6 reservoir and found that 74% of the cores had a bimodal distribution, while 26% had a monomodal distribution. The bimodal cores were more heterogeneous, with a higher percentage of left peaks and small holes. We used NMR T2 spectra, high-pressure mercury injection, scanning electron microscopy, casting thin-section analysis, and other parameters to evaluate the reservoir. We selected nine characteristic parameters for evaluation, including permeability, porosity, maximum mercury saturation, coefficient of sorting, median pressure, discharge pressure, pore throat radius, pore type, and pore–pore throat combination type; based on these parameters, we classified the 50 core samples and established 3 sample classification and evaluation criteria for the dense sandstone in Chang6 reservoir (Table 1).
Type I sandstone samples have the best physical properties and the best pore structure of the three types of samples. This type of reservoir has a proportion of 32%, and the porosity is between 9.45 and 13.58%, with an average porosity of 10.96%. The permeability is between 0.123 × 10⁻³ μm2 and 0.381 × 10⁻³ μm2, with an average of 0.138 × 10⁻³ μm2. The maximum mercury saturation has an average of 89.25% based on the mercury compression experiments. Other data are shown in Table 1. Observations from the casting thin sections reveal that the predominant pore types within this rock core are intergranular pores (Figure 1a,b). Type I samples have the lowest threshold pressure, as the average is only 0.58 (Figure 2a). The NMR T2 spectra of saturated water in the samples of type I cores are bimodal. The relaxation time has a wide distribution, mainly in the range of 0.02–499.45 ms (Figure 2b). The distribution range is wide, which means the type I samples have a better physical property.
The pore structure and physical properties of type II sandstone samples are slightly worse compared to type I samples. The proportion of type II reservoirs is higher at 46%, and the porosity ranges from 8.19% to 11.61%, with an average of 9.12%. The permeability ranges from 0.047 × 10⁻³ μm2 to 0.116 × 10⁻³ μm2, with an average of 0.067 × 10⁻³ μm2. The maximum feed mercury saturation averages at 85.71% based on the mercury compression experiments. A small number of intergranular pores and much more dissolved pores are observed in this type of core from the casting thin sections (Figure 1c,d). Type II samples’ average threshold pressure is 1.82 (Figure 2a). The NMR T2 spectra of saturated water in type II core samples are also bimodal, but the relaxation time distribution of the T2 spectra is smaller than that of type I samples. It is mainly distributed in the range 0.03–252.35 ms (Figure 2b). This type of core has poorer physical properties, greater median and discharge pressures than type I samples, and a smaller average pore throat radius.
There exists poor physical properties and a poor pore structure for type III sandstone samples. The proportion of this type of reservoir is 22%, with porosity ranging from 6.87% to 10.48%, giving an average of 8.83%. Permeability ranges from 0.025 × 10⁻³ μm2 to 0.043 × 10⁻³ μm2, with an average of 0.031 × 10⁻³ μm2. The maximum feed mercury saturation averages at 74.62% based on the mercury compression experiments. The types of pore throats in this type of core, as observed in casting thin sections, are predominantly solution and intergranular pores (Figure 1e,f). Type III samples have the highest threshold pressure, with an average of 3.94 (Figure 2a). The saturated water NMR T2 spectra of type III core samples are predominantly single-peaked; the highest peak is on the left, indicating a high percentage of small pores. The relaxation time is mainly distributed in the range of 0.04–136.04 ms (Figure 2b). This type of core has the worst physical properties and the smallest pore throat radius, and this type of pore is relatively unattached.

3. Experimental Section

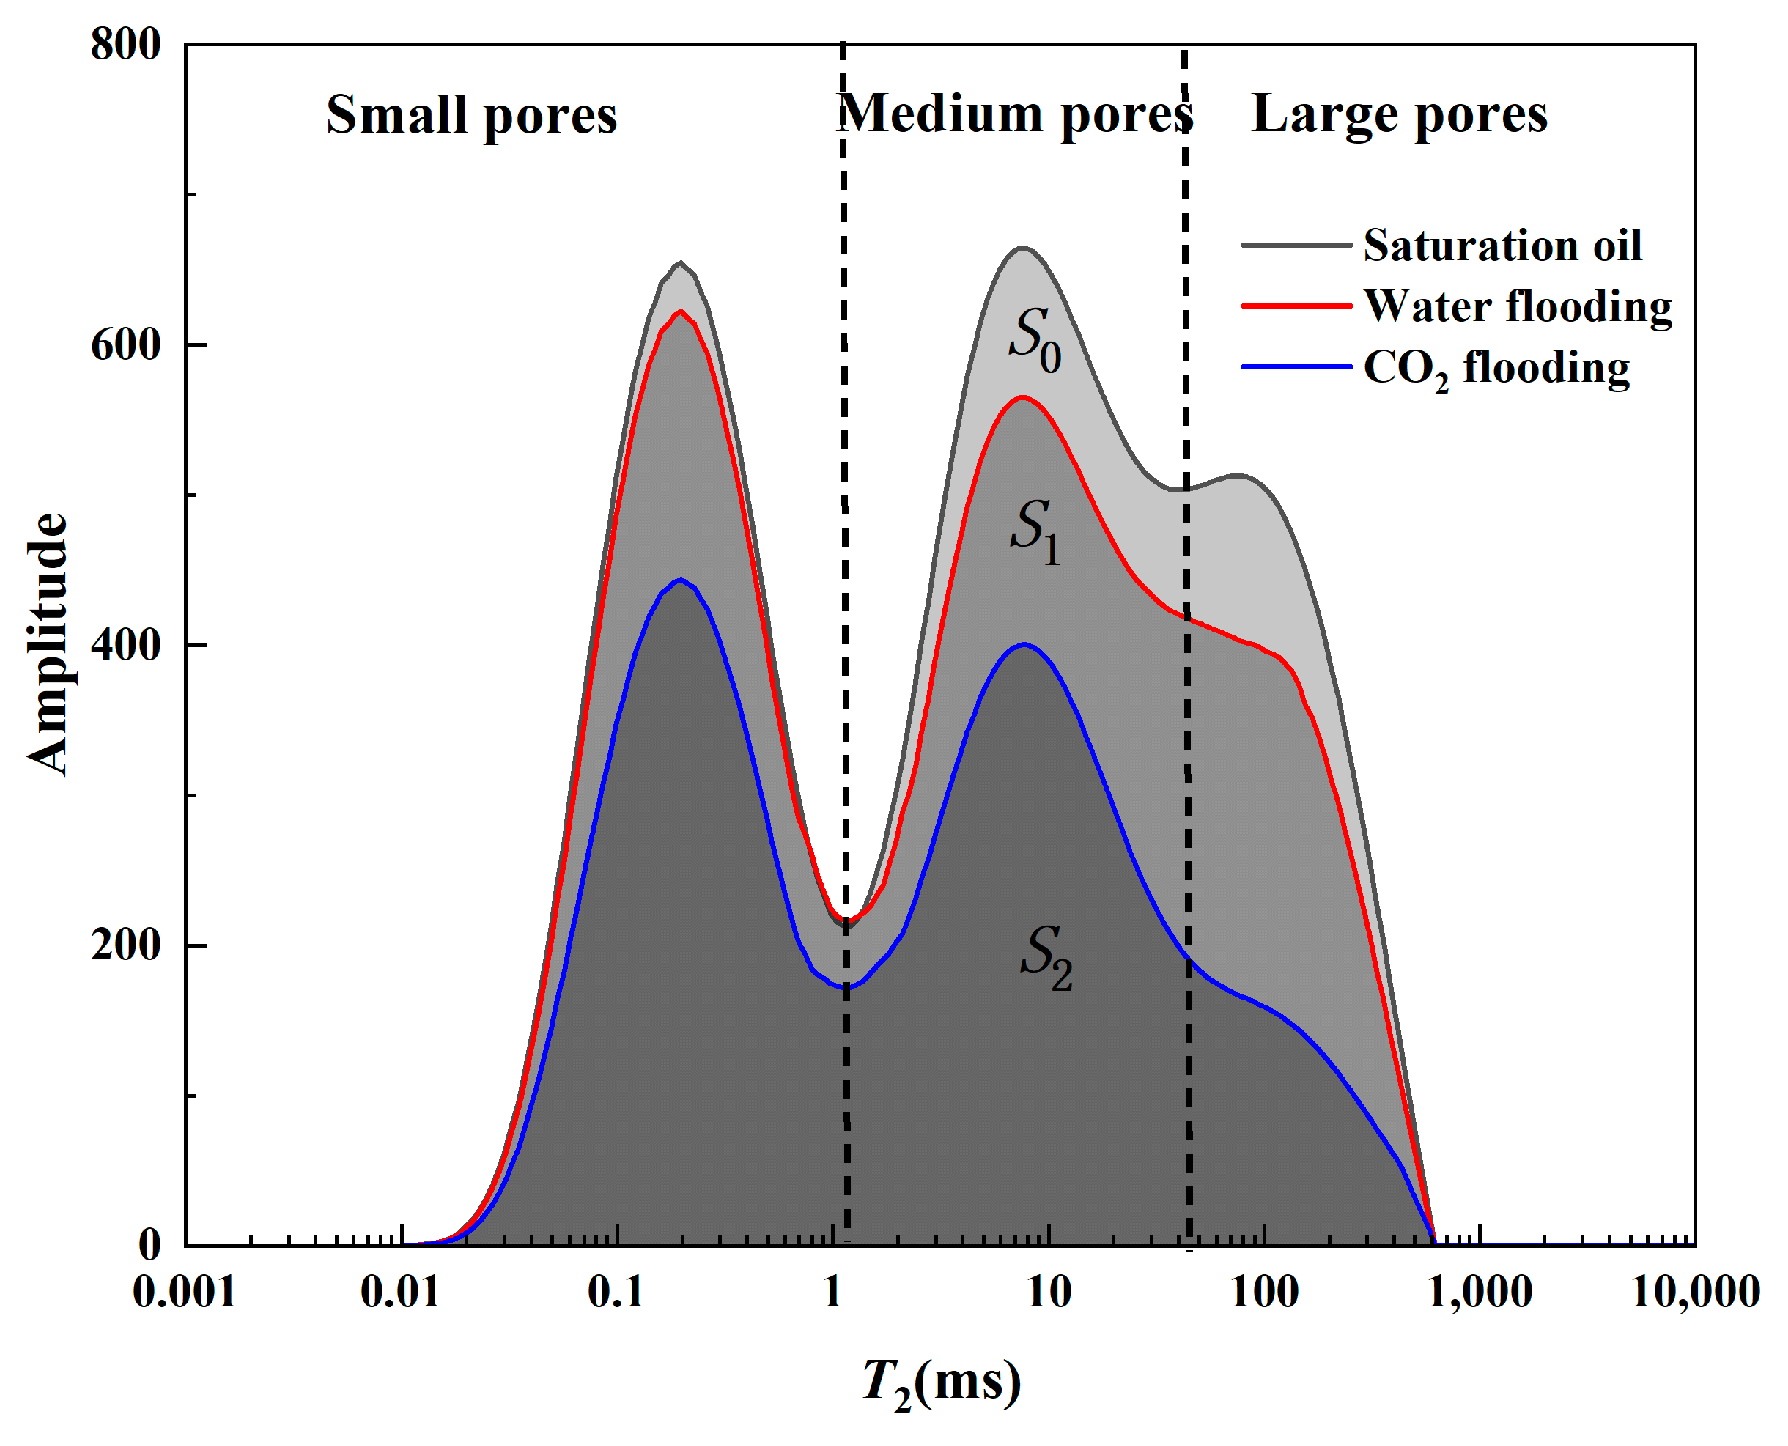
3.1. Experimental Principles

The NMR technique is primarily utilized to measure the transverse relaxation time T2 of core samples, which quantifies the volume change of fluid within the core. The equation for the conversion relationship between T2 relaxation time and pore radius can be expressed as follows:
1 T 2 = ρ ( S V ) p o r e = c r
where T2 is the transverse relaxation time, ms; ρ is a rock surface relaxation strength constant. S V is the specific surface, m2/m3; c is a parameter with pore-related properties; r is the pore radius, μm.
Based on the fundamental principles of NMR, the pore radius is directly proportional to the relaxation time T2. The oil recovery rate can be calculated using Equation (2), while the contribution of various porosity scales to the overall oil recovery can be determined using Equation (3). A schematic representation of the NMR T2 spectrum change curve is provided in Figure 3.
E = S 0 S i S 0 × 100 %
C = A i S 0 S i × 100 %
where E is the degree of oil recovery. C is the contribution rate. S0 is the area integrated with saturated oil. Si is the area integrated with an X-axis at the end of water flooding or CO2 flooding at a certain pressure. Ai denotes the envelope area of the T2 spectrum of a certain pore type before and after the experiments.

3.2. Experimental Materials

We selected three type samples based on the classification of microscopic pore structures as shown in Table 2. The oil sample used in the experiment was degassed oil from the surface of the Ordos Basin Chang6 reservoir, and the volume ratio of kerosene to oil was 3:1. The reservoir temperature was 60 °C. The reservoir pressure was 2 MPa, with 0.809 g/cm3 density and 1.3 mPa·S viscosity. The minimum miscible pressure (MMP) was 15.8 MPa. The heavy water used in the experiment was 99.9% D2O (heavy water) and the CO2 gas was 99.9% pure. The stratum water used in the experiment was CaCl2 water with 25,000 ppm. To shield the hydrogen signal in the experiment, the Mn2+ solution used was mineralized at 25,000 ppm.

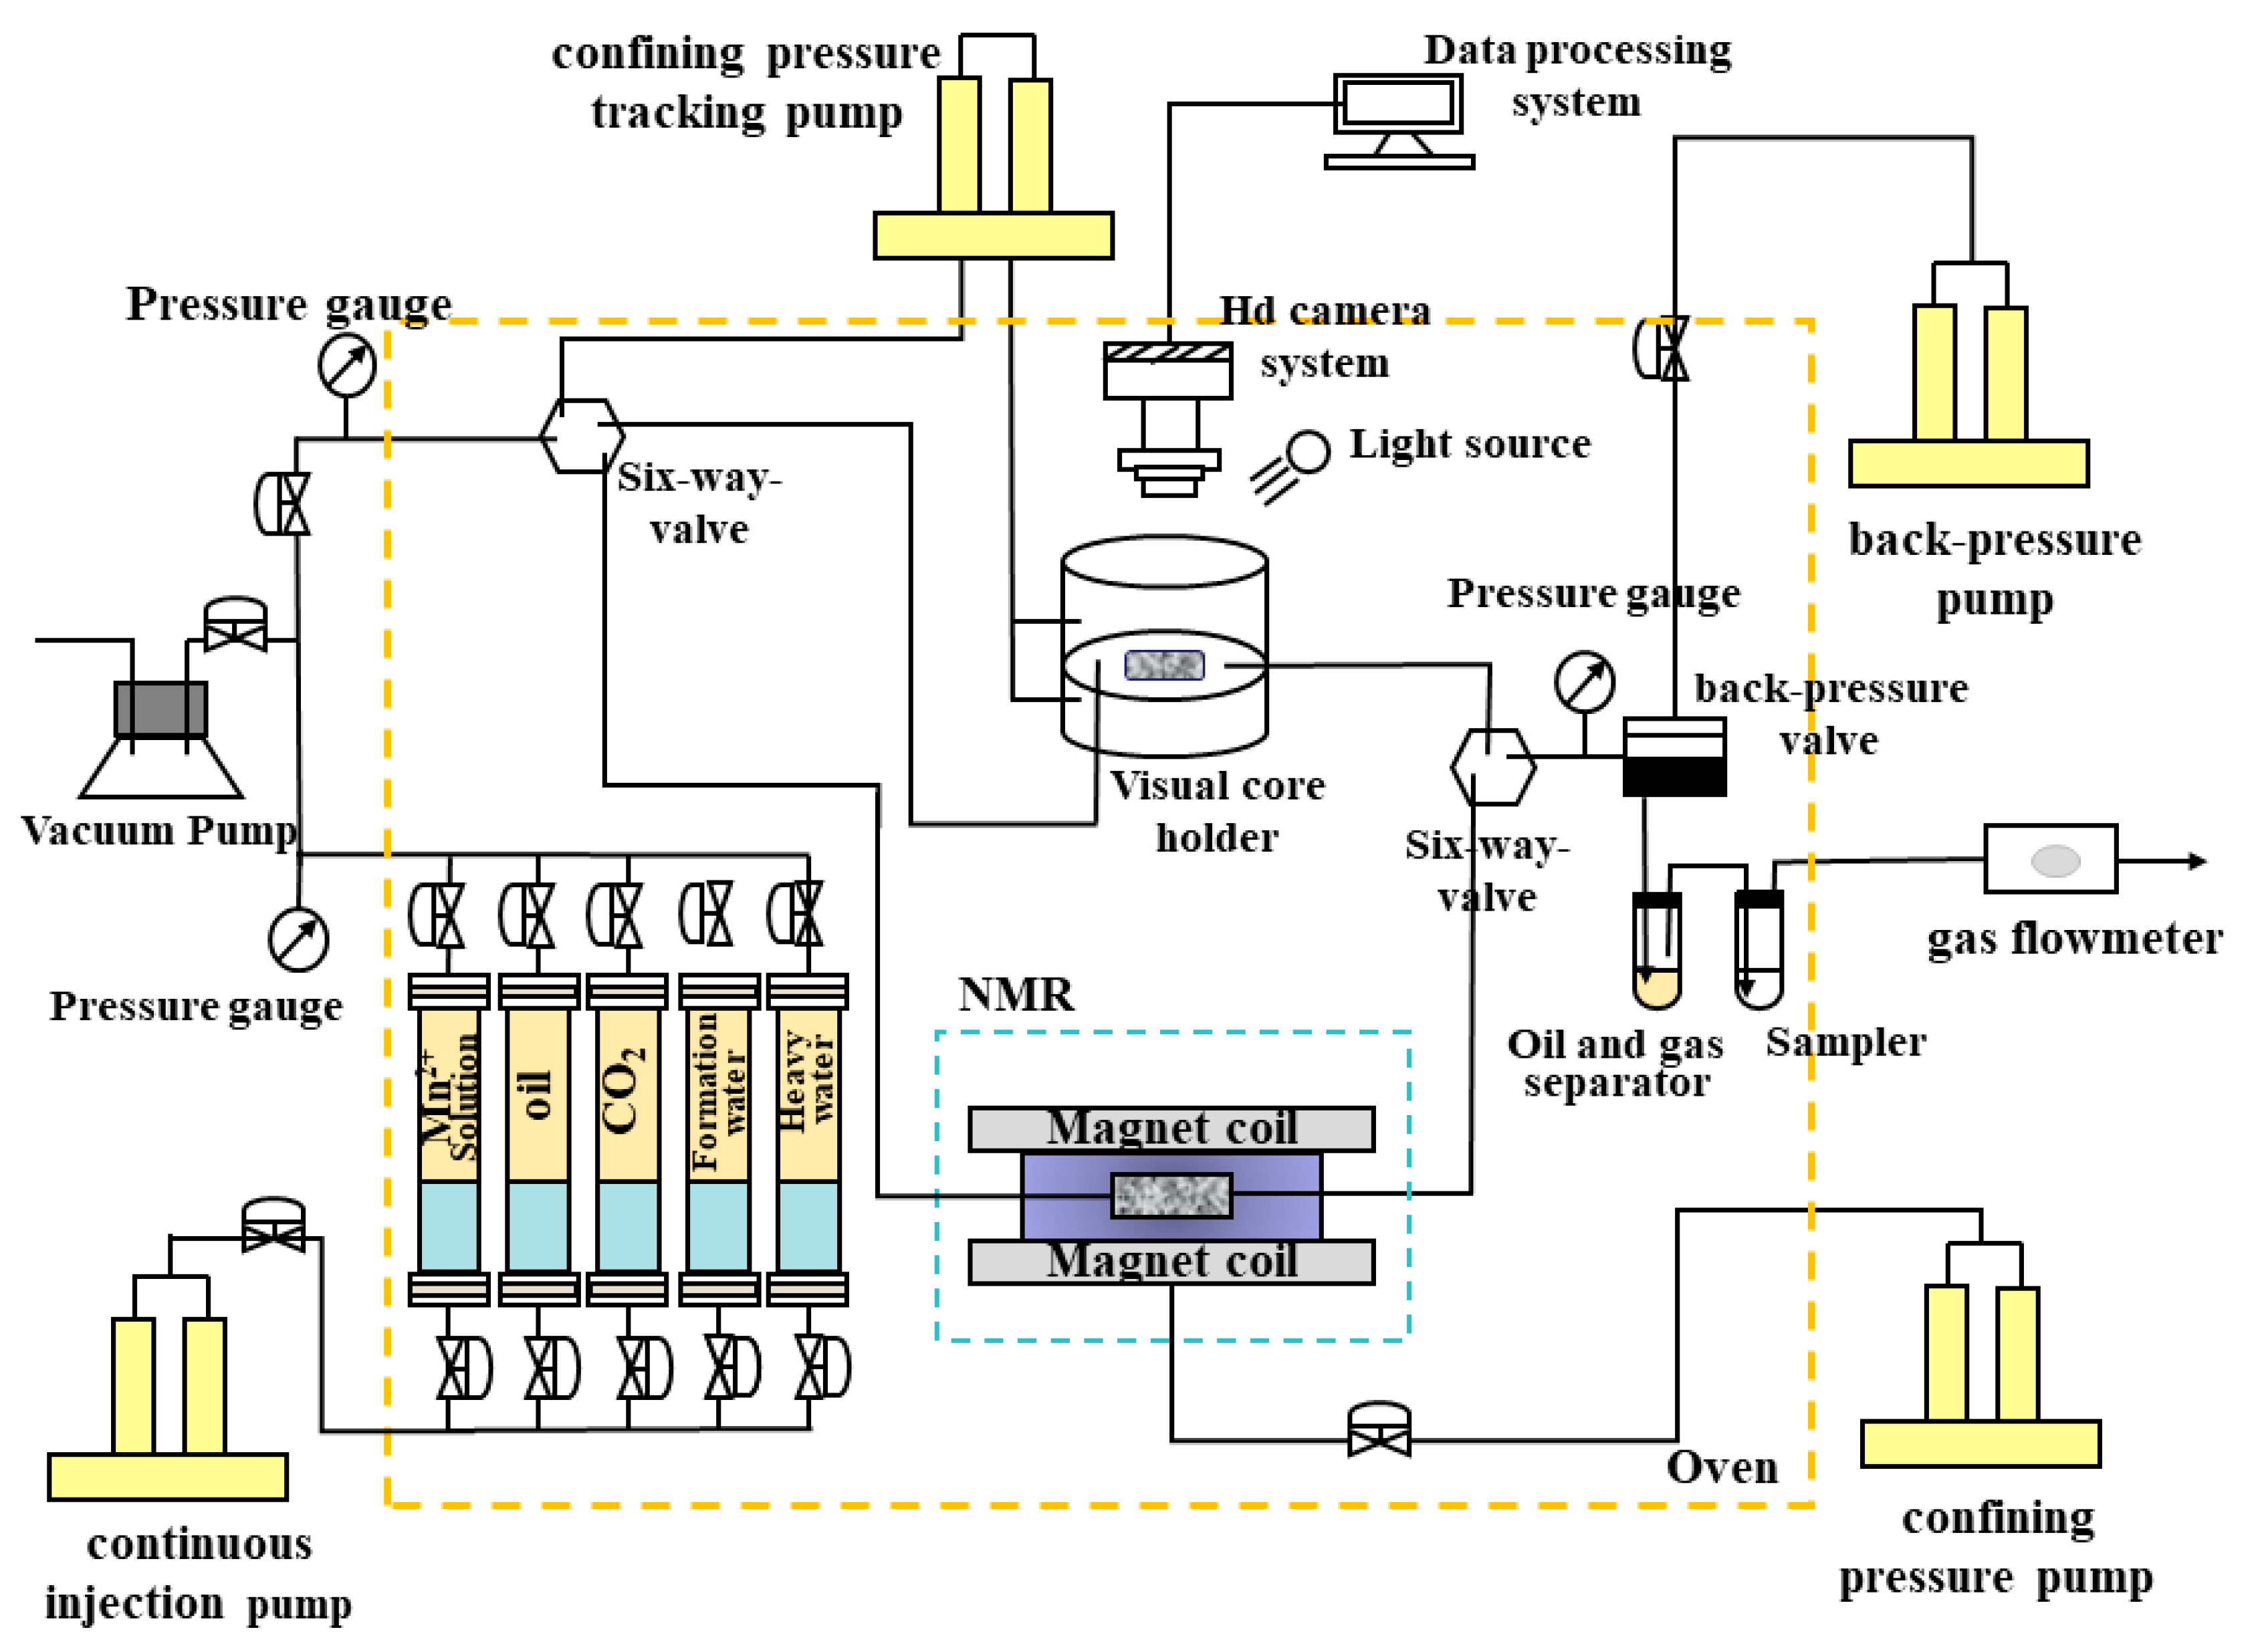
3.3. Experimental Apparatus

The experimental setup is composed of a plunger-like displacement device and a microscopic visualization displacement device, as shown in Figure 4 below. The LDY-150 displacement system includes a thermostat box, displacement injection pump, intermediate container, core gripper, hand pump, pressure return valve, gas flow meter, and other components. The injection pump can operate at flooding velocities ranging from 0.001 to 10 mL/min and flooding pressures ranging from 0 to 42 MPa. It can perform constant-pressure or constant-velocity flooding. The core gripper, intermediate container, and pressure return valve can withstand a maximum bearing pressure of 50 MPa. The maximum temperature of the thermostat is up to 120 °C, with an error of ±0.5 °C. The NMR instrument used has a model number of PQ001 and basic parameters of a 12 MHz permanent magnet, a 1 inch probe, an echo time of 0.1 ms, a number of callbacks of 5000, a measurement waiting time of 2.5 s, and a number of accumulations of 64 times. The high-temperature and high-pressure microscopic visualization displacement system is self-developed and features a micro-visualization core gripper. The experimental samples were changed from samples to visualization models. An annular pressure pump was replaced with an annular pressure tracking pump, and a high-definition camera system and data processing system were added for better visualization and data analysis.

3.4. Experimental Procedure

The specific experimental steps are as follows:
(1)
Plunger sample displacement experiment.
(1)
Core preparation. The core was washed with a mixture of benzene and ethanol at a ratio of 3:1 for seven days using an oil washing apparatus. Following this, the cores were heated to 105 °C in a thermostat and maintained at that temperature for 48 h without any changes. After drying, permeability and porosity of the cores was calculated.
(2)
Reconstruction of the oil–water distribution. The core was saturated with simulated formation water with 0.01 mL/min flow rate; it consisted of CaCl2 water with a salinity level of 25,000 mg/L. The flooding process was halted when the liquid output reached 4–5 PV. We use a Mn2+ solution to minimize the hydrogen signal with 4–5 PV. Subsequently, using a 0.01 mL/min flow rate, the configured simulated oil was injected into the core. The flooding process was halted again when the discharge reached 4–5 PV, and the liquid at the outlet was confirmed to be 100% simulated oil. Finally, an NMR T2 spectrum was performed on the core.
(3)
The D2O flooding experiment. In the D2O flooding experiment, at a 0.01 mL/min flow rate, the D2O injected was into the core at the inlet end. Reaching 2 PV, the displacement was stopped, the oil production and the D2O injection were recorded, and we performed T2 spectrum sampling at the start and end of the displacement.
(4)
The CO2 flooding experiment. After the D2O flooding experiment, the CO2 flooding experiment was initiated. The intermediate vessel containing CO2 was first pressurized to the experimental pressure of 10 MPa. By adjusting the pressure return valve, the backpressure was adjusted to 0.1 MPa below the injection pressure. The CO2 injected rate was 0.1 mL/min at the inlet end, and the valve at the injection end was opened. The flooding process was stopped with 2 PV injection volume. We recorded the oil production and the CO2 injection, and the results of the NMR T2 spectrum were always recorded.
(5)
During the whole experiment, the annular pressure remained constant at 25 MPa, with the temperature set at 60 °C. After completing the flooding process (2)–(4), the pressure was adjusted to 15 MPa and 20 MPa, respectively, for subsequent flooding experiments. Following each experiment, the core was replaced before continuing with steps (2)–(5).
(2)
Micro-visualization experiments.
(1)
Preparation of the real core model. The core sample was extracted from the area adjacent to the plunger in the displacement experiment. It was then carefully cut and polished using professional equipment to create a visual model with dimensions of 50 mm × 25 mm × 5 mm (length × width × thickness). The model was then glued together for visualization purposes, and its porosity and permeability were measured.
(2)
The visualization of flooding experiments followed the same steps as those used in plunger-like flooding experiments, with some differences in experimental subjects. The microscopic visualization of the flooding was studied using real core flakes, while the sample substitution was carried out using a standard core sample with a diameter of 2.5 cm.
(3)
During the visualization of the flooding process, the annular pressure was regulated by an annular pressure tracking pump, which maintained a constant pressure that was always 0.5 MPa higher than the injection pressure.

4. Results and Discussion

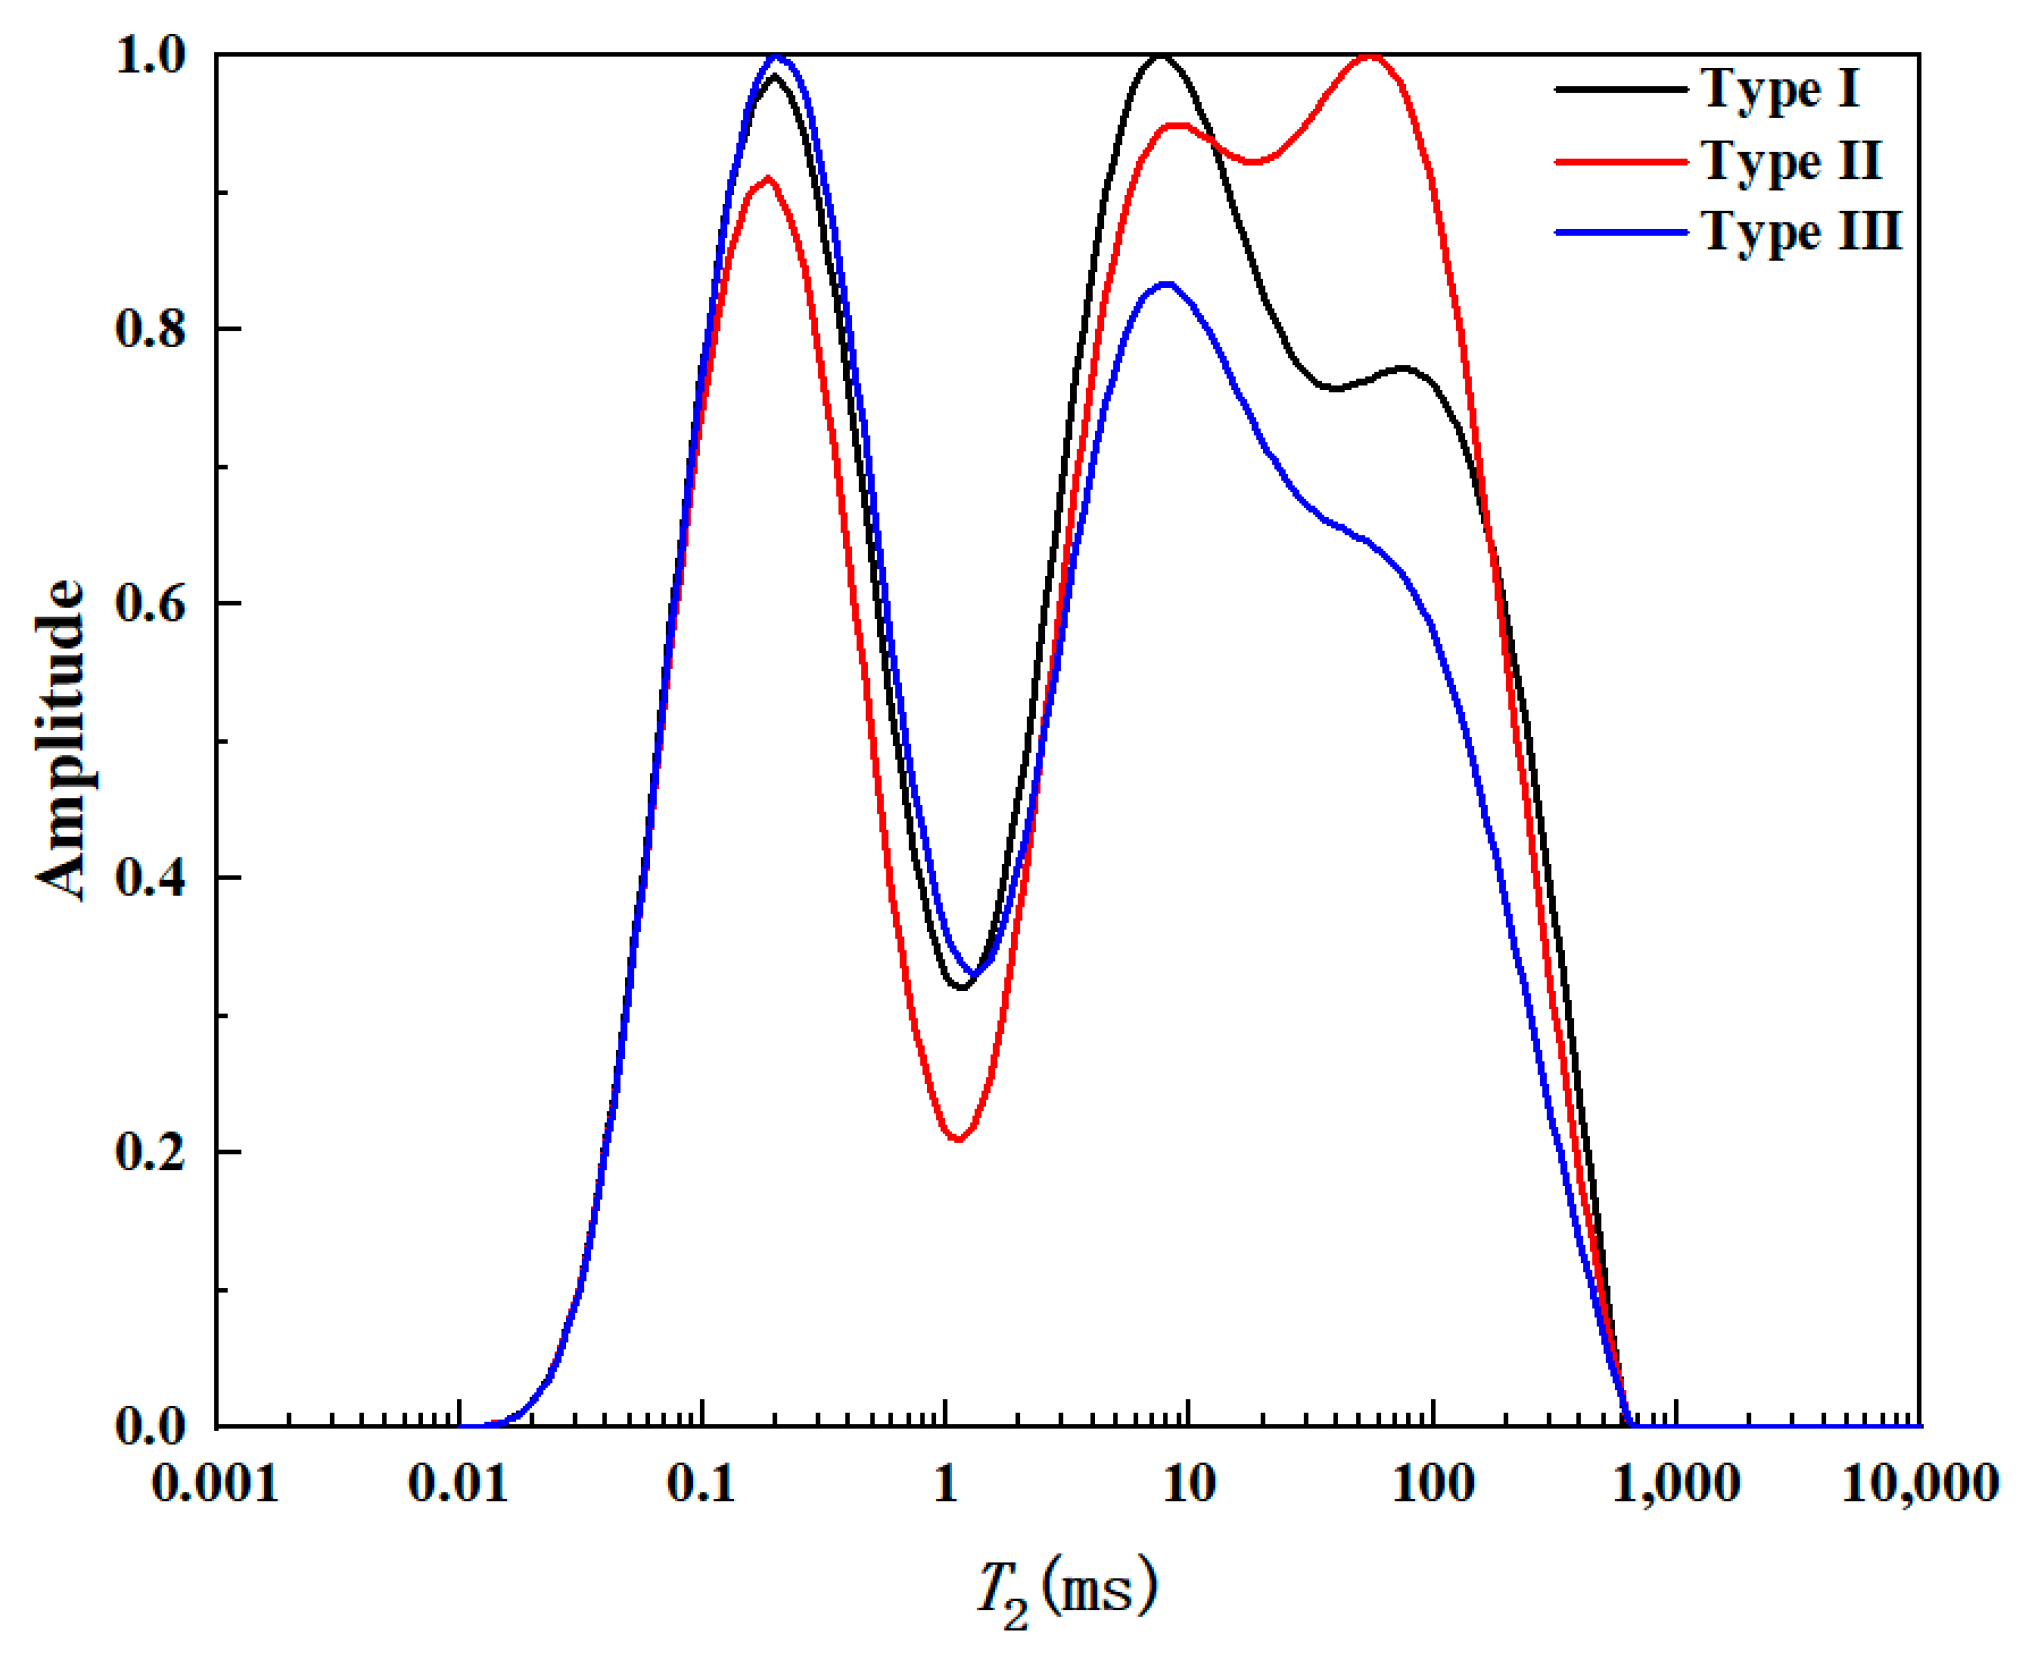
4.1. Saturated Oil T2 Spectra of Typical Core Samples

The saturated oil NMR T2 spectra of the cores are shown in Figure 5 below. To calculate individual pore fractions from the saturated oil NMR T2 spectra, we analyzed the amplitude of the left and center peaks for type I samples. The percentages of small, medium, and large pores were found to be 22.61%, 41.70%, and 35.69%, respectively. For type II core samples, the right peak amplitude was relatively high, at 32.12%, 42.40%, and 25.47% of small, medium, and large pores, respectively. Type III core samples exhibited relatively high left peak amplitudes and a slightly higher percentage of small pore intervals at 41.29%. The percentages of medium and large pores were 40.10% and 18.61%, respectively.
The NMR T2 spectra of the three types of core samples show that there is a high degree of variability in the development of each pore in different types of cores. The highest NMR T2 spectra correspond to the large pores of type II core samples, followed by type I core samples, and the lowest NMR T2 spectra are observed for type III core samples. The NMR T2 spectra corresponding to intermediate porosity are the highest in magnitude for type I core samples, whilst for type III core samples, they are the lowest. The amplitude of the NMR T2 spectra is highest for the low-porosity type III cores and lowest for the type II samples.

4.2. Oil Utilization Characteristics of Heavy Water Flooding

4.2.1. Recovery of D2O Flooding for Different Types of Samples

Prior to CO2 gas flooding, D2O flooding experiments were conducted on three distinct core samples. Utilizing the NMR curve, the recovery rate was ascertained in accordance with Equation (2). As depicted in Figure 6, the D2O flooding oil recovery rate for type I samples was 18.12%, followed by type II samples with an oil recovery of 15.72%, and type III samples with the lowest oil recovery rate of 11.25%. The recovery rate after D2O flooding of type II cores was only 2.4% lower than that of type I, while type III, with inferior physical properties, had an oil recovery rate 6.87% lower than that of type I. This disparity is attributable to variations in the physical properties and pore structure of the three cores, which ultimately resulted in varying D2O flooding oil recovery rates among the three types of samples. The physical attributes of type II samples are slightly inferior to those of type I samples, yet they exhibit a substantial number of intergranular pores. In comparison to type III reservoirs, physical properties of type II reservoirs are significantly superior, thus type I samples’ oil recovery rate is better, fallowed by the type II samples’ oil recovery rate, and type III samples having the lowest oil recovery rate. The presence of numerous intergranular pores in type II samples, despite their slightly inferior physical properties compared to type I samples, still results in their significantly higher oil flooding oil recovery rate compared to type III samples. The better the core’s physical properties are, the lower its capillary resistance becomes, leading to a higher D2O flooding oil recovery rate and a reduced residual oil content within the core.

4.2.2. Microporous Oil Utilization Characteristics of D2O Flooding

Based on the NMR T2 spectra after D2O flooding, Equation (2) was applied to quantify the oil utilization of the three types of samples, allowing us to obtain the degree of oil utilization in small, medium, and large pores during the D2O flooding process. As can be seen in Figure 7 below, the highest degree of oil utilization occurs within the large pores during D2O flooding in the three types of samples, followed by medium pores, while small pore oil utilization is minimal. Because the capillary resistance varies within different pores, with smaller pore scales, the capillary resistance increases. D2O preferentially enters the large pores where the resistance of the capillary is lower, the leading edge of the wave is advancing, and the wave spreads to the surrounding medium pores with slightly higher capillary resistance as well as to some of the small pores; thus, the oil in medium and small pores can be effectively utilized. Type I samples have more developed pores, more intergranular pores, a lower discharge pressure, and a larger average pore throat radius. So, it is easier for D2O to enter the core to drive out more oil. Type II samples have a higher degree of medium pore utilization due to better connectivity between medium and large pores in type II samples. Type III samples have a higher percentage of pores with poor properties, structurally small pores, and a higher capillary resistance, so there is less oil utilization in both small and large pores of type III samples.

4.3. Oil Utilization Characteristics of CO2 Flooding after Water Flooding

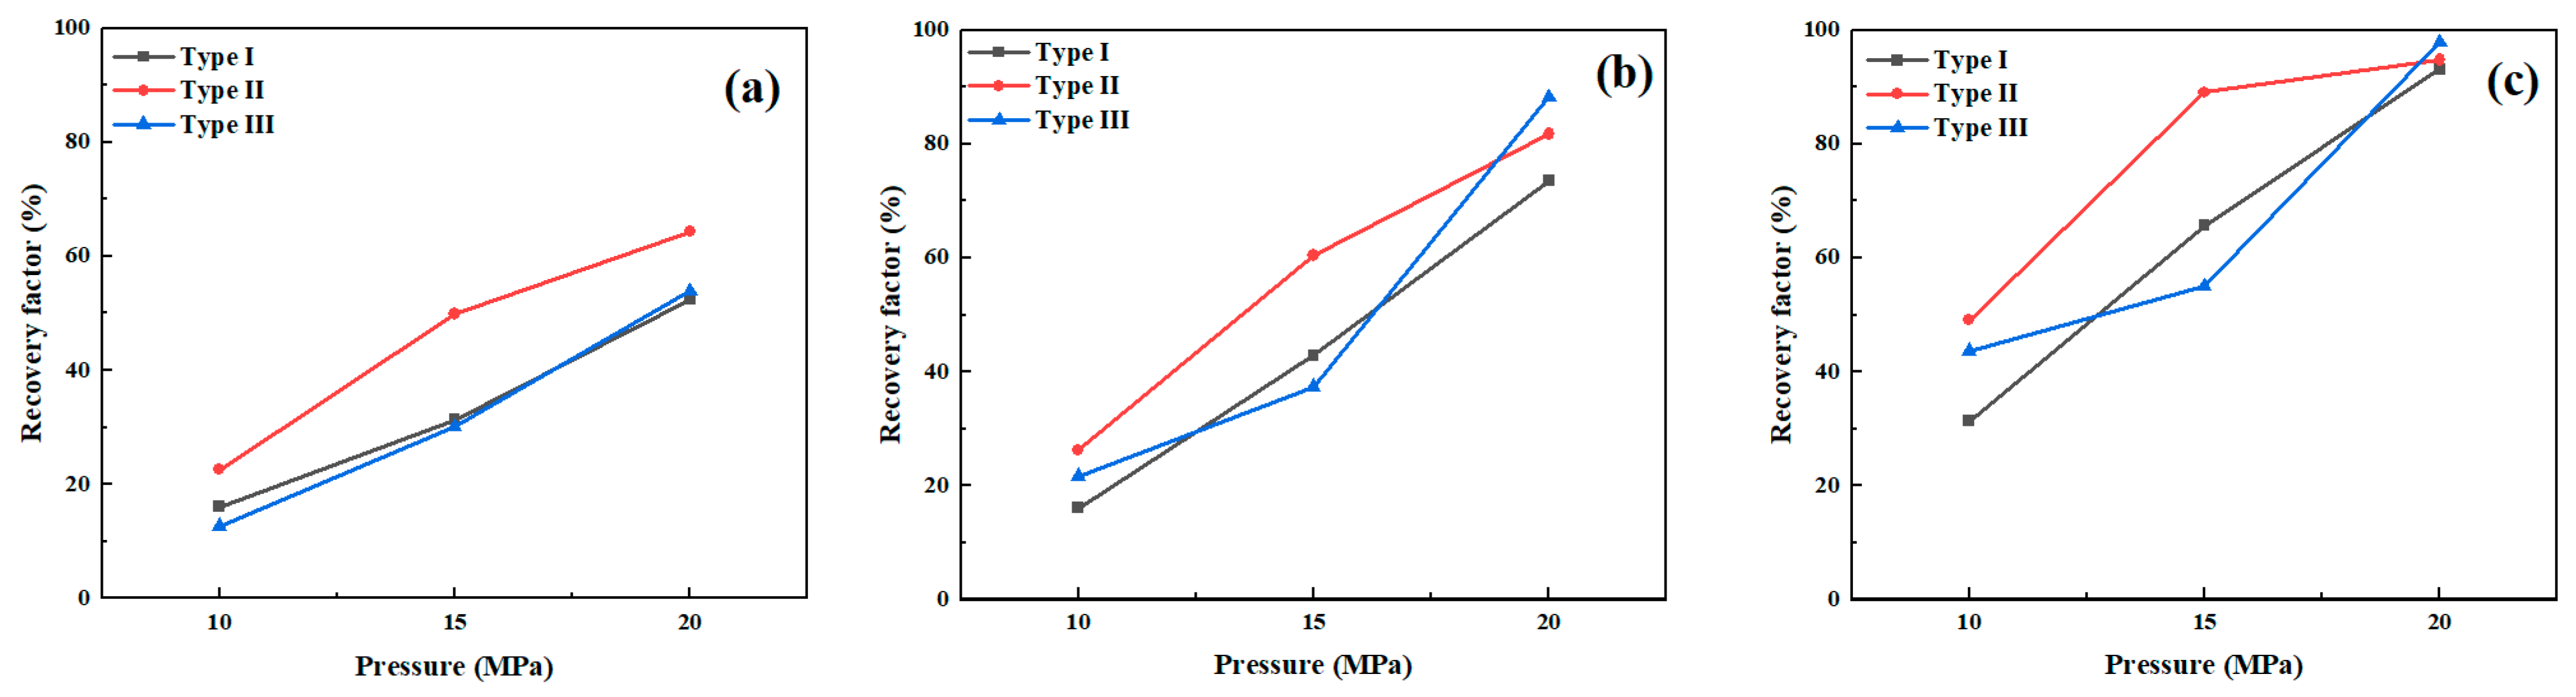
4.3.1. Recovery of CO2 Flooding after D2O Flooding for Different Types of Samples

For the three types of core samples, we analyzed the recovery of CO2 flooding after D2O flooding at different pressures (Figure 8) and the specific increases in oil recovery (Table 3). It was observed that the recovery rate of the samples gradually increased with increasing pressure. We observed the highest oil recovery rate for type II samples, but the enhancement in oil recovery varied by stage for the three types of cores. From the 10 MPa immiscible phase to the 15 MPa near-miscible phase, for type II samples, a maximum oil recovery rate of 64.33% and a maximum increase of 33.42% were observed, followed by the increase for type I samples, while type III samples recorded the lowest increase.
The primary reason for this is that in the immiscible phase, CO2 primarily displaces oil in large and medium-sized pores. As for type III samples, it has a lower percentage of medium and large pores, resulting in lower oil recovery. The best physical properties are observed for type I samples, with a well-developed pore structure and a high proportion of large and medium pores. However, CO2 tends to induce gas kicks easily, which can impact the final oil recovery rate. When the pressure increases beyond the minimum miscible pressure (MMP), the residual oil in type III samples after water flooding is effectively utilized. Within the pressure range from 15 MPa to 20 MPa, the oil recovery rate of type III samples increased by up to 38.16%, the growth rate of type I samples was second, and the improvement was the lowest for type II samples. This indicates that the miscible phase has a significant impact on enhancing the oil recovery rate of type III reservoirs.
By comparing the gas flooding oil utilization of different pores in the three types of core samples after D2O flooding (Figure 9), before miscibility, it was found that the degree of oil utilization was consistently highest in the small, medium, and large pores of type II samples, with the increase rate being the greatest. Type III samples were second, with the lowest ratio of growth in the recovery rate observed for type I samples. This is because type II cores have a higher proportion of both large and medium pores, coupled with superior pore connectivity. Below the MMP, CO2 expansion flooding is dominant, and CO2 will preferentially enter large pores and continue to accumulate and expand, eventually forcing its way into smaller pores with higher surrounding capillary resistance. This result shows that type II samples have the highest degree of oil utilization in the small pores. Type I cores are susceptible to gas kicks due to their pore structure and physical properties, resulting in low utilization of large and medium pores. Since the percentage of medium and large pores is higher in type I cores than in type III cores, the degree of oil utilization of each pore in type III samples was lower than that of type I samples under near-miscible phase pressure after D2O flooding. When the pressure reached the 20 MPa miscible phase, the interfacial tension between oil and CO2 disappeared, but CO2 still preferentially entered the large pores. After repeated contact between CO2 and the oil, the gas gradually entered the medium and small pores from the large pores in the miscible phase. Type III cores have a relatively small percentage of large and medium pores, and the large pore of the residual oil was mainly used to dissolve CO2 to reach a miscible phase. Therefore, the highest degree of large and medium pore oil utilization occurred for type III samples during the miscible phase. Thus, it is considered that type III cores are more suitable for CO2 miscible phase flooding after D2O flooding, while type I and type II cores are more suitable for near-miscible phase flooding after D2O flooding.

4.3.2. Microporous Oil Utilization Characteristics of CO2 Flooding

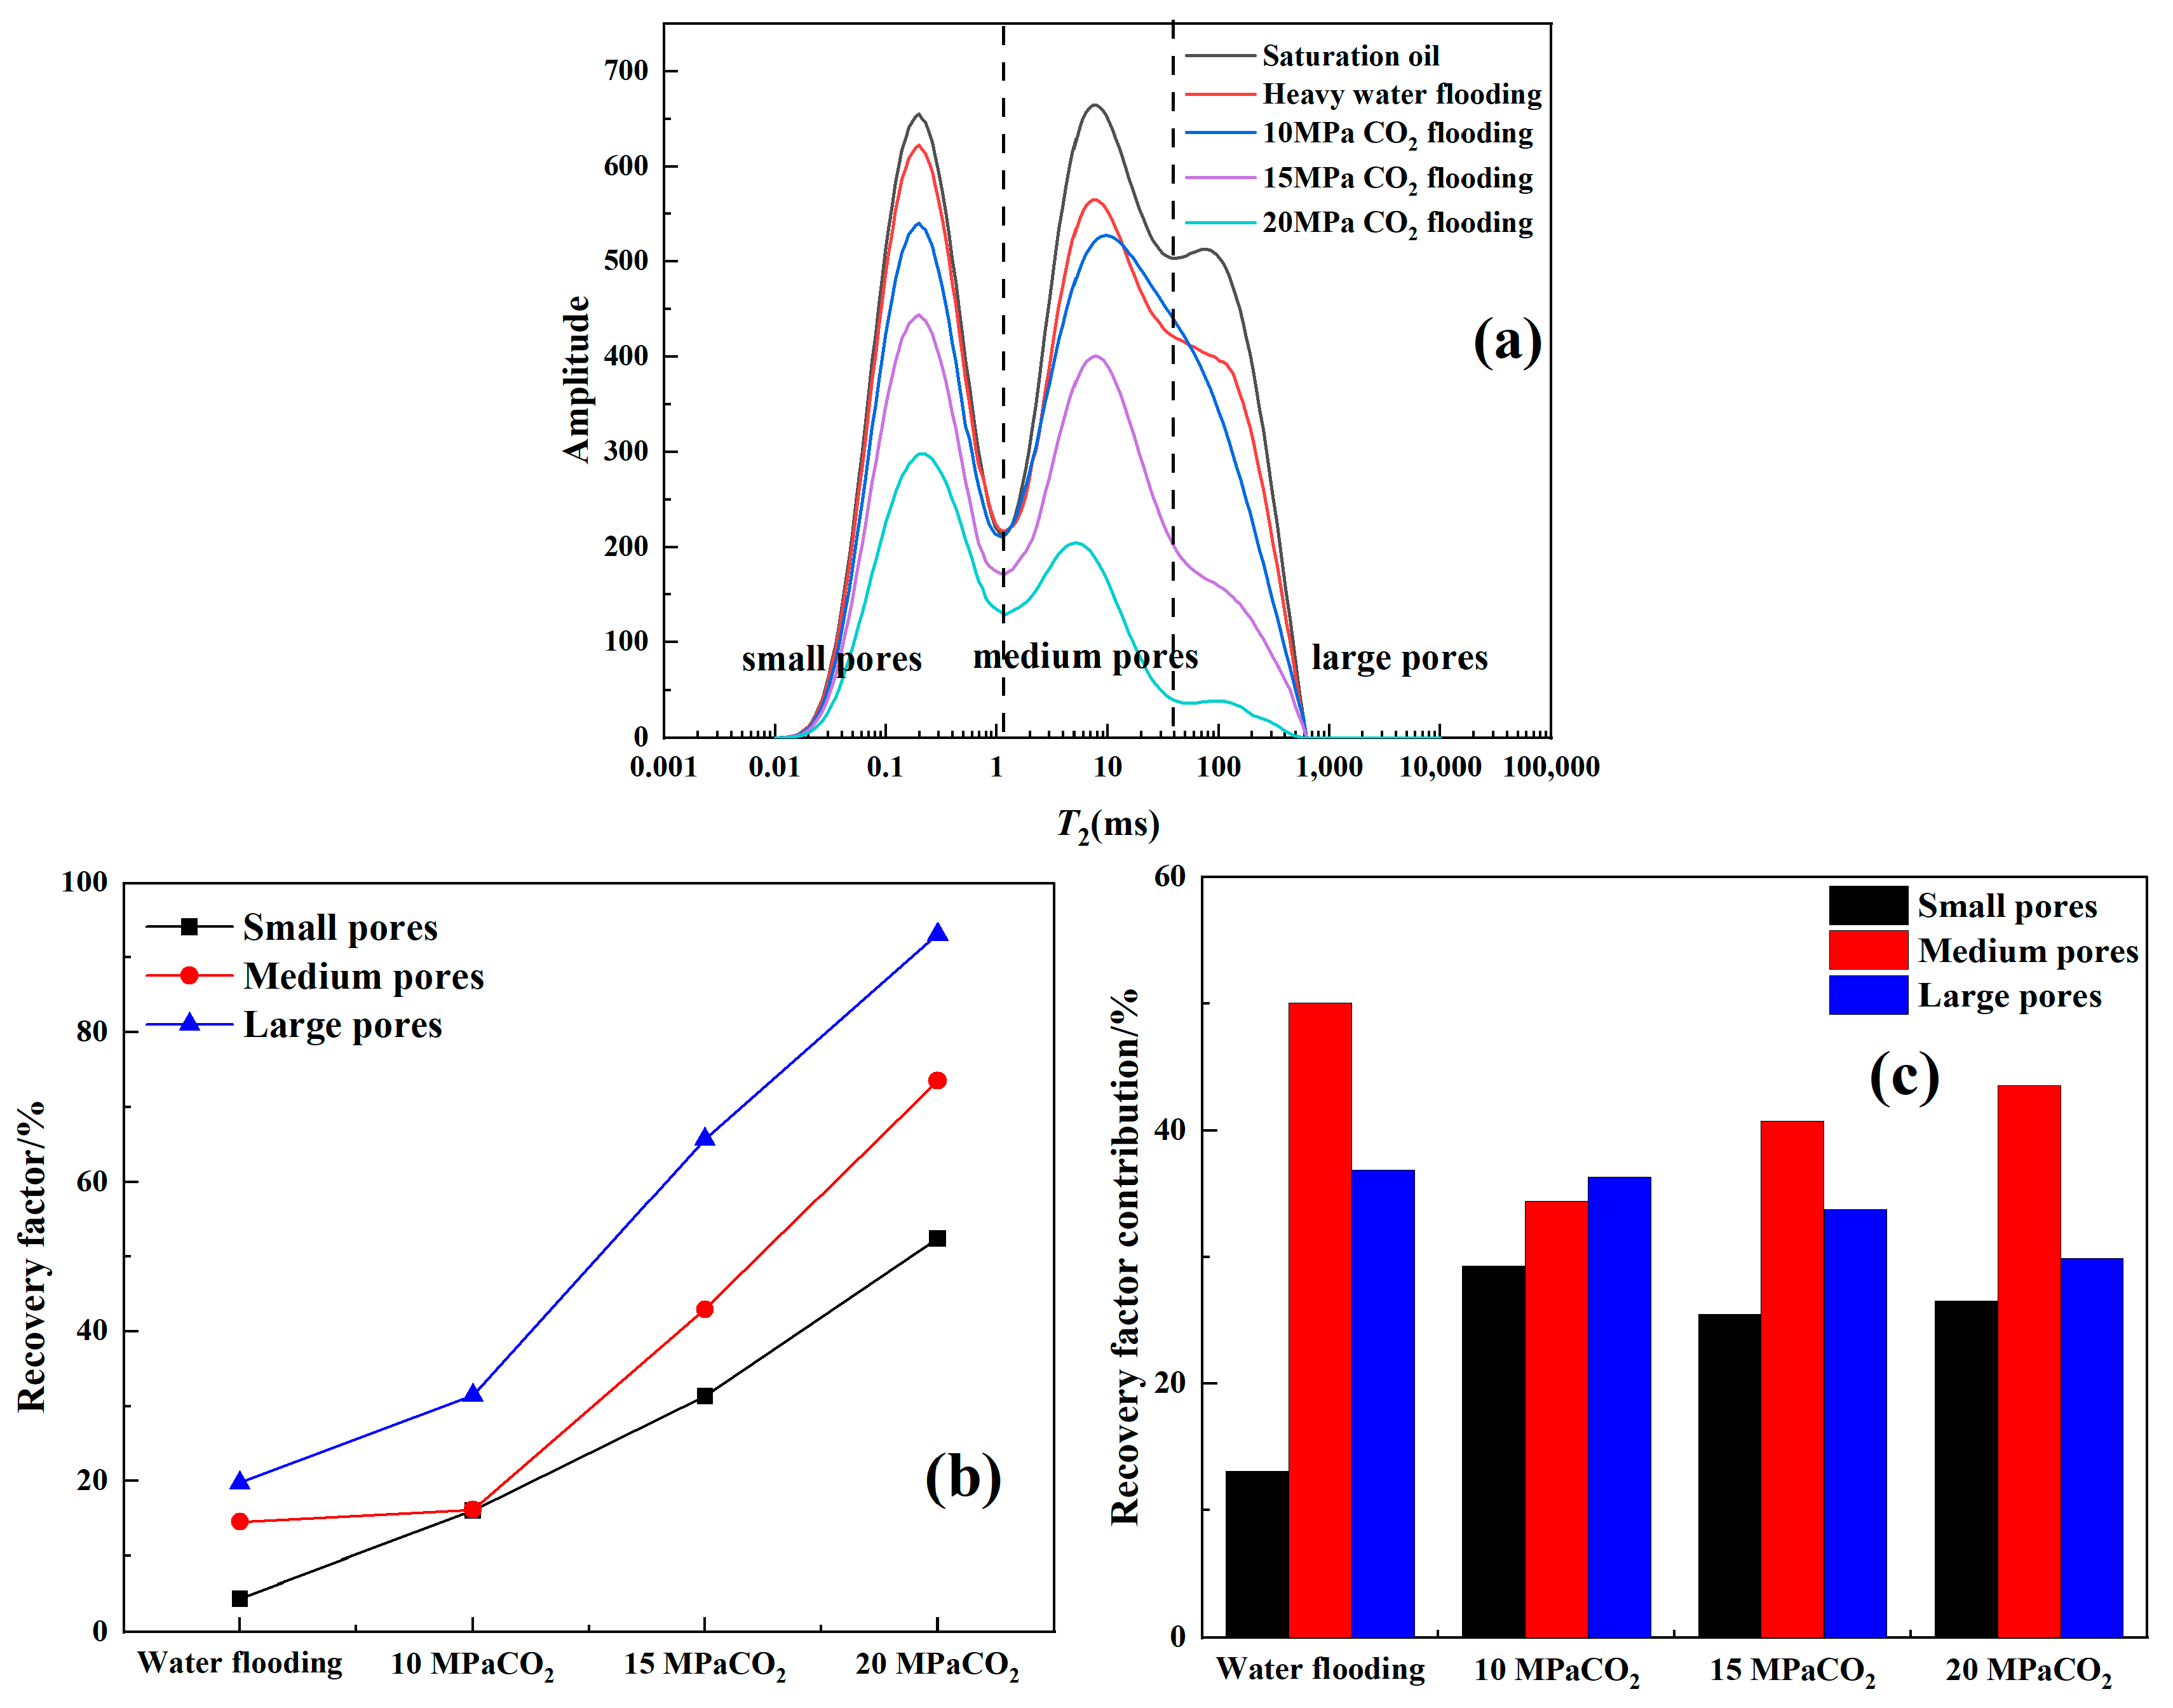
Oil Utilization Characteristics of Type I Samples

The NMR T2 spectra of type I samples at different pressures, between large and medium pores, have an increased connection, as shown in Figure 10a, indicating that the CO2 squeezed oil from large pores to medium pores under immiscible pressure. Additionally, there was a higher accumulation of oil at the throat due to some oil staying there. As the pressure increased and reached 15 MPa in the near-miscible phase, the NMR T2 spectra corresponding to large and medium pores decreased more significantly, suggesting that near-miscible phase flooding after D2O flooding is dominated by large and medium pores. Finally, when the pressure was increased by nearly one step to reach the miscible phase, the T2 spectra of large, medium, and small pores show a significant decrease.
As seen in Figure 10b, oil utilization in large, medium, and small pores increases gradually with increasing pressure after D2O flooding. The highest oil utilization was seen for large pores, followed by medium pores, and small pores have the lowest. The oil recovery rate of large pores was fastest in the immiscible phase, and the growth ratio of medium and large pores was comparable after reaching the miscible and near-miscible phases. This is due to the better physical properties and pore structure of type I samples. CO2 preferentially enters large and medium pores with better connectivity to large pores. When the pressure reached the near-miscible phase, the oil could dissolve in the CO2 in large quantities, leading to a gradual decrease in interfacial tension. The interfacial tension disappeared after reaching the miscible phase, allowing CO2 to enter small pore spaces more easily, which have a higher resistance to flooding the oil in the miscible phase. At a pressure of 20 MPa, the oil utilization in small, medium, and large pores of type I samples was 93.06%, 73.51%, and 52.36%, respectively. Figure 10c shows that when the pressure reached the near-miscible phase, oil was mainly driven out from medium pores.

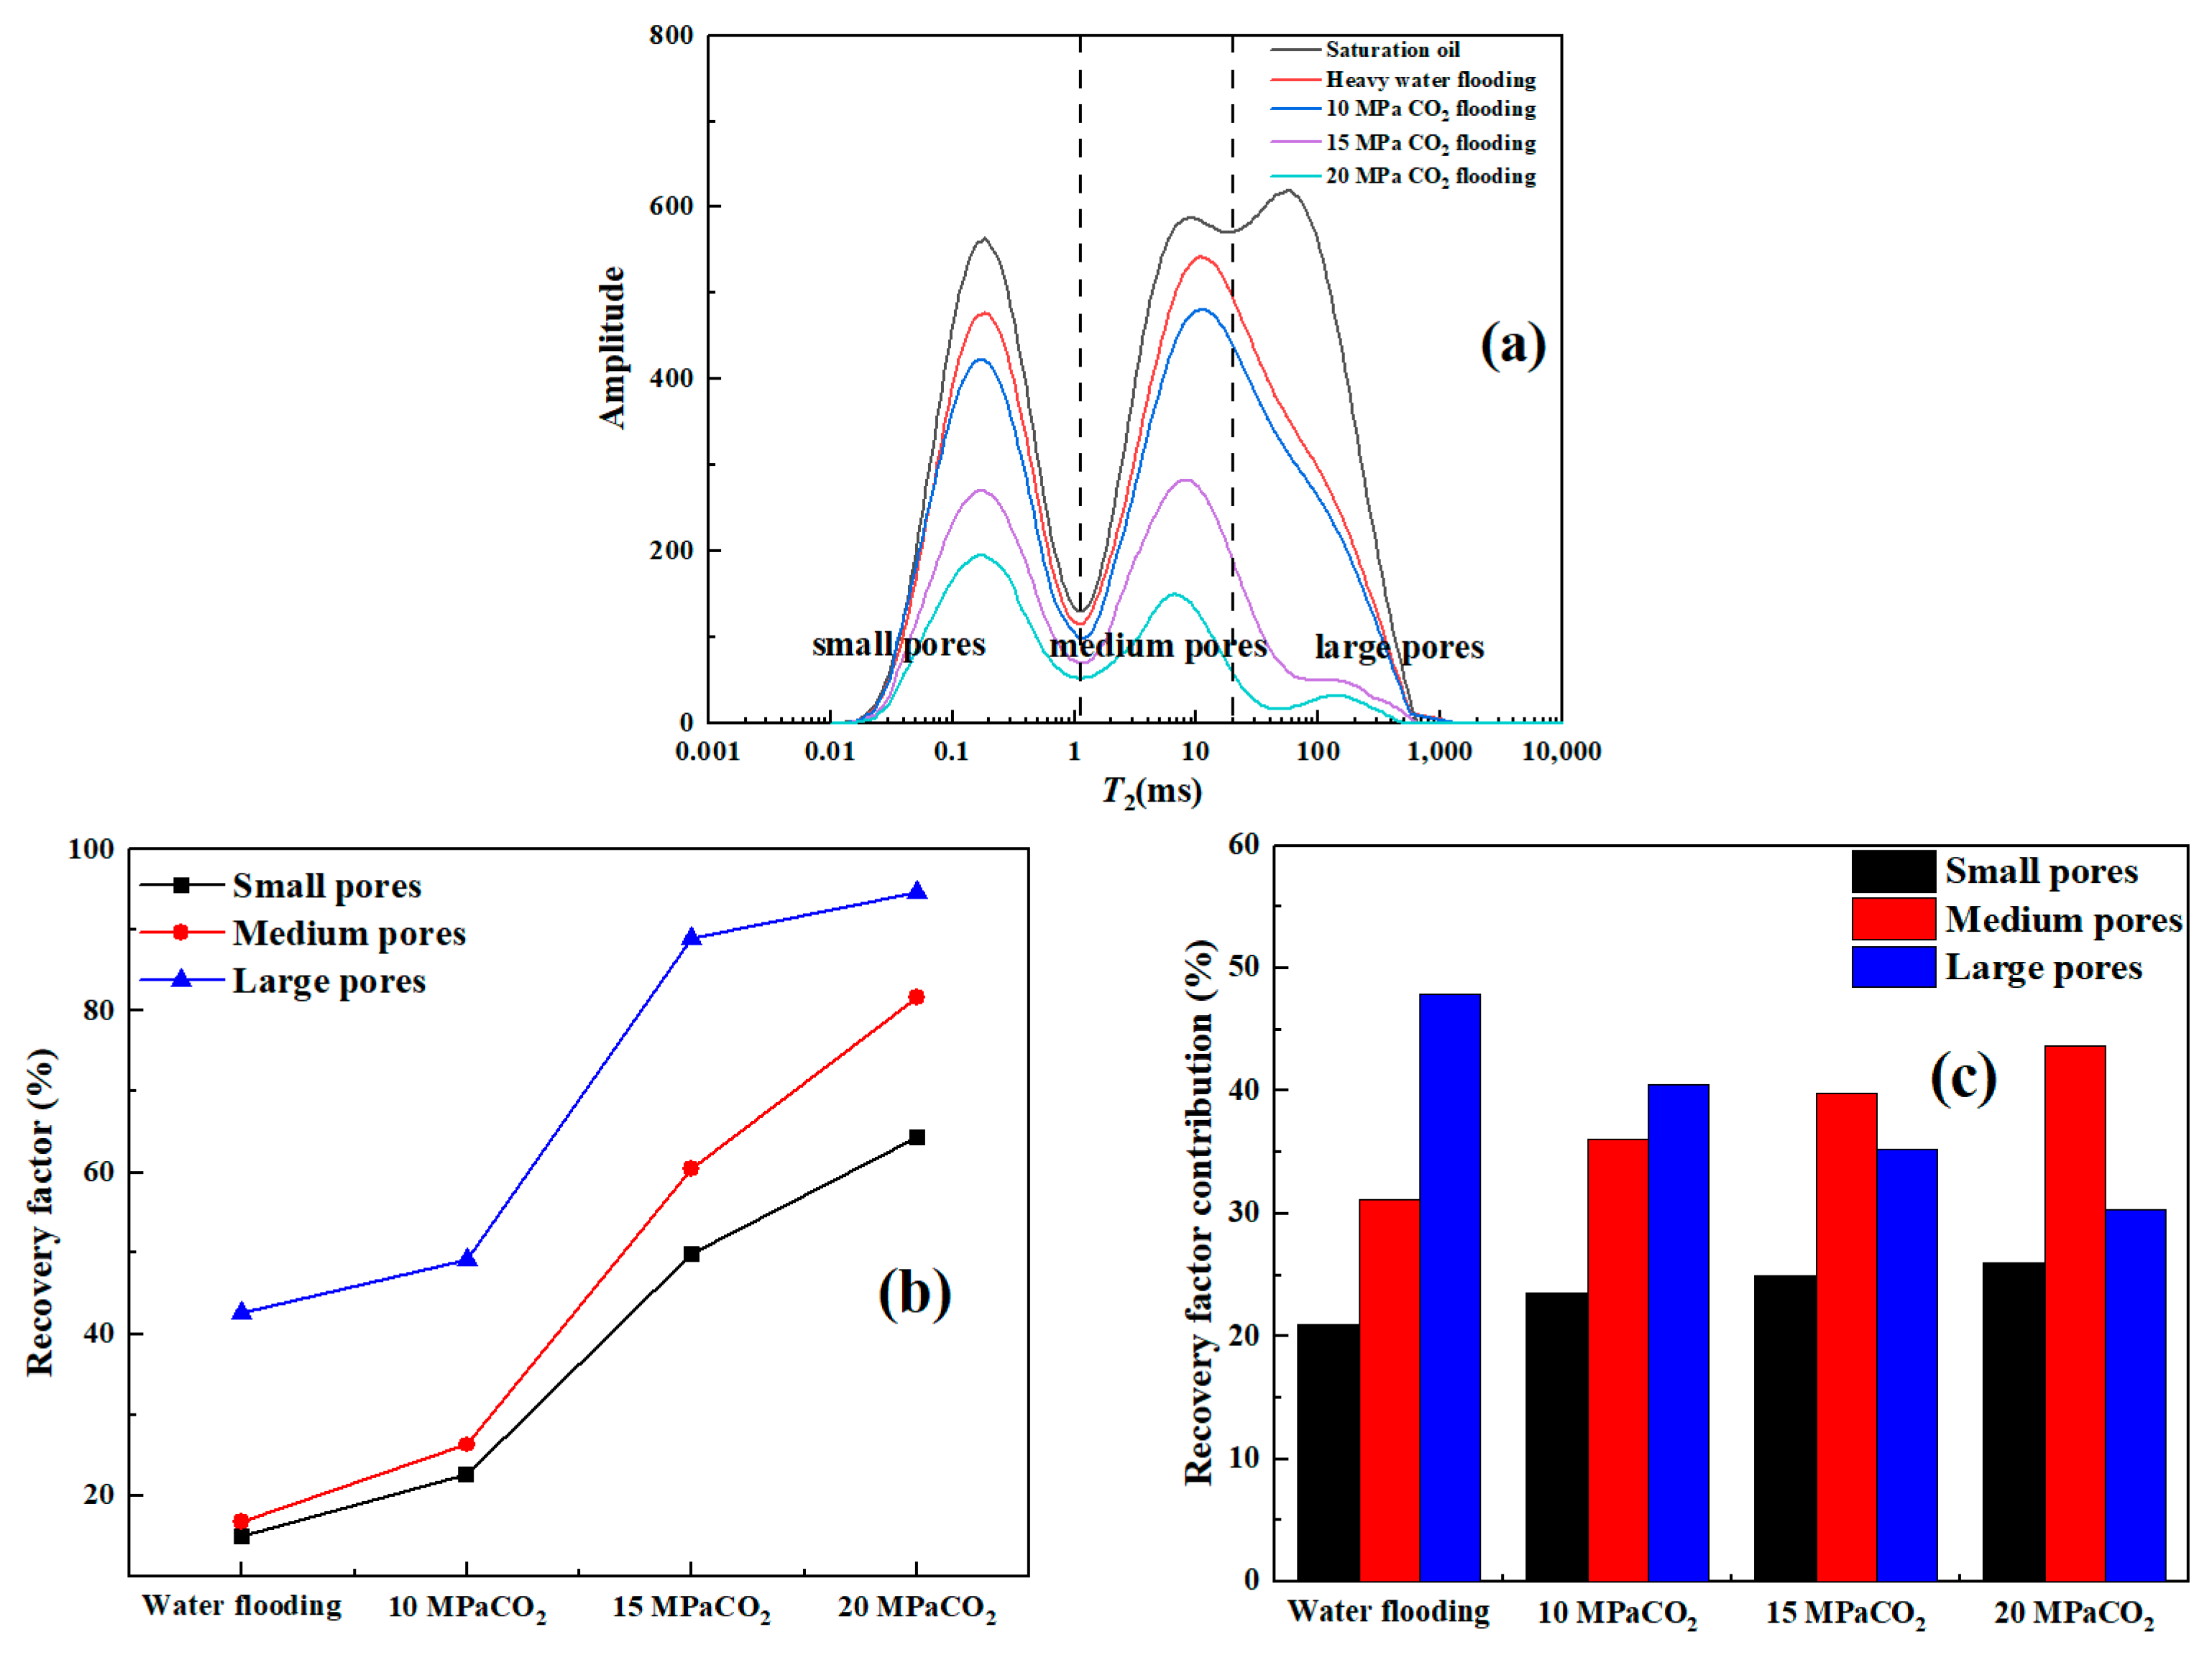
Oil Utilization Characteristics of Type II Samples

Type II core samples exhibit distinct characteristics when compared to type I samples. Despite having worse physical properties, type II samples possess a higher percentage of large pores, as evident from Figure 11a. The NMR T2 spectra of these samples also display a gradual decline with increasing pressure, albeit with slight variations. Notably, during 10 MPa immiscible phase flooding, the NMR T2 spectra for both large and small pores show a more modest decrease, while medium pores experienced a more pronounced decline. This phenomenon can be attributed to the intricate structure of type II pores and the fact that D2O predominantly occupied the main pore seepage channels. Consequently, larger pores tend to have less residual oil, while medium pores retain more residual oil. Furthermore, the connectivity between medium and large pores is better than that of type II samples, and so is the oil utilization degree in medium pores during immiscible phase flooding.
The NMR T2 spectra decrease significantly as the pressure increased toward the near-miscible phase. This is due to the increased solubility of CO2 and its extraction effect, which caused a gradual decrease in the interfacial tension between CO2 and oil. As a result, the oil gradually dissolved in the CO2, leading to a higher CO2 solubility and extraction capacity. This led to greater oil recovery of type II samples in near-miscible phases. As the pressure continued to increase, the solubility of CO2 also increased. The oil became continuously saturated with high concentrations of CO2, causing it to dissolve in the oil. Additionally, light hydrocarbons in the oil were constantly added to the miscible phase interface layer. This resulted in the gradual disappearance of the gas–oil interface, eventually reaching the miscible phase. At this point, CO2 can dissolve most of the oil in the pores and ultimately drive it out. At pressures up to 20 MPa, the oil utilization degree in large, medium, and small pores of type II samples was 94.96%, 81.75%, and 64.31%, respectively. With increasing pressure during CO2 flooding after the D2O flooding process, the contribution ratio of small and medium pores gradually increased, while that of large pores gradually decreased. Once the near-miscible phase was reached, oil mainly came from medium pores.

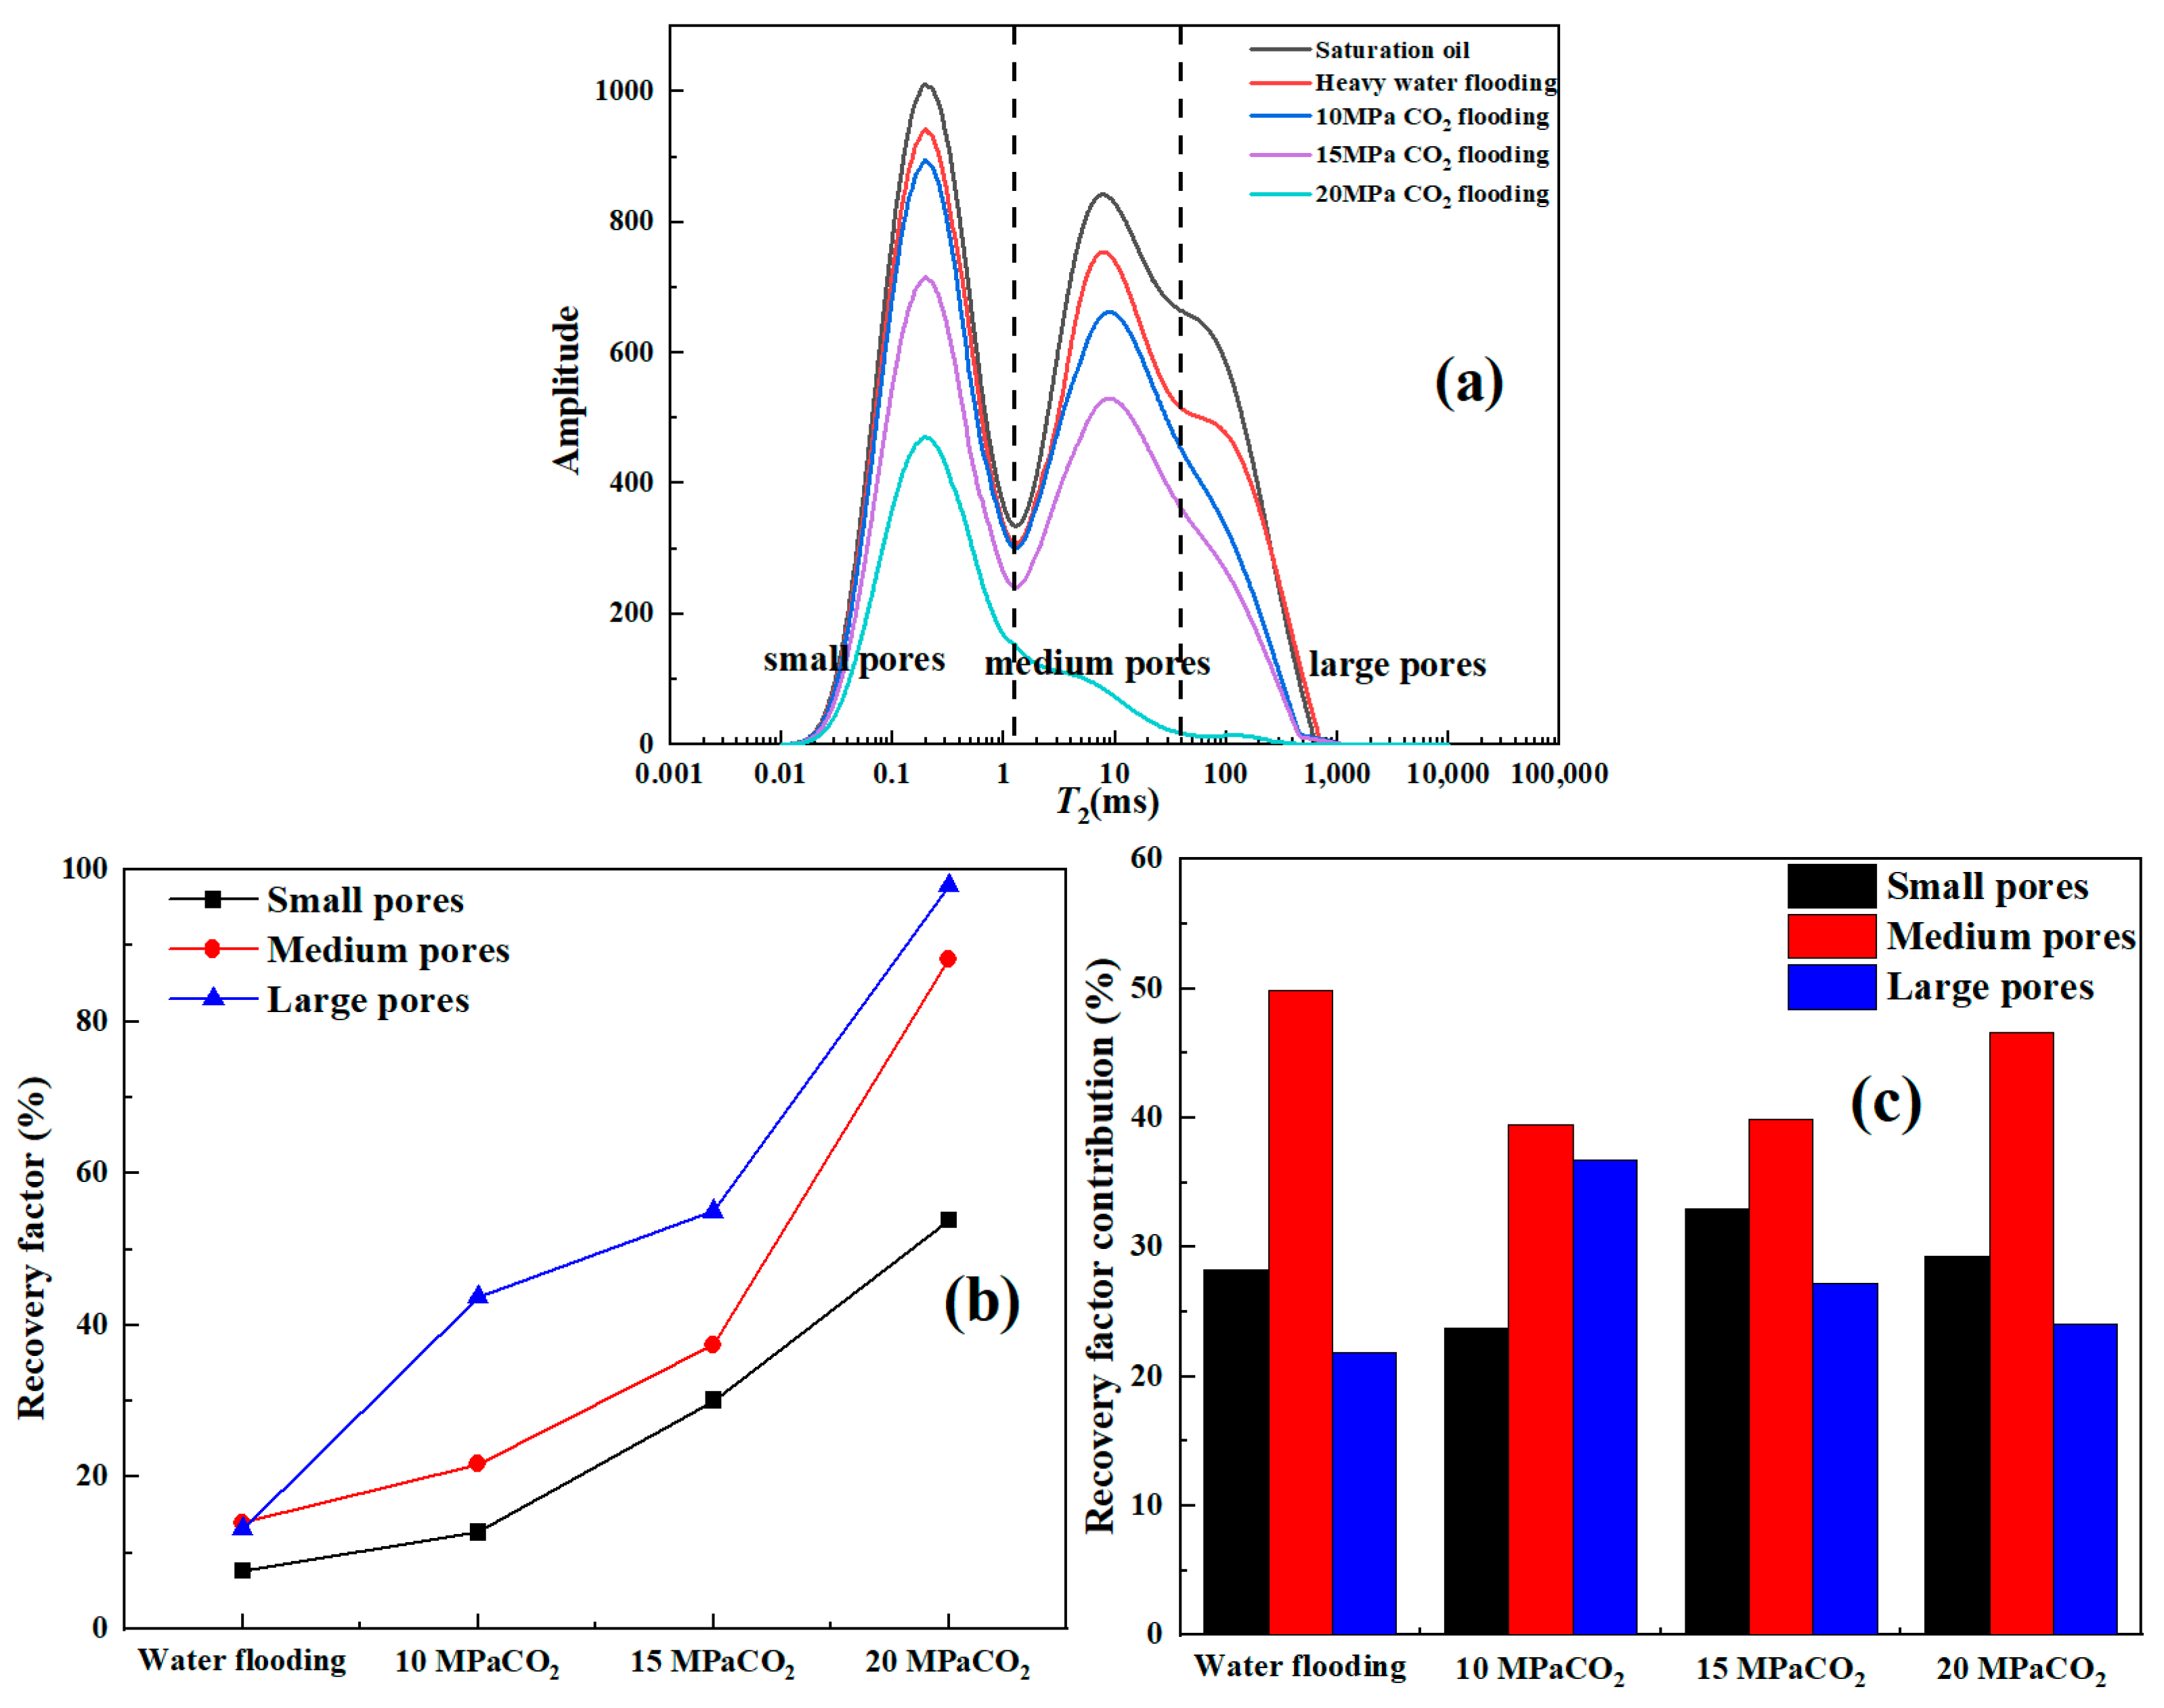
Oil Utilization Characteristics of Type III Samples

Type III samples have poor physical properties, with a high proportion of medium and small pores and a low proportion of large pores. The NMR T2 spectra show a lower decrease in Figure 12a during immiscible and near-miscible phases. As seen in Figure 12b, compared to type I and type II samples, oil recovery in large, medium, and small pores was lower for type III samples. The complex pore structure of type III core samples results in limited CO2 entering large pores before reaching the miscible phase, leading to low utilization of medium and small pores. However, when the pressure reached the 20 MPa miscible phase, the oil utilization degree increased significantly in large and medium pores. The NMR T2 amplitude values of large pores are close to zero, indicating that the oil in these pores has been completely driven out by CO2 extraction and dissolution. Medium and some small pores also benefit from CO2 extraction, accounting for the final oil utilization degree; small pore utilization was 53.86%, medium pore utilization was 88.27%, and large pore utilization was 97.87% at 20 MPa.

4.4. Microscopic Residual Oil Characteristics

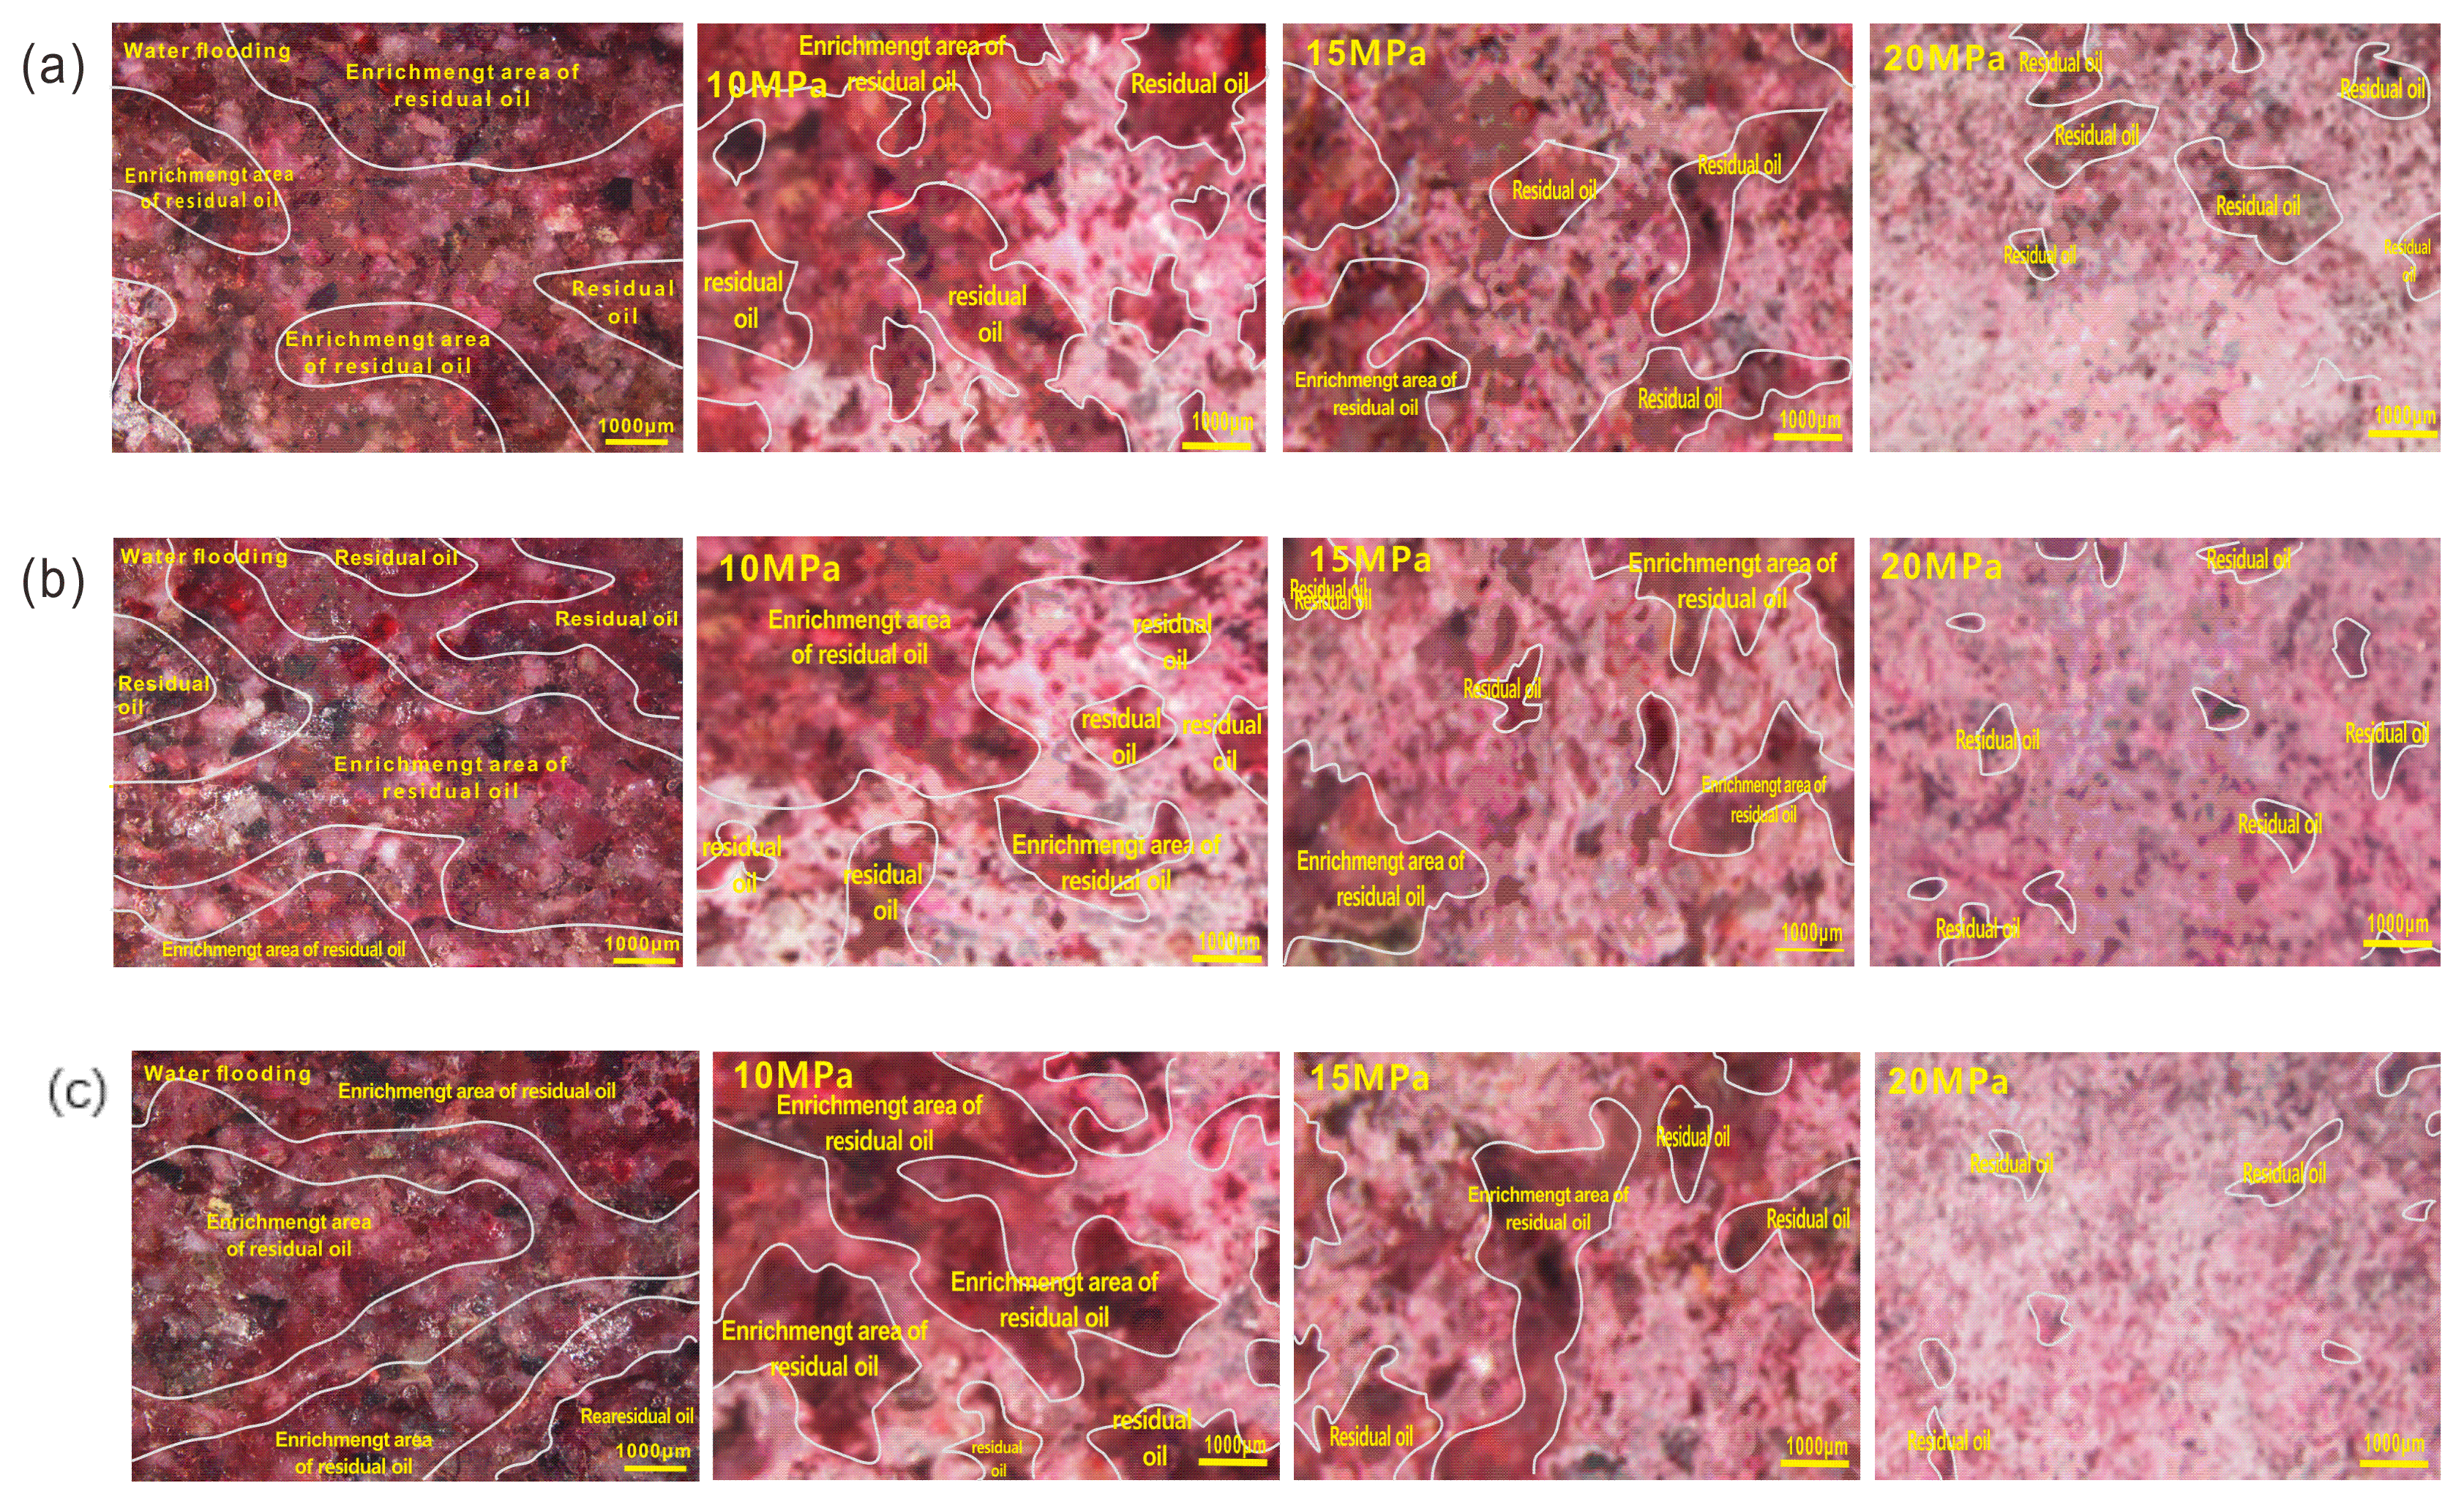
4.4.1. Residual Oil Distribution Regularity

At different stages, the residual oil distribution can be obtained by taking high-definition photographs of the flooding model at different stages using micro-visualization displacement equipment. In this study, we analyzed the core photographs of three types of core visualization models after water flooding and different pressure CO2 flooding to reveal the distribution regularity pattern of residual oil at different stages.
Figure 13a illustrates the residual oil distribution following water flooding and subsequent CO2 immiscible phase flooding at 10 MPa, near-miscible phase flooding at 15 MPa, and miscible phase flooding at 20 MPa. The red area diminishes in size and lightens in color from left to right. This indicates that from immiscible phase flooding at 10 MPa to near-miscible phase flooding at 15 MPa, and finally to miscible phase flooding at 20 MPa, CO2 continuously dissolved and extracted oil, resulting in a progressive reduction in residual oil saturation and a corresponding decrease in oil enrichment areas. In water flooding, due to the more developed pores in the type I model, the water primarily flowed along hypertonic channels, yielding an oil recovery of 18.5% post-water flooding. Following the water flooding, CO2 flooding at 10 MPa led to a significant increase in wave area, with the visible area’s red color gradually transitioning to white and residual oil saturation decreasing. The final oil recovery reached 38.78%. In the 15 MPa near-miscible phase of CO2 flooding, the interfacial tension between CO2 and oil decreased gradually, significantly enhancing CO2’s ability to dissolve oil. This resulted in an increase in the CO2 wave area, a reduction in residual oil saturation, and a nearly 58.47% increase in CO2 flooding oil recovery. When the pressure reached 20 MPa, CO2 and residual oil achieved complete miscibility; in the visible area, the percentage of residual oil area was reduced, residual oil saturation was reduced, and the final oil recovery rate was 68.15%.
As shown in Figure 13b, the photographs depict the type II residual oil, which exhibits lower physical properties compared to type I and has a larger area, as observed from the water flooding visualization images. This indicates that physical properties significantly impact water flooding oil recovery. In comparison to water flooding, at 10 MPa CO2 flooding, the photograph shows a lighter, smaller, red color visible area, and lower residual oil saturation, with the calculated oil recovery rate being 42.52%. At 15 MPa, near-miscible phase CO2 flooding after water flooding exhibited a significantly higher oil recovery rate in the type II model compared to the type I model, with a final oil recovery rate of 68.11%. When the pressure further rose to 20 MPa, the type II model residual oil area was smaller than that of the type I model under miscible phase CO2 flooding after water flooding. The final oil recovery rate was 71.98%.
In Figure 13c, the photographs depict the visualization of CO2 flooding for the type III model water flooding as well as for immiscible, near-miscible, and miscible phase flooding after water flooding. The oil recovery rate of the type III model water flooding was 13.8%, The oil recovery rate of immiscible phase CO2 flooding after water flooding at 10 MPa was 40.72%, the oil recovery rate was 56.84% during 15 MPa near-miscible phase flooding, and the oil recovery rate was 75.47% during 20 MPa miscible phase flooding.
In the type I model, the highest recovery rate was achieved in the core area, which had the best physical properties during water flooding. However, as the physical properties decreased, the oil recovery gradually decreased. For the immiscible 10 MPa CO2 flooding after water flooding, the oil recovery of the models was not much different from each other. When the pressure reached 15 MPa near-miscible phase CO2 flooding after water flooding, the highest rate of type II oil recovery was 68.11%, and when the pressure reached the miscible phase, the highest final oil recovery rate of type III samples was 75.47% during gas flooding after water flooding.

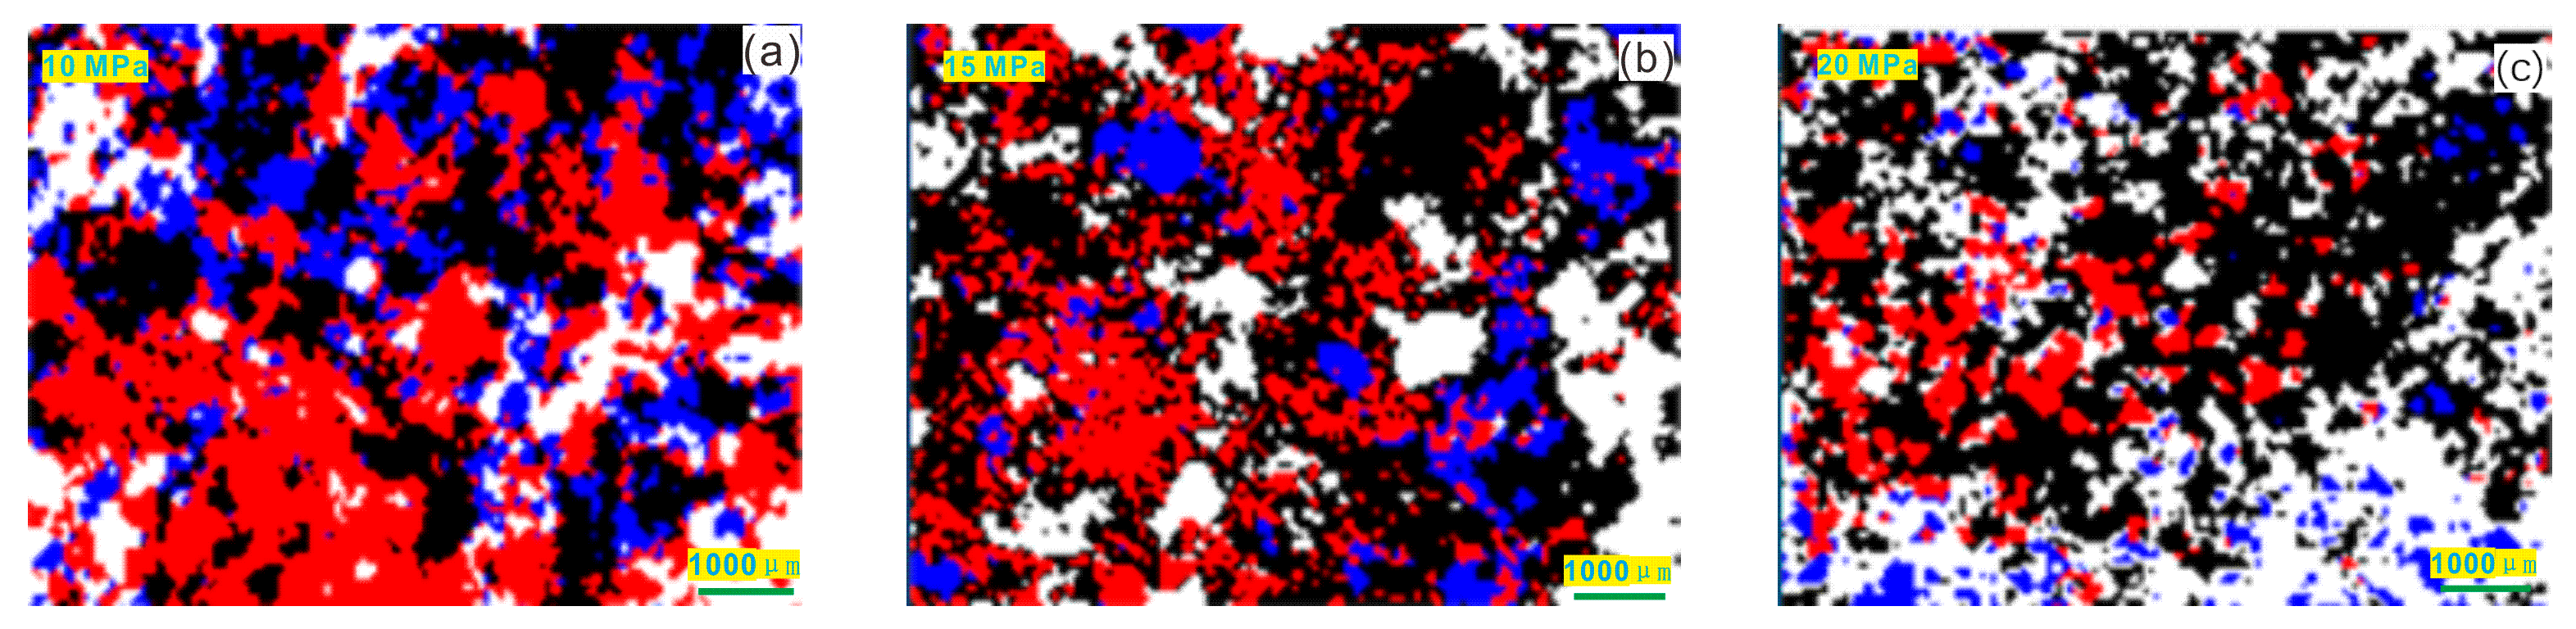
4.4.2. Typology of Microscopic Residual Oils

ENVI software (ENVI Classic 5.3.1. which was developed by Exeles Visual Information Solutions from USA.) was utilized for the conversion of microscopic visualization models post-CO2 flooding into a digital format, encompassing three different phases. The digital representation of the visualization images includes black denoting rock, red signifying residual oil, blue representing water, and white indicating pores after being displaced by CO2. A portion of the oil and water adhere to the rock, hence the digitization process only showcases the oil and water, while the underlying rock remains unhighlighted.
The residual oil in the form of contiguous flakes accounts for a larger proportion, followed by the reticular, and the oil film and oil droplets account for a smaller proportion. In immiscible phase 10 MPa flooding (Figure 14a), CO2 mainly circulates along the hypertonic channels, and the oil in the large pores is well utilized, while most of the small and medium pore are less utilized, leading to a lot of residual oil in the form of contiguous flakes. When the pressure reaches 15 MPa in the near-miscible phase (Figure 14b), as seen in the residual oil graph, the flaky residual oil is significantly reduced; the reason for this is that CO2 can disperse the flake-like residual oil, and the oil with less capillary resistance in the middle of the throat pore is displaced. Close to the rock wall, the oil is more difficult to be driven away due to higher viscous forces. As a result, the residual oil is connected in the form of a membrane, forming a large amount of reticular and filmy residual oil. As the pressure increases to 20 MPa miscible phase (Figure 14c), the CO2 extraction capacity is enhanced. From the pictures, it can be observed that there is less flaky residual oil and an increase in the content of residual oil in the form of reticulation and oil film.
The amount of residual oil can be calculated by analyzing the driving oil recovery rate after CO2 flooding at different pressures, as shown in Figure 15a below. It was observed that the residual oil content in all samples decreased with increasing pressure. The residual oil distribution pattern in different phases was evaluated using Image J software (ImageJ 1.53t, which is developed by Wayne Rasband and contributors National Institutes of Health, Maryland, USA.) by quantitatively assessing the proportion of four different residual oil contents. As shown in Figure 15b–d, with the increase in CO2 flooding pressure, the residual oil content of different types of core samples gradually decreased after water flooding. Different residual oil types have different proportions. But overall, the contiguous residual oil proportion is decreased, while the film residual oil proportion is increased.
The highest proportion of reticulated residual oil was observed for type II samples in the near-miscible phase at 15 MPa, and the oil film-like residual oil had the highest proportion when reaching the 20 MPa miscible phase. Type II core samples were also different in their residual oil shape. Type I samples had the lowest proportion of flaky residual oil. This is because flaky residual oil is mainly found in large pores, whereas type I samples have better physical properties and more developed pores, with more large pores. The residual oil content gradually decreased as the pressure increased, leading to a decreasing flaky residual oil proportion and an increasing proportion of droplet and film residual oil.

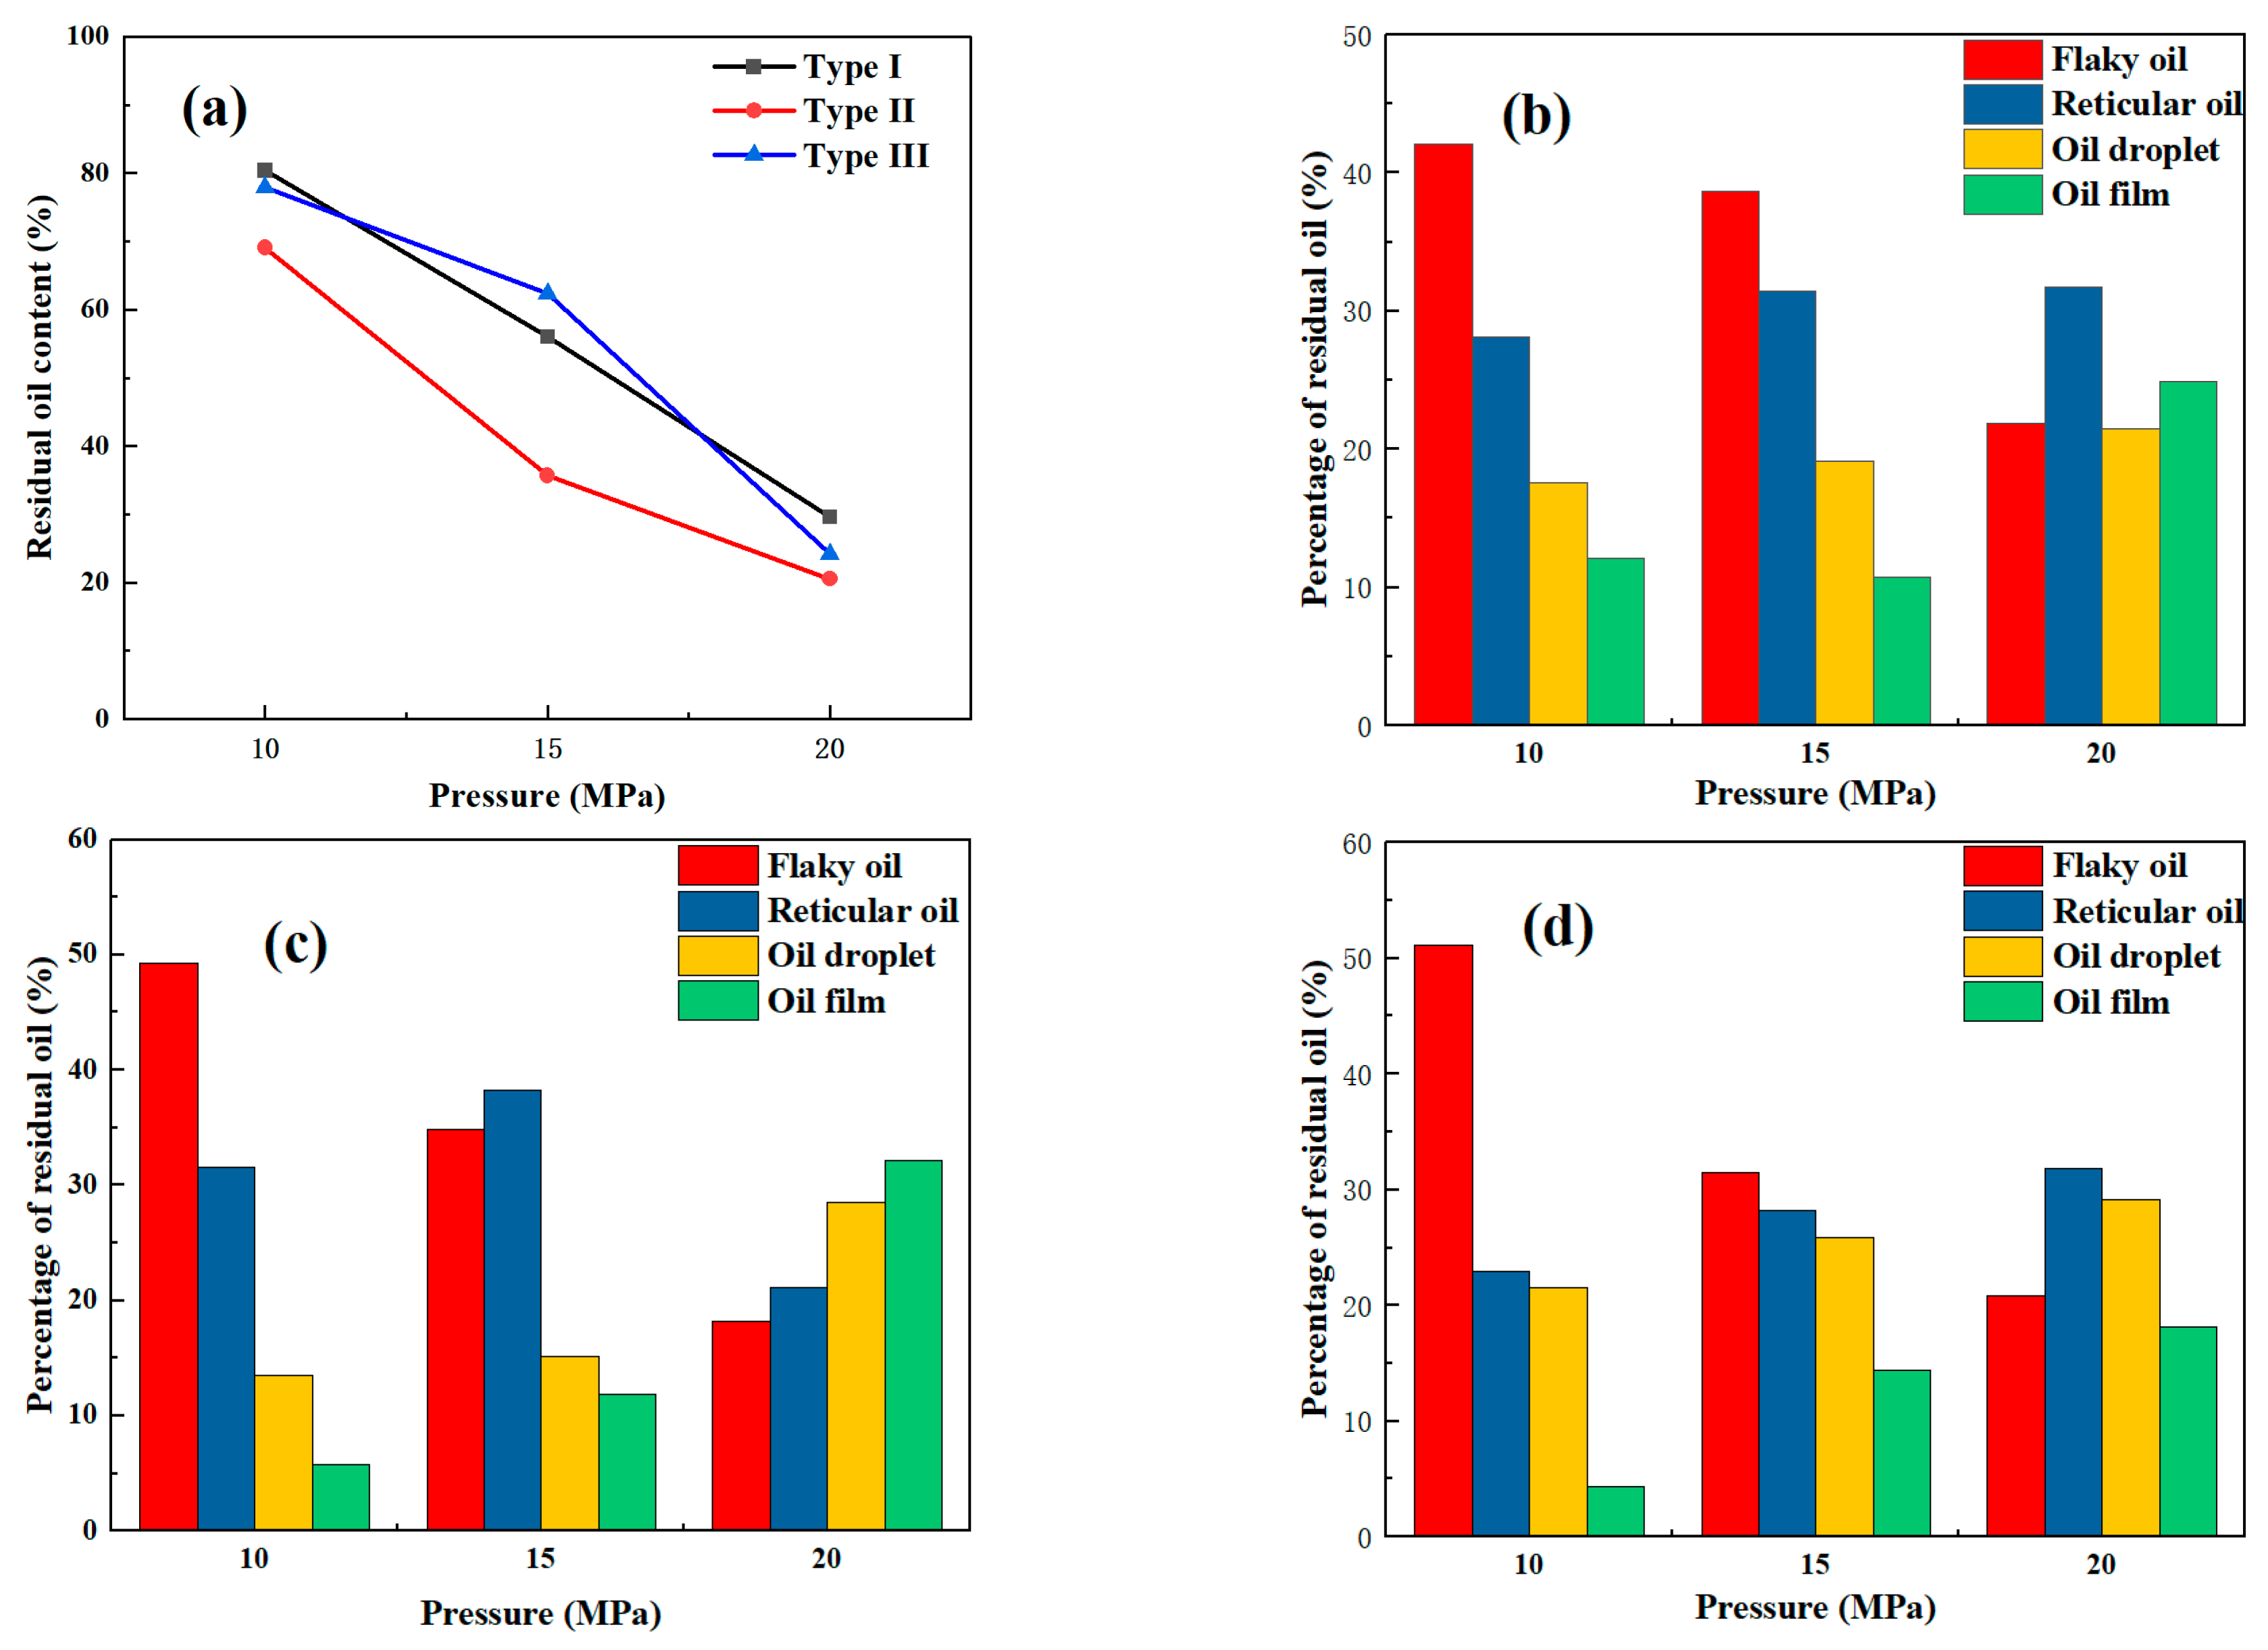
4.4.3. Differential Characterization of Different Types of Samples

Through the comparison of the different oil utilization characteristics of the core samples and the residual oil distribution and residual oil characteristics, it can be observed that type I and type II samples show a significant increase in recovery after the pressure reaches the 15 MPa near-miscible phase. The medium pore proportion is the most influential on oil recovery. In terms of residual oil distribution, type I and type II samples’ residual oil area decreases dramatically, which results in a significant reduction in residual oil saturation and increasing oil recovery. Type I samples have the largest proportion of reticular residual oil after reaching the miscible phase, and type II samples have the largest residual oil proportion in the near-miscible phase. For type III core samples, the oil utilization characteristics show that upon reaching the miscible phase, oil recovery increases significantly, and the proportion of oil in the medium pores and small pores significantly increases in the 20 MPa miscible phase. Based on the residual oil distribution, compared to the near-miscible phase, the type III model’s residual oil area is significantly reduced in the miscible phase. After reaching the miscible phase, the proportion of droplet and reticular residual oil increases significantly. In summary, type I and type II samples are most suitable for near-miscible phase flooding after water flooding, and type III samples are most suitable for miscible phase flooding after water flooding to achieve the maximum economic benefits.

5. Conclusions

Three types of tight sandstone samples with different permeability levels were selected for CO2 displacement experiments under different pressures after water flooding using the low-field NMR method. This study aimed to quantitatively analyze the oil movement characteristics of the core samples. Additionally, microscopic visualization experiments were carried out on three kinds of real core models using a high-temperature and high-pressure visualization displacement system. The objective was to evaluate the distribution of residual oil and the characteristics of its occurrence.
(1)
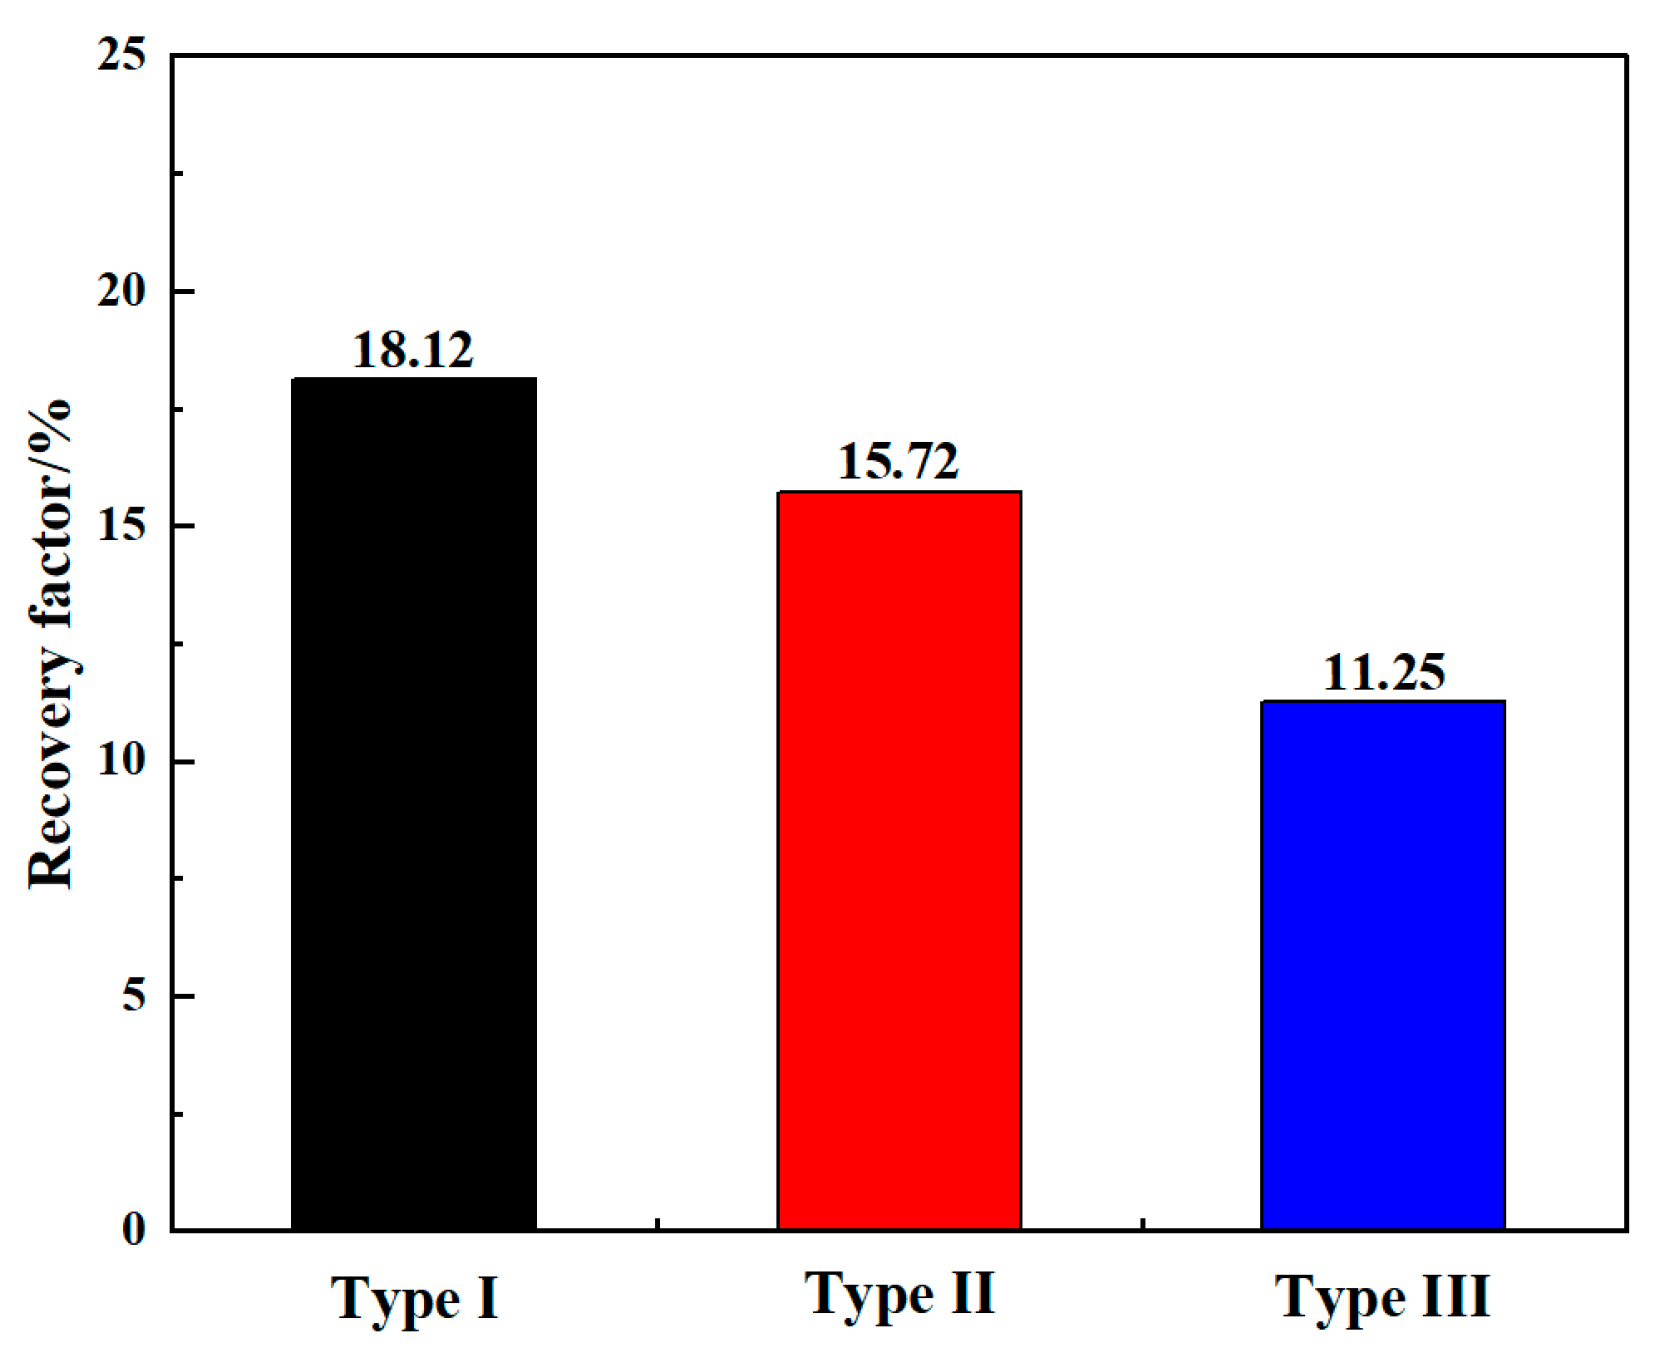
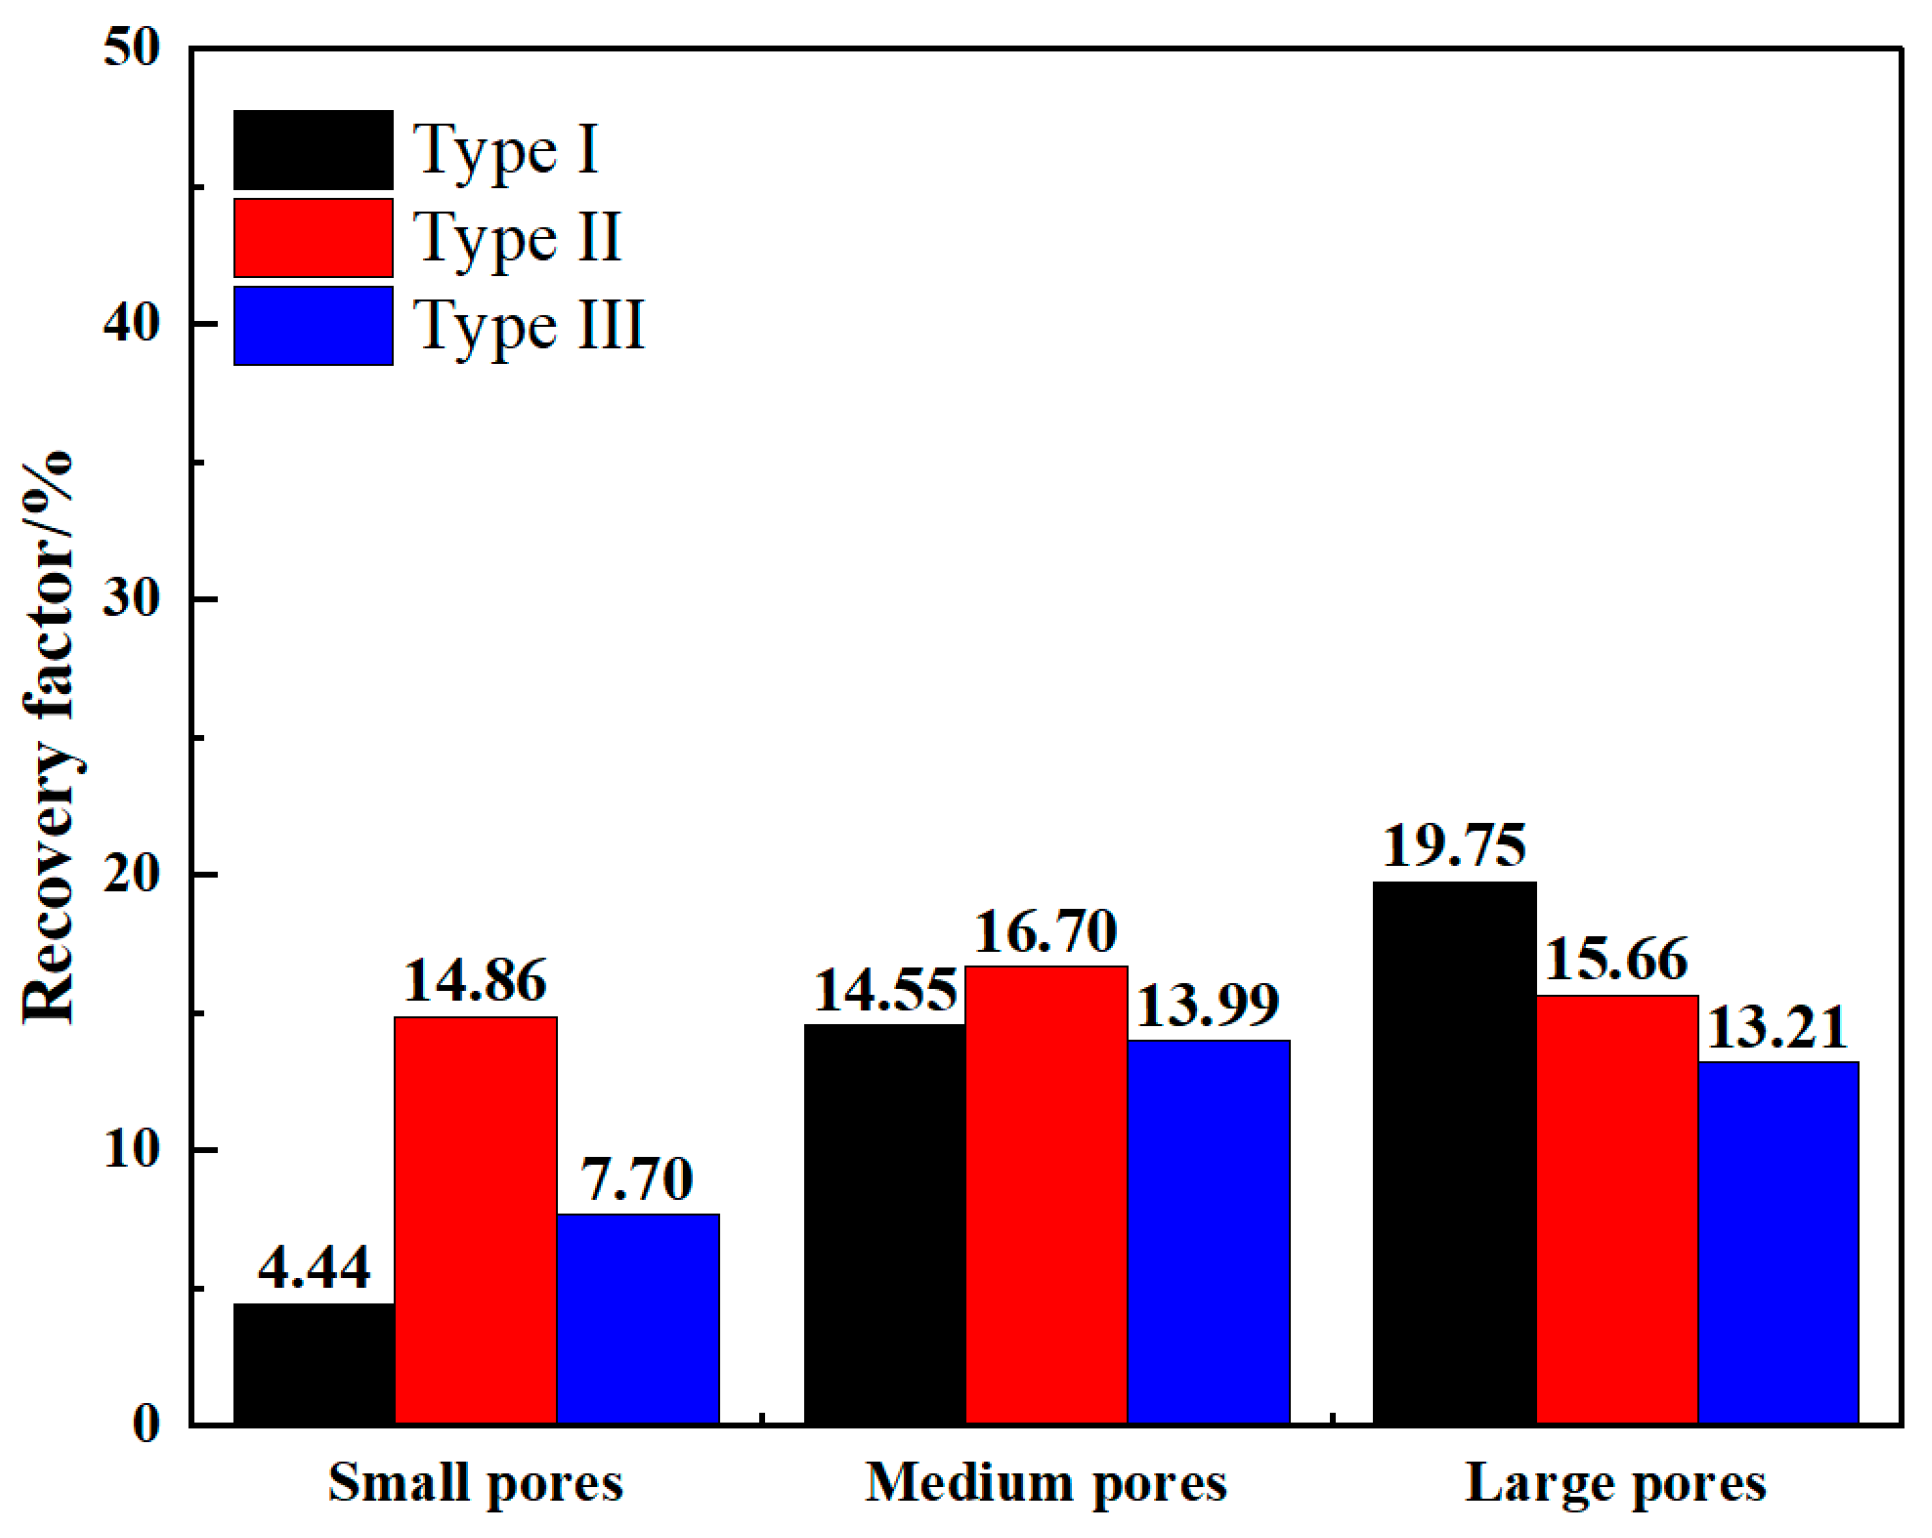
During water flooding, the oil recovery rate of type I, II, and III samples decreased progressively. The oil recovery rate of type I cores was the highest at 18.12%. The amount of produced oil in large pores and some medium pores is considerable, and the contribution from the small pores is relatively small for type I and type III samples.
(2)
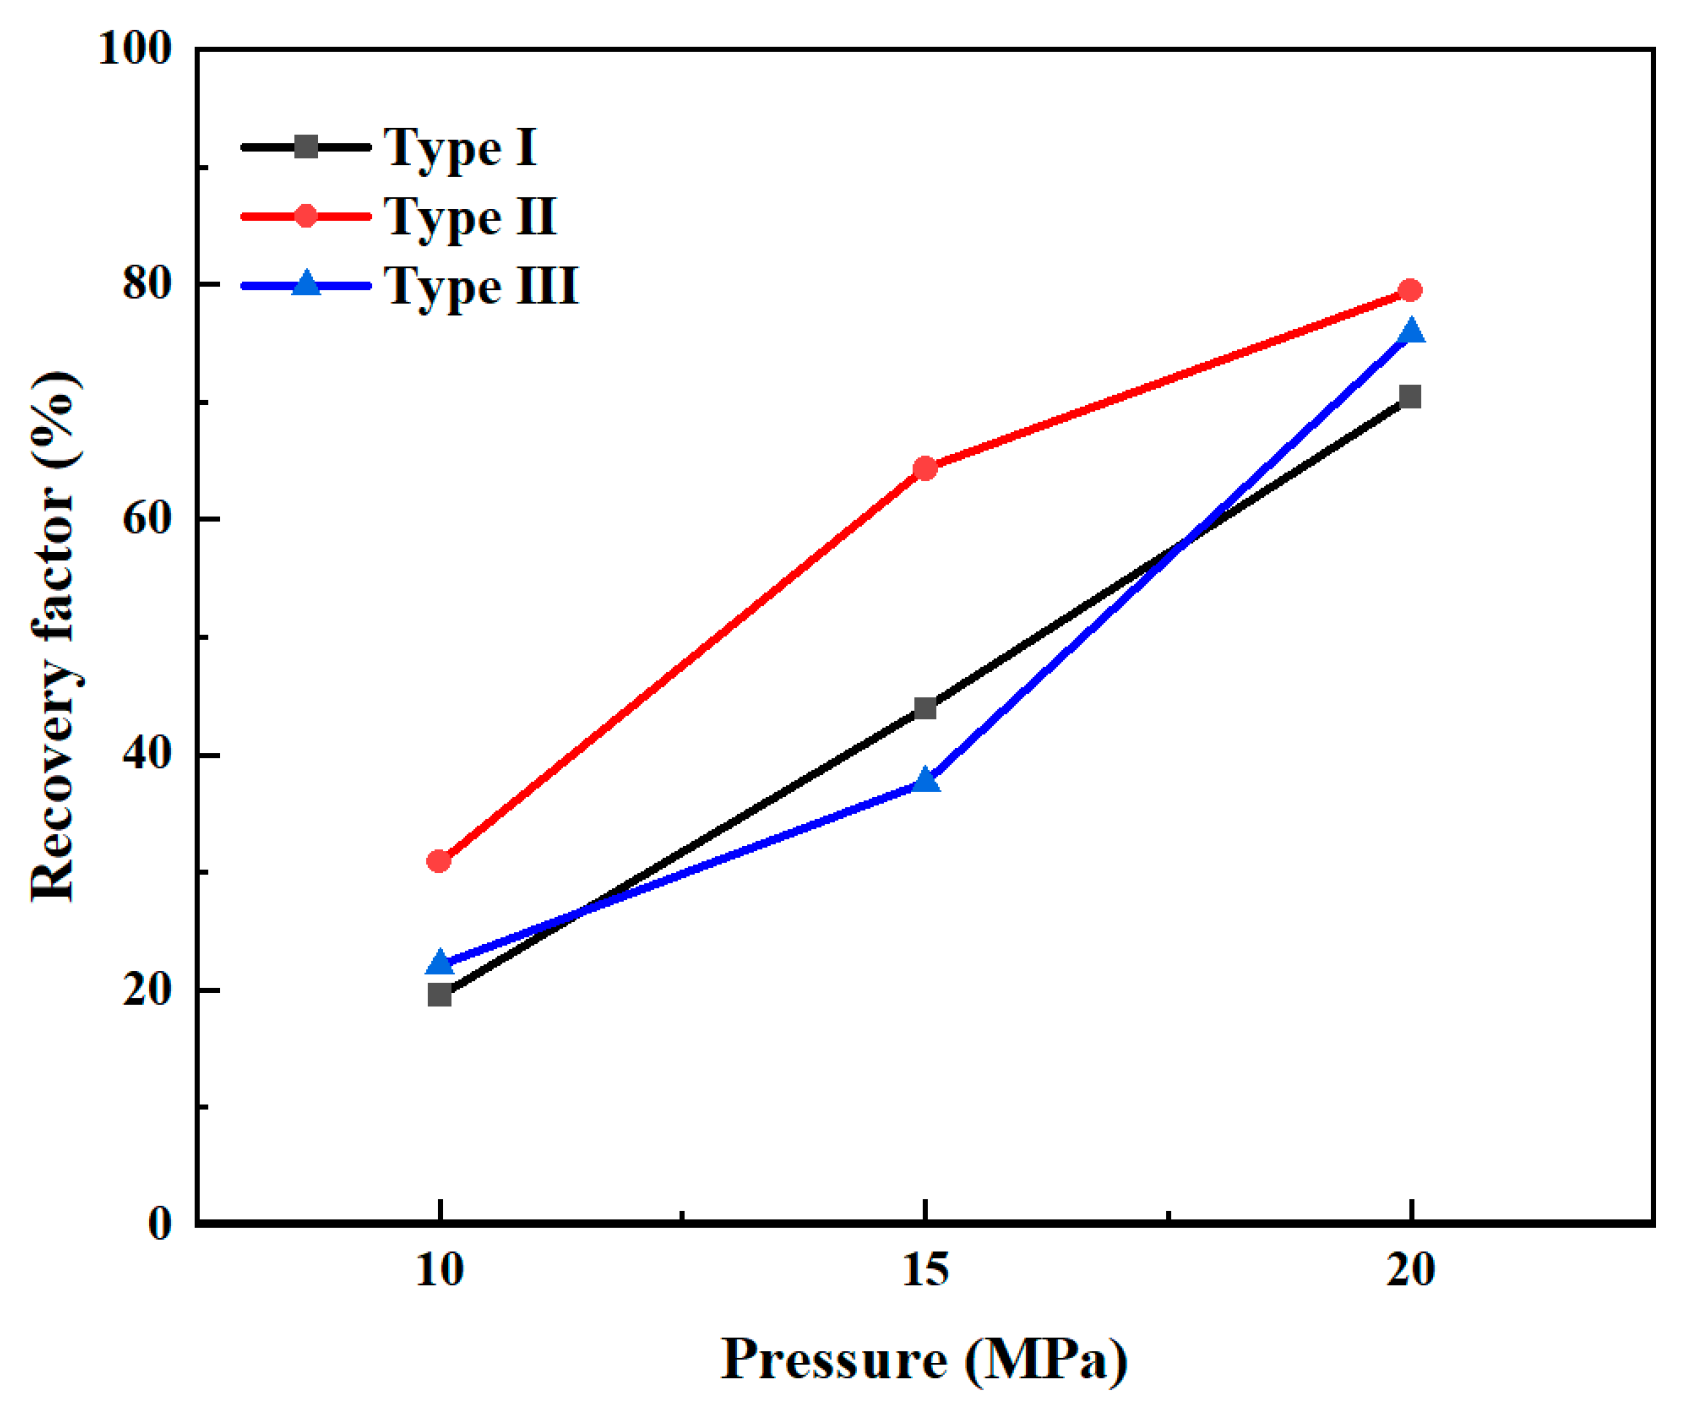
CO2 flooding after water flooding significantly increases oil recovery for all three-sample types. Type II core samples exhibited the highest oil recovery rate, while type I cores had the lowest oil recovery rate in both immiscible and miscible flooding. In near-miscible phases, type III cores had the lowest oil recovery rate. Notably, from immiscible to near-miscible flooding, type II cores demonstrated the most significant improvement in oil recovery. On the other hand, from near-miscible flooding to miscible flooding, type III cores experienced the most substantial oil recovery enhancement.
(3)
As the pressure increased, in the near-miscible phase, the produced oil in type I and II samples primarily came from large pores. Upon reaching the miscible phase, the recovered oil was predominantly from medium pores. In the immiscible phase, the recovered oil for type III samples mainly came from medium and large pores. In the near-miscible phase, the produced oil was mainly from medium and small pores. Near-miscible phase flooding after water flooding is more suitable for type I and II samples, while miscible phase flooding is more suitable for type III samples.
(4)
Examination of the microscopic distribution of residual oil revealed that in immiscible phase flooding after water flooding, oil recovery among the three core types exhibited marginal disparities, with the maximum recovery of 68.11% achieved in the near-miscible phase flooding of the type II model after water flooding. The highest recovery of 74.57% was observed in miscible phase flooding of the type III model after water flooding. The characteristics of residual oil are well established. With escalating pressure, the proportion of flaky residual oil diminished, while that of droplet and oil film formations gradually increased. Reticular residual oils predominated in type II samples in the near-miscible phase.

Author Contributions

Conceptualization, J.X. and H.G.; methodology, C.W.; software, J.X. and T.L.; validation, Z.C., P.L. and N.Z.; formal analysis, Z.M.; investigation, H.S.; resources, H.G.; data curation, X.L.; writing—original draft preparation, J.X.; writing—review and editing, J.X. and Z.C.; visualization, J.X., H.G. and T.L.; supervision, Z.M.; project administration, H.G.; funding acquisition, H.G. All authors have read and agreed to the published version of the manuscript.

Funding

This research was funded by Innovative Research Group Project of the National Natural Science Foundation of China grant number (52174030, 52374041). And Natural Science Basic Research Program of Shaanxi Province grant number [2024JC-YBMS-256]. [Education Department of Shaanxi Province] grant number [23JY067] And the APC was funded by Junjie Xue.

Institutional Review Board Statement

Not applicable.

Informed Consent Statement

Not applicable.

Data Availability Statement

Due to privacy the data presented in this study are available on request.

Acknowledgments

We thank the editors and anonymous reviewers for their helpful comments.

Conflicts of Interest

Zhanguo Ma, Huaqiang Shi, Xiaoling Li are employees of Oil & Gas Technology Research Institute of Changqing Oilfield Company, PetroChina. The company had no roles in the design of the study; in the collection, analysis, or interpretation of data; in the writing of the manuscript, or in the decision to publish the articles. The paper reflects the views of the scientists and not the company.

References

  1. Zou, C.; Zhang, G.; Yang, Z.; Tao, S.; Hou, L.; Zhu, R.; Yuan, X.; Ran, Q.; Li, D.; Wang, Z. Concepts, characteristics, potential and technology of unconventional hydrocarbons: On unconventional petroleum geology. Pet. Explor. Dev. 2013, 40, 413–428. [Google Scholar] [CrossRef]
  2. Sun, L.; Zou, C.; Jia, A.; Wei, Y.; Zhu, R.; Wu, S.; Guo, Z. Development characteristics and orientation of tight oil and gas in China. Pet. Explor. Dev. 2019, 46, 1073–1087. [Google Scholar] [CrossRef]
  3. Kokkinos, N.C.; Nkagbu, D.C.; Marmanis, D.I.; Dermentzis, K.I.; Maliaris, G. Evolution of Unconventional Hydrocarbons: Past, Present, Future and Environmental FootPrint. J. Eng. Sci. Technol. Rev. 2022, 15, 15–24. [Google Scholar] [CrossRef]
  4. Gao, H.; Liu, Y.; Zhang, Z.; Niu, B.; Li, H. Impact of Secondary and Tertiary Floods on Microscopic Residual Oil Distribution in Medium-to-High Permeability Cores with NMR Technique. Energy Fuels 2015, 29, 4721–4729. [Google Scholar] [CrossRef]
  5. Gao, H.; Wang, C.; Cheng, Z.; Li, T.; Dou, L.; Zhao, K.; Xue, J.; Luo, K. Effect of pressure pulse stimulation on imbibition displacement within a tight sandstone reservoir with local variations in porosity. Geoenergy Sci. Eng. 2023, 226, 211811. [Google Scholar] [CrossRef]
  6. Wang, C.; Gao, H.; Qi, Y.; Li, X.; Zhang, R.; Fan, H. Investigation on the Mechanisms of Spontaneous Imbibition at High Pressures for Tight Oil Recovery. ACS Omega 2020, 5, 12727–12734. [Google Scholar] [CrossRef]
  7. Zhang, T.; Tang, M.; Ma, Y.; Zhu, G.; Zhang, Q.; Wu, J.; Xie, Z. Experimental study on CO2/Water flooding mechanism and oil recovery in ultralow—Permeability sandstone with online LF-NMR. Energy 2022, 252, 123948. [Google Scholar] [CrossRef]
  8. Chen, M.; Dai, J.C.; Liu, X.J.; Kuang, Y.T.; Wang, Z.T.; Gou, S.C.; Qin, M.J.; Li, M. Effect of displacement rates on fluid distributions and dynamics during water flooding in tight oil sandstone cores from nuclear magnetic resonance (NMR). J. Pet. Sci. Eng. 2020, 184, 106588. [Google Scholar] [CrossRef]
  9. Zhang, J.; Li, X.Z.; Shen, W.J.; Gao, S.S.; Liu, H.X.; Ye, L.Y.; Fang, F.F. Study of the Effect of Movable Water Saturation on Gas Production in Tight Sandstone Gas Reservoirs. Energies 2020, 13, 4645. [Google Scholar] [CrossRef]
  10. Wang, W.; Li, X.Y.; Wei, Z.K.; Xin, Y.D.; Xiao, R.; Yang, H.X.; Chen, X.L. Effect of CO2-Brine-Rock Interactions on the Pore Structure of the Tight Sandstone during CO2 Flooding: A Case Study of Chang 7 Member of the Triassic Yanchang Formation in the Ordos Basin, China. ACS Omega 2023, 8, 3998–4009. [Google Scholar] [CrossRef]
  11. Chen, W.; Maolei, C.; Kai, W.; Yong, W.; Keyi, W.; Hui, G. Full-Scale Experimental Study on the Effect of CO2 Flooding on Storage-Seepage Capacity of Tight Sandstone Reservoirs. ACS Omega 2023, 8, 11897–11907. [Google Scholar]
  12. Ding, J.C.; Yan, C.H.; Wang, G.Z.; He, Y.M.; Zhao, R.H. Competitive adsorption between CO2 and CH4 in tight sandstone and its influence on CO2-injection enhanced gas recovery (EGR). Int. J. Greenh. Gas Control 2022, 113, 103530. [Google Scholar] [CrossRef]
  13. Lin, R.; Yu, Z.H.; Zhao, J.Z.; Dai, C.L.; Sun, Y.P.; Ren, L.; Xie, M.K. Experimental evaluation of tight sandstones reservoir flow characteristics under CO2-Brine-Rock multiphase interactions: A case study in the Chang 6 layer, Ordos Basin, China. Fuel 2022, 309, 122167. [Google Scholar] [CrossRef]
  14. Li, T.; Gao, H.; Ni, J.; Wang, C.; Cheng, Z.L.; Xue, J.J.; Luo, K.Q. Research on the Differential Oil Producing in the Various Scale Pores under Different CO2 Flooding Modes with a Fluid Distribution Pore Classification Method. Energy Fuels 2023, 37, 3775–3784. [Google Scholar] [CrossRef]
  15. Li, D.; Saraji, S.; Jiao, Z.; Zhang, Y. An experimental study of CO2 injection strategies for enhanced oil recovery and geological sequestration in a fractured tight sandstone reservoir. Geoenergy Sci. Eng. 2023, 230, 212166. [Google Scholar] [CrossRef]
  16. Yue, P.; Liu, F.; Yang, K.; Han, C.; Ren, C.; Zhou, J.; Wang, X.; Fang, Q.; Li, X.; Dou, L. Micro-Displacement and Storage Mechanism of CO2 in Tight Sandstone Reservoirs Based on CT Scanning. Energies 2022, 15, 6201. [Google Scholar] [CrossRef]
  17. Dai, Y.; Lai, F.; Ni, J.; Liang, Y.; Shi, H.; Shi, G. Evaluation of the impact of CO2 geological storage on tight oil reservoir properties. J. Pet. Sci. Eng. 2022, 212, 110307. [Google Scholar] [CrossRef]
  18. Wang, Y.; Shang, Q.; Zhou, L.; Jiao, Z. Utilizing macroscopic areal permeability heterogeneity to enhance the effect of CO2 flooding in tight sandstone reservoirs in the Ordos Basin. J. Pet. Sci. Eng. 2021, 196, 107633. [Google Scholar] [CrossRef]
  19. Peng, H.; Yang, J.; Peng, J.L.; Pu, J.H.; Liu, Q.; Su, J.; Liu, J. Experimental investigation of the mechanism of supercritical CO2 interaction with tight sandstone. Front. Energy Res. 2022, 10, 984144. [Google Scholar] [CrossRef]
  20. Peng, H.; Zhou, L.; Yang, J.; Peng, J.L.; Han, H.F.; Gou, X.H.; Wang, Z.Y. Influence of Supercritical CO2 on the Formation Sensitivity of Tight Sandstone. Front. Energy Res. 2022, 10, 922941. [Google Scholar] [CrossRef]
  21. Xue, J.; Gao, H.; Wen, X.; Wang, M.; Cheng, Z.; Wang, C.; Li, T.; Han, B.; Luo, K.; Zhang, N. Microscopic Production Characteristics of Huff-n-Puff after CO2 Flooding in Tight Oil Sandstone Reservoirs. Energy Fuels 2023, 37, 12994–13010. [Google Scholar] [CrossRef]
  22. Wang, Q.; Wang, L.; Glover, P.W.J.; Lorinczi, P. Effect of a Pore Throat Microstructure on Miscible CO2 Soaking Alternating Gas Flooding of Tight Sandstone Reservoirs. Energy Fuels 2020, 34, 9450–9462. [Google Scholar] [CrossRef]
  23. Wang, Q.; Yang, S.; Glover, P.W.J.; Lorinczi, P.; Qian, K.; Wang, L. Effect of Pore-Throat Microstructures on Formation Damage during Miscible CO2 Flooding of Tight Sandstone Reservoirs. Energy Fuels 2020, 34, 4338–4352. [Google Scholar] [CrossRef]
  24. Liu, X.; Kang, Y.; You, L.; Chen, F.; Yan, L.; Feng, B.; Gai, K. Experimental Evaluation of Spontaneous Imbibitions and Water Injection in Tight Sandstone Oil Reservoirs. Arab. J. Sci. Eng. 2019, 44, 10525–10535. [Google Scholar] [CrossRef]
  25. Hu, J.; Zhao, H.; Du, X.; Zhang, Y. An analytical model for shut-in time optimization after hydraulic fracturing in shale oil reservoirs with imbibition experiments. J. Pet. Sci. Eng. 2022, 210, 110055. [Google Scholar] [CrossRef]
  26. Liu, H.; Luo, Y.; Meng, Y.; Xiao, G.; Zhao, Y.; Zhou, S.; Shao, L. Effects of pore structure on the moveable oil saturation in water-driven tight oil sandstone reservoirs. J. Pet. Sci. Eng. 2021, 207, 109142. [Google Scholar] [CrossRef]
  27. Zhou, S.; Zhou, Y.; Shi, J.; Zhu, Y.; Xiao, W.; Zhang, R. Micropore structure and water driving characteristics of tight sandstone reservoirs in Ordos Basin. J. Pet. Sci. Eng. 2022, 12, 601–612. [Google Scholar] [CrossRef]
  28. Jiang, Z.; Liu, Z.; Zhao, P.; Chen, Z.; Mao, Z. Evaluation of tight waterflooding reservoirs with complex wettability by NMR data: A case study from Chang 6 and 8 members, Ordos Basin, NW China. J. Pet. Sci. Eng. 2022, 213, 110436. [Google Scholar] [CrossRef]
  29. Li, X.; Xue, J.; Wang, Y.; Yang, W.; Lu, J. Experimental study of oil recovery from pore of different sizes in tight sandstone reservoirs during CO2 flooding. J. Pet. Sci. Eng. 2022, 208, 109740. [Google Scholar] [CrossRef]
  30. Wang, H.; Tian, L.; Chai, X.; Wang, J.; Zhang, K. Effect of pore structure on recovery of CO2 miscible flooding efficiency in low permeability reservoirs. J. Pet. Sci. Eng. 2022, 208, 109305. [Google Scholar] [CrossRef]
  31. Gao, H.; Luo, K.Q.; Xie, Y.G.; Qi, Y.; Li, T.; Cheng, Z.L.; Wang, C. Experimental Investigation of the CO2 Flooding Characteristics of Tight Sandstone Reservoirs Using a High-Temperature and-Pressure Visualization Apparatus. Energy Fuels 2022, 36, 12544–12554. [Google Scholar] [CrossRef]
  32. Zang, Y.; Wang, Q.; Wang, H.; Wang, B.; Tian, K.; Wang, T.; Li, J.; Zhang, Z.; Tian, S.; Stanchits, S.; et al. Laboratory visualization of supercritical CO2 fracturing in tight sandstone using digital image correlation method. Geoenergy Sci. Eng. 2023, 225, 211556. [Google Scholar] [CrossRef]
  33. Wang, Y.; Hou, J.; Tang, Y.; Song, Z. Effect of vug filling on oil-displacement efficiency in carbonate fractured-vuggy reservoir by natural bottom-water drive: A conceptual model experiment. J. Pet. Sci. Eng. 2018, 174, 1113–1126. [Google Scholar] [CrossRef]
  34. Al-Obaidi, D.A.; Al-Mudhafar, W.J.; Al-Jawad, M.S. Experimental evaluation of Carbon Dioxide-Assisted Gravity Drainage process (CO2-AGD) to improve oil recovery in reservoirs with strong water drive. Fuel 2022, 324, 124409. [Google Scholar] [CrossRef]
  35. Khurpade, P.D.; Kshirsagar, L.K.; Nandi, S. Characterization of heterogeneous petroleum reservoir of Indian Sub-continent: An integrated approach of hydraulic flow unit—Mercury intrusion capillary pressure—Fractal model. J. Pet. Sci. Eng. 2021, 205, 108788. [Google Scholar] [CrossRef]
  36. Yang, J.; Hou, J. Experimental study on gas channeling characteristics of nitrogen and foam flooding in 2-D visualized fractured-vuggy model. J. Pet. Sci. Eng. 2020, 192, 107334. [Google Scholar] [CrossRef]
  37. Song, Z.; Li, M.; Zhao, C.; Yang, Y.; Hou, J. Gas injection for enhanced oil recovery in two-dimensional geology-based physical model of Tahe fractured-vuggy carbonate reservoirs: Karst fault system. Pet. Sci. 2020, 17, 419–433. [Google Scholar] [CrossRef]
  38. Liang, T.; Hou, R.; Qu, M.; Zhang, W.; Wu, W. 2-D nano-black card indoor evaluation and minefield application in seam-hole carbonate reservoirs. Pet. Sci. Bull. 2020, 5, 402–411. [Google Scholar]
  39. Zhang, T.; Xia, P.; Lu, F. 3D reconstruction of digital cores based on a model using generative adversarial networks and variational auto-encoders. J. Pet. Sci. Eng. 2021, 207, 109151. [Google Scholar] [CrossRef]
  40. Andrés, P.; Luis, R.; Miguel, A.; Nicolás, R. Modelling of 3D viscous fingering: Influence of the mesh on coreflood experiments. Fuel 2020, 287, 119441. [Google Scholar]
  41. Yan, G.; Yan, W.; Yuan, Y.; Gong, X.; Tang, Z.; Xue, B. Research on the Method of Evaluating the Pore Throat Structure of Rock Microscopically Based on the 3D Pore Network Model of Digital Core. Int. J. Pet. Technol. 2022, 9, 44–53. [Google Scholar] [CrossRef]
  42. Huang, X.; Zhang, Y.; He, M.; Li, X.; Yang, W.; Lu, J. Asphaltene precipitation and reservoir damage characteristics of CO2 flooding in different microscopic structure types in tight light oil reservoirs. Fuel 2022, 312, 122943. [Google Scholar] [CrossRef]
Figure 1. Pore–throat types of typical core samples. (a) SEM; intergranular pores, type I; (b) Slice; intergranular pores; (c) SEM; interparticle filling, type II. (d) Slice; intergranular pores and intergranular soluble pores. (e) SEM; intercrystallite pores, type III. (f) Slice; intercrystallite pores.
Atmosphere 15 00487 g001
Figure 2. High-pressure mercury intrusion curves (a) and NMR T2 spectra characteristics of typical core samples (b).
Atmosphere 15 00487 g002
Figure 3. Variation schematic of NMR T2 spectra.
Atmosphere 15 00487 g003
Figure 4. Schematic of equipment.
Atmosphere 15 00487 g004
Figure 5. Saturated oil NMR T2 spectra of typical core samples.
Atmosphere 15 00487 g005
Figure 6. Oil recovery for water flooding.
Atmosphere 15 00487 g006
Figure 7. Oil utilization of different pores for water flooding.
Atmosphere 15 00487 g007
Figure 8. Gas flooding recovery at different pressures in three types of core samples.
Atmosphere 15 00487 g008
Figure 9. Degree of oil utilization of different pores in three types of samples. (a) Small pores; (b) Medium pores and (c) Large pores.
Atmosphere 15 00487 g009
Figure 10. CO2 flooding after D2O flooding of type I samples. (a) NMR T2 spectra; (b) Oil utilization; (c) Contribution rate.
Atmosphere 15 00487 g010
Figure 11. CO2 flooding after D2O flooding of type II samples. (a) NMR T2 spectra; (b) Oil utilization; (c) Contribution rate.
Atmosphere 15 00487 g011
Figure 12. CO2 flooding after D2O flooding of type III samples. (a) NMR T2 spectra; (b) Oil utilization; (c) Contribution rate.
Atmosphere 15 00487 g012
Figure 13. Residual oil distribution after different flooding methods of three types of models. (a) Type I model; (b) Type II model; (c) Type III model.
Atmosphere 15 00487 g013
Figure 14. Distribution of residual oil after flooding in different phases. (a) Immiscible phase; (b) Near-miscible phase; (c) Miscible phase.
Atmosphere 15 00487 g014
Figure 15. Percentage of different residual oil types in three types of core samples. (a) Residual oil content of the three model samples; (b) Type I model; (c) Type II model; (d) Type III model.
Atmosphere 15 00487 g015
Table 1. Classification of the Chang6 reservoir pore samples [42].
Parameter TypeType I
(16 Cores)
Type II
(23 Cores)
Type III
(11 Cores)
RangeAverageRangeAverageRangeAverage
PhysicalPorosity/%9.45–13.5810.968.19–11.619.126.87–10.488.83
Permeability/10−3 μm20.123–0.3810.1380.047–0.1160.0670.025–0.0430.031
Mercury injectionMaximum mercury saturation/%86.24–93.8189.2583.87–89.5885.7167.95–88.1474.62
Median pressure/MPa2.85–8.566.975.65–10.938.9118.52–38.1431.84
Threshold pressure/MPa0.29–0.970.580.87–2.841.82>3.483.94
Pore throat radius/μm0.27–2.481.940.21–1.300.570.06–0.460.24
Sorting factor1.86–2.952.531.45–2.512.211.39–2.381.83
Casting thin sectionPore–throat combinationMedium pore; medium-fine throatSmall pore; medium-fine throatFine pore; microfine throat
Pore typeIntergranular pores; solution poresIntergranular pores; a small amount of corrosion poresCorrosion pores; a small number of intergranular pores
Comprehensive reservoir evaluationGoodMediumDifferent
Table 2. Basic parameters of typical core samples.
Sample TypeCore NumberLength (cm) Diameter (cm) Permeability (mD) Porosity (%)
Type I11–15.752.520.15811.784
Type II10–25.352.530.088610.190
Type III20–86.022.530.03118.474
Table 3. Recovery of three core samples.
Recovery of CO2 Flooding after
D2O Flooding
10 MPa 15 MPa 20 MPa
Current
(%)
Increase
(%)
Current
(%)
Increase
(%)
Current
(%)
Increase
(%)
Type I19.57-43.9524.3770.3926.44
Type II30.91-64.3333.4279.4615.13
Type III22.12-37.6915.5675.8438.16
Disclaimer/Publisher’s Note: The statements, opinions and data contained in all publications are solely those of the individual author(s) and contributor(s) and not of MDPI and/or the editor(s). MDPI and/or the editor(s) disclaim responsibility for any injury to people or property resulting from any ideas, methods, instructions or products referred to in the content.

