Article

Impact of Climate Change on Extreme Rainfall Events and Pluvial Flooding Risk in the Vojvodina Region (North Serbia)

1
Department of Water Management, Faculty of Agriculture, University of Novi Sad, 21000 Novi Sad, Serbia
2
Department of Agricultural Economics, Faculty of Agriculture, University of Novi Sad, 21000 Novi Sad, Serbia
3
Faculty of Agriculture, University of Belgrade, 11000 Belgrade, Serbia
*
Authors to whom correspondence should be addressed.
Atmosphere 2024, 15(4), 488; https://doi.org/10.3390/atmos15040488
Submission received: 24 March 2024 / Revised: 9 April 2024 / Accepted: 13 April 2024 / Published: 15 April 2024
(This article belongs to the Special Issue Climate Change Impacts and Adaptation Strategies in Agriculture)

Abstract

:
Extreme precipitation events, which are common natural hazards, are expected to increase in frequency due to global warming, leading to various types of floods, including pluvial floods. In this study, we investigated the probabilities of maximum 3-day precipitation amount (Rx3day) occurrences during spring in the Vojvodina region, covering both past (1971–2019) and future (2020–2100) periods. We utilized an ensemble of eight downscaled, bias-corrected regional climate models from the EURO-CORDEX project database, selecting the RCP8.5 scenario to examine future Rx3day amounts. The probabilities of occurrences of Rx3day were modeled using the GEV distribution, while the number of events where Rx3day in spring exceeds specific thresholds was modeled using the Poisson distribution. The results indicate that Rx3day with a ten-year return period during the spring months is expected to increase by 19% to 33%. Additionally, the probabilities of having more than one event where Rx3day exceeds thresholds are projected to rise by 105.6% to 200.0% in the future compared to the historical period. The analysis comparing the design values of Rx3day with future projections for the period 2020–2100 revealed that 51 drainage systems are likely to function without difficulties under future climate conditions. However, for the remaining 235 drainage systems, an increased risk of pluvial flooding was identified, as their design precipitation amounts are lower than the future projections. This study reveals that analyzing extreme rainfall events in the context of climate change yields crucial information that facilitates effective planning and policy making in water management, particularly flood protection.

1. Introduction

Global warming is expected to intensify the hydrological cycle, thereby increasing the intensity of extreme precipitation events and the risk of flooding [1]. Many studies have provided stronger evidence of an increase in extreme rainfall intensity at a global scale [2]. The atmospheric temperature significantly influences extreme rainfall intensity, as warmer air holds more water than cooler air, potentially contributing more moisture to rainfall events [2,3]. Additionally, extreme precipitation is expected to intensify due to global warming across many parts of the world. This increase is linked to the greater concentration of atmospheric water vapor, which serves as the source of precipitation. The rise in concentration occurs proportionally to the saturation levels, increasing at a rate of approximately 6–7% per degree of temperature rise. This relationship aligns with the thermodynamic Clausius–Clapeyron relationship [1].
The increasing intensity of extreme rainfall due to climate change is a significant societal concern, as rainfall-induced floods are among the most costly and dangerous natural hazards globally [2,4,5,6]. Understanding changes in extreme weather events is crucial for effective disaster management and mitigation, more so than changes in average patterns. The Intergovernmental Panel on Climate Change [7] reports that areas with rising mean precipitation are likely to experience more severe wet extremes, while areas with decreasing mean precipitation are expected to face more severe dry extremes [8]. Consequently, understanding the changing patterns and impacts of extreme rainfall is crucial for shaping rural and urban planning policies and for the development of effective flood protection infrastructure [2].
Extreme precipitation events are common natural hazards that can lead to landslides and various flood types, including pluvial, fluvial, and flash floods [9]. These occurrences, forecasted to become more frequent due to global warming, are expected to significantly impact the hydrological cycle, agricultural yields, and land use, as well as human life and natural ecosystems [10]. Predicting extreme precipitation events is not only a major scientific challenge but also crucial for societal needs, including civil protection and water management optimization [11].
Waterlogging is a common problem with a harmful impact not only on crop productivity [12] but also on soil quality [13], human health [14], and urban infrastructure [15]. It results from heavy rainfall, floods, and a rise in the phreatic water table. When runoff, infiltration, or evaporation are insufficient, excess water either accumulates on the surface or groundwater seeps up through porous soil, leading to waterlogging [16]. In the Vojvodina region, waterlogging and pluvial flooding primarily occur due to a large amount of precipitation during the non-vegetation period or heavy rainfall in spring.
Extreme precipitation events have been extensively studied both on a global scale [17,18] and on regional scales [19,20,21]. Extreme precipitation events are quantitatively characterized using various indices. Common indices include maximum 1-day (Rx1day) and 5-day (Rx5day) precipitation amounts, simple daily intensity index (SDII), number of heavy (R10) and very heavy precipitation days (R20), consecutive wet days (CWDs), very wet days (R95p), extremely wet days (R99p), and annual total wet-day precipitation (PRCPTOT) [10]. The extreme value theory (EVT) is used for modeling rare events and has proven effective in precisely predicting the return periods of extreme precipitation events [20]. The EVT, essential in water resources engineering and hydrology, comprises two main methods: the traditional block maxima (BM), which selects the highest recorded value annually, and the increasingly preferred peak over threshold (POT) method, offering a larger sample size for more accurate distribution parameter estimation than BM [22,23,24].
The design rainfall is one of the most important parameters for flood control facility design, where accurately approximating hydrological extremes is key to efficient hydraulic infrastructure design. Inaccurate analyses can lead to underestimations, increasing failure risk, or overestimations, raising construction costs [24,25,26,27]. For example, drainage systems in the Vojvodina region are mostly designed based on excess water accumulated from spring rainstorms with a return period of 10 years. Flood control systems and hydraulic infrastructure are often large and costly, with significant expenses also associated with their operation and maintenance. Assessing whether existing hydraulic infrastructure will continue to function satisfactorily in the future, particularly in the context of climate change, is critically important. This information is crucial as it enables the planning of appropriate management and maintenance measures for these systems, the identification of critical points, and the potential reconstruction of the system. In addition to analyzing historical data and trends in hydrological parameters, it is also essential to consider projections of climate changes for future periods.
In this study, we investigated the probabilities of occurrences of maximum 3-day precipitation amounts (Rx3day) during spring (March–May) in the Vojvodina region (northern Serbia) for both the past (1971–2019) and future (2020–2100) periods. The maximum 3-day precipitation amounts during spring were selected for analysis because the drainage systems in the Vojvodina region, which include about 286 systems that drain excess water from 2 million hectares of land, were designed based on these amounts with a 10-year return period. Various physical characteristics of the drainage system’s watershed in the Vojvodina region, including topography, geology, and land use, have determined that the time of concentration for each drainage catchment or sub-catchment in the region is approximately 3 days. It is usually assumed that the critical duration of rainfall, which generates the peak flow and upon which the design, size, and properties of the drainage system depend, is equal to the time of concentration of the catchment. Rx3day was analyzed only for spring, as the excess water in the Vojvodina region typically results from heavy precipitation during this season. Intense precipitation in the summer months rarely causes waterlogging, owing to high rates of evapotranspiration during that period and because soil water reserves are usually low or depleted. Accordingly, threshold levels were determined using the maximum 3-day precipitation amounts in spring with a 10-year return period based on past data (1971–2019). We then analyzed the distribution of the number of events exceeding these thresholds in the past and future. An ensemble of eight downscaled, bias-corrected regional climate models from the EURO-CORDEX project database was utilized, with the RCP8.5 scenario selected to study future 3-day precipitation amounts. The results of this study could be highly valuable for planning and policy making in water management activities, particularly in flood protection. This was demonstrated by assessing the future pluvial flood risk in the Vojvodina region. This study involved comparing the current design properties of existing drainage systems with future requirements and identifying those expected to underperform under projected future climate conditions. As data on the design properties of drainage systems were available only for the Vojvodina region, our study focused specifically on this area. However, the methodology and analysis could be applied anywhere in the world.

2. Materials and Methods
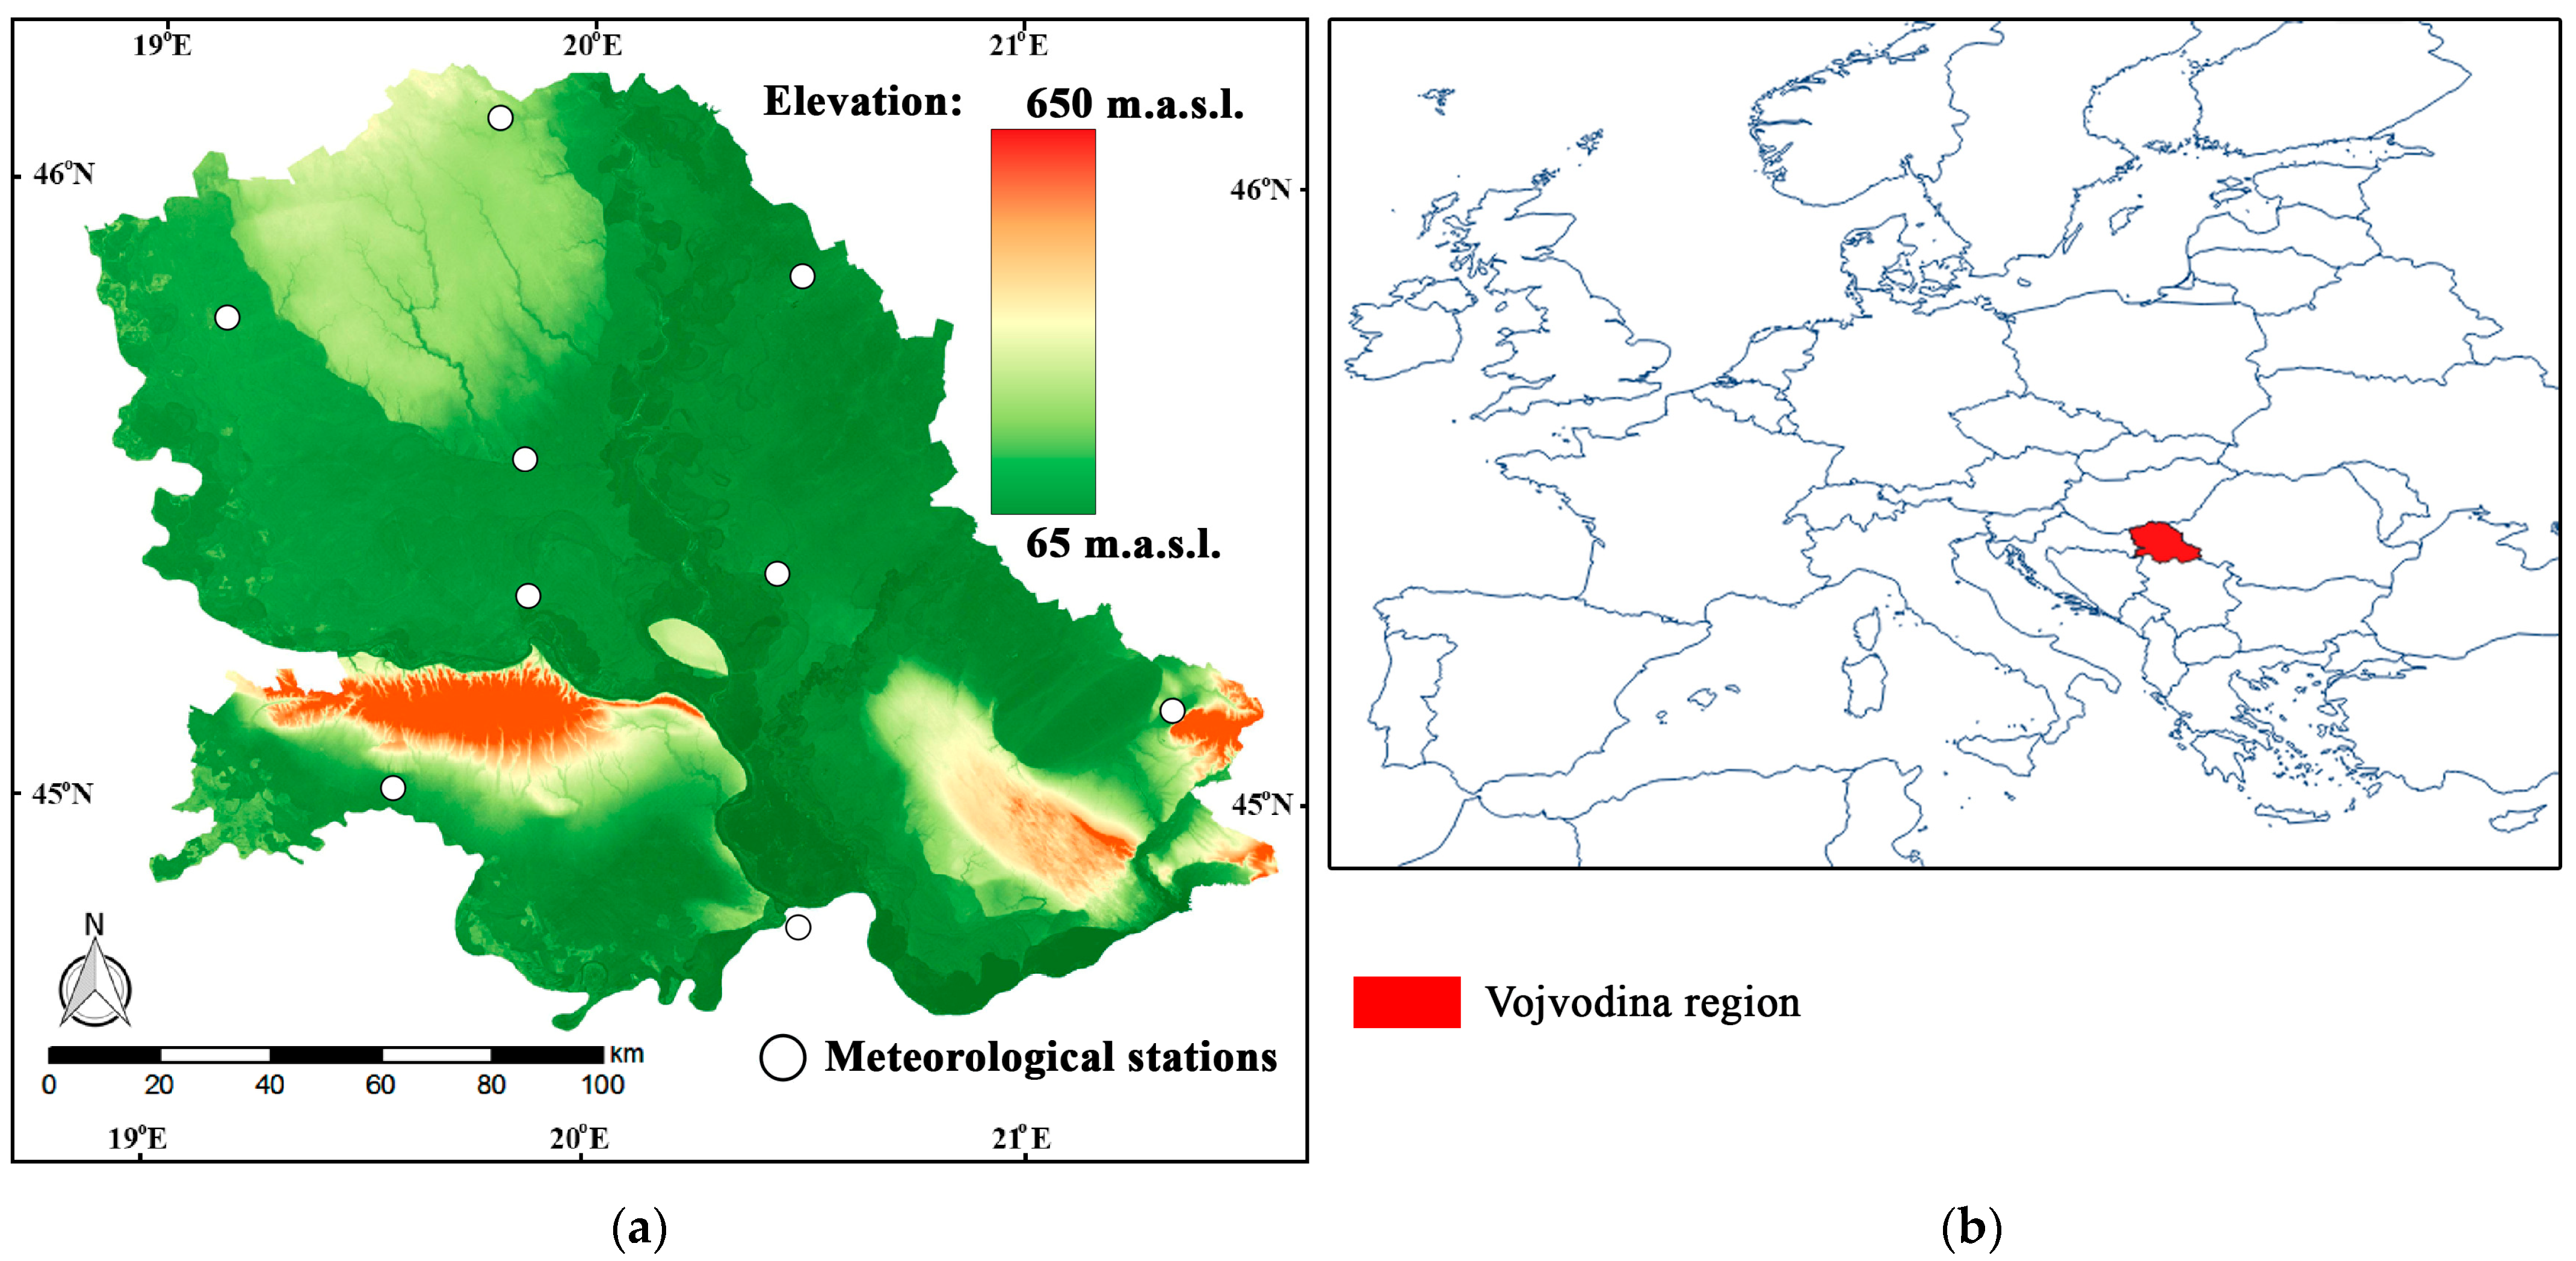
2.1. Study Area

Our study is centered on the Vojvodina region in Serbia (Figure 1), situated in southeast Europe and covering approximately 21,500 km2. The region, located between 44.6° N and 46.2° N latitude and 18.9° E and 21.5° E longitude, experiences a temperate continental climate with cold winters, warm and humid summers, significant seasonal temperature fluctuations, and uneven precipitation distribution [28]. According to the Köppen climate classification, the Vojvodina region’s climatological formula is Cfwbx, indicating a mild temperate/mesothermal climate with significant year-round precipitation, dry winters, and a secondary precipitation peak in autumn [29].
Spatial and temporal precipitation distribution in the region is uneven. Based on data from 9 meteorological stations of the Republic Hydrometeorological Service of Serbia from 1971 to 2016, as noted by Bezdan et al. [30], the average annual precipitation is 615 mm, with 249 mm occurring during the growing season and 366 mm in the non-growing season. The mean annual air temperature is 11.5 °C, rising to 18.3 °C in the growing season and dropping to 4.7 °C in the non-growing season.

2.2. Data

For the analysis of historical extreme rainfall events, specifically maximum 3-day precipitation amounts (Rx3day) during spring months from 1971 to 2019, daily precipitation data were obtained from 9 principal meteorological stations in the Vojvodina region. To analyze future extreme rainfall events from 2020 to 2100, we used an ensemble of 8 regional climate models from the EURO-CORDEX project database, with a spatial resolution of 0.1° (Table 1).
The use of this ensemble of 8 bias-corrected regional climate models was recommended for climate simulations over the territory of Serbia. This recommendation comes from the Digital Climate and Climate Change Atlas of the Republic of Serbia. The atlas was developed as part of the “Advancing medium and long-term adaptation planning in the Republic of Serbia” project funded by the Green Climate Fund, the Ministry of Agriculture, Forestry and Water Management, and the Ministry of Environmental Protection of the Republic of Serbia [31]. The RCP8.5 (Representative Concentration Pathway) scenario from the IPCC’s Fifth Assessment Report (IPCC AR5) was selected, as Serbia has already experienced the temperature changes predicted by this scenario for the next 20 years. Consequently, choosing milder scenarios, such as RCP 6.0, RCP 4.5, or RCP 2.6, would be inadequate [32,33].

2.3. Extreme Value Analysis

The Generalized Extreme Value (GEV) distribution function was chosen to study the probabilities of occurrences of Rx3day, as it is commonly used in similar hydrological analyses [24,34]. The GEV distribution is characterized by three parameters: location (µ), scale (σ), and shape (ξ). According to the shape parameter, the cases where ξ = 0, ξ > 0, and ξ < 0, correspond, respectively, to the Gumbel, Fréchet, and Weibull distributions. The cumulative distribution function of the GEV for a random variable x is as follows:
F x ; μ , σ , ξ = e x p 1 + ξ x μ σ 1 ξ , ξ 0 e x p e x p x μ σ , ξ = 0
The goodness of fit of the GEV distribution was tested using the Anderson–Darling test with a significance level of 0.05. Critical values for the Anderson–Darling test were calculated using Monte Carlo bootstrap simulations with the “nsRFA” R package [35]. The GEV distributions were fitted to empirical data through maximum likelihood estimation using the “fitdistrplus” R package [36]. Maximum likelihood estimation (MLE) is a statistical method used to determine the parameters of a model or probability distribution that best describes a given dataset, and it is one of the most commonly used methods in statistical inference [37,38]. MLE possesses many optimal properties and offers numerous advantages in estimation. As stated by Myung [37], the advantages of MLE include sufficiency (the MLE estimator contains complete information about the parameter of interest), consistency (the true parameter value that generated the data is recovered asymptotically, i.e., for sufficiently large samples), efficiency (the lowest possible variance of parameter estimates is achieved asymptotically), and parameterization invariance (the same MLE solution is obtained regardless of the parametrization used). However, MLE also has several disadvantages that must be considered when applying it, such as limited small sample performance (estimates can be biased in small samples, and for small to medium datasets, there are no rigorous selection criteria [39,40]), outlier sensitivity (MLE is sensitive to outliers, which can disproportionately influence the estimates, leading to skewed results [41]), and model dependence (MLE requires accurate knowledge of the probability distribution that generates the data; if the distribution is misspecified, the estimates can be biased or inconsistent [42]). Nevertheless, various studies [40,43,44] have shown that the L-moment and LH-moment methods for parameter estimation of distributions, such as the GEV, are less influenced by sample variability and the presence of outliers compared to other parameter estimation methods, namely the Method of Moments (MOM) or MLE, particularly for small- and medium-sized datasets.
The Poisson distribution is the most commonly used model for analyzing the distribution of the number of peaks that exceed a specific threshold level [45,46]. Therefore, for modeling the number of events (Rx3day in spring) exceeding thresholds, we employed the Poisson distribution. Threshold levels were established based on Rx3day in spring with a 10-year return period derived from past data (1971–2019). Subsequently, we analyzed the distribution of Rx3day in spring that exceeded these thresholds in both the past and the future.
According to the Poisson distribution, the probability of k exceedances occurring within the time period [0, t] is as follows:
P E k t = λ 1 t k k ! e λ 1 t
where
-
E k t represents the event where exactly k events (Rx3day in spring exceeding thresholds) occur within the time interval [0, t];
-
k = 0, 1, 2, …;
-
[0, t] = [1 March–31 May] = 92 days;
-
λ 1 t represents the average number of events where Rx3day in spring exceeds thresholds within the time interval [0, t].

3. Results and Discussion

The analysis of Rx3day can provide crucial insights for the development of strategies and policies in the field of water management. This study illustrates this through the evaluation of future pluvial flood risks in the Vojvodina region.
As previously mentioned, about 286 drainage systems manage the excess water in the Vojvodina region. These systems are designed based on specific rainfall and excess water criteria, including Rx3day during spring with a 10-year return period. The selection of Rx3day events is due to the fact that the time of concentration—the time needed for runoff to travel from the hydraulically furthest point in a catchment to the outlet—is approximately 3 days for each drainage catchment or sub-catchment in the region, owing to their characteristics.
Analyses of past (1971–2019) and future (2020–2100) occurrences of Rx3day in spring were conducted at nine principal meteorological stations in the Vojvodina region. This study focused on the following characteristics of the stochastic process of these occurrences: the probabilities of occurrence and the number of events exceeding specified thresholds.

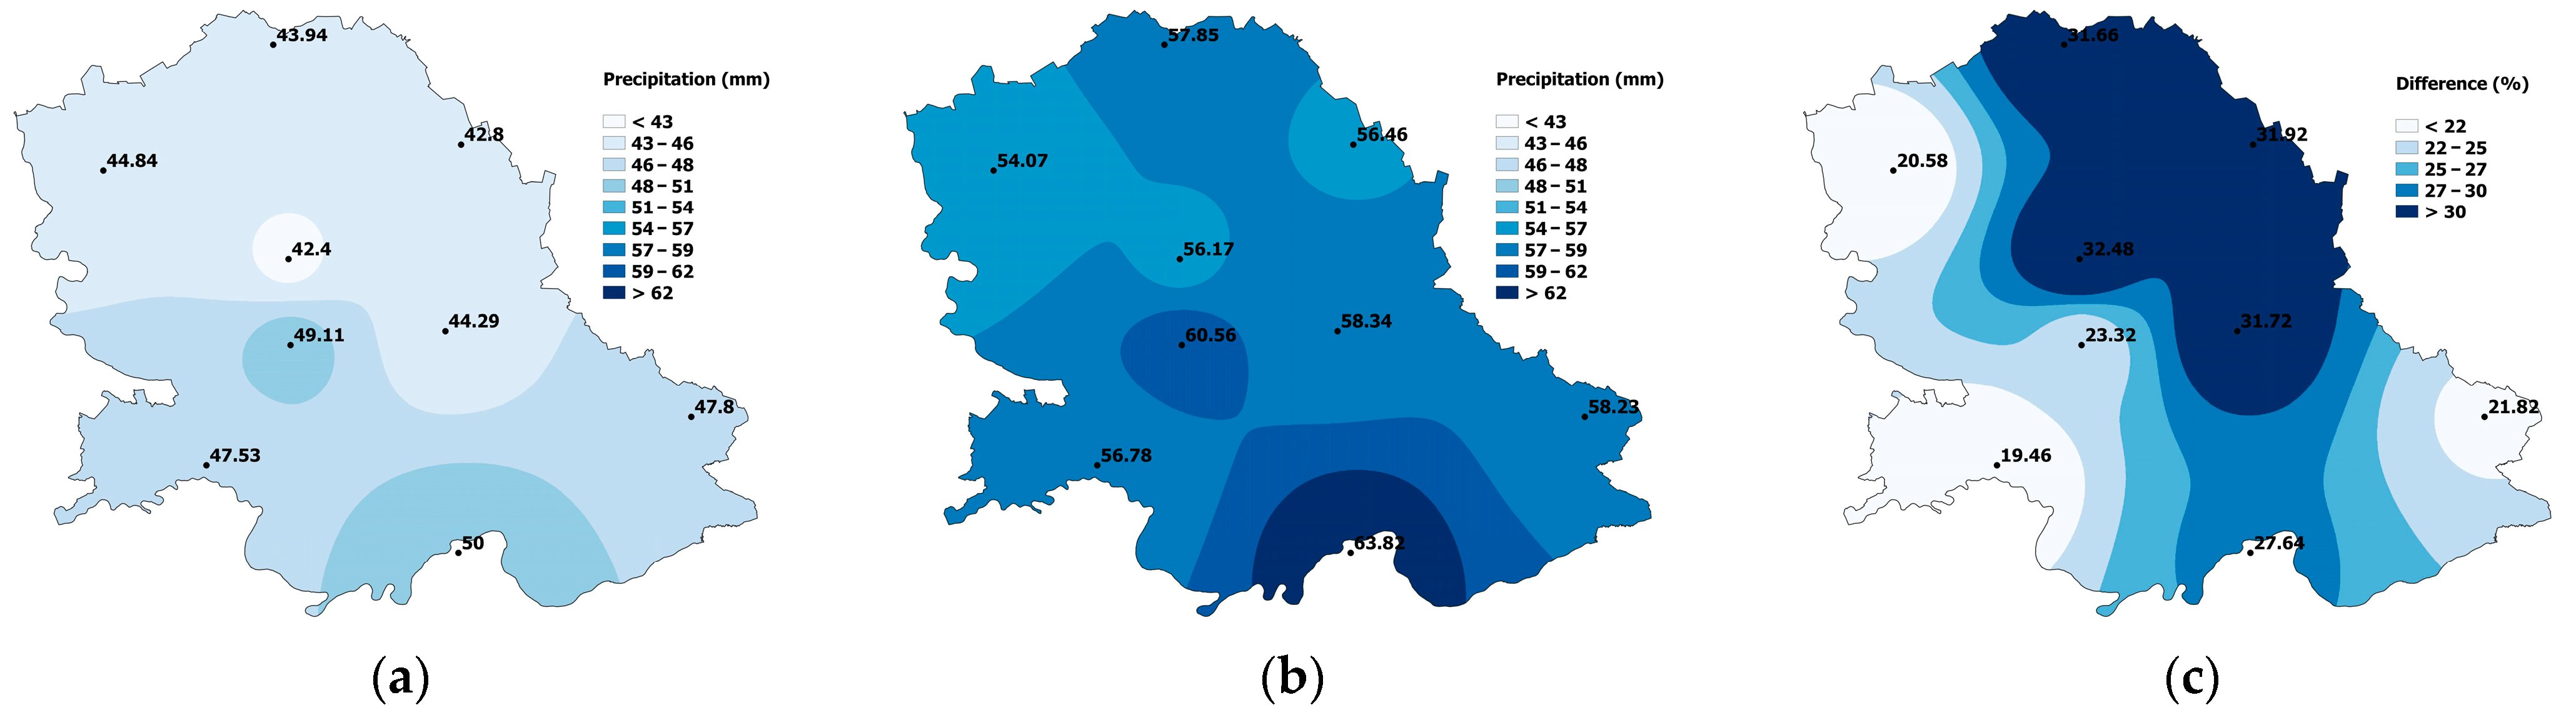
3.1. The Probabilities of Occurrences of Maximum 3-Day Precipitation Amounts

The time series of Rx3day was modeled using the GEV distribution. The results of the goodness of fit test indicate a suitable fit between the GEV distribution and the empirical data for Rx3day in spring. This distribution was used to calculate Rx3day with a 10-year return period. These calculations were performed for all analyzed meteorological stations, considering both past and future periods. For the future period, probabilities of occurrences were determined as median values. These values were derived from the precipitation data obtained from all eight regional climate models and based on the RCP8.5 scenario.
For the past period, our results show that Rx3day with a ten-year return period during spring months varied from 42.4 mm to 50.0 mm (Figure 2a). Furthermore, the results suggest that these amounts are expected to significantly increase in the future period, ranging from 54.1 mm to 63.8 mm (Figure 2b). This increase represents a rise of 19% to 33%, depending on the location (Figure 2c). The most substantial increase in Rx3day is expected in the northeastern part of the region. This increase in maximum 3-day precipitation amounts is expected, as numerous studies suggest a significant intensification of precipitation extremes in Europe under future climate projections [47,48]. In similar studies of future extreme events in the European climate, results indicate that while the frequency of heavy winter precipitation is expected to increase in Central Europe, the frequency of heavy summer precipitation will decrease over most of Europe [49,50].

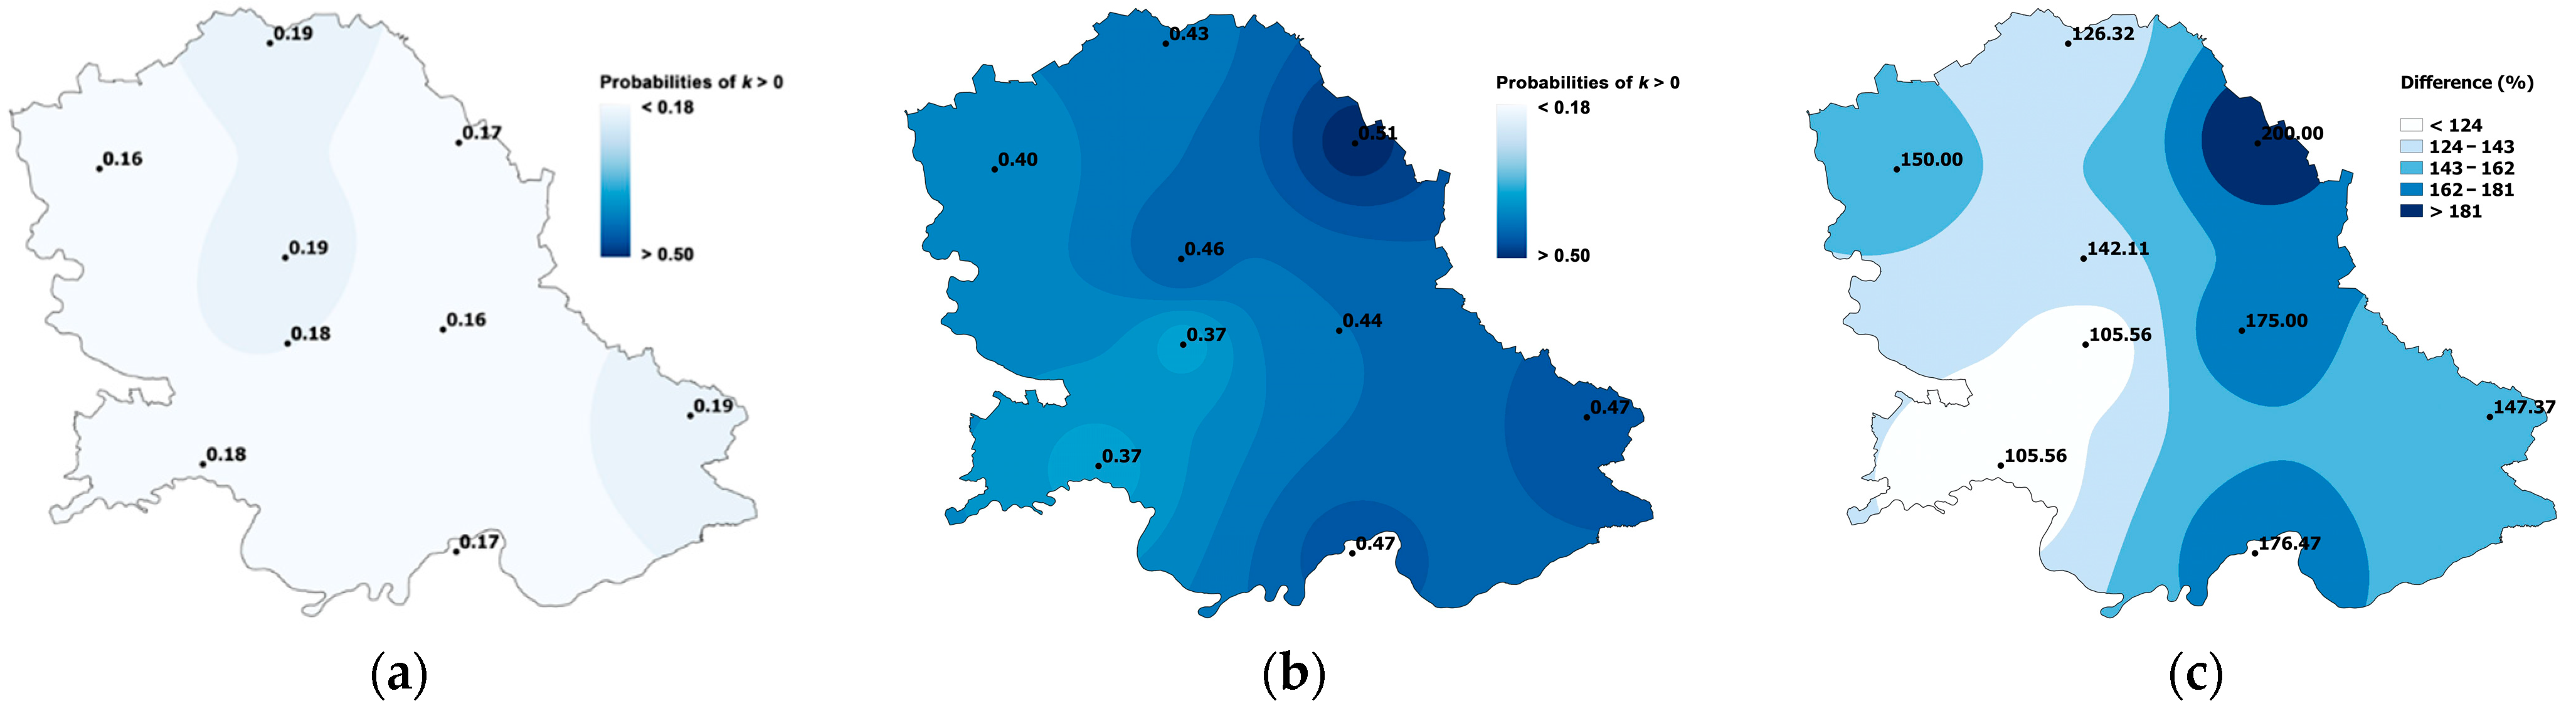
3.2. The Number of Events Exceeding Specified Thresholds

The number of events when Rx3day in spring exceeds specific thresholds (k) in both the past and future are modeled using the Poisson distribution. Previously calculated values of Rx3day with a 10-year return period from past data (1971–2019) were used as threshold levels.
To determine whether the events k are independent and identically distributed random variables, run tests [51,52] were conducted. These tests were performed at a 5% significance level for all nine meteorological stations using both past data and data from the selected ensemble of eight regional climate models. The run tests supported the hypothesis of randomness. In addition, serial correlation coefficients for these event series were calculated. Significance testing at the 5% probability level confirmed the independence of the events. The data showed no significant serial correlation. The Pearson χ2 and Kolmogorov–Smirnov tests were used to assess the agreement between theoretical and empirical distribution functions. The values obtained from these goodness of fit tests exceeded the critical values for the 5% significance level, indicating good agreement.
Results indicate that during the past period (1971–2019), the probabilities of having more than one event k in the spring months varied from 0.16 to 0.19 (Figure 3a). In the future period, these probabilities are expected to increase significantly, with projections showing a range from 0.37 to 0.51 for more than one event k in the spring months (Figure 3b). This increase represents a rise of 105.6% to 200.0%, depending on the location (Figure 3c). This result aligns with the findings of Nissen and Ulbrich [53], who concluded that the frequency of extreme precipitation events in most European regions is projected to increase by up to 150% in the future under the RCP8.5 scenario.

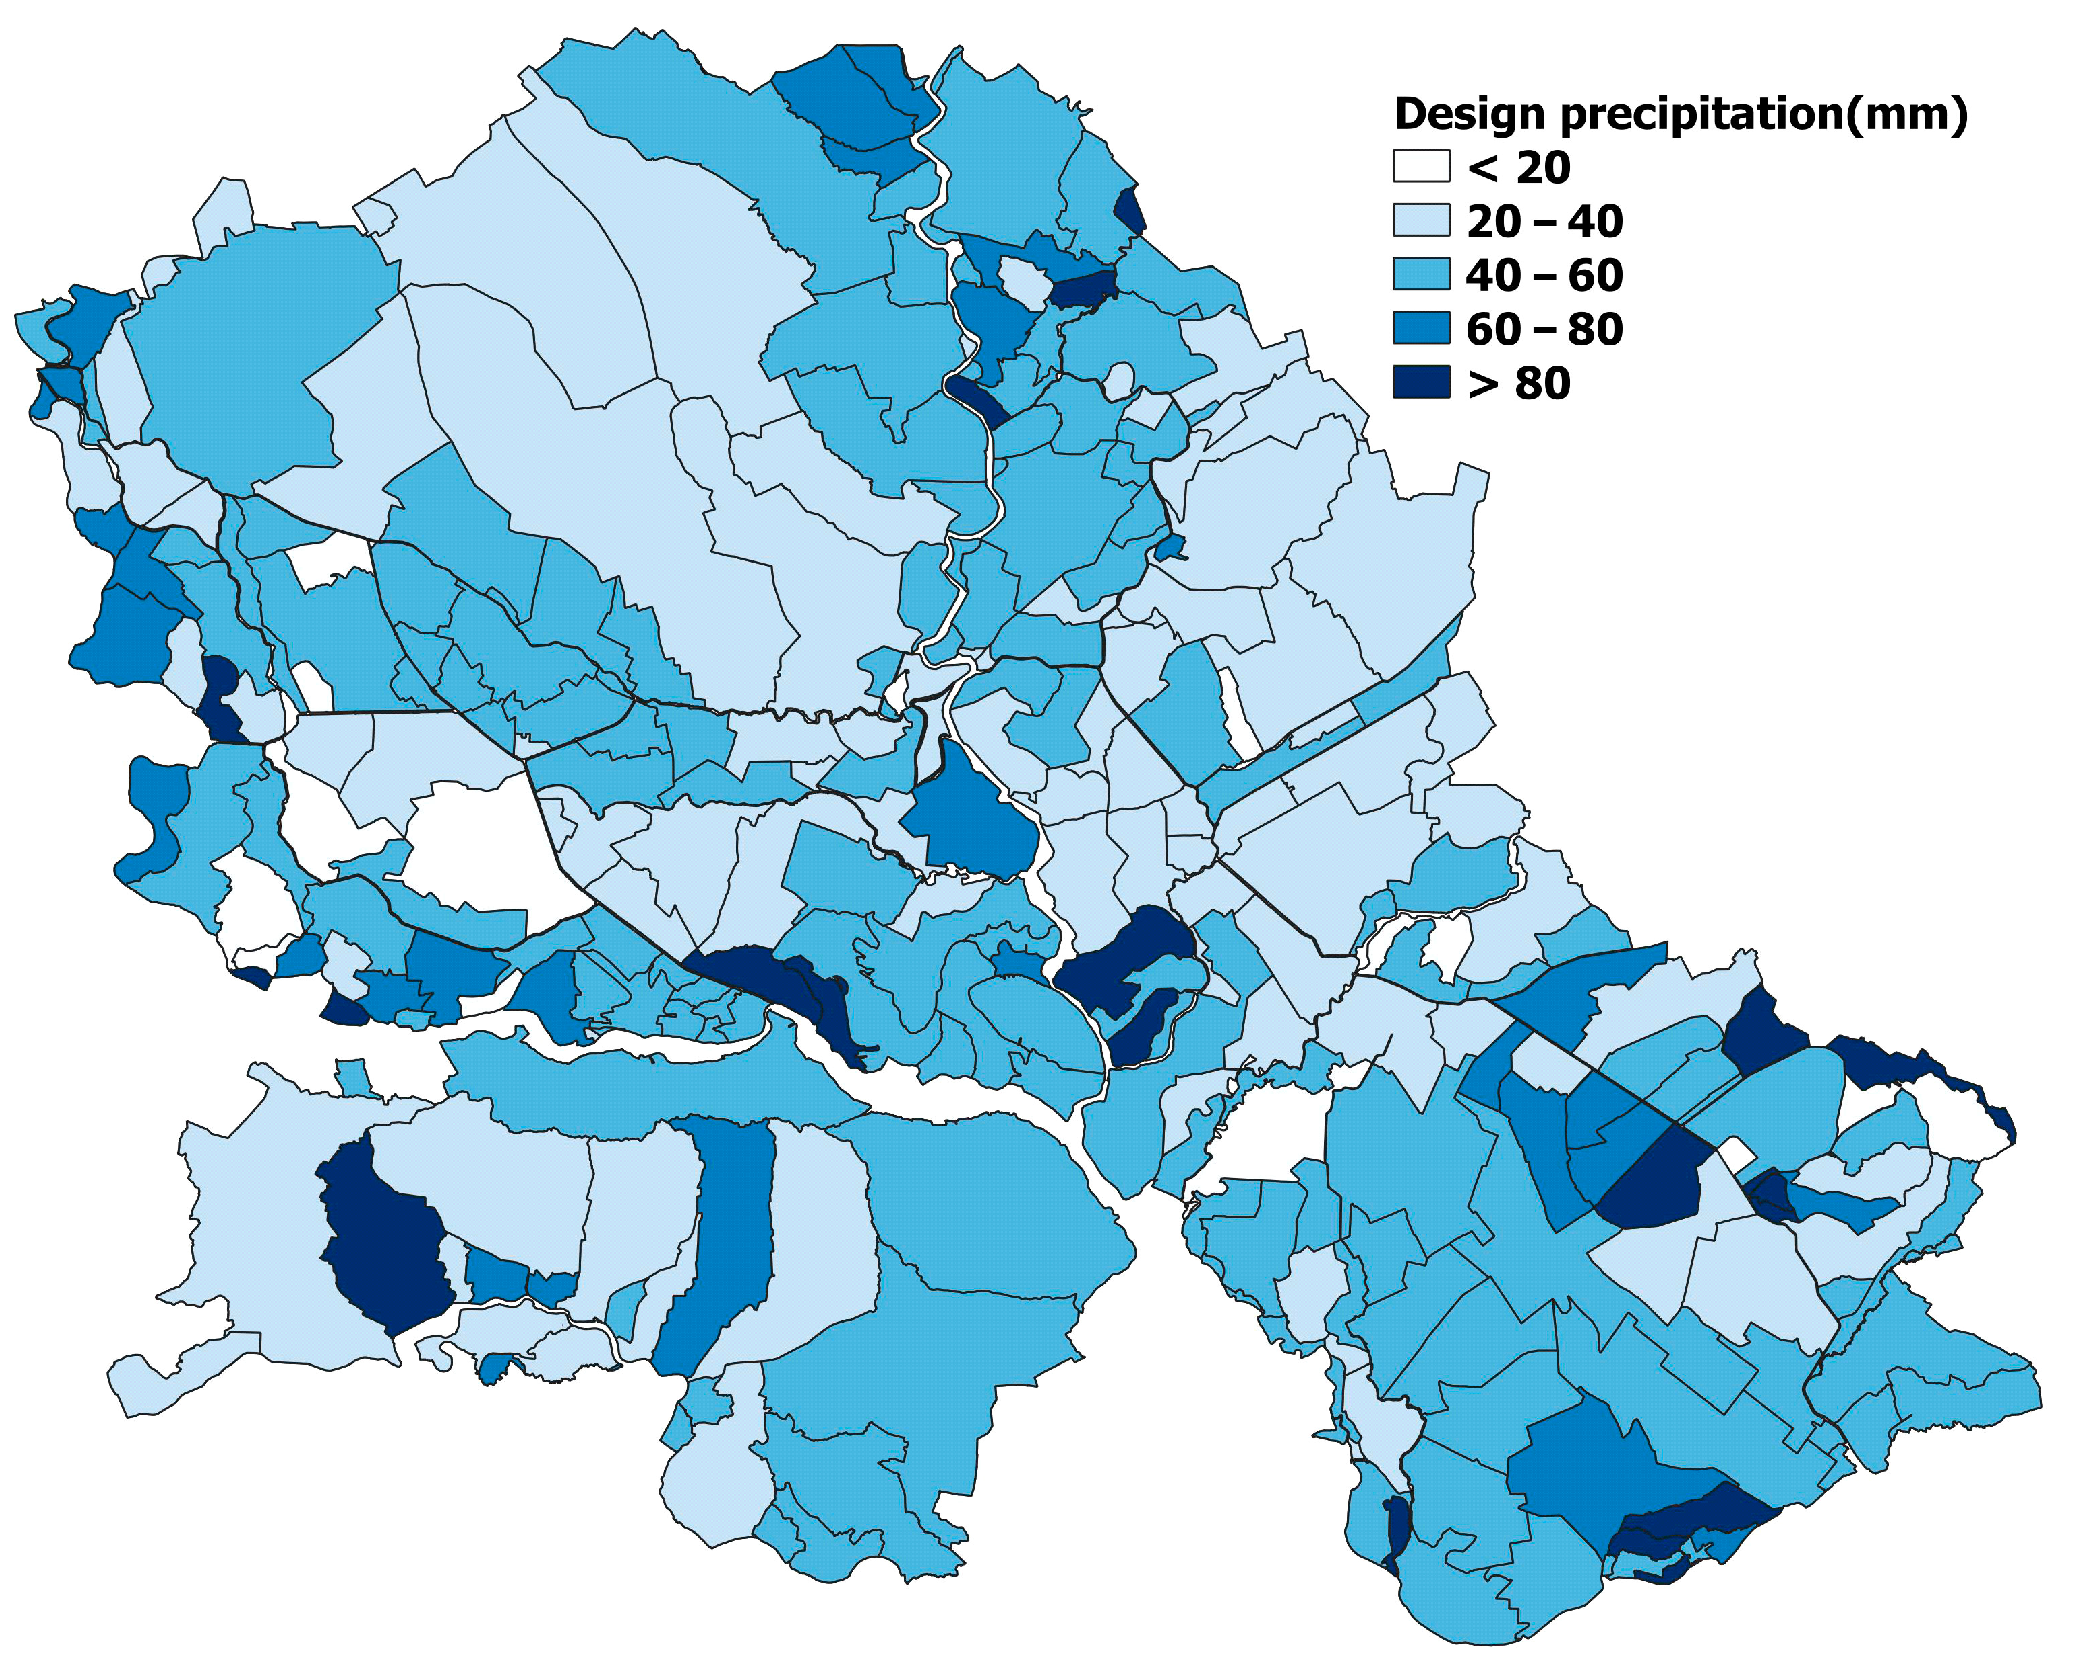
3.3. Future Pluvial Flood Risk Assessment

The future pluvial flood risk in the Vojvodina region was assessed by comparing the design properties and capabilities of existing drainage systems with estimated future requirements and identifying systems expected to underperform under projected future climate conditions.
According to the design documents from the public water management company, which manages all water management activities in the region, the drainage systems in the Vojvodina region were designed, constructed, or reconstructed around the mid-20th century. These documents contain information on Rx3day during spring based on which the drainage systems were designed. These values ranged from 15 mm to 91 mm, as presented in Figure 4.
In this analysis, we first compared the design values of Rx3day during spring with the modeled values. These were obtained using the GEV distribution based on data series from 1971 to 2019, as presented in Section 3.1, Figure 2a. This comparison was performed in order to evaluate the performance of drainage systems in the past period. The results are presented in Figure 5. The difference between the designed values and those modeled based on the data series from 1971 to 2019 varies from −41 mm to +34 mm.
Negative values imply that those drainage systems could have drained more excess water than what occurred in the analyzed period, suggesting that these systems likely performed effectively without problems in draining excess water. Also, high negative values could indicate that those systems were probably overdesigned. We identified 175 systems, most of the total number of systems, which were designed for precipitation amounts exceeding those that occurred in the analyzed period. These drainage systems are colored dark green in Figure 5.
The remaining drainage systems, numbering 111, likely faced some difficulties in draining excess water. This is because their design values for Rx3day during spring were lower than those recorded in the analyzed period. These systems can be considered to have operated with a certain level of risk of pluvial flooding and are represented in shades ranging from light green to red in Figure 5. Notably, only 23 out of the 286 drainage systems, accounting for approximately 5.7% of the total drained area in the Vojvodina region, could be classified as having a high risk of pluvial flooding during the analyzed period. This classification is based on the difference between the designed and modeled precipitation amounts greater than 20 mm.
In the next step, the impact of climate change on the operation of drainage systems and future pluvial flooding risks is assessed. As Visser et al. [54] have stated, traditional approaches to designing for extreme precipitation and flooding, which have relied on the assumption of a stationary climate, are likely to be inadequate for planning beyond a few decades. They suggest that infrastructure design will benefit from incorporating the best estimates of future changes in extreme precipitation based on climate model projections. This approach has also been applied in this study. The design values of Rx3day during spring are compared with future projections. These future amounts are modeled using the GEV distribution and are based on precipitation data from eight regional climate models. This is described in Section 3.1, Figure 2b. The results are presented in Figure 6. The difference between the designed values and future projections for the period 2020 to 2100 varies from −28 mm to +45 mm.
It has been identified that 51 drainage systems have a negative difference, as their designed precipitation values are higher than the future projections. These systems cover approximately 11.6% of the total drainage area in the Vojvodina region. It can be expected that these systems will continue to operate without difficulties under future climate conditions, given that their design capacities are sufficient to handle the anticipated excess water demands in the future.
In the remaining 235 drainage systems, the designed precipitation amounts fall below future projections. This implies an increased risk of pluvial flooding in those areas. In 47 drainage systems, which cover approximately 16.5% of the total drainage area in the Vojvodina region, a high risk of pluvial flooding can be expected in the future. This is because the future projections of Rx3day during spring, with a 10-year return period, exceed the designed values by more than 20 mm. Considering that the probabilities of experiencing more than one extreme precipitation event in the spring months (k) are expected to increase across the entire Vojvodina region, a worsening hydrological situation and increased challenges in water management activities in the region are anticipated for the future.
Detailed results for selected drainage systems, provided for illustrative purposes, are presented in Table 2. For instance, the Begeč–Gložan drainage system, located in the southwest of the region on the Danube River, serves as an example of a system whose design ensures satisfactory operation even under projected future climate conditions. For this drainage system, the design values of Rx3day during spring are higher than future projections. On the other hand, the Idvor–Uzdin drainage system, situated in the southern part of the region, represents a system that is expected to underperform under future climate conditions, thereby exposing its drained territory to a high level of pluvial flood risk. For this drainage system, the design values of Rx3day during spring are significantly lower than the future projections.
Similar to the results of this study, numerous other studies across Europe indicate that future climate change is expected to intensify heavy rainfall events and pluvial floods, with projections suggesting an increase in both the frequency and intensity of these events [55]. These changes are confirmed to escalate under various climate scenarios (RCP 4.5 and RCP 8.5), emphasizing the growing challenge of pluvial flooding, which will require greater attention [56,57]. Additionally, analyses predict a 47% rise in flood volumes for 10-year events and nearly a doubling of flood frequency, turning what was historically a 5-year event into a 2-year event [58]. This aligns with the results of our study, which shows that pluvial flood risk will significantly increase in the future, with an expected underperformance in 88% of all drainage systems in the Vojvodina region. Given these projections, the design of pluvial flooding infrastructure will greatly benefit from incorporating the best estimates of future changes in extreme precipitation to ensure resilience and adequacy. Compared to other studies, this study investigated Rx3day, which represents the design rainfall upon which the drainage system design is based. The obtained results indicate the extent to which certain drainage systems should be redesigned to perform adequately under future climate conditions. However, for precise calculations of runoff in a particular drainage system, detailed topographic characteristics of the watershed, soil properties, and land cover/land use data are needed in addition to Rx3day amounts. For this study, data from nine main meteorological stations in the Vojvodina region were used. Utilizing data from additional stations, such as local meteorological stations in the area of a specific drainage system, could increase the precision of Rx3day calculations. This is because the uneven distribution of meteorological stations may affect the research results [59,60].

4. Conclusions

The impact of climate change on extreme rainfall events and the associated risk of pluvial flooding was analyzed by studying the past (1971–2019) and future (2020–2100) occurrences of Rx3day in spring at nine principal meteorological stations in the Vojvodina region. Rx3day in spring with a 10-year return period was chosen because the design of pluvial flood protection systems in the Vojvodina region is based on these values. The RCP8.5 scenario was selected to study future Rx3day events in spring, and an ensemble of eight regional climate models from the EURO-CORDEX project database was employed. The research concentrated on specific aspects of the stochastic process related to these occurrences, including the probabilities of their occurrence and the number of events exceeding predefined thresholds.
The results indicate that Rx3day with a ten-year return period during the spring months is expected to increase by 19% to 33% in the future compared to the past period, depending on the location. Regarding the probabilities of having more than one event when Rx3day in spring exceeds specific thresholds, results show an increase in the future period ranging from 105.6% to 200.0% in the Vojvodina region.
By calculating the difference between the drainage systems’ design values of Rx3day during spring and the modeled values for the period from 1971 to 2019, 111 drainage systems that likely had difficulties in draining excess water were identified. This is because their design Rx3day values were lower than those observed in the analyzed period. The remaining 175 drainage systems were identified as potentially capable of operating without difficulties since their design Rx3day values were higher than those observed in the analyzed period.
The analysis of the difference between the design values of Rx3day during spring and future projections for the period 2020–2100 revealed that 51 drainage systems are likely to operate without difficulties under future climate conditions. This is because their design capacities are considered sufficient to handle the anticipated increase in excess water demands. For the remaining 235 drainage systems, an increased risk of pluvial flooding was identified because their designed precipitation amounts are below future projections.
The results demonstrate that the approach presented for analyzing extreme rainfall events, within the context of climate change, can provide necessary and highly valuable information. This information enables effective planning and policy making in water management activities, especially flood protection.

Author Contributions

Conceptualization, J.B. and A.B.; methodology, J.B. and A.B.; formal analysis, J.B., A.B., A.L. and B.B.; data curation, S.A. and A.G.; writing—original draft preparation, J.B. and A.B.; writing—review and editing, A.L., B.B., S.A., A.G. and D.M. All authors have read and agreed to the published version of the manuscript.

Funding

This work was supported by the European Union’s Horizon Europe innovation action program under grant agreement No. 101094070, project DALIA (Danube Region Water Lighthouse Action); the Ministry of Science, Technological Development, and Innovation of Serbia (Grant No. 451-03-65/2024-03/200117); and the Interreg’s Danube Region Programme project “Danube Water Balance”, project code DRP0200156.

Institutional Review Board Statement

Not applicable.

Informed Consent Statement

Not applicable.

Data Availability Statement

Due to privacy the data that support the findings of this study are available upon request from the authors.

Acknowledgments

We acknowledge the support by the Drought and Excess Water Management Centre established within the project Interreg-IPA CBC Hungary-Serbia (HUSRB/1602/11/0057): WATERatRISK; A.B. and J.B. are members of COST Actions CA22162–FutureMed and CA22122-RethinkBlue. We acknowledge the dataset from the digital platform developed within the “Improvement of medium-term and long-term planning of adaptation measures to changed climate conditions in the Republic of Serbia” project funded by the Green Climate Fund, the Ministry of Agriculture, Forestry, and Water Management, and the Ministry of Environmental Protection of the Republic of Serbia.

Conflicts of Interest

The authors declare no conflicts of interest.

References

  1. Tabari, H. Climate Change Impact on Flood and Extreme Precipitation Increases with Water Availability. Sci. Rep. 2020, 10, 13768. [Google Scholar] [CrossRef] [PubMed]
  2. Westra, S.; Fowler, H.J.; Evans, J.P.; Alexander, L.V.; Berg, P.; Johnson, F.; Kendon, E.J.; Lenderink, G.; Roberts, N.M. Future Changes to the Intensity and Frequency of Short-Duration Extreme Rainfall. Rev. Geophys. 2014, 52, 522–555. [Google Scholar] [CrossRef]
  3. Trenberth, K.E. Changes in Precipitation with Climate Change. Clim. Res. 2011, 47, 123–138. [Google Scholar] [CrossRef]
  4. Ahern, M.; Kovats, R.S.; Wilkinson, P.; Few, R.; Matthies, F. Global Health Impacts of Floods: Epidemiologic Evidence. Epidemiol. Rev. 2005, 27, 36–46. [Google Scholar] [CrossRef] [PubMed]
  5. Knapp, A.K.; Beier, C.; Briske, D.D.; Classen, A.T.; Luo, Y.; Reichstein, M.; Smith, M.D.; Smith, S.D.; Bell, J.E.; Fay, P.A. Consequences of More Extreme Precipitation Regimes for Terrestrial Ecosystems. Bioscience 2008, 58, 811–821. [Google Scholar] [CrossRef]
  6. Hallegatte, S.; Green, C.; Nicholls, R.J.; Corfee-Morlot, J. Future Flood Losses in Major Coastal Cities. Nat. Clim. Chang. 2013, 3, 802–806. [Google Scholar] [CrossRef]
  7. Solomon, S.; Qin, D.; Manning, M.; Chen, Z.; Marquis, M.; Averyt, K.B.; Tignor, M.; Miller, H.L. (Eds.) IPCC, 2007: Climate Change 2007: The Physical Science Basis. Contribution of Working Group I to the Fourth Assessment Report of the Intergovernmental Panel on Climate Change; Cambridge University Press: Cambridge, UK; New York, NY, USA, 2007. [Google Scholar]
  8. Guhathakurta, P.; Sreejith, O.P.; Menon, P.A. Impact of Climate Change on Extreme Rainfall Events and Flood Risk in India. J. Earth Syst. Sci. 2011, 120, 359–373. [Google Scholar] [CrossRef]
  9. Mastrantonas, N.; Herrera-Lormendez, P.; Magnusson, L.; Pappenberger, F.; Matschullat, J. Extreme Precipitation Events in the Mediterranean: Spatiotemporal Characteristics and Connection to Large-scale Atmospheric Flow Patterns. Int. J. Climatol. 2021, 41, 2710–2728. [Google Scholar] [CrossRef]
  10. Li, L.; Zou, Y.; Li, Y.; Lin, H.; Liu, D.L.; Wang, B.; Yao, N.; Song, S. Trends, Change Points and Spatial Variability in Extreme Precipitation Events from 1961 to 2017 in China. Hydrol. Res. 2020, 51, 484–504. [Google Scholar] [CrossRef]
  11. Grazzini, F.; Craig, G.C.; Keil, C.; Antolini, G.; Pavan, V. Extreme Precipitation Events over Northern Italy. Part I: A Systematic Classification with Machine-Learning Techniques. Q. J. R. Meteorol. Soc. 2020, 146, 69–85. [Google Scholar] [CrossRef]
  12. den Besten, N.; Steele-Dunne, S.; de Jeu, R.; van der Zaag, P. Towards Monitoring Waterlogging with Remote Sensing for Sustainable Irrigated Agriculture. Remote Sens. 2021, 13, 2929. [Google Scholar] [CrossRef]
  13. Ferronato, C.; Marinari, S.; Francioso, O.; Bello, D.; Trasar-Cepeda, C.; Antisari, L.V. Effect of Waterlogging on Soil Biochemical Properties and Organic Matter Quality in Different Salt Marsh Systems. Geoderma 2019, 338, 302–312. [Google Scholar] [CrossRef]
  14. Ding, G.; Gao, L.; Li, X.; Zhou, M.; Liu, Q.; Ren, H.; Jiang, B. A Mixed Method to Evaluate Burden of Malaria Due to Flooding and Waterlogging in Mengcheng County, China: A Case Study. PLoS ONE 2014, 9, e97520. [Google Scholar] [CrossRef]
  15. Islam, M.R.; Raja, D.R. Waterlogging Risk Assessment: An Undervalued Disaster Risk in Coastal Urban Community of Chattogram, Bangladesh. Earth 2021, 2, 151–173. [Google Scholar] [CrossRef]
  16. Kajári, B.; Bozán, C.; Van Leeuwen, B. Monitoring of Inland Excess Water Inundations Using Machine Learning Algorithms. Land 2023, 12, 36. [Google Scholar] [CrossRef]
  17. Serinaldi, F.; Kilsby, C.G. Rainfall Extremes: Toward Reconciliation after the Battle of Distributions. Water Resour. Res. 2014, 50, 336–352. [Google Scholar] [CrossRef]
  18. Du, H.; Alexander, L.V.; Donat, M.G.; Lippmann, T.; Srivastava, A.; Salinger, J.; Kruger, A.; Choi, G.; He, H.S.; Fujibe, F.; et al. Precipitation From Persistent Extremes Is Increasing in Most Regions and Globally. Geophys. Res. Lett. 2019, 46, 6041–6049. [Google Scholar] [CrossRef]
  19. Chen, S.; Li, Y.; Kim, J.; Kim, S.W. Bayesian Change Point Analysis for Extreme Daily Precipitation. Int. J. Climatol. 2017, 37, 3123–3137. [Google Scholar] [CrossRef]
  20. Rodrigues, D.T.; Gonçalves, W.A.; Spyrides, M.H.C.; Santos e Silva, C.M.; de Souza, D.O. Spatial Distribution of the Level of Return of Extreme Precipitation Events in Northeast Brazil. Int. J. Climatol. 2020, 40, 5098–5113. [Google Scholar] [CrossRef]
  21. Zeder, J.; Fischer, E.M. Observed Extreme Precipitation Trends and Scaling in Central Europe. Weather Clim. Extrem. 2020, 29, 100266. [Google Scholar] [CrossRef]
  22. Katz, R.W.; Parlange, M.B.; Naveau, P. Statistics of Extremes in Hydrology. Adv. Water Resour. 2002, 25, 1287–1304. [Google Scholar] [CrossRef]
  23. Lang, M.; Ouarda, T.B.M.J.; Bobée, B. Towards Operational Guidelines for Over-Threshold Modeling. J. Hydrol. 1999, 225, 103–117. [Google Scholar] [CrossRef]
  24. Tabari, H. Extreme Value Analysis Dilemma for Climate Change Impact Assessment on Global Flood and Extreme Precipitation. J. Hydrol. 2021, 593, 125932. [Google Scholar] [CrossRef]
  25. Hosseinzadehtalaei, P.; Tabari, H.; Willems, P. Climate Change Impact on Short-Duration Extreme Precipitation and Intensity–Duration–Frequency Curves over Europe. J. Hydrol. 2020, 590, 125249. [Google Scholar] [CrossRef]
  26. Papalexiou, S.M.; Koutsoyiannis, D. Battle of Extreme Value Distributions: A Global Survey on Extreme Daily Rainfall. Water Resour. Res. 2013, 49, 187–201. [Google Scholar] [CrossRef]
  27. Yan, H.; Sun, N.; Wigmosta, M.; Skaggs, R.; Hou, Z.; Leung, R. Next-Generation Intensity-Duration-Frequency Curves for Hydrologic Design in Snow-Dominated Environments. Water Resour. Res. 2018, 54, 1093–1108. [Google Scholar] [CrossRef]
  28. Hrnjak, I.; Lukić, T.; Gavrilov, M.B.; Marković, S.B.; Unkašević, M.; Tošić, I. Aridity in Vojvodina, Serbia. Theor. Appl. Climatol. 2014, 115, 323–332. [Google Scholar] [CrossRef]
  29. Mihailović, D.T.; Lalić, B.; Drešković, N.; Mimić, G.; Djurdjević, V.; Jančić, M. Climate Change Effects on Crop Yields in Serbia and Related Shifts of Köppen Climate Zones under the SRES-A1B and SRES-A2. Int. J. Climatol. 2015, 35, 3320–3334. [Google Scholar] [CrossRef]
  30. Bezdan, J.; Bezdan, A.; Blagojević, B.; Mesaroš, M.; Pejić, B.; Vranešević, M.; Pavić, D.; Nikolić-Đorić, E. SPEI-Based Approach to Agricultural Drought Monitoring in Vojvodina Region. Water 2019, 11, 1481. [Google Scholar] [CrossRef]
  31. Ministry for Environmental Protection of the Republic of Serbia (MEPRS). Digital Climate and Climate Change Atlas of the Republic of Serbia. Project “Advancing Medium and Long-Term Adaptation Planning in the Republic of Serbia”. Ministry for Environmental Protection of the Republic of Serbia. 2022. Available online: http://atlas-klime.eko.gov.rs (accessed on 1 February 2024).
  32. Vujadinović Mandić, M.; Ranković-Vasić, Z.; Ćosić, M.; Simić, A.; Đurivić, D.; Dolijanović, Ž.; Vuković Vimić, A.; Životić, L.; Stanojević, D.; Lipovac, A. Project: Advancing Medium and Long-Term Adaptation Planning in the Republic of Serbia (2019–2022). Funded by the Green Climate Fund, and Implemented by the United Nations Development Program (UNDP), in Cooperation with the Ministry of Agriculture, Forestry and Water Management. Report on the Impact of Climate Change on the Agriculture Sector, with Proposed Adaptation Measures. Activity 1: Risk and Vulnerability Assessment–Observed: Occurrences, Impacts, and Levels of Affectedness within. 2023. Available online: https://adaptacije.klimatskepromene.rs/wp-content/uploads/2022/03/Agriculture-1.-Risk-and-Vulnerability-assessment.pdf (accessed on 1 February 2024).
  33. Mandic, M.V.; Vimić, A.V.; Ranković-Vasić, Z.; Ćosić, M.; Đurović, D.; Dolijanović, Ž.; Simić, A.; Lipovac, A.; Životić, L. Climate Change Risks in Agricultural Plant Production of Serbia. In Proceedings of the EGU General Assembly Conference Abstracts, Vienna, Austria, 23–27 May 2022. [Google Scholar]
  34. Rodrigues, D.T.; Gonçalves, W.A.; Spyrides, M.H.C.; Andrade, L.d.M.B.; de Souza, D.O.; de Araujo, P.A.A.; da Silva, A.C.N.; e Silva, C.M.S. Probability of Occurrence of Extreme Precipitation Events and Natural Disasters in the City of Natal, Brazil. Urban Clim. 2021, 35, 100753. [Google Scholar] [CrossRef]
  35. Viglione, A.; Hosking, J.R.; Laio, F.; Miller, A.; Gaume, E.; Payrastre, O.; Salinas, J.L.; N’guyen, C.C.; Halbert, K.; Viglione, M.A. Package ‘nsRFA.’ Non-supervised Regional Frequency Analysis. CRAN Repos. 2020, 1–7. Available online: https://cran.r-project.org/package=nsRFA (accessed on 1 February 2024).
  36. Delignette-Muller, M.L.; Dutang, C. An R Package for Fitting Distributions. J. Stat. Softw. 2014, 64, 1–34. [Google Scholar]
  37. Myung, I.J. Tutorial on Maximum Likelihood Estimation. J. Math. Psychol. 2003, 47, 90–100. [Google Scholar] [CrossRef]
  38. Pan, J.-X.; Fang, K.-T. Maximum Likelihood Estimation. In Growth Curve Models and Statistical Diagnostics; Springer Series in Statistics; Springer: New York, NY, USA, 2002; pp. 77–158. ISBN 978-1-4419-2864-1. [Google Scholar]
  39. Anghel, C.G.; Stanca, S.C.; Ilinca, C. Two-Parameter Probability Distributions: Methods, Techniques and Comparative Analysis. Water 2023, 15, 3435. [Google Scholar] [CrossRef]
  40. Ilinca, C.; Stanca, S.C.; Anghel, C.G. Assessing Flood Risk: LH-Moments Method and Univariate Probability Distributions in Flood Frequency Analysis. Water 2023, 15, 3510. [Google Scholar] [CrossRef]
  41. Huber, P.J. Robust Statistics; Wiley: Hoboken, NJ, USA, 1981. [Google Scholar]
  42. White, H. Maximum Likelihood Estimation of Misspecified Models. Econom. J. Econom. Soc. 1982, 1–25. [Google Scholar] [CrossRef]
  43. Ilinca, C.; Anghel, C.G. Flood-Frequency Analysis for Dams in Romania. Water 2022, 14, 2884. [Google Scholar] [CrossRef]
  44. Anghel, C.G.; Ilinca, C. Parameter Estimation for Some Probability Distributions Used in Hydrology. Appl. Sci. 2022, 12, 12588. [Google Scholar] [CrossRef]
  45. Madsen, H.; Rasmussen, P.F.; Rosbjerg, D. Comparison of Annual Maximum Series and Partial Duration Series Methods for Modeling Extreme Hydrologic Events: 1. At-Site Modeling. Water Resour. Res. 1997, 33, 747–757. [Google Scholar] [CrossRef]
  46. Önöz, B.; Bayazit, M. Effect of the Occurrence Process of the Peaks over Threshold on the Flood Estimates. J. Hydrol. 2001, 244, 86–96. [Google Scholar] [CrossRef]
  47. Sunyer, M.A.; Hundecha, Y.; Lawrence, D.; Madsen, H.; Willems, P.; Martinkova, M.; Vormoor, K.; Bürger, G.; Hanel, M.; Kriaučiūnienė, J.; et al. Inter-Comparison of Statistical Downscaling Methods for Projection of Extreme Precipitation in Europe. Hydrol. Earth Syst. Sci. 2015, 19, 1827–1847. [Google Scholar] [CrossRef]
  48. Rajczak, J.; Schär, C. Projections of Future Precipitation Extremes Over Europe: A Multimodel Assessment of Climate Simulations. J. Geophys. Res. Atmos. 2017, 122, 10773–10800. [Google Scholar] [CrossRef]
  49. Beniston, M.; Stephenson, D.B.; Christensen, O.B.; Ferro, C.A.; Frei, C.; Goyette, S.; Halsnaes, K.; Holt, T.; Jylhä, K.; Koffi, B. Future Extreme Events in European Climate: An Exploration of Regional Climate Model Projections. Clim. Chang. 2007, 81, 71–95. [Google Scholar] [CrossRef]
  50. May, W. Potential Future Changes in the Characteristics of Daily Precipitation in Europe Simulated by the HIRHAM Regional Climate Model. Clim. Dyn. 2008, 30, 581–603. [Google Scholar] [CrossRef]
  51. Mood, A.M. The Distribution Theory of Runs. Ann. Math. Stat. 1940, 11, 367–392. [Google Scholar] [CrossRef]
  52. Siegel, S.; Castellan, N.J. Nonparametric Statistics for the Behavioral Sciences, 2nd ed.; McGraw-Hill: New York, NY, USA, 1988. [Google Scholar]
  53. Nissen, K.M.; Ulbrich, U. Increasing Frequencies and Changing Characteristics of Heavy Precipitation Events Threatening Infrastructure in Europe under Climate Change. Nat. Hazards Earth Syst. Sci. 2017, 17, 1177–1190. [Google Scholar] [CrossRef]
  54. Visser, J.B.; Kim, S.; Wasko, C.; Nathan, R.; Sharma, A. The Impact of Climate Change on Operational Probable Maximum Precipitation Estimates. Water Resour. Res. 2022, 58, e2022WR032247. [Google Scholar] [CrossRef]
  55. Kundzewicz, Z.W.; Pińskwar, I. Are Pluvial and Fluvial Floods on the Rise? Water 2022, 14, 2612. [Google Scholar] [CrossRef]
  56. Skougaard Kaspersen, P.; Høegh Ravn, N.; Arnbjerg-Nielsen, K.; Madsen, H.; Drews, M. Comparison of the Impacts of Urban Development and Climate Change on Exposing European Cities to Pluvial Flooding. Hydrol. Earth Syst. Sci. 2017, 21, 4131–4147. [Google Scholar] [CrossRef]
  57. Prokic, M.N.; Savić, S.; Pavić, D. Pluvial Flooding in Urban Areas across the European Continent. Geogr. Pannonica 2019, 23. [Google Scholar] [CrossRef]
  58. Hosseinzadehtalaei, P.; Ishadi, N.K.; Tabari, H.; Willems, P. Climate Change Impact Assessment on Pluvial Flooding Using a Distribution-Based Bias Correction of Regional Climate Model Simulations. J. Hydrol. 2021, 598, 126239. [Google Scholar] [CrossRef]
  59. Shen, X.; Liu, B.; Li, G.; Wu, Z.; Jin, Y.; Yu, P.; Zhou, D. Spatiotemporal Change of Diurnal Temperature Range and Its Relationship with Sunshine Duration and Precipitation in China. J. Geophys. Res. Atmos. 2014, 119, 13163–13179. [Google Scholar] [CrossRef]
  60. Zhang, X.; Xu, M.; Kang, S.; Wu, H.; Han, H. The Spatiotemporal Variability in Precipitation Gradients Based on Meteorological Station Observations in Mountainous Areas of Northwest China. Theor. Appl. Climatol. 2024, 155, 163–186. [Google Scholar] [CrossRef]
Figure 1. Study area: (a) topographic map of the Vojvodina region, (b) the Vojvodina region on the map of Europe.
Atmosphere 15 00488 g001
Figure 2. Rx3day with a ten-year return period during spring months for the past period (1971–2019) (a) for the future period (2020–2100) (b) and the percentage increase of precipitation amounts (c).
Atmosphere 15 00488 g002
Figure 3. The probabilities of k > 0 during the past period (1971–2019) (a), in the future period (2020–2100) (b), and the percentage increase (c).
Atmosphere 15 00488 g003
Figure 4. Designed Rx3day during spring.
Atmosphere 15 00488 g004
Figure 5. The difference between the design values of Rx3day during spring and the modeled values using the GEV distribution based on data series from 1971 to 2019.
Atmosphere 15 00488 g005
Figure 6. The difference between the design values of Rx3day during spring and the future projections for the period 2020 to 2100.
Atmosphere 15 00488 g006
Table 1. Combinations of global and regional climate models selected for use in this study [31,32].
Regional ModelGlobal Model
CLMcom-CCLM4-8-17ICHEC-EC-EARTH
DMI-HIRHAM5ICHEC-EC-EARTH
KNMI-RACMO22EICHEC-EC-EARTH
CLMcom-CCLM4-8-17MOHC-HadGEM2-ES
KNMI-RACMO22EMOHC-HadGEM2-ES
CLMcom-CCLM4-8-17MPI-M-MPI-ESM-LR
MPI-CSC-REMO2009MPI-M-MPI-ESM-LR (r1i1p1)
MPI-CSC-REMO2009MPI-M-MPI-ESM-LR (r2i1p1)
Table 2. Detailed analysis results of the occurrences of Rx3day in spring for selected drainage systems.
Name of the
Drainage System
Rx3day during Spring
with a 10-Year Return Period (mm)
The Probabilities of k > 0
Design Value1971–20192020–21001971–20192020–2100
Begeč–Gložan64.049.160.60.180.39
Burza52.042.456.20.180.45
Vranj44.047.556.80.170.40
Sonćanski rit29.044.854.10.160.41
Dobrica–Ilandža26.047.858.20.180.45
Idvor–Uzdin15.544.358.50.170.44
The colors correspond to the palette used in Figure 5 and Figure 6.
Disclaimer/Publisher’s Note: The statements, opinions and data contained in all publications are solely those of the individual author(s) and contributor(s) and not of MDPI and/or the editor(s). MDPI and/or the editor(s) disclaim responsibility for any injury to people or property resulting from any ideas, methods, instructions or products referred to in the content.

