Article

Exploring the Effects of Elevated Ozone Concentration on Physiological Processes in Summer Maize in North China Based on Exposure–Response Relationships

1
College of Environmental Science and Engineering, Beijing Forestry University, Beijing 100083, China
2
Research Center for Eco-Environmental of Sciences, Chinese Academy of Sciences, Beijing 100085, China
3
University of Chinese Academy of Sciences, Beijing 100049, China
4
Kunming Yangzonghai National Tourism Resort Management Committee, Kunming 650500, China
*
Authors to whom correspondence should be addressed.
These authors contributed to the work equally and should be regarded as co-first authors.
Atmosphere 2024, 15(6), 639; https://doi.org/10.3390/atmos15060639
Submission received: 29 April 2024 / Revised: 21 May 2024 / Accepted: 24 May 2024 / Published: 26 May 2024
(This article belongs to the Special Issue Ozone Pollution and Effects in China)

Abstract

:
As the predominant pollutant in North China during the summer months, ozone (O3) exhibits strong oxidizing capabilities. Long-term exposure of crops to ozone will cause a decrease in various physiological indicators, affect crop yields, and pose a serious threat to food security. The North China Plain, the primary region for summer maize production in China, is afflicted by ozone pollution. In order to explore the effects of increasing O3 concentration on the physiological characteristics and photosynthetic characteristics of summer maize, this study took summer-sown maize as the research object and carried out the ozone exposure experiment with open-top chamber (OTCs). The response of maize to O3 exposure was studied by measuring the damage, physiological indexes and photosynthetic indexes in the silking stage (late July to late August) and filling stage (late August to mid-September). The results indicated the following: (1) Prolonged exposure to high O3 concentrations exacerbated leaf chlorosis and damage. (2) The increase in O3 concentration caused lipid peroxidation. The content of malondialdehyde was significantly increased by 32.6%~122.56%. At the same time, chlorophyll was destroyed and decreased by 2.17% to 4.86%. Under ozone exposure, ascorbic acid content was significantly increased by 7.58%~35.69%. The antioxidant indexes of maize were more sensitive during the filling stage. (3) Under O3 exposure, photosynthetic rate, stomatal conductance and intercellular carbon dioxide concentration decreased significantly, indicating that the influence of O3 on maize was mainly due to stomatal limitation. Water use efficiency and transpiration rate decreased significantly. The water use efficiency decreased by 12.84%~35.62%, which led to the weakening of the carbon fixation ability of maize and affected the normal growth and development of maize.

1. Introduction

Near-surface ozone (O3) is generated from precursors such as nitrogen oxides (NOxs) and volatile organic compounds (VOCs) through photochemical reactions [1,2], which have serious toxic effects on plants [3,4,5,6]. With accelerating industrialization, urbanization and increasing human activities, O3 concentrations in the mid-latitude regions of the Northern Hemisphere have been increasing at a rate of 0.5% to 2.5% per year [7,8]. The highest average O3 concentrations in some regions can reach 109 ppbv, which is much higher than the damage threshold concentration of O3 for plants (40 ppbv) [9,10]. The evaluation indexes of O3 on crops are mainly divided into dose index and flux index. Since crops have a certain degree of resistance to O3 pollution, they are only damaged when the O3 concentration is above a certain threshold. Therefore the exposure–response function AOT40 (the cumulative value of O3 concentration exceeding 40 ppbv per hour), which is based on the ozone dose index, is widely used to reflect the ozone concentration in the air near plants. The response function PODY based on ozone flux takes into account the effects of biological and environmental factors on O3 absorption in plant stomata. The main calculation process of PODY is to simulate the hourly stomatal conductance value of plants through a model, then calculate the hourly O3 stomatal absorption flux, and, finally, obtain the cumulative flux in the growing season of crops [11,12]. Compared with AOT40, the advantage of using the PODY is better performance of the indicators in highly heterogeneous situations. However, the performance of AOT40 and PODY was similar when other environmental conditions were the same except for ozone concentration [13].
In China, the most severely ozone-polluted areas are mainly concentrated in the Beijing–Tianjin–Hebei, Yangtze River Delta and Pearl River Delta regions [3]. In addition, the ozone concentration in suburban areas is usually higher than that in urban areas [14]. According to research data, the current ambient ozone concentration in our country has already reached a rather high level. In North China Plain and Central/Western China, the highest hourly ozone concentration is as high as 316 ppbv [15]. The average monthly ozone concentration in the Beijing–Tianjin–Hebei region is above 90 ppbv [16]. According to research statistics, O3 pollution has led to relative yield losses of 23%, 33% and 9% for rice, wheat and maize in China, respectively [17]. The North China Plain is the main production area of spring-sown and summer-sown maize in China, of which the summer maize production accounts for 50% of the national maize production [18]. The rapid increase in O3 concentration in the North China Plain has had a great impact on the growth of China’s grain crops [19], leading to serious economic losses [20]. Therefore, it is of great significance to explore the impact of elevated O3 concentration on maize in the North China Plain.
Photosynthesis is sensitive to elevated O3 concentrations [21], which has been widely confirmed [22]. Stomata is the main channel through which O3 enters the blade. Facing rising ozone concentrations, the changes in stomata will result in the change of gas exchange rate. In severe cases, the stomata will be closed, which will reduce the O3 diffused into the apoplast. Stomatal closure will also affect the rate of CO2 absorption, thereby reducing the photosynthesis of leaves [23]. After entering cells through pores, O3 reacts with compounds present in cells and then produces reactive oxygen species (ROS) [24]. ROS, such as hydrogen peroxide (H2O2), destroy the integrity and function of biofilm. And, at the same time, plant leaves appear visible injury symptoms such as staining, chlorosis and yellowing [25,26,27]. The increase in O3 concentration will cause changes in sugar metabolism in plants and weaken the ability of protein synthesis, thus affecting the carbon sink capacity of plants [28]. In response to O3 exposure, the plant antioxidant system is induced to accelerate the clearance of ROS [29,30], in which ascorbic acid (ASA) plays a key role. ASA reacts with O3 to produce dehydroascorbic acid (DHA). DHA is then transported into the cytoplasm and regenerated into ASA via the ascorbate–glutathione cycle (ASA-GSH) [31]. The sensitivity of plants to O3 is related to the level of antioxidant substances [32]. Under O3 exposure, the slope of exposure dose–response relationship becomes larger, and the ozone influence becomes more serious and the sensitivity becomes stronger. On the contrary, the sensitivity decreased, indicating that the plants had adapted to ozone.
This study found that different crops have different levels of sensitivity to ozone. The sensitivity of C3 crops (crops in which the initial product of CO2 assimilation is a three-carbon compound) such as wheat was higher than that of C4 crops (crops in which the initial product of CO2 assimilation is the four-carbon compound malic acid or aspartate) such as maize [33]. Crop sensitivity to ozone is not only related to crop species but also to the growing stage of the crop. The growth period of maize is mainly divided into major developmental stages such as sowing, seedling emergence, three-leaf stage, seven-leaf stage, silking stage, stamen extraction stage, flowering stage, filling stage, milk ripening stage and maturity stage [34]. Among them, crops such as wheat and maize are most sensitive to ozone during the filling stage [4,35]. The filling stage is the key reproductive stage for yield formation in summer maize, in which almost all the nutrients are transported to the maize kernels. Most of the studies have been conducted to investigate the effects of a certain concentration of ozone on crops by simulating O3 through Open-top Chamber (OTCs) [36,37,38]. It was found that the effects of O3 on crops varied depending on O3 concentration, exposure conditions and exposure period [39,40,41].
Many studies have shown that surface ozone pollution is the result of the synergistic action of human-made sources, natural sources and photochemical reactions. Naturally occurring nitrogen oxides (NOx) react with volatile organic compounds emitted by plants to form O3. Human activities will emit a large amount of NOxs and VOCs, and together with natural sources in the environment through complex photochemical reactions to produce O3. In the main crop-producing areas of North China, the proportion of human-made sources decreased, and the promotion effect of natural sources on ozone generation was more obvious. In order to further explore the effects of ozone pollution on the physiological and photosynthetic characteristics of maize, and compare the sensitivity of different indicators to ozone at different growth stages, this study used the OTC simulation platform of O3 fumigation established by the Rural Environmental Research Station of the Research Center for Ecological Environment of the Chinese Academy of Sciences to observe the changes of relevant parameters during the critical growth period of maize in summer in North China. This study explored the mechanism of ozone damage in order to provide a theoretical basis for the risk assessment of maize yield loss caused by O3 pollution in North China.

2. Materials and Methods

2.1. Study Site

The field observation experiment of this study was carried out at the Rural Environment Research Station of the Research Center for Eco-Environmental Sciences, the Chinese Academy of Sciences (38°42′ N, 115°15′ E). The research station is located in Dongbaituo Village, Wangdu County, Baoding City, Hebei Province, China, in the northwest of the North China Plain. The research station has a continental semi-arid climate, with an average annual rainfall of about 510 mm and an average annual temperature of 11.8 °C. It is surrounded by open terrain, which is basically the farmland of winter wheat and summer maize rotation.

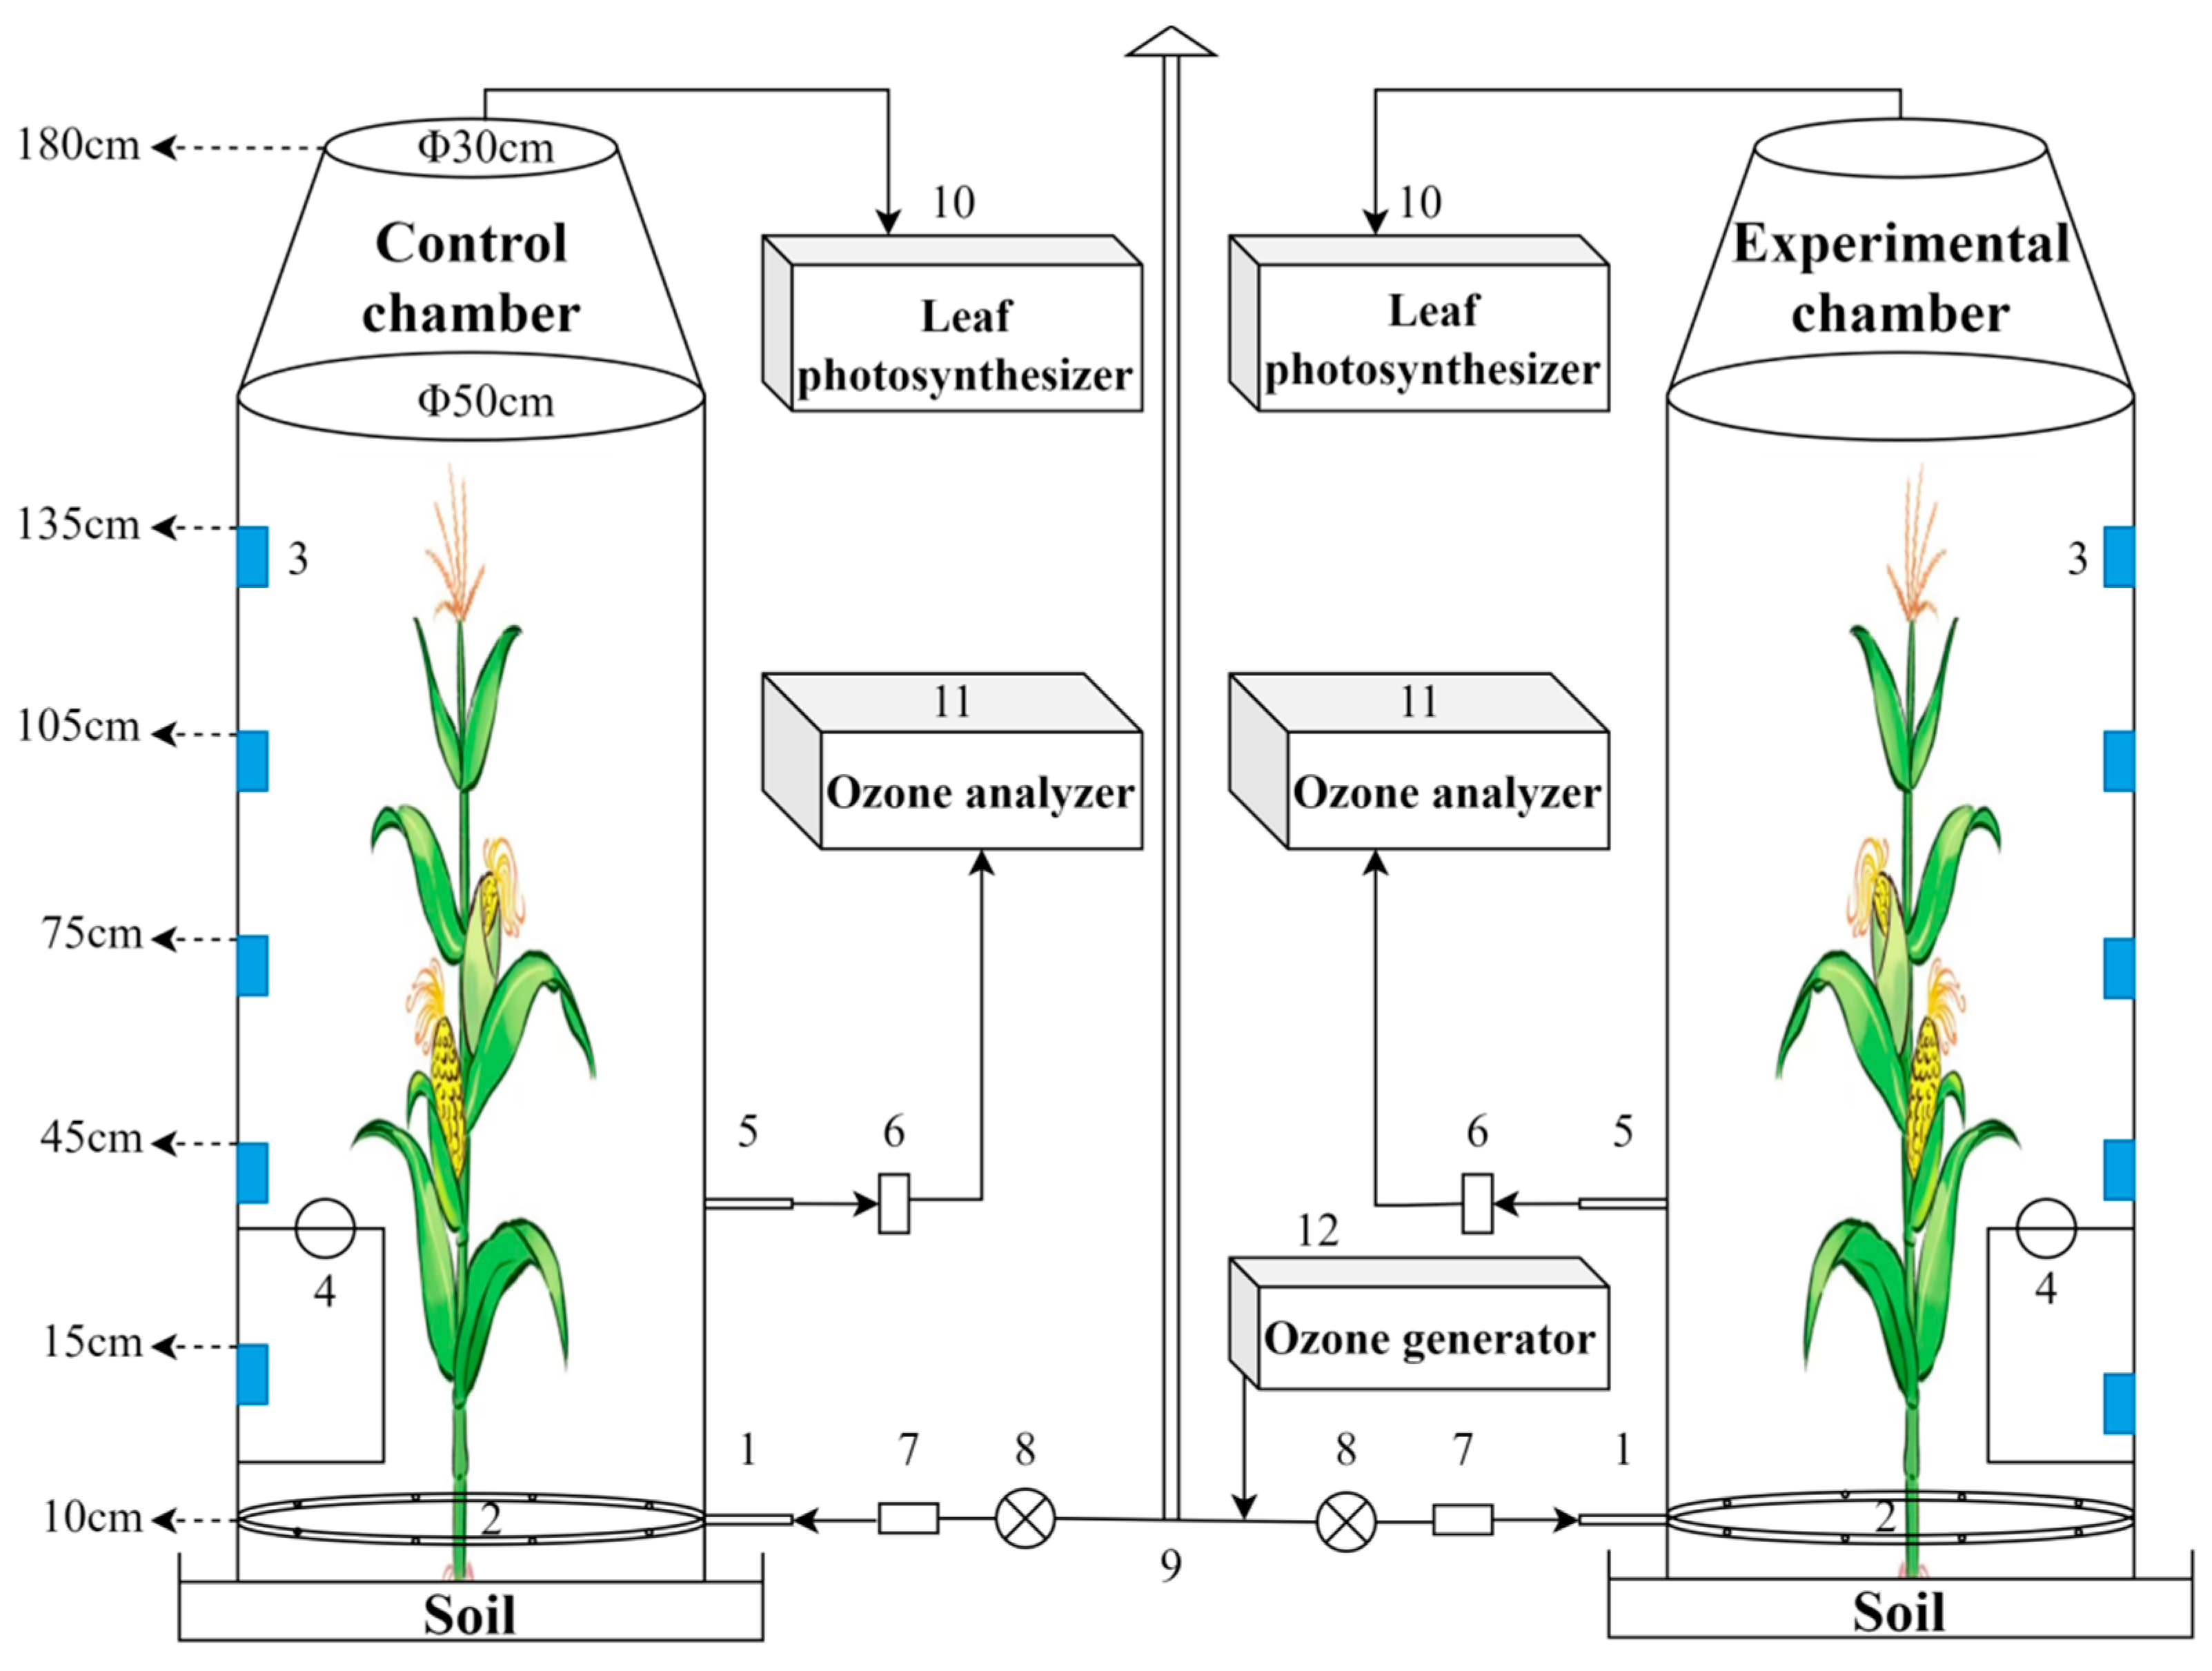
2.2. Ozone Treatment

In the experiments, the OTCs consisted of a cylindrical dynamic chamber with a bottom diameter of 50 cm and a height of 160 cm combined with a frustum of a cone with an upper bottom diameter of 30 cm and a lower bottom diameter of 50 cm and a height of 20 cm. The surface of the chamber was wrapped with a transparent polytetrafluoroethylene (PTFE) film to ensure light transmission (>95%). In order to ensure gas flow, the OTCs were equipped with a circular opening at the top and a diaphragm pump (Model N838, KNF, Freiburg, Germany) at the bottom to extract the gas. In order to ensure gas mixing, miniature fans were mounted inside the dynamic chamber. Temperature and humidity probes (EML Electronics Co., Ltd., Handan, China) were mounted inside the OTCs to monitor the meteorological parameters in the chamber. During observation, the chamber was placed above the maize plants and the liquid was sealed by pouring water into the bottom tank of the dynamic chamber (Figure 1).
Four O3 concentration levels were set up for the experiment: NF, ambient O3 concentration; CF, NF+ozone adsorbent; NF40, NF+40 ppbv; and NF80, NF+80 ppbv. O3 was generated by an O3 generator (GHZTW3G, Guangzhou Chuanghuan Ozone Electrical Equipment Co., Ltd., Guangzhou, China), and the amount of O3 was controlled through the control of the airflow rate. The O3 concentration inside the OTC was continuously monitored using an O3 analyzer (US 2B 202 ozone monitor). Ozone fumigation was carried out from 8 August to 17 September. On rainy days, the fumigation will be stopped, and it is necessary to ensure the use of the instrument after the rain. The maximum daily fumigation time is 8 h (09:00~17:00).
The conditions of this experiment were not highly heterogeneous and the advantage of the PODY indicator was not obvious, so the AOT40 indicator was used for this study. Based on the real-time monitoring of ozone concentration, AOT40 was calculated with the following formula:
AOT 40 = i = 0 n O 3 40 × Δ t
where [O3] is the hourly concentration of ozone, Δt = 1 h.

2.3. Parameter Measurements

2.3.1. Visible Leaf Damage

During the experimental period, visible leaf injury was counted on maize once after every 6 consecutive days of ozone fumigation. Maize damage characteristics and damaged leaves were recorded and analyzed statistically.

2.3.2. Physiological Parameter

During the experiment, leaves with fixed positions on the plant were selected for analysis of physiological and biochemical indices. Chlorophyll (Chl) content was determined spectrophotometrically by soaking the leaves in a 1:1 solution of anhydrous ethanol and acetone at 4 °C for 24 h until the leaves turned white. Using thiobarbituric acid (TBA) and malondialdehyde (MDA) heated under acidic conditions to form reddish-brown trimethylchuan (3,5,5-trimethyloxazole 2,4-dione), the MDA content of the plants was determined by measuring the absorbance values. Ascorbic acid (ASA) was determined by reducing Fe3+ to Fe2+ and reacting with red phenanthroline (4,7-diphenyl-1,10-phenanthroline, BP) to form a red chelate, which was then measured using a spectrophotometer (Shanghai Precision Instrument Co., Ltd., Shanghai, China).

2.3.3. Photosynthetic Parameters

During the experimental period, leaves at the same leaf location were selected for the determination of photosynthetic parameters. The selected sample leaves were mature leaves with flat growth angles at the upper leaf position; the leaves were intact and the leaf area was larger than the leaf chamber area. The photosynthetic indexes of the control group (NF) were measured continuously every day using leaf photosynthesizer A (YZQ-100A portable photosynthesizer V3.0), and the photosynthetic indexes of the treatment groups (CF, NF40, NF80) were measured every day using leaf photosynthesizer B (YZQ-100A portable photosynthesizer V3.0) on a rotational basis. The two leaf photosynthesizers were regularly calibrated, the measurement data were corrected and appropriate measurement methods were used to reduce or eliminate experimental errors.

2.3.4. Data Quality Assurance

The ozone analyzer was calibrated once before and once after use. For the calibration, the ozone calibration system was composed of a Thermo Fisher commercial instrument, Model 49i-PS (Thermo Fisher Scientific, Waltham, MA, USA), and a Model 111 zero gas generator. Compressed air was supplied by an air compressor into a Thermo Scientific™ 111 Zero Gas Generator. The air was treated by the Model 111 Zero Gas Generator to be free of contaminants such as NO, CO2, O3, SO2, CO and hydrocarbons, and a flow rate of up to 20 L/min can be achieved at a pressure of 30 psi. This was then passed into the Model 49i-PS, which was irradiated with 254 nm UV light to produce a fixed concentration of ozone gas that entered the ozone concentration monitoring instrument. Using the standard ozone concentration (y) generated by the 49i-PS versus the concentration measured by the instrument (x), a calibration curve (y = k × x + b) was plotted to further calibrate the ozone concentration data measured by the instrument in the experiment to obtain the actual ozone concentration in the atmosphere.

3. Results

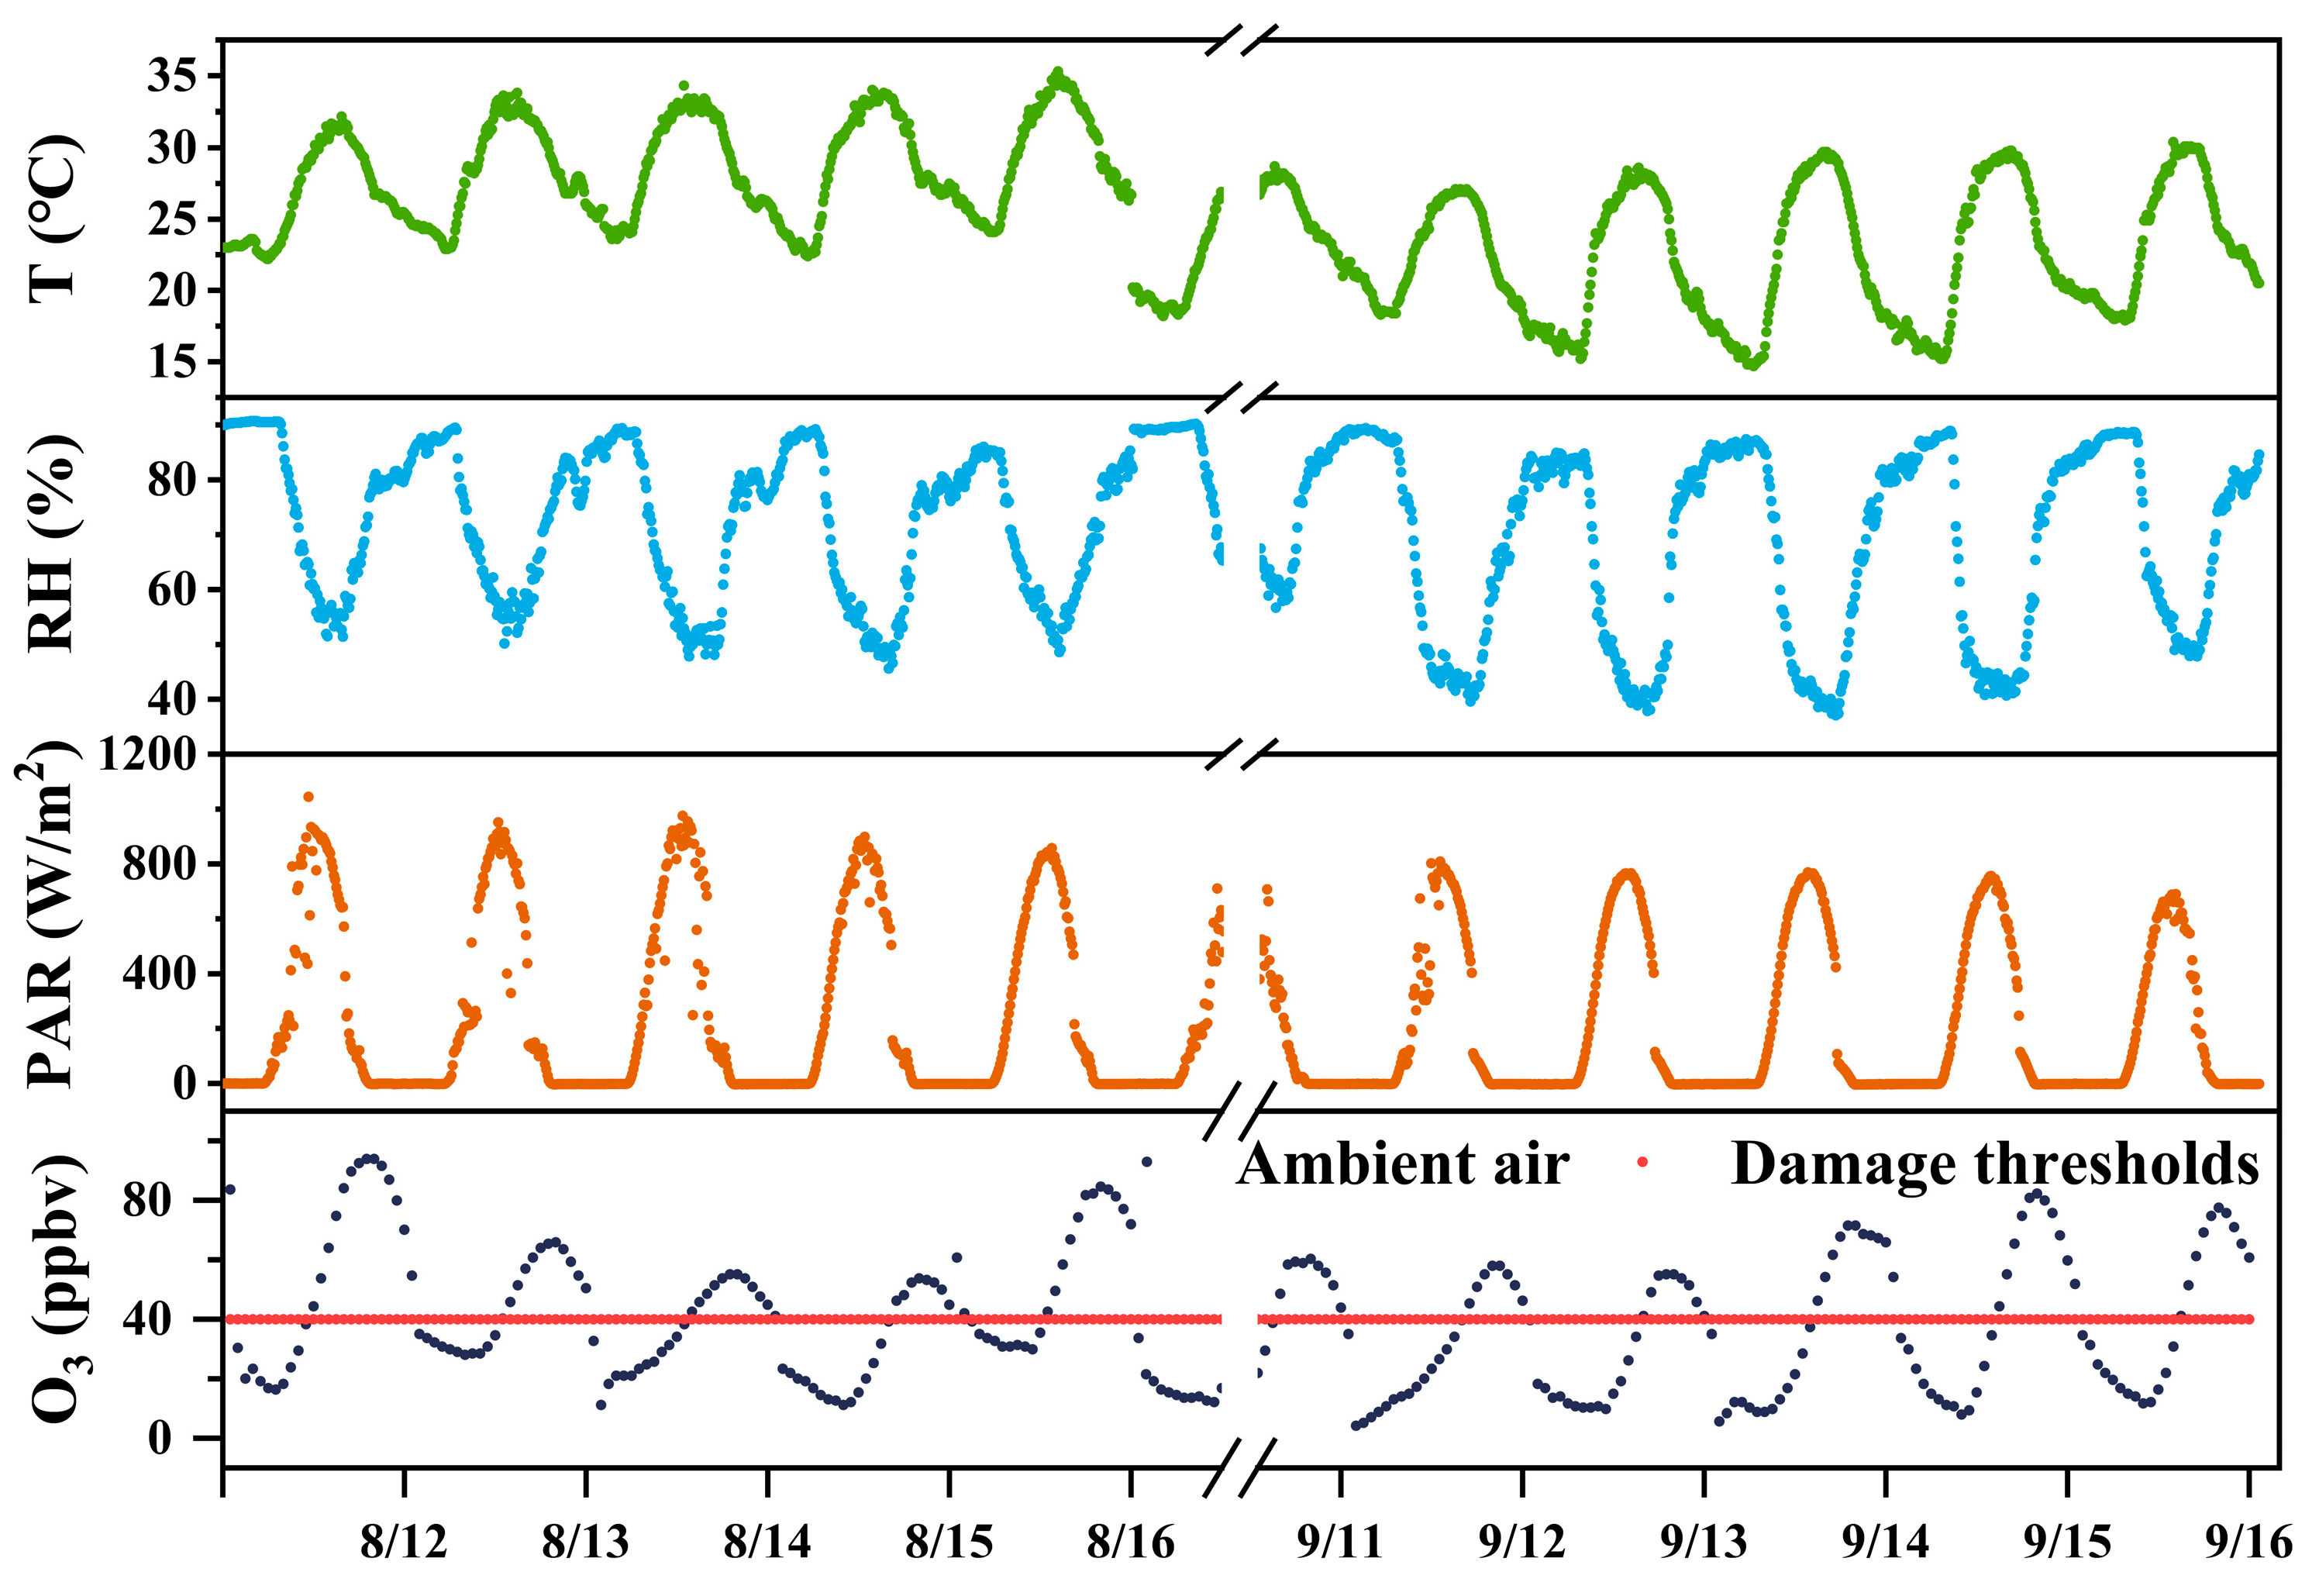
3.1. Ozone Concentration and AOT40

In the process of ozone fumigation, the average temperature of OTCs in CF, NF, NF40 and NF80 treatment groups was 26.33 °C, 28.06 °C, 28.86 °C and 29.27 °C, respectively, and the relative humidity was 84.01%, 83.89%, 82.17% and 80.42% (Table 1). The mean atmospheric temperature was 26.13 °C and the mean relative humidity was 75.71% (Figure 2). The average concentration of O3 in CF, NF, NF40 and NF80 treatment groups was 24.21 ppbv, 36.59 ppbv, 44.75 ppbv and 54.64 ppbv, respectively. The AOT40 of NF, NF40 and NF80 treatment groups were 0.5007 ppm h, 0.8445 ppm h and 1.2823 ppm h, respectively (Table 1).

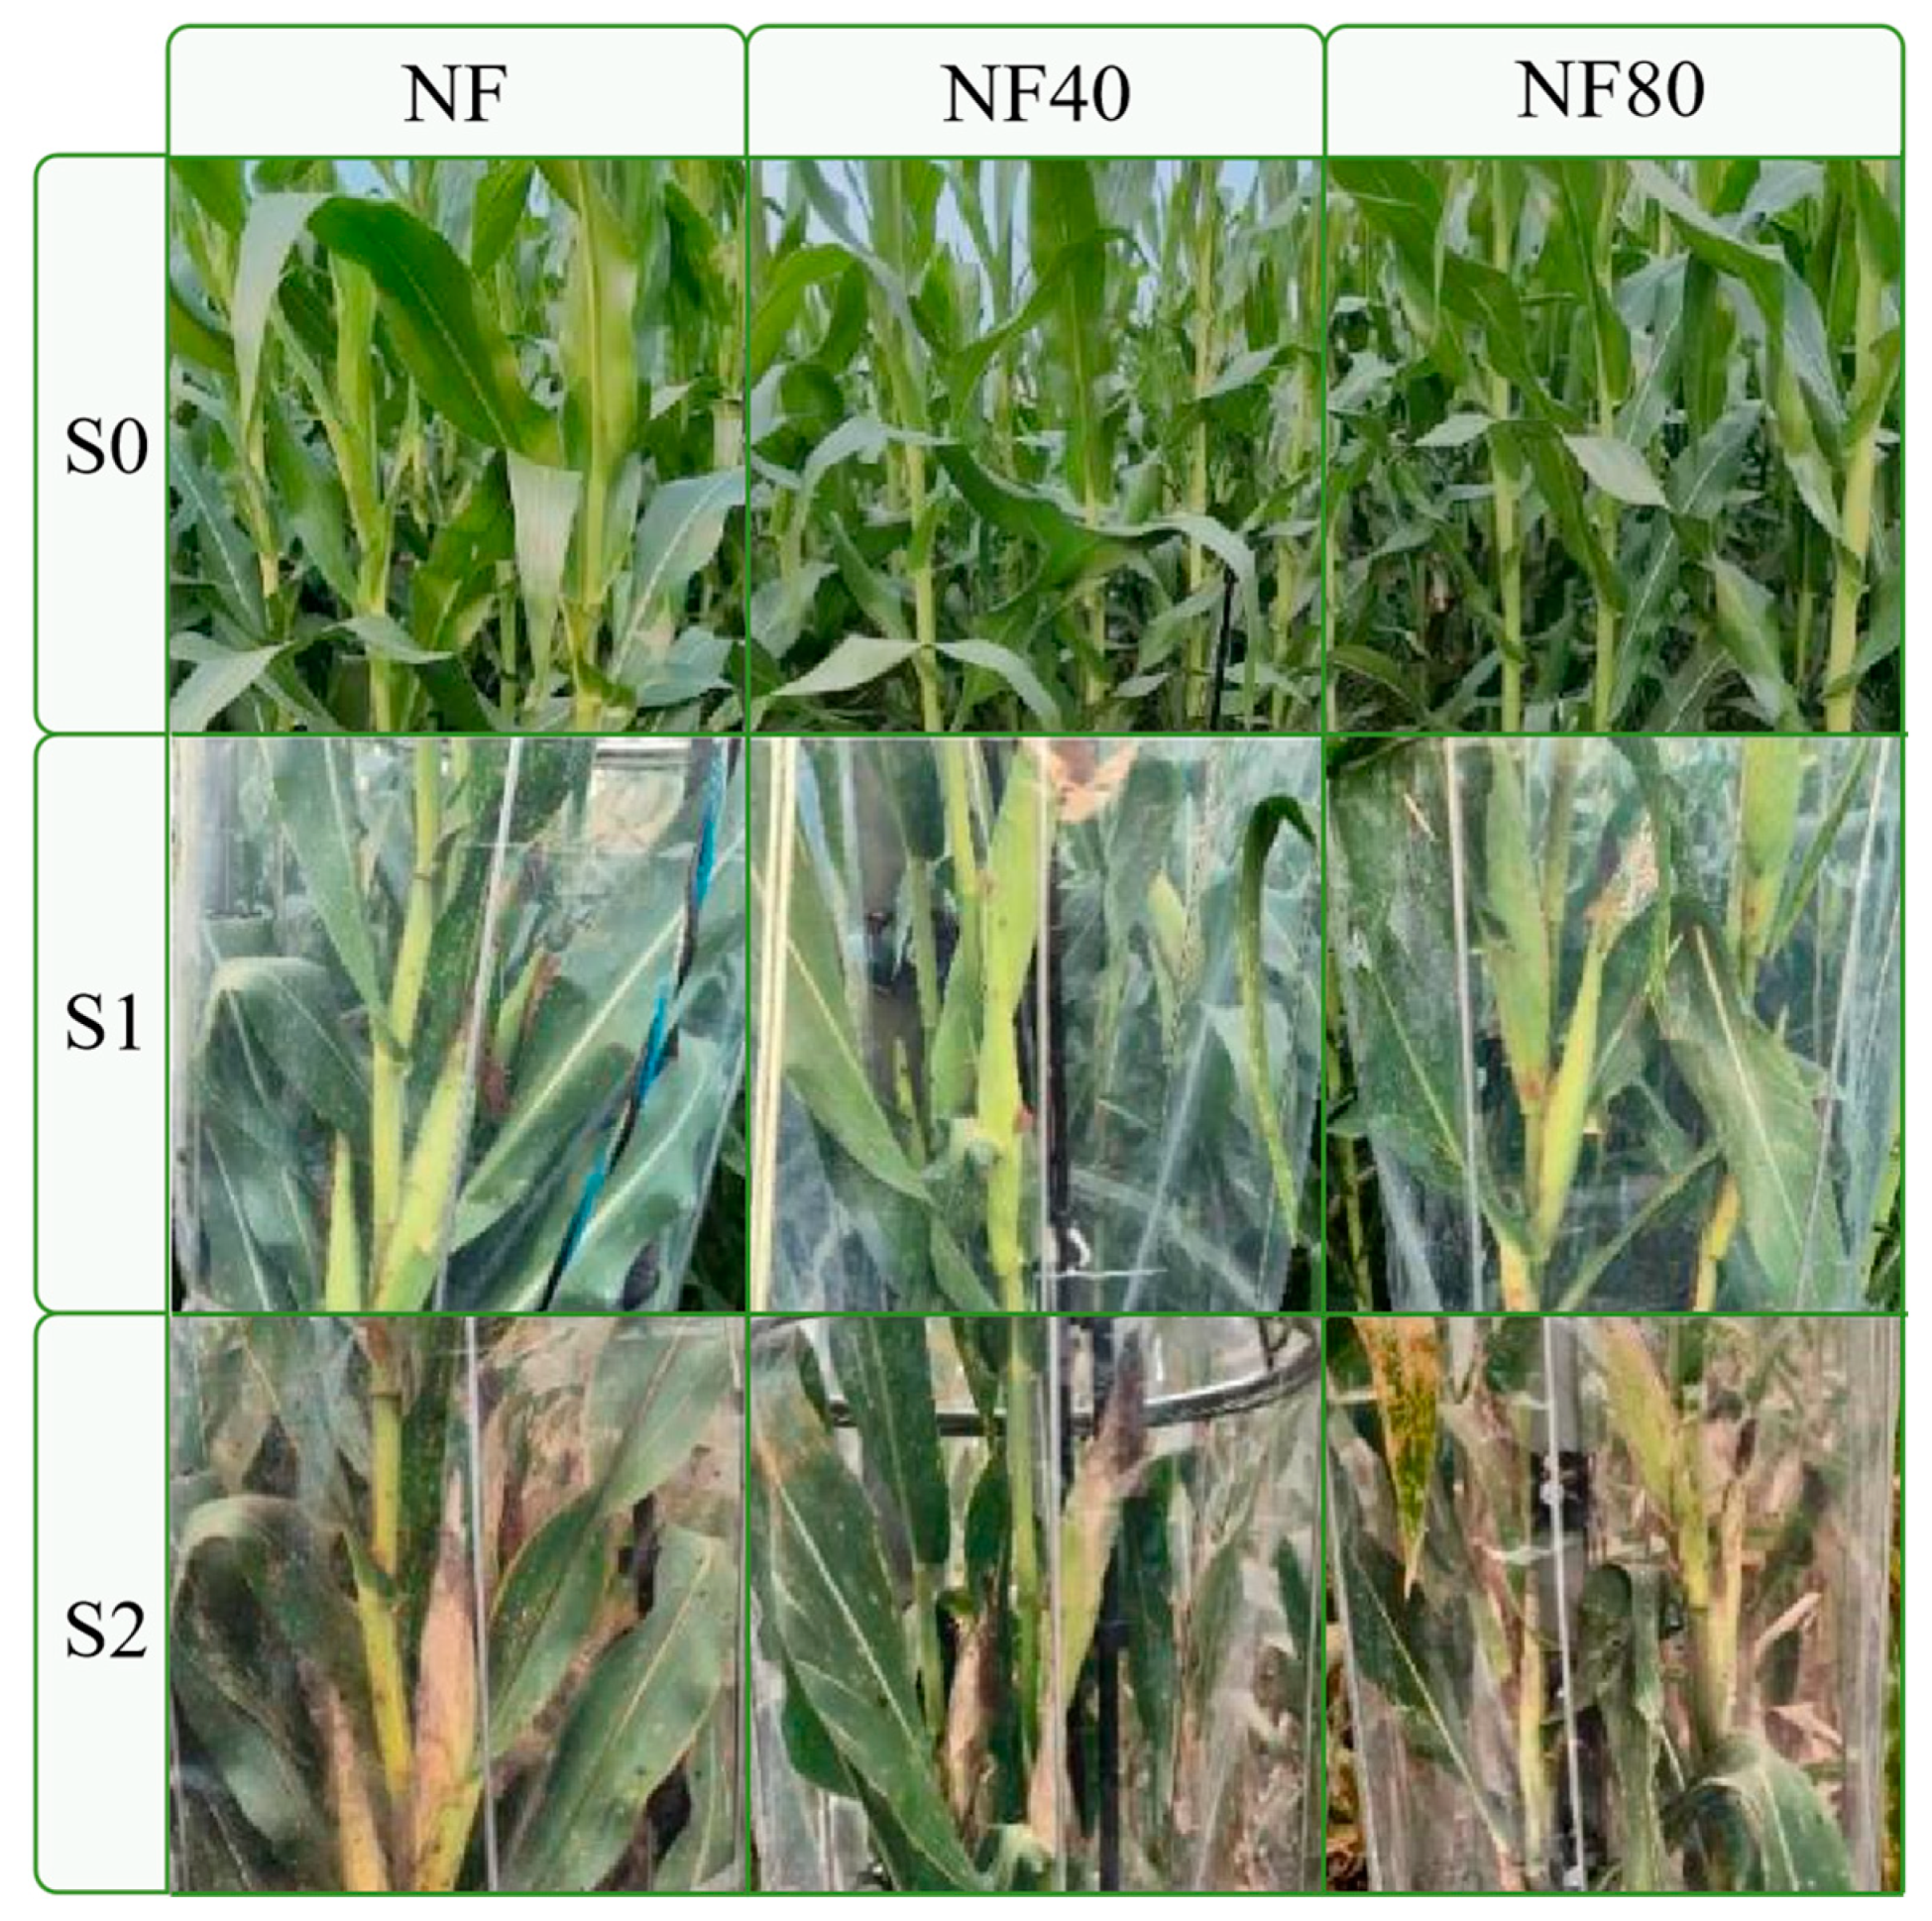
3.2. Visible Leaf Damage

This study found that continuous exposure in August at the silking stage (S1) resulted in round brown spots on the leaves and brown marks on the stalks. The maize in the NF80 suffered the most severe damage, while the maize in the NF and NF40 were in good condition. After ozone fumigation treatment in September at the filling stage (S2), the maize damage increased. The degree of chlorosis was much higher in the NF80 than in the NF40 (Figure 3). The analysis showed that a high concentration of ozone would destroy chlorophyll in maize and cause visible damage to maize.

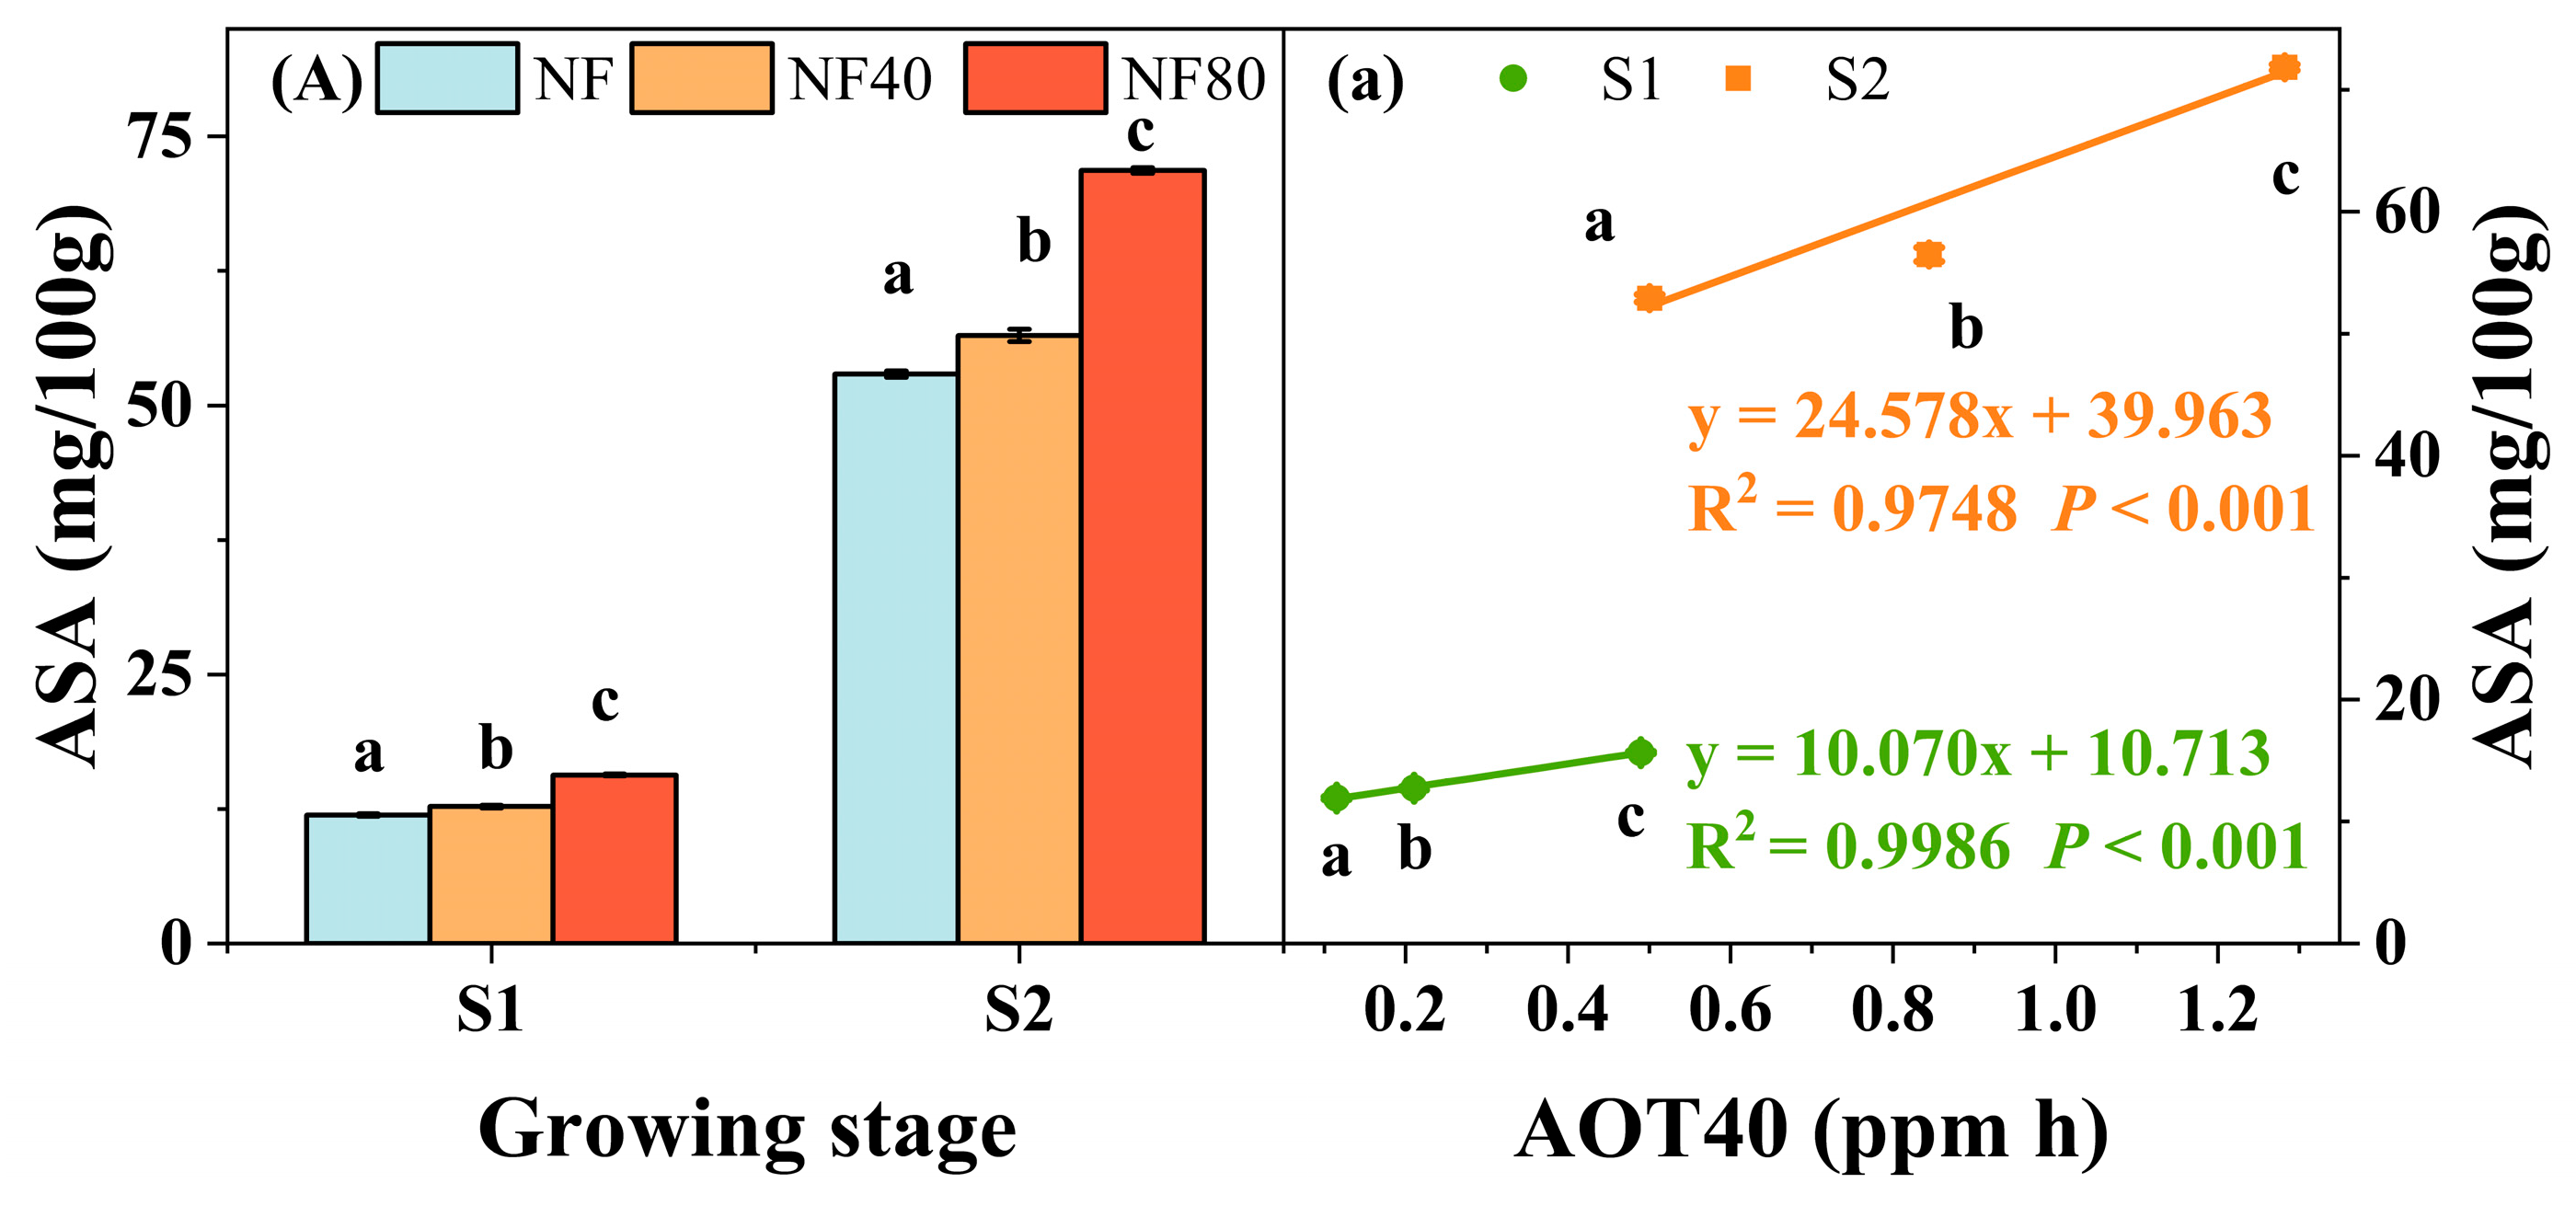
3.3. Physiological Responses of Maize to Elevated O3 Concentrations at Different Growth Stages

The chlorophyll (Chl) content in maize leaves gradually decreased with increasing O3 concentration. The analysis showed that after ozone exposure at the silking stage (S1) in August, the Chl content was reduced by 2.17% in the NF40 and 3.82% in the NF80 compared with NF (Figure 4A). After ozone exposure during the September filling stage (S2), the Chl content was reduced by 0.03% in the NF40, which was less pronounced, and by 4.86% in the NF80 (Figure 4A). The analysis showed that ROS were generated during the diffusion of O3 through the cell gap. The ROS could lead to the decomposition of pigments in the chloroplast cells by destroying the chloroplast cell membrane permeability, resulting in a decrease in Chl content. In turn, the surface of maize leaves emerged with damage symptoms, showing irregular greenish-white spots and yellowing, affecting the normal development of the plant.
The decrease in Chl content in maize leaves was closely related to lipid peroxidation induced by ROS. The level of malondialdehyde (MDA) content reflected the degree of lipid peroxidation. After S1 ozone exposure, the MDA content increased by 32.6% in NF40 and 52.85% in NF80 compared with NF (Figure 4B). After S2 ozone exposure, the MDA content increased by 51.94% in NF40 and 122.56% in NF80 compared with NF (Figure 4B). The analysis showed that high concentrations of ozone led to increased lipid peroxidation in maize, and the higher the concentration of ozone exposure, the more intense the lipid peroxidation. Compared with S1, maize was more sensitive in S2, and the increase in MDA content was more obvious.
Under ozone exposure, the Chl content in maize was significantly negatively correlated with AOT40 (p < 0.01). The decreasing trend of Chl content in the S1 period was greater than that in S2 (Figure 4a). During the filling stage, the analysis indicated that the sensitivity of Chl content in maize was reduced. At the same time, the ASA content increased substantially, providing a positive feedback effect on maize, which in turn affected the sensitivity of Chl and improved the resistance of maize to ozone stress.
During the ozone exposure, the MDA content showed a significant positive correlation with AOT40 (p < 0.01). The slope of the MDA content and the AOT40 exposure dose-response relationship gradually increased in S2 compared with S1 (Figure 4b), indicating that the sensitivities of MDA to the response to O3 were on the rise. In S2, MDA content increased significantly, indicating that a large number of ROS accumulated in plants, resulting in increased lipid peroxidation, thus affecting membrane permeability and accelerating leaf aging [42,43].
Ascorbic acid (ASA) acted as the first cellular barrier to remove ROS from plants. After S1 ozone exposure, ASA content increased by 8.08% in NF40 and 32.37% in NF80 compared with NF (Figure 5A). After S2 ozone exposure, ASA content increased by 7.58% in NF40 and 35.69% in NF80 compared with NF (Figure 5A). To alleviate the degree of lipid peroxidation, the ASA content in maize was increased. The ASA content under high ozone exposure was significantly higher than the other two groups, indicating that high ozone concentration elicited more response from the antioxidant mechanism to cope with the high level of ROS. Furthermore, the ASA level in S2 was much higher than that in S1, suggesting that the antioxidant system of maize responded positively in S2.
During the ozone exposure, the ASA content showed a significant positive correlation with AOT40 (p < 0.01). The slope of the ASA content and the AOT40 exposure dose-response relationship gradually increased in S2 compared with S1 (Figure 5a), indicating that the sensitivities of ASA to the response to O3 were on the rise. In S2, the antioxidant system of maize was more sensitive. The exponential increase in ASA made maize more resistant to ozone and ensured normal growth and development during the critical growth stages.

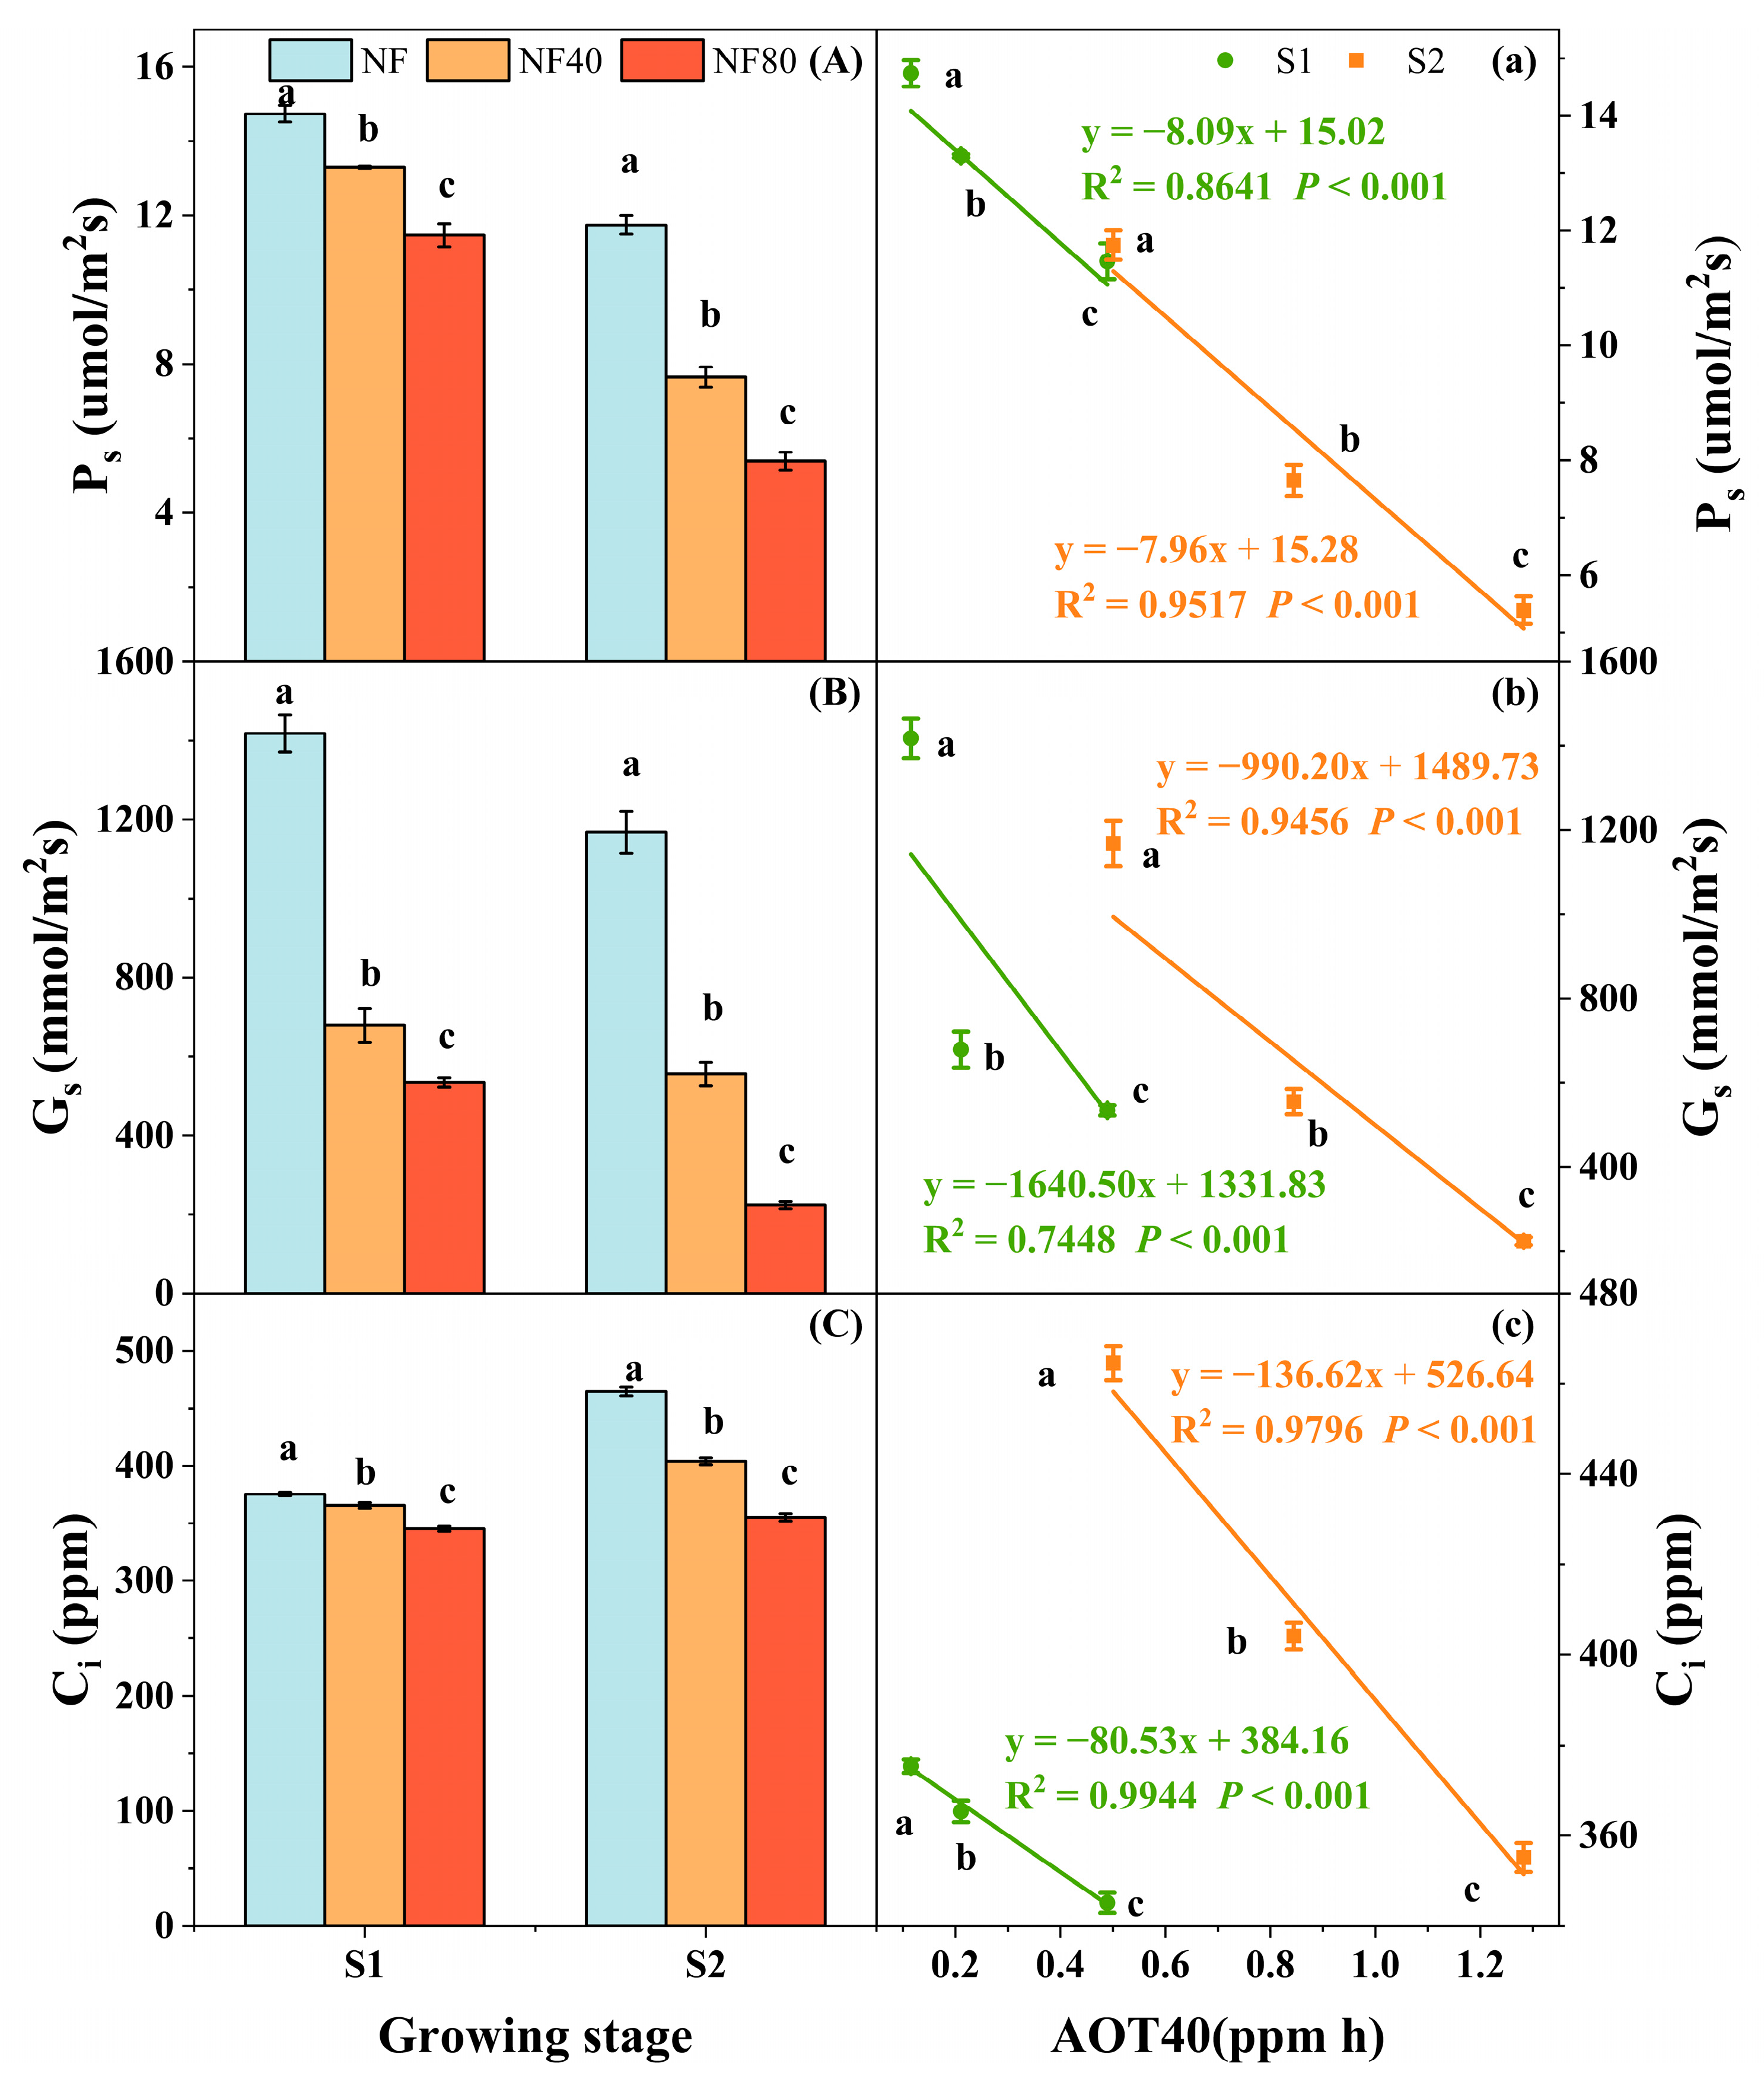
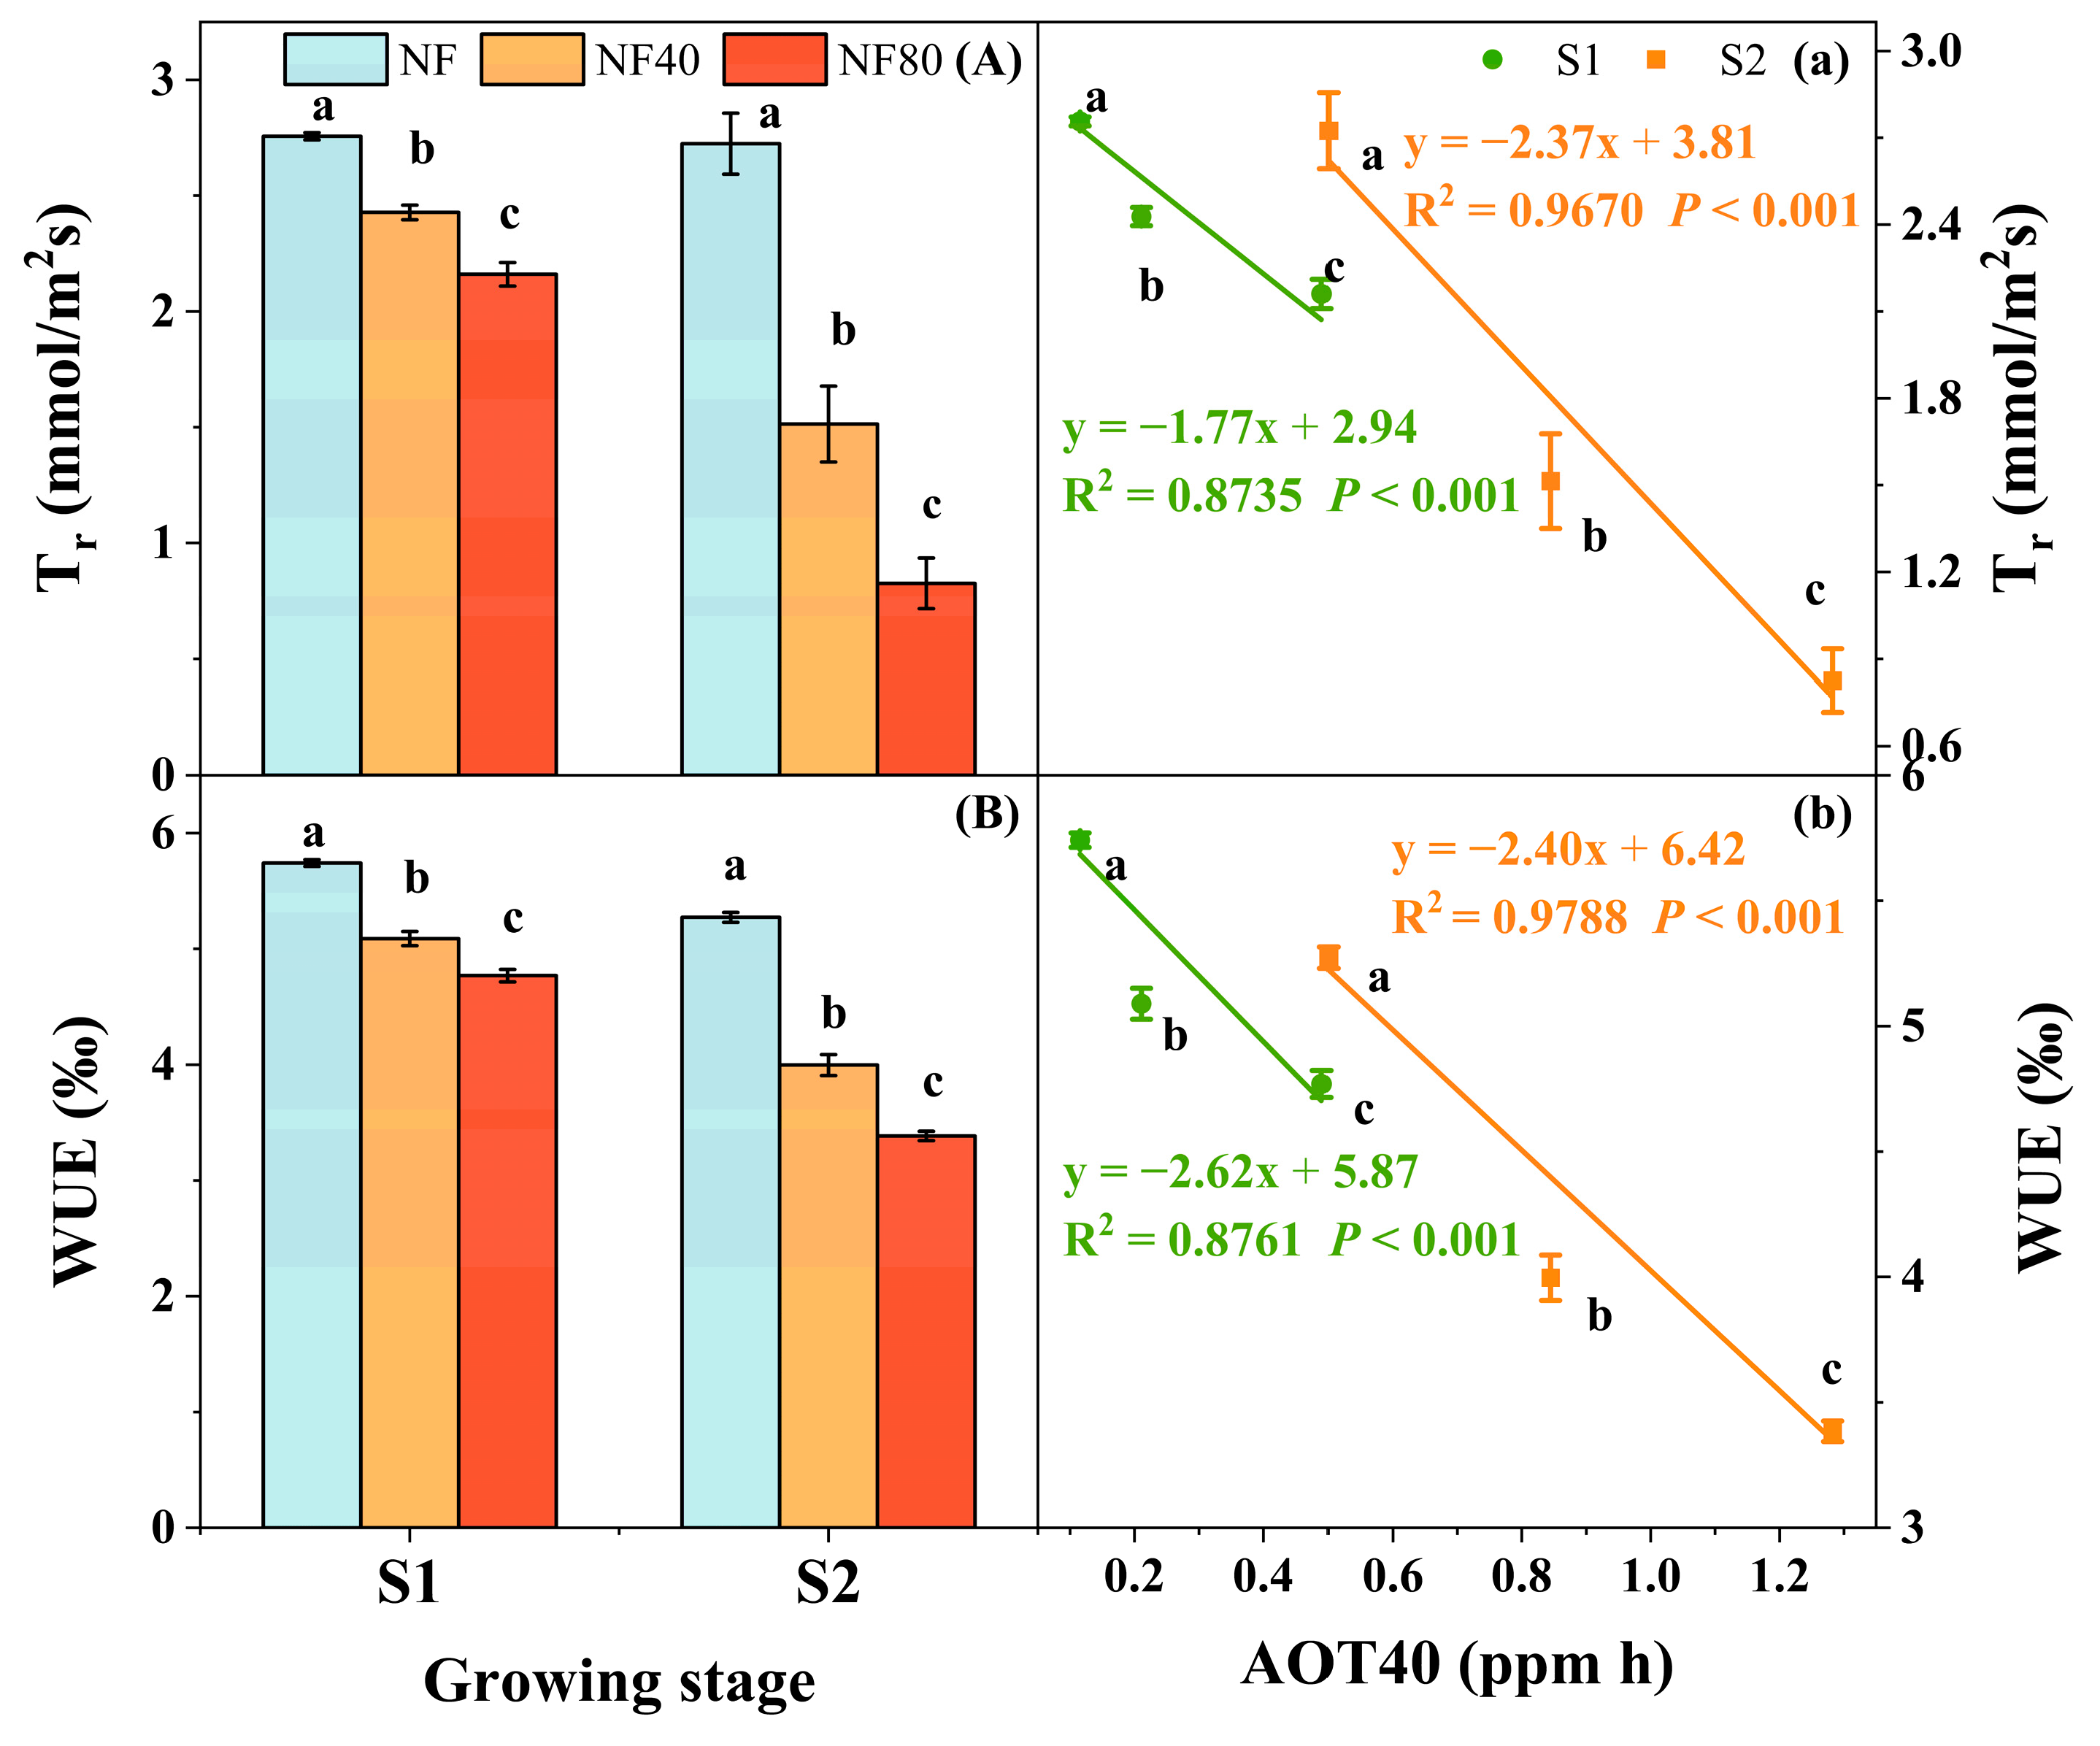
3.4. Photosynthetic Response of Maize to Elevated O3 Concentration at Different Growth Stages

The parameters of photosynthesis had different responses to O3. The photosynthetic rate (Ps) of leaves emerged with different degrees of reduction. After S1 ozone exposure, Ps was reduced by 8.36% in NF40 and 23.28% in NF80 compared with NF (Figure 6A). After S2 ozone exposure, the Ps was significantly reduced by 33.51% in NF40 and 55.28% in NF80 compared to NF (Figure 6A). Thus, it could be seen that O3 exposure can significantly reduce Ps. Ozone disrupted the photosynthetic system of maize, resulting in a decrease in Ps that was not recovered. Different concentrations of ozone exposure had significant effects, with high concentrations of ozone exposure decreasing maize Ps by up to 55.28%.
Stomatal conductance (Gs) not only affected photosynthesis in plants but also indirectly influenced water use efficiency (WUE). After S1 ozone exposure, Gs was significantly reduced by 51.78% in NF40 and 63.02% in NF80 compared with NF (Figure 6B). After S2 ozone exposure, Gs was significantly reduced by 52.57% in NF40 and 80.69% in NF80 compared with NF (Figure 6B). Intercellular carbon dioxide concentrations (Ci) of maize leaves emerged with different degrees of reduction under O3 exposure. After S1 ozone exposure, the Ci reduced by 2.91% in NF40 and 7.96% in NF80 compared with NF (Figure 6C). After S2 ozone exposure, the Ci was significantly reduced by 12.98% in NF40 and 22.83% in NF80 compared with NF (Figure 6C). The decrease in Gs under ozone exposure was extremely significant. Analyses indicated that ROS entered the cytoplasm through water channel proteins and reacted with chloroplasts, mitochondria and peroxidase to generate metabolites. The metabolic or signaling ROS collectively altered the redox state of regulatory proteins. These led to an increase in membrane permeability and closure of defense cell stomata, which in turn reduced water availability and affected Ci.
The Ps, Gs and Ci of maize under ozone exposure showed a significant negative correlation with AOT40 (p < 0.01). Ps, Gs and Ci gradually decreased with the increase in AOT40. The decreasing trend of Ps and Gs of maize in S1 was larger than that in S2, and the analysis showed that the sensitivity of maize’s Ps and Gs was reduced in the filling stage under ozone exposure (Figure 6a,b), which might be due to the action of antioxidant system. The decreasing trend of Ci in maize during the S2 was greater than that during the S1, and the sensitivity of Ci in maize during the filling stage was increased by ozone exposure (Figure 6c).
Prolonged exposure to high ozone concentrations weakened photosynthesis, resulting in stunted plant growth and reduced transpiration rate (Tr). After S1 ozone exposure, the Tr was reduced by 13.28% in NF40 and 19.91% in NF80 compared with NF (Figure 7A). After S2 ozone exposure, Tr was significantly reduced by 48.54% in NF40 and 68.06% in NF80 compared to NF (Figure 7A). It was obvious to see that there was a significant correlation between Tr and Gs, and the decrease in Gs led to the decrease in Tr of maize. Maize WUE in the treatment groups showed different degrees of reduction. After S1 ozone exposure, NF40 and NF80 showed a significant reduction in WUE by 12.84% and 18.08%, when compared with NF (Figure 7B). After S2 ozone exposure, WUE was significantly reduced by 24.51% in NF40 and 35.62% in NF80 compared with NF (Figure 7B). These indicated that the carbon sequestration capacity of maize was affected.
There was a significant negative correlation (p < 0.01) between Tr, WUE and AOT40 in ozone-exposed maize. Tr and WUE decreased significantly with increasing AOT40. The fitted curves showed that the decreasing trend of Tr of maize in S2 was larger than that in S1 (Figure 7a), and the degree of sensitivity increased. The decreasing trend of WUE of maize in S2 was smaller than that in S1, and the degree of sensitivity decreased (Figure 7b). The analysis showed that ozone exposure reduced the carbon sequestration capacity of maize per unit of water consumption capacity and affected maize yield.

4. Discussion

4.1. Physiological Response of Maize to O3 Exposure

Entering the cells through the stomata, O3 generated ROS with various substances in the cells. The ROS wrecked the permeability of the cell membrane, led to the decomposition of intracellular pigments and caused damage to the surface of the leaves, which in turn affected the normal growth and development of the plant body. In this experiment, when maize was exposed to high concentrations of O3, round brown spots appeared on the stalks. With the increase in exposure time, the leaf damage increased and the Chl content decreased significantly. The decrease in photosynthetic pigment content in plants due to ozone exposure has been confirmed by many parties in the study of Peng et al. [44]. The photosynthetic system within the leaves was severely damaged, photosynthesis was weakened and biomass was reduced. And leaf senescence was accelerated, which in turn affected the normal growth and development of maize.
ROS not only induced defense mechanisms and altered physiological processes, but also changed the allocation of carbon sources during plant growth [45]. The level of MDA content reflected the degree of lipid peroxidation, which was an important indicator of the degree of leaf senescence [46]. Many studies have shown that MDA content increases in ozone-exposed plants, thus affecting the extent of lipid peroxidation in the plant body [42,43]. In this study, maize Chl was significantly and negatively correlated with MDA content. The MDA content increased significantly with increasing O3 exposure concentration. At the filling stage, the MDA content was much higher than that at the silking stage, and the response to AOT40 was also more sensitive. ROS in plants could alter cellular redox balance and activate the mitogen-activated protein kinase (MAPK) signaling pathway, which in turn increased the expression of hormone biosynthesis genes and abscisic acid, ethylene, salicylic acid and jasmonic acid hormones. The MAPK signaling cascade could also lead to additional transcriptional responses, including an increase in the expression of genes related to antioxidant metabolism and respiration, as well as a photosynthesis-related decreased gene expression [45]. The analysis showed that maize exposed to high concentrations of O3 during the filling stage resulted in a large accumulation of ROS in the plant, and increased lipid peroxidation, which in turn affected maize photosynthesis.
Under abiotic stress, plant bodies must detoxify elevated ROS to prevent cell membrane damage and protein degradation, including important protein complexes associated with photosynthesis [47]. Plants detoxify ROS mainly by using antioxidants such as superoxide dismutase (SOD), ascorbate–glutathione cycle enzymes and their metabolites and catalase (CAT) [48]. Ascorbic acid (ASA) scavenges ROS in plants and enables them to withstand high levels of O3 stress. In this study, ASA in maize leaves was significantly and positively correlated with AOT40. The ASA content tended to increase after maize was subjected to O3 stress. The analyses showed that the ASA content of maize surged under the high concentration of ozone, which improved the efficiency of scavenging ROS. The significant increase in ASA content during the filling stage indicated that maize was more sensitive to ozone exposure during the critical growth period, which enhanced the resilience of maize to O3 stress.

4.2. Photosynthetic Response of Maize to O3 Exposure

Long-term exposure to high concentrations of ozone affects ROS levels and defense mechanisms in plants, leading to reduced photosynthesis and reduced biomass [49]. Photosynthesis is the main process by which plants accumulate organic matter and maintain plant growth. In this experiment, high concentrations of O3 exposure resulted in significant reductions in photosynthetic indexes and physiological indexes of maize at the silking stages and at the filling stage. Compared with the silking stage, maize at the filling stage was more sensitive to ozone exposure, which was closely related to the MDA content in the plant.
Stomatal factors played an important role in the uptake of O3 by plants, and O3 flux into the plastid was regulated by the rate of stomatal exchange. The number, size and openness of stomatals determined the rate of O3 entering the plastid space. Studies have found that increased O3 concentration leads to decreased Gs in plants. Reduction of Gs affected the entry of CO2 into plant leaves, resulting in a decrease in photosynthesis [50]. However, at the same time, it was also a protective mechanism for the plant body to face the elevated O3 concentration [51]. In this experiment, Gs decreased significantly during both the silking stages and the filling stage. Ci showed a decrease but not significant during the silking stages, while it showed a significant decrease during the filling stage. Under O3 exposure, the Ps was influenced by both stomatal and non-stomatal factors. Peng et al. [44] found that the effects of O3 on maize photosynthesis mainly depended on non-stomatal factors rather than stomatal factors. In this experiment, fumigation was carried out on two growth periods of maize, and due to the short exposure time to ozone, uncoupling was not found in Ps and Gs. The analysis indicated that the main factor affecting Ps in this experiment was Gs.
WUE is an important indicator of carbon sequestration water consumption for plant bodies and is affected by stomata. Improving WUE is conducive to increasing the amount of carbon fixation per unit of water-consuming capacity of plants. In this experiment, Tr and WUE were significantly negatively correlated with AOT40, and the sensitivity of Tr was higher in maize at the filling stage than at the silking stages. Decreases in WUE due to ozone exposure have been observed in other crops such as soybean, rice and wheat [52]. Thus, in areas where water availability was limited, the increase in water requirement per unit of growth of crops affected by elevated ozone concentrations during the filling stages could further impair plant productivity and affect food security.
In studies of ozone stress, stomatal retardation responses had been found in plants exposed to ozone, which exacerbated ozone-induced deleterious effects by limiting CO2 uptake or increasing transpiration [53]. Under prolonged ozone exposure, stomatal retardation became pronounced, which led to uncoupling of Ps and Gs [54] and decreased WUE [55]. Ozone-induced stomatal responses have sufficient potential to significantly alter ecosystem carbon pools. The correlation between Ps, Gs and WUE plays a profoundly decisive role in carbon and water balance in the upcoming scenario of elevated CO2 concentrations and higher temperatures.

5. Conclusions

In this study, we analyzed that (1) with the increase in O3 concentration, the growth and development of maize were inhibited, the yellowing of leaves increased and the Chl content and Ps decreased. (2) During the filling stage, MDA content and ASA content were significantly higher and more sensitive. (3) Ps, Gs and Ci of maize were significantly reduced, indicating that the effect of elevated O3 concentration on Ps was mainly due to the limitation of stomatal factors. Ps, Gs and WUE jointly affected the normal growth and development of maize. WUE and Tr were significantly reduced, resulting in a weakened carbon fixation capacity.
North China is not only an important crop-producing area in China, but also a key layout of petrochemical and organic chemical industries and a large stock of coal-fired boilers. These factors have expanded VOCs and nitrogen oxide emissions, forming a medium- and long-term pressure on ozone control in the region. This study is expected to provide a scientific basis for the effects of ozone pollution on the physiological and biochemical processes of maize in North China. In the future, further in-depth studies can be conducted by combining maize varieties, antioxidant properties, yield and other indicators. The characteristics of the crop’s response to O3 exposures at different growth periods need to be considered in evaluating O3 injury.

Author Contributions

Conceptualization, M.W., S.X., X.L. (Xiaoxiu Lun), Z.H. and J.L.; methodology, M.W., S.X., X.L. (Xiaoxiu Lun), Z.H., X.L. (Xin Liu) and J.L.; software, M.W., S.X., Z.H., X.L. (Xin Liu) and J.L.; validation, X.L. (Xiaoxiu Lun) and J.L.; data curation, M.W., S.X. and X.L. (Xin Liu); writing—original draft preparation, M.W., S.X., X.L. (Xiaoxiu Lun) and J.L.; writing—review and editing, M.W., S.X., X.L. (Xiaoxiu Lun), L.W., T.W. and J.L.; supervision, X.L. (Xiaoxiu Lun); funding acquisition, X.L. (Xiaoxiu Lun) and J.L.; project administration, W.L.; resources, W.L.; visualization, L.W. and T.W. All authors have read and agreed to the published version of the manuscript.

Funding

This study was funded by the National Natural Science Foundation of China (No. 42077454, No. 21976190).

Institutional Review Board Statement

Not applicable.

Informed Consent Statement

Not applicable.

Data Availability Statement

The data presented in this study are contained within this article.

Conflicts of Interest

The authors declare that they have no known competing financial interests or personal relationships that could have appeared to influence the work reported in this paper.

References

  1. Watanabe, K.; Inn, E.C.Y.; Zelikoff, M. Absorption coefficients of oxygen in the vacuum ultraviolet. J. Chem. Phys. 1953, 21, 1021–1030. [Google Scholar] [CrossRef]
  2. Calfapietra, C.; Fares, S.; Manes, F.; Morani, A.; Sgrigna, G.; Loreto, F. Role of Biogenic Volatile Organic Compounds (BVOC) emitted by urban trees on ozone concentration in cites: A review. Environ. Pollut. 2013, 183, 71–80. [Google Scholar] [CrossRef] [PubMed]
  3. Wang, X.; Manning, W.; Feng, Z.; Zhu, Y. Ground-level ozone in China: Distribution and effects on crop yields. Environ. Pollut. 2007, 147, 394–400. [Google Scholar] [CrossRef] [PubMed]
  4. Feng, Z.Z.; Kobayashi, K.; Ainsworth, E.A. Impact of elevated ozone concentration on growth, physiology, and yield of wheat (Triticum aestivum L.): A meta-analysis. Glob. Change Biol. 2008, 14, 2696–2708. [Google Scholar] [CrossRef]
  5. Serengil, Y.; Augustaitis, A.; Bytnerowicz, A.; Grulke, N.; Kozovitz, A.R.; Matyssek, R.; Müller-Starck, G.; Schaub, M.; Wieser, G.; Aydin Coskun, A.; et al. Adaptation of forest ecosystems to air pollution and climate change: A global assessment on research priorities. iForest-Biogeosciences For. 2011, 4, 44–48. [Google Scholar] [CrossRef]
  6. Hassan, I.A.; Bell, N.B.; Ashmore, M.R.; Cotrozzi, L.; Haiba, N.S.; Basahi, J.M. Cultivar-Specific Response to O3: Patterns of Biochemical and Plant Growth Characteristics. Clean Soil Air Water 2018, 46, 6. [Google Scholar] [CrossRef]
  7. Tang, H.; Takigawa, M.; Liu, G.; Zhu, J.; Kobayashi, K. A projection of ozone induced wheat production loss in China and India for the years 2000 and 2020 with exposure-based and flux based approaches. Glob. Change Biol. 2013, 19, 2739–2752. [Google Scholar] [CrossRef] [PubMed]
  8. Vingarzan, R. A review of surface ozone background levels and trends. Atmos. Environ. 2004, 38, 3431–3442. [Google Scholar] [CrossRef]
  9. Sicard, P.; Anav, A.; De Marco, A.; Paoletti, E. Projected global ground level ozone impacts on vegetation under different emission and climate scenarios. Atmos. Chem. Phys. 2017, 17, 12177–12196. [Google Scholar] [CrossRef]
  10. Fuhrer, J.; Skarby, L.; Ashmore, M.R. Critical levels for ozone effects on vegetation in Europe. Environ. Pollut. 1997, 97, 91–106. [Google Scholar] [CrossRef]
  11. Pleijel, H.; Danielsson, H.; Ojanpera, K.; De Temmerman, L.; Hogy, P.; Badiani, M.; Karlsson, P.E. Relationships between ozone exposure and yield loss in European wheat and potato—A comparison of concentration-and flux-based exposure indices. Atmos. Environ. 2004, 38, 2259–2269. [Google Scholar] [CrossRef]
  12. Mills, G.; Hayes, F.; Simpson, D.; Emberson, L.; Norris, D.; Harmens, H.; Buker, P. Evidence of widespread effects of ozone on crops and (semi-)natural vegetation in Europe (1990–2006) in relation to AOT40-and flux-based risk maps. Glob. Change Biol. 2011, 17, 592–613. [Google Scholar] [CrossRef]
  13. Peng, J.L.; Shang, B.; Xu, Y.S.; Feng, Z.Z.; Pleijel, H.; Calatayud, V. Ozone exposure- and flux-yield response relationships for maize. Environ. Pollut. 2019, 252, 1–7. [Google Scholar] [CrossRef] [PubMed]
  14. Feng, Z.; Sun, J.; Wan, W.; Hu, E.; Calatayud, V. Evidence of widespread ozone-induced visible injury on plants in Beijing, China. Environ. Pollut. 2014, 193, 296–301. [Google Scholar] [CrossRef] [PubMed]
  15. Feng, Z.; Hu, E.; Wang, X.; Jiang, L.; Liu, X. Ground-level O3 pollution and its impacts on food crops in China: A review. Environ. Pollut. 2015, 199, 42–48. [Google Scholar] [CrossRef]
  16. Wang, H.X.; Kiang, C.S.; Tang, X.Y.; Zhou, X.J.; Chameides, W.L. Surface ozone: A likely threat to crops in Yangtze delta of China. Atmos. Environ. 2005, 39, 3843–3850. [Google Scholar]
  17. Lu, X.; Zhang, L.; Wang, X.; Gao, M.; Li, K.; Zhang, Y.; Yue, X.; Zhang, Y. Rapid increases in warm-season surface ozone and resulting health impact in China since 2013. Environ. Sci. Technol. 2020, 7, 240–247. [Google Scholar] [CrossRef]
  18. Sun, H.; Zhang, X.; Liu, X.; Liu, X.; Shao, L.; Chen, S.; Wang, J.; Dong, X. Impact of different cropping systems and irrigation schedules on evapotranspiration, grain yield and groundwater level in the North China Plain. Agric. Water Manag. 2019, 211, 202–209. [Google Scholar] [CrossRef]
  19. Feng, Z.Z.; Peng, J.L. Relationship between Relative Crop Yield/Woody Plant Biomass and Groud-level Ozone Pollution in China. Environ. Sci. 2021, 42, 3084–3090. [Google Scholar]
  20. Feng, Z.; Xu, Y.; Kobayashi, K.; Dai, L.; Zhang, T.; Agathokleous, E.; Calatayud, V.; Paoletti, E.; Mukherjee, A.; Agrawal, M.; et al. Ozone pollution threatens the production of major staple crops in East Asia. Nat. Food 2022, 3, 47–56. [Google Scholar] [CrossRef]
  21. Xin, Y.; Shang, B.; Chen, X.L.; Feng, Z.Z. Effects of elevated ozone and nitrogen deposition on photosynthetic characteristics and biomass of Populus cathayana. Environ. Sci. 2016, 37, 3642–3649. [Google Scholar]
  22. Xu, Y.; Feng, Z.; Shang, B.; Dai, L.; Uddling, J.; Tarvainen, L. Mesophyll conductance limitation of photosynthesis in poplar under elevated ozone. Sci. Total Environ. 2019, 657, 136–145. [Google Scholar] [CrossRef] [PubMed]
  23. Hoshika, Y.; Fares, S.; Pellegrini, E.; Conte, A.; Paoletti, E. Water use strategy affects avoidance of ozone stress by stomatal closure in Mediterranean trees-A modelling analysis. Plant Cell Environ. 2020, 43, 611–623. [Google Scholar] [CrossRef] [PubMed]
  24. Castagna, A.; Ranieri, A. Detoxification and repair process of ozone injury: From O3 uptake to gene expression adjustment. Environ. Pollut. 2009, 157, 1461–1469. [Google Scholar] [CrossRef] [PubMed]
  25. Ranieri, A.; Castagna, A.; Pacini, J.; Baldan, B.; Mensuali Sodi, A.; Soldatini, G.F. Early production and scavenging of hydrogen peroxide in the apoplast of sunflower plants exposed to ozone. J. Exp. Bot. 2003, 54, 2529–2540. [Google Scholar] [CrossRef] [PubMed]
  26. Zhou, K.Q.; Feng, Y. Influence of ozone to the growth of cultivating vegetables in guangzhou. J. Huazhong Agric. Univ. 2001, 20, 344–347. [Google Scholar]
  27. Fiscus, E.L.; Booker, F.L.; Burkey, K.O. Crop responses to ozone: Uptake, modes of action, carbon assimilation and partitioning. Plant Cell Environ. 2005, 28, 997–1011. [Google Scholar] [CrossRef]
  28. Huang, Y.Y.; Huang, Y.Z.; Li, Q.X.; Huang, S.J.; Tang, G.F.; Lin, J.H. Physiological and foliar symptom response of Pinus massoniana, Eucalyptus urophylla and Aglaia odorata to ozone in southern China. Ecol. Environ. 2006, 15, 674–681. [Google Scholar]
  29. Jin, M.H.; Feng, Z.W.; Zhang, F.Z. Effects of ozone on membrane lipid peroxidation and antioxidant system of rice leaves. Environ. Sci. 2000, 21, 1–5. [Google Scholar]
  30. Xie, J.Q. The Impacts and Defence of O3 on Crop in Site. Master’s Thesis, Northwest A&F University, Xianyang, China, 2006. [Google Scholar]
  31. Dai, L.L.; Kobayashi, K.; Nouchi, I.; Masutomi, Y.; Feng, Z.Z. Quantifying determinants of ozone detoxification by apoplastic ascorbate in peach (Prunus persica) leaves using a model of ozone transport and reaction. Glob. Change Biol. 2020, 26, 3147–3162. [Google Scholar] [CrossRef]
  32. Yu, H.; Chen, Z.; Cao, J.X.; Shang, H. Effects of elevated O3 level on photosynthesis, antioxidant capacity and biomass of Phoebe zhennan and Phoebe bournei seedlings in subtropical China. For. Res. 2018, 31, 33–41. [Google Scholar]
  33. Feng, Z.Z.; Uddling, J.; Tang, H.Y.; Zhu, J.G.; Kobayashi, K. Comparison of crop yield sensitivity to ozone between open-top chamber and free-air experiments. Glob. Change Biol. 2018, 24, 2231–2238. [Google Scholar] [CrossRef] [PubMed]
  34. Zhao, X.P. Growth stage division and growth and development characteristics of maize. Mod. Anim. Husb. Sci. Technol. 2014, 4, 85. [Google Scholar]
  35. Wilkinson, S.; Mills, G.; Illidge, R.; Davies, W.J. How is ozone pollution reducing our food supply? J. Exp. Bot. 2012, 63, 527–536. [Google Scholar] [CrossRef] [PubMed]
  36. Mandle, R.H. A cylindrical open-top chamber for the exposure of plants to air pollutants in the field. J. Environ. Qual. 1973, 15, 371–376. [Google Scholar] [CrossRef]
  37. Kobayashi, K.; Okada, M. Effects of ozone on the light use of rice (Oryza sativa L.) plants. Agric. Ecosyst. Environ. 1995, 53, 1–12. [Google Scholar] [CrossRef]
  38. Paoletti, E. Ozone impacts on forests. CAB reviews: Perspectives in agriculture, veterinary science. Nutr. Nat. Resour. 2007, 2, 13. [Google Scholar]
  39. Yao, F.F.; Wang, X.K.; Chen, Z.; Feng, Z.Z.; Zheng, Q.W.; Duan, X.N.; Ouyang, Z.Y.; Feng, Z.W. Response of photosynthesis, growth and yield of field-grown winter wheat to ozone exposure. J. Plant Ecol. 2008, 32, 212–219. [Google Scholar]
  40. Feng, Z.; Wang, X.; Zheng, Q.; Feng, Z.; Xie, J.; Chen, Z. Response of gas exchange of rape to ozone concentration and exposure regimes. Acta Ecol. Sin. 2006, 26, 823–829. [Google Scholar] [CrossRef]
  41. Li, C.C.; Zhang, Z.R.; Song, X.X.; Kong, J.J.; Han, Y.; Ruan, Y.N. Effects of Ozone Stress on Antioxidant Metabolism and Reproductive Growth of Soybean. Ecol. Environ. Sci. 2022, 31, 1383–1392. [Google Scholar]
  42. Sachdev, S.; Ansari, S.A.; Ansari, M.I.; Fujita, M.; Hasanuzzaman, M. Abiotic stress and reactive oxygen species: Generation, signaling, and defense mechanisms. Antioxidants 2021, 10, 277. [Google Scholar] [CrossRef]
  43. Chaudhary, I.J.; Rathore, D. Effects of ambient and elevated ozone on morphophysiology of cotton (Gossypium hirsutum L.) and its correlation with yield traits. Environ. Technol. Innov. 2022, 25, 102146. [Google Scholar] [CrossRef]
  44. Peng, J.L.; Shang, B.; Xu, Y.; Feng, Z.Z.; Calatayud, V. Effects of ozone on maize (Zea mays L.) photosynthetic physiology, biomass and yield components based on exposure- and flux-response relationships. Environ. Pollut. 2020, 256, 113466. [Google Scholar] [CrossRef] [PubMed]
  45. Ainsworth, E.A. Understanding and improving global crop response to ozone pollution. Plant J. 2017, 90, 886–897. [Google Scholar] [CrossRef] [PubMed]
  46. Zheng, Q.W.; Wang, X.K.; Feng, Z.Z.; Song, W.Z.; Feng, Z.W. Ozone effects on chlorophyll content and lipid peroxidation in the in situ leaves of winter wheat. Acta Bot. Boreali-Occident. Sin. 2005, 25, 2240–2244. [Google Scholar]
  47. Kobayashi, K. Role of membrane glycerolipids in photosynthesis, thylakoid biogenesis and chloroplast development. J. Plant Res. 2016, 129, 565–580. [Google Scholar] [CrossRef]
  48. De Carvalho, K.; De Campos, M.K.F.; Domingues, D.S.; Pereira, L.F.P.; Vieira, L.G.E. The accumulation of endogenous proline induces changes in gene expression of several antioxidant enzymes in leaves of transgenic Swingle citrumelo. Mol. Biol. Rep. 2013, 40, 3269–3279. [Google Scholar] [CrossRef]
  49. Emberson, L.D.; Pleijel, H.; Ainsworth, E.A.; Van den Berg, M.; Ren, W.; Osborne, S.; Mills, G.; Pandey, D.; Dentener, F.; Büker, P.; et al. Ozone effects on crops and consideration in crop models. Eur. J. Agron. 2018, 100, 19–34. [Google Scholar] [CrossRef]
  50. Marzuoli, R.; Monga, R.; Finco, A.; Gerosa, G. Biomass and physiological responses of Quercus robur (L.) young trees during 2 years of treatments with different levels of ozone and nitrogen wet deposition. Trees 2016, 30, 1995–2010. [Google Scholar] [CrossRef]
  51. Vahisalu, T.; Puzõrjova, I.; Brosché, M.; Valk, E.; Lepiku, M.; Moldau, H.; Pechter, P.; Wang, Y.-S.; Lindgren, O.; Salojärvi, J.; et al. Ozone-triggered rapid stomatal response involves the production of reactive oxygen species, and is controlled by SLAC1 and OST1. Plant J. 2010, 62, 442–453. [Google Scholar] [CrossRef]
  52. Barnes, J.D.; Pfirrmann, T. The influence of CO2 and O3, singly and in combination, on gas exchange, growth and nutrient status of radish. New Phytol. 1992, 121, 403–412. [Google Scholar] [CrossRef] [PubMed]
  53. Hoshika, Y.; Katata, G.; Deushi, M.; Watanabe, M.; Koike, T.; Paoletti, E. Ozone-induced stomatal sluggishness changes carbon and water balance of temperate deciduous forests. Sci. Rep. 2015, 5, 9871. [Google Scholar] [CrossRef] [PubMed]
  54. Paoletti, E.; Grulke, N.E. Ozone exposure and stomatal sluggishness in different plant physiognomic classes. Environ. Pollut. 2010, 158, 2664–2671. [Google Scholar] [CrossRef] [PubMed]
  55. Hoshika, Y.; Fares, S.; Savi, F.; Gruening, C.; Goded, I.; De Marco, A.; Paoletti, E. Stomatal conductance models for ozone risk assessment at canopy level in two Mediterranean evergreen forests. Agric. For. Meteorol. 2017, 234, 212–221. [Google Scholar] [CrossRef]
Figure 1. Open dynamic chamber system: (1) air inlet, (2) air distribution ring, (3) fan, (4) temperature, humidity and light probe, (5) sampling port, (6) electromagnetic relay, (7) flow meter, (8) diaphragm pump, (9) sampling tube, (10) leaf photosynthesizer, (11) ozone analyzer, (12) ozone generator).
Atmosphere 15 00639 g001
Figure 2. Time series of temperatures (T), relative humidity (RH), photosynthetically active radiation (PAR) and ozone concentration of the environment.
Atmosphere 15 00639 g002
Figure 3. Visible injury symptoms of maize leaves at different concentrations of O3. From left to right were NF, NF40 and NF80, and from top to bottom were the untreated period (S0), after ozone exposure in August during the silking stage (S1), and after ozone exposure in September during the filling stage (S2).
Atmosphere 15 00639 g003
Figure 4. Effect of elevated O3 concentration on maize chlorophyll (Chl) (A) and malondialdehyde (MDA) (B). Effect of AOT40 on maize chlorophyll (Chl) (a) and malondialdehyde (MDA) (b). (Letters at the top of the columns in the figure indicate the results of the significance analysis; different lowercase letters indicate significant differences (p < 0.05). Data in graphs are means ± standard deviation (N = 3).)
Atmosphere 15 00639 g004
Figure 5. Effect of elevated O3 concentration on maize ascorbic acid (ASA) (A). Effect of AOT40 on maize ascorbic acid (ASA) (a). (Letters at the top of the columns in the figure indicate the results of the significance analysis; different lowercase letters indicate significant differences (p < 0.05). Data in graphs are means ± standard deviation (N = 3).)
Atmosphere 15 00639 g005
Figure 6. Effect of O3 exposure on photosynthetic rate (Ps) (A), stomatal conductance (Gs) (B) and intercellular carbon dioxide concentration (Ci) (C) in maize. Effect of AOT40 on photosynthetic rate (Ps) (a), stomatal conductance (Gs) (b) and intercellular carbon dioxide concentration (Ci) (c) in maize. (Letters at the top of the columns in the figure indicate the results of the significance analysis; different lowercase letters indicate significant differences (p < 0.05). Data in graphs are means ± standard deviation (N = 3).)
Atmosphere 15 00639 g006
Figure 7. Effect of O3 exposure on transpiration rate (Tr) (A) and water use efficiency (WUE) (B) in maize. Effect of AOT40 on transpiration rate (Tr) (a) and water use efficiency (WUE) (b) in maize. (Letters at the top of the columns in the figure indicate the results of the significance analysis; different lowercase letters indicate significant differences (p < 0.05). Data in graphs are means ± standard deviation (N = 3).)
Atmosphere 15 00639 g007
Table 1. Meteorological data for ozone treatment groups CF, NF, NF40, NF80.
O3 treatmentsCFNFNF40NF80
T (℃)26.3328.0628.8629.27
RH (%)84.0183.8982.1780.42
PAR (W/m2)457.81461.92461.92453.06
AOT40 (ppm h)-0.50070.84451.2823
Disclaimer/Publisher’s Note: The statements, opinions and data contained in all publications are solely those of the individual author(s) and contributor(s) and not of MDPI and/or the editor(s). MDPI and/or the editor(s) disclaim responsibility for any injury to people or property resulting from any ideas, methods, instructions or products referred to in the content.

