Next Issue
Volume 15, July
Previous Issue
Volume 15, May


Atmosphere, Volume 15, Issue 6 (June 2024) – 120 articles

Cover Story (view full-size image): 
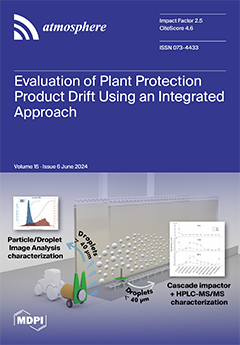
Although Plant Protection Products play a fundamental role nowadays, atmosphere contamination can easily occur due to wind drift. Using the correct spray nozzle, together with other practices, can reduce the drift and guarantee better performances. As such, our aim was to characterize the spray erogated by a conventional hollow cone nozzle and an anti-drift air inclusion nozzle mounted on a full-scale orchard sprayer in a 10 × 6 × 30 m (H × L × W) wind tunnel. Large droplets (>40 μm) were studied using Particle/Droplet Image Analysis, while smaller droplets (40–0.056 μm) were first sampled with a multi-stage cascade impactor and then analyzed with an HPLC-MS/MS analytical technique. View this paper
  • Issues are regarded as officially published after their release is announced to the table of contents alert mailing list.
  • You may sign up for e-mail alerts to receive table of contents of newly released issues.
  • PDF is the official format for papers published in both, html and pdf forms. To view the papers in pdf format, click on the "PDF Full-text" link, and use the free Adobe Reader to open them.
Order results
Result details
Section
Select all
Export citation of selected articles as:
14 pages, 3133 KiB  
Article
The Effects of Different Sowing Dates on the Autumn Development and Yield of Winter Wheat in Central Lithuania
by Arvydas Kanapickas, Ilona Vagusevičienė and Gintarė Sujetovienė
Atmosphere 2024, 15(6), 738; https://doi.org/10.3390/atmos15060738 - 20 Jun 2024
Viewed by 215
Abstract
Sowing date is a particularly important management option to optimize yields as it determines proper wintering and productivity. During a seven-year field experiment, the response of winter wheat to five different sowing times was studied. The beginning of the dormancy period was determined, [...] Read more.
Sowing date is a particularly important management option to optimize yields as it determines proper wintering and productivity. During a seven-year field experiment, the response of winter wheat to five different sowing times was studied. The beginning of the dormancy period was determined, and the Growing Degree Day (GDD) requirements for the period from sowing to emergence and from emergence to dormancy were assessed. As the sowing date was delayed, the time from sowing to emergence increased. The minimum optimum temperature during the emergence period was about 12 °C, with a heat requirement of about 125–130 GDD for earlier sowings, ensuring that winter wheat germinated successfully and properly prepared for wintering. The heat requirement for later sowings was higher and reached about 180 GDD when the average temperature of this period was about 8 °C. For the late sowing, the period from emergence to dormancy was too short, so winter wheat did not accumulate the required amount of heat, which had a significant impact on yield. The accumulated temperature from emergence to dormancy must be greater than 100 GDD. The obtained values can be applied in other regions or to choose the appropriate wheat sowing time to reduce yield losses under climate change. Full article
(This article belongs to the Special Issue Influence of Weather Conditions on Agriculture)
Show Figures

Figure 1

16 pages, 3461 KiB  
Article
Assessment of Atmospheric Particles Flux Variation on the Different Underlying Surfaces (Grasslands and Forest) in the Lake Baikal Region
by Tumen S. Balzhanov, Alexander S. Zayakhanov, Galina S. Zhamsueva, Vadim V. Tcydypov and Ayuna L. Dementeva
Atmosphere 2024, 15(6), 737; https://doi.org/10.3390/atmos15060737 - 20 Jun 2024
Viewed by 221
Abstract
In this study, the new data of experimental studies of the atmospheric particulate matter (PM) on the south-eastern coast of Lake Baikal (station Boyarsky) were analyzed in summer 2021. High-altitude measuring sites were arranged in the forest massif (mast, 16 m) and above [...] Read more.
In this study, the new data of experimental studies of the atmospheric particulate matter (PM) on the south-eastern coast of Lake Baikal (station Boyarsky) were analyzed in summer 2021. High-altitude measuring sites were arranged in the forest massif (mast, 16 m) and above the meadow vegetation (mast, 30 m). By the Giardina M. model and based on the measurements data the calculations of the deposition flux density of aerosol particles on forest and meadow vegetation were made. Our preliminary results of prediction obtained by Giardina M. model good agrees with measured dry deposition velocities across particle sizes. In the forest, the mass concentration of aerosol particles differs slightly from the mass concentrations in the grasslands and is equal on average 7.9 × 10⁻³ mg m−3 for the size particles below 200 nm (PM0.2) and 6.7 × 10⁻⁴ mg m−3 for particles in the size range from 0.2 to 10 μm (PM0.2–10). However, we found that mass flux density of aerosol particle is almost 4.8 times higher under forest canopy than in meadow vegetation. In addition, the leaf area index (LAI), which characterize the effective area of particle deposition, is also significantly higher in the tree canopy (5.6) compared to the grassland vegetation (2.4). Full article
(This article belongs to the Section Air Quality)
Show Figures

Graphical abstract

19 pages, 16259 KiB  
Article
Analysis of Spatial and Temporal Changes in FVC and Their Driving Forces in the Inner Mongolia Section of the Yellow River Basin
by Danni He, Yong Wang, Dengji Wang, Yahui Yang, Wenya Fang and Yu Wang
Atmosphere 2024, 15(6), 736; https://doi.org/10.3390/atmos15060736 - 20 Jun 2024
Viewed by 137
Abstract
To investigate the spatial and temporal changes in fractional vegetation coverage (FVC) and their driving forces in different regions of the Inner Mongolia section of the Yellow River Basin, this paper observed the spatial trends and stability of FVC in these regions based [...] Read more.
To investigate the spatial and temporal changes in fractional vegetation coverage (FVC) and their driving forces in different regions of the Inner Mongolia section of the Yellow River Basin, this paper observed the spatial trends and stability of FVC in these regions based on the MOD13Q1 information regarding the 2000–2020 period as a data source. It used the dimidiate pixel model to invert FVC, and based on the centre of gravity migration model, the coefficient of variation and the Mann–Kendall and Sen’s slope estimator test, it studied the spatial variation trend and stability of FVC in the four relevant areas of the Inner Mongolia section; an attribution analysis using a geodetector was also conducted. The following results were found: (1) in terms of temporal FVC change in the relevant areas, from 2000 to 2020, the overall FVC showed an increasing trend, indicating an obvious hierarchy of change as per different seasonal scales (summer > growing season > fall > spring). There is a mutation point in FVC in different areas, and the FVC sequence is random. (2) Regarding spatial change, the overall FVC showed a trend of being high in the eastern regions and low in the western regions and low–high–low from the north to the south; the stability of the Hetao Irrigation District–Wuliangsuhai Area changed more significantly with the successive seasons, and the degraded areas of FVC were mainly distributed in the city centre of the Kundulun River–Daheihe River Area and in the Hetao Irrigation District in the summer. (3) In terms of driving factors, soil type had a relatively higher explanatory power regarding the Hetao Irrigation District–Wuliangsuhai Area, rainfall had a relatively higher explanatory power regarding the Morin River–Wuding River Area and the Kundulun River–Daheihe River Area, and land use had a relatively higher explanatory power regarding the Ten Kongtui–Heidaigou Area. Full article
Show Figures

Figure 1

17 pages, 5725 KiB  
Article
A GPU-Implemented Lattice Boltzmann Model for Large Eddy Simulation of Turbulent Flows in and around Forest Shelterbelts
by Yansen Wang, Xiping Zeng, Jonathan Decker and Leelinda Dawson
Atmosphere 2024, 15(6), 735; https://doi.org/10.3390/atmos15060735 - 20 Jun 2024
Viewed by 362
Abstract
Using porous wind barriers for the microclimate modification of agricultural lands, urban areas, and surrounding roads is a ubiquitous practice. This study establishes a new method for numerically modeling the turbulent flow in and around forest shelterbelts using an advanced multiple-relaxation-time lattice Boltzmann [...] Read more.
Using porous wind barriers for the microclimate modification of agricultural lands, urban areas, and surrounding roads is a ubiquitous practice. This study establishes a new method for numerically modeling the turbulent flow in and around forest shelterbelts using an advanced multiple-relaxation-time lattice Boltzmann model (MRTLBM). A detailed description is presented for a large eddy simulation (LES) of turbulent winds by implementing barrier element drag force in the MRTLBM framework. The model results for a forest shelterbelt are compared with a field observational dataset. The study indicated that our implementation of drag force in MRTLBM is an accurate method for modeling turbulent flows in and around forest patches. Sensitivity analyses of turbulent flow related to the shelterbelt structure parameters and wind directions are also carried out. The analysis indicated that the optimal wind shelter effect in reducing the mean wind speed and turbulent kinetic energy is maximized using a narrow, medium porosity shelterbelt, with the wind direction perpendicular to the shelterbelt. These conclusions are in agreement with other observational and modeling studies. Finally, the computational time of a central processing unit (CPU) and graphics processing unit (GPU) was compared for a large domain with 25 million grids to demonstrate the MRTLBM advantage of LES in regards to computational speed with a mixed forest and building environment. The GPU is approximately 300 times faster than a CPU, and real-time simulation for this large domain is achieved using the Nvidia V100 GPU. Full article
(This article belongs to the Section Atmospheric Techniques, Instruments, and Modeling)
Show Figures

Figure 1

18 pages, 4271 KiB  
Article
Long Short-Term Memory Recurrent Network Architectures for Electromagnetic Field Reconstruction Based on Underground Observations
by Yixing Tian, Chengliang Xie and Yun Wang
Atmosphere 2024, 15(6), 734; https://doi.org/10.3390/atmos15060734 - 20 Jun 2024
Viewed by 256
Abstract
Deep underground laboratories offer advantages for conducting high-precision observations of weak geophysical signals, benefiting from a low background noise level. Enhancing strong, noisy ground electromagnetic (EM) field data using synchronously recorded underground EM signals, which typically exhibit a high signal-to-noise ratio, is both [...] Read more.
Deep underground laboratories offer advantages for conducting high-precision observations of weak geophysical signals, benefiting from a low background noise level. Enhancing strong, noisy ground electromagnetic (EM) field data using synchronously recorded underground EM signals, which typically exhibit a high signal-to-noise ratio, is both valuable and feasible. In this study, we propose an EM field reconstruction method employing a Long Short-Term Memory (LSTM) recurrent neural network with referenced deep underground EM observations. Initially, a deep learning model was developed to capture the time-varying features of underground multi-component EM fields using the LSTM recurrent neural network. Subsequently, this model was applied to process synchronously observed strong, noisy data from other conventional observation systems, such as those at the surface, to achieve noise suppression through signal reconstructions. Both the theoretical analysis and the practical observational data suggest that the proposed method effectively suppresses noise and reconstructs clean EM signals. This method is efficient and time-saving, representing an effective approach to fully utilizing the advantages of deep underground observation data. Furthermore, this method could be extended to the processing and analysis of other geophysical data. Full article
Show Figures

Graphical abstract

22 pages, 3644 KiB  
Article
Investigating the Effect of Fine Particulate Matter (PM2.5) Emission Reduction on Surface-Level Ozone (O3) during Summer across the UK
by Lydia Curley, Rayne Holland, M. Anwar H. Khan and Dudley E. Shallcross
Atmosphere 2024, 15(6), 733; https://doi.org/10.3390/atmos15060733 - 19 Jun 2024
Viewed by 233
Abstract
UK air pollutant data collected over a 10-year period (2010–2019) from 46 sites with Urban Traffic, Urban Background, Suburban Background, Rural Background, and Urban Industrial environmental types were analysed to study the relationships between [NO] vs. [PM2.5] and [O3] [...] Read more.
UK air pollutant data collected over a 10-year period (2010–2019) from 46 sites with Urban Traffic, Urban Background, Suburban Background, Rural Background, and Urban Industrial environmental types were analysed to study the relationships between [NO] vs. [PM2.5] and [O3] vs. [PM2.5] during the summer for each site type. These results were used to describe the consequence of recent PM2.5 reductions on NO and O3 concentrations at different site types across the UK. The strongest positive [NO] vs. [PM2.5] correlation was observed for the Urban Traffic site type overall, but it displayed the weakest positive [O3] vs. [PM2.5] correlation. Analysis of individual Urban Traffic sites revealed an overall negative [O3] vs. [PM2.5] gradient at the London Marylebone Road (LMR) site. A sharp 35% PM2.5 decrease occurred at LMR between 2011 and 2015 before annual mean concentrations plateaued. Further examination of annual correlations revealed negative [O3] vs. [PM2.5] gradients in each year directly proceeding the sharp 35% PM2.5 decrease at LMR. NOx fluctuations were minimal and accompanied by comparable volatile organic compound (VOC) decreases; thus, VOC-limited chemistry at LMR was deemed to not be the primary cause of O3 increases. Instead, PM2.5 reductions are suggested to be a more significant factor in causing O3 increases, as suppression of O3 production by PM2.5 chemistry decreases with declining [PM2.5]. The remaining two Urban Traffic sites in Birmingham did not display a negative [O3] vs. [PM2.5] correlation in the years studied. This was partly ascribed to the Birmingham measurement sites not being under the influence of the street canyon effect like LMR. Principal attribution was to the lower-average absolute initial PM2.5 concentrations and absence of a significant (>26%) continuous mean PM2.5 decline of greater than 2 years. This study therefore proposed a threshold initial PM2.5 concentration (t) above which O3 suppression by PM2.5 chemistry is sufficient to induce O3 increases when average PM2.5 concentrations significantly decline (by >26% across >2 years), where 17 μg m−3 < t < 26 μg m−3. Extending this analysis to additional cities across the UK as sufficient data become available would allow refinement of the proposed threshold and improved understanding of the influence from the street canyon effect. These results inform future air pollution policies, in the UK and across the globe, in which further joint reductions of PM2.5 and O3 are crucial to achieve maximum benefits to human health. Full article
(This article belongs to the Special Issue Air Quality in the UK (2nd Edition))
Show Figures

Figure 1

13 pages, 3786 KiB  
Article
Characteristics of the Evolution of Precipitation Particles during a Stratiform Precipitation Event in Liupan Mountains
by Yujun Qiu, Nansong Feng, Ying He, Rui Xu and Danning Zhao
Atmosphere 2024, 15(6), 732; https://doi.org/10.3390/atmos15060732 - 19 Jun 2024
Viewed by 228
Abstract
This study utilizes comprehensive observational data from a stratiform mixed-cloud precipitation event in Liupan Mountains, combined with ground-based millimeter-wave cloud radar (CR), micro rain radar (MRR), and microwave radiometer (MR) data, to study the evolution characteristics and conversion efficiency of precipitation particles in [...] Read more.
This study utilizes comprehensive observational data from a stratiform mixed-cloud precipitation event in Liupan Mountains, combined with ground-based millimeter-wave cloud radar (CR), micro rain radar (MRR), and microwave radiometer (MR) data, to study the evolution characteristics and conversion efficiency of precipitation particles in the ice–water mixed layer, melting layer, and below these layers during the formation and dissipation of precipitation. The results show the following: (1) When precipitation particles occupy more than 20% of cloud layers detected by cloud radar, the ice–water mixed cloud layer descends and evolves into a precipitating cloud. (2) During surface precipitation periods, the proportion of raindrops forming precipitation was equivalent to that of small-scale precipitation particles in the cloud layers. The proportion of precipitation particles in the cloud layers with temperatures below 0 °C averaged 25%. Ice-phase particles within the bright band (BB) melted, coalesced, and grew into larger precipitation particles, increasing their proportion to 55%. (3) After surface precipitation ended, the water content and precipitation rate of the cloud layer were 60% and 52% of those during the precipitation process, respectively. The proportion of small-scale precipitation particles in the cloud layers was approximately half of that during the precipitation period. A large number of evaporated small-scale precipitation particles floated in the air layer below the clouds, occupying less than 6.0% of the cloud layers. Full article
(This article belongs to the Special Issue Cloud Remote Sensing: Current Status and Perspective)
Show Figures

Figure 1

12 pages, 1288 KiB  
Article
Modelling Smell Events in Urban Pittsburgh with Machine and Deep Learning Techniques
by Andreas Gavros, Yen-Chia Hsu and Kostas Karatzas
Atmosphere 2024, 15(6), 731; https://doi.org/10.3390/atmos15060731 - 19 Jun 2024
Viewed by 270
Abstract
By deploying machine learning (ML) and deep learning (DL) algorithms, we address the problem of smell event modelling in the Pittsburgh metropolitan area. We use the Smell Pittsburgh dataset to develop a model that can reflect the relation between bad smell events and [...] Read more.
By deploying machine learning (ML) and deep learning (DL) algorithms, we address the problem of smell event modelling in the Pittsburgh metropolitan area. We use the Smell Pittsburgh dataset to develop a model that can reflect the relation between bad smell events and industrial pollutants in a specific urban territory. The initial dataset resulted from crowd-sourcing citizen reports using a mobile phone application, which we categorised in a binary matter (existence or absence of smell events). We investigate the mapping of smell data with air pollution levels that were recorded by a reference station located in the southeastern area of the city. The initial dataset is processed and evaluated to produce an updated dataset, which is used as an input to assess various ML and DL models for modelling smell events. The models utilise a set of air quality and climate data to associate them with a smell event to investigate to what extent these data correlate with unpleasant odours in the Pittsburgh metropolitan area. The model results are satisfactory, reaching an accuracy of 69.6, with ML models mostly outperforming DL models. This work also demonstrates the feasibility of combining environmental modelling with crowd-sourced information, which may be adopted in other cities when relevant data are available. Full article
Show Figures

Figure 1

15 pages, 7840 KiB  
Article
Prediction of Permafrost Subgrade Thawing Settlement in the Qinghai–Tibet Engineering Corridor under Climate Warming
by Jine Liu, Xiaona Liu, Jianbing Chen, Yue Zhai, Yu Zhu and Fuqing Cui
Atmosphere 2024, 15(6), 730; https://doi.org/10.3390/atmos15060730 - 19 Jun 2024
Viewed by 303
Abstract
As a result of global warming, the thawing settlement disasters of permafrost in the Qinghai–Tibet Engineering Corridor (QTEC) have intensified, which has serious effects on the safe operation of permafrost highway engineering. In this work, a prediction model for the thawing depth of [...] Read more.
As a result of global warming, the thawing settlement disasters of permafrost in the Qinghai–Tibet Engineering Corridor (QTEC) have intensified, which has serious effects on the safe operation of permafrost highway engineering. In this work, a prediction model for the thawing depth of permafrost subgrade in the QTEC under the climate warming scenario was established. Based on the survey results of permafrost ice content along the QTEC and the classification of thawing settlement risks, the zoning characteristics of thawing settlement of permafrost subgrade in the QTEC were obtained and analyzed. The results showed that the thawing depth of permafrost underlying the 26 m width subgrade in the QTEC will mainly remain below 9 m, and the area with a thawing depth of 6~9 m will have the widest spread within the next 20 years. The thawing settlement will be between 0.02 m and 5.45 m, with an average value of about 0.93 m after 20 years. Furthermore, after 50 years, the thawing depth of permafrost underlying the 26 m width subgrade will almost always be greater than 9 m, and the average thawing settlement will be about 1.12 m. Within the next 20 to 50 years, the risk of permafrost subgrade thawing settlement in the QTEC will be the most significant risk type, and this effect will mainly be distributed in the Kunlun Mountains, Chumar River Plain, Kekexili Mountains, Beiluhe Basin, Tanggula Mountains and intermountain Basins. Full article
(This article belongs to the Special Issue Research about Permafrost–Atmosphere Interactions)
Show Figures

Figure 1

21 pages, 4050 KiB  
Article
Fiber Lidar for Control of the Ecological State of the Atmosphere
by Sergei N. Volkov, Nikolai G. Zaitsev, Sun-Ho Park, Duk-Hyeon Kim and Young-Min Noh
Atmosphere 2024, 15(6), 729; https://doi.org/10.3390/atmos15060729 - 18 Jun 2024
Viewed by 262
Abstract
Methods and means of remote control of the ecological state of the atmosphere are constantly improving. Lidar sensing allows obtaining up-to-date information about natural and technogenic sources of atmospheric pollution. There is a wide range of problems in ecological control, where the deployment [...] Read more.
Methods and means of remote control of the ecological state of the atmosphere are constantly improving. Lidar sensing allows obtaining up-to-date information about natural and technogenic sources of atmospheric pollution. There is a wide range of problems in ecological control, where the deployment of an inexpensive mobile lidar network is required. For this purpose, it is suggested to use Q-switch and MOPA fiber lasers in lidars. Q-switch fiber lasers have a simpler design and are more practical to use. However, pulses from Q-switch lasers have long full-pulse durations. In the present work, a lidar signal inversion method (LSIM) is proposed for solving this problem. Verification and outdoor experimentation of the LSIM was carried out with the reference signal method (RSM). The advantage of the proposed RSM is the minimum number of controllable parameters necessary for LSIM verification and approbation. As a result, the accuracy of the obtained results increased. Thus, the possibility of application of the Q-switch fiber lasers for lidar sensing is shown both theoretically and experimentally. Full article
Show Figures

Figure 1

18 pages, 11359 KiB  
Article
Study of Quality Control Methods Utilizing IRMCD for HY-2B Data Assimilation Application
by Jiazheng Hu, Yu Zhang, Jianjun Xu, Jiajing Li, Duanzhou Shao, Qichang Tan and Junjie Feng
Atmosphere 2024, 15(6), 728; https://doi.org/10.3390/atmos15060728 - 18 Jun 2024
Viewed by 260
Abstract
Quality control (QC) of HaiYang-2B (HY-2B) satellite data is mainly based on the observation process, which remains uncertain for data assimilation (DA). The data in operation have not been widely used in numerical weather prediction. To ensure HY-2B data meet the theoretical assumptions [...] Read more.
Quality control (QC) of HaiYang-2B (HY-2B) satellite data is mainly based on the observation process, which remains uncertain for data assimilation (DA). The data in operation have not been widely used in numerical weather prediction. To ensure HY-2B data meet the theoretical assumptions for DA applications, the iterated reweighted minimum covariance determinant (IRMCD) QC method was studied in HY-2B data based on the typhoon “Chanba”. The statistical results showed that most of the outliers were eliminated, and the observation increment distribution of the HY-2B data after QC (QCed) was closer to a Gaussian distribution than the raw data. The kurtosis and skewness of the QCed data were much closer to zero. The QCed track demonstrated the lowest accumulated error and the best intensity in typhoon assimilation, and the QCed intensity was closest to the observation during the nearshore enhancement, exhibiting the strongest intensity among the experiment. Further analysis revealed that the improvement was accompanied by a significant reduction in vertical wind shear during the nearshore enhancement of the typhoon. The QCed moisture flux divergence and vertical velocity in the upper layer increased significantly, which promoted the upward transport of momentum in the lower layers and contributed to the maintenance of the typhoon’s barotropic structure. Compared with the assimilation of raw data, the effective removal of outliers using the IRMCD algorithm significantly improved the simulation results for typhoons. Full article
Show Figures

Figure 1

14 pages, 5468 KiB  
Article
Spatiotemporal Modeling of Carbon Fluxes over Complex Underlying Surfaces along the North Shore of Hangzhou Bay
by Kaidi Zhang, Min Zhao, Zhenyu Zhao, Xucheng Shen, Yanyu Lu and Jun Gao
Atmosphere 2024, 15(6), 727; https://doi.org/10.3390/atmos15060727 - 17 Jun 2024
Viewed by 323
Abstract
Urban areas contribute to over 80% of carbon dioxide emissions, and considerable efforts are being undertaken to characterize spatiotemporal variations of CO2 (carbon dioxide) at a city, regional, and national level, aiming at providing pipelines for carbon mission reduction. The complex underlying [...] Read more.
Urban areas contribute to over 80% of carbon dioxide emissions, and considerable efforts are being undertaken to characterize spatiotemporal variations of CO2 (carbon dioxide) at a city, regional, and national level, aiming at providing pipelines for carbon mission reduction. The complex underlying surface composition of urban areas makes process-based and physiology-based models inadequate for simulating carbon flux in this context. In this study, long short-term memory (LSTM), support vector machine (SVM), random forest (RF), and artificial neural network (ANN) were employed to develop and investigate their viability in estimating carbon flux at the ecosystem level. All the data used in our study were derived from the long-term chronosequence observations collected from the flux towers within urban complex underlying surface, along with meteorological reanalysis datasets. To assess the generalization ability of these models, the following statistical metrics were utilized: coefficient of determination (R2), root mean square error (RMSE), and mean absolute error (MAE). Our analysis revealed that the RF model performed the best in simulating carbon flux over long time series, with the highest R2 values reaching up to 0.852, and exhibiting the smallest RMSE and MAE values at 0.293 μmol·m−2·s−1 and 0.157 μmol·m−2·s−1. As a result, the RF model was chosen for simulating carbon flux at spatial scale and assessing the impact of urban impervious surfaces in the simulation. The results showed that the RF model performs well in simulating carbon flux at the spatial scale. The input of impervious surface area index can improve the performance of the RF model in simulating carbon flux, with R2 values of 84.46% (with the impervious surface area index in) and 83.74% (without the impervious surface area index in). Furthermore, the carbon flux in Fengxian District, Shanghai, exhibited significant spatial heterogeneity: the CO2 flux in the western part of Fengxian District was less than in the eastern part, and the CO2 flux gradually increased from the west to the east. In addition, we creatively introduced the diurnal impervious surface area index based on the Kljun model, and clarified the influence of impervious surface on the spatiotemporal simulation of CO2 flux over the complex urban underlying surface. Based on these findings, we conclude that the RF models can be effectively applied for estimating carbon flux on the complex underlying urban surface. The results of our study reduce the uncertainty in modeling carbon cycling in terrestrial ecosystems, and make the variety of models for the carbon cycling of terrestrial ecosystems more diverse. Full article
Show Figures

Figure 1

16 pages, 4507 KiB  
Article
Rainfall Estimation Model in Seasonal Zone and Non-Seasonal Zone Regions Using Weather Radar Imagery Based on a Gradient Boosting Algorithm
by Maulana Putra, Mohammad Syamsu Rosid and Djati Handoko
Atmosphere 2024, 15(6), 726; https://doi.org/10.3390/atmos15060726 - 17 Jun 2024
Viewed by 262
Abstract
Indonesia, a country located in the equatorial region with hilly and valley lands surrounded by vast oceans, has complex rainfall patterns that can generally be classified into three types: equatorial, monsoon, and local. Rainfall estimates have only been derived based on local data [...] Read more.
Indonesia, a country located in the equatorial region with hilly and valley lands surrounded by vast oceans, has complex rainfall patterns that can generally be classified into three types: equatorial, monsoon, and local. Rainfall estimates have only been derived based on local data and characteristics so far, and have not yet been developed based on universal data for all of Indonesia. This study aimed to develop a rainfall estimation model based on weather radar data throughout Indonesia using ensemble machine learning with the gradient boosting algorithm. The proposed rainfall estimation model is universal, can be applied to different rainfall pattern areas, and has a temporal resolution of 10 min. It is based on determining the root mean square error (RMSE) and R-squared (R2) values. Research was conducted in six areas with different rainfall patterns: Bandar Lampung and Banjarmasin with monsoon rain patterns, Pontianak and Deli Serdang with equatorial rain patterns, and the Gorontalo and Biak areas with local rain patterns. The analysis of the proposed model reveals that the best hyperparameters for the learning rate, maximum depth, and number of trees are 0.7, 3, and 50, respectively. The results demonstrate that the estimated rainfall in the six areas was very accurate, with RMSE < 2 mm/h and R2 > 0.7. Full article
(This article belongs to the Section Meteorology)
Show Figures

Figure 1

16 pages, 2846 KiB  
Article
Study on the Health Effect of Temperature on Cardiovascular and Cerebrovascular Diseases in Haikou City
by Mingjie Zhang, Shaowu Lin, Yajie Zhang and Jinghong Zhang
Atmosphere 2024, 15(6), 725; https://doi.org/10.3390/atmos15060725 - 17 Jun 2024
Viewed by 231
Abstract
Research on the impact of temperature in tropical regions on the risk of cardiovascular and cerebrovascular diseases was limited. The aim of the study was to investigate this topic using Haikou, a tropical city, as the research area. Outpatient data on cardiovascular and [...] Read more.
Research on the impact of temperature in tropical regions on the risk of cardiovascular and cerebrovascular diseases was limited. The aim of the study was to investigate this topic using Haikou, a tropical city, as the research area. Outpatient data on cardiovascular and cerebrovascular diseases (CVD and CeVD) from Hainan Provincial People’s Hospital during 2016–2018 (total of 77,820) and meteorological and air-quality data were used to establish a distributed-lag nonlinear model (DLNM) based on the nested generalized addition model (GAM) of meteorological elements. The results revealed the impact on the risk of CVD and CeVD was mainly due to the cold effect, which significantly lagged behind. The thermal effect had a strong impact on the onset of CVD and CeVD on the day of high temperature. Males were easily affected by low temperatures, while females were the opposite. The lag period of the working-age group affected by low temperatures was longer and greater than that of the elderly group. The high-temperature effect only had an impact on the working-age group. The lag effect of low temperatures on the risk of hypertension was the greatest. These results can provide technical support for carrying out meteorological forecasting, warning, and services for individuals with CVD and CeVD, suggesting attaching importance to health protection for special populations. Full article
(This article belongs to the Section Biometeorology)
Show Figures

Figure 1

26 pages, 7611 KiB  
Article
Numerical Analysis of the Effects of Different Window-Opening Strategies on the Indoor Pollutant Dispersion in Street-Facing Buildings
by Yongjia Wu, Yilian Ouyang, Tianhao Shi, Zhiyong Li and Tingzhen Ming
Atmosphere 2024, 15(6), 724; https://doi.org/10.3390/atmos15060724 - 17 Jun 2024
Viewed by 361
Abstract
The idling of automobiles at street intersections can lead to pollutant accumulation which impacts the health of residents in street-facing buildings. Previous research focused on pollutant dispersion within street canyons and did not consider the coupling of indoor and outdoor pollutants. This paper [...] Read more.
The idling of automobiles at street intersections can lead to pollutant accumulation which impacts the health of residents in street-facing buildings. Previous research focused on pollutant dispersion within street canyons and did not consider the coupling of indoor and outdoor pollutants. This paper employs the computational fluid dynamics (CFD) method to simulate the dispersion characteristics of vehicle emission pollutants in street canyons, primarily investigating the indoor and outdoor pollutant dispersion patterns under various window opening configurations (single-sided ventilation, corner ventilation, and different positions of the glass under corner ventilation). Additionally, the study considers the impacts of the aspect ratio and ambient wind speed. Studies have shown that corner ventilation is effective in reducing indoor pollutant levels. When the two window glass positions are far away from the center of the intersection, the average CO mass fraction in the single-sided ventilation room is reduced by 87.1%. The average indoor CO mass fraction on the leeward side decreases with the increasing wind speed and aspect ratio. At a wind speed of 8 m/s, the average indoor CO mass fraction on the leeward side decreases to 2.45 × 10⁻⁸. At an aspect ratio of 2, the indoor CO mass fraction on the leeward side decreases with increasing floors before stabilizing at approximately 4.77 × 10⁻⁹. This study suggests optimal window opening strategies to reduce indoor pollutant levels in street-facing buildings at street intersections, offering guidance to indoor residents on window ventilation practices. Full article
(This article belongs to the Special Issue Urban Air Quality Modelling)
Show Figures

Figure 1

22 pages, 8817 KiB  
Article
Assessment of Wind over Complex Terrain Considering the Effects of Topography, Atmospheric Stability and Turbine Wakes
by Atsushi Yamaguchi, Alireza Tavana and Takeshi Ishihara
Atmosphere 2024, 15(6), 723; https://doi.org/10.3390/atmos15060723 - 17 Jun 2024
Viewed by 370
Abstract
This study proposes a microscale flow model to estimate mean wind speed, fluctuating wind speed and wind direction over complex terrain considering the effects of topography, atmospheric stability, and turbine wakes. Firstly, the effect of topography is considered using Computational Fluid Dynamics (CFD). [...] Read more.
This study proposes a microscale flow model to estimate mean wind speed, fluctuating wind speed and wind direction over complex terrain considering the effects of topography, atmospheric stability, and turbine wakes. Firstly, the effect of topography is considered using Computational Fluid Dynamics (CFD). Next, a mesoscale model is presented to account for the effect of atmospheric stability. The effect of turbine wakes on the mean and fluctuating wind speeds are then represented by an advanced wake model. The model is validated using the measurement data of a wind farm located in the North of Japan. The measured wind data by Lidar at a reference height are horizontally extrapolated to a nearby met mast hub height and validated by a cup anemometer. Moreover, a novel averaging method is proposed to calculate a directional equivalent Monin–Obukhov length scale to account for the effect of atmospheric stability. Finally, the measured wind data at the reference height are vertically extrapolated and validated at the lidar location. The predicted mean and fluctuating wind speeds show good agreement with the measurements. Full article
(This article belongs to the Section Atmospheric Techniques, Instruments, and Modeling)
Show Figures

Figure 1

18 pages, 3368 KiB  
Article
Enhancing Tomato Production by Using Non-Conventional Water Resources within Integrated Sprinkler Irrigation Systems in Arid Regions
by Ramadan Eid Abdelraouf, Mamdouh A. A. Abdou, Ahmed Bakr, Ahmed E. Hamza, Younes M. Rashad, Ahmed M. Abd-ElGawad, Mohamed Hafez and R. Ragab
Atmosphere 2024, 15(6), 722; https://doi.org/10.3390/atmos15060722 - 16 Jun 2024
Viewed by 348
Abstract
This research evaluated the importance of establishing an integrated sprinkler irrigation design connected to fish farm ponds in order to achieve environmental and financial benefits. To achieve the aim of the study, two field experiments were conducted at a private farm in the [...] Read more.
This research evaluated the importance of establishing an integrated sprinkler irrigation design connected to fish farm ponds in order to achieve environmental and financial benefits. To achieve the aim of the study, two field experiments were conducted at a private farm in the Nubaria area of Beheira Governorate during the 2022 and 2023 seasons to quantify all the benefits from using fish water effluent (FWE) in irrigation. The obtained results indicated that the effluent could represent a good source of irrigation and bio-fertilization. The yield of tomato was higher when using FWE for irrigation compared with using groundwater for irrigation (IW). This was due to the additional amounts of dissolved bio-nitrogen along with other nutrients present in the FWE. The proportion of dissolved nitrogen added by using FWE was 22.3 kg nitrogen per hectare in 2022 and 24.6 kg nitrogen per hectare in 2023, in addition to some other major elements such as phosphorus and potassium, which are also among the main nutrients needed by crops. It has also been noticed that the fertility of the sandy soil increased with the use of FWE for irrigation. One of the most important results was the possibility of reducing the addition of nitrogen mineral fertilizers by 25%, thus saving on N fertilizers when growing tomato. In addition to the vitality of the FWE and its macro- and microelements, algae, microorganisms, and other organic materials, the use of this type of water as an alternative source for irrigation, along with the reduction in the amount of added mineral fertilizers, will reduce the degree of groundwater contamination with mineral fertilizers and increase the income of farmers. It was also observed that the air temperature decreased during the growing season when compared with the temperature of uncultivated surrounding areas. Full article
(This article belongs to the Special Issue Agriculture-Climate Interactions in Tropical Regions)
Show Figures

Figure 1

21 pages, 6978 KiB  
Article
Associations between Indoor and Outdoor Size-Resolved Particulate Matter in Urban Beijing: Chemical Compositions, Sources, and Health Risks
by Shili Tian, Liming Wang, Qingyang Liu, Liang Luo, Chunyan Qian, Baocheng Wang and Yanju Liu
Atmosphere 2024, 15(6), 721; https://doi.org/10.3390/atmos15060721 - 16 Jun 2024
Viewed by 407
Abstract
Ventilation may lead to a deterioration in indoor air quality in urban environments located close to roads. Understanding the differences in the chemical compositions of size-resolved particulate matter (PM) in indoor air and outdoor air could aid in assessing the health impacts of [...] Read more.
Ventilation may lead to a deterioration in indoor air quality in urban environments located close to roads. Understanding the differences in the chemical compositions of size-resolved particulate matter (PM) in indoor air and outdoor air could aid in assessing the health impacts of air in these settings and establishing relevant regulation policies. In this study, indoor and outdoor size-resolved PM was collected from an office in Beijing in summer (between 5 and 25 July 2020) and winter (between 5 and 31 January 2021). Its chemical components, including sulfate, nitrate, ammonium, chlorine, organic matter (OM), elemental carbon (EC), crustal materials (CM), and heavy metals (HM), were analyzed. The mean levels of indoor and outdoor PM2.1 and PM9 were found to be much higher than those in the guidelines for PM2.5 and PM10 outlined by the National Ambient Air Quality Standard. Moreover, the levels of PM2.1 and PM2.1–9 mass were higher outdoors than they were indoors. The size distributions of mass concentrations were shown to be bimodal, peaking at 0.43–0.65 μm and 4.7–5.8 μm, respectively. The most abundant chemicals were OM, nitrate, and sulfate for PM2.1 and OM, CM, and nitrate for PM2.1–9. We found higher percentages of sulfate, nitrate, ammonium, EC, and HM in smaller-size fractions of PM. Additionally, positive matrix factorization showed that biomass burning, secondary inorganic aerosol, coal combustion, dust, traffic, and industrial pollution were the main sources of PM during the study period. The greatest non-carcinogenic and carcinogenic hazards were found at 0.43–0.65 μm in summer and 2.1–3.3 μm in winter. Our results indicate that size-resolved PM of ambient origin may infiltrate buildings near roads to varying degrees, resulting in negative health effects. Full article
(This article belongs to the Special Issue New Insights into Exposure and Health Impacts of Air Pollution)
Show Figures

Figure 1

21 pages, 4193 KiB  
Article
Study on Spatial-Temporal Evolution, Decoupling Effect and Influencing Factors of Tourism Transportation Carbon Emissions: Taking North China as an Example
by Dongni Feng, Cheng Li and Yangzhou Li
Atmosphere 2024, 15(6), 720; https://doi.org/10.3390/atmos15060720 - 15 Jun 2024
Viewed by 274
Abstract
As global warming intensifies, reducing carbon emissions has become a global common mission. Tourism transportation is one of the important sources of carbon emissions, and reducing its carbon emissions is a key part of achieving China’s carbon reduction goals. Based on the panel [...] Read more.
As global warming intensifies, reducing carbon emissions has become a global common mission. Tourism transportation is one of the important sources of carbon emissions, and reducing its carbon emissions is a key part of achieving China’s carbon reduction goals. Based on the panel data of various provinces and cities in North China from 2000 to 2022, this paper calculates the carbon emissions of tourism transportation by using the carbon emission coefficients of different transportation modes in different segments. Moreover, the temporal and spatial evolution of the tourism economy is systematically analyzed. The Tapio decoupling model and LMDI addition decomposition model are used to analyze the relationship between carbon emissions and tourism economic growth and the effects of 11 influencing factors on carbon emissions. The results show that: (1) The carbon emission of tourism transportation in North China has experienced four stages: a steady growth period, a transitional adaptation period, a stable equilibrium period, and a drastic decline period. The overall carbon emission level of tourism transportation is as follows: Hebei Province > Shanxi Province > Inner Mongolia Autonomous Region > Beijing City > Tianjin City. (2) The decoupling coefficient between tourism traffic carbon emissions and economic development fluctuates but mainly shows a weak decoupling state. (3) In terms of influencing factors, passenger size and passenger density have the greatest impact on the carbon emissions of tourism transportation. Full article
(This article belongs to the Special Issue Urban Carbon Emissions)
Show Figures

Figure 1

13 pages, 2189 KiB  
Article
Seasonal Patterns and Allergenicity of Casuarina Pollen in Sydney, Australia: Insights from 10 Years of Monitoring and Skin Testing
by Edwin R. Lampugnani, Jeremy D. Silver, Pamela Burton, Usha Nattala and Constance H. Katelaris
Atmosphere 2024, 15(6), 719; https://doi.org/10.3390/atmos15060719 - 15 Jun 2024
Viewed by 307
Abstract
Casuarina (Australian pine, She-oak) is native to Australia and South East Asia and is known for its abundant wind-borne pollen. Despite not being considered a major aeroallergen, some patients report respiratory symptoms upon exposure, with positive skin prick tests (SPT) to Casuarina pollen [...] Read more.
Casuarina (Australian pine, She-oak) is native to Australia and South East Asia and is known for its abundant wind-borne pollen. Despite not being considered a major aeroallergen, some patients report respiratory symptoms upon exposure, with positive skin prick tests (SPT) to Casuarina pollen extract. This study investigates Casuarina pollen dispersal patterns in Sydney, Australia, over a 10-year period, from 2008 to 2018, revealing a bimodal distribution of pollen from September to October (southern hemisphere spring) and February to March (mid-late summer). Analysis of historical SPT data shows 20% of individuals with respiratory allergies reacting positively to Casuarina pollen extract, with almost 90% of these also reacting to grass pollen, suggesting potential cross-reactivity. Notably, there are no exclusive reactions to Casuarina pollen. Understanding the prolonged pollen season underscores the importance of year-round monitoring for accurate characterization. Currently lacking are commercially available skin test extracts or specific IgE assays for Casuarina sensitization, necessitating challenge studies to confirm clinical symptoms directly attributable to Casuarina pollen. By elucidating the seasonal dynamics and meteorological drivers of Casuarina pollen dispersion, alongside the potential allergenicity suggested by skin prick tests, this study paves the way for improved management of Casuarina-related allergies and highlights the critical need for further research on native Australian plant allergens. Full article
(This article belongs to the Special Issue Real-Time Detection, Discrimination, and Forecasting of Bioaerosols)
Show Figures

Figure 1

17 pages, 3121 KiB  
Article
Near-Surface Thermodynamic Influences on Evaporation Duct Shape
by Sarah E. Wessinger, Daniel P. Greenway, Tracy Haack and Erin E. Hackett
Atmosphere 2024, 15(6), 718; https://doi.org/10.3390/atmos15060718 - 15 Jun 2024
Viewed by 300
Abstract
This study utilizes in situ measurements and numerical weather prediction forecasts curated during the Coupled Air–Sea Processes Electromagnetic Ducting Research (CASPER) east field campaign to assess how thermodynamic properties in the marine atmospheric surface layer influence evaporation duct shape independent of duct height. [...] Read more.
This study utilizes in situ measurements and numerical weather prediction forecasts curated during the Coupled Air–Sea Processes Electromagnetic Ducting Research (CASPER) east field campaign to assess how thermodynamic properties in the marine atmospheric surface layer influence evaporation duct shape independent of duct height. More specifically, we investigate evaporation duct shape through a duct shape parameter, a parameter known to affect the propagation of X-band radar signals and is directly related to the curvature of the duct. Relationships between this duct shape parameter and air sea temperature difference (ASTD) reveal that during unstable periods (ASTD < 0), the duct shape parameter is generally larger than in near-neutral or stable atmospheric conditions, indicating tighter curvature of the M-profile. Furthermore, for any specific duct height, a strong linear relationship between the near-surface-specific humidity gradient and the duct shape parameter is found, suggesting that it is primarily driven by near-surface humidity gradients. The results demonstrate that an a priori estimate of duct shape, for a given duct height, is possible if the near-surface humidity gradient is known. Full article
Show Figures

Figure 1

18 pages, 3802 KiB  
Article
Influence of Natural Tropical Oscillations on Ozone Content and Meridional Circulation in the Boreal Winter Stratosphere
by Tatiana Ermakova, Andrey Koval, Kseniia Didenko, Olga Aniskina and Arina Okulicheva
Atmosphere 2024, 15(6), 717; https://doi.org/10.3390/atmos15060717 - 15 Jun 2024
Viewed by 317
Abstract
The dependence of ozone content in the polar stratosphere upon different phases of the quasi-biennial oscillation (QBO) of the zonal wind and the El Niño–Southern Oscillation (ENSO) during winter was studied. The monthly (from November to January) mean residual meridional circulation (RMC) was [...] Read more.
The dependence of ozone content in the polar stratosphere upon different phases of the quasi-biennial oscillation (QBO) of the zonal wind and the El Niño–Southern Oscillation (ENSO) during winter was studied. The monthly (from November to January) mean residual meridional circulation (RMC) was calculated for four different combinations of the main phases of ENSO and QBO using MERRA2 reanalysis data. It has been demonstrated that the QBO phase manifests itself in different vertical distributions of ozone in the equatorial stratosphere, as well as in strengthening/weakening of the secondary meridional circulation in the tropics. The enhancement of the RMC from the tropical to the polar stratosphere is stronger at altitudes where ozone is higher in the tropics under El Niño conditions. The RMC modification and intensification are observed from ozone-depleted areas under La Niña conditions. A “cumulative” effect is observed by February under La Niña conditions and the easterly QBO, which is expressed in the lowest ozone content in the polar stratosphere. The numerical experiments carried out using the Middle and Upper Atmosphere Model (MUAM) confirmed tendencies in changes in the meridional transport detected from the reanalysis data for different combinations of QBO and ENSO. Full article
(This article belongs to the Special Issue Ozone Evolution in the Past and Future (2nd Edition))
Show Figures

Figure 1

18 pages, 22255 KiB  
Article
Characterization of Spatial and Temporal Variations in Air Pollutants and Identification of Health Risks in Xi’an, a Heavily Polluted City in China
by Li Han and Yongjie Qi
Atmosphere 2024, 15(6), 716; https://doi.org/10.3390/atmos15060716 - 14 Jun 2024
Viewed by 233
Abstract
The study of the temporal and spatial characteristics of air pollutants in heavily polluted cities is extremely important for analyzing the causes of pollution and achieving a viable means of control. Such characteristics in the case of Xi’an, a typical heavily polluted city [...] Read more.
The study of the temporal and spatial characteristics of air pollutants in heavily polluted cities is extremely important for analyzing the causes of pollution and achieving a viable means of control. Such characteristics in the case of Xi’an, a typical heavily polluted city in Fenwei Plain, China, have remained unclear due to limitations in data accuracy and research methods. The monthly, daily, and hourly patterns of O3 and particulate matter (PM2.5 and PM10) are analyzed in this study using on-site data provided by an urban air quality monitoring network. The analysis of variance (ANOVA) method was used to compare differences in pollutant concentrations during different seasons and time periods. The spatial distributions of O3, PM2.5, and PM10 at different time points following interpolation of the air quality monitoring sites have been analyzed. The results show that the O3 concentration from 12 p.m. to 3 p.m. was significantly higher than that in the morning and evening, and the concentrations of PM2.5 and PM10 from 7 p.m. to 10 p.m. were significantly higher than those in the morning and afternoon. The number of qualified days for PM2.5 was less than 30 and unqualified days for O3 was more than 100 in 2019. There is a potential risk of exposure to pollution with associated health risks. Even on the same day, the spatial pollutant distributions at different time points can differ significantly. This study provides a scientific basis for reducing O3 and particulate matter exposure. Outdoor activities in the morning in summer are more beneficial to reduce O3 exposure, and outdoor activities should be curtailed in the evening in winter to reduce particulate exposure. This study provides a scientific basis for the government to formulate public health policies to reduce pollution exposure from outdoor activities. Full article
(This article belongs to the Section Air Quality and Human Health)
Show Figures

Figure 1

13 pages, 2997 KiB  
Article
Evaluating Real Driving Emissions of Compressed Natural Gas Taxis in Chongqing, China—A Typical Mountain Cities
by Wei Hu, Linfeng Duan, Min Tang, Rui Yuan, Gaiyan Lv, Pingjiang Lv, Zhenliang Li, Ling Li, Hualong Xu, Jiajia Ding and Dan Zhang
Atmosphere 2024, 15(6), 715; https://doi.org/10.3390/atmos15060715 - 14 Jun 2024
Viewed by 264
Abstract
Compressed natural gas (CNG) taxis represent the most ubiquitous and dynamically active passenger vehicles in urban settings. The pollutant emission characteristics of in-use CNG taxis driving on a typical mountain city before and after three-way catalyst (TWC) replacement was examined using a modular [...] Read more.
Compressed natural gas (CNG) taxis represent the most ubiquitous and dynamically active passenger vehicles in urban settings. The pollutant emission characteristics of in-use CNG taxis driving on a typical mountain city before and after three-way catalyst (TWC) replacement was examined using a modular on-board portable emissions measurement system (PEMS), the OBS-ONE developed by Horiba. The results showed that the exhaust NO of CNG taxis equipped with deactivation TWC exceeded the emission limits, even higher than gasoline vehicles. The high emission rate of CNG taxis is mainly concentrated on road slopes between a 2% and 6% gradient and a deceleration rate in the interval of [0.5, 4], respectively, which results in higher emissions from CNG taxis traveling in the mountain city of Chongqing than other cities and vehicles. Moreover, the pollutant emission rates of the in-use CNG taxis were highly correlated with the velocity and the vehicle specific power (VSP). After a new TWC replacement, the emission factors of carbon monoxide (CO), total hydrocarbons (THC), nitrogen oxides (NOx), and particle number (PN) decreased by 85.21–89.11%, 68.71–85.49%, 60.91–81.11%, and 62.26–68.39%, respectively. Our results will provide guidance for urban environments to carry out the comprehensive management of in-use vehicles and emphasize the importance of TWC replacement for CNG taxis. Full article
(This article belongs to the Special Issue Traffic Related Emission (2nd Edition))
Show Figures

Figure 1

15 pages, 44675 KiB  
Article
Three-Dimensional Computerized Ionospheric Tomography over Maritime Areas Based on Simulated Slant Total Electron Content along Small-Satellite Constellation–Automatic Identification System Signal Rays
by Haiying Li, Bin Xu, Cheng Wang, Haisheng Zhao, Ruimin Jin, Hongbo Zhang and Feifei Wang
Atmosphere 2024, 15(6), 714; https://doi.org/10.3390/atmos15060714 - 14 Jun 2024
Viewed by 300
Abstract
Ionospheres over sea areas have an inevitable impact on maritime–satellite communications; however, due to geographic constraints, ionospheric observation and analysis over sea areas are far from adequate. In our paper, slant total electron content (STEC) along small-satellite constellation–automatic identification system (AIS) signal rays [...] Read more.
Ionospheres over sea areas have an inevitable impact on maritime–satellite communications; however, due to geographic constraints, ionospheric observation and analysis over sea areas are far from adequate. In our paper, slant total electron content (STEC) along small-satellite constellation–automatic identification system (AIS) signal rays is used for computerized ionospheric tomography (CIT) over sea areas, and small-satellite constellations can provide more effective signal rays than a single satellite. An adjustment factor δ is introduced to optimize the initial electron density for the multiplicative algebraic reconstruction technique (MART). The CIT results reconstructed by a traditional MART and our new method at 00:00 and 06:00, 15 March 2022, are compared, and our new method produces about a 15% and over 40% improvement in average deviation (AD) and root-mean-square error (RMSE). The results show that the bigger the difference between δ and 1, the better improvement will be in the 3D CIT process. The initial electron density is well selected during CIT when δ is approximate to 1, which is the case at 12:00, and the reconstructed 3D electron density, applying the initial ne and the adjusted initial ne, are both close to the true electron density. The small-satellite constellation–AIS signals are valuable resources for electron density reconstruction in sea areas. Full article
Show Figures

Graphical abstract

13 pages, 3037 KiB  
Article
Rainy Season Migration across the Northeast Coast of Brazil Related to Sea Surface Temperature Patterns
by Marcos Paulo Santos Pereira, Fabiana Couto, Vanúcia Schumacher, Fabrício Daniel dos Santos Silva, Helber Barros Gomes, Djane Fonseca da Silva, Heliofábio Barros Gomes, Rafaela Lisboa Costa, Flávio B. Justino and Dirceu Luís Herdies
Atmosphere 2024, 15(6), 713; https://doi.org/10.3390/atmos15060713 - 14 Jun 2024
Viewed by 332
Abstract
Accurate regional seasonal forecasts of the rainy season are essential for the implementation of effective socioeconomic activities and policy. However, current characteristics of the period of occurrence of the rainy season in the Eastern Northeast Brazil (ENEB) region demonstrated that maximum precipitation varies [...] Read more.
Accurate regional seasonal forecasts of the rainy season are essential for the implementation of effective socioeconomic activities and policy. However, current characteristics of the period of occurrence of the rainy season in the Eastern Northeast Brazil (ENEB) region demonstrated that maximum precipitation varies substantially depending on the period analyzed. From 1972 to 2002, the rainy season occurred during the June–July–August (JJA) quarter, while from 1981 to 2011, it occurred in the April–May–June (AMJ) quarter. To access how these differences may be due to different patterns of sea surface temperature (SST), using observed precipitation and SST data from NOAA for the period from 1982 to 2018, this study identified the spatial patterns of inter-annual changes in Pacific and Atlantic SST related to the occurrence of the ENEB rainy seasons. We focus on the statistical method of symmetric mean absolute percentage error (sMAPE) for forecasting these periods based on SST information. Our results revealed five different quarterly periods (FMA, MAM, AMJ, MJJ, JJA) to the rainy season, in which MJJ is more prevalent. The sMAPE values of the SST patterns are inversely proportional to precipitation in the ENEB. Hence, it may be concluded that our climate analysis demonstrates that seasonal SST patterns can be used for forecasting the period of the rainy season. Full article
(This article belongs to the Section Biosphere/Hydrosphere/Land–Atmosphere Interactions)
Show Figures

Figure 1

25 pages, 8775 KiB  
Article
Analysis of Atmospheric Aerosol Changes in the Qinghai-Tibetan Plateau Region during 2009–2019 Using a New Fusion Algorithm
by Zhijian Zhao and Hideyuki Tonooka
Atmosphere 2024, 15(6), 712; https://doi.org/10.3390/atmos15060712 - 14 Jun 2024
Viewed by 325
Abstract
The Qinghai-Tibetan Plateau (QTP) is the largest permafrost-covered area in the world, and it is critical to understand accurately and dynamically the cyclical changes in atmospheric aerosols in the region. However, due to the scarcity of researchers in this field and the complexity [...] Read more.
The Qinghai-Tibetan Plateau (QTP) is the largest permafrost-covered area in the world, and it is critical to understand accurately and dynamically the cyclical changes in atmospheric aerosols in the region. However, due to the scarcity of researchers in this field and the complexity of analyzing the spatial and temporal dynamics of aerosols, there is a gap in research in this area, which we hope to fill. In this study, we constructed a new fusion algorithm based on the V5.2 algorithm and the second-generation deep blue algorithm through the introduced weight factor of light and dark image elements. We used the algorithm to analyze the spatial and temporal changes in aerosols from 2009–2019. Seasonal changes and the spatial distribution of aerosol optical depth (AOD) were analyzed in comparison with the trend of weight factor, which proved the stability of the fusion algorithm. Spatially, the AOD values in the northeastern bare lands and southeastern woodland decreased most significantly, and combined with the seasonal pattern of change, the AOD values in this region were higher in the spring and fall. In these 11 years, the AOD values in the spring and fall decreased the most, and the aerosol in which the AOD decreases occurred should be the cooling-type sulfate aerosol. In order to verify the accuracy of the algorithm, we compared the AOD values obtained by the algorithm at different time intervals with the measured AOD values of several AERONET stations, in which the MAE, RMSE, and R between the AOD values obtained by the algorithm and the measured averages of the 12 nearest AERONET stations in the QTP area were 0.309, 0.094, and 0.910, respectively. In addition, this study also compares the AOD results obtained from the fusion algorithm when dynamically weighted and mean-weighted, and the results show that the error value is smaller in the dynamic weighting approach in this study. Full article
(This article belongs to the Special Issue Climate Dynamics and Variability Over the Tibetan Plateau)
Show Figures

Figure 1

27 pages, 2091 KiB  
Article
Zonons Are Solitons Produced by Rossby Wave Ringing
by Nimrod Cohen, Boris Galperin and Semion Sukoriansky
Atmosphere 2024, 15(6), 711; https://doi.org/10.3390/atmos15060711 - 14 Jun 2024
Viewed by 306
Abstract
Along with the familiar Rossby–Haurwitz waves, two-dimensional flows on the surface of a rotating sphere in the regime of zonostrophic turbulence harbor another class of waves known as zonons. Zonons are wave packets produced by energetic large-scale Rossby–Haurwitz wave modes ‘enslaving’ other wave [...] Read more.
Along with the familiar Rossby–Haurwitz waves, two-dimensional flows on the surface of a rotating sphere in the regime of zonostrophic turbulence harbor another class of waves known as zonons. Zonons are wave packets produced by energetic large-scale Rossby–Haurwitz wave modes ‘enslaving’ other wave modes. They propagate westward with the phase speed of the enslaving modes. Zonons can be visualized as enslaving modes’ ‘ringing’ in the enslaved ones with the frequencies of the former, the property that renders zonons non-dispersive. Zonons reside in high-shear regions confined between the opposing zonal jets yet they are mainly attached to westward jets and sustained by the ensuing barotropic instability. They exchange energy with the mean flow while preserving their identity in a fully turbulent environment, a feature characteristic of solitary waves. The goal of this study is to deepen our understanding of zonons’ physics using direct numerical simulations, a weakly non-linear theory, and asymptotic analysis, and ascertain that zonons are indeed isomorphic to solitary waves in the Korteweg–de Vries framework. Having this isomorphism established, the analysis is extended to eddies detected in the atmospheres of Jupiter and Saturn based upon the observed mean zonal velocity profiles and earlier findings that circulations on both planets obey the regime of zonostrophic macroturbulence. Not only the analysis confirms that many eddies and eddy trains on both giant planets indeed possess properties of zonons, but the theory also correctly predicts latitudinal bands that confine zonal trajectories of the eddies. Full article
Show Figures

Figure 1

18 pages, 2502 KiB  
Article
Impact of Integrating Flameless Combustion Technology and Sludge–Fly Ash Recirculation on PCDE Emissions in Hazardous Waste Thermal Treatment Systems
by Sheng-Lun Lin, Lu-Lu Duan, Jhong-Lin Wu, Chien-Er Huang and Meng-Jie Song
Atmosphere 2024, 15(6), 710; https://doi.org/10.3390/atmos15060710 - 14 Jun 2024
Viewed by 342
Abstract
Polychlorinated diphenyl ethers (PCDEs), persistent environmental pollutants, are found in flue gas from incinerators. While air pollution control systems (APCSs) capture pollutants, the resulting sludge/fly ash (SFA) requires further treatment due to residual PCDEs and other harmful substances. This study investigated a hazardous [...] Read more.
Polychlorinated diphenyl ethers (PCDEs), persistent environmental pollutants, are found in flue gas from incinerators. While air pollution control systems (APCSs) capture pollutants, the resulting sludge/fly ash (SFA) requires further treatment due to residual PCDEs and other harmful substances. This study investigated a hazardous waste thermal treatment system (HAWTTS) utilizing flameless combustion technology alongside a multistage APCS (scrubbers, cyclone demisters, bag houses). SFA from the APCS was recirculated for secondary combustion. PCDE levels were measured before and after each unit within the HAWTTS. The HAWTTS achieved a remarkable overall PCDE removal efficiency of 99%. However, the incinerator alone was less effective for low-chlorine PCDEs. Scrubbers and bag houses exhibited lower removal efficiencies (17.8% and 30.9%, respectively) due to the memory effect. Conversely, the cyclone demister achieved a high removal rate (98.2%). Following complete APCS treatment, PCDE emissions were significantly reduced to 1.02 ng/Nm3. While SFA still contained some PCDEs, the flameless combustion’s uniform temperature distribution enhanced combustion efficiency, minimizing overall PCDE emissions. This system demonstrates significant potential for mitigating PCDE pollution from incinerators. Further research could focus on optimizing treatment processes to address residual PCDEs in SFA. Full article
(This article belongs to the Special Issue Toxicity of Persistent Organic Pollutants and Microplastics in Air)
Show Figures

Figure 1

30 pages, 32244 KiB  
Article
Microclimate Zoning Based on Double Clustering Method for Humid Climates with Altitudinal Gradient Variations: A Case Study of Colombia
by Cristian Mejía-Parada, Viviana Mora-Ruiz, Jonathan Soto-Paz, Brayan A. Parra-Orobio and Shady Attia
Atmosphere 2024, 15(6), 709; https://doi.org/10.3390/atmos15060709 - 14 Jun 2024
Viewed by 477
Abstract
Climatic classification is essential for evaluating climate parameters that allow sustainable urban planning and resource management in countries with difficult access to meteorological information. Clustering methods are on trend to identify climate zoning; however, for microclimate, it is necessary to apply a double [...] Read more.
Climatic classification is essential for evaluating climate parameters that allow sustainable urban planning and resource management in countries with difficult access to meteorological information. Clustering methods are on trend to identify climate zoning; however, for microclimate, it is necessary to apply a double clustering technique to reduce the variability from former clusters. This research raised a climate classification of an emerging country, Colombia, using climatological models based on freely available satellite image data. A double clustering approach was applied, including climatological, geographic, and topographic patterns. The research was divided into four stages, covering the collection and selection of climatic and geographic data, and multivariate statistical analysis including principal components analysis (PCA) and agglomerative hierarchical clustering (HAC). The meteorological data were from reliable sources from the Center for Hydrometeorology and Remote Sensing (CHRS) and the National Renewable Energy Laboratory (NREL). The results showed that a total of 17 microclimates distributed across the country were identified, each characterized by a different threshold of the climatic and geographic factors evaluated. This subdivision provided a detailed understanding of local climatic conditions, especially in the mountain chains of the Andes. Full article
(This article belongs to the Section Climatology)
Show Figures

Figure 1

Previous Issue
Next Issue
Back to TopTop