
Earthquake Risk Assessment in Seismically Active Areas of Qinghai Province Based on Geographic Big Data


Abstract
:1. Introduction
2. Materials
2.1. Study Area
2.2. Data Source
3. Methods
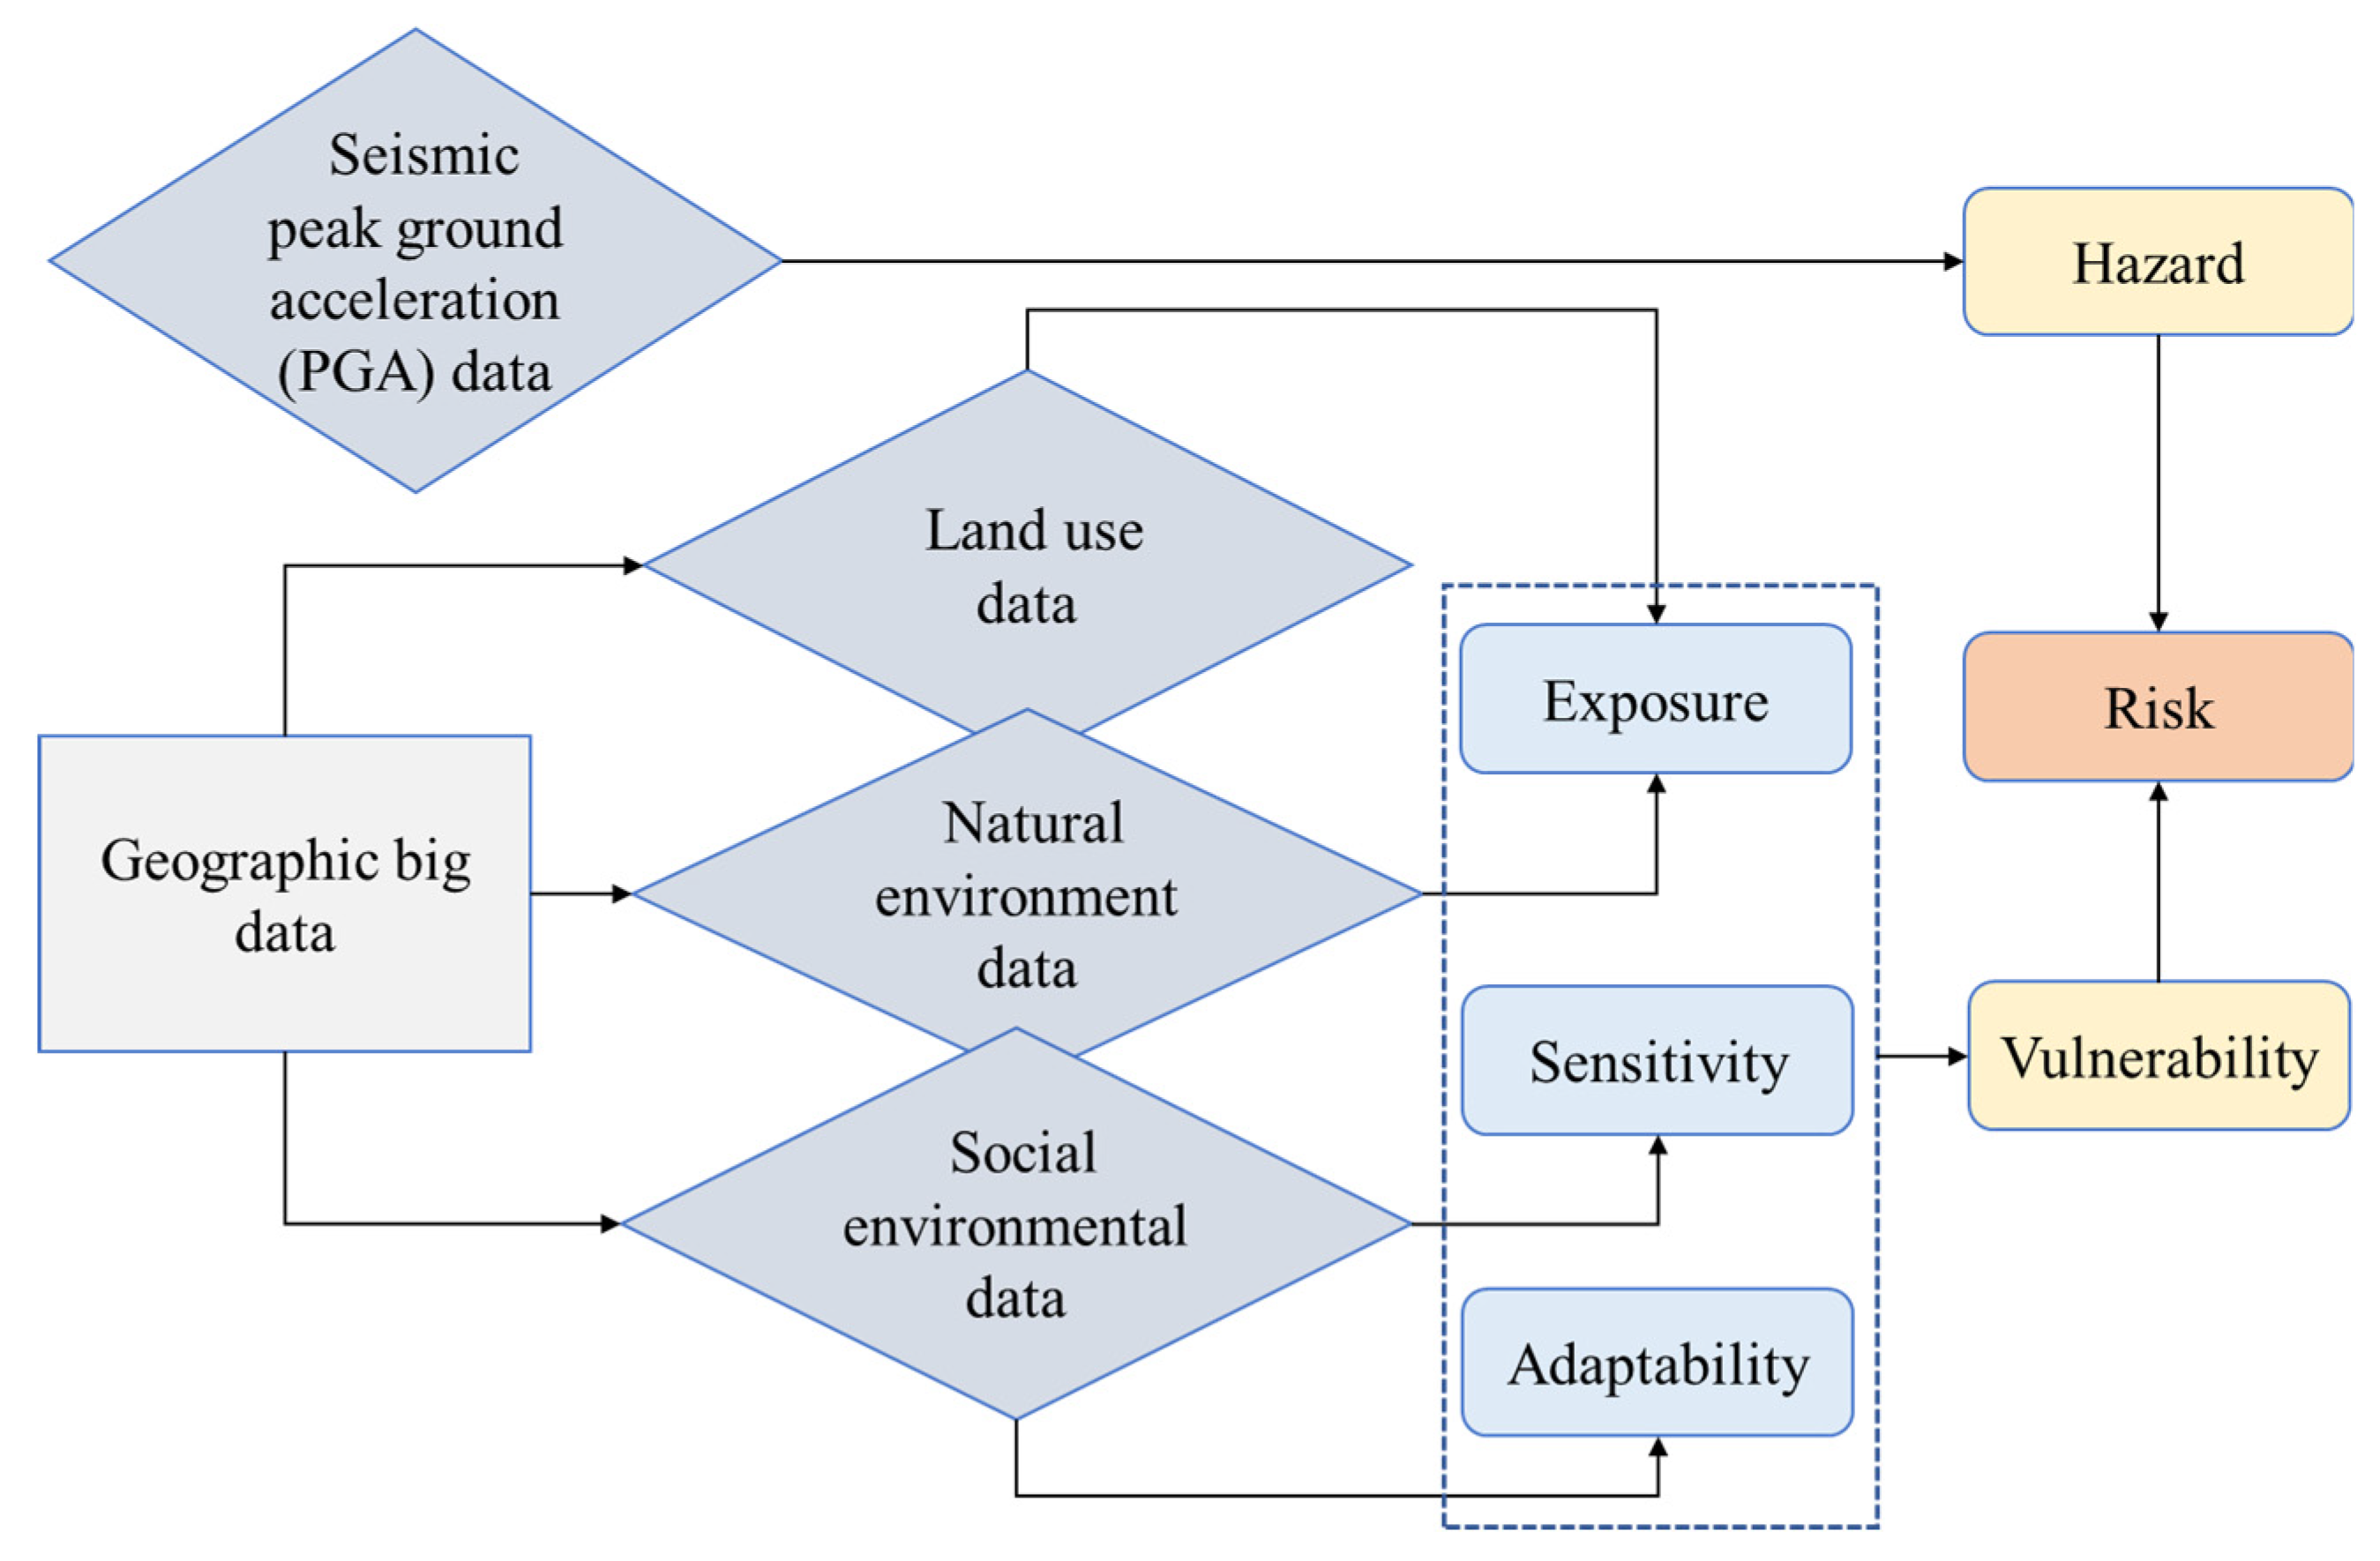
3.1. Hazard Assessment Method
3.2. Vulnerability Assessment Method
3.3. Risk Assessment
4. Results
4.1. Hazard
4.2. Vulnerability
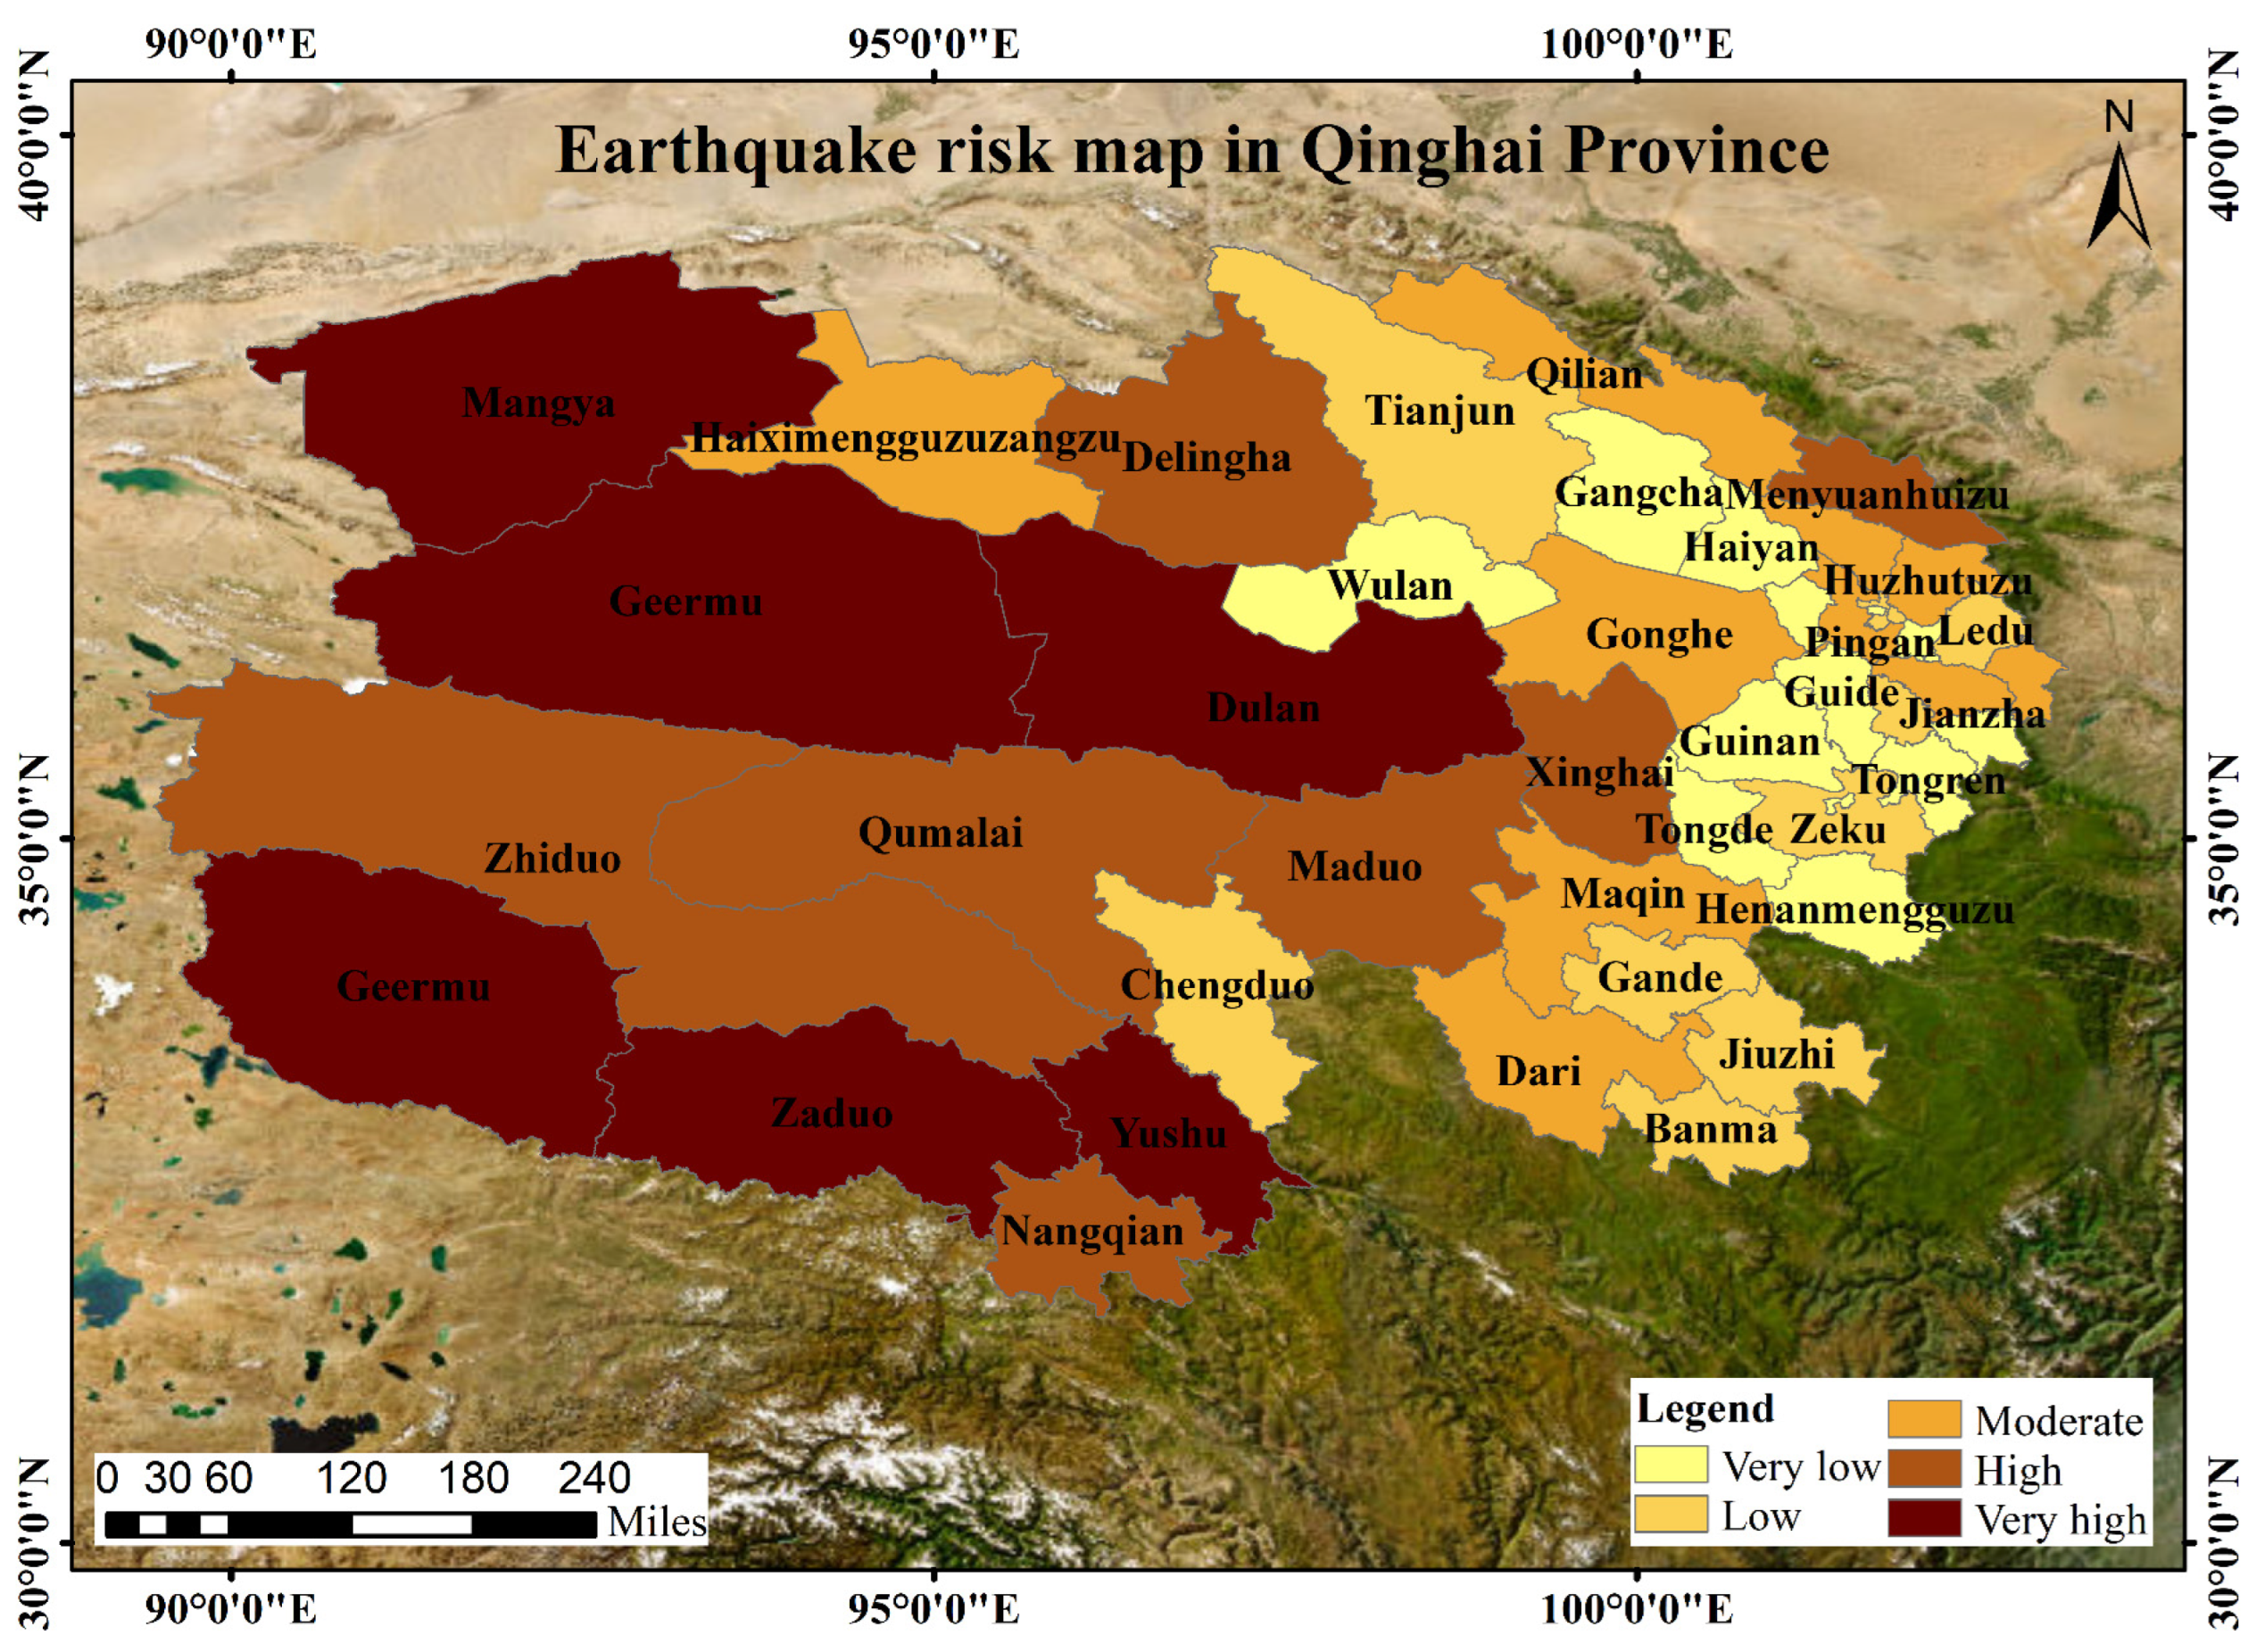
4.3. Risk
5. Discussion
5.1. Validation
5.2. Analysis of Influencing Factors of Earthquake Risk Assessment
- (1)
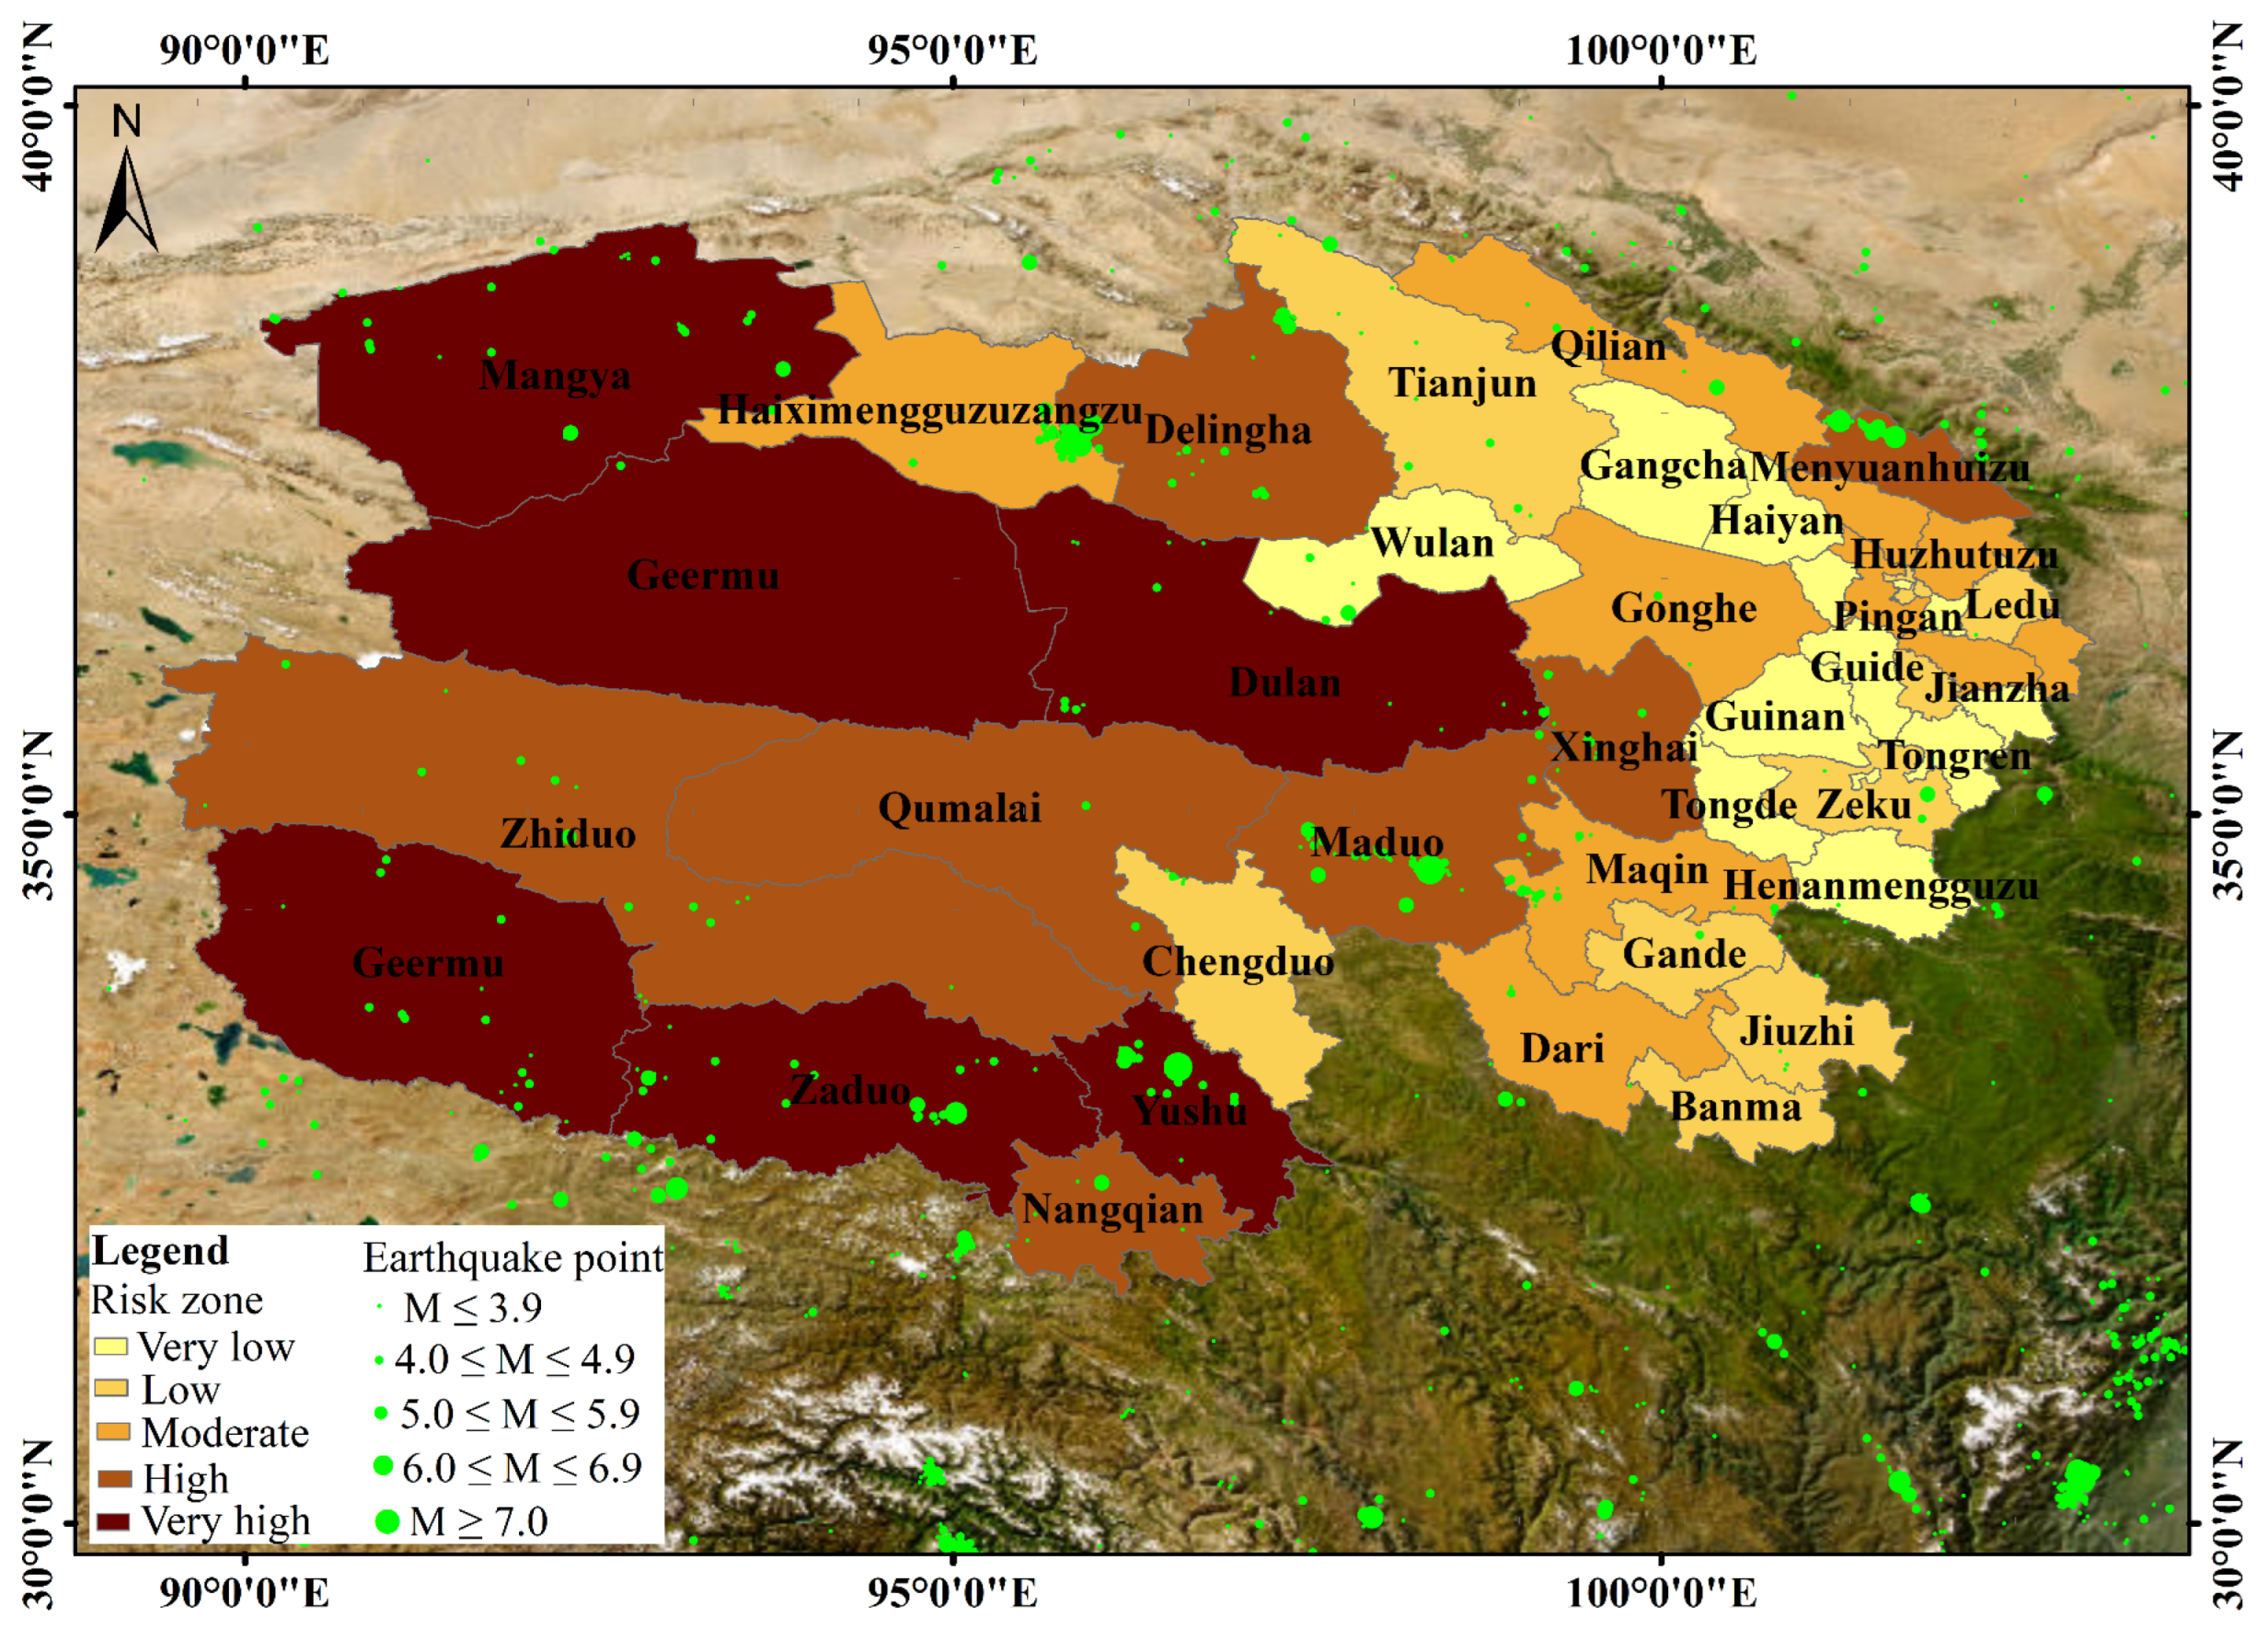
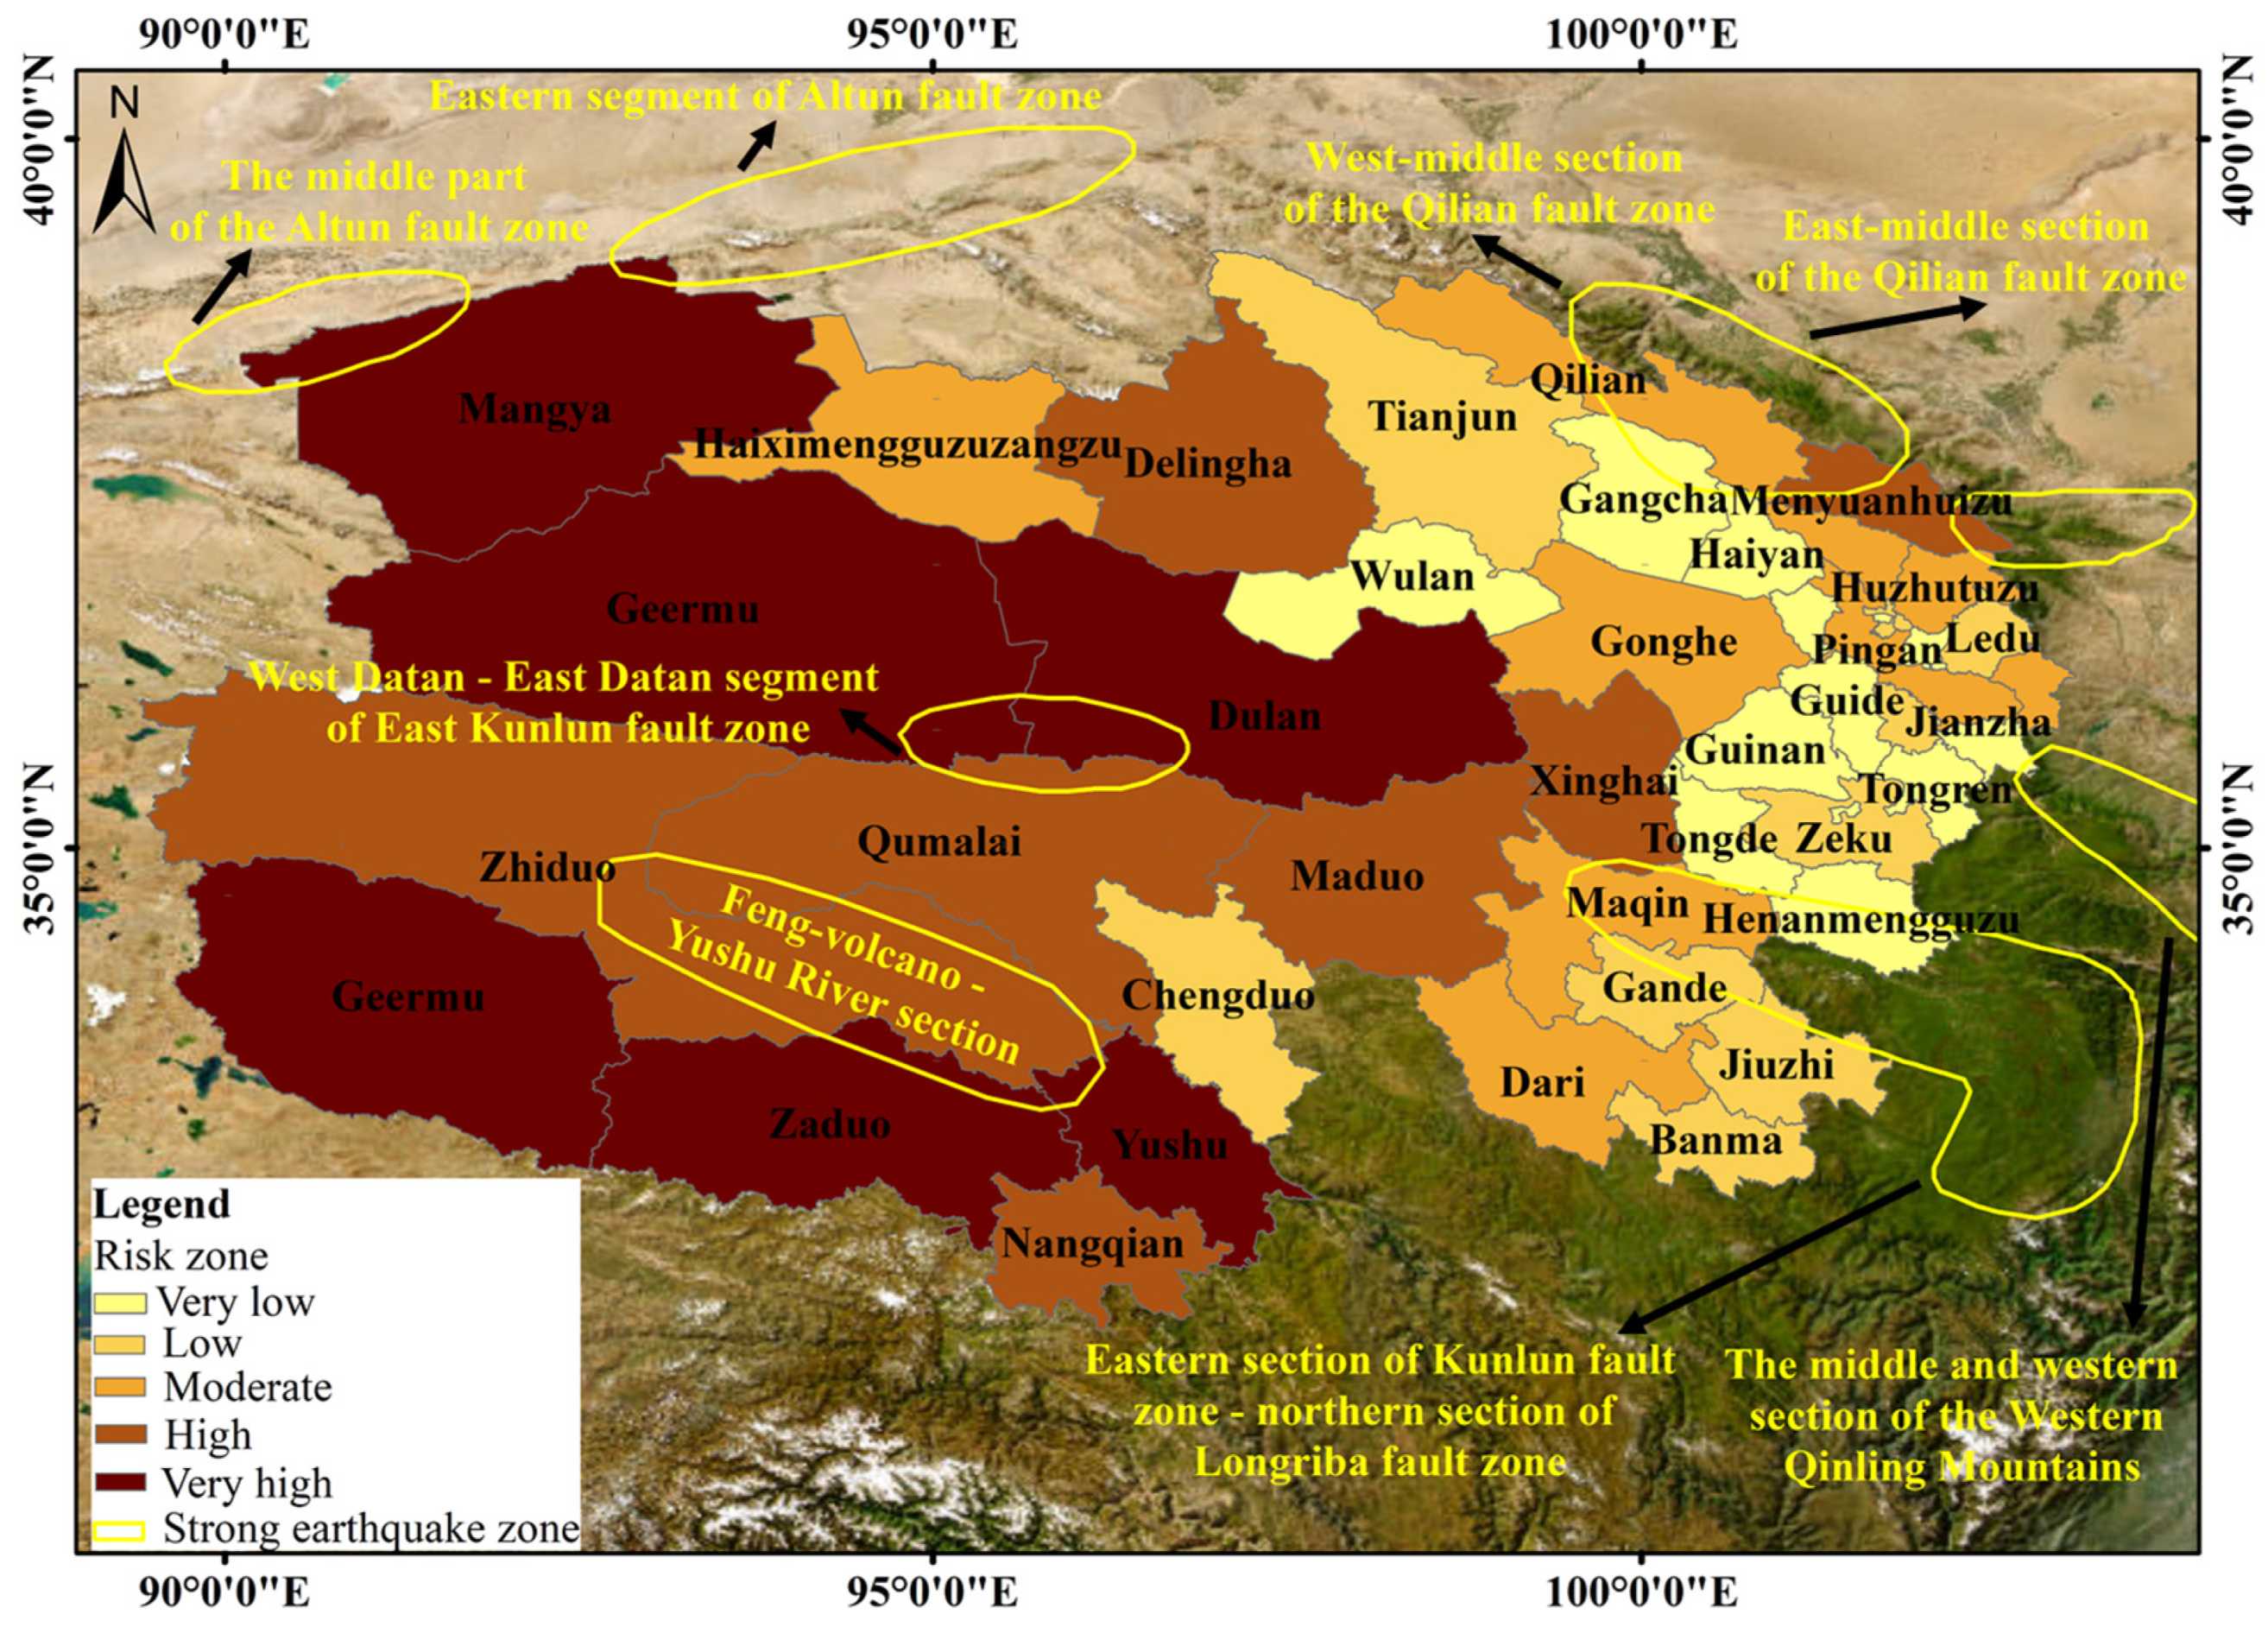
- Research shows that the vast majority of earthquakes on Earth occur on active faults [59]. In Figure 11, the Altun fault belt in the north of Qinghai Province and the East Kunlun fault belt in the middle of Qinghai Province are its main trunk, and are the main places for stress release and adjustment during crustal deformation. The paleoseismic research since late Quaternary shows that the paleoearthquakes on the Altun active fault zone are frequent and strong, and there are at least ten paleoseismic surface rupture deformation belts along the Altun active fault zone, each of which has had several strong earthquakes [60]. According to the official determination of the China Earthquake Networks, a 5.8-magnitude earthquake occurred in Mangya City, Qinghai Province, on 16 June 2021, and the epicenter of the earthquake was located on the fault along the southern margin of the Altun Mountains and the northwestern margin of the Qaidam Basin.
- (2)
- Earthquake risk and vulnerability are the main factors that affect earthquake risk, showing the possibility of earthquake disaster [61,62]. The peak acceleration of ground motion in Qinghai province is relatively high, and the whole province is basically in the earthquake medium–high-intensity area of degree Ⅶ or above, which indicates that the ground and the buildings on the ground are affected and damaged greatly. Therefore, in 2021, the General Office of the People’s Government of Qinghai Province issued the 14th Five-Year Plan for Earthquake Prevention and Disaster Reduction of Qinghai Province. This is of great significance for Qinghai Province to further improve the basic capacity of earthquake prevention and disaster reduction at the grassroot level, promote the modernization of earthquake prevention and disaster reduction undertakings in the new era, and deepen the reform and development of earthquake prevention and disaster reduction undertakings. In order to reduce the earthquake disaster, we can increase the stiffness and strength of the building structure, increase the seismic support, use seismic materials, adopt seismic isolation technology, shock absorption technology, etc., and through reasonable seismic design and reinforcement measures, we can greatly improve the seismic ability of the building and reduce the loss caused by the earthquake.
- (3)
- The central and southern part of Qinghai Province is the Qingnan Plateau with an average altitude of more than 4000 m, accounting for more than half of the total area of the province. This natural barrier has brought great difficulties for earthquake relief work. Its lofty mountains form the basic skeleton of Qinghai’s landscape and witness the uplifting northward march of the Tibetan Plateau, making Qinghai and its neighbors the most active intracontinental orogenic belt in the world. The geological structure and active fault system within the orogenic belt are very complex, resulting in an earthquake-prone area.
5.3. The Limitation of Remote Sensing and GIS Technology in Earthquake Disaster Risk Assessment
6. Conclusions
Author Contributions
Funding
Institutional Review Board Statement
Informed Consent Statement
Data Availability Statement
Conflicts of Interest
References
- Massazza, A.; Brewin, C.R.; Joffe, H. The nature of “natural disasters”: Survivors’ explanations of earthquake damage. Int. J. Disaster Risk Sci. 2019, 10, 293–305. [Google Scholar] [CrossRef]
- Yousuf, M.; Bukhari, S.K.; Bhat, G.R.; Ali, A. Understanding and managing earthquake hazard visa viz disaster mitigation strategies in Kashmir valley, NW Himalaya. Prog. Disaster Sci. 2020, 5, 100064. [Google Scholar] [CrossRef]
- Wang, J.; Wang, Z.; Cheng, H.; Kang, J.; Liu, X. Land Cover Changing Pattern in Pre-and Post-Earthquake Affected Area from Remote Sensing Data: A Case of Lushan County, Sichuan Province. Land 2022, 11, 1205. [Google Scholar] [CrossRef]
- Andrabi, T.; Daniels, B.; Das, J. Human capital accumulation and disasters: Evidence from the Pakistan earthquake of 2005. J. Hum. Resour. 2021, 58, 1057–1096. [Google Scholar] [CrossRef]
- Zhang, S.; Li, R.; Wang, F.; Iio, A. Characteristics of landslides triggered by the 2018 Hokkaido Eastern Iburi earthquake, Northern Japan. Landslides 2019, 16, 1691–1708. [Google Scholar] [CrossRef]
- Baharmand, H.; Comes, T.; Lauras, M. Supporting group decision makers to locate temporary relief distribution centres after sudden-onset disasters: A case study of the 2015 Nepal earthquake. Int. J. Disaster Risk Reduct. 2020, 45, 101455. [Google Scholar] [CrossRef]
- Wu, J.; He, X.; Li, Y.; Shi, P.; Ye, T.; Li, N. How earthquake-induced direct economic losses change with earthquake magnitude, asset value, residential building structural type and physical environment: An elasticity perspective. J. Environ. Manag. 2019, 231, 321–328. [Google Scholar] [CrossRef] [PubMed]
- Oliva, S.; Lazzeretti, L. Measuring the economic resilience of natural disasters: An analysis of major earthquakes in Japan. City Cult. Soc. 2018, 15, 53–59. [Google Scholar] [CrossRef]
- Meroni, F.; Squarcina, T.; Pessina, V.; Locati, M.; Modica, M.; Zoboli, R. A damage scenario for the 2012 Northern Italy Earthquakes and estimation of the economic losses to residential buildings. Int. J. Disaster Risk Sci. 2017, 8, 326–341. [Google Scholar] [CrossRef]
- Tassara, C.; Cesca, S.; Miller, M.; López-Comino, J.Á.; Sippl, C.; Cortés-Aranda, J.; Schurr, B. Seismic source analysis of two anomalous earthquakes in Northern Chile. J. S. Am. Earth Sci. 2022, 119, 103948. [Google Scholar] [CrossRef]
- Zhang, Y.; Zhang, C.; Drake, W.; Olshansky, R. Planning and recovery following the great 1976 Tangshan earthquake. J. Plan. Hist. 2015, 14, 224–243. [Google Scholar] [CrossRef]
- Athukorala, P.-C.; Resosudarmo, B.P. The Indian Ocean tsunami: Economic impact, disaster management, and lessons. Asian Econ. Pap. 2005, 4, 1–39. [Google Scholar] [CrossRef]
- Ishigaki, A.; Higashi, H.; Sakamoto, T.; Shibahara, S. The Great East-Japan Earthquake and devastating tsunami: An update and lessons from the past Great Earthquakes in Japan since 1923. Tohoku J. Exp. Med. 2013, 229, 287–299. [Google Scholar] [CrossRef]
- Cui, S.; Yin, Y.; Wang, D.; Li, Z.; Wang, Y. A stacking-based ensemble learning method for earthquake casualty prediction. Appl. Soft Comput. 2021, 101, 107038. [Google Scholar] [CrossRef]
- Zhai, Y.; Chen, S.; Ouyang, Q. GIS-based seismic hazard prediction system for urban earthquake disaster prevention planning. Sustainability 2019, 11, 2620. [Google Scholar] [CrossRef]
- Luo, L.; Lombardo, L.; van Westen, C.; Pei, X.; Huang, R. From scenario-based seismic hazard to scenario-based landslide hazard: Rewinding to the past via statistical simulations. Stoch. Environ. Res. Risk Assess. 2022, 36, 2243–2264. [Google Scholar] [CrossRef]
- Rahimi, H.; Mahsuli, M. Structural reliability approach to analysis of probabilistic seismic hazard and its sensitivities. Bull. Earthq. Eng. 2019, 17, 1331–1359. [Google Scholar] [CrossRef]
- Chen, Y.; Lin, P. Bayesian network of risk assessment for a super-large dam exposed to multiple natural risk sources. Stoch. Environ. Res. Risk Assess. 2019, 33, 581–592. [Google Scholar] [CrossRef]
- Ebrahimian, H.; Jalayer, F.; Forte, G.; Convertito, V.; Licata, V.; d’Onofrio, A.; Santo, A.; Silvestri, F.; Manfredi, G. Site-specific probabilistic seismic hazard analysis for the western area of Naples, Italy. Bull. Earthq. Eng. 2019, 17, 4743–4796. [Google Scholar] [CrossRef]
- Peñarubia, H.C.; Johnson, K.L.; Styron, R.H.; Bacolcol, T.C.; Sevilla, W.I.G.; Perez, J.S.; Bonita, J.D.; Narag, I.C.; Solidum, R.U.; Pagani, M.M. Probabilistic seismic hazard analysis model for the Philippines. Earthq. Spectra 2020, 36, 44–68. [Google Scholar] [CrossRef]
- Slejko, D.; Rebez, A.; Santulin, M.; Garcia-Pelaez, J.; Sandron, D.; Tamaro, A.; Civile, D.; Volpi, V.; Caputo, R.; Ceramicola, S. Seismic hazard for the Trans Adriatic Pipeline (TAP). Part 1: Probabilistic seismic hazard analysis along the pipeline. Bull. Earthq. Eng. 2021, 19, 3349–3388. [Google Scholar] [CrossRef]
- Rahman, M.; Siddiqua, S.; Kamal, A. Seismic source modeling and probabilistic seismic hazard analysis for Bangladesh. Nat. Hazards 2020, 103, 2489–2532. [Google Scholar] [CrossRef]
- McGuire, R.K. Probabilistic seismic hazard analysis and design earthquakes: Closing the loop. Bull. Seismol. Soc. Am. 1995, 85, 1275–1284. [Google Scholar] [CrossRef]
- Loi, D.W.; Raghunandan, M.E.; Swamy, V. Revisiting seismic hazard assessment for Peninsular Malaysia using deterministic and probabilistic approaches. Nat. Hazards Earth Syst. Sci. 2018, 18, 2387–2408. [Google Scholar] [CrossRef]
- Kolathayar, S.; Sitharam, T.; Vipin, K. Deterministic seismic hazard macrozonation of India. J. Earth Syst. Sci. 2012, 121, 1351–1364. [Google Scholar] [CrossRef]
- Shah, M.; Qaisar, M.; Iqbal, J.; Ahmed, S. Deterministic Seismic Hazard Assessment of Quetta, Pakistan. In Proceedings of the 15th World Conference on Earthquake Engineering, Lisbon, Portugal, 24–28 September 2012. [Google Scholar]
- Ochoa, L.H.; Niño, L.F.; Vargas, C.A. Fast magnitude determination using a single seismological station record implementing machine learning techniques. Geod. Geodyn. 2018, 9, 34–41. [Google Scholar] [CrossRef]
- Geiß, C.; Pelizari, P.A.; Marconcini, M.; Sengara, W.; Edwards, M.; Lakes, T.; Taubenböck, H. Estimation of seismic building structural types using multi-sensor remote sensing and machine learning techniques. ISPRS J. Photogramm. Remote Sens. 2015, 104, 175–188. [Google Scholar] [CrossRef]
- Astuti, W.; Akmeliawati, R.; Sediono, W.; Salami, M.-J.E. Hybrid technique using singular value decomposition (SVD) and support vector machine (SVM) approach for earthquake prediction. IEEE J. Sel. Top. Appl. Earth Obs. Remote Sens. 2014, 7, 1719–1728. [Google Scholar] [CrossRef]
- Han, J.; Park, S.; Kim, S.; Son, S.; Lee, S.; Kim, J. Performance of logistic regression and support vector machines for seismic vulnerability assessment and mapping: A case study of the 12 September 2016 ML5. 8 Gyeongju Earthquake, South Korea. Sustainability 2019, 11, 7038. [Google Scholar] [CrossRef]
- Jozinović, D.; Lomax, A.; Štajduhar, I.; Michelini, A. Rapid prediction of earthquake ground shaking intensity using raw waveform data and a convolutional neural network. Geophys. J. Int. 2020, 222, 1379–1389. [Google Scholar] [CrossRef]
- Chanda, S.; Somala, S.N. Single-component/single-station–based machine learning for estimating magnitude and location of an earthquake: A support vector machine approach. Pure Appl. Geophys. 2021, 178, 1959–1976. [Google Scholar] [CrossRef]
- Jena, R.; Pradhan, B.; Beydoun, G.; Sofyan, H.; Affan, M. Integrated model for earthquake risk assessment using neural network and analytic hierarchy process: Aceh province, Indonesia. Geosci. Front. 2020, 11, 613–634. [Google Scholar] [CrossRef]
- Omar, A.E.; Arnous, M.O.; El-Ghawaby, M.A.; Alshami, A.S.; El Zalaky, M.A. Seismotectonic hazards assessment in Southwestern Sinai area using Remote sensing and GIS. Sinai J. Appl. Sci. 2016, 5, 427–442. [Google Scholar] [CrossRef]
- Sahar, L.; Muthukumar, S.; French, S.P. Using aerial imagery and GIS in automated building footprint extraction and shape recognition for earthquake risk assessment of urban inventories. IEEE Trans. Geosci. Remote Sens. 2010, 48, 3511–3520. [Google Scholar] [CrossRef]
- Lyu, H.-M.; Shen, J.S.; Arulrajah, A. Assessment of geohazards and preventative countermeasures using AHP incorporated with GIS in Lanzhou, China. Sustainability 2018, 10, 304. [Google Scholar] [CrossRef]
- Zheng, Q.; Lyu, H.-M.; Zhou, A.; Shen, S.-L. Risk assessment of geohazards along Cheng-Kun railway using fuzzy AHP incorporated into GIS. Geomat. Nat. Hazards Risk 2021, 12, 1508–1531. [Google Scholar] [CrossRef]
- Han, J.; Kim, J. A GIS-based seismic vulnerability mapping and assessment using AHP: A case study of Gyeongju, Korea. Korean J. Remote Sens. 2019, 35, 217–228. [Google Scholar]
- Malakar, S.; Rai, A.K.; Gupta, A.K. Earthquake risk mapping in the Himalayas by integrated analytical hierarchy process, entropy with neural network. Nat. Hazards 2022, 116, 951–975. [Google Scholar] [CrossRef]
- Fariza, A.; Abhimata, N.P.; Hasim, J.A.N. Earthquake disaster risk map in east Java, Indonesia, using analytical hierarchy process—Natural break classification. In Proceedings of the 2016 International Conference on Knowledge Creation and Intelligent Computing (KCIC), Manado, Indonesia, 15–17 November 2016; pp. 141–147. [Google Scholar]
- Liu, S.; Cui, Y.; Lu, F.; Qin, X. The analysis of relief amplitude in Qinghai Province based on GIS. In Proceedings of the 2013 21st International Conference on Geoinformatics, Kaifeng, China, 20–22 June 2013; pp. 1–5. [Google Scholar]
- Sun, L.; Su, G.; Tian, Q.; Qi, W.; Liu, F.; Qi, M.; Li, R. Religious belief and Tibetans’ response to earthquake disaster: A case study of the 2010 Ms 7.1 Yushu earthquake, Qinghai Province, China. Nat. Hazards 2019, 99, 141–159. [Google Scholar] [CrossRef]
- Jena, R.; Pradhan, B.; Beydoun, G. Earthquake vulnerability assessment in Northern Sumatra province by using a multi-criteria decision-making model. Int. J. Disaster Risk Reduct. 2020, 46, 101518. [Google Scholar] [CrossRef]
- Sarmah, T.; Das, S. Earthquake vulnerability assessment for RCC buildings of Guwahati City using rapid visual screening. Procedia Eng. 2018, 212, 214–221. [Google Scholar] [CrossRef]
- Alizadeh, M.; Ngah, I.; Hashim, M.; Pradhan, B.; Pour, A.B. A hybrid analytic network process and artificial neural network (ANP-ANN) model for urban earthquake vulnerability assessment. Remote Sens. 2018, 10, 975. [Google Scholar] [CrossRef]
- Kamranzad, F.; Memarian, H.; Zare, M. Earthquake risk assessment for Tehran, Iran. ISPRS Int. J. Geo-Inf. 2020, 9, 430. [Google Scholar] [CrossRef]
- Liu, Y.; Lu, C.; Yang, X.; Wang, Z.; Liu, B. Fine-scale coastal storm surge disaster vulnerability and risk assessment model: A case study of Laizhou Bay, China. Remote Sens. 2020, 12, 1301. [Google Scholar] [CrossRef]
- Adger, W.N. Vulnerability. Glob. Environ. Change 2006, 16, 268–281. [Google Scholar] [CrossRef]
- Crowley, H.; Despotaki, V.; Rodrigues, D.; Silva, V.; Toma-Danila, D.; Riga, E.; Karatzetzou, A.; Fotopoulou, S.; Zugic, Z.; Sousa, L. Exposure model for European seismic risk assessment. Earthq. Spectra 2020, 36, 252–273. [Google Scholar] [CrossRef]
- Zhao, D.; Lancuo, Z.; Hou, G.; Xu, C.; Li, W. Assessment of geological disaster susceptibility in the Hehuang Valley of Qinghai Province. J. Geomech. 2021, 27, 83–95. [Google Scholar]
- Wang, C.; Wang, J.; Naudiyal, N.; Wu, N.; Cui, X.; Wei, Y.; Chen, Q. Multiple effects of topographic factors on Spatio-temporal variations of vegetation patterns in the three parallel rivers region, Southeast Qinghai-Tibet Plateau. Remote Sens. 2021, 14, 151. [Google Scholar] [CrossRef]
- Li, B.; Wang, N.; Chen, J. GIS-based landslide susceptibility mapping using information, frequency ratio, and artificial neural network methods in Qinghai Province, Northwestern China. Adv. Civ. Eng. 2021, 2021, 4758062. [Google Scholar] [CrossRef]
- Lipsey, M.W. Design Sensitivity; Sage: Newbury Park, CA, USA, 1990. [Google Scholar]
- Smit, B.; Wandel, J. Adaptation, adaptive capacity and vulnerability. Glob. Environ. Chang. 2006, 16, 282–292. [Google Scholar] [CrossRef]
- Shannon, C.E. A mathematical theory of communication. Bell Syst. Tech. J. 1948, 27, 379–423. [Google Scholar] [CrossRef]
- Nyimbili, P.H.; Erden, T.; Karaman, H. Integration of GIS, AHP and TOPSIS for earthquake hazard analysis. Nat. Hazards 2018, 92, 1523–1546. [Google Scholar] [CrossRef]
- Pedone, R.; Lombardo, P.; Diamantidis, D. Seismotectonic regionalization of the Red Sea area and its application to seismic risk analysis. Nat. Hazards 1992, 5, 233–247. [Google Scholar] [CrossRef]
- Shao, Z.; Wu, Y.; Ji, L.; Diao, F.; Shi, F.; Li, Y.; Long, F.; Zhang, H.; Wang, W.; Wei, W. Assessment of strong earthquake risk in the Chinese mainland from 2021 to 2030. Earthq. Res. Adv. 2022, 3, 100177. [Google Scholar] [CrossRef]
- Ota, Y.; Chen, Y.-G.; Chen, W.-S. Review of paleoseismological and active fault studies in Taiwan in the light of the Chichi earthquake of September 21, 1999. Tectonophysics 2005, 408, 63–77. [Google Scholar] [CrossRef]
- Jiandong, Z. Significance of the Altun Tagh fault of China. Epis. J. Int. Geosci. 1991, 14, 307–312. [Google Scholar] [CrossRef]
- Vicente, R.; Parodi, S.; Lagomarsino, S.; Varum, H.; Silva, J. Seismic vulnerability and risk assessment: Case study of the historic city centre of Coimbra, Portugal. Bull. Earthq. Eng. 2011, 9, 1067–1096. [Google Scholar] [CrossRef]
- Ambraseys, N.; Jackson, J. Earthquake hazard and vulnerability in the northeastern Mediterranean: The Corinth earthquake sequence of February–March 1981. Disasters 1981, 5, 355–368. [Google Scholar] [CrossRef] [PubMed]
- Van Westen, C.J. Remote sensing and GIS for natural hazards assessment and disaster risk management. Treatise Geomorphol. 2013, 3, 259–298. [Google Scholar]
- Theilen-Willige, B.; Aher, S.P.; Gawali, P.B.; Venkata, L.B. Seismic hazard analysis along Koyna Dam area, western Maharashtra, India: A contribution of remote sensing and GIS. Geosciences 2016, 6, 20. [Google Scholar] [CrossRef]
- Ahmad, M.N.; Shao, Z.; Aslam, R.W.; Ahmad, I.; Liao, M.; Li, X.; Song, Y. Landslide hazard, susceptibility and risk assessment (HSRA) based on remote sensing and GIS data models: A case study of Muzaffarabad Pakistan. Stoch. Environ. Res. Risk Assess. 2022, 36, 4041–4056. [Google Scholar] [CrossRef]
- Wang, J.; Yang, X.; Wang, Z.; Cheng, H.; Kang, J.; Tang, H.; Li, Y.; Bian, Z.; Bai, Z. Consistency Analysis and Accuracy Assessment of Three Global Ten-Meter Land Cover Products in Rocky Desertification Region—A Case Study of Southwest China. ISPRS Int. J. Geo-Inf. 2022, 11, 202. [Google Scholar] [CrossRef]
- Manfré, L.A.; Hirata, E.; Silva, J.B.; Shinohara, E.J.; Giannotti, M.A.; Larocca, A.P.C.; Quintanilha, J.A. An analysis of geospatial technologies for risk and natural disaster management. ISPRS Int. J. Geo-Inf. 2012, 1, 166–185. [Google Scholar] [CrossRef]
- Tralli, D.M.; Blom, R.G.; Zlotnicki, V.; Donnellan, A.; Evans, D.L. Satellite remote sensing of earthquake, volcano, flood, landslide and coastal inundation hazards. ISPRS J. Photogramm. Remote Sens. 2005, 59, 185–198. [Google Scholar] [CrossRef]
- Nobrega, R.; O’hara, C.; Vijayaraj, V.; Olson, G.; Kim, S.; Quintanilha, J.; Barros, M. Extracting and classifying bare soil erosion risk areas in an urban basin using object-oriented technologies, high resolution imagery and elevation data. In Proceedings of the Geographic Information Systems and Water Resources IV-AWRA Spring Specialty Conference, Houston, TX, USA, 8–10 May 2006. [Google Scholar]


| PGA/g | |||||
|---|---|---|---|---|---|
| Intensity | V | VI | VII | VIII | IX |
| level | 1 | 2 | 3 | 4 | 5 |
| explain | Very low | Low | Moderate | High | Very high |
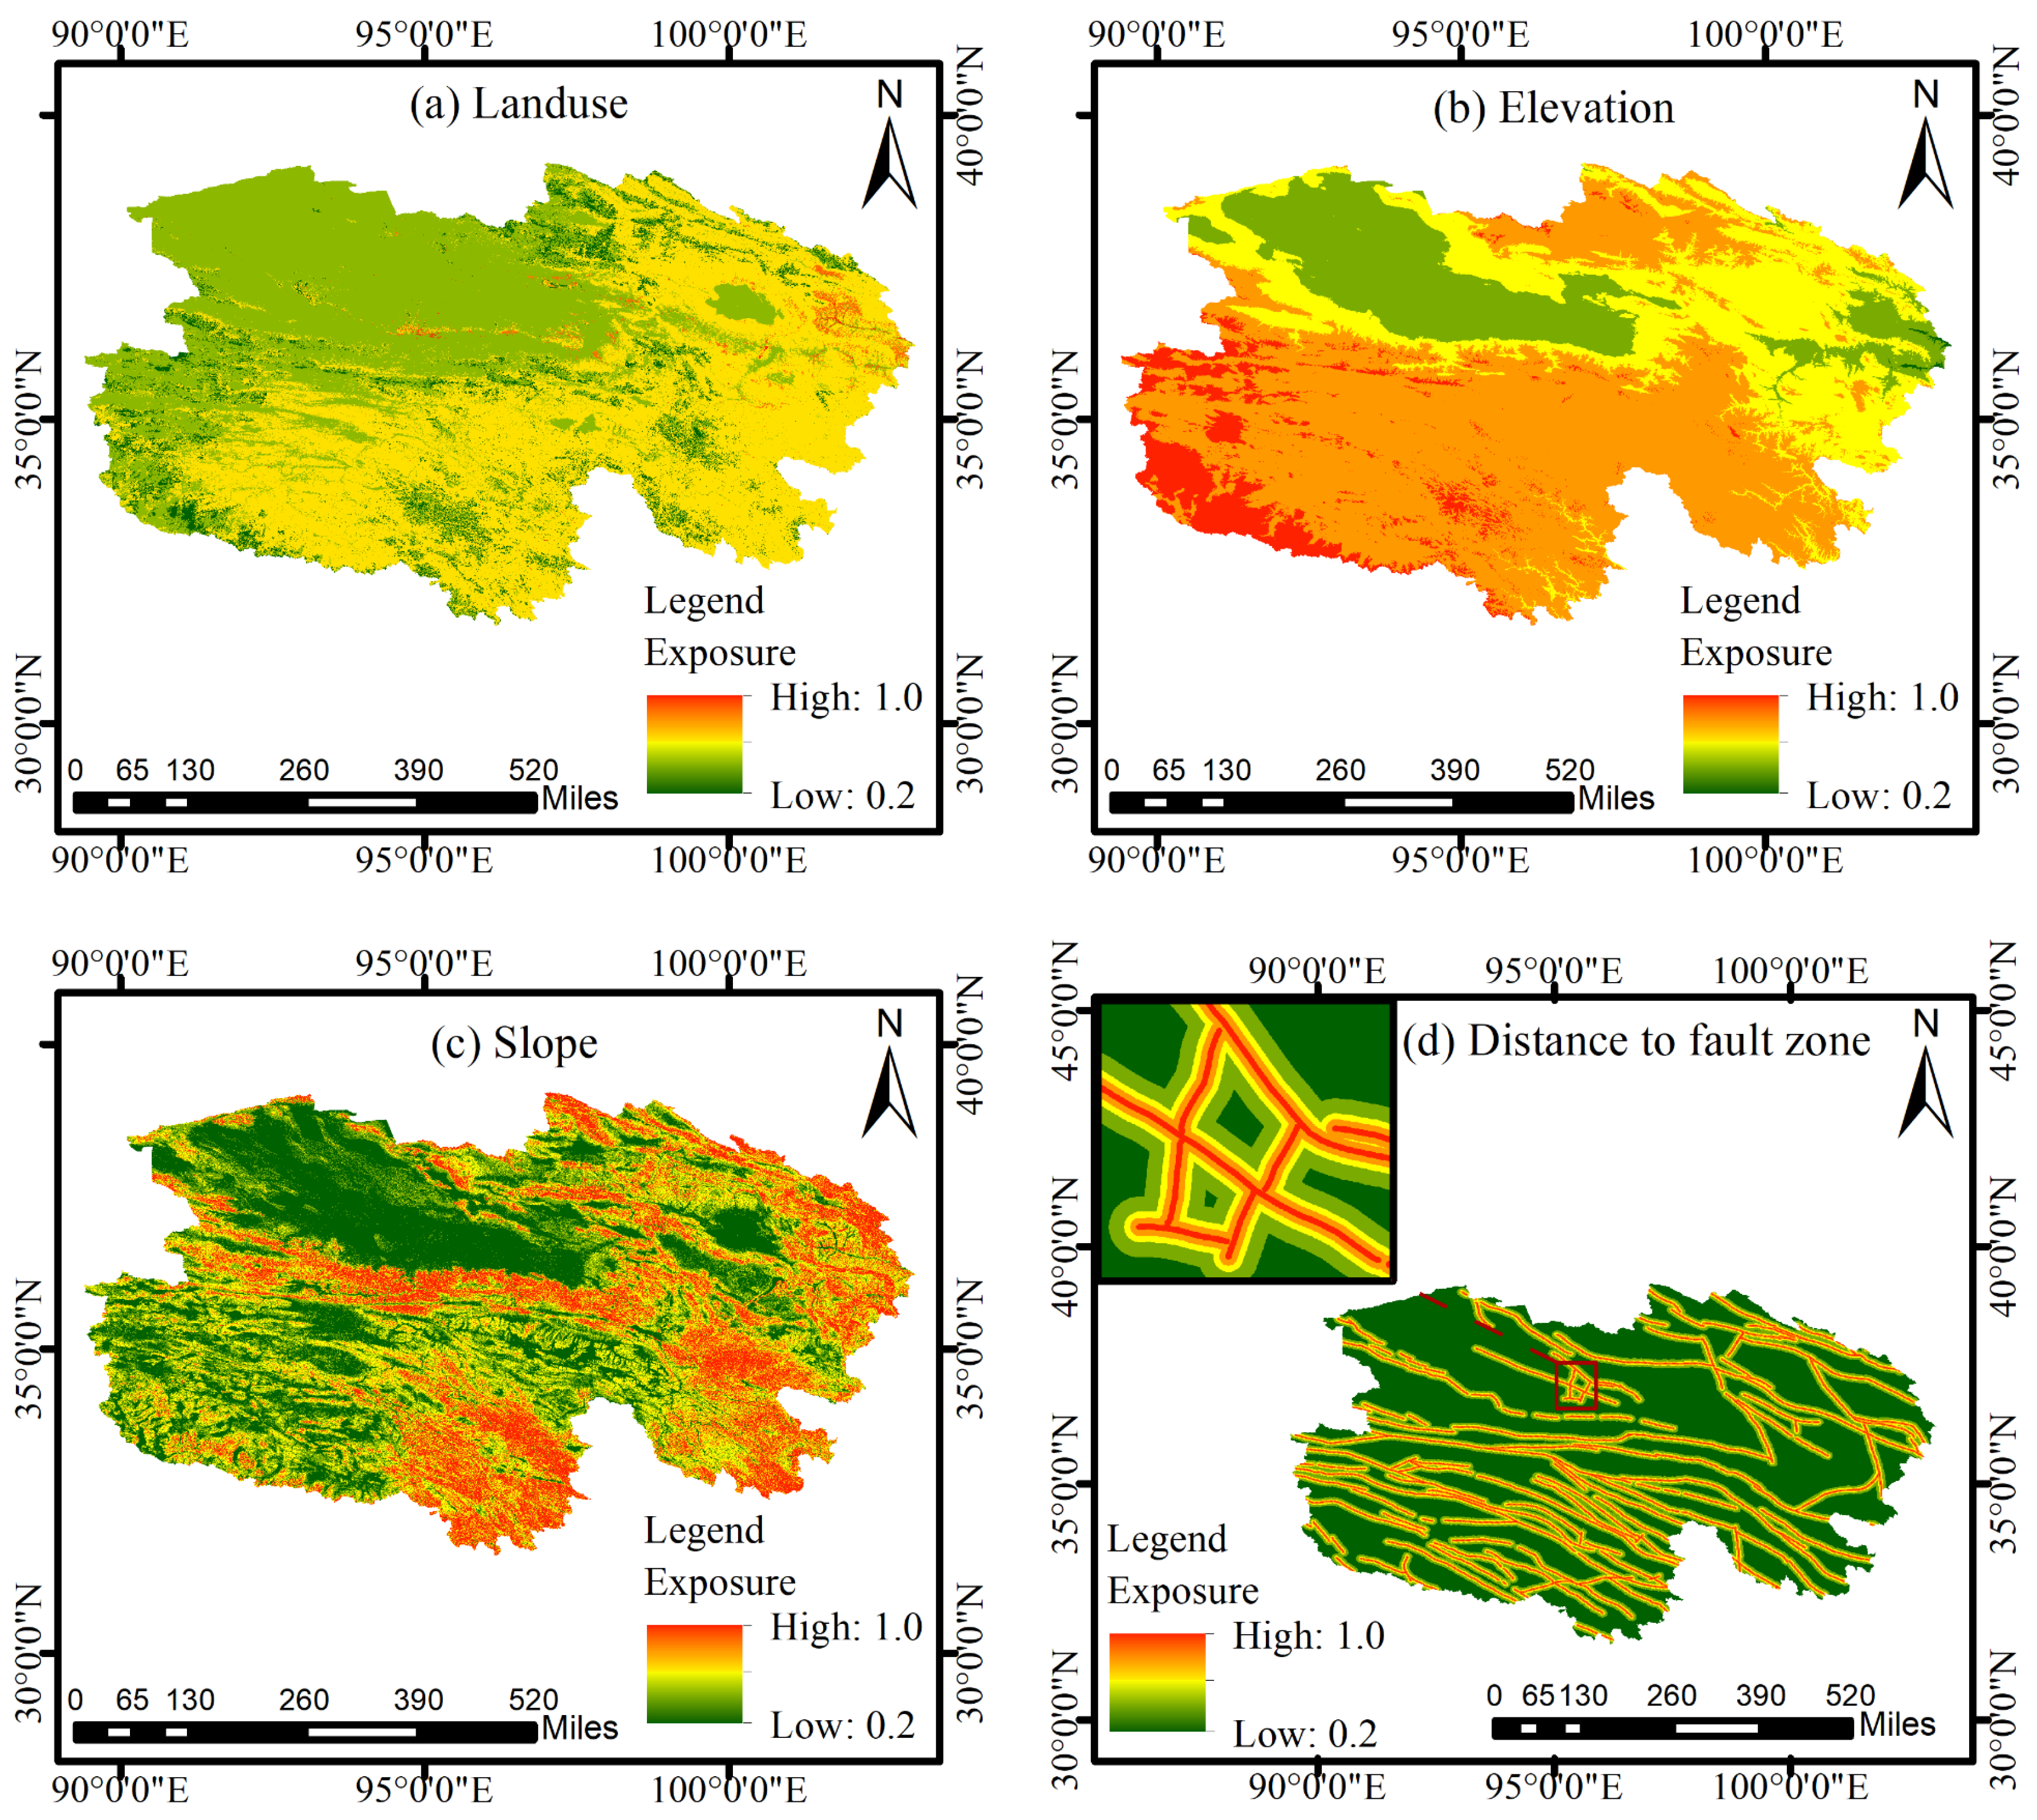
| Indicator | Judgment Criterion | Exposure Value | Weight |
|---|---|---|---|
| Land use | Built-up | 1.0 | 0.024 |
| Cropland | 0.8 | ||
| Vegetation | 0.6 | ||
| Water | 0.4 | ||
| Bareland | 0.4 | ||
| Snow/Ice | 0.2 | ||
| Wetland | 0.2 | ||
| Elevation (km) | <2 | 0.2 | 0.132 |
| 2–3 | 0.4 | ||
| 3–4 | 0.6 | ||
| 4–5 | 0.8 | ||
| >5 | 1.0 | ||
| Slope (°) | <2 | 0.2 | 0.225 |
| 2–6 | 0.4 | ||
| 6–15 | 0.6 | ||
| 15–25 | 0.8 | ||
| >25 | 1.0 | ||
| Distance to fault zone (km) | <1.0 | 1.0 | 0.110 |
| 1.0–3.0 | 0.8 | ||
| 3.0–5.0 | 0.6 | ||
| 5.0–10.0 | 0.4 | ||
| >10.0 | 0.2 | ||
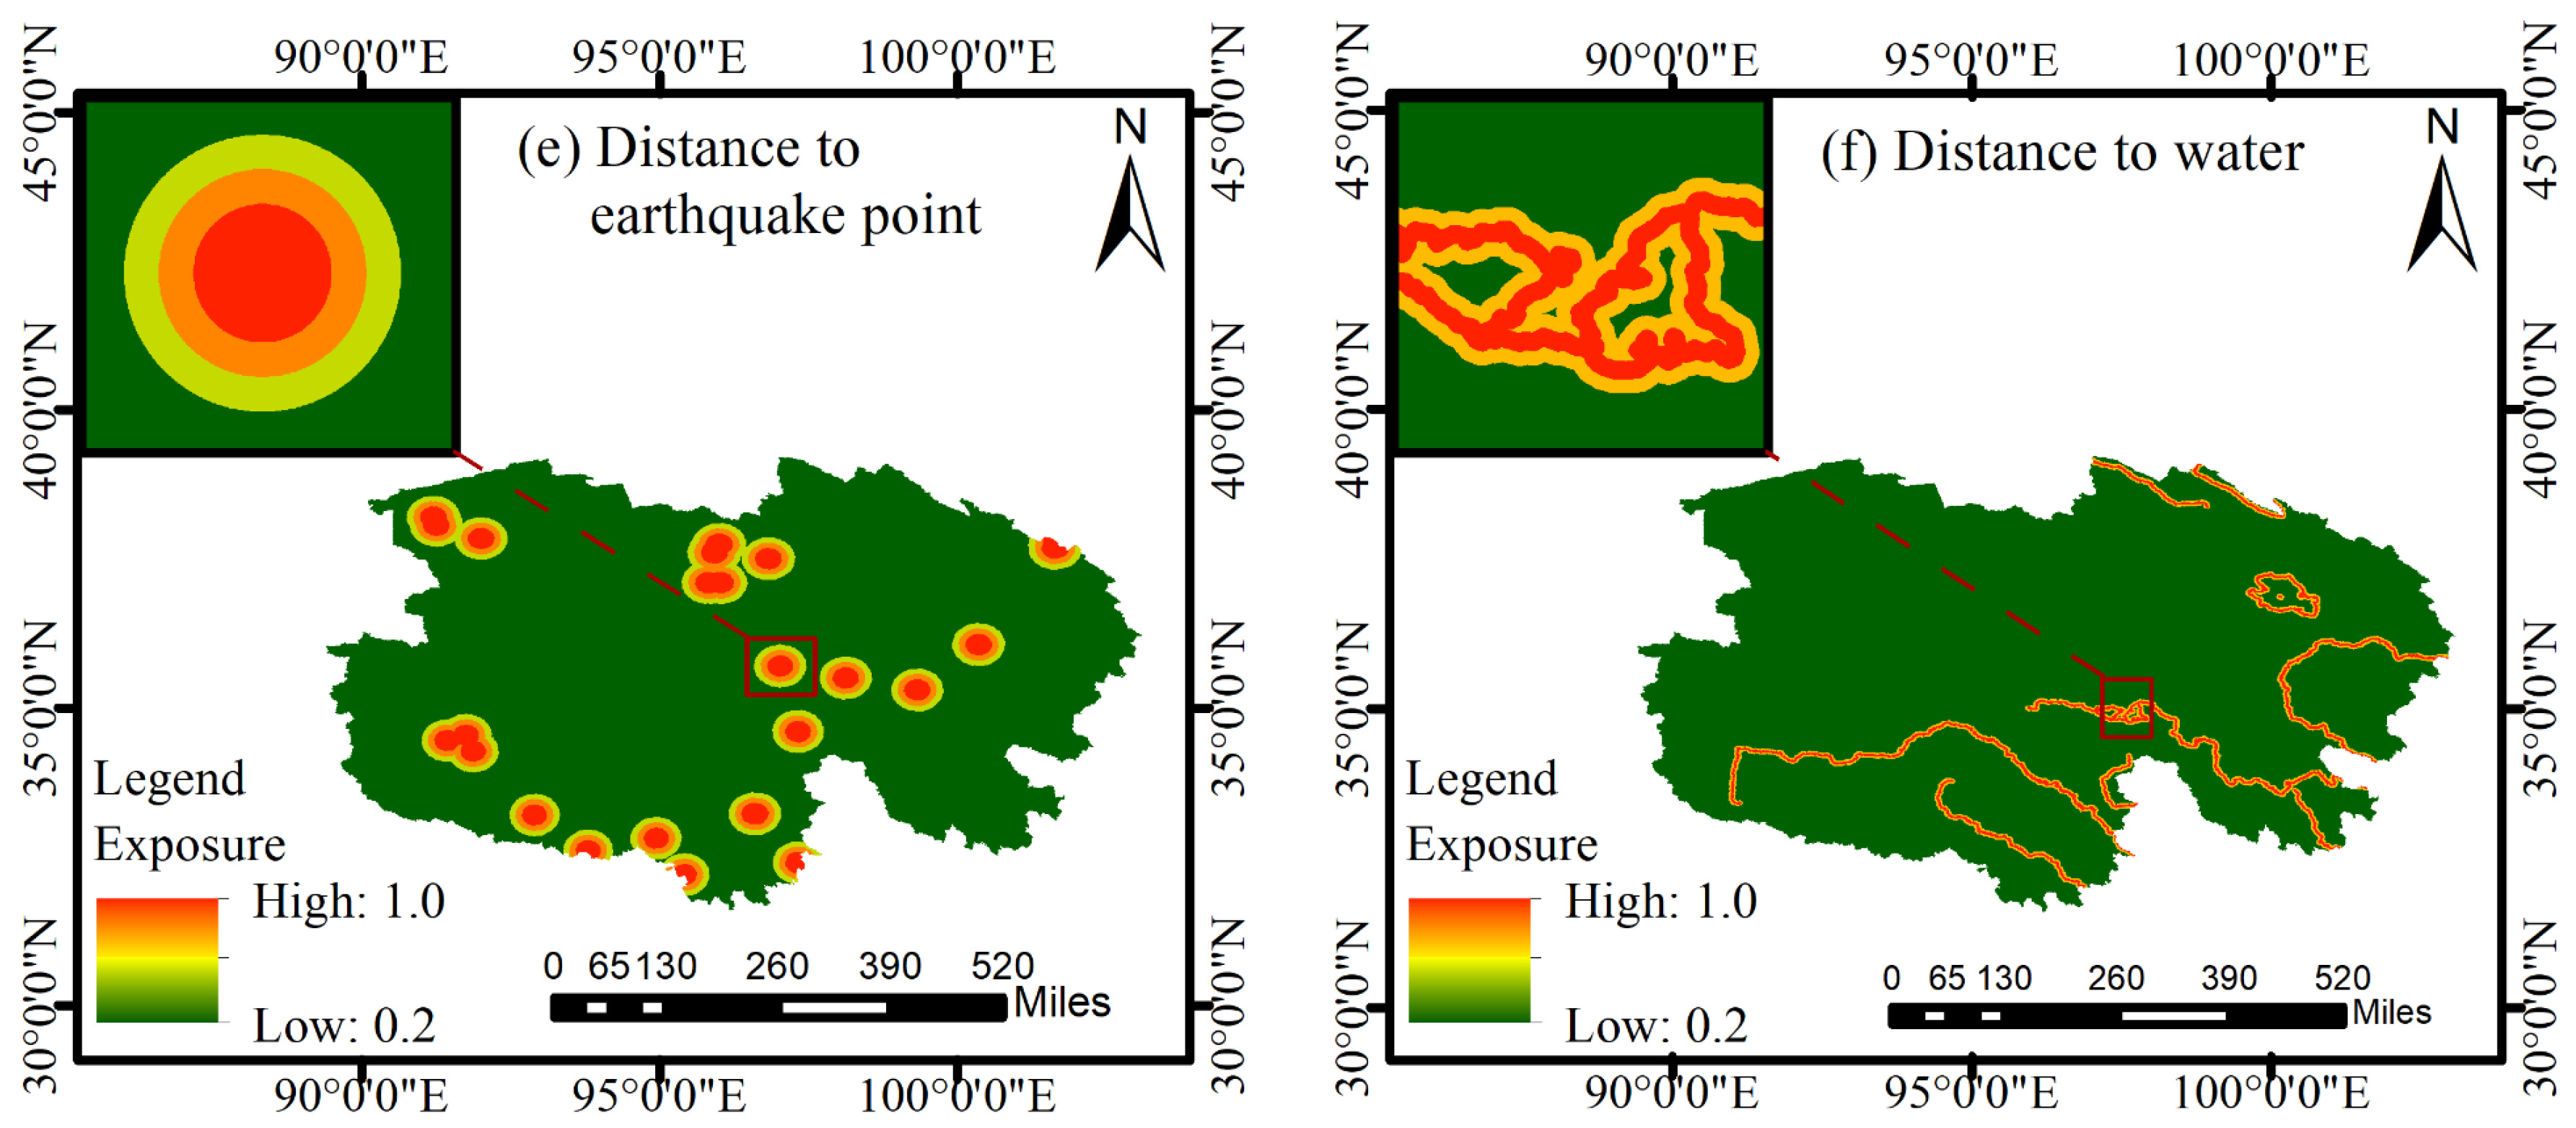
| Distance to earthquake point (km) | <10 | 1.0 | 0.458 |
| 10–20 | 0.8 | ||
| 20–30 | 0.6 | ||
| 30–40 | 0.4 | ||
| >40 | 0.2 | ||
| Distance to water (km) | <0.5 | 1.0 | 0.051 |
| 0.5–1.0 | 0.8 | ||
| 1.0–2.0 | 0.6 | ||
| 2.0–5.0 | 0.4 | ||
| >5.0 | 0.2 |
| Vulnerability Dimension | No. | Indicator | Impact to Vulnerability |
|---|---|---|---|
| Exposure | 1 | Areas of land use with the exposure value of 0.2–0.4 | + 1 |
| 2 | Areas of land use with the exposure value of 0.4–0.6 | + | |
| 3 | Areas of land use with the exposure value of 0.6–0.8 | + | |
| 4 | Areas of land use with the exposure value of 0.8–1.0 | + | |
| 5 | Total population | + | |
| 6 | Percentage of females | + | |
| Sensitivity | 7 | Percentage of population aged 14 and under | + |
| 8 | Percentage of population aged 65 and above | + | |
| Adaptability | 9 | General public budget expenditure | - 1 |
| 10 | GDP | - | |
| 11 | Urban disposable income per capita | - | |
| 12 | Rural disposable income per capita | - | |
| 13 | Number of hospital medical staff | - | |
| 14 | Number of medical institutions | - |
| Vulnerability Value | Vulnerability Level | Vulnerability Interpretation |
|---|---|---|
| (0.000, 0.035] | 1 | Very low |
| (0.035, 0.068] | 2 | Low |
| (0.068, 0.169] | 3 | Moderate |
| (0.169, 0.458] | 4 | High |
| (0.458, 1.000] | 5 | Very high |
| Vulnerability | 1 Level | 2 Level | 3 Level | 4 Level | 5 Level | |
|---|---|---|---|---|---|---|
| Risk | ||||||
| 1 level | 1 level | 1 level | 1 level | 2 level | 3 level | |
| 2 level | 1 level | 1 level | 2 level | 3 level | 4 level | |
| 3 level | 1 level | 2 level | 3 level | 4 level | 5 level | |
| 4 level | 2 level | 3 level | 4 level | 5 level | 5 level | |
| 5 level | 3 level | 4 level | 5 level | 5 level | 5 level | |
Disclaimer/Publisher’s Note: The statements, opinions and data contained in all publications are solely those of the individual author(s) and contributor(s) and not of MDPI and/or the editor(s). MDPI and/or the editor(s) disclaim responsibility for any injury to people or property resulting from any ideas, methods, instructions or products referred to in the content. |
© 2024 by the authors. Licensee MDPI, Basel, Switzerland. This article is an open access article distributed under the terms and conditions of the Creative Commons Attribution (CC BY) license (https://creativecommons.org/licenses/by/4.0/).
Share and Cite
Zhang, Z.; Kang, J.; Wang, J.; Fang, D.; Liu, Y. Earthquake Risk Assessment in Seismically Active Areas of Qinghai Province Based on Geographic Big Data. Atmosphere 2024, 15, 648. https://doi.org/10.3390/atmos15060648
Zhang Z, Kang J, Wang J, Fang D, Liu Y. Earthquake Risk Assessment in Seismically Active Areas of Qinghai Province Based on Geographic Big Data. Atmosphere. 2024; 15(6):648. https://doi.org/10.3390/atmos15060648
Chicago/Turabian StyleZhang, Zhouping, Junmei Kang, Jun Wang, Dengmao Fang, and Yang Liu. 2024. "Earthquake Risk Assessment in Seismically Active Areas of Qinghai Province Based on Geographic Big Data" Atmosphere 15, no. 6: 648. https://doi.org/10.3390/atmos15060648
APA StyleZhang, Z., Kang, J., Wang, J., Fang, D., & Liu, Y. (2024). Earthquake Risk Assessment in Seismically Active Areas of Qinghai Province Based on Geographic Big Data. Atmosphere, 15(6), 648. https://doi.org/10.3390/atmos15060648