Abstract
The permafrost in Northeast China is experiencing rapid degradation due to the influence of climate change and human activities, profoundly impacting the local ecological environment and engineering construction. Understanding the spatiotemporal dynamics of long-term permafrost in this region is crucial; however, systematic research on this topic remains scarce. This study combines meteorological station data, MODIS land surface temperature (LST) datasets, and borehole locations to apply the surface frost number (SFn) model. This approach enables the simulation and estimation of the spatial distribution and changes in the area of the surface frost number without vegetation effects (SFnv) and permafrost temperature (PT) in Northeast China from 1971 to 2020. The area of the SFnv > 0.49 within the permafrost region decreased substantially from approximately 44.353 × 10⁴ km2 to 19.909 × 10⁴ km2 between 1971 and 2020, with a notable change in 1988. The area of permafrost calculated using PT < 0 was slightly smaller, declining from 39.388 × 10⁴ km2 to 29.852 × 10⁴ km2. There was also a significant increase in the area with PT ranging from −1 °C to 0 °C, indicating a decline in permafrost stability. Approximately 10.926 × 10⁴ km2 of stable permafrost has been transformed into semi-stable and unstable permafrost. Moreover, from 1982 to 2020, the NDVI was negatively correlated with the area of stable permafrost and positively correlated with the area of transitional or unstable permafrost. Vegetation cover decreased as transitional or unstable permafrost degraded. These findings provide valuable information for permafrost research and engineering development in cold regions, as well as for future planning and adaptation strategies.
1. Introduction
Permafrost is a critical component of the cryosphere, covering approximately 11% of the Earth’s exposed land surface. It is defined as ground (soil or rock) that has remained at or below 0 °C for at least two consecutive years [1,2,3]. The thermal state of permafrost is highly sensitive to climate changes such as those affecting air temperature and snow cover. In recent decades, air temperatures in high-latitude and high-altitude regions have risen faster than the global average [4,5,6]. Global permafrost temperature has increased by 0.29 ± 0.12 °C [5], and rapid and extensive permafrost degradation will alter the hydrological and biogeochemical cycles in these regions, significantly impacting topography, ecosystems, shallow groundwater, infrastructure, and socioeconomic conditions [7,8,9]. Moreover, as permafrost thaws, it releases significant amounts of organic carbon, which can result in the emission of greenhouse gases such as carbon dioxide and methane. This process has the potential to profoundly impact regional and even global climate systems, contributing to further warming [10,11,12,13].
Northeast China stands out as a critical ecological and permafrost zone within the mid-to-high latitudes. It serves as a significant ecological barrier in Northern China and Northeast Asia, playing a pivotal role in safeguarding biodiversity and regulating the regional climate [14]. Permafrost is found primarily in Eurasia and northern North America. The permafrost region in Northeast China is located at the southern edge of the Eurasian permafrost and is the second-largest permafrost distribution region and the only high-latitude permafrost region in China. Climate warming and human activities have intensified permafrost degradation in this region. Over the past 50 years, the average annual temperature in Northeast China has increased by 0.9–2.2 °C [15]. Permafrost degradation involves the northward retreat of its southern boundary, permafrost thinning, rising mean annual ground temperature (MAGT), and increased active-layer thickness (ALT) [16,17]. These changes in the permafrost environment inevitably adversely affect local engineering projects [18]. Simultaneously, permafrost degradation profoundly impacts the northern forest ecosystem and hydrological structure by altering soil hydrothermal characteristics, leading to extensive ecological deterioration. This includes the sharp decline of natural forest belts and shrinking wetlands in the Greater and Lesser Xing’an Mountains [19]. Thus, accurately estimating the distribution and degradation processes of permafrost in Northeast China is essential in the context of climate change. These estimations provide a critical foundation for studying the patterns and processes of terrestrial ecosystems.
The characteristics of permafrost in Northeast China are primarily influenced by latitude and altitude zonality, as well as other factors such as inversion layers, vegetation, snow cover, annual average temperature, and soil properties [20]. Advances in field investigations, physical models, empirical models, machine learning, and remote sensing technology have diversified permafrost mapping methods and achieved notable successes in monitoring and mapping the permafrost in Northeast China. Wei et al. (2011) [21] proposed an equivalent latitude model for predicting permafrost in Northeast China using the unsteady-state heat conduction model. Their findings indicated that permafrost in Northeast China will decrease to 18.4 × 10⁴ km2 in 50 years and 12.9 × 10⁴ km2 in 100 years, with more severe degradation in the eastern part than in the western part. Zhang et al. (2021) [22] estimated the mean annual ground temperature (MAGT) in Northeast China from 1950 to 2010 using weather station data and reanalysis data through a geographically weighted regression model. Their results revealed a decrease in permafrost area from 48 × 104 km2 to 31 × 104 km2, with the southern boundary shifting northward by 0.1 to 1.1 degrees. Gao et al. (2020) [23] proposed a permafrost monitoring method that combined the freeze–thaw state of surface soil determined by the dual-index algorithm and a permafrost classification method based on thermal stability. The results showed that the proportion of permafrost in Northeast China decreased by 6.5% from 2002 to 2017, with the southern boundary moving by approximately 25–75 km. Huang et al. (2023) [24] employed the Geophysical Institute Permafrost Lab (GIPL) model to map the spatiotemporal variation in the mean annual temperature at the bottom of the active layer (MATBAL) and the active-layer thickness (ALT) in Northeast China. The results indicated that MATBAL increased rapidly at a rate of 0.17–0.83 °C per decade from 1961 to 2020. Shan et al. (2022) [18] enhanced the surface frost number (SFn) model by incorporating the normalized-difference vegetation index (NDVI) and forest crown density, establishing a statistical relationship between SFn and permafrost temperature to simulate the permafrost temperature distribution in Northeast China. Their results showed a decrease in permafrost area from 33 × 104 km2 to 27 × 104 km2 between 2003 and 2019.
Existing research indicates a rapid degradation of permafrost in Northeast China and a significant reduction in its area due to climate change in recent decades. However, the permafrost maps produced by different studies are different from each other, making it challenging to accurately capture the temporal and spatial changes of permafrost. Long-term research on permafrost changes often relies on meteorological station data or reanalysis data. However, reanalysis data is characterized by a large scale, which can lead to insufficient detail representation. Spatial interpolation data cannot provide accurate spatial distribution characteristics, particularly in regions with a sparse and uneven distribution of meteorological stations. To address these limitations, remote sensing technology can provide more accurate and systematic large-scale observation data, which can be used to make up for the lack of observations of permafrost monitoring points on the regional and global scales [8,25,26]. Some variables related to permafrost, such as LST, vegetation cover, and snow cover, etc., can be obtained with high-precision and high-temporal-resolution data by remote sensing sensors. Additionally, vegetation plays a crucial role that cannot be ignored in the study of permafrost in Northeast China, as the extensive boreal coniferous forest may cause significant deviations in surface temperature measurements.
Addressing the aforementioned challenges, this study is based on the SFn model, using meteorological monitoring data to extend the MODIS LST dataset. Additionally, two vegetation indicators, NDVI and the canopy density index, were introduced to enhance the SFn model’s outcomes. The spatial distribution and area of the SFnv and PT in Northeast China during different periods from 1971 to 2020 were simulated and estimated. The spatial–temporal variation trend and type of transformation process of permafrost were analyzed by linear regression and transfer-type methods, while the mutation point detection method determined the year of mutation for various stable permafrost types. Furthermore, the impact of the permafrost degradation process on vegetation was discussed. Through these analyses, this study contributes to a better understanding of the long-term dynamic changes in permafrost in Northeast China and provides fundamental scientific data for engineering construction, resource development, ecological restoration, and environmental protection.
2. Materials and Methods
2.1. Study Area
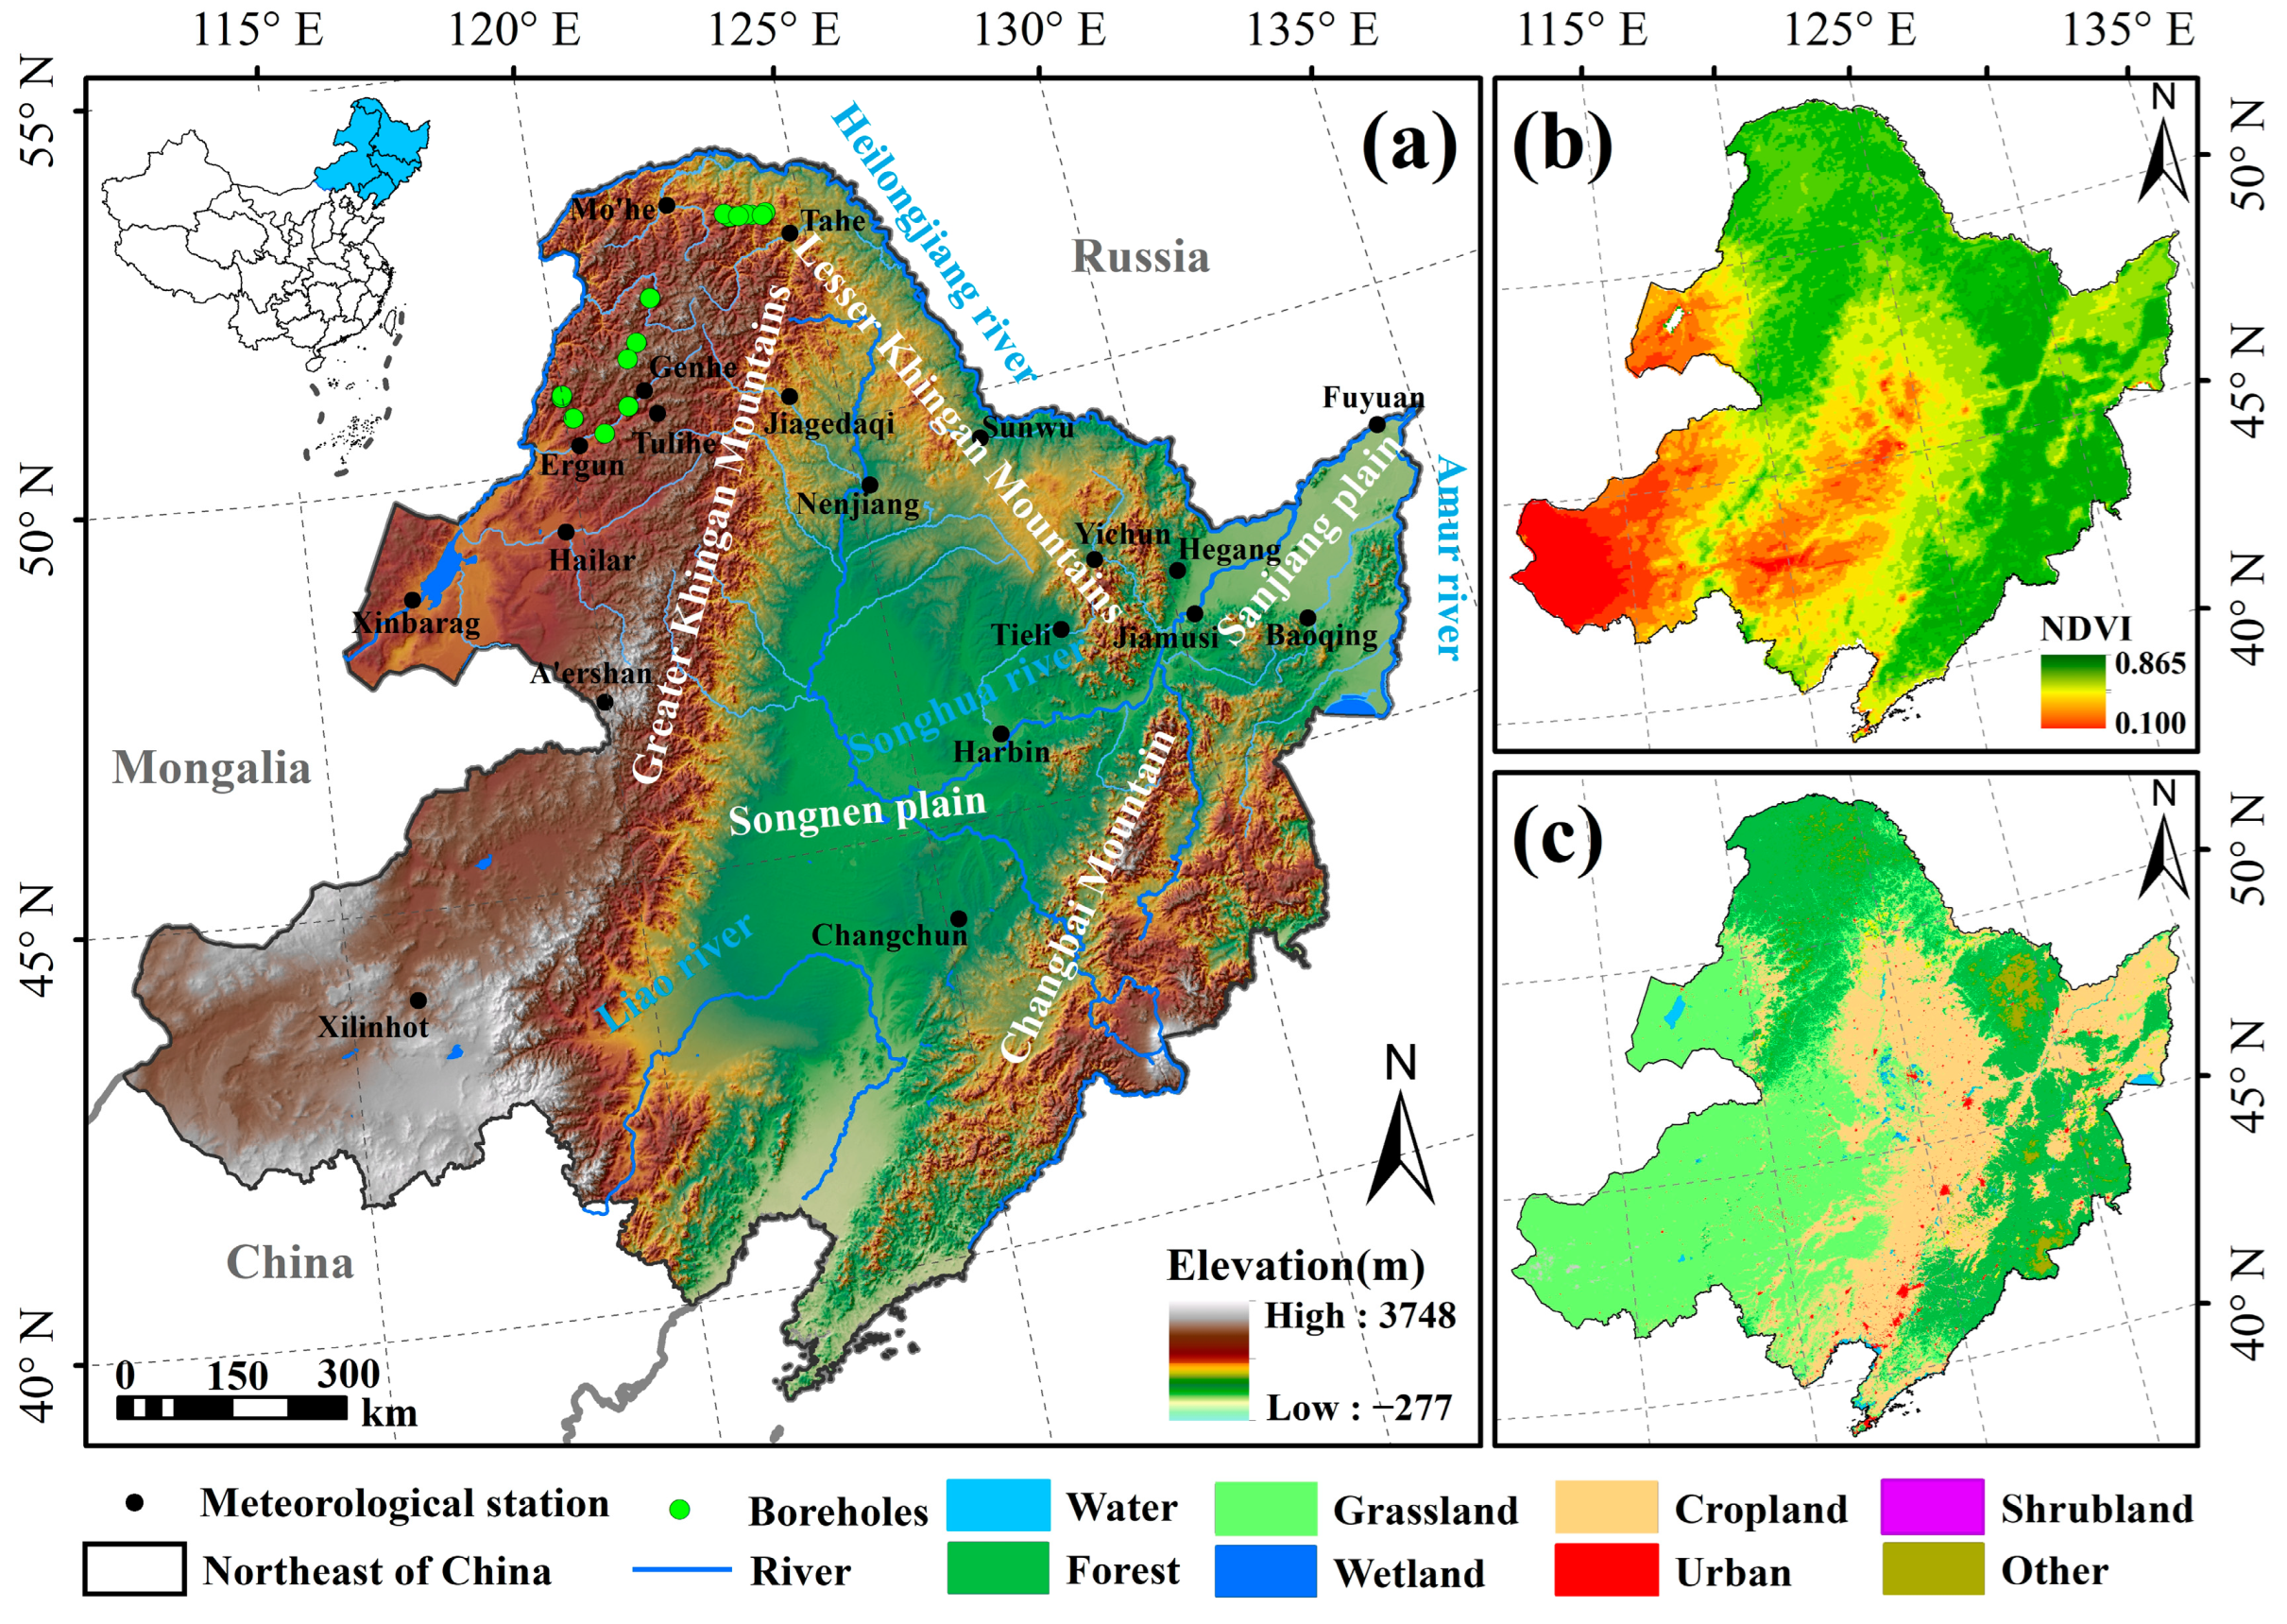
Northeast China, including eastern Inner Mongolia, Heilongjiang, Jilin, and Liaoning provinces, extends from 115°32′ E to 135 °09′ E and 38°42′ N to 53°35′ N (Figure 1). It has an area of approximately 1.52 × 10⁶ km2 and an altitude below 2700 m [14,27]. The study area is surrounded by middle and low mountains in three directions—the Changbai Mountains in the southeast, the Greater Xing’an Mountains in the northwest, and the Lesser Xing’an Mountains in the northeast—and the Hulunbuir Plateau is located in the west. Vegetation distribution is primarily influenced by latitude, verticality, and zonality. The main types of vegetation in hilly and mountainous areas are cold-temperate broad-leaved and coniferous mixed forests, along with cold-temperate coniferous forests [28]. The Xing’an larch forest has several major zonal vegetation types. In the western region, semi-arid shrubs, grasslands, and temperate grasslands prevail. Most of the study area experiences a temperate continental monsoon climate, and the continental climate gradually strengthens from east to west. The winter is long and cold, while the summer is rainy and hot, and the annual average temperature is low [14]. The eastern region falls within the cold-temperate and warm-temperate humid regions, while the western region belongs to the semi-arid region. The temperature gradually increases from north to south, with an annual average of −6~12 °C. Precipitation diminishes from east to west, ranging from 1100 to 80 mm, with 70–80% of the precipitation concentrated from mid-June to mid-August [29,30].
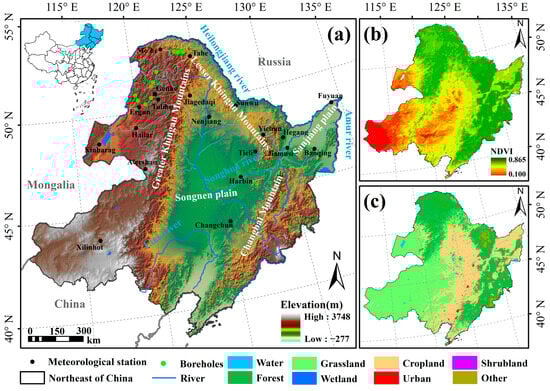
Figure 1.
Geographical location and elevation distribution (a), NDVI spatial distribution (b), and land cover type spatial distribution (c) in Northeast China.
The prevailing Siberian High pressure system in winter results in widespread and strong atmospheric temperature inversions, affecting the development and distribution of permafrost in this region [15,31]. The latitudinal and mountainous permafrost in northeast China is distributed on the southern edge of the degraded zone of the Eurasian permafrost region, primarily located in the Greater and Lesser Xing’an Mountains. Additionally, permafrost is also distributed in the Changbai Mountains in the southeast and in the Aershan and Huanggangliang Mountains in the southwest [21]. Compared with high-altitude permafrost and Arctic permafrost, the permafrost in Northeast China is thinner and has higher ground temperatures, rendering it highly susceptible to climate warming [22].
2.2. Data Source and Preprocessing
2.2.1. Meteorological Data
The GST data used in this study was obtained from the China National Meteorological Data Center (http://data.cma.cn/ (accessed on 22 January 2023)). Daily GST measurements at a depth of 0 cm from 231 meteorological stations in Northeast China were utilized for the period of 1971 to 2020. Before 2005, GST refers to the temperature of the snow surface in winter and of the surface in other seasons. After 2005, GST is the temperature at 0 cm depth (half of the temperature probe is buried in the soil) [22]. To ensure data quality, invalid values were excluded, and missing data were imputed using the mean method. Subsequently, annual freezing and thawing indices were calculated based on the daily average GST. These indices were further interpolated into high-resolution raster data with a spatial resolution of 1 km using multiple linear regression and residual methods. Finally, the corrected indices were inputted into the SFn model for subsequent analysis.
2.2.2. MODIS LST
The LST remote sensing data utilized in this study was obtained from the MOD11A2 dataset spanning from 2001 to 2020 (https://ladsweb.modaps.eosdis.nasa.gov, accessed on 10 December 2022). This dataset offers an 8-day temporal resolution and a spatial resolution of 1 km, providing two observations during the day and at night. After identifying and filling in missing values, we take the mean of the daytime and nighttime observations as the daily mean GST.
2.2.3. Vegetation Data
The NDVI dataset comes from the GIMMS NDVI3g+ from 1982 to 2010 and the MODIS NDVI dataset from 2001 to 2020. The MOD13A2 dataset obtained from the Earth Observing System dataset of the National Aeronautics and Space Administration (NASA), with a temporal resolution of 8 days and a spatial resolution of 1 km (https://ladsweb.modaps.eosdis.nasa.gov, accessed on 10 February 2023). Monthly NDVI data were derived using the maximum-value synthesis method to reduce the atmospheric influence on clouds and aerosols. GIMMS NDVI3g+ is the third-generation GIMMS AVHRR NDVI dataset released by NASA (https://ecocast.arc.nasa.gov/data/pub/, accessed on 10 February 2023), with a time resolution of 15 d and a spatial resolution of 0.0833°. For consistency, the GIMMS NDVI3g+ dataset was resampled to 1 km resolution and calculate NDVI monthly mean values [32].
2.2.4. Field Survey Data
The soil-temperature monitoring data of the permafrost layer were obtained from the Northeast Permafrost Region Geological Environment System Field Scientific Observation and Research Station of the Ministry of Education. The distribution of the monitoring points is shown in Figure 1. The soil-temperature monitoring equipment is a series of thermistor temperature probes buried at different depths in the soil layer. The sampling frequency is 1 time/d, and the data is transmitted wirelessly. Borehole data at the lower layer of seasonally frozen soil and the central parting zone are removed, while borehole data at the relatively less-disturbed road shoulder and slope toe positions are retained. The potential thermal influence of drilling on the temperature distribution of the frozen soil layer can be eliminated in about one year, and the data from the second year after monitoring is selected. A borehole with a drilling depth that can reach or penetrate the permafrost layer is selected, and the soil temperature at a depth of 12 m is used as the permafrost temperature. If the drilling depth cannot reach more than 12 m, the soil temperature 1 m below the bottom of the active permafrost layer is used as the permafrost temperature.
2.2.5. Supplementary Data
Shuttle Radar Topography Mission (SRTM) digital elevation data, with a resolution of 30 m, were obtained from the United States Geological Survey (USGS) (https://earthexplorer.usgs.gov/ (accessed on 25 February 2023)). The land use data is the MCD12Q1 data product with a spatial resolution of 500 m in 2019.
2.3. Methods
2.3.1. Modification of the SFn Model
The SFn model uses the freezing indices and thawing indices derived from the GST and utilizes their relationship to delineate the boundary between permafrost and seasonal frost [33,34]. The SFn calculation is based on the following formula:
where DDT and DDF are the thawing indices and freezing indices. DDT is calculated by summing the daily average GST values greater than 0 °C throughout the year, while DDF is calculated by summing the daily average GST values less than 0 °C throughout the year.
The SFn model, after accounting for the influence of vegetation factors, can be expressed as follows:
Among them, represents the crown density index, with an average value ranging from 0.2 to 0.69 in the study area. This study takes the empirical value of 0.56 from previous studies [17]. NDVIg is the average value of the NDVI in each growing season, representing the overall status of vegetation coverage throughout the year.
In order to extend the period of SFnv, the SFn calculated based on MODIS LST is supplemented by the SFn calculated by the 0 cm GST of the meteorological station. The SFn from 1971 to 2001 is:
where n represents the average ratios of SFn calculated based on meteorological stations (SFnm), and the SFn is calculated based on MODIS data (SFnv).
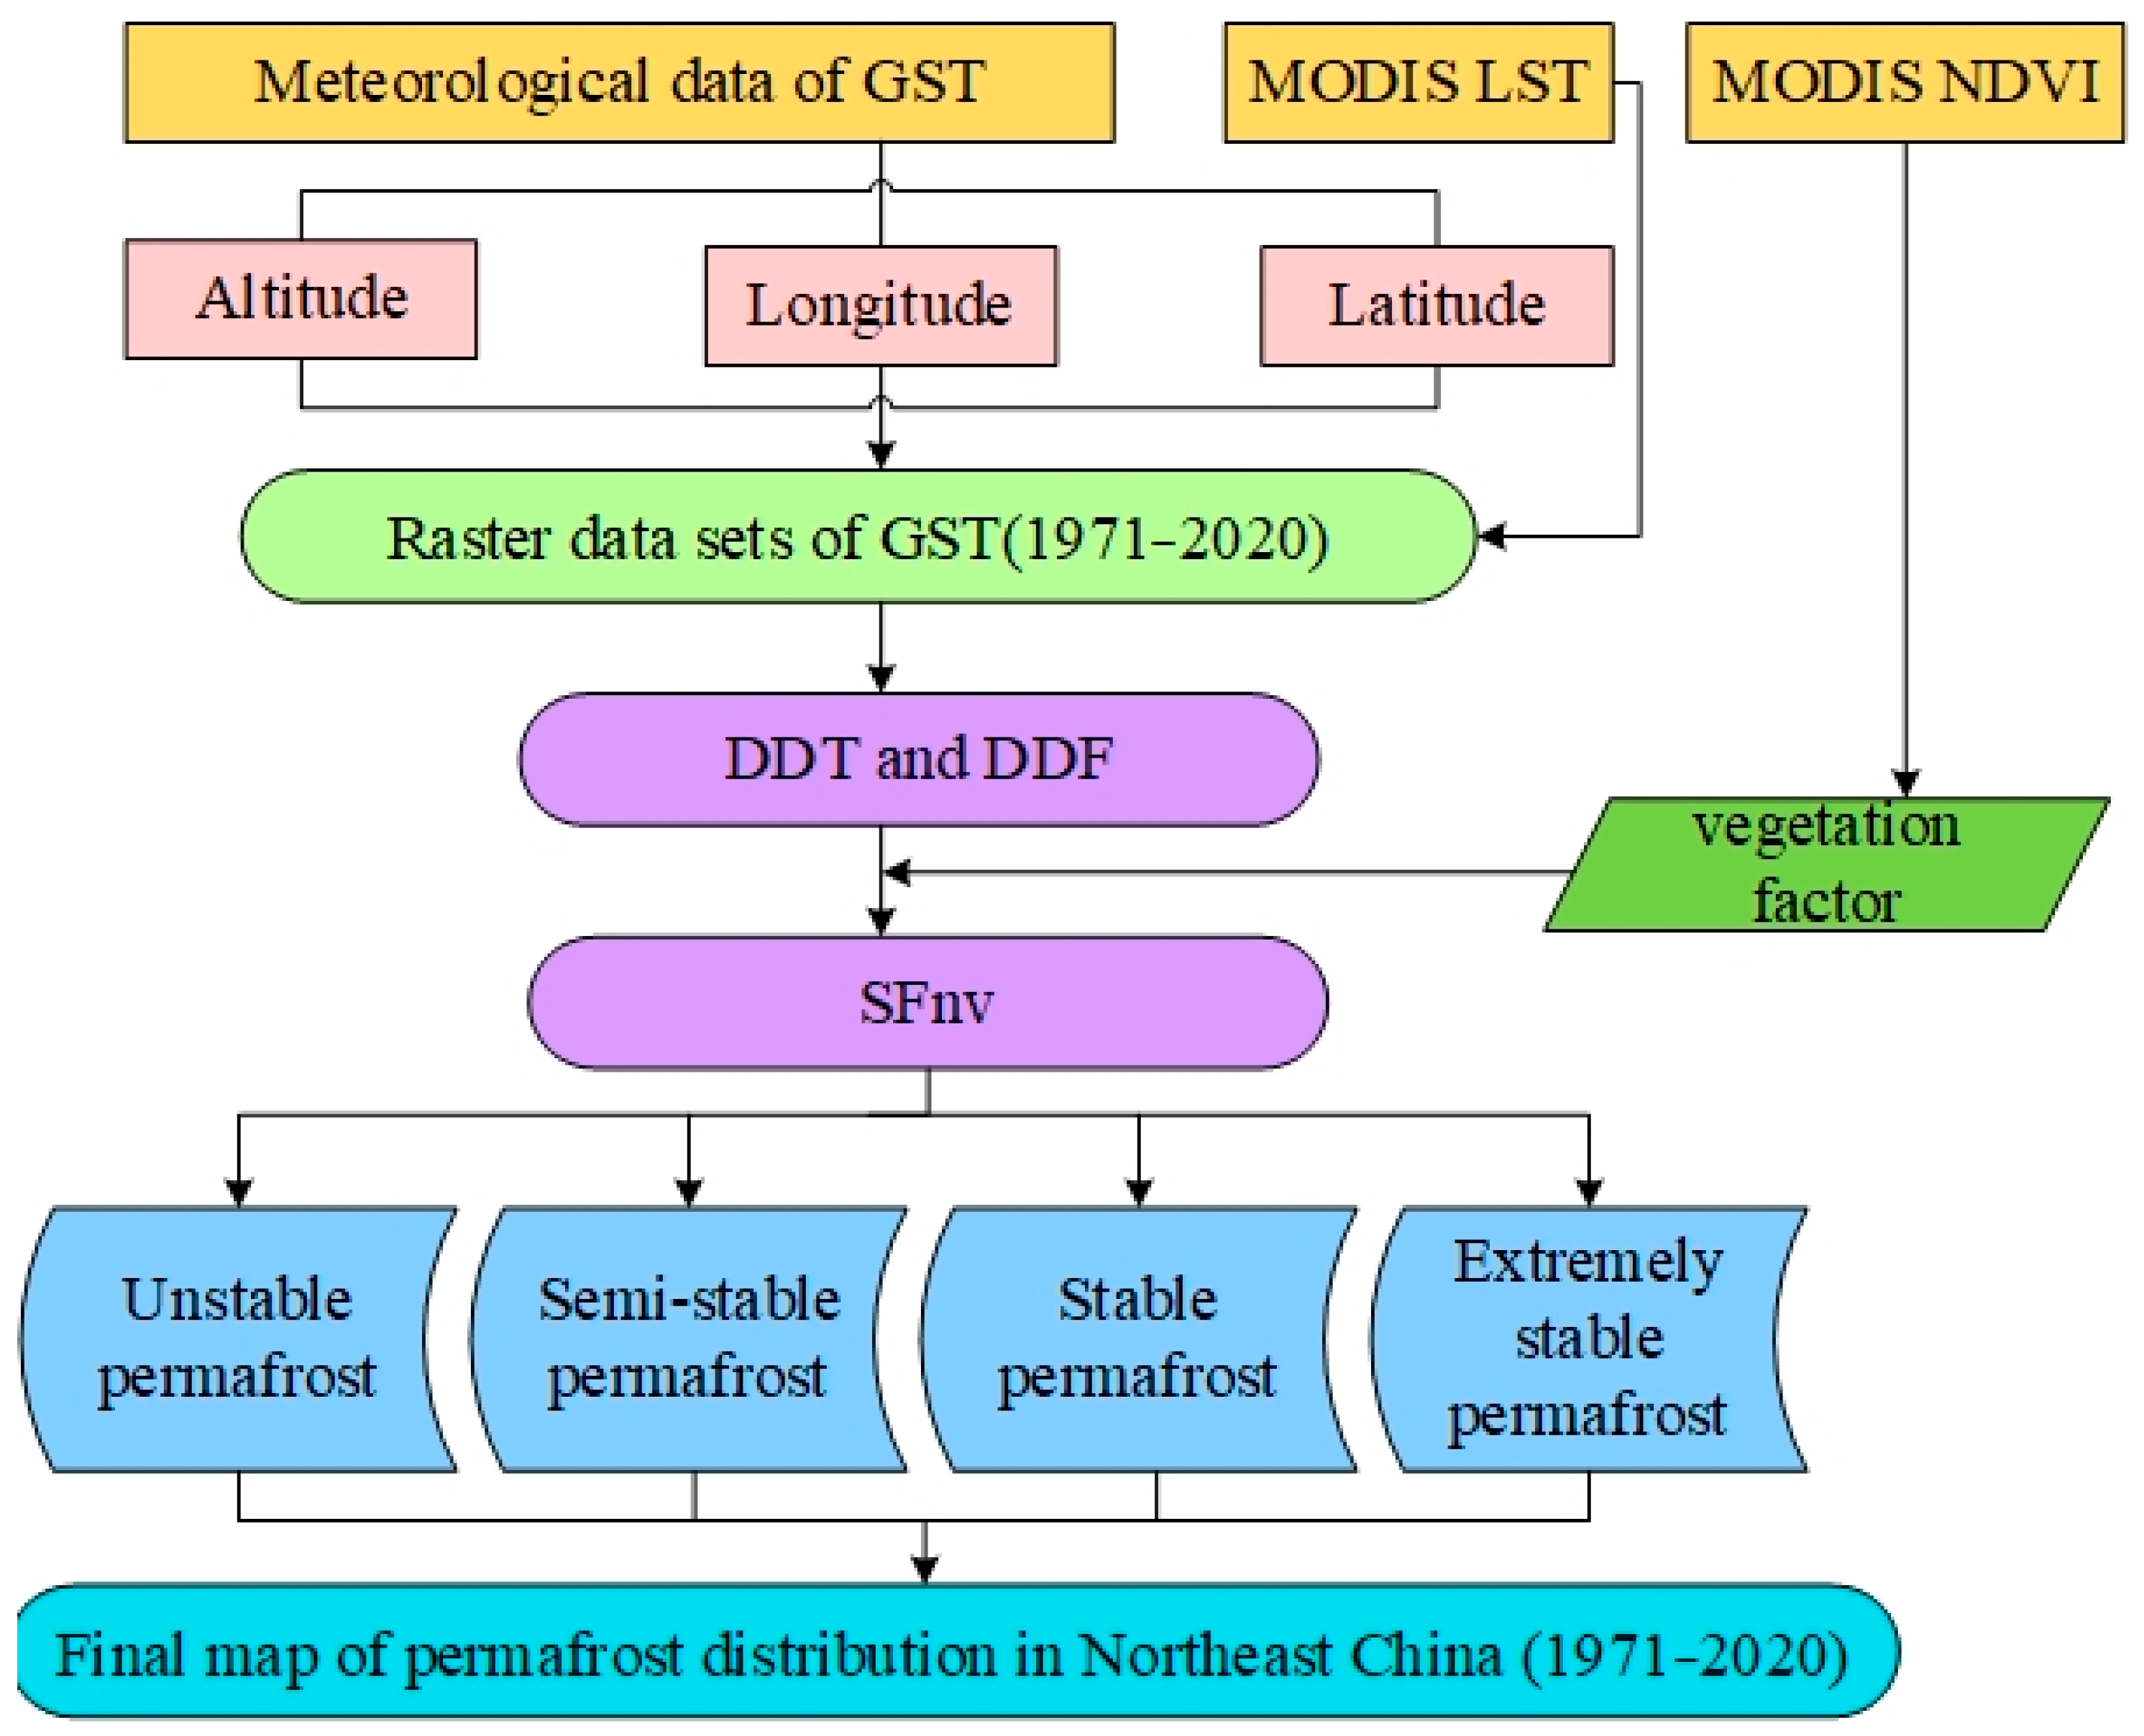
The calculated SFnv is used to establish the latitudinal zoning of permafrost [34]. In this study, the classification criteria for different thermal stability states of permafrost in Northeast China are based on extensive field surveys, investigation data, and monitoring results previously proposed by Shan et al. (2022) [18]. The regional definitions are as follows: (1) Seasonal frost: 0 < F < 0.49; (2) Transitional or unstable permafrost: 0.49 ≤ F ≤ 0.51; (3) Semi-stable permafrost: 0.51 < F < 0.55; (4) Stable permafrost: 0.55 ≤ F < 0.667; (5) Extremely stable permafrost: F ≥ 0.667 [17]. The specific experimental process is shown in Figure 2.

Figure 2.
Flow chart of the method for drawing permafrost distribution map based on the SFnv model.
2.3.2. Permafrost Temperature Calculation Based on Monitoring Data
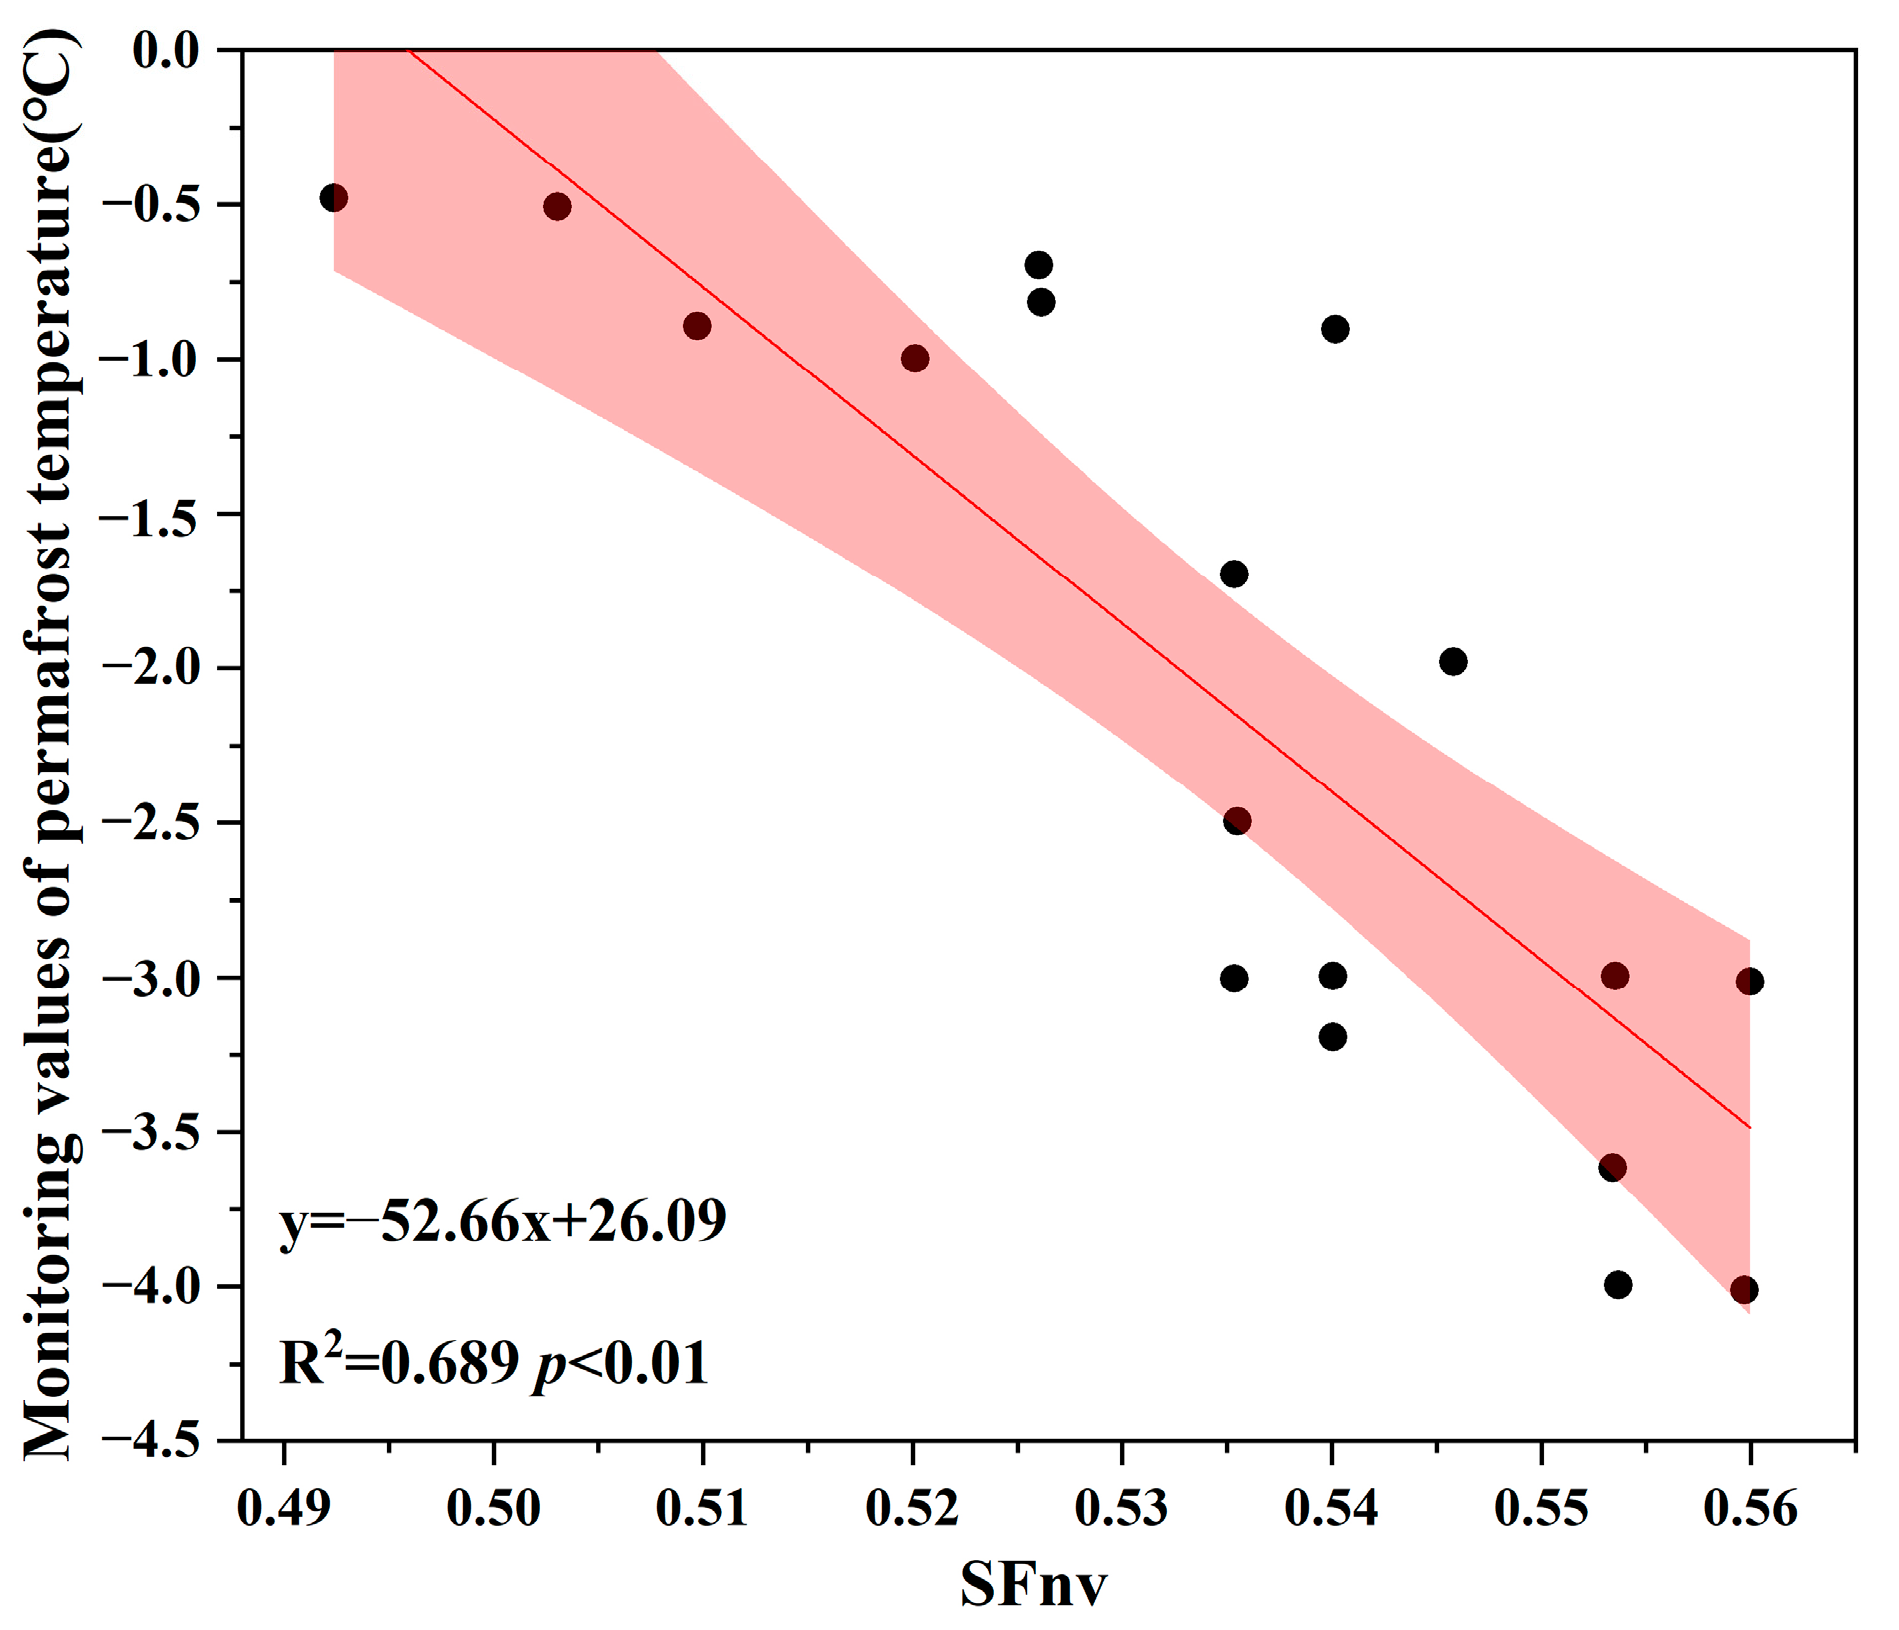
The soil temperature of the permafrost layer is an important representation of the permafrost layer. On the one hand, it can be used to evaluate the stable state of the permafrost layer, and it is also an important indicator for judging the degree of permafrost melting. In this study, permafrost soil-temperature monitoring data were combined to establish a numerical relationship between the SFnv and the permafrost temperature at monitoring point locations corresponding to the monitoring period (Figure 3), and to simulate the large-scale spatial distribution characteristics of permafrost soil temperature in Northeast China. Select the stable soil temperature and the natural-hole measuring-point data with a higher degree of fit. The linear regression equation is:

Figure 3.
Linear fitting of the monitoring-point SFnv and the permafrost temperature.
The PT is the permafrost temperature, and SFnv is the surface frost number without vegetation effects.
2.3.3. Trend Analysis
The least-squares regression method was used to analyze the temporal and spatial trends for the SFnv and NDVI in different periods. Fit the least-squares regression through the time series of each pixel and calculate the slope. A slope > 0 indicates that the SFnv and NDVI of the pixel are increasing, while a slope < 0 indicates the opposite trend [35,36,37]. The correlation coefficient between the SFnv and the NDVI was calculated by Pearson correlation [38].
2.3.4. Point Mutation Test
The Mann–Kendall mutation test is a nonparametric statistical test method for analyzing trend changes in time-series data. It is based on the Mann–Kendall test and is primarily employed for detecting single or multiple breakpoints in univariate time-series data [39,40,41]. The method involves computing the rank series of the original time series in sequential order, resulting in the cumulative forward UF values. Similarly, the rank series of the time series in reverse order is computed, resulting in the cumulative backward UB values. Given a significance level of α = 0.05, the corresponding critical value is U0.05 = ±1.96. The mutation points are identified at the intersection of the UF and UB curves within the confidence interval. UF > 0 indicates an upward trend in the series, while UF < 0 suggests a downward trend. When UF > 1.96 or UF < −1.96, it indicates a significant change in trend.
The Pettitt test is a nonparametric statistical method for detecting mutation points in time-series data, which can identify a single mutation point in univariate time-series data [42]. The basic principle of the Pettitt test is to calculate the differences between any two observations in the time series, accumulating these differences, and finding the maximum cumulative difference. The time point corresponding to the maximum cumulative difference is the potential mutation point.
In order to determine the mutation year of different types of permafrost areas in the long-term series, this study uses the M-K mutation test to determine the variation trend and the mutation point of the variable. When there are multiple potential mutation points in the single-variable time series, the Pettitt test is used to determine the unique mutation point, and then the change trend for permafrost areas in different time periods is analyzed.
3. Results
3.1. Permafrost Distribution Characteristics in Northeast China
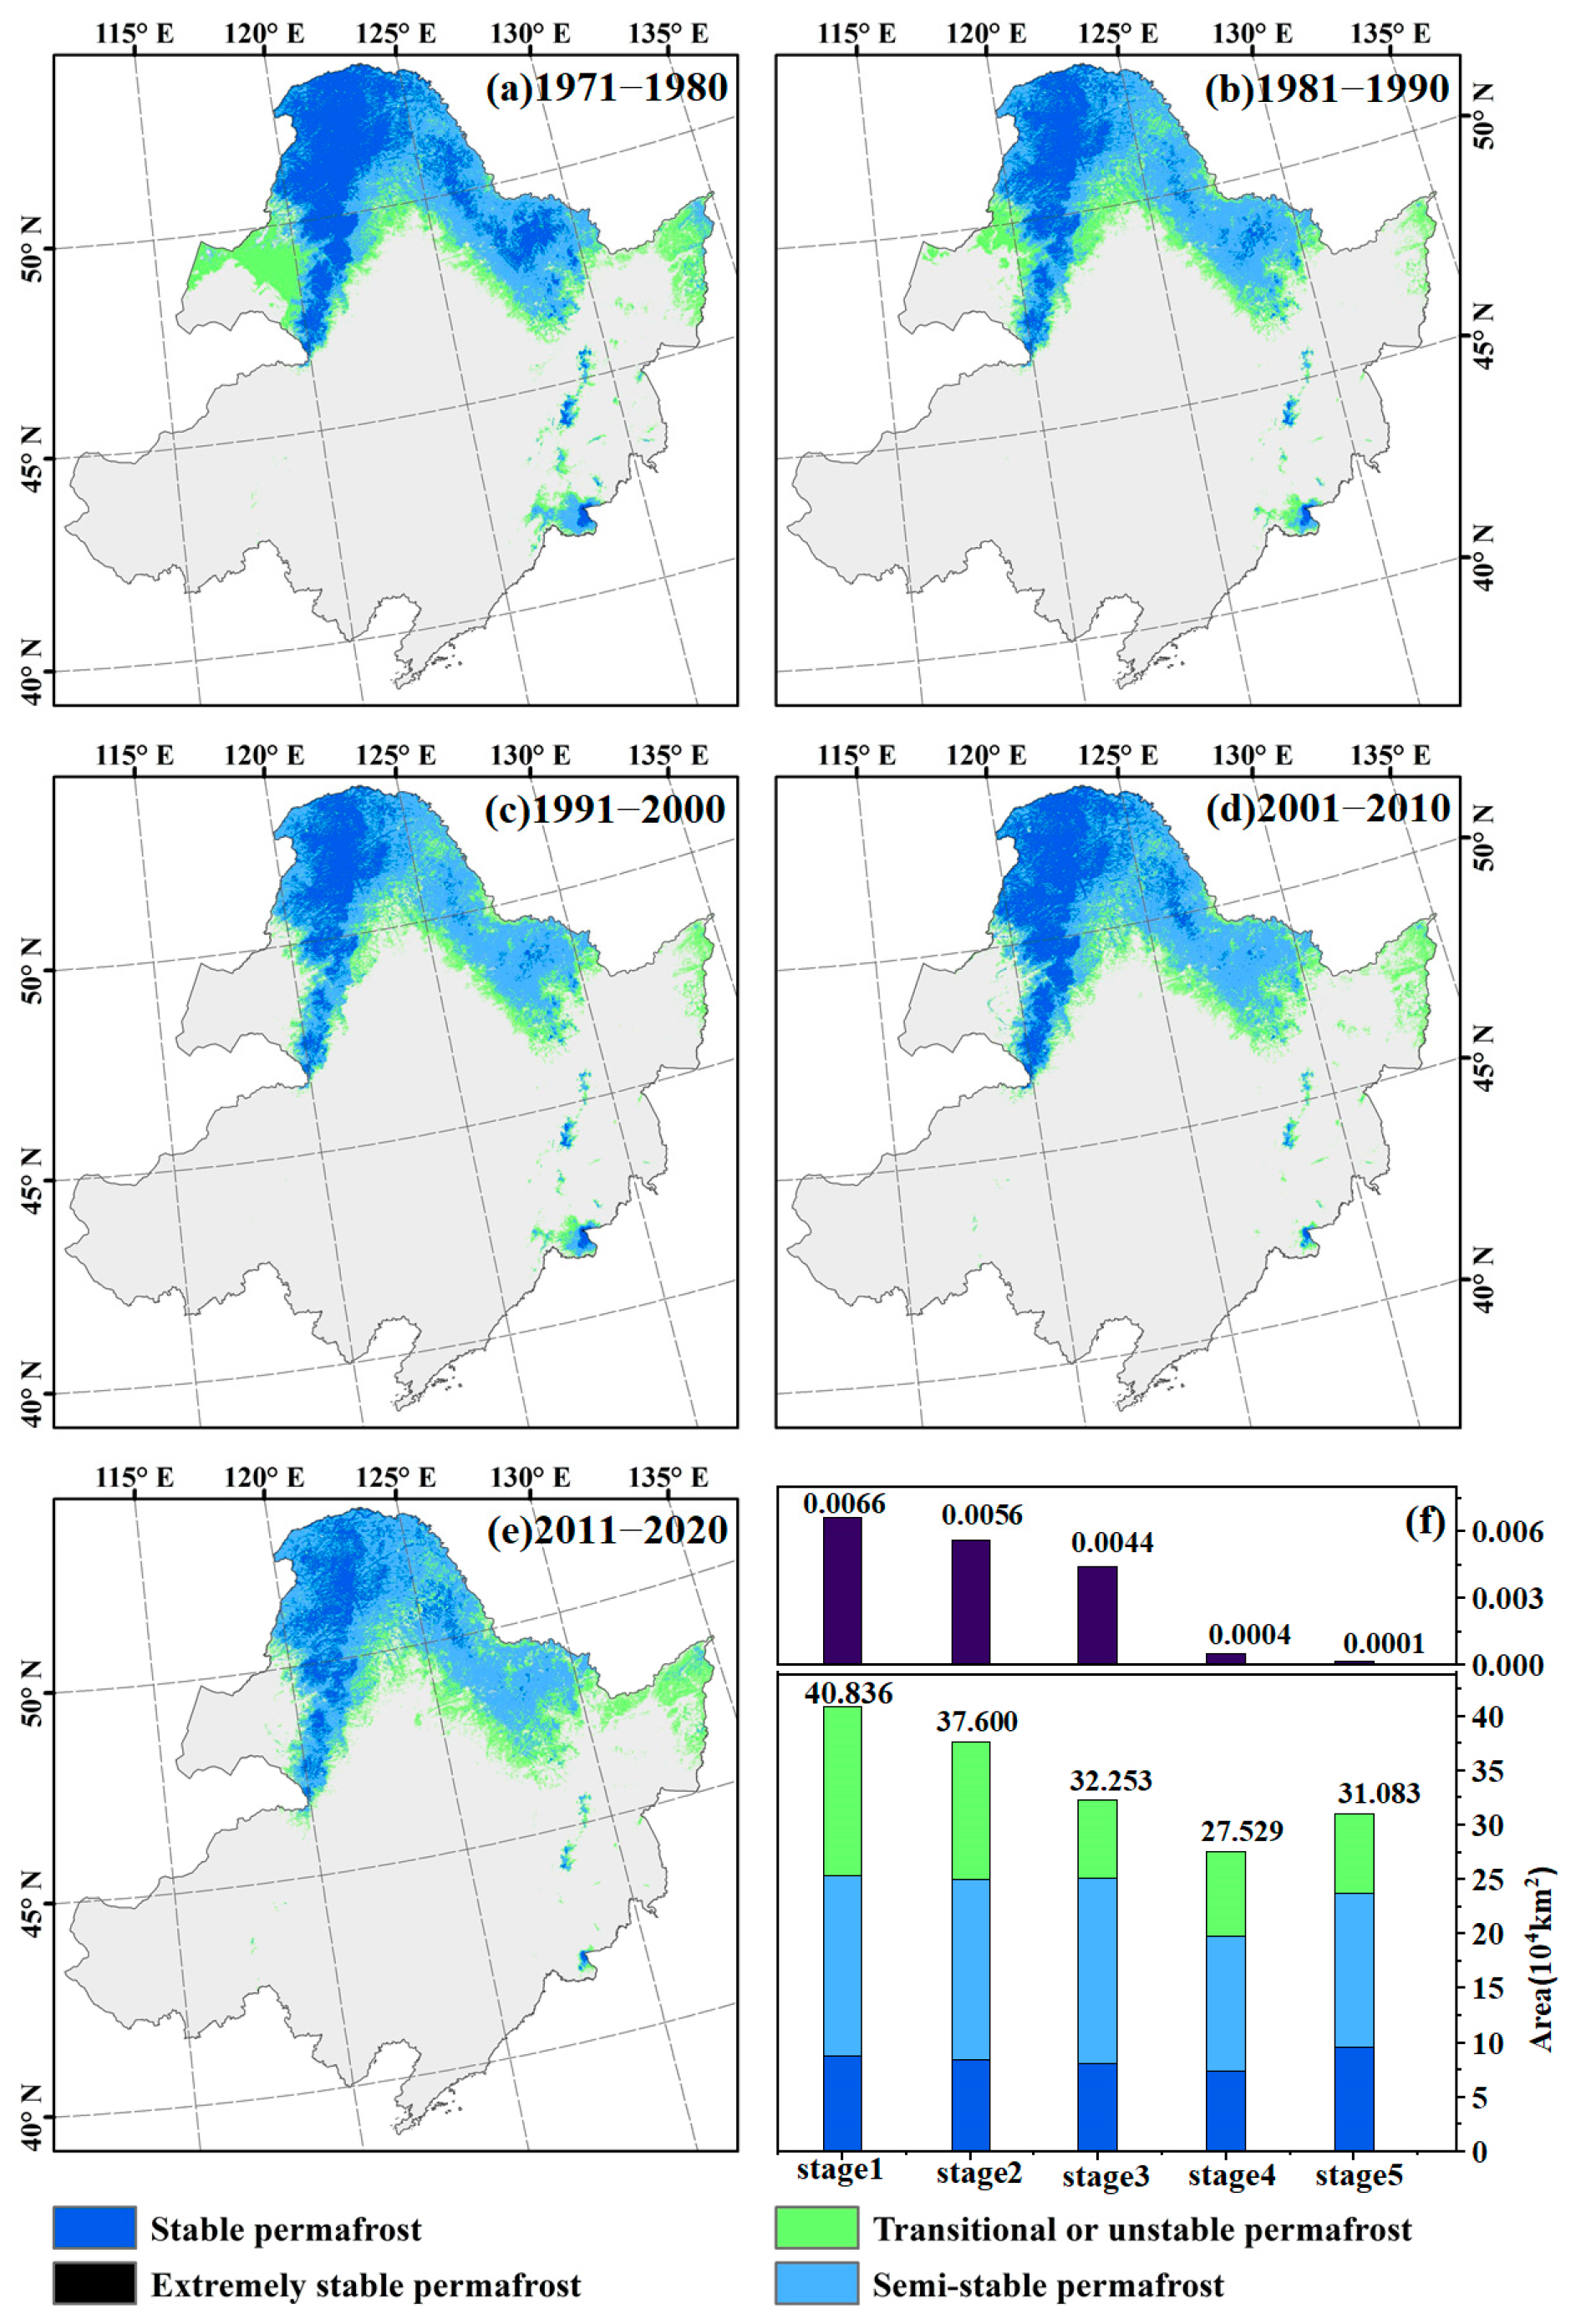
The spatial distribution of different stable types of permafrost in Northeast China from 1971 to 2020 was obtained using the improved SFn model (Figure 4a–e). The SFnv value shows an increasing trend with latitude and altitude. A region is defined as permafrost when the SFnv > 0.49, and its distribution varied from 44.353 × 10⁴ km2 (1976) to 19.909 × 10⁴ km2 (2007), accounting for approximately 29.180% to 13.098% of the total area. Permafrost is mainly distributed in the Greater and Lesser Xing’an Mountains, the Hulunbeier Plateau, the northern Songnen Plain, and the northern Sanjiang Plain. Additionally, a small amount of mountainous permafrost is also distributed in the Huanggangliang Mountains in the southwest and the Changbai Mountains in the southeast.

Figure 4.
Spatial distribution of different types of permafrost in different periods (a–e) and its area change statistics (f). The colors in the bar graph (f) correspond to the colors in the graphs (a–e) and represent different types of permafrost stability. The numbers in the figure represent the total area of permafrost areas in different time periods. The bar graph above shows the area of extremely stable permafrost areas.
The stability of permafrost gradually weakens from north to south, with stable permafrost being predominant, followed by semi-stable permafrost and transitional or unstable permafrost. The Greater and Lesser Xing’an Mountains are mainly characterized by stable permafrost, while transitional or unstable permafrost is found in the southern regions such as the Hulunbuir Plateau, the northern Songnen Plain, and the northern Sanjiang Plain. Extremely stable permafrost is only present in a small amount in the Changbai Mountains. The area of permafrost regions in the five periods showed a declining trend (Figure 4f), decreasing from 40.836 × 10⁴ km2 in 1970–1980 to 27.529 × 10⁴ km2 in 2000–2010. However, there was a slight increase in the area of permafrost regions in the eastern part of the study area from 2010 to 2020. In the 1970s, the permafrost was dominated by stable permafrost, but by 2020, a significant portion of permafrost in Northeast China had transitioned to semi-stable or transitional and unstable permafrost.
3.2. Temporal Evolution of the Permafrost Area
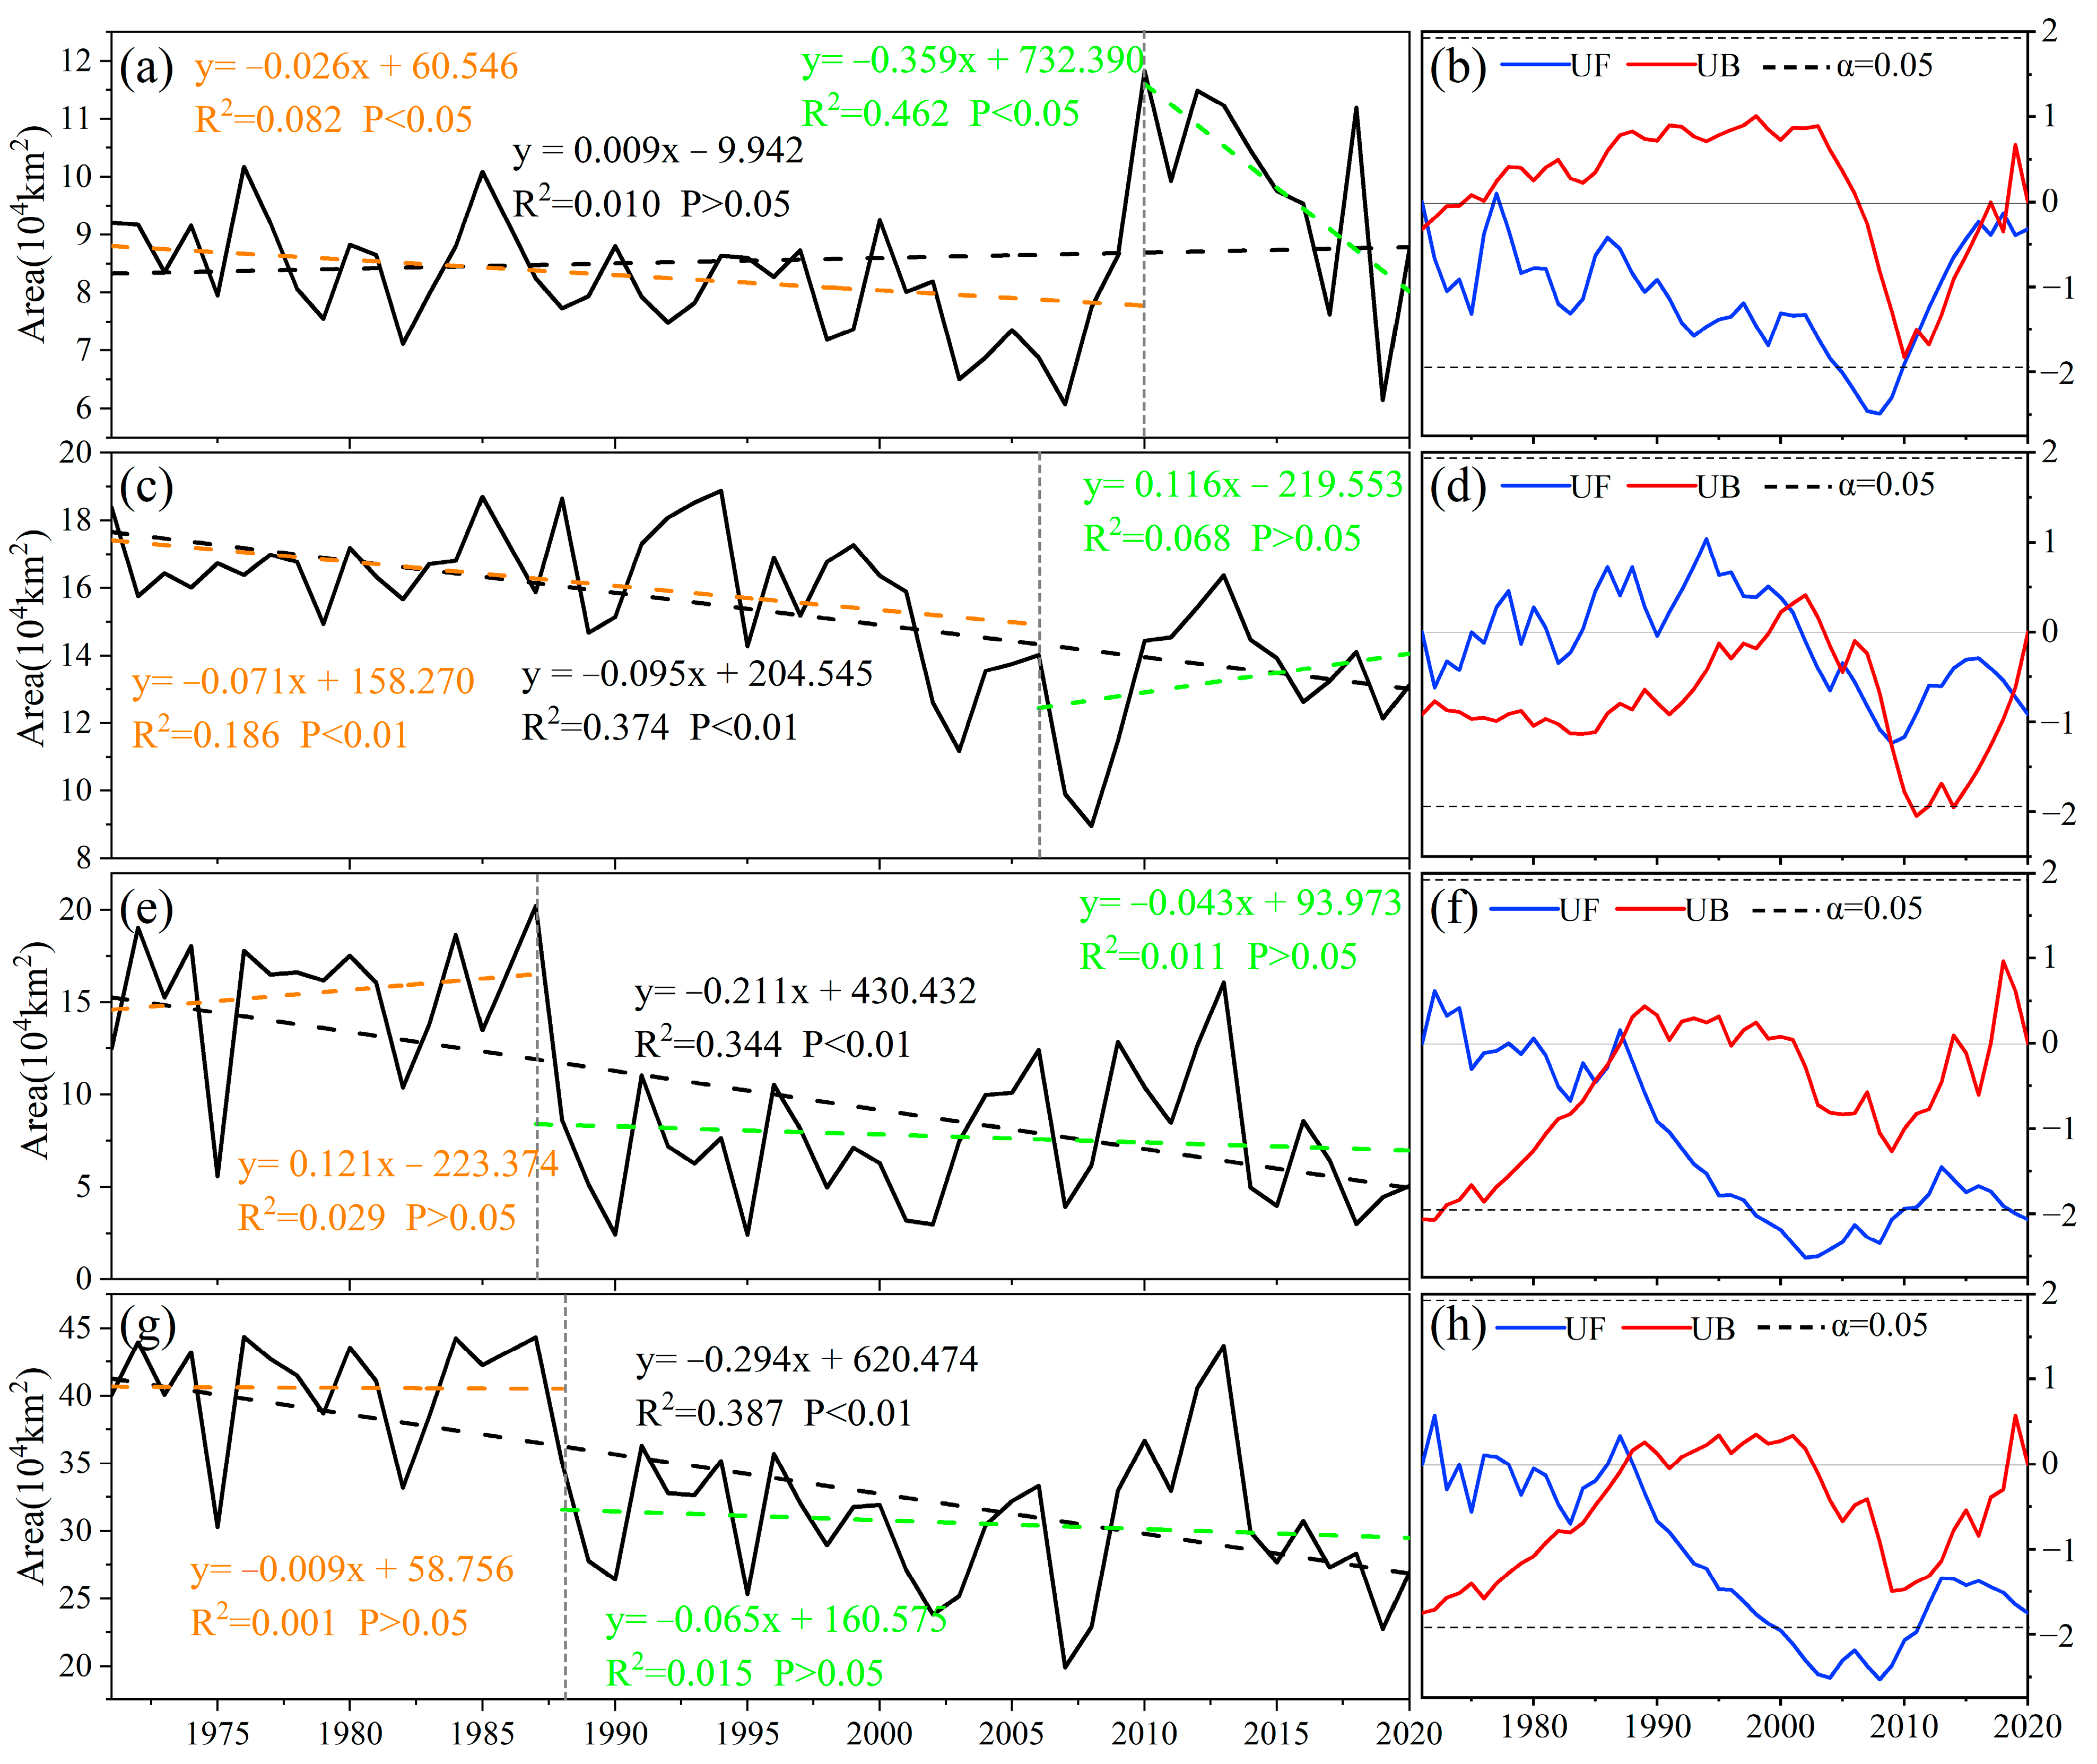
The stability of permafrost is assessed using the SFnv values, and the changes in permafrost area over time for each type are illustrated in Figure 4a,c,e. The average areas of unstable, semi-stable, and stable permafrost are 9.613 × 10⁴ km2, 14.098 × 10⁴ km2, and 7.372 × 10⁴ km2, respectively, with mutations occurring in 2010, 2006, and 1987 (Figure 5b,d,f). From 1971 to 2020, the area of transitional and unstable permafrost in Northeast China increased slightly at a rate of 0.009 × 10⁴ km2/yr. It exhibited a slow decrease at a rate of 0.026 × 10⁴ km2/yr from 1971 to 2010, reaching a minimum value in 2006. Afterward, it showed a rapid increase, reaching a peak value of 11.832 × 10⁴ km2 in 2010. However, in the period of 2010–2020, the area exhibited a rapid decline at a rate of 0.359 × 10⁴ km2/yr. The area of semi-stable permafrost experienced a significant decrease at a rate of 0.095 × 10⁴ km2/yr (p < 0.01) from 1971 to 2020. It decreased significantly from 1971 to 2006, but after 2006, it started to increase at a rate of 0.116 × 10⁴ km2/yr. The area of stable permafrost decreased significantly at a rate of 0.211 × 10⁴ km2/yr (p < 0.01) from 1971 to 2020, and a sudden change occurred in 1987, with the area changing from an insignificant increase (0.121 × 10⁴ km2/yr) to a significant decrease trend (−0.043 × 10⁴ km2/yr).
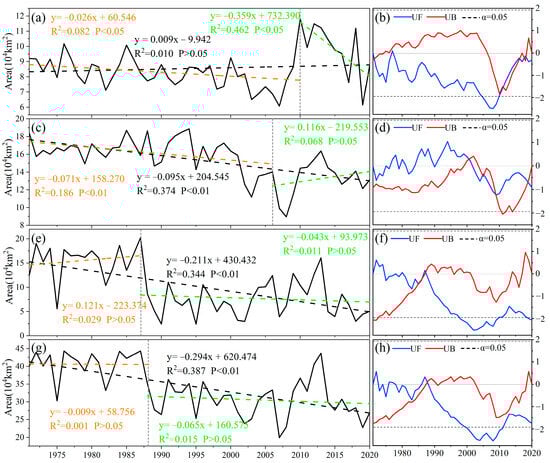
Figure 5.
Timing variation and mutation point test of (a) and (b) unstable type, (c) and (d) semi-stable type, (e) and (f) stable type, and (g) and (h) SFnv > 0.49 permafrost areas from 1971 to 2020.
The area of permafrost regions with SFnv > 0.49 had a sudden change in 1988 (Figure 5h). The UF curve trend indicates a decreasing trend in the total area, with noticeable fluctuations from 2001 to 2008, passing a 95% significance test. The area of permafrost regions with an SFnv > 0.49 in Northeast China decreased significantly at a rate of 0.294 × 10⁴ km2/yr from 1971 to 2020 (Figure 5g). Before 1987, there was no significant decrease in the area, only a slight decrease at a rate of 0.009 × 10⁴ km2/yr. In 1988, the year of mutation, the area decreased extremely rapidly from 44.315 × 10⁴ km2 to 27.771 × 10⁴ km2, followed by a slower decrease at a rate of 0.065 × 10⁴ km2/yr. Another significant change occurred between 2013 and 2014, with the area reaching its maximum in 2013 and then rapidly declining with a continuous decreasing trend.
Overall, the area of permafrost regions in Northeast China exhibited a decreasing trend from 1971 to 2020. Specifically, the area of semi-stable and stable permafrost decreased, while the area of transitional or unstable permafrost did not show a significant increase. This indicates that not only is the permafrost area decreasing, but the stability of permafrost in Northeast China is also deteriorating, with a gradual transition from stable and semi-stable permafrost to transitional or unstable permafrost. The period from 1986 to 1988 was particularly important as it witnessed a rapid degradation of the permafrost in Northeast China. This time period coincides with a significant and rapid global warming trend that has been noted since 1980. Therefore, it is considered a critical period of significant changes in permafrost in Northeast China [26,43,44]. Notably, from 2006 to 2008, the area of all three types of permafrost experienced a rapid decrease, reaching a minimum value followed by a significant increase, peaking in 2013 to 2014. This pattern is consistent with the research findings of Gao et al. [26].
3.3. Spatial Evolution of Permafrost Distribution
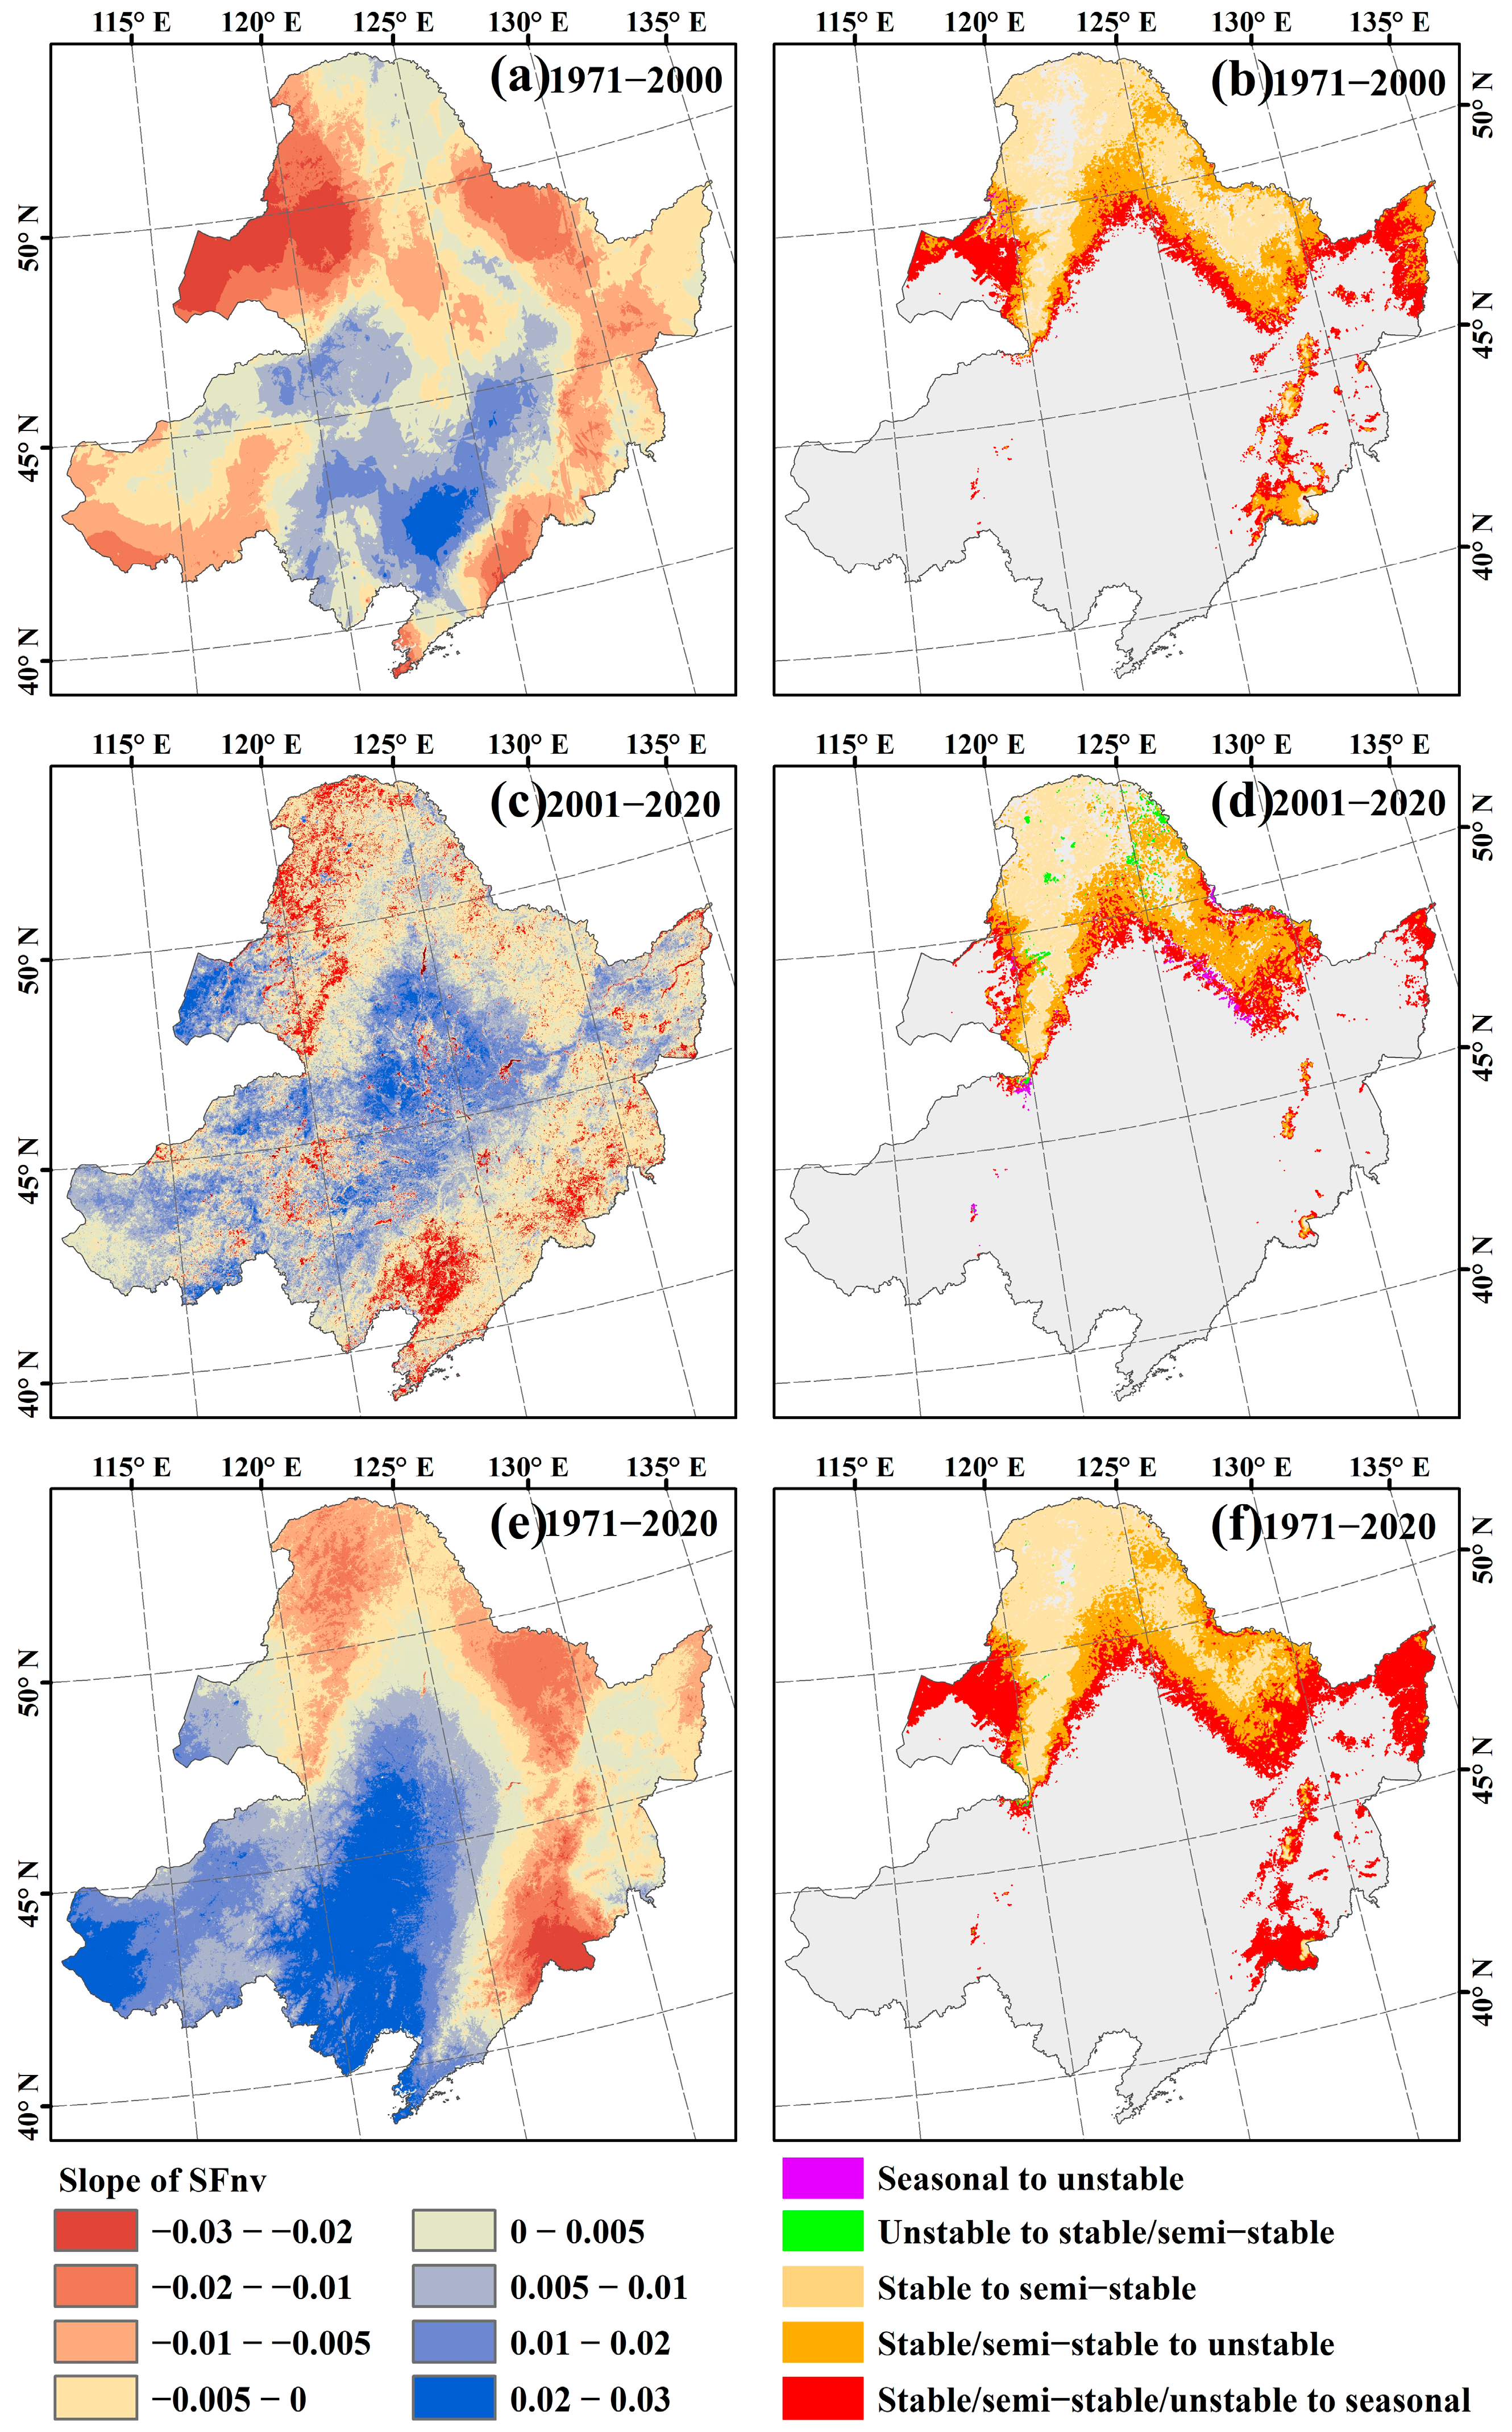
The trends in permafrost SFnv in Northeast China (Figure 6a,c,e) and the transitions of permafrost types (Figure 6b,d,f) were calculated for the periods of 1971–2000, 2001–2020, and 1971–2020. From 1971 to 2000, there was a significant decrease in the SFnv and the corresponding degradation of permafrost in the western Hulunbeier Plateau and the northern part of the Lesser Xing’an Mountains, primarily affecting unstable permafrost. During this period, about 8.987 × 10⁴ km2 of permafrost degenerated into sporadic permafrost and seasonal frost, and about 5.469 × 10⁴ km2 of semi-stable permafrost transformed into unstable permafrost. From 2001 to 2020, the permafrost region experienced a general decline in SFnv. The main types of permafrost degradation during this period were semi-stable and unstable permafrost, with a combined area reduction of 1.101 × 10⁴ km2 and 4.750 × 10⁴ km2, respectively. The degradation areas of permafrost were mainly distributed in the east of the Lesser Xing’an Mountains. Furthermore, the stability of permafrost continued to deteriorate, as approximately 4.194 × 10⁴ km2 of semi-stable permafrost transitioned into unstable permafrost, and 3.950 × 10⁴ km2 of stable permafrost transformed into semi-stable permafrost. The area of stable permafrost significantly decreased, with only small pockets remaining in colder regions such as the Tuli River and Genhe River by 2020.

Figure 6.
Spatial variation trends in the SFnv in different periods (a,c,e) and the transformation of different types of permafrost (b,d,f).
Overall, from the 1970s to 2020, the SFnv values of the permafrost regions in Northeast China exhibited a predominant decrease, and the area of permafrost significantly decreased and its stability deteriorated. Spatially, the degradation trend of the permafrost showed a gradual degradation trend from south to north and from east to west. The area of permafrost regions in Northeast China from 1971 to 2020 was approximately 42.855 × 10⁴ km2, with a decrease of 14.753 × 10⁴ km2 over the past 50 years. Among the degraded areas, unstable permafrost accounted for the majority with 10.248 × 10⁴ km2, followed by semi-stable permafrost with 4.428 × 10⁴ km2, and stable permafrost with 0.0779 × 10⁴ km2. Additionally, about 10.926 × 10⁴ km2 of stable permafrost transformed into semi-stable and unstable permafrost, while 6.692 × 10⁴ km2 of semi-stable permafrost transformed into unstable permafrost. Moreover, about 0.22 × 10⁴ km2 of seasonal frost was transformed into permafrost. From 1971 to 2000, the rapid degradation of unstable permafrost dominated. After 2000, although the degradation rate of the permafrost slowed down and the degraded area was smaller than that of the previous period, the stability of the permafrost continued to weaken. The degradation process started from the periphery and gradually affected the stable permafrost.
3.4. Changes in PT
PT serves as a crucial indicator reflecting the atmosphere–ground energy exchange and permafrost distribution, and the spatial variation in PT reflects the latitudinal and altitude zonality of the permafrost distribution [19]. When the PT is less than 0 °C, the probability of permafrost is high. In this study, a linear regression model was developed using borehole data and SFnv values to estimate the PT in Northeast China during different periods (Figure 7).

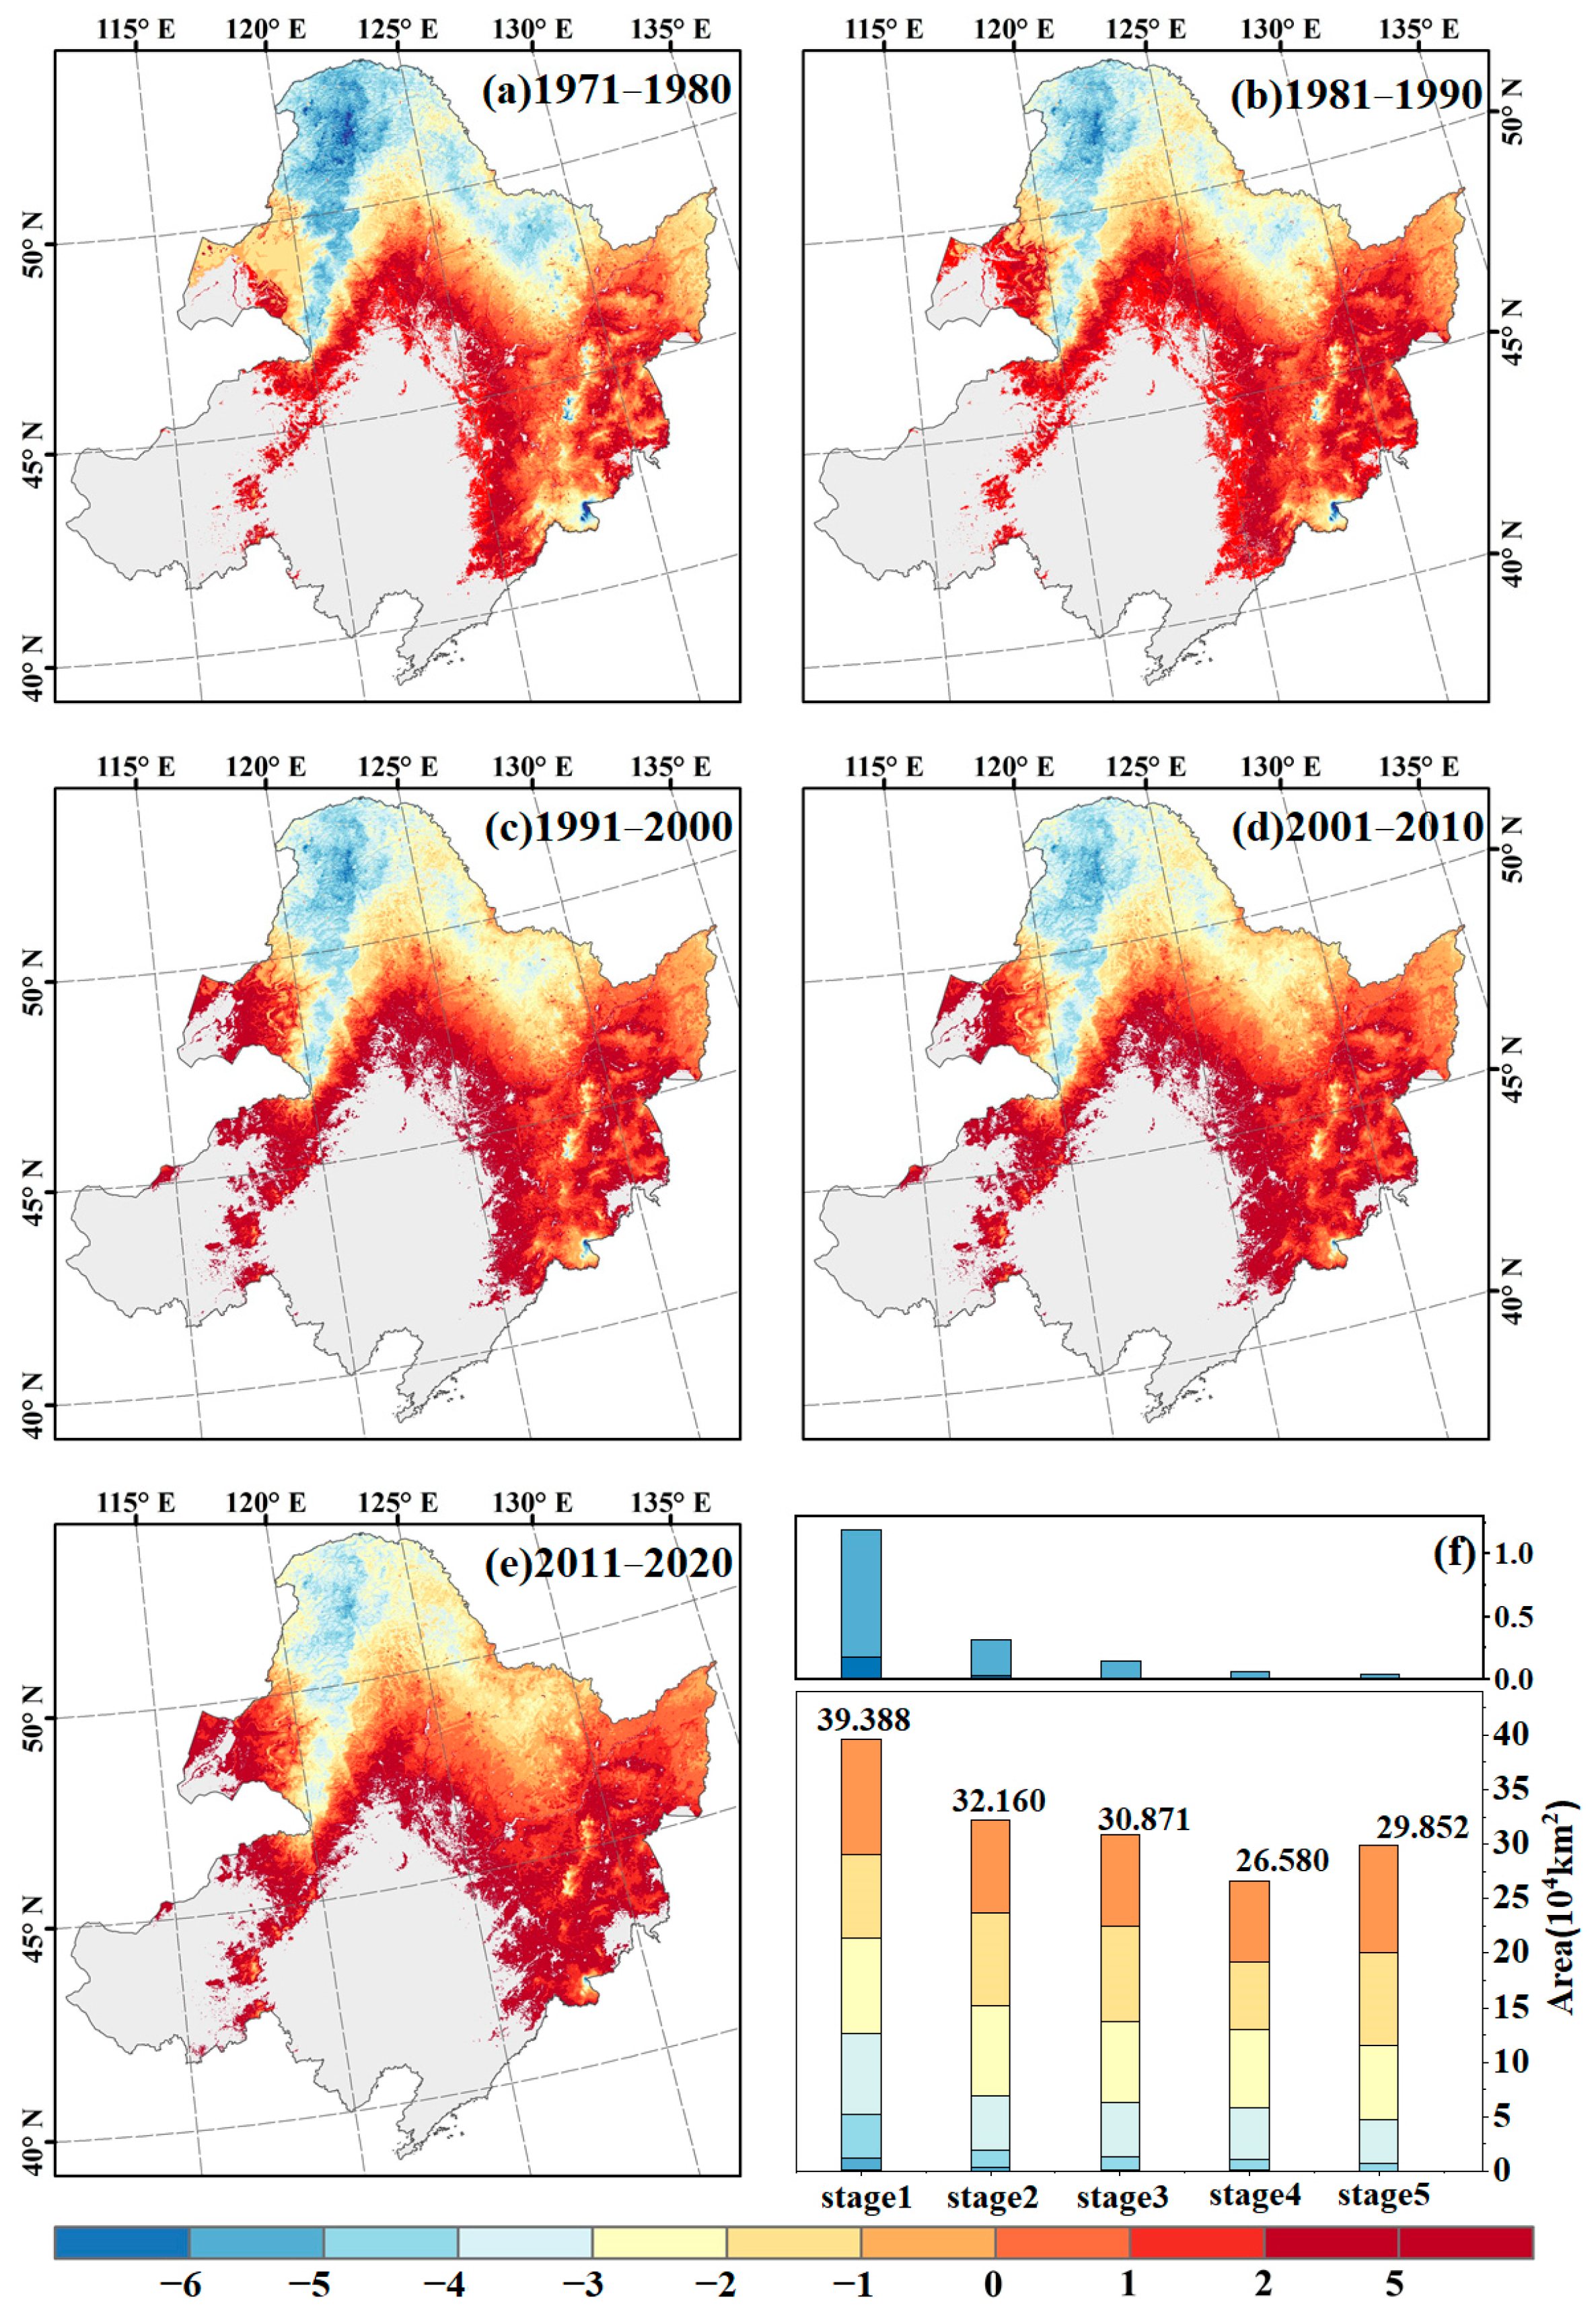
Figure 7.
Spatial distribution (a–e) and area change statistics (f) of the PT in different periods. The colors of the histogram (f) correspond to the colors in the graphs (a–e), representing different PT value intervals. The numbers in the figure represent the total area with a PT < 0 °C in different periods. The bar graph above represents the areas with a PT < −6 °C and a PT between −6~−5 °C.
The area of permafrost defined by a PT < 0 °C is slightly smaller than the area of the permafrost region with an SFnv > 0.49. From 1971 to 2020, the area with a PT < 0 °C decreased from 39.388 × 10⁴ km2 to 29.852 × 10⁴ km2. From 2001 to 2010, the area of permafrost was the smallest at 26.580 × 10⁴ km2. The minimum PT value increased from −12.228 °C to −5.981 °C, with the lowest value observed in Genhe. The area with a PT < −5 °C decreased from 1.195 × 10⁴ km2 in 1971–1980 to 0.151 × 10⁴ km2 in 1991–2000, with only 0.046 × 10⁴ km2 remaining below −5 °C in 2020. Additionally, the area with −4 °C < PT < −5 °C decreased significantly from 4.040 × 10⁴ km2 to 1.581 × 10⁴ km2 during 1971–1990. The PT in the study area is mainly in the range of −3~−1 °C, accounting for 41.685% (1971–1980) to 52.139% (1981–1990) of the total permafrost area. Notably, the area with a PT of −1~0 °C increased significantly after 2000, ranging from 27.326% to 32.973%. The area with high-temperature permafrost has significantly increased, and the spatial variation process of PT reflects the changes in permafrost.
4. Discussion
4.1. Performance of the SFnv Model
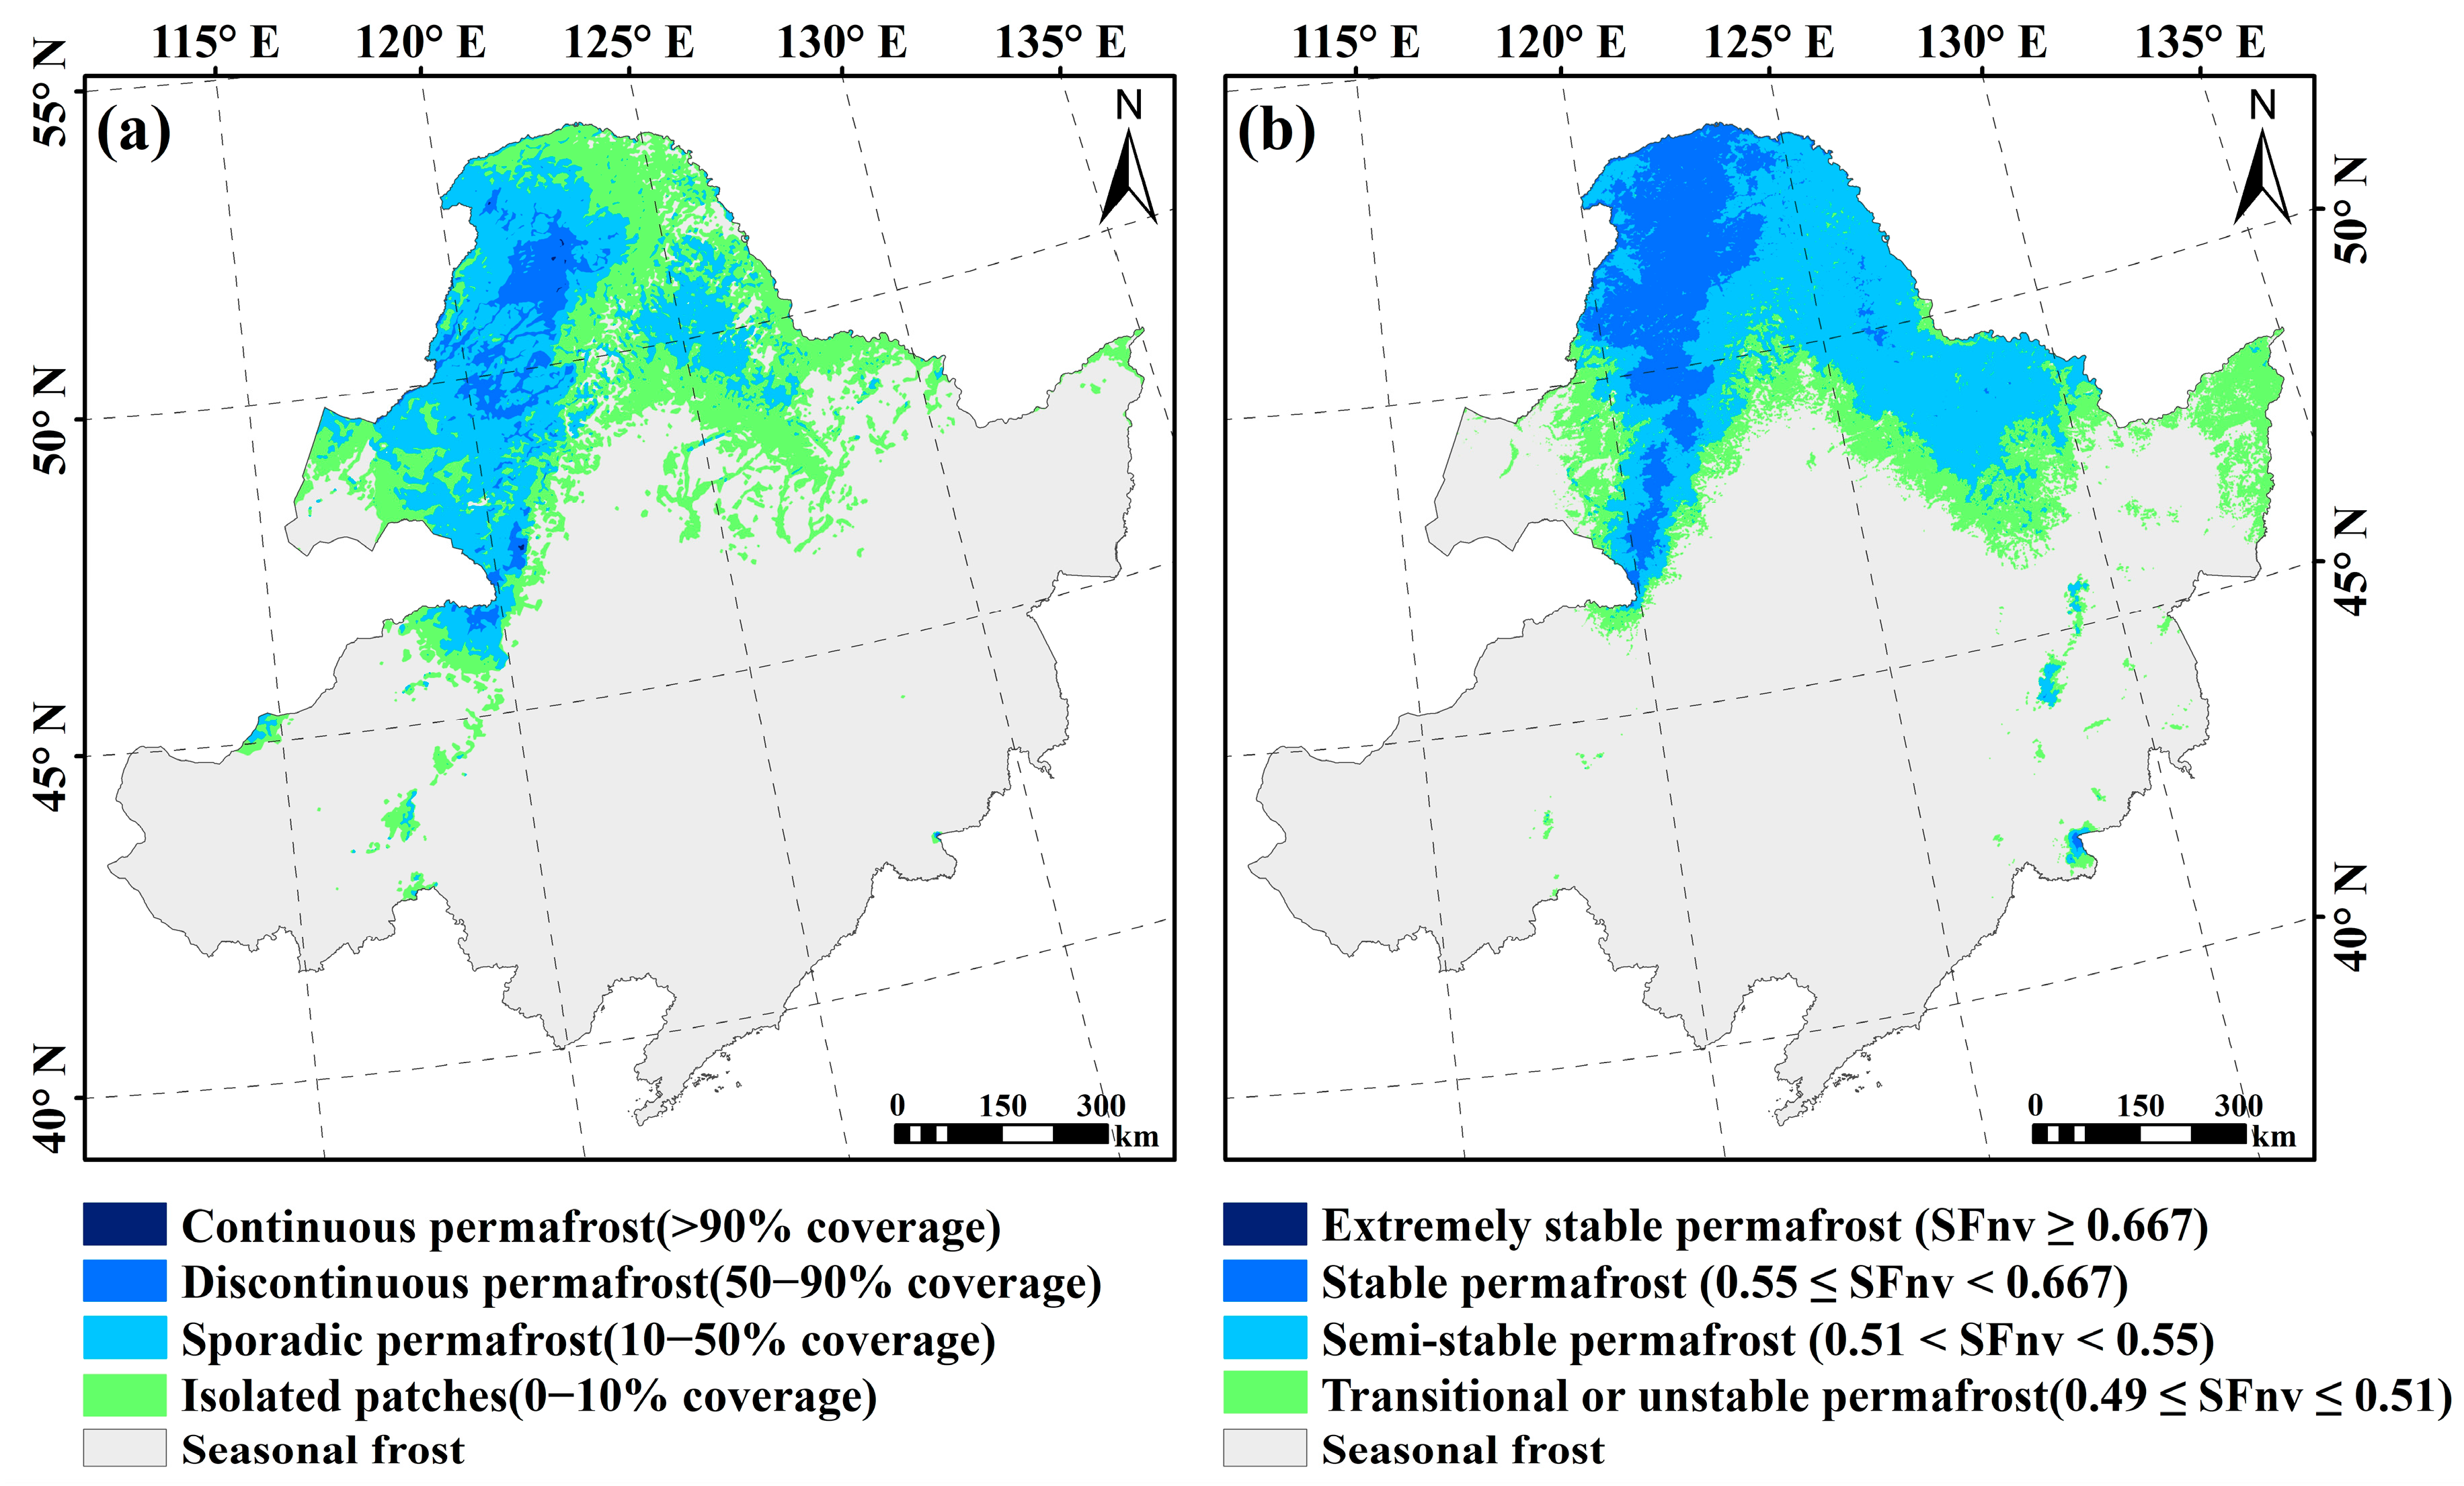
Compared with the permafrost probability map of the Northern Hemisphere from 2000 to 2016 based on the TTOP model using MODIS LST data by Obu et al. (2019) [3], the permafrost area simulated by the SFnv model in this study is slightly larger (Figure 8). The overall pattern of permafrost distribution is similar between the two studies, particularly in the stable and semi-stable permafrost regions, which are predominantly located in the Greater and Lesser Xing’an Mountains, with concentrated areas in Genhe. However, the spatial distribution of island-shaped permafrost and unstable permafrost is significantly different. In the permafrost distribution map provided by Obu et al. (2019) [3], there are small areas of sporadic and island-shaped permafrost distributed in the Hulun Lake Basin and Huanggangliang Mountains, while in this study, these areas have experienced substantial degradation, with only a minute fraction of unstable permafrost remaining. Moreover, our research findings reveal that unstable permafrost still existed in the Sanjiang Plain and the eastern part of the Lesser Xing’an Mountains from 2000 to 2016, as well as a small area of semi-stable permafrost in the Changbai Mountains. These permafrost occurrences were underestimated in Obu et al.’s (2019) study [3]. The results of the study may have overestimated the area of degraded permafrost in the western and southwestern parts of the study area and underestimated the high-altitude permafrost in the Changbai Mountains and other regions. These disparities can be attributed to differences in models and selected parameters [9,45]. Our findings provide a more representative depiction of the distribution status of permafrost in Northeast China and offer a better simulation of the spatial pattern of permafrost in the southeastern part of the study area. This demonstrates the effectiveness of incorporating vegetation factors into the SFn model for simulating permafrost distribution in Northeast China.

Figure 8.
The difference between the spatial distribution of permafrost from 2000 to 2016 simulated by Obu et al. (2019) [3] based on the TTOP model (a) and the spatial distribution of permafrost in this study (b).
4.2. Relationship between Permafrost and Vegetation
The SFnv model improved by introducing vegetation factors can effectively simulate the distribution of permafrost in Northeast China, indicating that vegetation coverage is a primary influencing factor of permafrost distribution in this region. The relationship between vegetation and permafrost is complex, with mutual influences. Permafrost acts as an aquifer, preventing the downward movement of surface and soil water, while also providing water and nutrients to vegetation. Additionally, vegetation coverage during the growing season helps to reduce the surface temperature and transpiration rate, playing a crucial role in the insulation and cooling of permafrost [46,47].
To further explore the relationship between vegetation cover and permafrost, this study selected GIMMS NDVI3g+ data from 1982–2010 and MODIS NDVI data from 2010–2020, resampling them to a resolution of 1 km. Then, the variation rate of the NDVI during the growing season (April–October) and its spatial correlation with the SFnv were analyzed. The analysis of NDVI trends (Figure 9a) revealed pronounced spatial heterogeneity in NDVI changes across Northeast China. Overall, the vegetation in the permafrost region exhibited an improvement trend, with a significant increase in the NDVI observed in the distribution area of stable permafrost in the northern part of the Greater Xing’an Mountains and the degraded permafrost area in the southern part of the Lesser Xing’an Mountains. However, in regions such as the northern Songnen Plain, the southern foothills of the Lesser Xing’an Mountains, and the Sanjiang Plain, the NDVI exhibits an insignificant decreasing trend, especially in the Hulun Lake area in the western part of the study area. Vegetation degradation mainly occurs in degraded permafrost regions and in unstable permafrost regions at the southern edge of the permafrost region. As stable permafrost degraded to semi-stable and unstable permafrost, the vegetation coverage exhibited an improving trend.
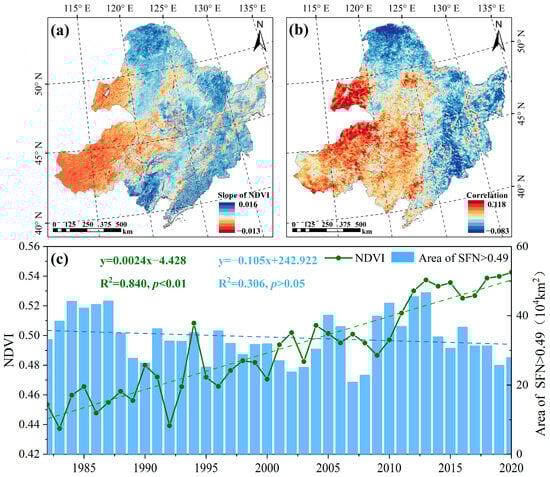
Figure 9.
The NDVI trends in the study area (a), the correlation coefficient between the SFnv and the NDVI (b), and the time-varying curve of the NDVI and the area of permafrost regions (c).
The spatial correlation analysis (Figure 9b) indicates a negative correlation between NDVI and SFnv values in Northeast China from 1971 to 2020, with the NDVI increasing as the SFnv decreases. Further analysis of the correlation between the NDVI and the different types of permafrost areas during different periods (Table 1) revealed a significant positive correlation between the NDVI and the area of unstable permafrost from 1982 to 2020 (R2 = 0.414, p < 0.01). From 2001 to 2020, there is a significant positive correlation between the NDVI and the semi-stable permafrost area (R2 = 0.479, p < 0.05). In contrast, the NDVI exhibits a negative correlation with the stable permafrost area, and this correlation is significant during the period from 1982 to 2000 (R2 = 0.479, p < 0.05).

Table 1.
Correlation coefficients between the NDVI and the different types of permafrost areas in different periods.
In the previous period of permafrost degradation (1982–2000), there was a negative correlation between the NDVI and the overall permafrost area; specifically, there was a significant negative correlation with the stable permafrost area. Vegetation coverage increased as permafrost decreased during this period. Changes in soil moisture played a crucial role in influencing vegetation cover during permafrost degradation. The rise in the water table during the early stages of permafrost degradation altered moisture conditions in the vegetation growth environment, leading to increased vegetation cover. Additionally, soil temperatures may increase during permafrost degradation, accelerating soil organic matter decomposition, enhancing nitrogen mineralization and availability, and improving soil nutrient content [48,49]. After 2000, a positive correlation was observed between the area of unstable permafrost and semi-stable permafrost with the NDVI, indicating a decrease in vegetation cover with the degradation of these two types of permafrost. The ongoing degradation of permafrost results in a weakening of its water-proof effect on the floor, resulting in declining groundwater levels and subsequent surface-soil drying, which leads to reduced vegetation cover on the ground surface [50]. While permafrost degradation may initially promote vegetation growth in the short term, it may ultimately weaken or hinder it in the long term [16]. These findings contribute to a deeper understanding of the relationship between vegetation cover and permafrost distribution, providing valuable references for future permafrost research.
5. Conclusions
This study combines the MODIS remote sensing dataset and meteorological station data and considers the influence of vegetation factors on the SFn model to improve the simulated longitude. Based on this approach, the spatial distribution of SFnv and PT in Northeast China from 1971 to 2020 was simulated, and the spatiotemporal variation characteristics of permafrost stability and PT were analyzed.
The SFn model, when enhanced by incorporating the vegetation index, provides a more precise representation of permafrost dynamics in Northeast China. Furthermore, it demonstrates superior performance at a finer spatial scale compared with the conventional SFn model. However, the accuracy of the data based on the fusion of remote sensing data and meteorological data needs to be further verified, and the fusion method of multi-source data also needs to be further improved. At the same time, the influence of vegetation on permafrost is mostly on the surface or shallow soil, while the vertical distribution and variations of permafrost are closely tied to soil conditions. Subsequent research should consider the influence of soil hydrothermal properties on permafrost distribution and account for the spatial heterogeneity of soil characteristics in the study area to attain a more accurate depiction of permafrost and active-layer changes. Additionally, while the current permafrost distribution map with a 1 km resolution offers a macroscopic view of temporal and spatial changes, a more detailed local-scale map is essential for engineering purposes. Future investigations will incorporate various influencing factors and leverage measured and borehole data to produce refined permafrost maps.
The stability of permafrost in Northeast China gradually weakens from north to south, with transitional or unstable permafrost mainly distributed on the southern edge of permafrost. The area of permafrost regions with an SFnv > 0.49 ranged from 44.353 × 10⁴ km2 (1976) to 19.909 × 10⁴ km2 (2007), with the smallest area in 2001–2010. The area of permafrost region with an SFnv > 0.49 decreased rapidly from 44.315 × 10⁴ km2 to 27.771 × 10⁴ km2 in 1988. The spatial distribution of SFnv trends in different periods was significantly different, and the SFnv values in the Hulunbeier Plateau and northern Lesser Xing’an Mountains decreased significantly from 1971 to 2000. The degradation of unstable permafrost is the main cause, and about 8.987 × 10⁴ km2 of permafrost degenerated into seasonal frost. From 2001 to 2020, the degradation of permafrost mainly occurred in the east of the Lesser Xing’an Mountains, and the stability of permafrost continued to deteriorate. Around 4.194 × 10⁴ km2 of semi-stable permafrost transformed into unstable permafrost.
From 1971 to 2020, the permafrost area with temperatures below 0 °C in the study area decreased from 39.388 × 10⁴ km2 to 29.852 × 10⁴ km2, and the temperature of permafrost increased year by year. From 1971 to 1990, the area with −4 °C < PT < −5 °C decreased from 4.040 × 10⁴ km2 to 1.581 × 10⁴ km2. The PT is primarily in the range of −3 °C to −1 °C, and the area of permafrost at −1~0 °C has increased significantly since 2000. There was a significant positive correlation between the NDVI and the area of unstable permafrost from 1982 to 2020 (R2 = 0.414, p < 0.01). From 1982 to 2000, there was a significant negative correlation between the NDVI and the area of stable permafrost. After 2000, the NDVI was positively correlated with the area of unstable permafrost and semi-stable permafrost, and the vegetation cover decreased with the degradation of the two types of permafrost.
Author Contributions
Conceptualization, W.S.; Data curation, W.S., L.Q., C.Z. and S.L.; Formal analysis, L.Q.; Funding acquisition, W.S.; Methodology, L.Q. and C.Z.; Project administration, W.S. and Y.G.; Resources, W.S.; Software, L.Q.; Writing—original draft, W.S. and L.Q.; Writing—review and editing, W.S., L.Q., Y.G., C.Z. and S.L. All authors have read and agreed to the published version of the manuscript.
Funding
This research was funded by the National Natural Science Foundation of China (Grant No. 41641024) and the Science and the Technology Project of Heilongjiang Communications Investment Group (Grant No. JT-100000-ZC-FW-2021-0182) and the Field Scientific Observation and Research Station of the Ministry of Education–Geological Environment System of the permafrost area in Northeast China (MEORS-PGSNEC).
Institutional Review Board Statement
Not applicable.
Informed Consent Statement
Not applicable.
Data Availability Statement
The data presented in this study are available on request from the corresponding author. The data are not publicly available due to privacy.
Acknowledgments
The authors thank the LAADS DAAC (https://ladsweb.modaps.eosdis.nasa.gov/, accessed on 10 December 2022), the China National Meteorological Data Center (http://data.cma.cn/, accessed on 25 November 2022), the SRTM DEM (https://dwtkns.com/srtm30m/, accessed on 29 March 2022), the National Tibetan Plateau Data Center (https://data.tpdc.ac.cn/home, accessed on 29 December 2022), and other organizations and institutions for providing free and open-source datasets to support this paper.
Conflicts of Interest
The authors declare no conflicts of interest.
References
- Subcommittee, P. Glossary of Permafrost and Related Ground-Ice Terms; Associate Committee on Geotechnical Research, National Research Council of Canada: Ottawa, ON, Canada, 1988; Volume 156, pp. 63–64. [Google Scholar]
- Obu, J. How much of the earth’s surface is underlain by permafrost? J. Geophys. Res. Earth Surf. 2021, 126, e2021JF006123. [Google Scholar] [CrossRef]
- Obu, J.; Westermann, S.; Bartsch, A.; Berdnikov, N.; Christiansen, H.H.; Dashtseren, A.; Delaloye, R.; Elberling, B.; Etzelmüllerm, B.; Kholodov, A.; et al. Northern Hemisphere permafrost map based on TTOP modelling for 2000–2016 at 1 km2 scale. Earth-Sci Rev. 2019, 193, 299–316. [Google Scholar] [CrossRef]
- Pepin, N.; Bradley, R.S.; Diaz, H.F.; Baraer, M.; Caceres, E.B.; Forsythe, N.; Fowler, H.; Greenwood, G.; Hashmi, M.Z.; Liu, X.D.; et al. Elevation-dependent warming in mountain regions of the world. Nat. Clim. Chang. 2015, 5, 424–430. [Google Scholar]
- Biskaborn, B.K.; Smith, S.L.; Noetzli, J.; Matthes, H.; Vieira, G.; Streletskiy, D.A.; Schoeneich, P.; Romanovsky, V.E.; Lewkowicz, A.G.; Abramov, A.; et al. Permafrost is warming at a global scale. Nat. Commun. 2019, 10, 264. [Google Scholar] [CrossRef] [PubMed]
- Post, E.; Alley, R.B.; Christensen, T.R.; Macias-Fauria, M.; Forbes, B.C.; Gooseff, M.N.; Iler, A.; Kerby, J.T.; Laidre, K.L.; Mann, M.E.; et al. The polar regions in a 2 ℃ warmer world. Sci. Adv. 2019, 5, eaaw9883. [Google Scholar] [CrossRef]
- Chadburn, S.E.; Burke, E.J.; Cox, P.M.; Friedlingstein, P.; Hugelius, G.; Westermann, S. An observation-based constraint on permafrost loss as a function of global warming. Nat. Clim. Chang. 2017, 7, 340–344. [Google Scholar] [CrossRef]
- Westermann, S.; Østby, T.I.; Gisnås, K.; Schuler, T.V.; Etzelmüller, B.J. A ground temperature map of the North Atlantic permafrost region based on remote sensing and reanalysis data. Cryosphere 2015, 9, 753–790. [Google Scholar] [CrossRef]
- Zhang, Y.; Touzi, R.; Feng, W.; Hong, G.; Lantz, T.C.; Kokelj, S.V. Landscape-scale variations in near-surface soil temperature and active-layer thickness: Implications for high-resolution permafrost mapping. Permafr. Periglac. 2021, 32, 627–640. [Google Scholar] [CrossRef]
- Mastepanov, M.; Sigsgaard, C.; Dlugokencky, E.J.; Houweling, S.; Ström, L.; Tamstorf, M.P.; Christensen, T.R. Large tundra methane burst during onset of freezing. Nature 2008, 456, 628–630. [Google Scholar] [CrossRef]
- Schuur, E.A.; McGuire, A.D.; Schädel, C.; Grosse, G.; Harden, J.W.; Hayes, D.J.; Hugelius, G.; Koven, C.D.; Kuhry, P.; Lawrence, D.M.; et al. Climate change and the permafrost carbon feedback. Nature 2015, 520, 171–179. [Google Scholar] [CrossRef]
- Hope, C.; Schaefer, K. Economic impacts of carbon dioxide and methane released from thawing permafrost. Nat. Clim. Chang. 2016, 6, 56–59. [Google Scholar] [CrossRef]
- MacDougall, A.H.; Avis, C.A.; Weaver, A.J. Significant contribution to climate warming from the permafrost carbon feedback. Nat. Geosci. 2012, 5, 719–721. [Google Scholar] [CrossRef]
- Mao, D.; Wang, Z.; Luo, L.; Ren, C. Integrating AVHRR and MODIS data to monitor NDVI changes and their relationships with climatic parameters in Northeast China. Int. J. Appl. Earth Obs. Geoinf. 2012, 18, 528–536. [Google Scholar] [CrossRef]
- Jin, H.; Yu, Q.; Lü, L.; Guo, D.; He, R.; Yu, S.; Sun, G.; Li, Y. Degradation of permafrost in the Xing’anling Mountains, northeastern China. Permafr. Periglac. 2007, 18, 245–258. [Google Scholar] [CrossRef]
- Jin, X.; Jin, H.; Iwahana, G.; Marchenko, S.; Luo, D.; Li, X.; Liang, S. Impacts of climate-induced permafrost degradation on vegetation: A review. Adv. Clim. Chang. Res. 2021, 12, 29–47. [Google Scholar] [CrossRef]
- Li, R.; Zhang, M.; Andreeva, V.; Pei, W.; Zhou, Y.; Misailov, I.; Basharin, N. Impact of climate warming on permafrost changes in the Qinghai-Tibet Plateau. Cold Reg. Sci. Technol. 2023, 205, 103692. [Google Scholar] [CrossRef]
- Shan, W.; Zhang, C.; Guo, Y.; Qiu, L.; Xu, Z.; Wang, Y. Spatial distribution and variation characteristics of permafrost temperature in Northeast China. Sustainability 2022, 14, 8178. [Google Scholar] [CrossRef]
- Chen, S.; Zang, S.; Sun, L. Permafrost degradation in Northeast China and its environmental effects: Present situation and prospect. Glaciol. Geocryol. 2018, 40, 298–306. (In Chinese) [Google Scholar]
- Zhang, Z.; Wu, Q.; Xun, X.; Li, Y. Spatial distribution and changes of Xing’an permafrost in China over the past three decades. Quatern Int. 2019, 523, 16–24. [Google Scholar]
- Wei, Z.; Jin, H.; Zhang, J.; Yu, S.; Han, X.; Ji, Y.; He, R.; Chang, X. Prediction of permafrost changes in Northeastern China under a changing climate. Sci. China Earth Sci. 2011, 54, 924–935. [Google Scholar] [CrossRef]
- Zhang, Z.; Wu, Q.; Hou, M.; Tai, B.; An, Y. Permafrost change in Northeast China in the 1950s–2010s. Adv. Clim. Chang. Res. 2021, 12, 18–28. [Google Scholar] [CrossRef]
- Gao, H.; Nie, N.; Zhang, W.; Chen, H. Monitoring the spatial distribution and changes in permafrost with passive microwave remote sensing. ISPRS J. Photogramm. 2020, 170, 142–155. [Google Scholar] [CrossRef]
- Huang, S.; Ding, Q.; Chen, K.; Hu, Z.; Liu, Y.; Zhang, X.; Gao, K.; Qiu, K.; Yang, Y.; Ding, L. Changes in near-surface permafrost temperature and active layer thickness in Northeast China in 1961–2020 based on GIPL model. Cold Reg. Sci. Technol. 2023, 206, 103709. [Google Scholar] [CrossRef]
- Nitze, I.; Grosse, G.; Jones, B.M.; Romanovsky, V.E.; Boike, J. Remote sensing quantifies widespread abundance of permafrost region disturbances across the Arctic and Subarctic. Nat. Commun. 2018, 9, 5423. [Google Scholar] [CrossRef] [PubMed]
- Gao, X.; Lin, K.; Liu, M.; Dong, C.; Yao, Z.; Liu, Z.; Xiao, M.; Xie, X.; Huang, L. Dynamic changes in permafrost distribution over China and their potential influencing factors under climate warming. Sci. Total Environ. 2023, 874, 162624. [Google Scholar] [CrossRef] [PubMed]
- Zhang, H.; Zhou, G.; Li, D.; Wang, B.; Xiao, D.; He, L. Climate-associated rice yield change in the Northeast China Plain: A simulation analysis based on CMIP5 multi-model ensemble projection. Sci. Total Environ. 2019, 666, 126–138. [Google Scholar] [CrossRef] [PubMed]
- Shen, X.; Liu, B.; Xue, Z.; Jiang, M.; Lu, X.; Zhang, Q. Spatiotemporal variation in vegetation spring phenology and its response to climate change in freshwater marshes of Northeast China. Sci. Total Environ. 2019, 666, 1169–1177. [Google Scholar] [CrossRef] [PubMed]
- Dang, Y.; Qin, L.; Huang, L.; Wang, J.; Li, B.; He, H. Water footprint of rain-fed maize in different growth stages and associated climatic driving forces in Northeast China. Agr. Water Manag. 2022, 263, 107463. [Google Scholar] [CrossRef]
- Xiang, H.; Zhang, J.; Mao, D.; Wang, Z.; Qiu, Z.; Yan, H. Identifying spatial similarities and mismatches between supply and demand of ecosystem services for sustainable Northeast China. Ecol. Indic. 2022, 134, 108501. [Google Scholar] [CrossRef]
- Nekrasov, I.; Klimovskii, I. Permafrost along the Baikal-Amur Main (Railway); Science Press (Siberia Branch): Yakutsk, Russia, 1978. [Google Scholar]
- Gu, Y.; Pang, B.; Qiao, X.; Xu, D.; Li, W.; Yan, Y.; Dou, H.; Ao, W.; Wang, W.; Zou, C.; et al. Vegetation dynamics in response to climate change and human activities in the Hulun Lake basin from 1981 to 2019. Ecol. Indic. 2022, 136, 108700. [Google Scholar] [CrossRef]
- Nelson, F.E. Permafrost distribution in central Canada: Applications of a climate-based predictive model. Ann. Assoc. Am. Geogr. 1986, 76, 550–569. [Google Scholar] [CrossRef]
- Nelson, F.E.; Outcalt, S.I. A computational method for prediction and regionalization of permafrost. Arct. Antarct. Alp. Res. 1987, 19, 279–288. [Google Scholar] [CrossRef]
- Huang, K.; Zhang, Y.; Zhu, J.; Liu, Y.; Zu, J.; Zhang, J. The influences of climate change and human activities on vegetation dynamics in the Qinghai-Tibet Plateau. Remote Sens. 2016, 8, 876. [Google Scholar] [CrossRef]
- Ndayisaba, F.; Guo, H.; Bao, A.; Guo, H.; Karamage, F.; Kayiranga, A. Understanding the spatial temporal vegetation dynamics in Rwanda. Remote Sens. 2016, 8, 129. [Google Scholar] [CrossRef]
- Zhang, T.; Chen, Y. Analysis of dynamic spatiotemporal changes in actual evapotranspiration and its associated factors in the Pearl River Basin based on MOD16. Water 2017, 9, 832. [Google Scholar] [CrossRef]
- Li, D.; Luo, H.; Hu, T.; Shao, D.; Cui, Y.; Khan, S.; Luo, Y. Identification of the roles of climate factors, engineering construction, and agricultural practices in vegetation dynamics in the Lhasa River Basin, Tibetan Plateau. Remote Sens. 2020, 12, 1883. [Google Scholar] [CrossRef]
- Hirsch, R.M.; Slack, J.R.; Smith, R.A. Techniques of trend analysis for monthly water quality data. Water Resour. Res. 1982, 18, 107–121. [Google Scholar] [CrossRef]
- Xing, L.; Huang, L.; Chi, G.; Yang, L.; Li, C.; Hou, X. A dynamic study of a Karst Spring based on wavelet analysis and the Mann–Kendall Trend Test. Water 2018, 10, 698. [Google Scholar] [CrossRef]
- Jian, S.; Yin, C.; Wang, Y.; Yu, X.; Li, Y. The Possible Incoming Runoff Under Extreme Rainfall Event in the Fenhe River Basin. Front. Env. Sci. 2022, 10, 812351. [Google Scholar] [CrossRef]
- Conte, L.C.; Bayer, D.M.; Bayer, F.M. Bootstrap Pettitt test for detecting change points in hydroclimatological data: Case study of Itaipu Hydroelectric Plant, Brazil. Hydrol. Sci. J. 2019, 64, 1312–1326. [Google Scholar] [CrossRef]
- Reid, P.C.; Hari, R.E.; Beaugrand, G.; Livingstone, D.M.; Marty, C.; Straile, D.; Barichivich, J.; Goberville, E.; Adrian, R.; Aono, Y.; et al. Global impacts of the 1980s regime shift. Glob. Chang. Biol. 2016, 22, 682–703. [Google Scholar] [CrossRef] [PubMed]
- Goossens, C.; Berger, A. How to recognize an abrupt climatic change. In Abrupt Climatic Change: Evidence and Implications; Springer: Dordrecht, The Netherlands, 1987; pp. 31–45. [Google Scholar]
- Wright, J.F.; Duchesne, C.; Côté, M.M. Regional-scale permafrost mapping using the TTOP ground temperature model. In Proceedings of the 8th International Conference on Permafrost, Zürich, Switzerland, 21–25 July 2003; pp. 1241–1246. [Google Scholar]
- Yang, Z.; Ou, Y.; Xu, X.; Zhao, L.; Song, M.; Zhou, C. Effects of permafrost degradation on ecosystems. Acta Ecol. Sin. 2010, 30, 33–39. [Google Scholar] [CrossRef]
- Yue, Y.; Liu, H.; Xue, J.; Li, Y.; Guo, W. Ecological indicators of near-surface permafrost habitat at the southern margin of the boreal forest in China. Ecol. Indic. 2020, 108, 105714. [Google Scholar] [CrossRef]
- Che, L.; Zhang, H.; Wan, L. Spatial distribution of permafrost degradation and its impact on vegetation phenology from 2000 to 2020. Sci. Total Environ. 2023, 877, 162889. [Google Scholar] [CrossRef] [PubMed]
- Che, L.; Cheng, M.; Xing, L.; Cui, Y.; Wan, L. Effects of permafrost degradation on soil organic matter turnover and plant growth. Catena 2022, 208, 105721. [Google Scholar] [CrossRef]
- Liu, Z.; Chen, B.; Wang, S.; Wang, Q.; Chen, J.; Shi, W.; Wang, X.; Liu, Y.; Tu, Y.; Huang, M.; et al. The impacts of vegetation on the soil surface freezing-thawing processes at permafrost southern edge simulated by an improved process-based ecosystem model. Ecol. Model. 2021, 456, 109663. [Google Scholar] [CrossRef]

Disclaimer/Publisher’s Note: The statements, opinions and data contained in all publications are solely those of the individual author(s) and contributor(s) and not of MDPI and/or the editor(s). MDPI and/or the editor(s) disclaim responsibility for any injury to people or property resulting from any ideas, methods, instructions or products referred to in the content. |
© 2024 by the authors. Licensee MDPI, Basel, Switzerland. This article is an open access article distributed under the terms and conditions of the Creative Commons Attribution (CC BY) license (https://creativecommons.org/licenses/by/4.0/).