Article

Assessment of Satellite Products in Estimating Tropical Cyclone Remote Precipitation over the Yangtze River Delta Region

1
Institute of Remote Sensing and Earth Sciences, School of Information Science and Technology, Hangzhou Normal University, Hangzhou 311121, China
2
Zhejiang Provincial Key Laboratory of Urban Wetlands and Regional Change, Hangzhou 311121, China
*
Author to whom correspondence should be addressed.
Atmosphere 2024, 15(6), 667; https://doi.org/10.3390/atmos15060667
Submission received: 4 May 2024 / Revised: 23 May 2024 / Accepted: 28 May 2024 / Published: 31 May 2024
(This article belongs to the Special Issue Severe Weather: Evolution, Prediction, and Risk Reduction)

Abstract

:
Satellite products have shown great potential in estimating torrential rainfall due to their wide and consistent global coverage. This study assessed the monitoring capabilities of satellite products for the tropical cyclone remote precipitation (TRP) over the Yangtze River Delta region (YRDR) associated with severe typhoon Khanun (2017) and super-typhoon Mangkhut (2018). The satellite products include the CPC MORPHing technique (CMORPH) data, Tropical Rainfall Measuring Mission 3B42 Version 7 (TRMM 3B42), and Integrated Multi-satellite Retrievals for the Global Precipitation Measurement Mission (GPM IMERG). Eight precision evaluation indexes and statistical methods were used to analyze and evaluate the monitoring capabilities of CMORPH, TRMM 3B42, and GPM IMERG satellite precipitation products. The results indicated that the monitoring capability of TRMM satellite precipitation products was superior in capturing the spatial distribution, and GPM products captured the temporal distributions and different category precipitation observed from gauge stations. In contrast, the CMORPH products performed moderately during two heavy rainfall events, often underestimating or overestimating precipitation amounts and inaccurately detecting precipitation peaks. Overall, the three satellite precipitation products showed low POD, high FAR, low TS, and high FBIAS for heavy rainfall events, and the differences in monitoring torrential TRP may be related to satellite retrieval algorithms.

1. Introduction

Carbon emission from the core production systems such as the crop, livestock, and industrial sectors is the main reason for global warming [1,2,3]. As global warming intensifies, the Yangtze River Delta region (YRDR) is experiencing an increasing trend in extreme precipitation [4]. In the YPDR, typhoons are crucial in triggering extreme precipitation events, with many intense and prolonged heavy rainfalls closely related to typhoons. Chen [5] pointed out that the rainstorm area of a typhoon can be divided into two major areas: the area where the rainstorm is directly triggered by the typhoon circulation itself, and the distant rainstorm area indirectly influenced by the typhoon. Among them, tropical cyclone remote precipitation (TRP) is defined as precipitation occurring far away from the typhoon system, yet exhibiting notable physical interactions with the typhoon [6]. Additionally, Galarneau et al. [7] proposed that the precipitation that falls approximately 1000 km from the typhoon’s center is commonly referred to as the long-distance precipitation of a typhoon. Cong et al. [8] pointed out that the generation of long-distance heavy rainfall associated with tropical cyclones can be attributed to the complex interactions between tropical cyclone water vapor transport, mid-latitude westerly troughs, and topographic factors.
The generation of a TRP event is complex and typically occurs in regions located more than one thousand kilometers away from the typhoon center. The rainfall may be neglected or underestimated due to the long distance away from the typhoon center, leading to considerable uncertainty in the TRP prediction associated with typhoons. The combination of this unpredictability and uncertainty, along with the high intensity of TRP, can result in rapid accumulation of precipitation, triggering severe natural disasters such as flooding and even posing a serious threat to local socioeconomic activities and the safety of people’s lives and property [9]. For instance, under the influence of severe typhoon In-Fa (2021), Henan Province experienced a rare extreme precipitation event in 2021. On 20 July, the 24 h precipitation in Zhengzhou city reached as high as 552.5 mm, exceeding 80% of the average annual precipitation. The rainstorm resulted in 302 deaths and 50 people missing. TRP occurs almost every year in the YRDR of China. According to statistics, 252 typhoons occurred in the South China Sea–West Pacific region between 2010 and 2019, of which 73 made landfall in China, and it is worth noting that the amount of TRP in the YRDR triggered by these landing typhoons accounted for 10% of the total number of landing typhoons [10]. The super-typhoon Mangkhut (2018) in 2018 had a significant impact on Guangdong Province directly, leading to heavy rainfall in the YRDR, which was 1300 km away from Guangdong. Cumulative rainfall in southern Anhui, Jiangsu, and northern Zhejiang exceeded 250 mm, with rainfall at some observation stations surpassing 300 mm [11]. Due to heavy rainfall, areas with low terrain, dense river networks, and low vegetation coverage are more susceptible to flood disasters. During the TRP process, the cities in the eastern YRDR may suffer from serious waterlogging disasters.
The Yangtze River Delta City urban agglomeration serves as a crucial intersection point for the “the Belt and Road” and the Yangtze River Economic Belt, holding significant strategic importance in progressing China’s national modernization and opening up. To achieve accurate monitoring and efficient early warning of TRP in the YRDR under the background of the frequent occurrences of extreme weather and climate events, further enhancements in meteorological research on typhoons and TPR in the YRDR are imperative.
At present, China’s meteorological observation work mainly relies on the professional observation stations established by the meteorological departments, which aim at providing representative and highly accurate meteorological data. However, there are also some limitations, such as insufficient network densities, and uneven spatial distributions, especially in mountainous and marine areas where observation stations are relatively scarce. This makes it difficult to accurately reflect the actual temporal–spatial characteristics of precipitation regardless of using spatial interpolation methods [12], complicating the precise monitoring of small- and medium-scale weather systems. This in turn impacts the accuracy of meteorological forecasts and disaster warnings. In recent years, the development of satellite remote sensing technology has greatly promoted the study of TRP. Remote sensing data possess strong spatial continuity, wide monitoring coverage, real-time transmission of instantaneous imaging, and are not restricted by geographical environments, presenting significant advantages in the study of TRP. Cheng et al. [13] evaluated the precipitation products of CMORPH and TRMM 3B42 in the regions of China. The results indicated that the spatial distribution of daily average precipitation between different satellite data and ground station data shows similarity, but CMORPH exhibits different monitoring capabilities between North and South China. There are noticeable seasonal variations in mean absolute error, relative error, and root mean square error. All three satellite datasets can effectively reflect the diurnal variation characteristics of summer precipitation in most regions of China, yet significant biases exist in certain areas. Xiao et al. [14] assessed the GPM satellite precipitation products during typhoon extreme precipitation processes, and showed that GPM IMERG’s ability to reproduce regional precipitation of small rainfall amounts is better than that of medium ones, and the heavy precipitation was overestimated. Li et al. [15] conducted a comparative analysis of precipitation products for TRMM and GPM satellites in mainland China; it was found that both TRMM and GPM satellite precipitation products exhibited low relative errors and high correlations compared with observations in Eastern China. The overall error of GPM precipitation data was lower than that of TRMM, and it was more capable of monitoring weak precipitation. Satellite products demonstrate significant differences in monitoring different levels of precipitation in different regions.
In conclusion, satellites have promising applications in the context of typhoon-related heavy rainfall, including estimating rainfall distributions, assessing precipitation peaks, and analyzing the capabilities of extreme precipitation estimations [13,14,15,16,17]. Satellites not only provide real-time precipitation monitoring products but also enable meteorological departments to effectively monitor areas with relatively few weather stations, such as mountainous areas. At the same time, precipitation data obtained from satellites can be applied to the analysis of hydrological models, thus providing significant initial data for hydrological forecasts (e.g., flood prediction). The YRDR has a subtropical monsoon climate with complex and variable climatic characteristics, is densely populated and economically prosperous, and is also prone to droughts and floods in the context of global climate change [18,19]. Thus, it is necessary to strengthen the study of satellite precipitation in this region. In recent years, satellite products have made significant advancements in monitoring precipitation in different regions, but research evaluating the monitoring capabilities of satellite precipitation products for TRP events is scarce. This study firstly utilizes ground weather station data in the region to detect extreme precipitation events caused by severe typhoon Khanun (2017) and super-typhoon Mangkhut (2018). Subsequently, this study evaluates the monitoring capabilities of three satellite products (CMORPH, TRMM, and GPM) during TRP events in the YRDR. This study provides scientific evidence for the prevention of rainstorm floods and associated secondary disasters in the YRDR, holding significant practical and applied value in water resource management.

2. Study Area and Data
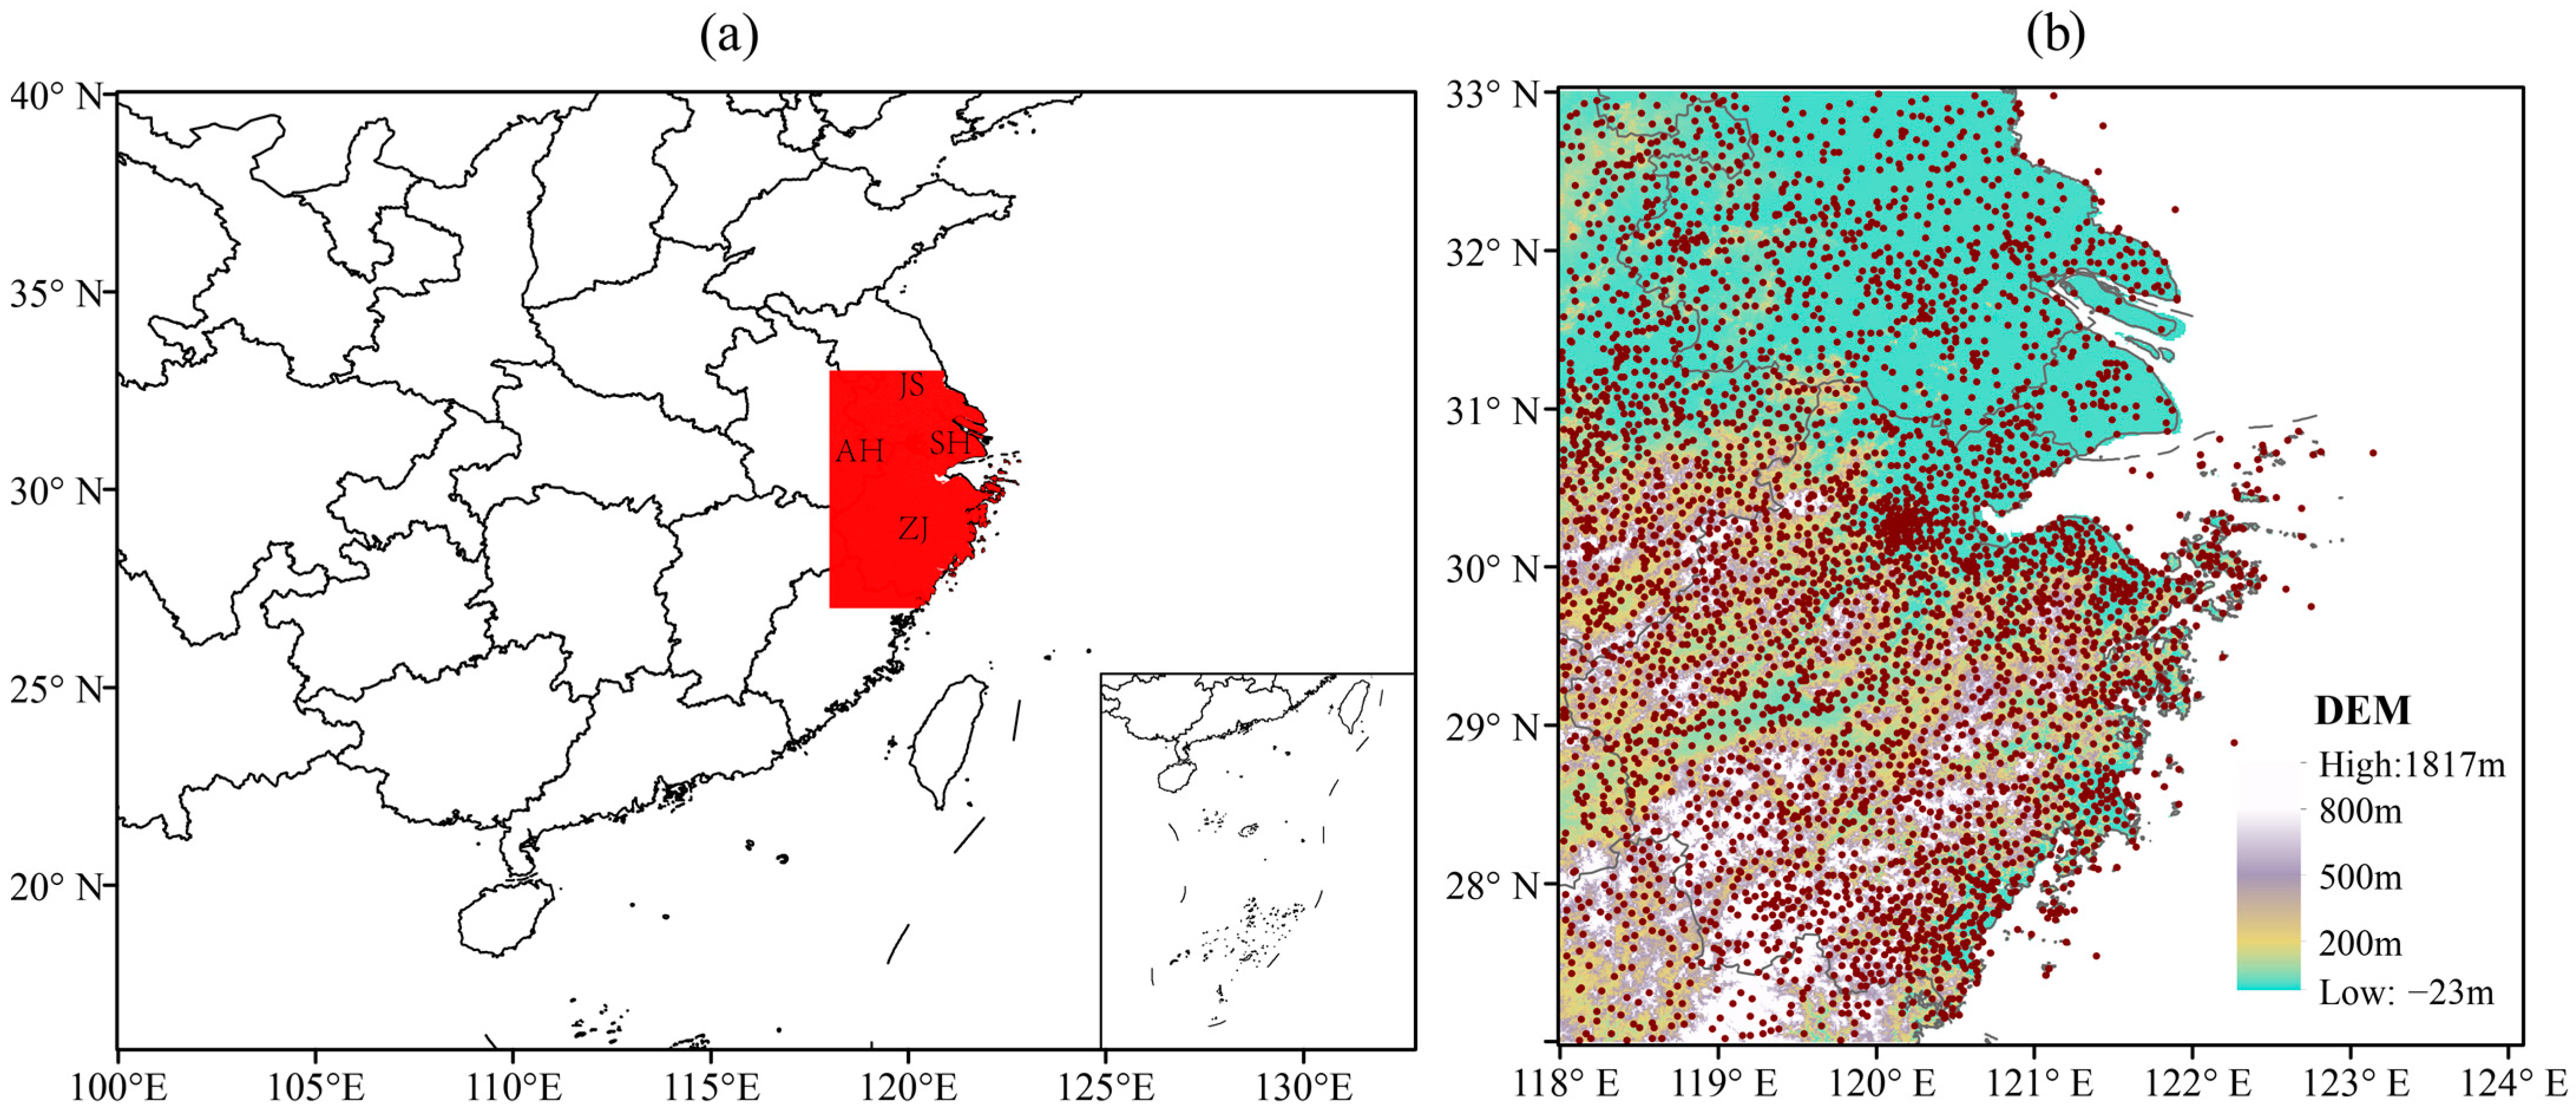
2.1. Study Area

This study analyzes the monitoring capabilities of different satellite products for TRP events in the region of 27–33° N and 118–124° E. The area mainly includes the southern and central regions of Jiangsu, Zhejiang, southeastern Anhui Provinces, and Shanghai (Figure 1). The YRDR is characterized by a plain–hilly continent with complex terrains, dense rivers, and diverse climates, which is prone to heavy precipitation in summer and drought in fall. Additionally, typhoons and heavy rainfall, droughts and floods, and a wide range of meteorological hazards with high intensity may occur simultaneously with high frequency. According to the statistics from the Ministry of Emergency Management of the People’s Republic of China (https://www.mem.gov.cn/, accessed on 4 May 2024) in 2021, China experienced frequent extreme heavy rainfall with a total of 42 occurrences. Among them, severe typhoon In-Fa (2021) made landfall in Zhoushan and Pinghu of Zhejiang Province, accompanied by strong winds and heavy rainfall. The east–central coastal areas of persistent windy weather, including enormous rainfall amounts of 50 to 250 mm and gusts of 28.5 to 41.4 m/s, and most of the areas in northeastern Zhejiang, central Jiangsu, and Shanghai experienced a total rainfall of more than 250 mm. With the annual damage statistics of natural disasters in Zhejiang province (https://www.zju.edu.cn/, accessed on 4 May 2024), it is found that 2005, 2013, and 2019 are the years severely impacted by typhoons, which resulted in the direct economic loss of up to 60.91 billion dollars in 2013, and the affected areas were as much as 630,920 hectares.

2.2. Data

The hourly precipitation from national weather stations in the YRDR was obtained from the China Meteorological Data Service Center (https://data.cma.cn/, accessed on 4 May 2024). The selected weather stations include national reference climatological stations, national basic weather stations, and national general weather stations that have monitored precipitation during the study period. Their spatial distributions are depicted in Figure 1. The datasets from the weather stations cover the periods from 0000 UTC on 15 October to 0000 UTC on 16 October 2017 during the landfall of severe typhoon Khanun (2017), and from 1200 UTC on 16 September to 1200 UTC on 17 September 2018 during the landfall of super-typhoon Mangkhut (2018). The weather station information can be found on the GitHub website (https://github.com/jasonliu222/atmosphere-15-00667/, accessed on 4 May 2024). There were 5457 weather stations that monitored severe typhoon Khanun (2017) and 4118 weather stations that monitored super-typhoon Mangkhut (2018). The digital elevation model (DEM) data from Geospatial Data Cloud (https://www.gscloud.cn/, accessed on 4 May 2024) in Figure 1 is a geographic information system (GIS) technology that represents the terrain’s elevation in a digital format.
CMORPH precipitation products can be obtained from the official National Centers for Environmental Information (NCEI) website (https://www.ncei.noaa.gov/, accessed on 4 May 2024) with a spatial resolution of 0.25° × 0.25° and a temporal resolution of 1 h. The National Oceanic and Atmospheric Administration (NOAA) and Climate Prediction Center (CPC) produced CMORPH by combining various infrared and microwave precipitation data sources [20]. The TRMM 3B42 and GPM IMERG precipitation products are obtained from the NASA official website (https://www.nasa.gov/, accessed on 4 May 2024). The TRMM 3B42 products were obtained by jointly merging TRMM and other satellites, which only provided precipitation information in grid points within the 50° S-to-50° N range [20]. The spatial resolution of TRMM datasets is 0.25° × 0.25°, and the temporal resolution is 3 h. GPM IMERG data are a half-hourly precipitation data product generated by the GPM satellite based on microwave–infrared datasets with a resolution of 0.1° × 0.1°, detailed information about the data can refer to the file specification for GPM [20]. This study aggregates the half-hourly GPM precipitation products into hourly data to match the observations in temporal resolution.
To obtain public weather stations of the datasets during the above 24 h time periods, the stations containing deficient rainfall for a certain time were eliminated. These public stations enable the acquisition of precipitation data at 3 h and 24 h intervals. This study generated 3 h and 24 h datasets by aggregating 1 h CMORPH and half-hour GPM products and generated 24 h datasets by integrating 3 h TRMM precipitation. Using NCAR Command Language (NCL) software, rainfall data from CMORPH, TRMM, and GPM were spatiotemporally matched to weather stations via applying bilinear interpolation (Figure 1).

3. Methodology

This study adopted the quality evaluation indices for meteorological satellite quantitative products as outlined by Ebert et al. [21]. Additionally, three satellite precipitation products were further evaluated using statistical metrics, including the root mean square error (RMSE), correlation coefficient (CC), average deviation (BIAS), and mean absolute error (MAE); the formulas can be written as follows:
R M S E = i = 1 N ( S i O i ) 2 n
C C = i = 1 N ( S i S ¯ i ) ( O i O ¯ i ) i = 1 N ( S i S ¯ ) 2 i = 1 N ( O i O ¯ ) 2
B I A S = 1 N i = 1 N ( S i O i )
M A E = 1 N i = 1 N S i O i
where N represents the total number of samples, S is the satellite estimate of precipitation, O is the gauge precipitation value, and S and O are the averages of satellite and gauge precipitation values, respectively. In addition to the spatial analysis methods as above described, the scatter analysis method was also applied to compare the observations and satellite datasets. Bilinear interpolation was also used to interpolate the satellite precipitation into weather stations using NCAR Command Language software.
To evaluate the performance of satellite precipitation products in identifying precipitation events, this study additionally employed probability of detection (POD), false alarm rate (FAR), threat score (TS), and bias score (FBIAS) as four statistical classification metrics. POD refers to the proportion of the predicted actual precipitation area to the total actual precipitation area; FAR indicates the proportion of the area where no actual precipitation occurred in the forecasted precipitation area; TS is applied to evaluate meteorological forecast accuracy by comparing forecasted precipitation amount with observed precipitation amount to calculate scores; FBIAS is mainly used to measure the forecast deviation of a certain magnitude during precipitation events [17,22,23,24]. The formulas can be expressed as follows:
P O D = a a + b
F A R = c a + c
T S = a a + b + c
F B I A S = a + c a + b
where a represents the total number of hits (observed rain correctly detected); b represents the number of missed alarms (observed rain not detected); c represents the number of false alarms (detected rain not observed). Where POD, FAR, and TS take values in the range of [0, 1]; FBIAS takes values in the range of [0, +∞); the ideal values of POD, TS, and FBIAS are 1, and that of FAR is 0.

4. Results

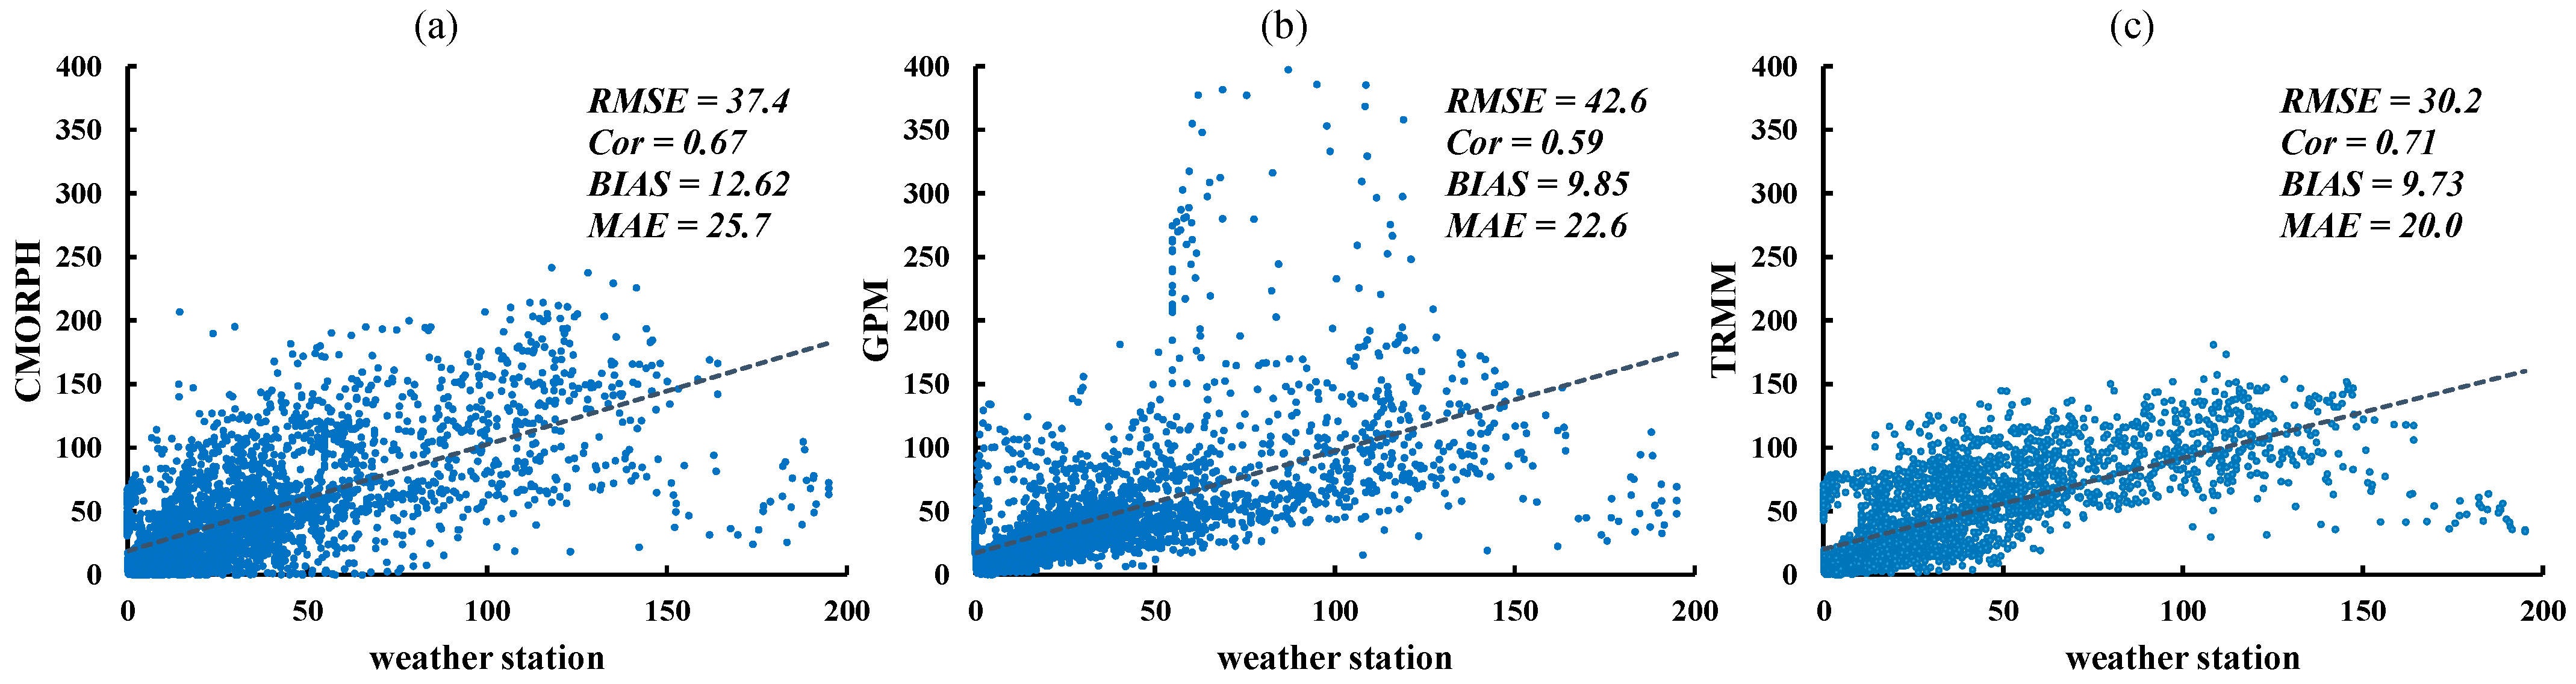
4.1. Spatial Distribution Characteristics

Figure 2 and Figure 3 present the 24 h cumulative rainfall distribution of observations and satellite data. Figure 2a shows the heavy rainfall area of severe typhoon Khanun (2017) from 0000 UTC, 15 October to 0000 UTC, 16 October 2017, which was mainly concentrated in the eastern coastal areas of YRDR. The rainfall center was mainly located in the eastern areas of Zhejiang province, with the 24 h accumulated rainfall exceeding 250 mm. Precipitation generally showed a decreasing trend from the eastern coastal areas towards the inland areas.
The CMORPH, TRMM, and GPM estimated similar heavy rainfall patterns, with the precipitation center concentrated in the eastern coastal areas and relatively less precipitation in the western inland areas. However, the estimated rainfall amounts from the three satellites were underestimated compared to the observations, and the position of heavy rainfall was shifted towards the east. Specifically, in the coastal areas, GPM estimated the heavy rainfall center positioned off the eastern coast of Zhejiang Province, which closely matched the observations. Conversely, TRMM and CMORPH failed to detect precipitation exceeding 200 mm and did not identify a discernable center of heavy rainfall. In inland areas, the three satellites generally estimate precipitation of less than 10 mm, slightly underestimating the range for rainfall of 10–25 mm. In the southeast hilly regions of Zhejiang Province, satellites significantly underestimated precipitation, and the phenomenon may be largely attributed to scarce distributions of weather stations in mountainous regions or the complex mountainous terrains impairing the accuracy of satellite retrieval capabilities [25,26].
Figure 3a showed the 24 h heavy rainfall from 1200 UTC, 16 September to 1200 UTC, 16 September 2018, which was mainly concentrated in the eastern offshore areas. There existed two small centers with rainfall exceeding 150 mm: one was located in the eastern offshore area of Yancheng of Jiangsu Province, and the other was in the eastern region of Ningbo in Zhejiang Province.
Comparing the spatial distribution of observed rainfall with that of satellites, the satellites generally estimated the location of intense rainfall centers, especially identifying the small-range intense rainfall center in eastern Ningbo. Comparatively, the GPM more accurately estimated the location of the intense rainfall center (Figure 3d); the intense rainfall center estimated by CMORPH shifted southeastward (Figure 3b), and that of TRMM shifted southward (Figure 3c). All three satellites accurately estimated the spatial distribution characteristics, though the rainfall center from observations was 150 mm, which was significantly overestimated by CMORPH and GPM (exceeds 200 mm). The rainfall center intensity estimated by TRMM was closer to the observations. The precipitation estimated by satellites in the southeastern hilly areas was larger compared to the observations, and this bias may be attributed to the scarce distributions of weather stations in mountainous regions or the influence of the complex mountainous terrain on the retrieval ability of satellites [25,26].
Figure 4 and Figure 5 show the scatter plots of precipitation from satellites and observations, and they exhibit that certain differences exist in the RMSE values for the three satellite products. During the severe typhoons Khanun (2017) and Mangkhut (2018), the RMSE values for CMORPH, GPM, and TRMM were, respectively, 37.8 mm (37.4 mm), 41.1 mm (42.6 mm), and 36.5 mm (30.2 mm). Among them, TRMM performed the best, followed by CMORPH, with GPM exhibiting the least accuracy. Regarding the correlation between estimated precipitation and observations during the two typhoons, CMORPH, GPM, and TRMM exhibited values of 0.53 (0.67), 0.45 (0.59), and 0.57 (0.71), respectively. TRMM showed the highest correlations, followed by CMORPH and GPM. In terms of BIAS, the three satellite precipitation products (CMORPH, GPM, and TRMM) underestimated heavy rainfall during severe typhoon Khanun (2017), with values of −7.60 mm, −10.00 mm, and −11.77 mm, respectively, while they overestimated the heavy precipitation of super-typhoon Mangkhut (2018). TRMM exhibited the lowest overestimation with a BIAS of 9.73 mm, followed by GPM and CMORPH, showing values of 9.85 mm and 12.62 mm, respectively. Overall, TRMM exhibited the best performance. The MAE of precipitation estimated from CMORPH, GPM, and TRMM satellite products was 21.7 mm, 23.1 mm, and 21.4 mm for Khanun (2017), and 25.7 mm, 22.6 mm, and 19.9 mm for Mangkhut (2018), respectively. Overall, the TRMM satellite precipitation products demonstrated the best performance in terms of the above statistics methods.

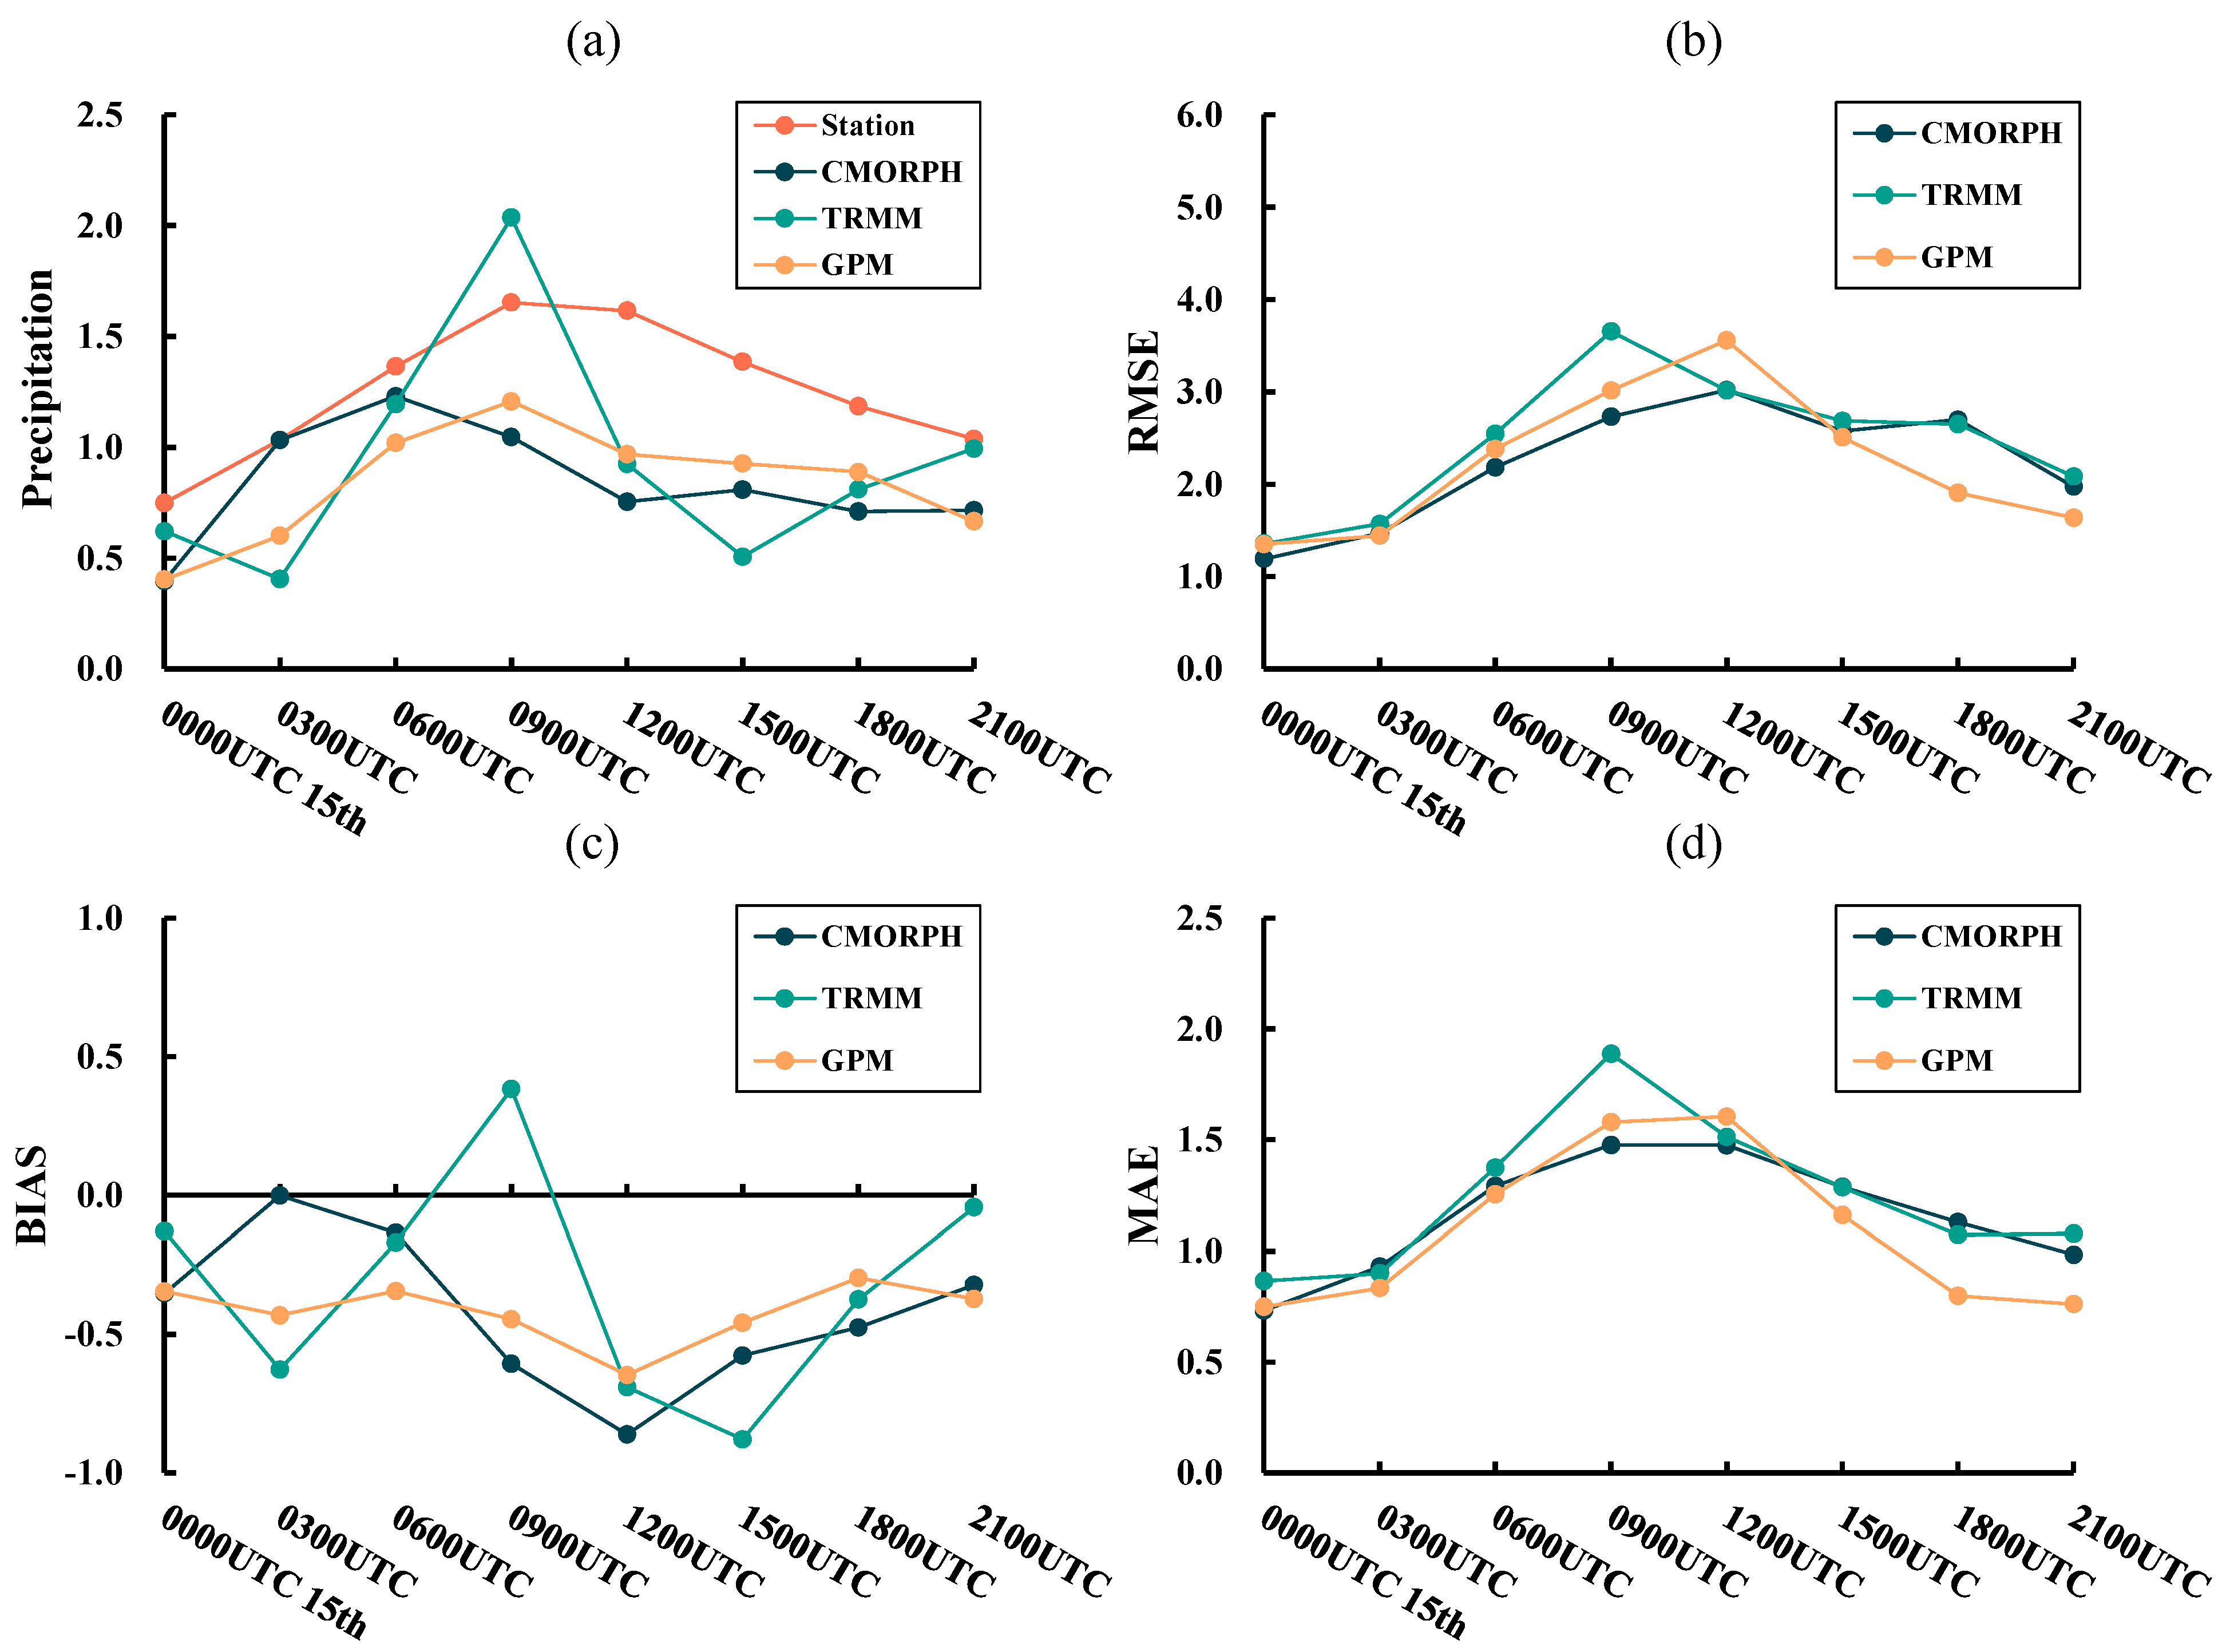
4.2. Temporal Distribution Characteristics

Figure 6 and Figure 7 present the 3 h average precipitation data from observations, RMSE, BIAS, and MAE between observations and rainfall from CMORPH, TRMM, and GPM for severe typhoons Khanun (2017) and Mangkhut (2018). Figure 6a illustrates that TRMM overestimated precipitation at 09:00 UTC, and all the satellites underestimated the 3-hourly average precipitation during the 24 h; in particular, the GPM product significantly underestimated observations, approximately half of the observations. In terms of estimating the peak value of heavy rainfall, both TRMM and GPM satellite products accurately predicted the temporal variations and peak time of rainfall (09:00 UTC). With a value of 2.04 mm/h, TRMM estimated the peak value closest to the observations of 1.65 mm/h, though the temporal variations showed significant fluctuations, deviating from the observations at 03:00 and 15:00 UTC, where minimum values were observed, whereas the CMORPH product detected the peak value earlier at 06:00 UTC with a lower intensity and detected values close to the observations in the temporal series. Overall, the GPM satellite showed the most similar temporal patterns to observations. From Figure 6b, the RMSEs of the TRMM and GPM satellite precipitation products were larger, ranging from 1.4 to 3.7 mm/h. Specifically, the TRMM product reached the maximum RMSE at 0900 UTC. In contrast, the CMORPH satellite precipitation product had relatively lower RMSEs (within 3.0 mm/h) than those of TRMM. The temporal trend of MAE in Figure 6d further demonstrates that both CMORPH and GPM satellite precipitation products generally underestimated precipitation, and the underestimation was especially pronounced at 12:00 UTC. The BIAS of CMORPH estimate was approximately 0 at 03:00 UTC, indicating an accurate estimation of the observations, while GPM showed a lower BIAS, ranging from −0.65 to −0.30 mm/h. Conversely, the TRMM satellite displayed overestimation at 09:00 UTC and underestimation at other times, exhibiting a more substantial variance in BIAS ranging from −0.88 to 0.38 mm/h.
Figure 7a shows that three satellite products generally overestimated heavy rainfall in the YRDR. Super-typhoon Mangkhut (2018) showed two significant precipitation peaks and one dip. The first peak occurred at around 18:00 UTC on 16 September with rainfall of 2.20 mm/h, while the second lower peak occurred at around 0000 UTC on 17 September with rainfall of 1.51 mm/h, and the dip appeared at around 05:00 UTC on 17 September, with rainfall of 1.27 mm/h. For the estimation of the precipitation peaks and dips, all three satellite products were capable of estimating the precipitation peak at 18:00 UTC on 16 September but showed overestimations, among which TRMM estimated the value of 2.23 mm/h closest to the observation. Regarding the second peak and dip, TRMM showed obvious lag, while CMORPH could estimate the dip at 21:00 UTC on 16 September with the value of 2.10 mm/h, but the estimation for the second peak was delayed at around 03:00 UTC on 17 September. Generally, the GPM estimated the dip, and second peak best matched the observed rainfall trend characteristics.
Figure 7b,d show that the overall trends of the RMSE (MAE) of the three satellite products were similar, especially for the CMORPH and TRMM satellite products. However, at 18:00 UTC on 16 September, both the RMSE and MAE of the three satellite precipitation products reached their peak values. Especially from 12:00 UTC on 16 September, the RMSE of the GPM product rapidly increased, reaching the maxima of 6.5 mm/h and 2.2 mm/h, respectively, indicating the precipitation retrieval ability decreased as the rainfall increased. Figure 7c shows that at 21:00 UTC on 16 September, the BIAS of CMORPH, TRMM, and GPM products were similar with values of 0.83 mm/h, 0.75 mm/h, and 0.70 mm/h, respectively. CMORPH and GPM satellite precipitation products overestimated heavy rainfall every 3 h, peaking at 15:00 UTC and 21:00 UTC on 16 September, and 03:00 UTC on 17 September. Meanwhile, the TRMM satellite precipitation product showed an underestimation of −0.14 mm/h at 06:00 UTC on 17 September; an overestimation at other time intervals, with a peak of 0.75 mm/h and 0.97 mm/h, respectively, at 21:00 UTC on 16 September and 03:00 UTC on 17 September; and the BIAS ranging from −0.14 to 0.97 mm/h, showing a wider range of variability.
A comprehensive analysis of the three-hourly satellite precipitation products revealed their capability to monitor the peak heavy rainfall during the severe typhoon Khanun (2017) and super-typhoon Mangkhut (2018). Among these, the TRMM satellite provided the most accurate measurements, closely aligned with the observations. However, the three satellite products only captured the first peak of intense rainfall, showing weak capabilities in monitoring the second peak with a noticeable lag. In comparison, the GPM satellite estimated the time trend of the 3-hourly average rainfall closest to the observations. The BIAS revealed that the GPM satellite precipitation product showed the smallest fluctuations. In contrast, the CMORPH and TRMM products exhibited broader ranges of BIAS variability, with TRMM demonstrating the most significant fluctuations. These products alternatively overestimated precipitation during the two major heavy rainfall events. Further analysis of the RMSE and MAE time series for the two heavy rainfall events indicated that the accuracy of the three satellite products correlated to the precipitation intensity. Peak rainfall intensities recorded at 09:00 UTC (1.65 mm/h) and 12:00 UTC (1.62 mm/h) in 2017, as well as in 2018 at 18:00 UTC (2.20 mm/h), corresponding to large RMSE and MAE values in the three satellite precipitation products.

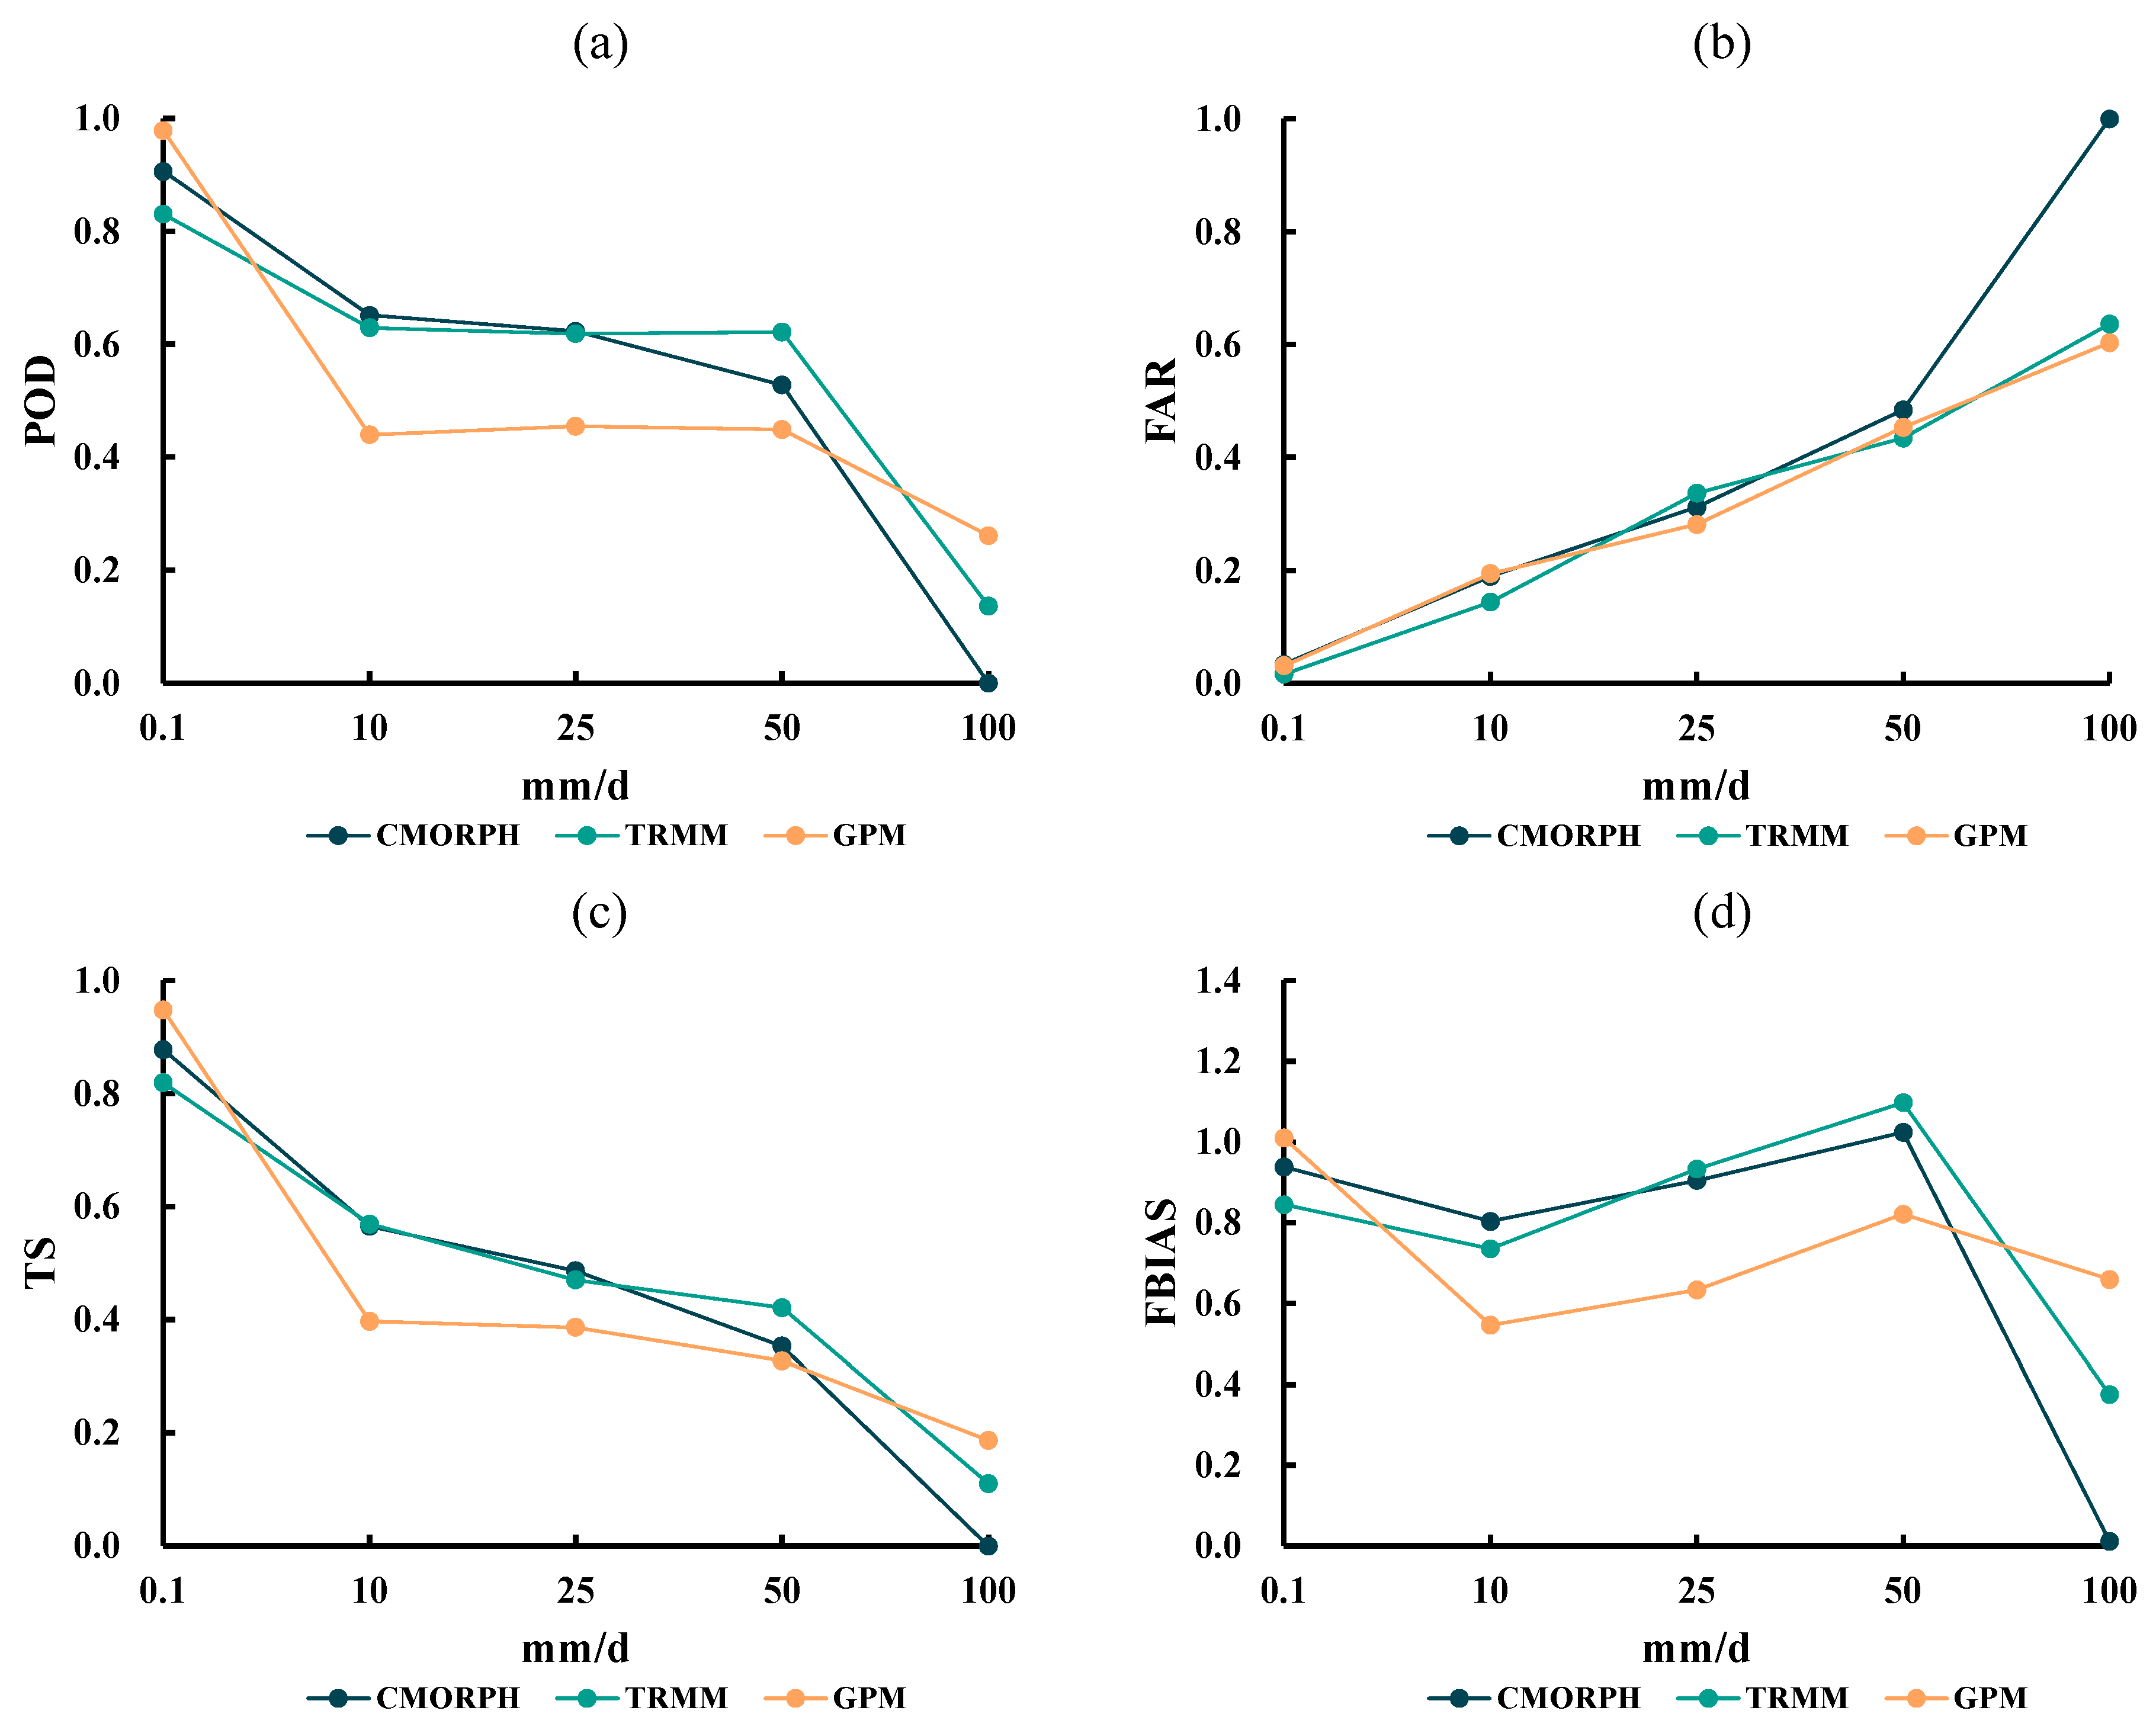
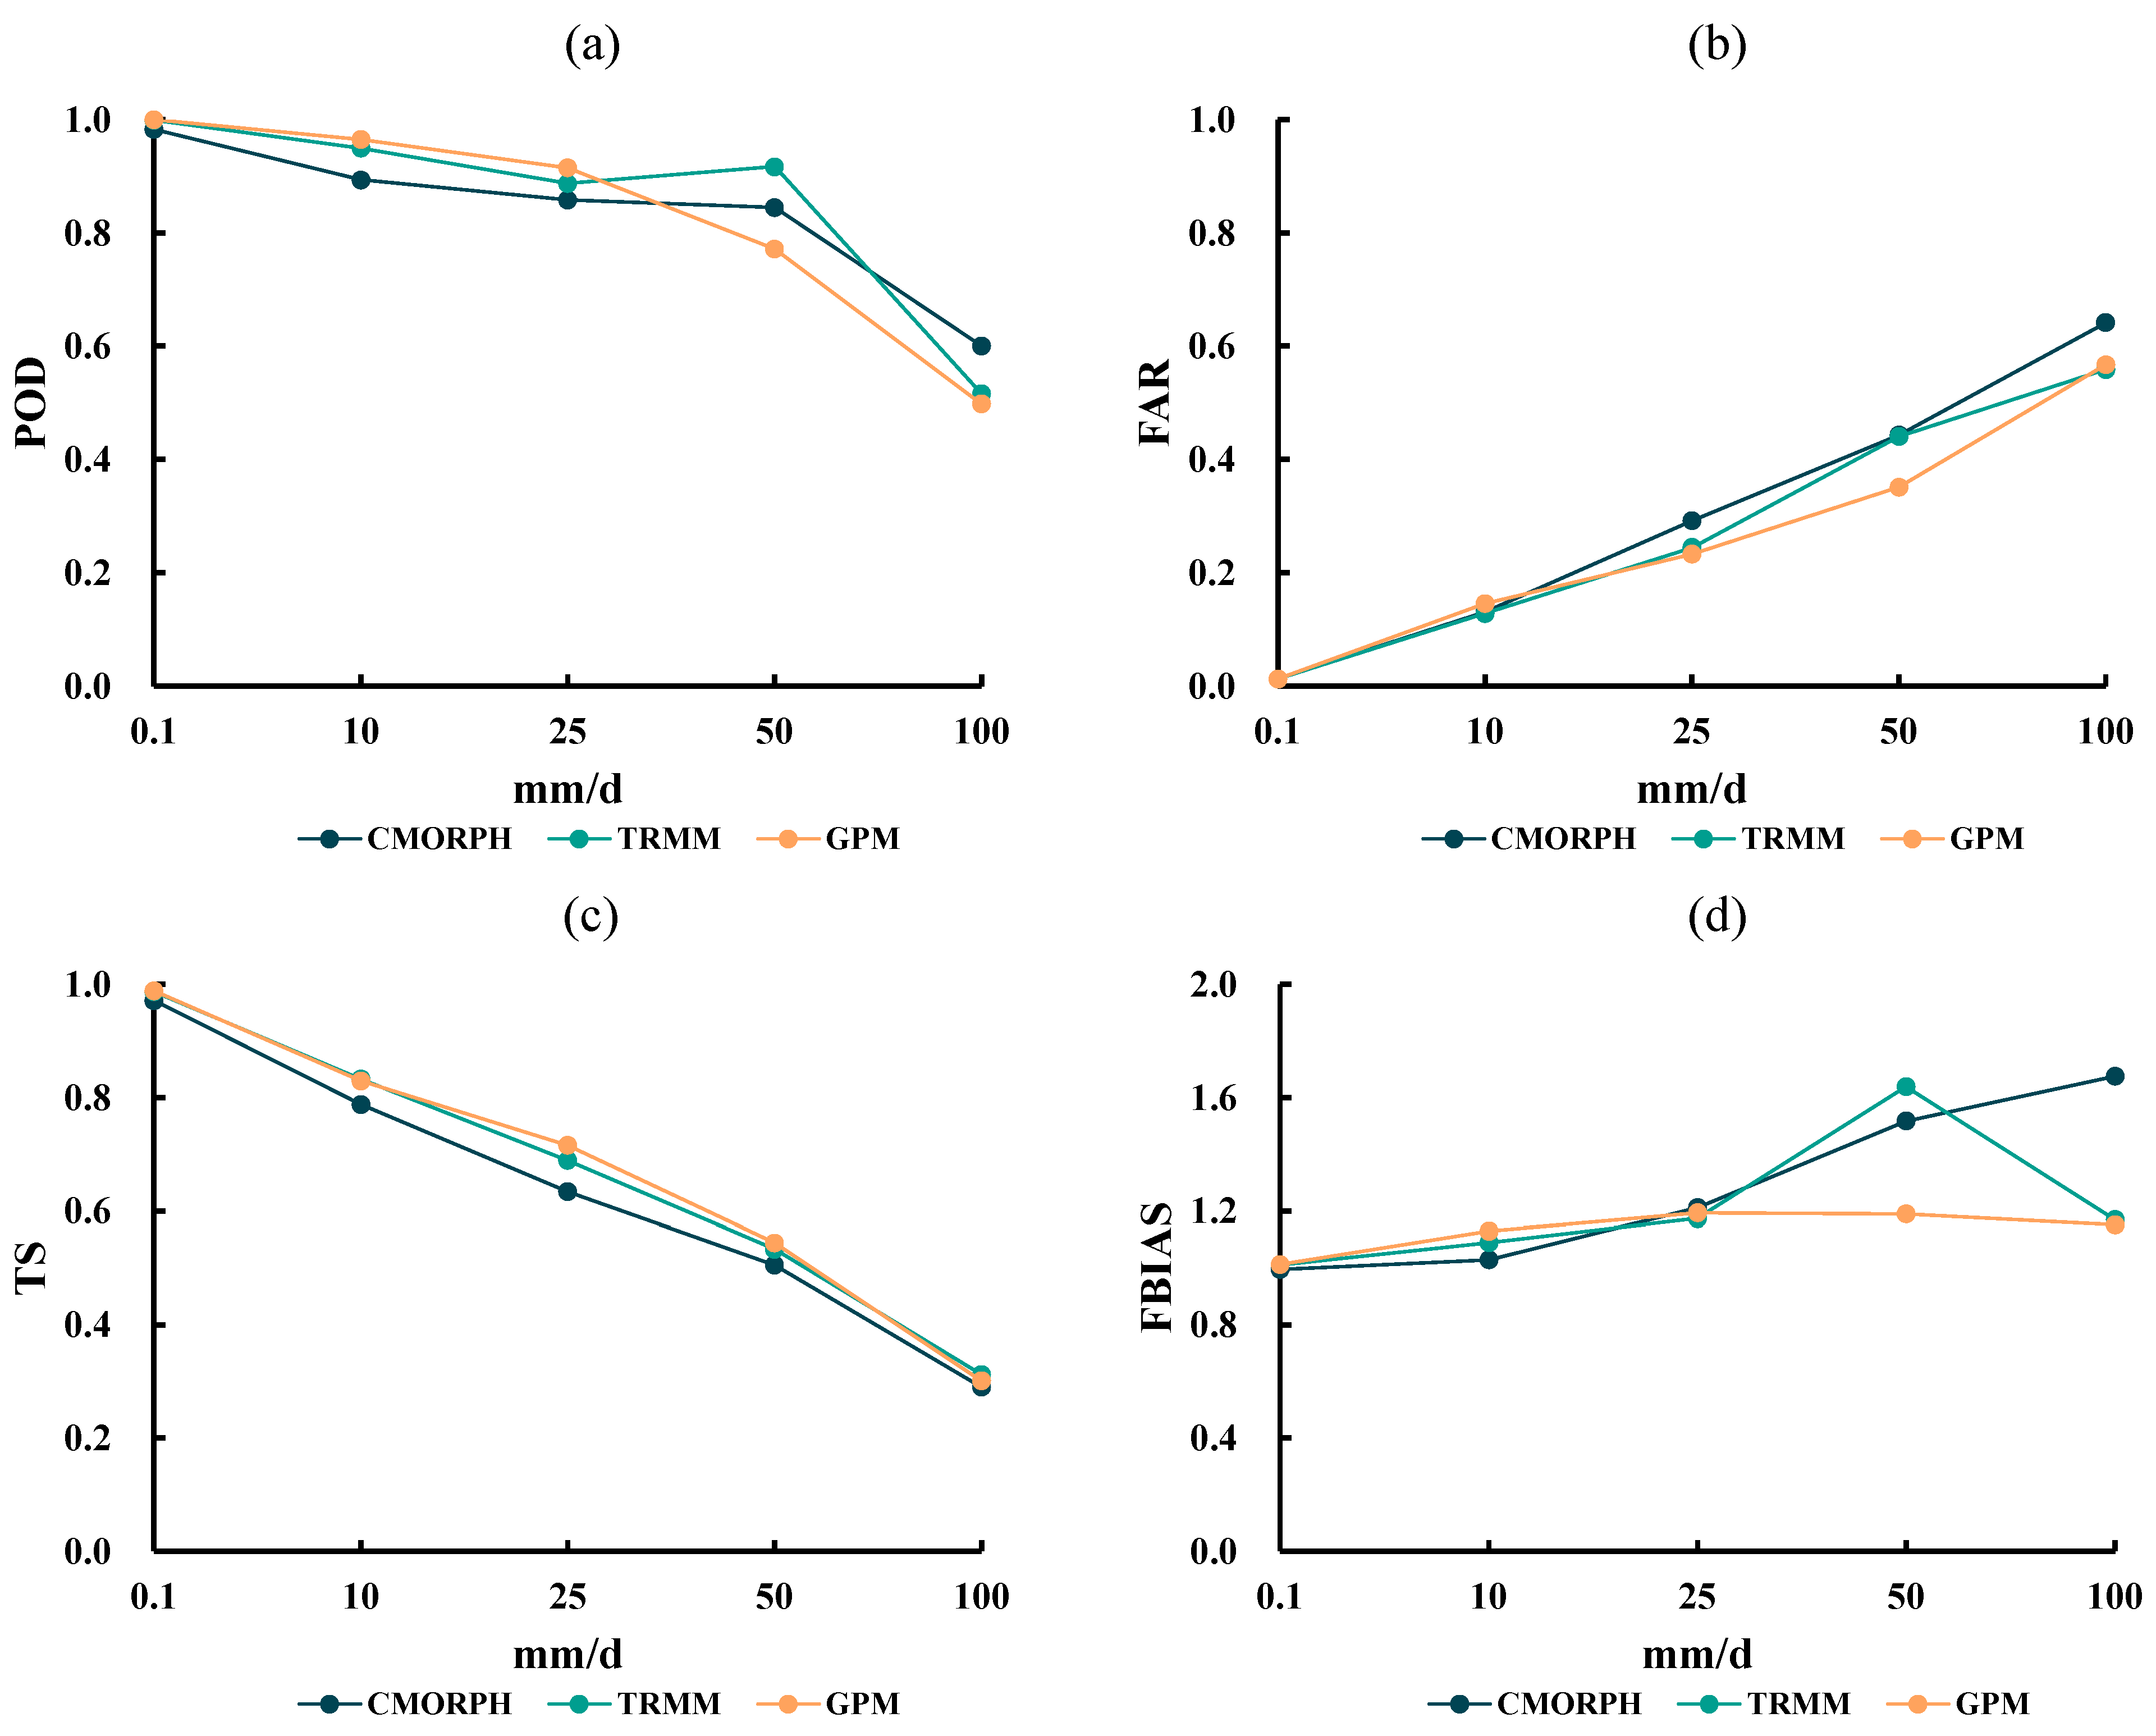
4.3. Graduated Precipitation Accuracy Evaluation

According to the CMA standards (http://data.cma.cn/en, accessed on 4 May 2024), the 24 h rainfall can be classified into the following categories: 0.1~9.9 mm (light rain), 10~24.9 mm (moderate rain), 25~49.9 mm (heavy rain), 50~99.9 mm (torrential rain), 100~249.9 mm (severe rain), and ≥250 mm (extreme rain). The thresholds of surface rainfall were set at 0.1 mm, 10 mm, 25 mm, 50 mm, and 100 mm based on meteorological standards. The POD, FAR, TS, and FBIAS were calculated for the three satellite datasets at different thresholds during heavy precipitation in 2017 and 2018.
Figure 8a shows that the POD decreased as the precipitation threshold increased from 0.1 mm to 10 mm, indicating a decrease in detection rates for the three satellite products. Specifically, the detection rate of CMORPH decreased from 0.906 to 0.651, that of TRMM reduced from 0.830 to 0.629, and GPM rapidly dropped from 0.978 to 0.440, representing the most significant decrease. At the 50 mm/day threshold, the TRMM product exhibited the highest POD of 0.621. As the precipitation threshold increased from 50 mm to 100 mm, the POD of the three satellite precipitation products declined significantly, among which, the CMORPH product exhibited the most rapid decrease, with its POD deducing to 0 at the 100 mm threshold, highlighting its inability to detect severe rainfall. As the precipitation threshold increased from 0.1 mm to 25 mm, the POD for the three satellite products illustrated a gradual decline and maintained a high-performance level above 0.85, indicating excellent detection capability. For the rainfall of 50 mm, the POD for CMORPH and GPM products decreased to 0.845 and 0.772, respectively. Conversely, the TRMM satellite precipitation product exhibited a marginal increase to 0.917. As the precipitation amount increased from 50 mm to 100 mm, the detection rates of the three satellite products decreased rapidly. Figure 8b and Figure 9b demonstrate that the false alarm rates for the three satellite products rose with an increase in the rainfall threshold. TRMM and GPM products demonstrated similar trends in the FAR, yet GPM recorded a lower FAR at the 25 mm threshold, indicating superior performance. In contrast, the CMORPH product demonstrated a higher FAR, which was especially evident as the precipitation threshold increased from 50 mm to 100 mm. During the severe typhoon Khanun (2017), the FAR of CMORPH products escalated from 0.484 to 1. Figure 8c illustrates that the POD curves of the three satellite precipitation products and the TS curves followed a similar trend, and the TS curves of the three satellite products exhibited comparable trends. Notably, the TS values significantly decrease as the precipitation threshold increases from 0.1 to 10 mm and from 50 mm to 100 mm. However, between the thresholds of 10 and 50 mm, the TS values maintained relative stability. Overall, the performance of TRMM products demonstrated superior performance, while GPM exhibited the worst performance. Figure 9c illustrated that the TS for the three satellite products decreased as the rainfall thresholds increased, and the TS of the GPM data exhibited a consistently higher value compared to the CMORPH and TRMM products. Figure 8d showed a gradual decrease in FBIAS as precipitation levels ranging from 0.1 to 10 mm and 50 mm to 100 mm, showing the lowest FBIAS of 0.546 for GPM precipitation at the 10 mm threshold. For precipitation thresholds between 10 and 50 mm, the FBIAS of the CMORPH product increased from 0.830 to 1.023, that of the TRMM product increased from 0.735 to 1.098, and that of the GPM product increased from 0.546 to 0.821. Figure 9d shows that the bias scores of the three satellite precipitation products were similar for thresholds less than 25 mm, ranging between 0.995 and 1.211. For precipitation thresholds of 50 mm, the FBIAS for CMORPH and TRMM products increased rapidly to 1.517 and 1.638, respectively, while the FBIAS for GPM decreased marginally to 1.189. For the precipitation threshold of 100 mm, the FBIAS of TRMM and GPM decreased to 1.170 and 1.152, respectively, while that of CMORPH slowly rose to 1.675.
During two heavy rainfall events, as the surface rainfall threshold increased, the POD decreased, FAR increased, TS decreased, and FBIAS decreased, reaching the minimum value at the 10 mm threshold, and the maximum value at the 50 mm threshold. Among them, the GPM product performed optimally in terms of POD, FAR, TS, and FBIAS at the 0.1 mm threshold, which may be attributed to the improved ability of GPM to capture light precipitation [27]. POD decreased most rapidly from 50 mm to 100 mm, with the TRMM satellite precipitation product showing the highest POD and optimal performance at the 50 mm threshold. GPM showed the lowest FAR for precipitation; this is particularly evident as thresholds were over 25 mm/d. As CMOPRH failed to detect 100 mm precipitation during the heavy precipitation of severe typhoon Khanun (2017), the POD for CMORPH was 0 and FAR was 1 at the 100 mm threshold, and in general the FAR of the three satellite precipitation products vary minimally. During the TRP event in 2017, the TS for GPM was below 0.5 for the rainfall between 10 mm and 100 mm, and during the TRP event in 2018, it was the best among the three satellite products, which corresponded well with the differences in the spatial and temporal distribution of precipitation [23]. For the 50 mm rainfall threshold, the FBIAS was relatively high across all three satellite precipitation products. The GPM product exhibited minimal variation among all thresholds and maintained the lowest FBIAS, demonstrating optimal performance.

5. Discussion

5.1. Monitoring Capabilities

This study mainly evaluated the performance of three prominent satellite precipitation estimates (GPM, TRMM, and CMORPH) in capturing predecessor torrential rainfall in the Lower Yangtze River region at various spatial and temporal scales during Khanun (2017) and Mangkhut (2018). The results implied that all three products generally show good performance in capturing the spatial distributions of torrential rainfall, with correlation coefficients of more than 0.45, whereas the capabilities in detecting extreme rainfall are limited. This is similar to the assessments of satellite products in the literature [28,29,30], which implied that all three satellite products fit well with the observations but overestimated the precipitation; TRMM obtained satisfactory results with smaller relative errors. As shown in this study, all three satellite products performed well in detecting rainfall in the coastal areas in China. Several reasons may account for it [31,32]. Firstly, there are more gauge stations in the coastal areas compared to the mountainous regions, which are applied to calibrate the satellite products, improving the satellite products [33]. Secondly, precipitation in mountainous regions is more complicated due to the interactions with the terrain, which are more difficult to detect by satellite sensors [34]. Additionally, the complex weather systems and clouds in the mountainous regions make the detection of rainfall more complex [32,35].
From the perspective of monitoring capabilities, the three satellite products show respective characteristics. The higher temporal and spatial resolutions in GPM and CMORPH allow for better detection and analysis of localized heavy rainfall. This is significant for understanding the hydrological impacts on smaller river basins in the Lower Yangtze River region. The GPM satellite product shows advantages in capturing intense and localized rainfall since GPM has higher revisit frequency and advanced instrumentation [36,37], which is crucial for real-time monitoring and early warning systems. CMORPH’s reliance on cloud cover information related to the infrared sensors can sometimes lead to inaccuracies in estimating rainfall [38], especially under thick cloud systems associated with typhoon systems [39]. TRMM showed good performance in terms of spatial patterns, which is similar to studies in Tibetan regions [40,41] and Southwest China [30,38], while TRMM no longer provides real-time data, though the historical datasets are valuable for climatological studies and precipitation pattern and trend analysis.

5.2. Limitations and Challenges

The assessment of satellite products in estimating tropical cyclone remote precipitation over the Yangtze River Delta region provides valuable insights into the strengths and limitations of different satellite-based precipitation datasets. Despite the advancements in satellite precipitation products, several challenges remain. The presence of complex terrain and varying land cover in the Yangtze River Delta can introduce errors in satellite rainfall estimates. Additionally, the calibration and validation of satellite data using ground-based observations, such as rain gauges and radar, are crucial steps that must be continuously improved to enhance the accuracy of these products.
Future research should focus on integrating multiple satellite products to leverage their complementary strengths. Combining GPM and CMORPH datasets could provide a more robust and comprehensive picture of precipitation dynamics during tropical cyclones. Furthermore, advancements in machine learning and data assimilation techniques offer promising avenues for improving the precision and reliability of satellite-derived precipitation estimates. In conclusion, this study underscores the importance of utilizing advanced satellite products for monitoring and understanding typhoon-induced torrential rainfall in the Yangtze River Delta. Continued improvement is necessary.

6. Conclusions

This study utilized hourly precipitation data from weather stations in the YRDR and employed various statistical indicators to assess the suitability of CMORPH, TRMM, and GPM products in TRP cases in the YRDR. The main conclusions are as follows.
(1) The spatial distributions of heavy precipitation monitored by the three satellite precipitation products during the two TRP events were roughly consistent with observations, but the location of the heavy precipitation centers and the amount of rainfall varied. Among them, the CMORPH and TRMM satellite products underestimated heavy precipitation in 2017 and failed to detect the heavy rainfall center; the GPM satellite’s heavy precipitation center was closest to the observations, albeit the centers of the two heavy precipitation events were located near the east; and the TRP in 2018 was severely overestimated. Influenced by the complex terrains of southeastern hilly areas in Zhejiang and small-scale climatic factors, the three satellite products underestimated or overestimated precipitation in the southeastern hilly areas of Zhejiang. Compared with observations, the correlation of the three satellite precipitation products showed significant correlations with values ranging from 0.45 to 0.71. Among them, the GPM satellite precipitation product showed the lowest correlation coefficients for severe typhoon Khanun (2017) and super-typhoon Mangkhut (2018) with values of 0.45 and 0.59, respectively. In the TRP event in 2017, the CMORPH, TRMM, and GPM satellite products underestimated rainfall to some degree, with deviations of −10 mm, −7.60 mm, and −11.77 mm, respectively. For the TRP event in 2018, they showed overestimations, with deviations of 12.62 mm, 9.73 mm, and 9.85 mm, respectively. Compared to observations, the TRMM satellite product showed the smallest error, the highest correlation coefficient, and superior quality.
(2) By analyzing the monitoring capabilities of precipitation in spatial distributions, it was found that all three satellite precipitation products can estimate the time series of the first heavy precipitation peak accurately. However, their monitoring capabilities were insufficient for the second peak of heavy precipitation. Both CMORPH and TRMM satellite products showed obvious delays, while the GPM satellite product provided a spatial distribution of precipitation closest to the observations. In terms of BIAS, the GPM satellite product showed the most stable BIAS, while the TRMM satellite product performed the worst. For RMSE and MAE, all three satellite products showed high values during heavy precipitation periods.
(3) For the precipitation assessment of different rainfall grades, the POD of the three satellite products decreased, the FAR increased and the TS decreased as the surface rainfall threshold increased. For light rain (0.1~10 mm/d), the three satellite products performed well, with GPM achieving the highest accuracy. For rainfall thresholds ranging from 10 mm to 50 mm, CMORPH and TRMM satellite products showed similar performance, while GPM showed relatively poorer performance with the POD and TS declining sharply during the 2017 precipitation event. For rainfall thresholds between 50 mm and 100 mm, the POD and TS of the three satellite precipitation products sharply declined, and the FAR increased. CMORPH did not detect rainfall of more than 100 mm during the 2017 precipitation event, with POD and TS values of 0 and FAR of 1. In terms of FBIAS, GPM satellite precipitation products showed the lowest FBIAS and performed the best in two TRP events.
Overall, the satellite’s capability to monitor the spatial distribution characteristics of precipitation can be ranked as TRMM > CMORPH > GPM. For the temporal distribution characteristics, the ranking was GPM > CMORPH > TRMM. For different grades of precipitation, the order was GPM > TRMM > CMORPH. These variations may be attributed to the differences in the satellite retrieval algorithms. The TRMM satellite product algorithm calibrated the precipitation amount estimated by high-quality microwave precipitation with estimations from infrared radiation, enhancing the spatial distribution accuracy of precipitation monitoring yet exhibiting a relatively weaker capability in temporal distribution characteristics. In contrast, the CMORPH satellite precipitation product algorithm exclusively utilized microwave retrieval values and indirectly incorporated infrared precipitation data. This approach led to significant accuracy deviations in determining the spatial distribution of precipitation, often resulting in a miss alarm or false alarm. Unlike the TRMM and CMORPH, the GPM precipitation product utilized a dual-frequency precipitation radar system and a statistical framework to calibrate with collected brightness temperature, thereby resulting in higher accuracy in estimating instantaneous and small-scale precipitation events. However, GPM demonstrated variability in tracking extreme precipitation under different terrains and climatic conditions. Owing to the high intensity and considerable spatial and temporal variability in TRP events, the applications of the satellite’s instantaneous retrieval datasets may lead to significant errors. In the future, further research should focus on improving the applicability of satellite precipitation products on complex terrains and minimizing errors during TRP events.

Author Contributions

Conceptualization, H.X. and S.L.; methodology, X.W. and H.X.; software, X.W. and Y.L.; validation, X.W., S.L., Y.J. and H.X.; formal analysis, X.W.; investigation, X.W.; resources, X.W. and H.X.; data curation, X.W.; writing—original draft preparation, X.W.; writing—review and editing, S.L. and Y.J.; visualization, X.W. and Y.L.; supervision, H.X. and S.L.; project administration, H.X.; funding acquisition, H.X. All authors have read and agreed to the published version of the manuscript.

Funding

This research was funded by the National Natural Science Foundation of China (Grant 42105004), and the Scientific Research Foundation of Hangzhou Normal University (Grant No. 4115F41122024).

Institutional Review Board Statement

Not applicable.

Informed Consent Statement

Not applicable.

Data Availability Statement

The data of observations are available from the China Meteorological Administration, but there are restrictions to apply to the availability of these data, which were used under license for the current study and so are not publicly available. However, the observations are available from the authors upon reasonable request and with permission of the China Meteorological Administration. The data of TRMM and GPM can be obtained by https://www.nasa.gov/, and CMORPH can be accessed by https://www.ncei.noaa.gov/.

Conflicts of Interest

The authors declare no conflict of interest.

References

  1. Elahi, E.; Li, G.; Han, X.; Zhu, W.; Liu, Y.; Cheng, A.; Yang, Y. Decoupling Livestock and Poultry Pollution Emissions from Industrial Development: A Step towards Reducing Environmental Emissions. J. Environ. Manag. 2024, 350, 119654. [Google Scholar] [CrossRef] [PubMed]
  2. Yin, S.; Liu, L.; Mahmood, T. New Trends in Sustainable Development for Industry 5.0: Digital Green Innovation Economy. Green Low-Carbon Econ. 2023, 1–8. [Google Scholar] [CrossRef]
  3. Abbas, A.; Waseem, M.; Ahmad, R.; Khan, K.A.; Zhao, C.; Zhu, J. Sensitivity Analysis of Greenhouse Gas Emissions at Farm Level: Case Study of Grain and Cash Crops. Environ. Sci. Pollut. Res. 2022, 29, 82559–82573. [Google Scholar] [CrossRef] [PubMed]
  4. Shu, Z.; Li, W.; Zhang, J.; Jin, J.; Xue, Q.; Wang, Y.; Wang, G. Historical Changes and Future Trends of Extreme Precipitation and High Temperature in China. Strateg. Study Chin. Acad. Eng. 2022, 24, 116–125. [Google Scholar] [CrossRef]
  5. Chen, L.S. The Evolution on Research and Operational Forecasting Techniques of Tropical Cyclones. J. Appl. Meteorol. Sci. 2006, 17, 672–681. [Google Scholar] [CrossRef]
  6. Chen, L.S. Study and Forecast on Landfall Tropicalcyclone Heavy Rainfall. In Proceedings of the 14th Proseminar on Tropical Cyclone, Shanghai, China, 6−9 November 2021; pp. 3–7. Available online: https://d.wanfangdata.com.cn/conference/7187768 (accessed on 15 March 2024). (In Chinese).
  7. Galarneau, T.J.; Bosart, L.F.; Schumacher, R.S. Predecessor Rain Events Ahead of Tropical Cyclones. Mon. Weather Rev. 2010, 138, 3272–3297. [Google Scholar] [CrossRef]
  8. Cong, C.H.; Chen, L.S.; Lei, X.T.; Li, Y. A study on the mechanism of the tropical cyclone remote precipitation. Acta Meteorol. Sin. 2012, 70, 717–727, (In Chinese with English Abstract). [Google Scholar] [CrossRef]
  9. Jiang, F.R.; Jiang, B. Study on impacts of typhoon on China and its characteristics. Yangtze River 2014, 45, 85–89. [Google Scholar] [CrossRef]
  10. Xu, H.; Li, X.; Yin, J.; Zhang, D. Predecessor Rain Events in the Yangtze River Delta Region Associated with South China Sea and Northwest Pacific Ocean (SCS-WNPO) Tropical Cyclones. Adv. Atmos. Sci. 2023, 40, 1021–1042. [Google Scholar] [CrossRef]
  11. Chen, S.Q.; Li, Y.; Fan, Y.M.; Xu, Z.Y.; Li, F. Analysis of Long-Distance Heavy Rainfall Caused by Typhoon Mangosteen. Chin. J. Atmos. Sci. 2021, 45, 573–587. [Google Scholar] [CrossRef]
  12. Castro, L.M.; Gironás, J.; Fernández, B. Spatial Estimation of Daily Precipitation in Regions with Complex Relief and Scarce Data Using Terrain Orientation. J. Hydrol. 2014, 517, 481–492. [Google Scholar] [CrossRef]
  13. Cheng, L.; Shen, R.P.; Shi, C.X.; Bai, L.; Yang, Y.H. Evaluation and Verification of CMORPH and TRMM 3B42 Precipiation Estimation Products. Metorol. Mon. 2014, 40, 1372–1379. [Google Scholar] [CrossRef]
  14. Xiao, L.S.; Zhang, A.S.; Min, C.; Chen, S.; Sheng, C. Evaluation of GPM satellite-based precipitation estimates during three tropical-related extreme rainfall events. Plateau Meteorol. 2019, 38, 993–1003. [Google Scholar] [CrossRef]
  15. Li, Q.L.; Zhang, W.C.; Yi, L.; Liu, J.P.; Chen, H. Accuracy evaluation and comparison of GPM and TRMM precipitation product over Mainland China. Adv. Water Sci. 2018, 19, 303–313. [Google Scholar] [CrossRef]
  16. Wang, D.D.; Fang, Y.Y.; Qian, Y.Z.; Shen, H.Y.; Chen, S. Evaluation on application of GPM satellites during typhoon-precipitation process. Water Resour. Hydropower Eng. 2022, 54, 1–17. [Google Scholar] [CrossRef]
  17. Liu, S.N.; Wang, J.; Wang, H.J. Analysis of the Monitoring Ability of High-Resolution Satellites for the “21·7” Heavy Rain in Henan. Acta Meteorol. Sin. 2022, 80, 765–776. [Google Scholar] [CrossRef]
  18. Zhang, C.; Li, Z.; Xiao, J.; Zhou, L.; Fang, H.; Zhang, L.; Zhang, H. Spatio-temporal Characteristics of Thermal Comfort in the Yangtze River Delta. Clim. Environ. Res. 2022, 27, 669–678. [Google Scholar] [CrossRef]
  19. Shouli, X.; Qingyun, Z.; Shuqing, S. Anomalous Midsummer Rainfall in Yangtze River-Huaihe River Valleys and Its Association with the East Asia Westerly Jet. Adv. Atmos. Sci. 2011, 28, 387–397. [Google Scholar] [CrossRef]
  20. Liu, S.J.; Cai, D.X.; Han, J.; Gan, Y.X. Progress of the Satellite Remote Sensing Retrieval of Precipitation. Adv. Meteorol. Sci. Technol. 2021, 11, 28–33. [Google Scholar]
  21. Ebert, E.E.; Janowiak, J.E.; Kidd, C. Comparison of Near-Real-Time Precipitation Estimates from Satellite Observations and Numerical Models. Bull. Am. Meteor. Soc. 2007, 88, 47–64. [Google Scholar] [CrossRef]
  22. Chen, S.; Hong, Y.; Cao, Q.; Kirstetter, P.-E.; Gourley, J.J.; Qi, Y.C.; Zhang, J.; Howard, K.; Hu, J.J.; Wang, J. Performance Evaluation of Radar and Satellite Rainfalls for Typhoon Morakot over Taiwan: Are Remote-Sensing Products Ready for Gauge Denial Scenario of Extreme Events? J. Hydrol. 2013, 506, 4–13. [Google Scholar] [CrossRef]
  23. Liu, D.L.; Chen, C. Preliminary Application and Evaluation of Optimal Threat Score Method in Hourly Precipitation Forecast. J. Trop. Meteorol. 2022, 38, 611–620. [Google Scholar] [CrossRef]
  24. Ma, S.J.; Chen, C.H.; He, H.R.; Li, X.; Li, Y. Experiment and Verification of the Convective-Scale Ensemble Forecast Based on BGM. Plateau Meteorol. 2018, 37, 495–504. [Google Scholar]
  25. Chen, H.Q.; Lu, D.K.; Zhou, Z.H.; Zhu, Z.W.; Ren, Y.J.; Yong, B. An overview of assessments on global precipitation measurement (GPM) precipitation products. Water Resour. Prot. 2019, 35, 27–34. [Google Scholar] [CrossRef]
  26. Jin, X.L.; Shao, H.; Zhang, C.; Yan, Y. The Applicability Evaluation of Three Satellite Products in Tianshan Mountains. J. Nat. Resour. 2016, 31, 2074–2085. [Google Scholar] [CrossRef]
  27. Tang, G.Q.; Wan, W.; Zeng, Z.Y.; Guo, X.L.; Li, N.; Long, D.; Hong, Y. An Overview of the Global Precipitation Measurement (GPM) Mission and Its Latest Development. Remote Sens. Technol. Appl. 2015, 30, 607–615. [Google Scholar] [CrossRef]
  28. Ji, H.; Peng, D.; Gu, Y.; Liang, Y.; Luo, X. Evaluation of Multiple Satellite Precipitation Products and Their Potential Utilities in the Yarlung Zangbo River Basin. Sci. Rep. 2022, 12, 13334. [Google Scholar] [CrossRef] [PubMed]
  29. Benkirane, M.; Laftouhi, N.-E.; Khabba, S.; El Mansouri, B. Multiscale Assessment of TRMM (3B42 V7) and GPM (IMERG V5) Satellite Precipitation Products over a Mediterranean Mountainous Watershed with Sparse Rain Gauges in the Moroccan High Atlas (Case Study of Zat Basin). Hydrol. Earth Syst. Sci. Discuss. 2021, 1–18. [Google Scholar] [CrossRef]
  30. Yan, G.; Liu, Y.; Chen, X. Evaluating Satellite-Based Precipitation Products in Monitoring Drought Events in Southwest China. Int. J. Remote Sens. 2018, 39, 3186–3214. [Google Scholar] [CrossRef]
  31. Zhang, Y.; Wu, C.; Yeh, P.J.-F.; Li, J.; Hu, B.X.; Feng, P.; Lei, Y. Evaluation of Multi-Satellite Precipitation Products in Estimating Precipitation Extremes over Mainland China at Annual, Seasonal and Monthly Scales. Atmos. Res. 2022, 279, 106387. [Google Scholar] [CrossRef]
  32. Yu, L.; Leng, G.; Python, A. A Comprehensive Validation for GPM IMERG Precipitation Products to Detect Extremes and Drought over Mainland China. Weather Clim. Extrem. 2022, 36, 100458. [Google Scholar] [CrossRef]
  33. Tang, G.; Ma, Y.; Long, D.; Zhong, L.; Hong, Y. Evaluation of GPM Day-1 IMERG and TMPA Version-7 Legacy Products over Mainland China at Multiple Spatiotemporal Scales. J. Hydrol. 2016, 533, 152–167. [Google Scholar] [CrossRef]
  34. Huang, C.; Zhang, S.; Dong, L.; Wang, Z.; Li, L.; Cui, L. Spatial and Temporal Variabilities of Rainstorms over China under Climate Change. J. Geogr. Sci. 2021, 31, 479–496. [Google Scholar] [CrossRef]
  35. Smith, T.M.; Arkin, P.A.; Bates, J.J.; Huffman, G.J. Estimating Bias of Satellite-Based Precipitation Estimates. J. Hydrometeorol. 2006, 7, 841–856. [Google Scholar] [CrossRef]
  36. Zhu, H.Q.; Chen, S.; Li, X.Y.; Li, Z. Assessment on error of GPM satellite-based precipitation products during ‘7.21’extreme rainstorm in Henan. Water Resour. Hydropower Eng. 2022, 53, 1–13. [Google Scholar] [CrossRef]
  37. Zhou, Z.; Guo, B.; Xing, W.; Zhou, J.; Xu, F.; Xu, Y. Comprehensive Evaluation of Latest GPM Era IMERG and GSMaP Precipitation Products over Mainland China. Atmos. Res. 2020, 246, 105132. [Google Scholar] [CrossRef]
  38. Jiang, S.; Ren, L.; Hong, Y.; Yong, B.; Yang, X.; Yuan, F.; Ma, M. Comprehensive Evaluation of Multi-Satellite Precipitation Products with a Dense Rain Gauge Network and Optimally Merging Their Simulated Hydrological Flows Using the Bayesian Model Averaging Method. J. Hydrol. 2012, 452–453, 213–225. [Google Scholar] [CrossRef]
  39. Yu, Z.; Yu, H.; Chen, P.; Qian, C.; Yue, C. Verification of Tropical Cyclone–Related Satellite Precipitation Estimates in Mainland China. J. Appl. Meteorol. Climatol. 2009, 48, 2227–2241. [Google Scholar] [CrossRef]
  40. Wang, X.; Ding, Y.; Zhao, C.; Wang, J. Similarities and Improvements of GPM IMERG upon TRMM 3B42 Precipitation Product under Complex Topographic and Climatic Conditions over Hexi Region, Northeastern Tibetan Plateau. Atmos. Res. 2019, 218, 347–363. [Google Scholar] [CrossRef]
  41. Xu, R.; Tian, F.; Yang, L.; Hu, H.; Lu, H.; Hou, A. Ground Validation of GPM IMERG and TRMM 3B42V7 Rainfall Products over Southern Tibetan Plateau Based on a High-Density Rain Gauge Network. J. Geophys. Res. Atmos. 2017, 122, 910–924. [Google Scholar] [CrossRef]
Figure 1. Map of (a) southeastern regions of China, and (b) the Yangtze River Delta region (YRDR) study area and locations of meteorological stations. The red points represent the locations of meteorological stations. JS, SH, AH, and ZJ denote Jiangsu, Shanghai, Anhui, and Zhejiang provinces, respectively.
Atmosphere 15 00667 g001
Figure 2. Twenty-four-hour cumulative rainfall from observations and satellite data: (a) observations (OBS means observations), (b) CMORPH, (c) TRMM, and (d) GPM from 0000 UTC, 15 October to 0000 UTC, 16 October 2017; the unit is mm. The stars of JS, SH, ZJ denote Jiangsu, Shanghai, and Zhejiang, respectively.
Atmosphere 15 00667 g002
Figure 3. Twenty-four-hour cumulative rainfall from observations and satellite datasets: (a) observations (OBS means observations), (b) CMORPH, (c) TRMM, and (d) GPM from 1200 UTC, 16 September to 1200 UTC, 16 September 2018; the unit is mm. The stars of YC, HZ, NB denote Yancheng of Jiangsu province, Hangzhou, and Ningbo of Zhejiang province, respectively.
Atmosphere 15 00667 g003
Figure 4. Scatter chart of 24 h accumulated precipitation at weather stations and (a) CMORPH, (b) GPM, and (c) TRMM 24 h accumulated precipitation during the period from 0000 UTC, 15 October 2017 to 0000 UTC, 16 October 2017; the unit is mm.
Atmosphere 15 00667 g004
Figure 5. Scatter plots of 24 h accumulated precipitation at different meteorological stations and (a) CMORPH, (b) GPM, and (c) TRMM of 24 h accumulated precipitation during the period from 1200 UTC, 16 September to 1200 UTC, 16 September 2018; the unit is mm.
Atmosphere 15 00667 g005
Figure 6. (a) Three-hour average precipitation from observations and satellite datasets, (b) RMSE, (c) BIAS, (d) MAE between observations and rainfall from CMORPH, TRMM, and GPM from 00:00 UTC, 15 October to 00:00 UTC, 16 October 2017; the unit is mm.
Atmosphere 15 00667 g006
Figure 7. (a) Three-hour average precipitation data from observations, (b) RMSE, (c) BIAS, (d) MAE between observations and satellite rainfall from CMORPH, TRMM, and GPM from 12:00 UTC, 16 September to 12:00 UTC, 17 September 2018; the unit is mm.
Atmosphere 15 00667 g007
Figure 8. (a) POD, (b) FAR, (c) TS, and (d) FBIAS for CMORPH, TRMM, and GPM based on different thresholds from 0000 UTC, 15 October 2017 to 0000 UTC, 16 October 2017.
Atmosphere 15 00667 g008
Figure 9. (a) POD, (b) FAR, (c) TS, and (d) FBIAS for CMORPH, TRMM, and GPM based on various thresholds from 1200 UTC, 16 September to 1200 UTC, 16 September 2018.
Atmosphere 15 00667 g009
Disclaimer/Publisher’s Note: The statements, opinions and data contained in all publications are solely those of the individual author(s) and contributor(s) and not of MDPI and/or the editor(s). MDPI and/or the editor(s) disclaim responsibility for any injury to people or property resulting from any ideas, methods, instructions or products referred to in the content.

