Abstract
Research on the impact of temperature in tropical regions on the risk of cardiovascular and cerebrovascular diseases was limited. The aim of the study was to investigate this topic using Haikou, a tropical city, as the research area. Outpatient data on cardiovascular and cerebrovascular diseases (CVD and CeVD) from Hainan Provincial People’s Hospital during 2016–2018 (total of 77,820) and meteorological and air-quality data were used to establish a distributed-lag nonlinear model (DLNM) based on the nested generalized addition model (GAM) of meteorological elements. The results revealed the impact on the risk of CVD and CeVD was mainly due to the cold effect, which significantly lagged behind. The thermal effect had a strong impact on the onset of CVD and CeVD on the day of high temperature. Males were easily affected by low temperatures, while females were the opposite. The lag period of the working-age group affected by low temperatures was longer and greater than that of the elderly group. The high-temperature effect only had an impact on the working-age group. The lag effect of low temperatures on the risk of hypertension was the greatest. These results can provide technical support for carrying out meteorological forecasting, warning, and services for individuals with CVD and CeVD, suggesting attaching importance to health protection for special populations.
1. Introduction
According to the World Health Organization (WHO), cardiovascular and cerebrovascular diseases (CVD and CeVD) are the leading causes of death worldwide and are estimated to cause 17.9 million deaths each year, with ischemic heart disease and stroke ranked as the top two subtypes implicated in CVD and CeVD mortality [1]. The current number of CVD and CeVD patients in China is estimated to be 330 million, including 245 million with hypertension, 13 million with stroke, and 11.39 million with coronary heart disease (CHD). Among urban and rural residents, CVD and CeVD account for the largest proportion of disease-related deaths [2]. CVD and CeVD are influenced by various risk factors, including lifestyle, dietary habits, genetic history, and weather and climate conditions. Research has shown that the cold and heat effects caused by temperature are the main reasons for the influence of meteorological factors on CVD and CeVD, which can lead to the occurrence, development, and death of individuals with CVD and CeVD [3,4,5,6,7,8].
For example, in Beijing, when the daily average temperature is less than −5.9 °C, for every 1 °C decrease in temperature, the number of emergency visits for CHD increases by 10.3% on the fourth day after the onset of those cold temperatures; when the daily average temperature is above 27.4 °C, for every 1 °C increase in temperature, the number of emergency visits for CHD increases by 7.74% [9]. When the temperature is less than 9 °C, the relative risk (RR) of CVD and CeVD in Shanghai increases significantly with decreasing temperature [10]. Days with extremely high temperatures in the coastal city of Ningbo had the greatest impact on stroke-related deaths on the day that those extremely high temperatures occurred, and the effects lasted until the third day afterward. The cumulative RRs (95% confidence intervals (CI)) for the entire population on 40 °C days, with lags of 0–1 days, 0–2 days, and 0–3 days, were 1.29 (1.17–1.43), 1.38 (1.22–1.55), and 1.41 (1.25–1.60), respectively. Compared to females, males had a greater risk of death due to extremely high temperatures [11]. For residents of Pingluo County and Qingtongxia County, Ningxia, extreme temperatures are associated with greater mortality and hospitalization. Extremely high temperatures are associated with stroke risk (RRlag0-21: 1.993, 95% CI = 1.517~2.618), and the impact of extremely high temperatures on hospitalization risk among individuals <65 years old is greater than that among individuals ≥65 years old (RRlag0-21: 1.851, 1.297; 95% CI = 1.654–2.072~1.476–1.927, respectively). Extremely low temperatures are associated with an increased main risk among individuals <65 years old (RRlag0-21: 1.297, 95% CI = 1.158~1.453) [12]. Associations between suboptimal air temperatures and an increased risk of CVD death were observed in all five regions of Brazil. The RR for cold-related CVD death was highest in Manaus (RR 1.53; 1.22–1.91) and Campo Grande (RR 1.52; 1.18–1.94), while the RRs for heat-related CVD deaths were highest in Manaus (RR 1.75; 1.35–2.26) and Brasília (RR 1.36; 1.15–1.60) [13]. The average annual temperature was negatively correlated with the prevalence of CVD and CeVD in China. Every 1 °C increase in the average annual temperature reduced the rates of hypertension, heart disease, and stroke by 3% (odds ratio (OR): 0.97; 95% CI= 0.96–0.97), 6% (OR: 0.94; 95% CI = 0.92~0.95), and 5% (OR: 0.95; 95% CI = 0.94~0.97) [14], respectively. Temperature is negatively associated with cerebrovascular morbidity in Shanghai. When the mean temperature increased by 1 °C, the number of male patients with cerebrovascular disease decreased by 0.95% (95% CI = 0.80~1.10%) or decreased by 0.34% (95% CI = −0.68~1.36%) when the temperature was below or above 27 °C, respectively. However, for every 1 °C increase in temperature, the number of female patients with cerebrovascular disease increased by 0.34% (95% CI = −0.26~0.94%) or decreased by 0.92% (95% CI = 0.72, 1.11%) when the temperature was below or above 8 °C, respectively [15]. On cold days with temperatures corresponding to the 1st percentile of temperature distribution, a 9% increase in daily hospitalizations for CHD (95% CI = 1~16%), a 29% increase for acute myocardial infarction (AMI) (95% CI = 15~45%) and an 11% increase in daily hospitalizations for stroke (95% CI = 1~22%) relative to days with an optimal temperature was found [16]. A temperature–mortality relationship was especially apparent in the elderly population. A U-shaped relationship was observed between temperature and mortality from coronary artery disease and cerebral infarction. In elderly individuals, the risk of cerebral infarction at 32 °C was 66% greater than that at 27–29 °C. The risk of coronary artery disease at 32 °C was 22% greater than that at 26–29 °C [17]. The above studies show that temperature has an important impact on CVD-related morbidity and mortality, but the results of the analyses vary greatly due to differences in the geographical area of the study, the selection of the study subjects, the sources of medical data, and the methods of analysis.
Hainan Province is located at the southernmost point of China, on the northern edge of the tropics, and has a tropical marine monsoon climate. Against the background of climate change, the frequency of extreme high- and low-temperature events has increased. Therefore, the purpose of this article was to conduct a study on the health effects of temperature on cardiovascular and cerebrovascular diseases in Haikou, the capital city of Hainan Province, using data from the outpatient department of the People’s Hospital of Hainan Province from 2016 to 2018 (including 77,820 patients with hypertension, stroke, and coronary heart disease). By constructing a distributed-lag nonlinear model (DLNM) based on a temperature element base variable nested generalized additive model (GAM), we analyzed the exposure–response relationship and lag effect between temperature and the increase in the number of CVD and CeVD patients and conducted a subclass analysis to identify sensitive populations. These findings will provide a scientific basis for formulating measures for public health adaptation, improving public awareness of disease prevention, and reducing the health risks associated with extreme high- and low-temperature events. This study will also provide technical support for medical meteorological forecasting, early warning, and services for individuals with CVD and can serve as a reference for the study of the relationship between CVD and CeVD and meteorological conditions in tropical island regions worldwide, as well as disease prevention.
2. Materials and Methods
2.1. Data Sources
Disease data: Outpatient data on CVD and CeVD were collected at Hainan Provincial People’s Hospital from September 2016 to April 2018. The diagnostic criteria for patients with CVD (mainly hypertension, stroke, and coronary heart disease (CHD)) were based on the 10th revision of the International Statistical Classification of Diseases and Related Health Problems (ICD-10). Information such as the patient’s name, sex, age, permanent address, and date of visit was collected. The data were filtered according to the following criteria: (1) resided in Haikou city; (2) the information was complete with no missing items; and (3) patients who visited the hospital again within one week after their initial visit were excluded.
Meteorological data: The daily average temperature, highest temperature, lowest temperature, relative humidity, precipitation, average wind speed, atmospheric pressure, and other meteorological data of the Haikou National Meteorological Station during the same period were sourced from the Hainan Provincial Meteorological Information Center.
Air quality data: Daily air quality monitoring data such as PM2.5, PM10, SO2, NO2, O3, CO, and air quality index (AQI) in Haikou city during the same period were obtained from the China Environmental Monitoring Station and the Ecological Environment Bulletin.
2.2. Research Methods
2.2.1. Descriptive Analysis
Descriptive analysis methods were used to analyze the epidemiological characteristics of outpatient data, meteorological data, and air quality data of cardiovascular and cerebrovascular diseases in Haikou City, including statistical indicators such as mean and standard deviation. Spearman correlation analysis was used to assess the correlation between the three types of data.
2.2.2. Distributed-Lag Nonlinear Model (DLNM)
A generalized addition model (GAM) can effectively handle complex nonlinear relationships between independent and dependent variables and is a flexible and effective method for nonlinear regression analysis of the independent and interactive effects of environmental factors such as meteorological conditions on health. It is widely used in international epidemiological health effect assessments [18,19,20]. The DLNM is a combination of traditional modeling concepts such as GAM and distributed-lag linear models. The core idea is to add lag dimensions to the exposure–response relationship through cross-basis functions to simultaneously describe the distribution of changes in its effects in both the independent and lag dimensions [21]. They can simultaneously consider the lag effects of exposure factors and the nonlinear exposure–response relationship [22] and have broad application prospects in epidemiology. The impact of meteorological environmental factors on human health presents nonlinear, persistent, and lagging effects [23,24]; that is, population health indicators (such as incidence rate and mortality) are not only related to the exposure level of the day but also may be affected by the exposure level of yesterday or even a period before. Therefore, in this study, a DLNM was chosen to investigate the impact of temperature on the risk of an increase in the number of CVD and CeVD patients.
In the present study, the number of patients with CVD and CeVD was used as the dependent variable, and temperature indicators related to the number of patients with CVD were selected for modeling (α = 0.05), and the correlation analysis revealed that there was a highly significant positive correlation between the daily number of patients with CVD and CeVD in Haikou city and the daily minimum temperature. The correlation coefficients among the daily average temperature, daily maximum temperature, and daily minimum temperature were all 0.9 and highly significant (p < 0.01). Considering the collinearity between these factors, in this study, we included the daily minimum temperature in the DLNM. A GAM was used to establish a linear relationship between the expected value function (connection function) of variables and the predicted variables. Considering that the daily number of disease visits is a low probability event, to avoid excessive discretization, a quasi-Poisson distribution was used for model fitting [9,25], and we established a DLNM based on a meteorological element basis variable nested GAM, which is a DLNM of temperature and daily number of CVD and CeVD visits. While controlling for holiday and weekend effects, the median was used as the benchmark to analyze the exposure–response relationship between meteorological parameters and CVD and CeVD visits, and the RR [26] was calculated as the main characterization variable. The basic model [27] can be represented as:
where represents the number of CVD and CeVD visits on day t, which approximately follows the quasi-Poisson distribution, and E (t) is its expected value; α is the model intercept; and is the cross basis function of the independent variable daily minimum temperature (Temp) and the lag time dimension l (0, 1…, L), with a maximum lag time of L = 10. The temperature exposure–response dimension is based on a B-spline function, degree = 3, df = 4, while the exposure lag effect dimension is fitted with a polynomial function, degree = 2, using the modified Akaike information criterion (Q-AIC) [28] to analyze the sensitivity of the model and determine the optimal parameters; Prs is the water vapor pressure, is the natural cubic spline function of the variable Prs, with a degree of freedom parameter df1 = 3; AQI is the air quality index, is the natural cubic spline function of the variable AQI, with a degree of freedom parameter df2 = 3; Time is the time variable (1, 2…, 1095), and is the natural cubic spline function of the time variable; and the long-term trend is fitted by a time variable of 7 degrees of freedom per year, that is, the degree of freedom parameter df3 = 3; represents “day of the week”, and represents “holiday”, which appear as dummy variables in the model.
Relative risk (RR) represents the ratio of the incidence rate of a group of patients with a certain disease when exposed to a certain condition to the incidence rate when not exposed. An RR equal to 1 indicates that exposure is not related to the occurrence of the event a value greater than 1 indicates that exposure increases the risk of the event occurring, and a value less than 1 indicates that exposure reduces the risk of the event occurring. In this study, RR values were used to represent the impact of exposure to certain meteorological conditions on disease incidence.
During the research process, the “mgcv” and “dlnm” packages in R software (version 4.1.2) were used to analyze and plot the nonlinear and hysteresis effects of influencing factors. The results are represented by RR values and 95% CIs, and p < 0.05 was considered to indicate statistical significance.
2.2.3. Subgroup Analysis
To study the differences in the risk of CVD and CeVD caused by temperature among different CVD and CeVD subtypes in Haikou city and to further identify sensitive populations, stratified analyses were conducted for age, sex, and CVD and CeVD subtypes. According to the current demographic age groups, the population was divided into the following groups: children (aged ≤14 years), working-age (aged >14 years but ≤65 years), and elderly (aged >65 years). Sex was divided into male and female categories. CVD and CeVD subtypes were divided into hypertension, CHD, and stroke.
3. Results
3.1. Basic Information
From September 2016 to April 2018, a total of 77,820 cases of CVD and CeVD were reported in Haikou city, with a daily average of 128.2 cases. Among those who experienced CVD and CeVD, there were 42,882 males and 34,938 females, and ≤50 patients were aged 14 years, 39,177 patients were aged >14 years but ≤65 years, and 38,593 patients were aged >65 years; 32,254 patients experienced hypertension, 26,580 patients experienced CHD, and 18,986 patients experienced stroke. The daily average pressure, maximum pressure, minimum pressure, average temperature, maximum temperature, minimum temperature, water vapor pressure, relative humidity, precipitation, average wind speed, and temperature variation amplitude in Haikou city were 1005 hPa, 1007.4 hPa, 1003.1 hPa, 23.9 °C, 27.2 °C, 21.6 °C, 24.7 hPa, 81.5%, 4.6 mm, 3.0 m/s, and 0.0 °C, respectively. The daily average AQI, PM2.5, PM10, SO2, NO2, CO, and O3 were 44, 21.5 μg/m3, 38.8 μg/m3, 6.2 μg/m3, 12.4 μg/m3, 0.6 μg/m3, and 75 μg/m3, respectively.
Spearman correlation analysis [21] (Table 1) revealed that the number of daily visits for CVD and CeVD was significantly negatively correlated with the daily minimum temperature and water vapor pressure, significantly negatively correlated with the daily average temperature and daily maximum temperature, and significantly positively correlated with the AQI and NO2. The impact of the daily minimum temperature on the number of daily CVD and CeVD visits was most significant (r = −0.11, p < 0.01).

Table 1.
Spearman correlation coefficients between the number of CVD and CeVD patients and the meteorological and air quality indicators.
3.2. Exposure–Response Relationship between Temperature and the Total Number of Individuals with CVD and CeVD
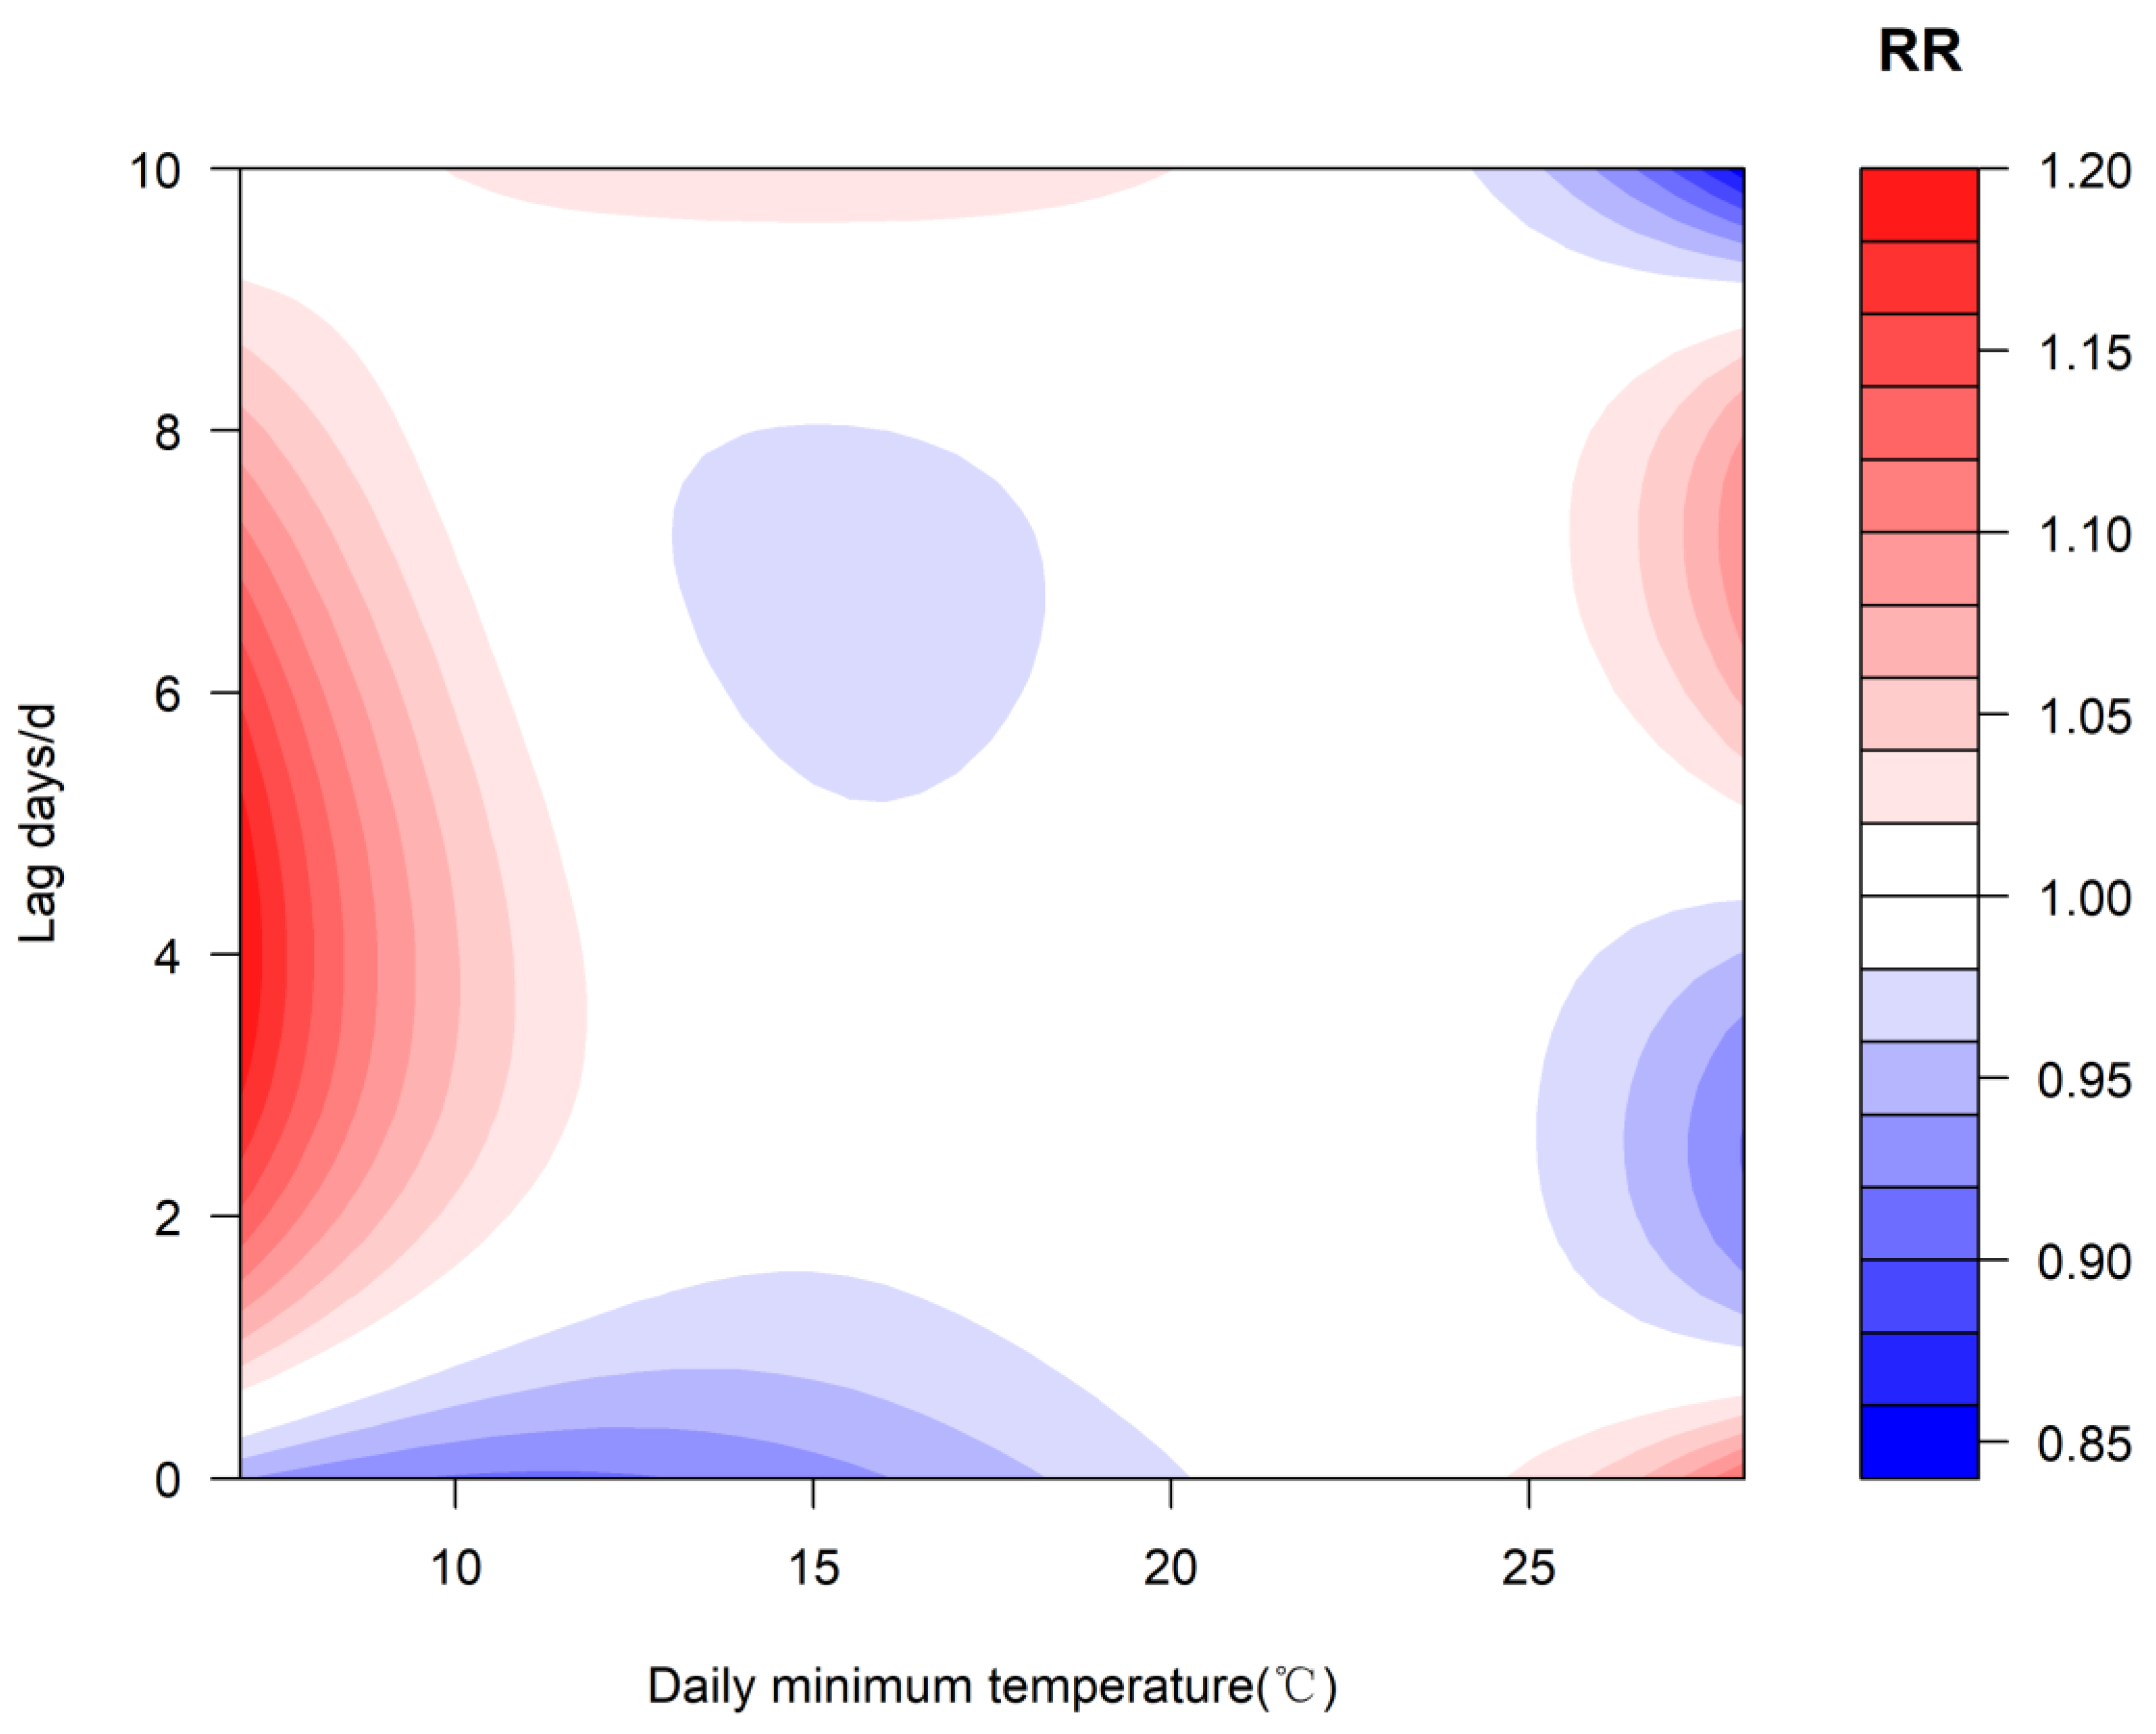
The median daily minimum temperature (22.5 °C) was selected as the reference value, which was used as the dividing point to discuss cold and heat effects when the temperature was below and above this temperature, respectively, to study the exposure–response relationship between temperature and the number of CVD and CeVD patients (Figure 1 and Figure 2) and calculate the cumulative effect of continuous exposure to low temperature (high temperature) environments. The results indicate that (Figure 1 and Figure 2) show that the effect of temperature on the risk of an increase in the number of CVD and CeVD patients was influenced mainly by the cold effect and had a significant lag effect on the increase in the number of CVD and CeVD patients. The risk was relatively high after a lag of 1–10 days, while the heat effect had an impact on the increase in the number of CVD and CeVD patients on the day of high temperature and after a 6–8-day lag.

Figure 1.
Two-dimensional graph of the exposure–response relationship between the daily minimum temperature and the number of CVD and CeVD patients.
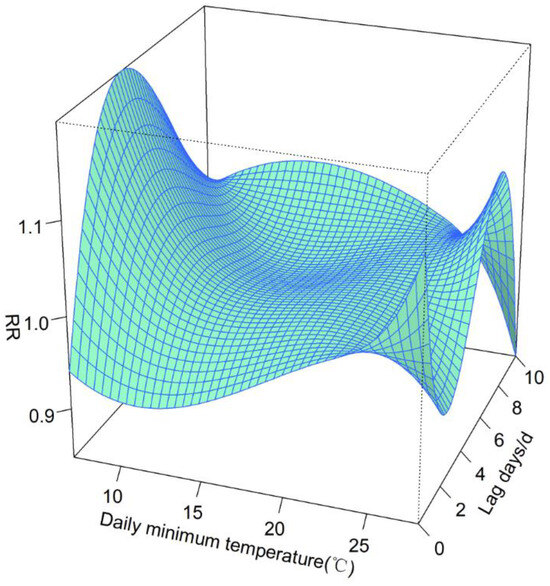
Figure 2.
Three-dimensional graph of the exposure–response relationship between the daily minimum temperature and the number of CVD and CeVD patients.
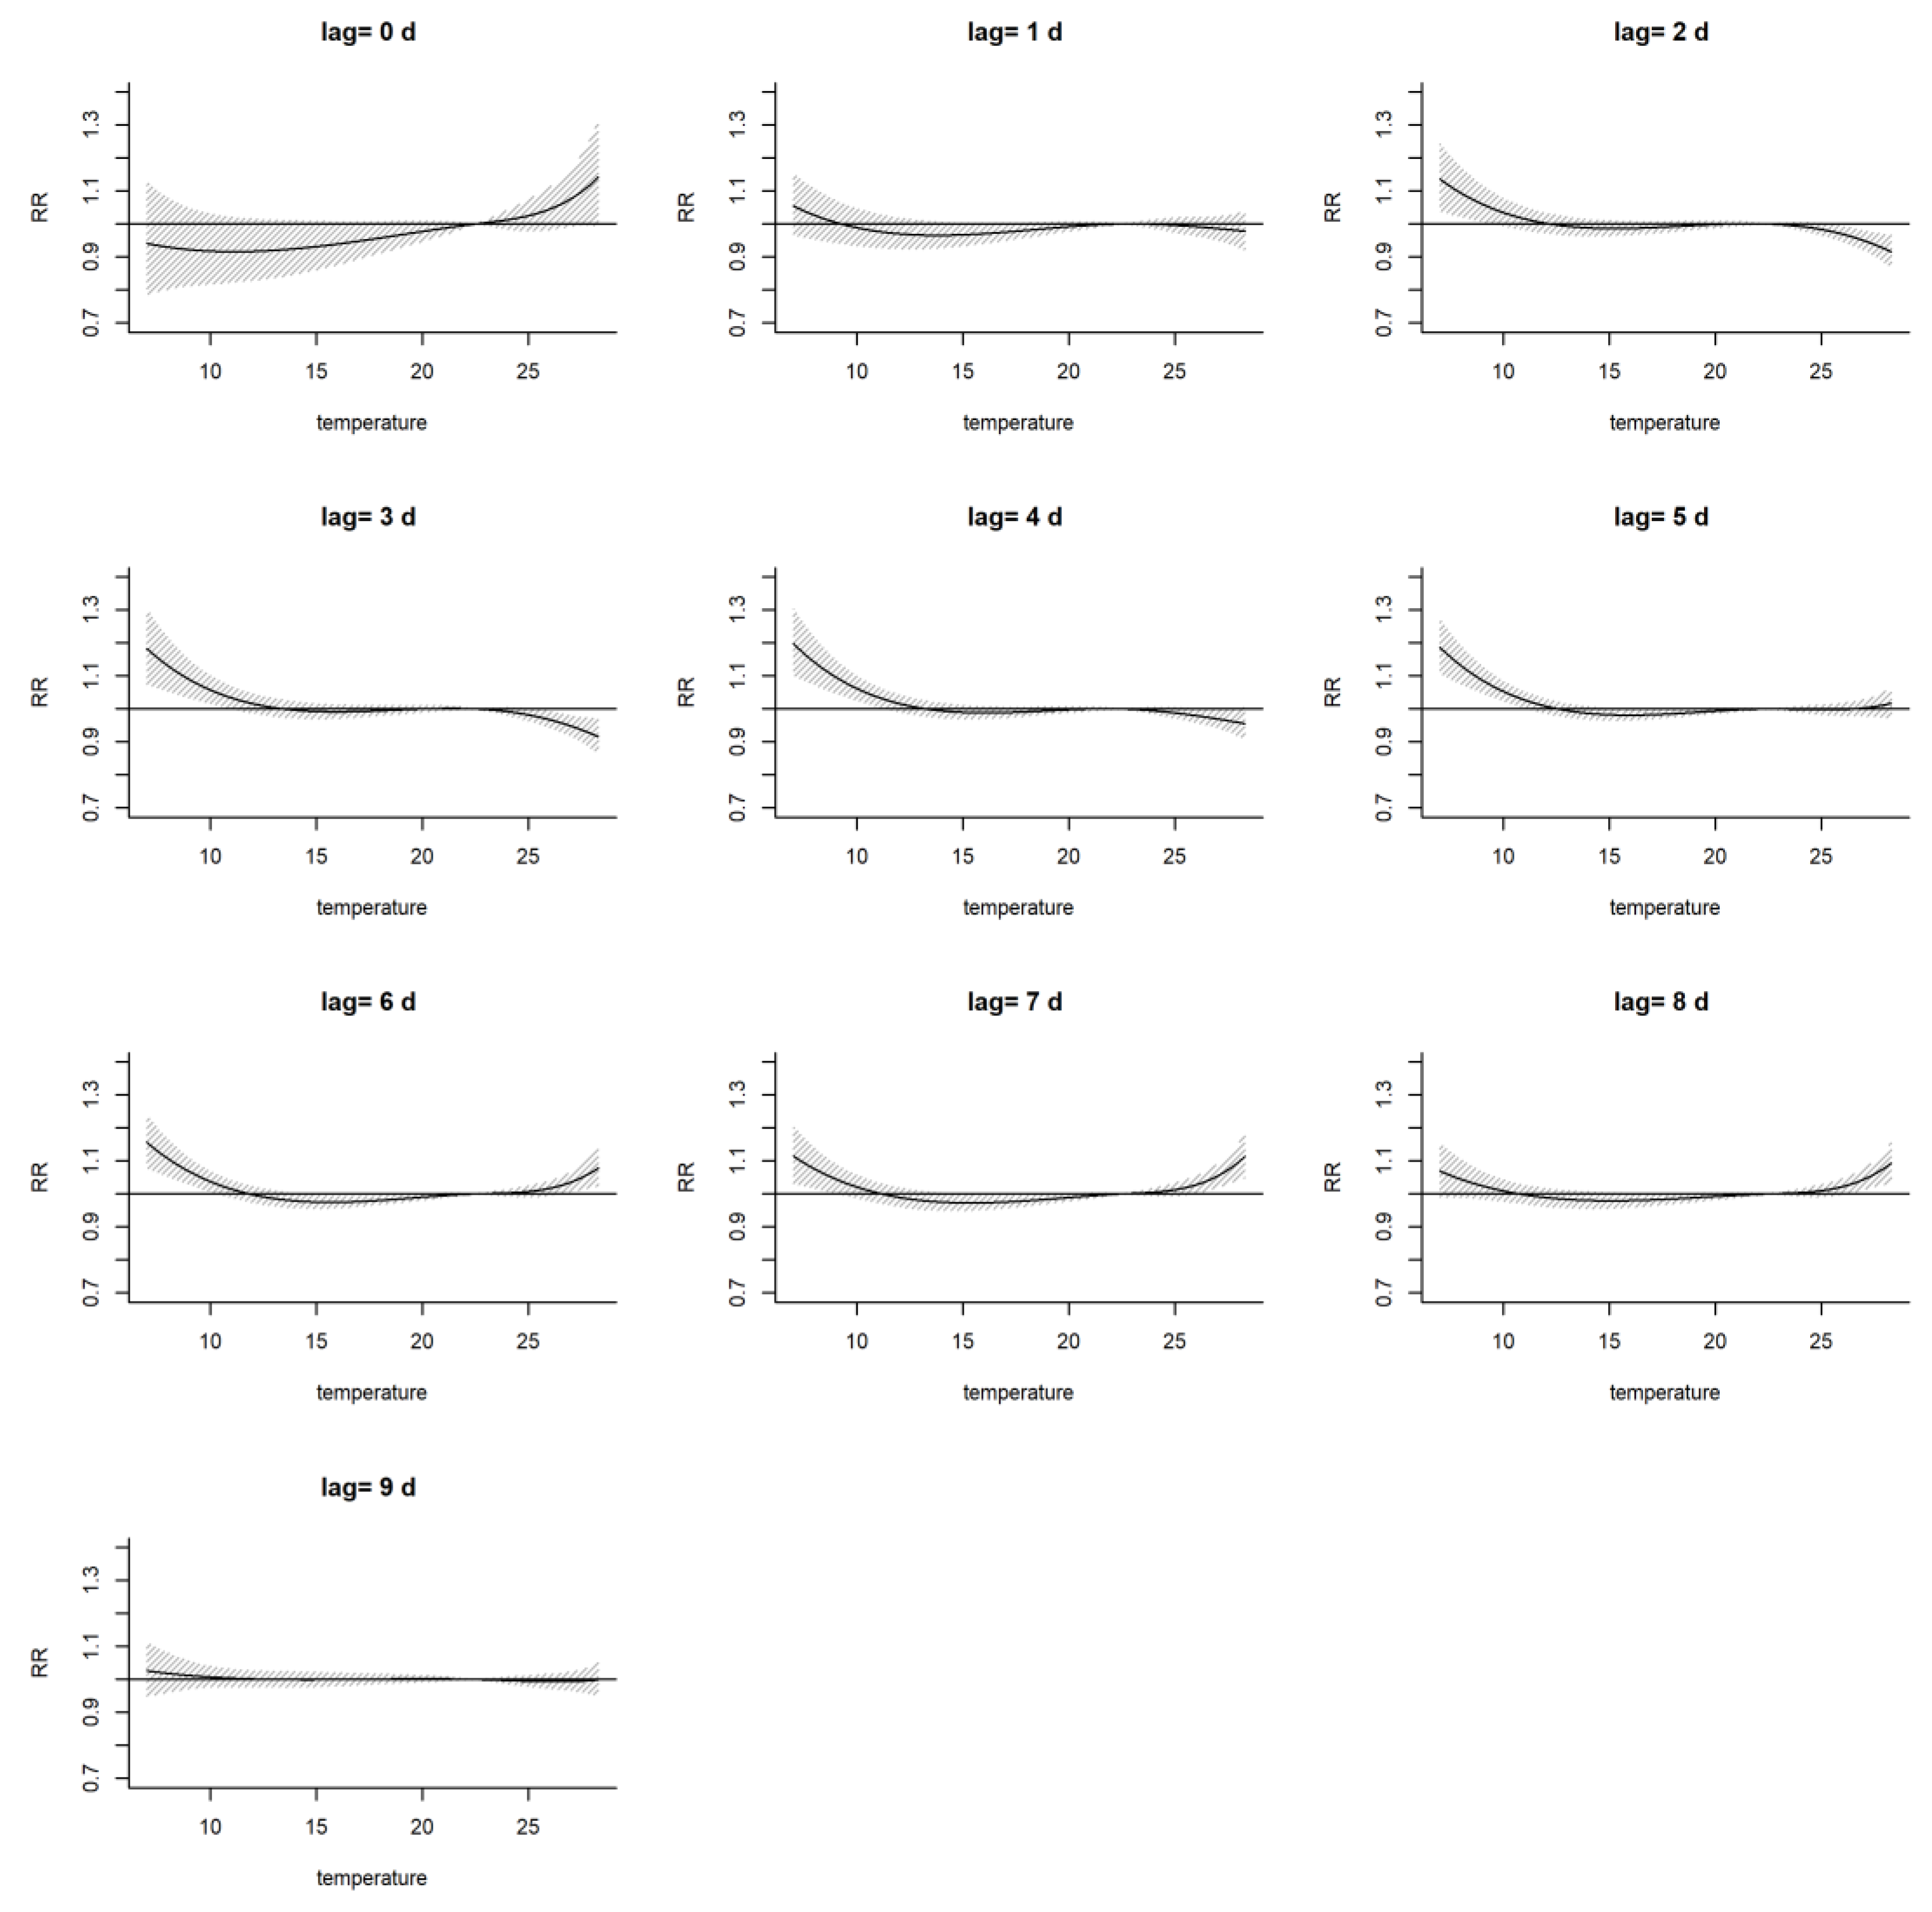
Further analysis of the impact of the daily minimum temperature on the risk of the increase in the number of CVD and CeVD patients under different numbers of lag days (Figure 3) revealed that the low-temperature cooling effect had a significant impact on the risk of the increase in the number of CVD and CeVD patients after a lag of 1–9 days, with a lag of 2–7 days passing the significance test; the high-temperature thermal effect was associated with an increased risk of the number of CVD and CeVD patients on the day of the high temperature, with a lag of 0 days and 6–8 days, and the impact of a lag of 6–8 days was tested for significance.
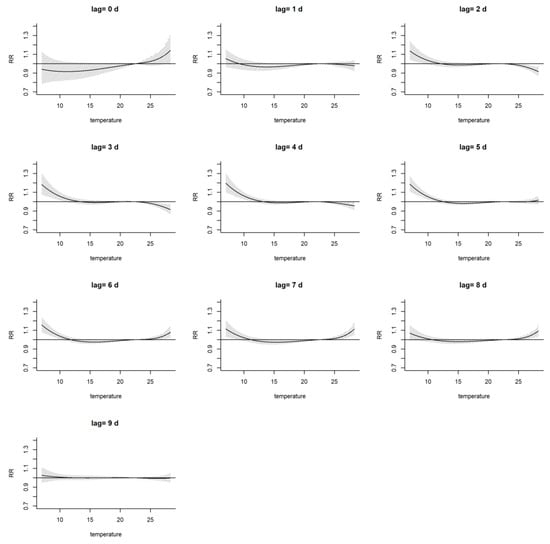
Figure 3.
Relative risk graph of the impact of the daily minimum temperature on the number of CVD and CeVD patients on different lag days. (The lines mean RR and shadows mean the range of RR. The same below.)
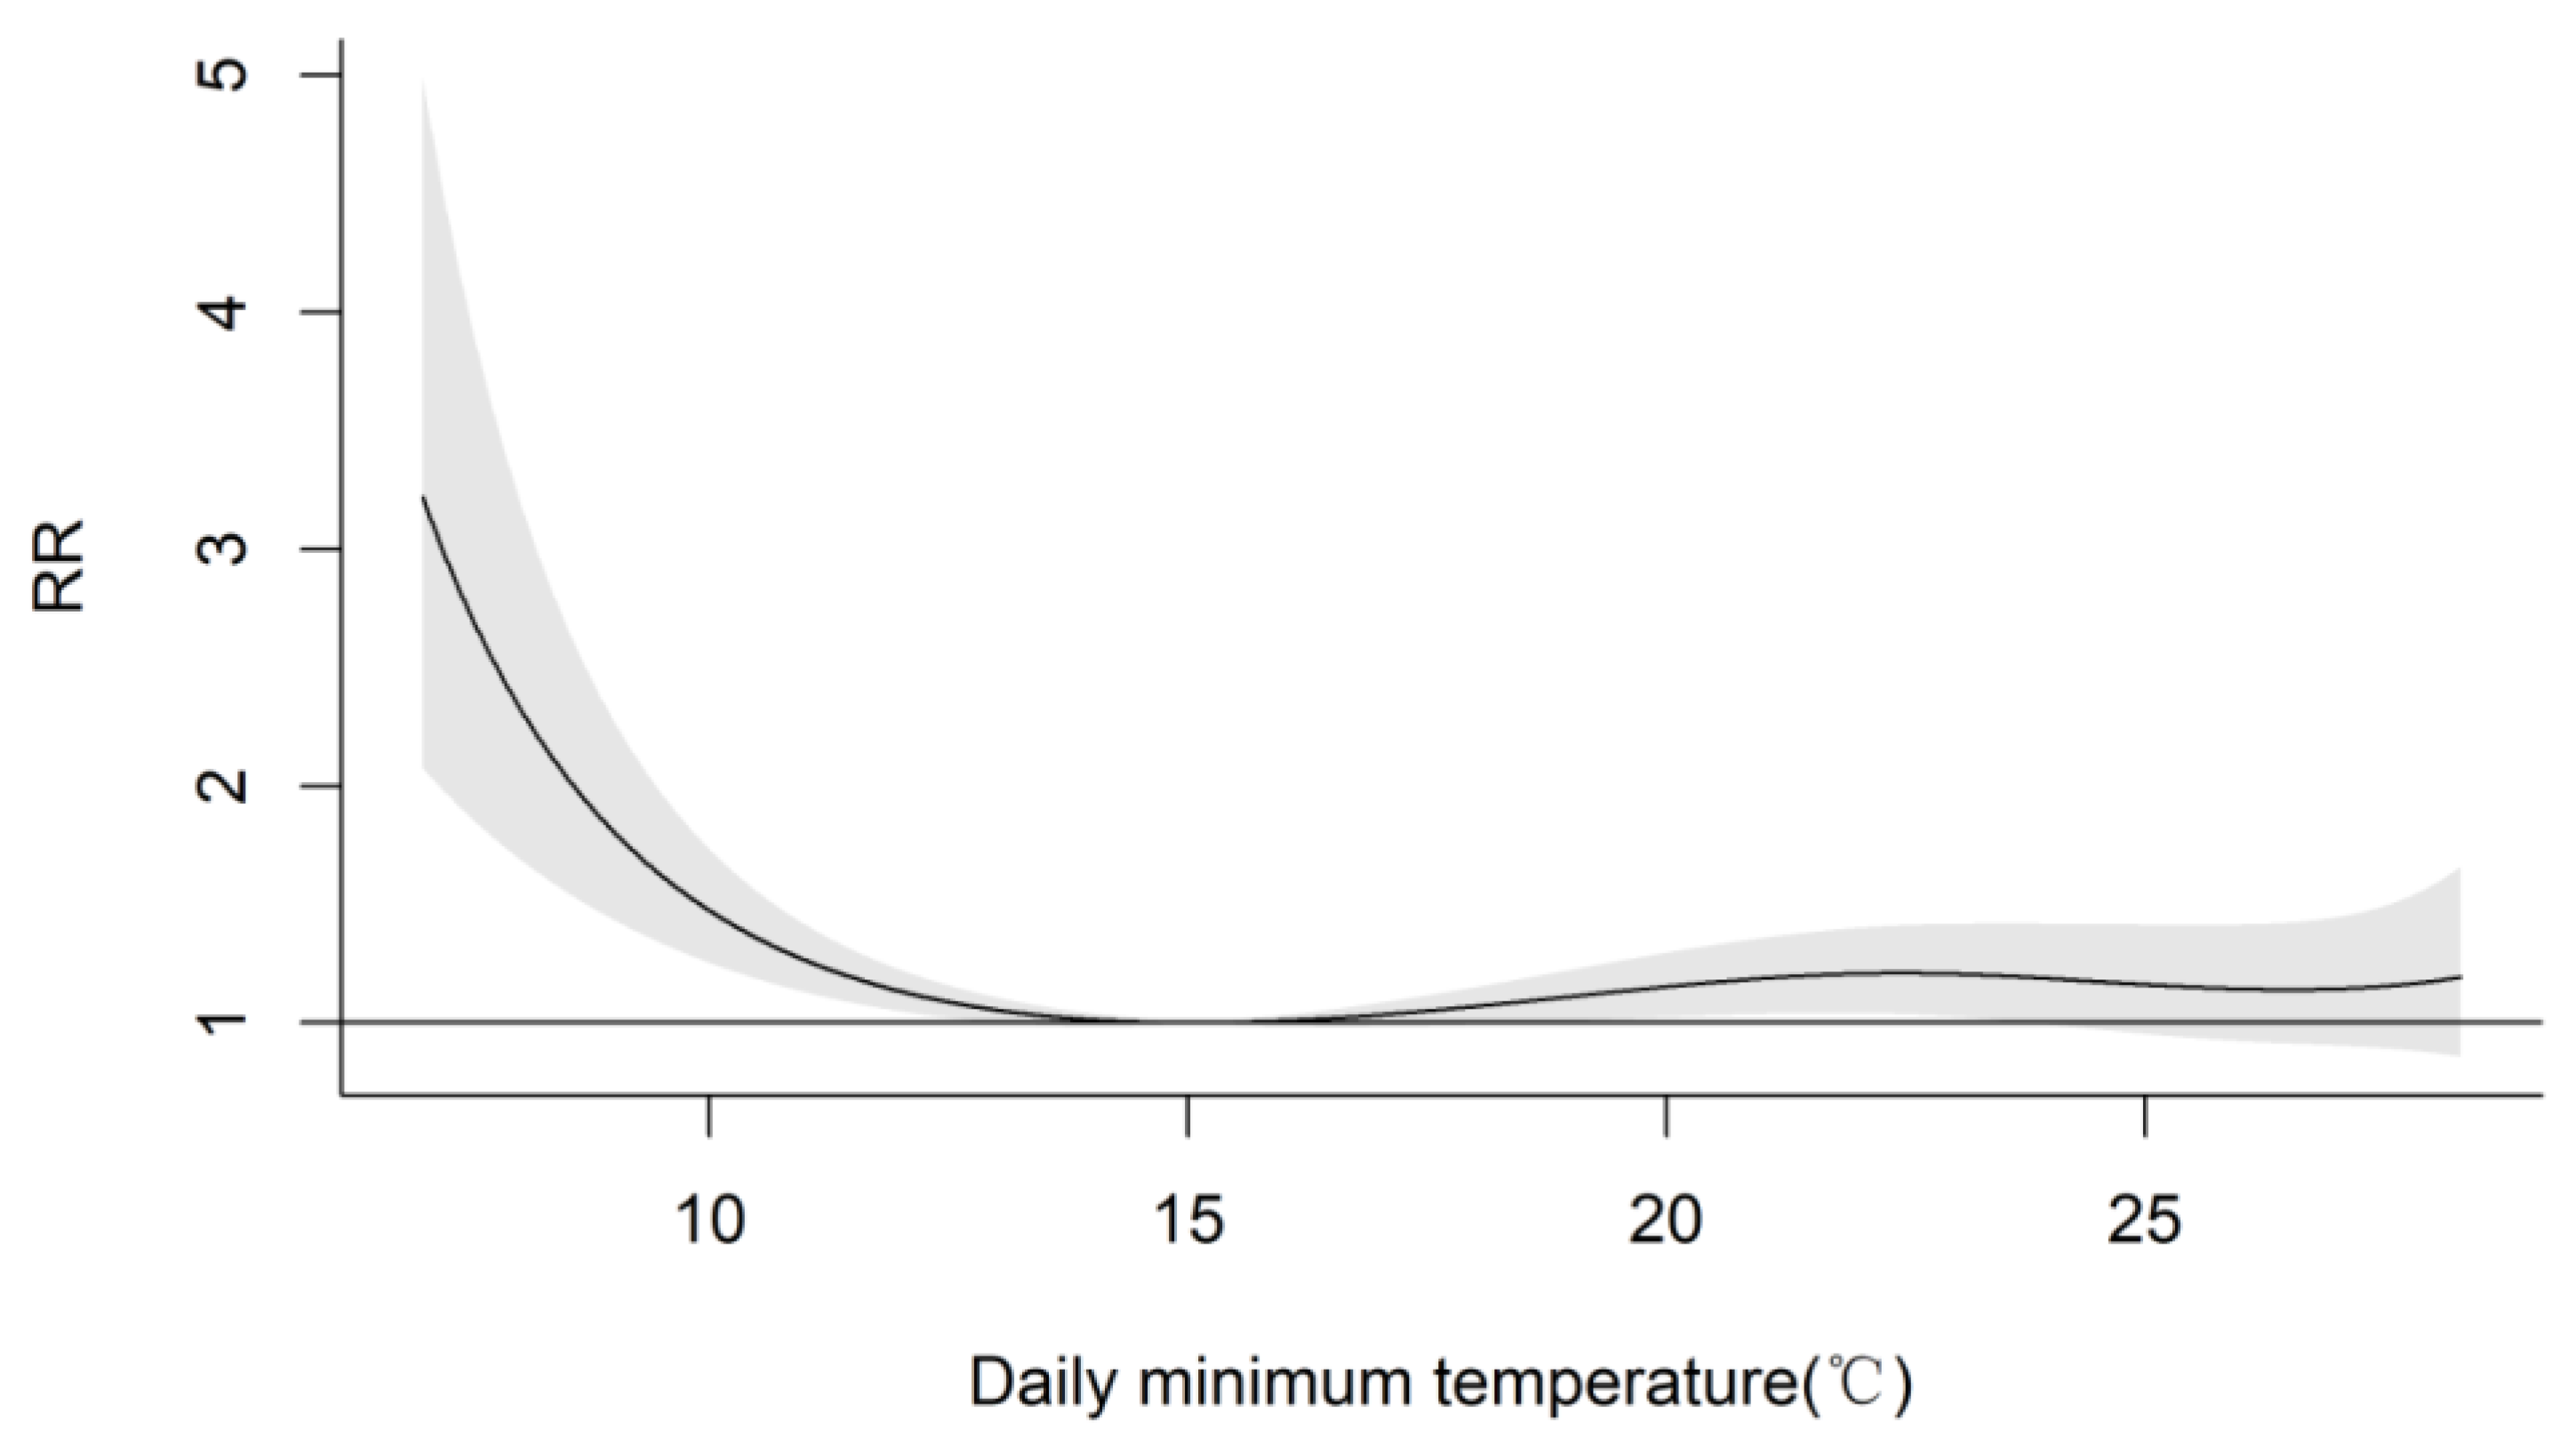
By using the DLNM of the exposure–response relationship between temperature and the number of CVD and CeVD patients, the lowest RR for the increase in the number of CVD and CeVD patients was calculated to correspond to a daily minimum temperature of 15 °C. At this temperature, the RR for CVD and CeVD was set to RR = 1, and an exposure–response relationship between the daily minimum temperature and the number of CVD and CeVD patients based on the lowest RR was plotted (Figure 4). As the temperature further increased or decreased, the risk of the number of CVD and CeVD patients increased with temperature, meaning that high or low temperatures could lead to an increased risk of disease. When the minimum temperature of the day was less than 15 °C, the risk of an increase in the number of CVD and CeVD patients slowly increased with decreasing temperature. When the minimum temperature of the day decreased to approximately 10 °C, the risk of an increase in the number of CVD and CeVD patients increased rapidly with the decreasing temperature. Compared to the patients with the lowest risk of CVD and CeVD, the patients with the highest risk of CVD and CeVD had a 221.9% greater risk (RR = 3.219, 95% CI = 2.078~4.986; with statistical significance) at a minimum temperature of 7.0 °C. When the daily minimum temperature was greater than 15 °C, the risk of the increase in the number of CVD and CeVD patients gradually increased slowly and then decreased slowly with increasing temperature. At a daily minimum temperature of 22.5 °C, the number of patients increased by 21% (RR = 1.21, 95% CI = 1.037~1.41; statistically significant).
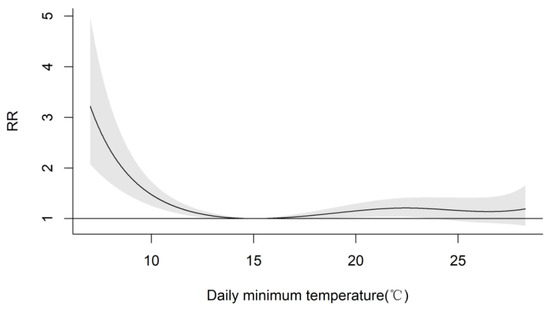
Figure 4.
Exposure–response relationship between the daily minimum temperature and the number of CVD and CeVD visits based on minimum relative risk.
The daily minimum temperature and the number of CVD and CeVD patients showed an inverted J-shaped distribution, indicating that the health risk of the cold effect was greater than that of the heat effect. High temperatures manifested as an acute effect, and the heat effect was often stronger on the day that the high temperature occurred and then rapidly decreased. The cold effect was not the strongest on the day when low temperatures occurred. Regarding lag time, compared to the heat effect, the cold effect began to appear and lasted much longer. A longer cold effect lag time was associated with a greater health risk; that is, the high temperature effect is immediate and the low temperature effect is delayed.
3.3. Exposure–Response Relationship between Temperature and the Number of Visits for Different CVD and CeVD Subtypes
Subgroup analyses were conducted to assess the effects of different sexes, ages, and CVD and CeVD subtypes on the health effects of exposure to daily minimum temperatures during the study period.
3.3.1. Different Sexes
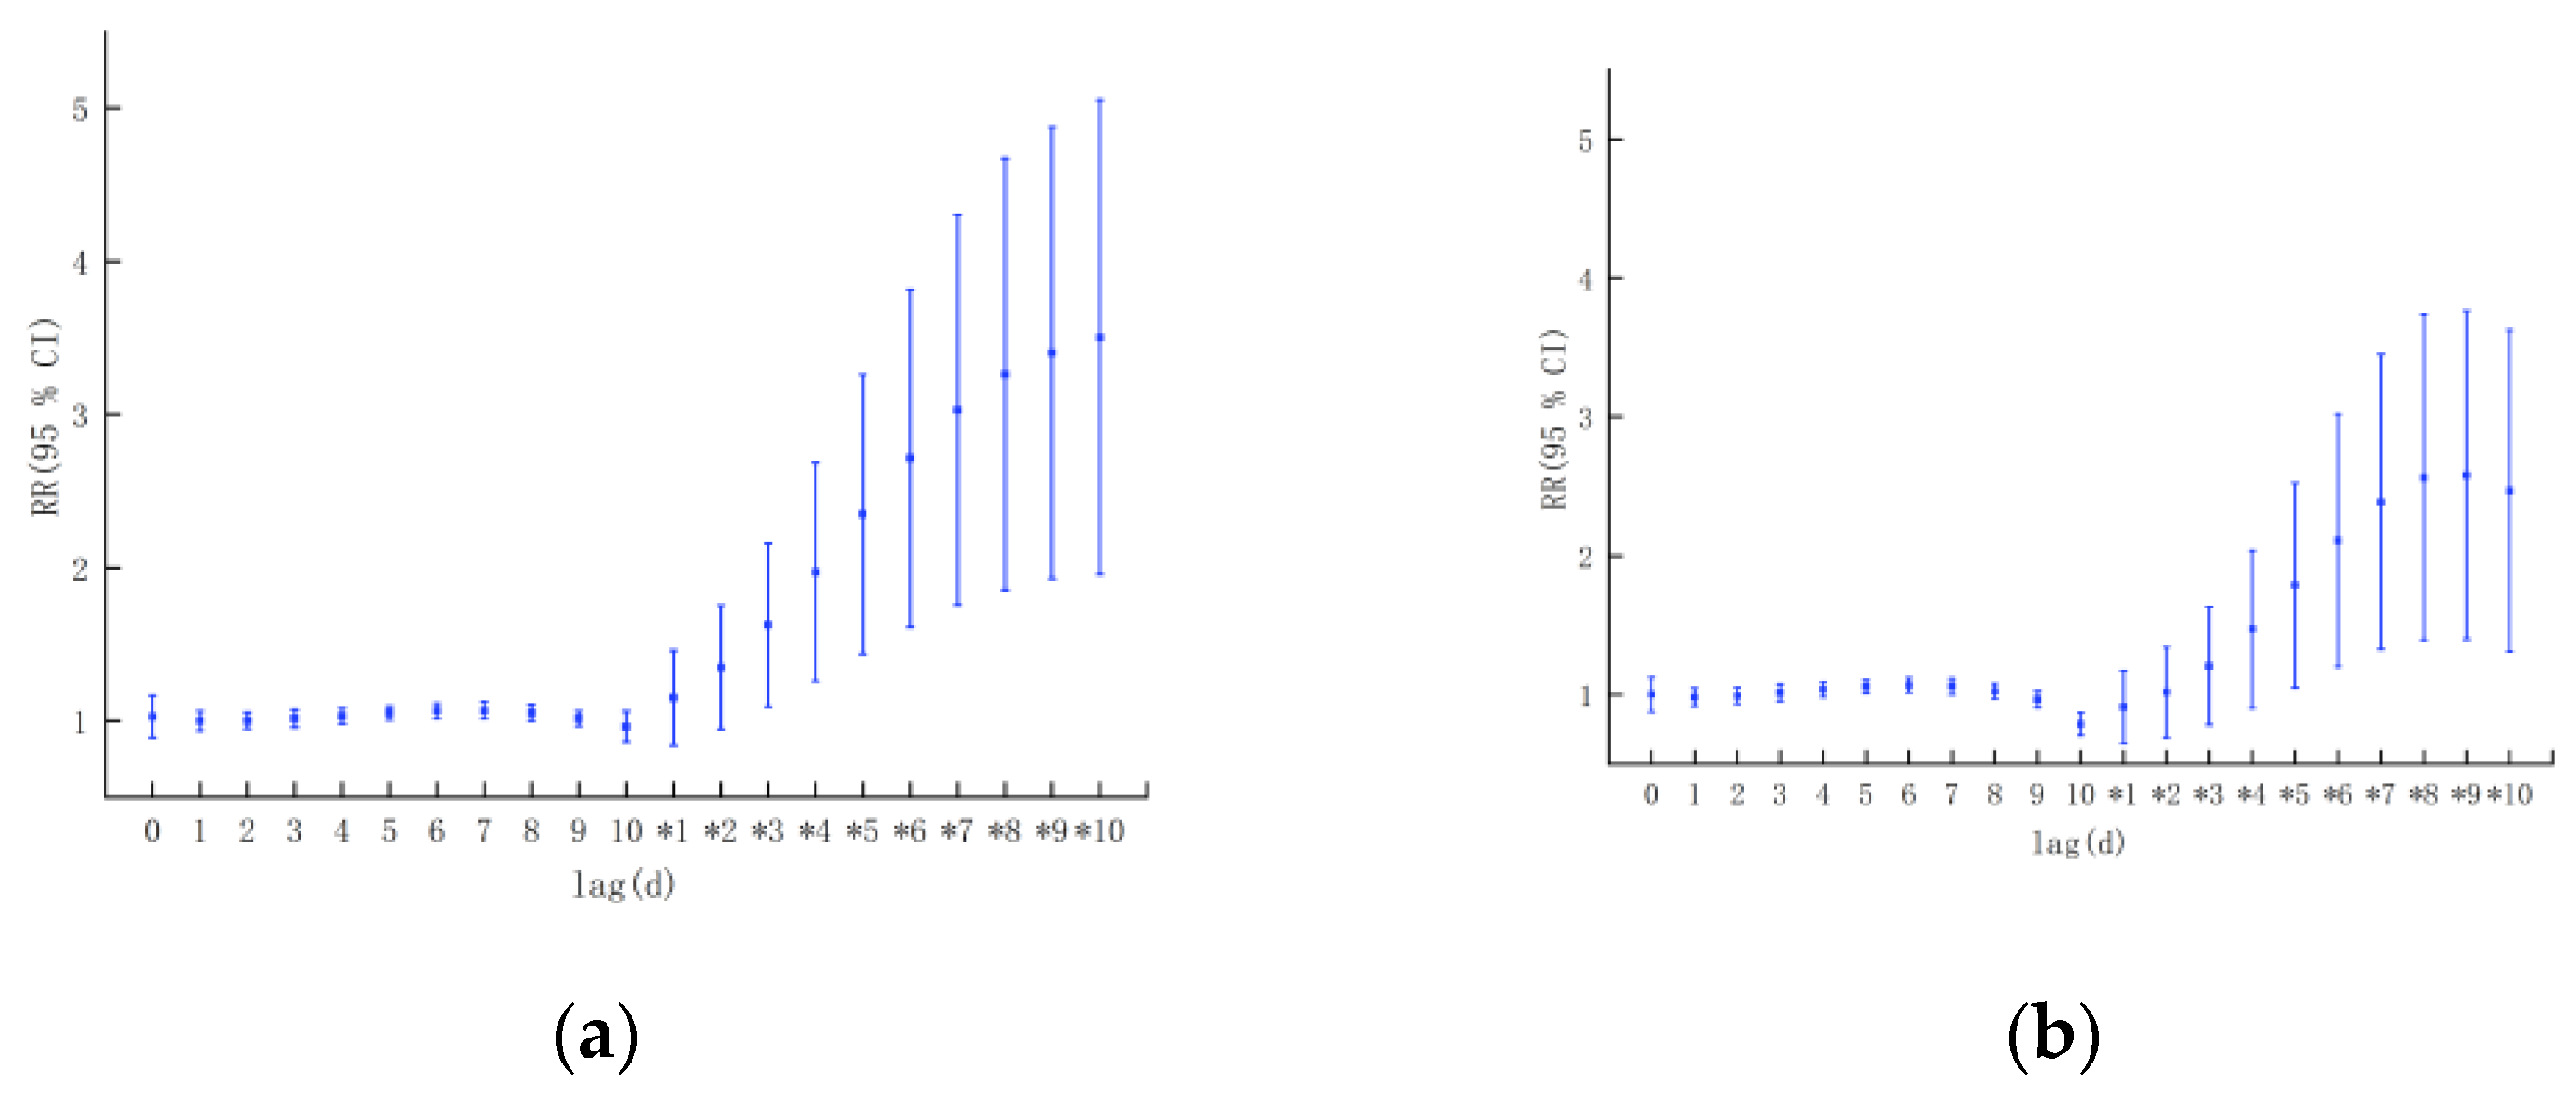
According to sex classification, from the perspective of the single-day lag effect, both high and low temperatures could have a certain impact on the increase in the number of CVD and CeVD patients in both males and females(Figure 5). In terms of the effect of low temperature, the correlation between low temperature and the increase in the number of CVD and CeVD patients in males and females was statistically significant, and there were sex differences. The impact of low temperature on women was weaker than that on men and lagged behind that on men. The impact on men started from the day the low temperatures appeared, and the impact on women started from the day it lagged behind but reached its maximum on the fourth day of lag (RR = 1.196, 1.203; 95% CI = 1.09~1.313, 1.089~13.28). As the lag period increased, the impact of low temperatures on the increase in the number of CVD and CeVD patients in both men and women gradually decreased. The impact of high temperatures on women was greater than that on men, showing an acute effect. The impact on both men and women reached its peak on the day that the high temperature occurred (RR = 1.119, 1.17; 95% CI = 0.956~1.309, 0.993~1.38; nonsignificant) and then rapidly decreased. At the same time, the initial temperature of women with a high temperature was lower than that of men, starting at 22.8 °C for women and 28.2 °C for men. From the perspective of cumulative effects, as the cumulative lag period increased, the impact of the daily minimum temperature on the risk of the increase in the number of CVD and CeVD patients in men gradually increased, while the impact on women first increased and then decreased, and the growth rate in men was greater than that in women.
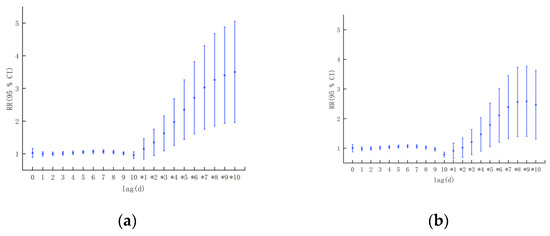
Figure 5.
Lagging effect of temperature on the incidence of CVD and CeVD in different sexes: (a) males. (b) females. ( 0, 1,…, 10 represents the lag effect of the day, the first day,…, and the 10th day, * 1, * 2,…, * 10 represents the cumulative lag effect of 1 day, 2 days,…, and 10 days (the same below).).
3.3.2. Different Ages
In terms of age, low temperatures only had an impact on the increase in the number of CVD and CeVD patients in the adolescent group on the day of its occurrence (possibly due to the small number of cases, only this result was analyzed) (Figure 6). The impact of low temperatures on the working-age and elderly groups started with a lag of 1 day, reaching its maximum at 3 and 4 days, respectively (RR = 1.166, 1.224, 95% CI = 1.051~1.294, 1.106–1.354; all statistically significant), and then showed a gradually decreasing trend. The lag period of the impact on the working-age group was longer than that for the impact on the elderly group. A high temperature only had an impact on the risk of an increase in the number of CVD and CeVD patients in the working-age group and reached its maximum on the day that the high temperature occurred (RR was 1.185, 95% CI = 1.019~1.378). From the cumulative lag effect, as the cumulative lag period increased, the impact of the daily minimum temperature on the risk of an increase in the number of CVD and CeVD patients in both the working-age and elderly groups gradually increased, and the working-age group was more affected.
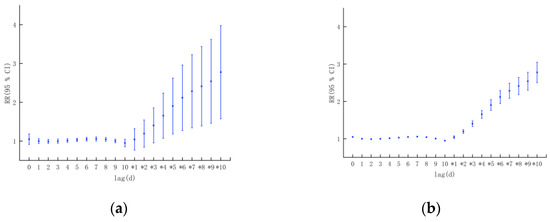
Figure 6.
Lag effect of temperature on the incidence of CVD and CeVD in different age groups: (a) working-age group. (b) elderly group.
3.3.3. Different CVD and CeVD Subtypes
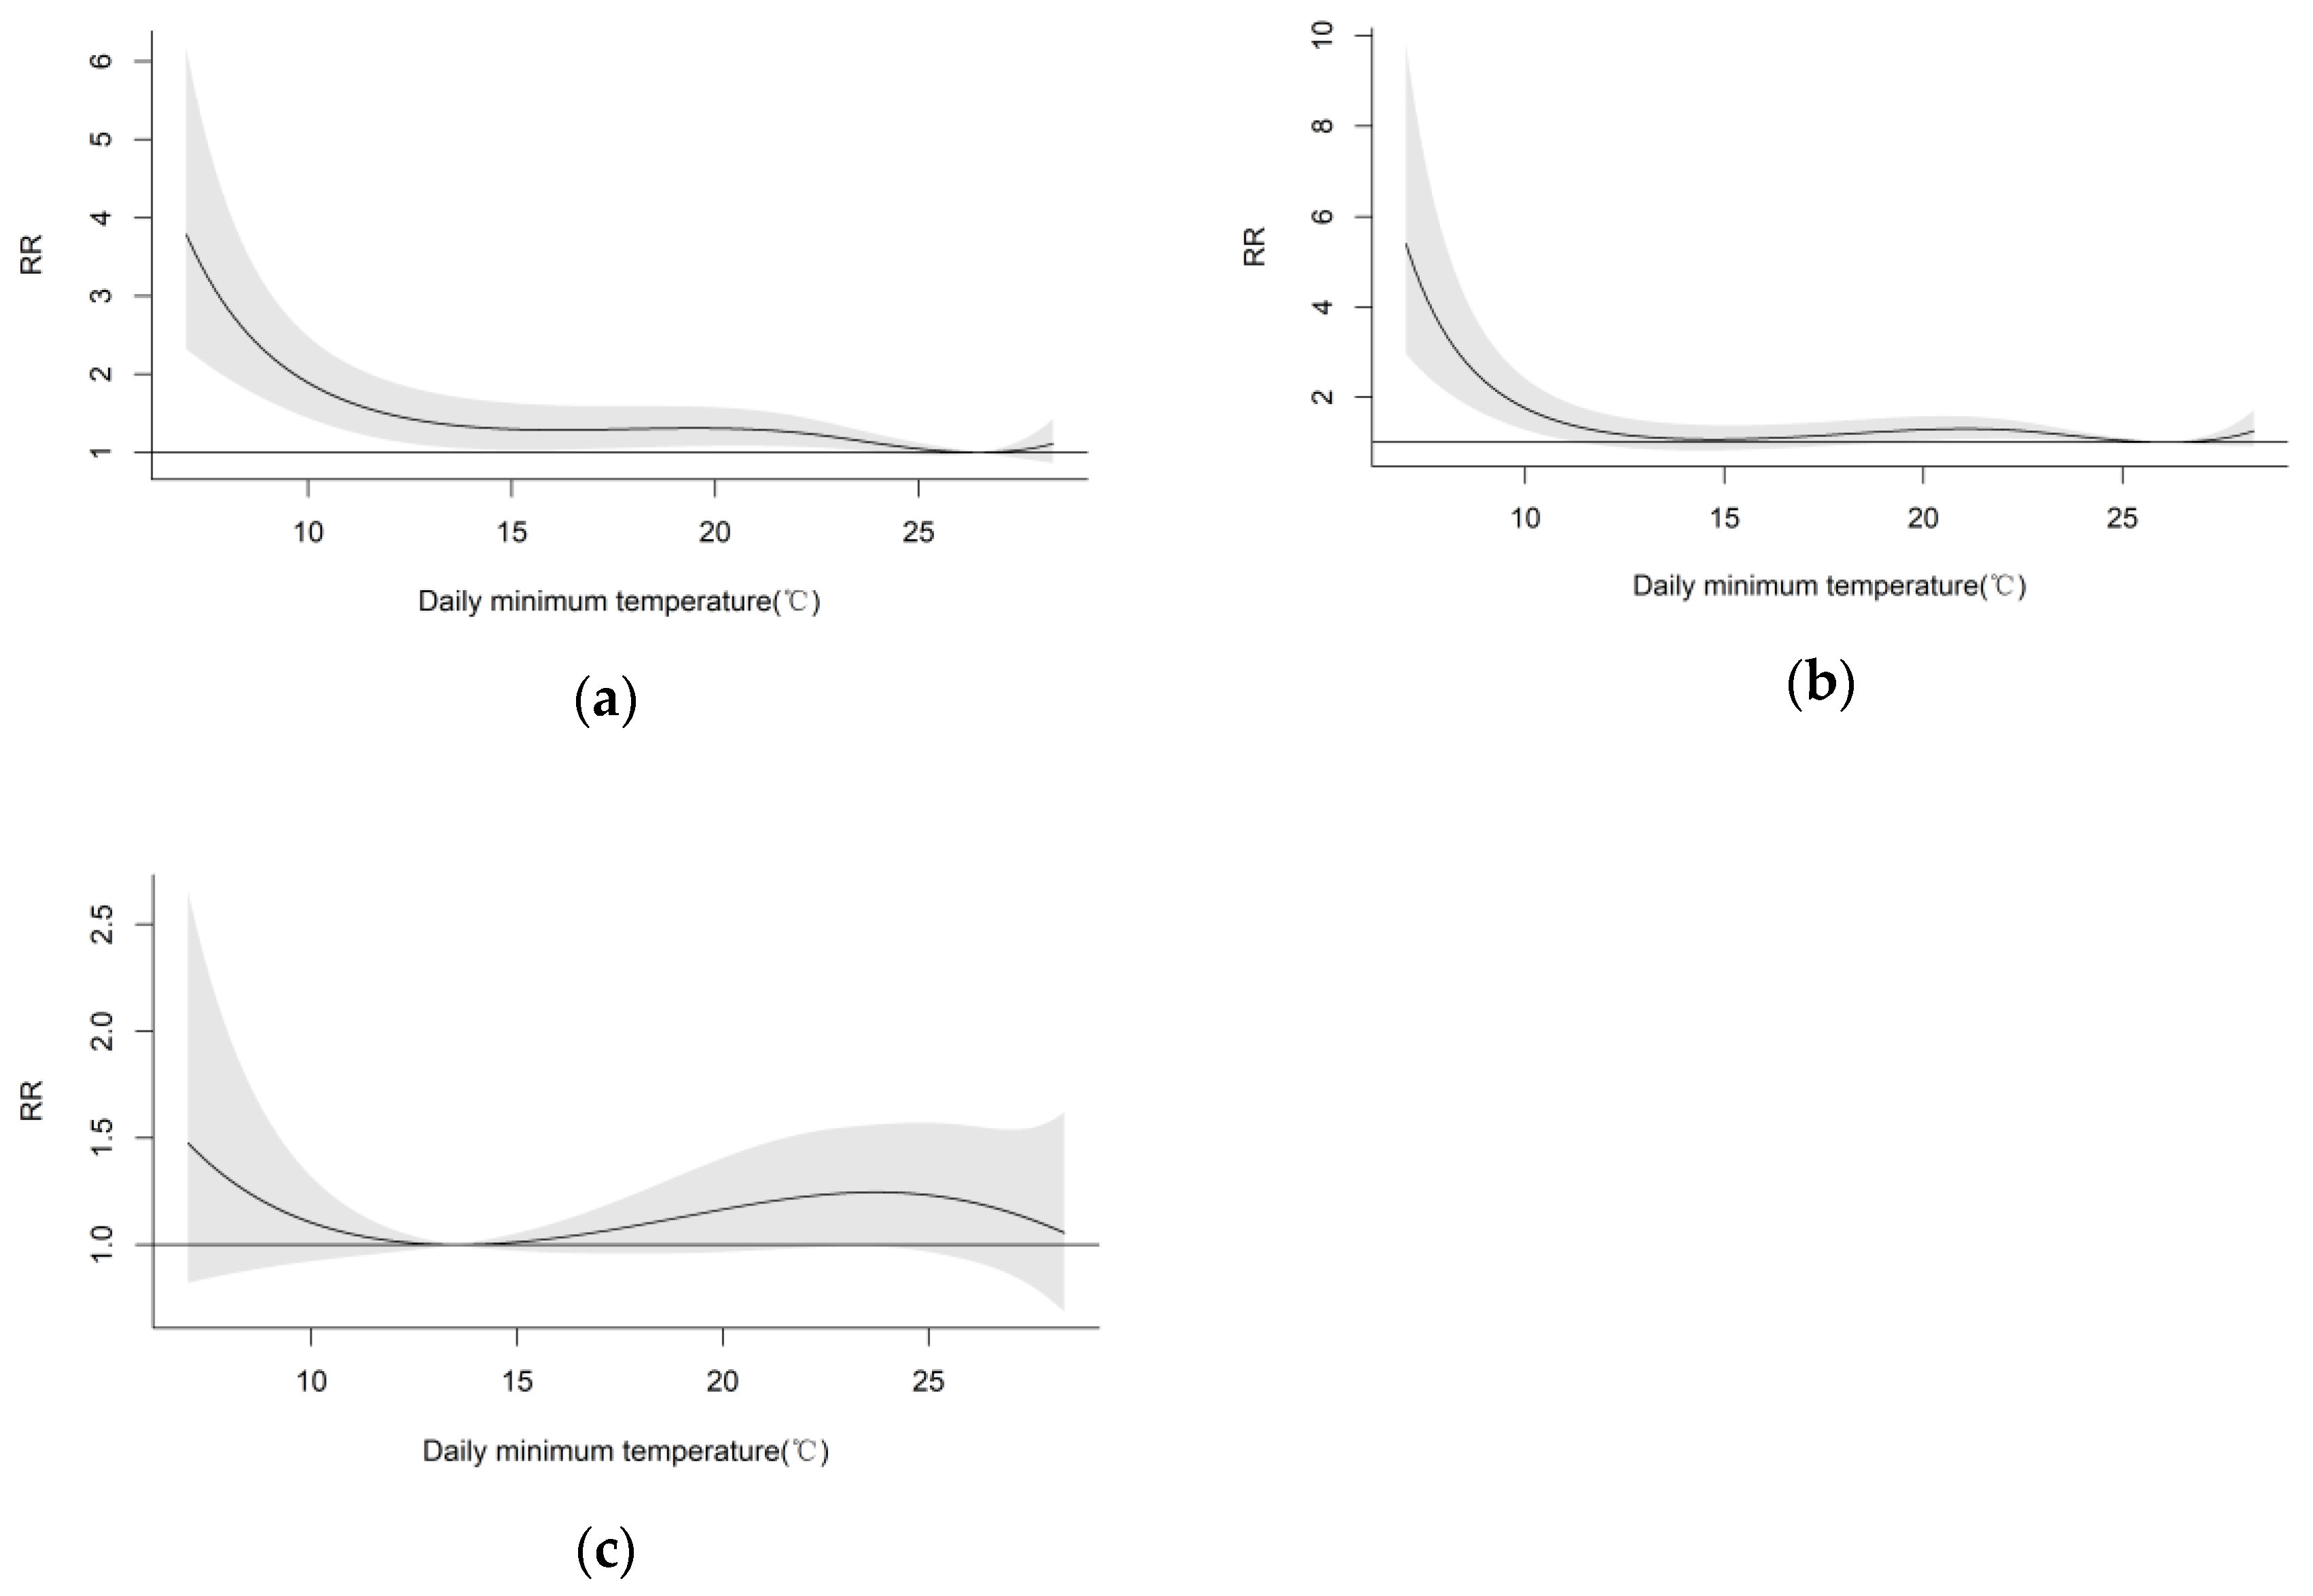
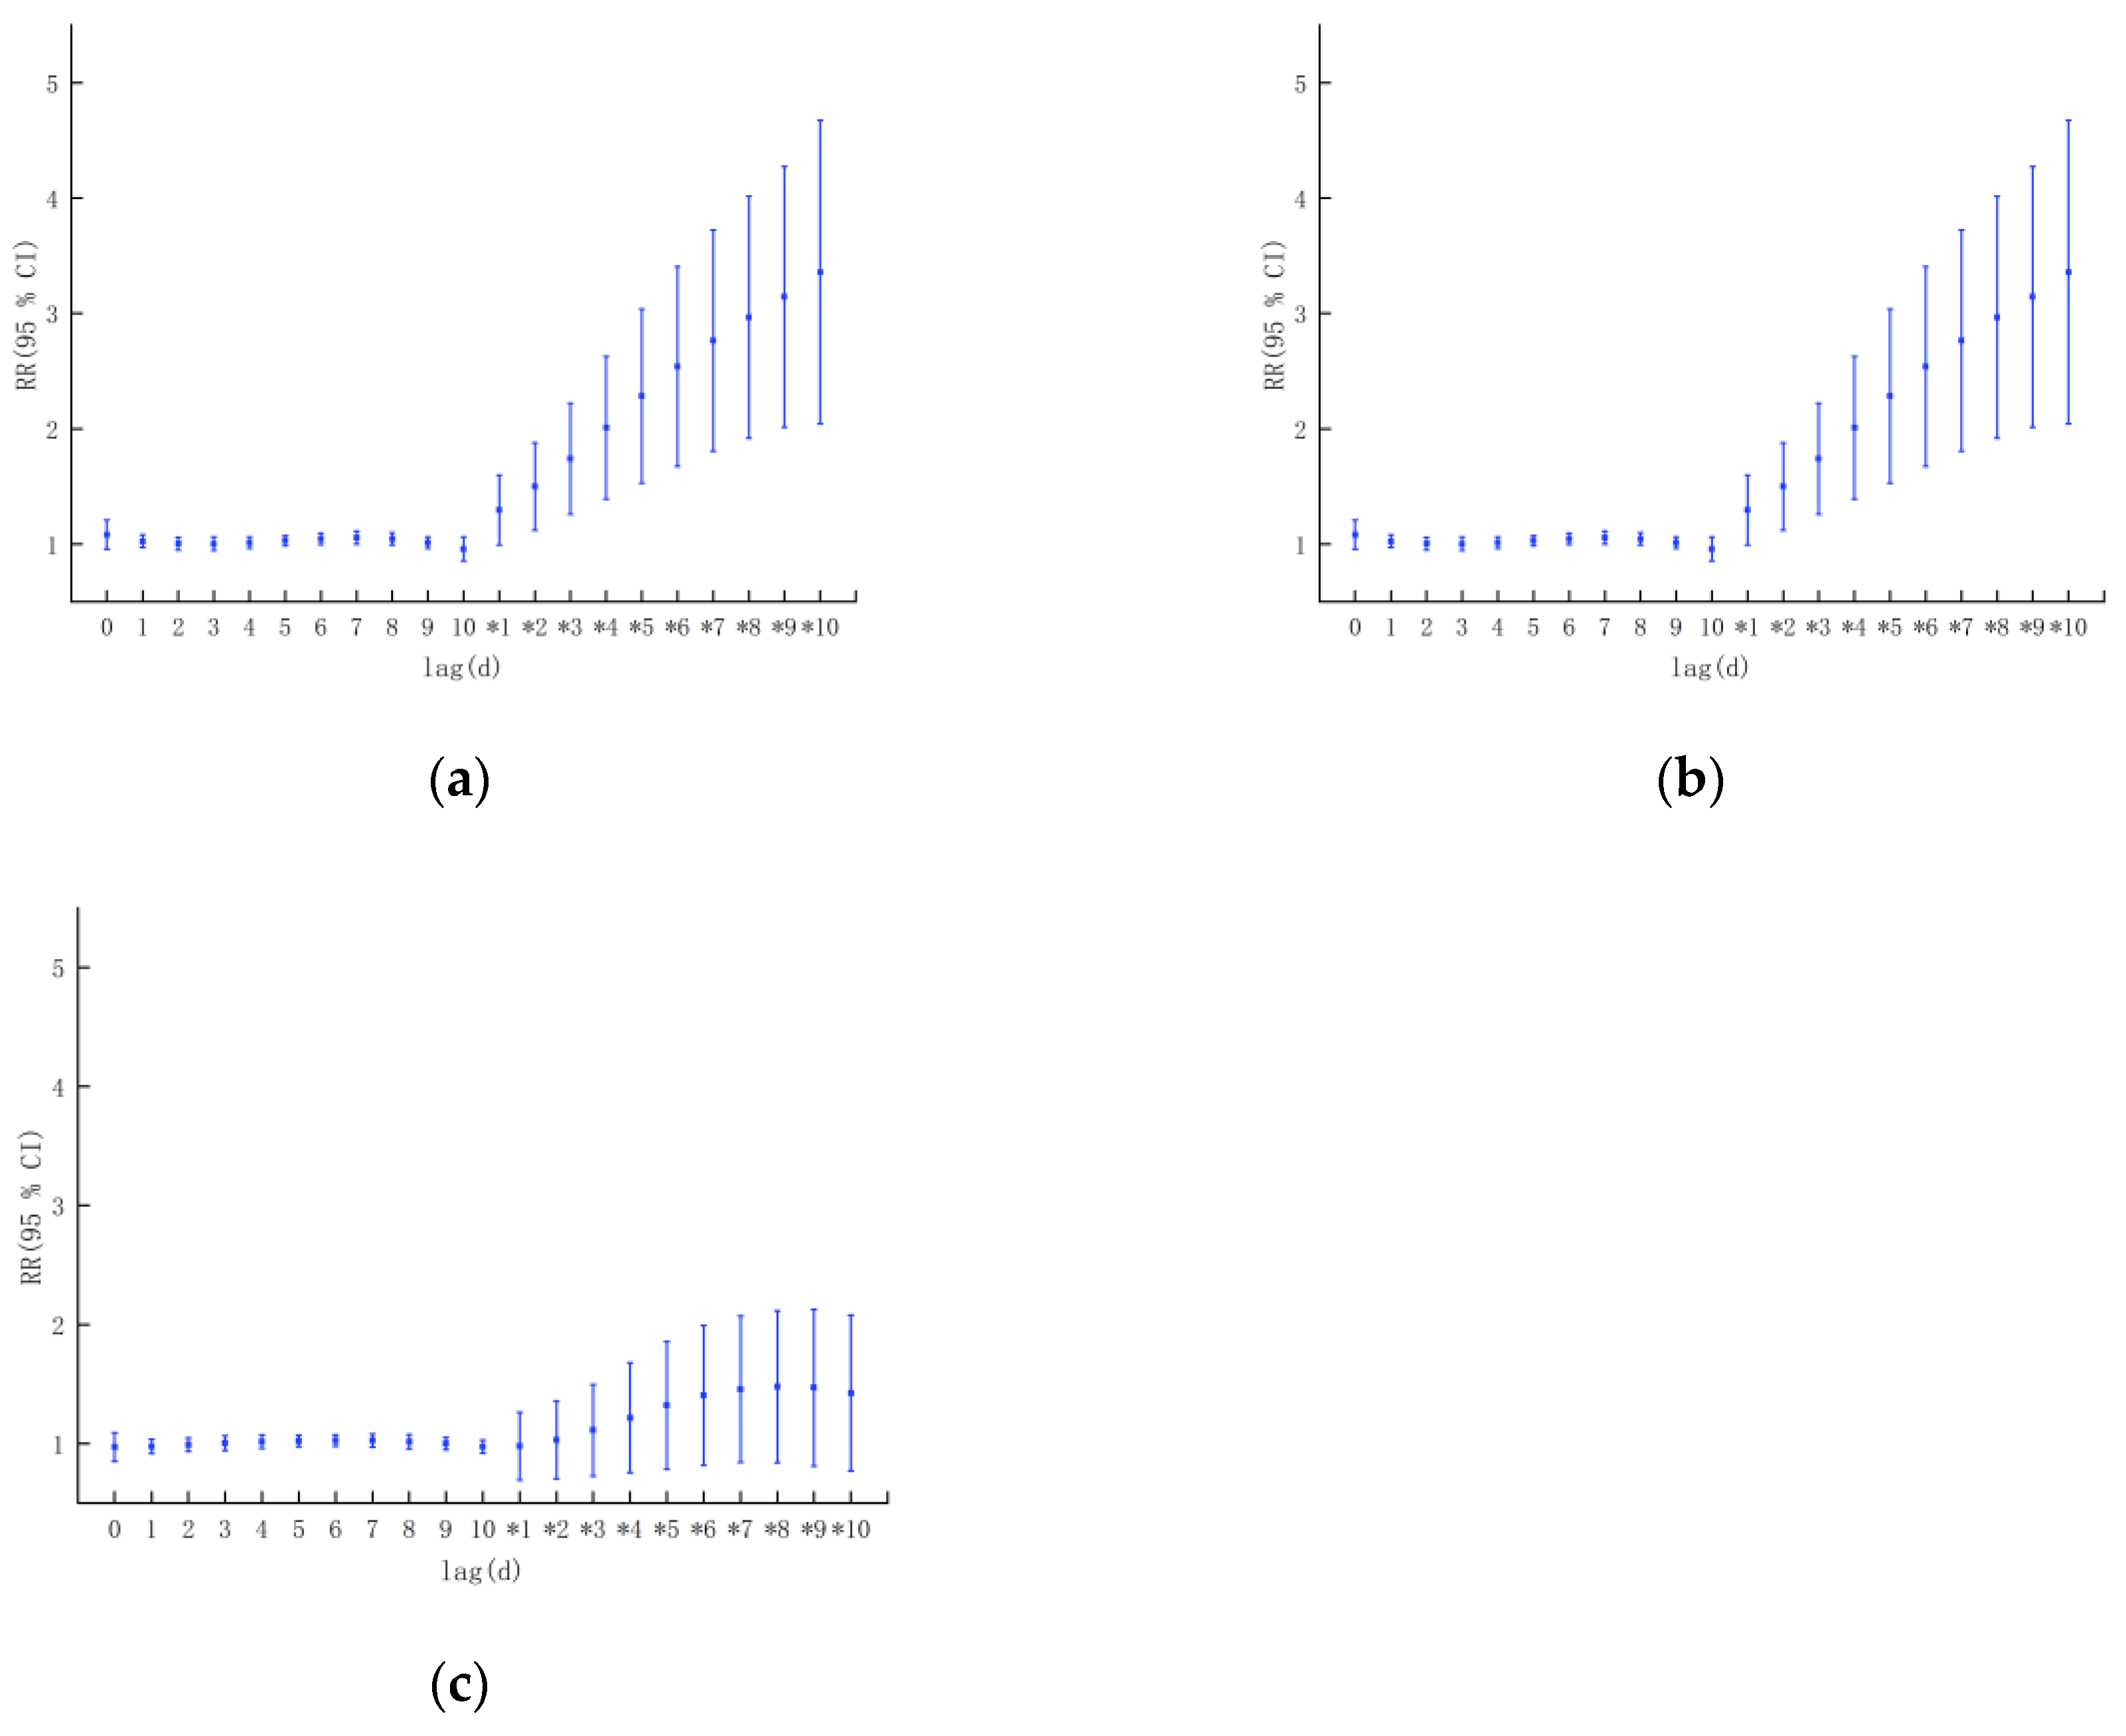
By using the DLNM to calculate the exposure–response relationship between the daily minimum temperature and the number of patients with hypertension, CHD, and stroke, the daily minimum temperature corresponding to the lowest RR values of the three CVD and CeVD was calculated. The RRs for the three CVDs and CeVDs under different temperatures were set to 1, and the exposure–response relationship between the daily minimum temperature based on the lowest RR and the number of patients with the three CVD and CeVD was plotted (Figure 7). The results indicated that as the temperature decreased, the risk of the three CVDs gradually increased. When the temperature was below 10 °C, the risk of CVD and CeVD increased rapidly. Among the individual CVD and CeVD, compared to the lowest risk of hypertension visits (corresponding to a daily minimum temperature of 26.5 °C), the impact of temperature on the risk of hypertension onset was statistically significant as the temperature decreased to 24.1 °C. When the daily minimum temperature was 7.0 °C, the increase in the number of visits reached 279% (RR = 3.79, 95% CI = 2.236~6.176; statistically significant). Compared to the lowest risk of CHD visits (corresponding to a daily minimum temperature of 26.1 °C), the impact of temperature on the risk of CHD onset decreased significantly when the temperature decreased to 11.4 °C. At a daily minimum temperature of 7.0 °C, the increase in the number of visits reached 439.5% (RR = 5.395, 95% CI = 2.963~9.821; statistically significant). Compared to the lowest risk of stroke visits (corresponding to a daily minimum temperature of 13.5 °C), the risk of stroke increases rapidly as the temperature decreases. When the daily minimum temperature was 7.0 °C, the increase in visits reached 47.7% (RR = 1.477, 95% CI = 0.822~2.653; nonsignificant). The above analysis results indicated that low temperatures could significantly increase the increase in the number of CVD and CeVD patients in different subtypes of the population.

Figure 7.
Exposure–response relationship between the daily minimum temperature and the number of CVD and CeVD visits based on minimum relative risk: (a) hypertension, (b) CHD, (c) stroke.
Further analysis revealed that the effect of low temperatures on the risk of hypertension started on the day of low temperature onset and reached its maximum at a lag of 3 days (RR = 1.153, 95% CI = 1.038~1.281; statistically significant). The effect of a 1- to 6-day lag was statistically significant, while the effect on CHD started from an approximately 1-day lag and reached its maximum at a lag of 5 days (RR = 1.269, 95% CI = 1.163~1.384; statistically significant). The effect on stroke started with an approximately 2-day lag and reached its maximum at a lag of 4 days (RR = 1.077, 95% CI = 0.963~1.206; nonsignificant). The lag time for the effect of low temperatures on hypertension was the longest, reaching 10 days. Regarding high-temperature effects, the highest risk of the three CVDs and CeVDs was observed on the day that the high temperature occurred (RR = 1.113, 1.048, 1.007; 95% CI = 0.959~1.291, 0.898~1.224, 0.87~1.165; respectively), but none of the associations were statistically significant.
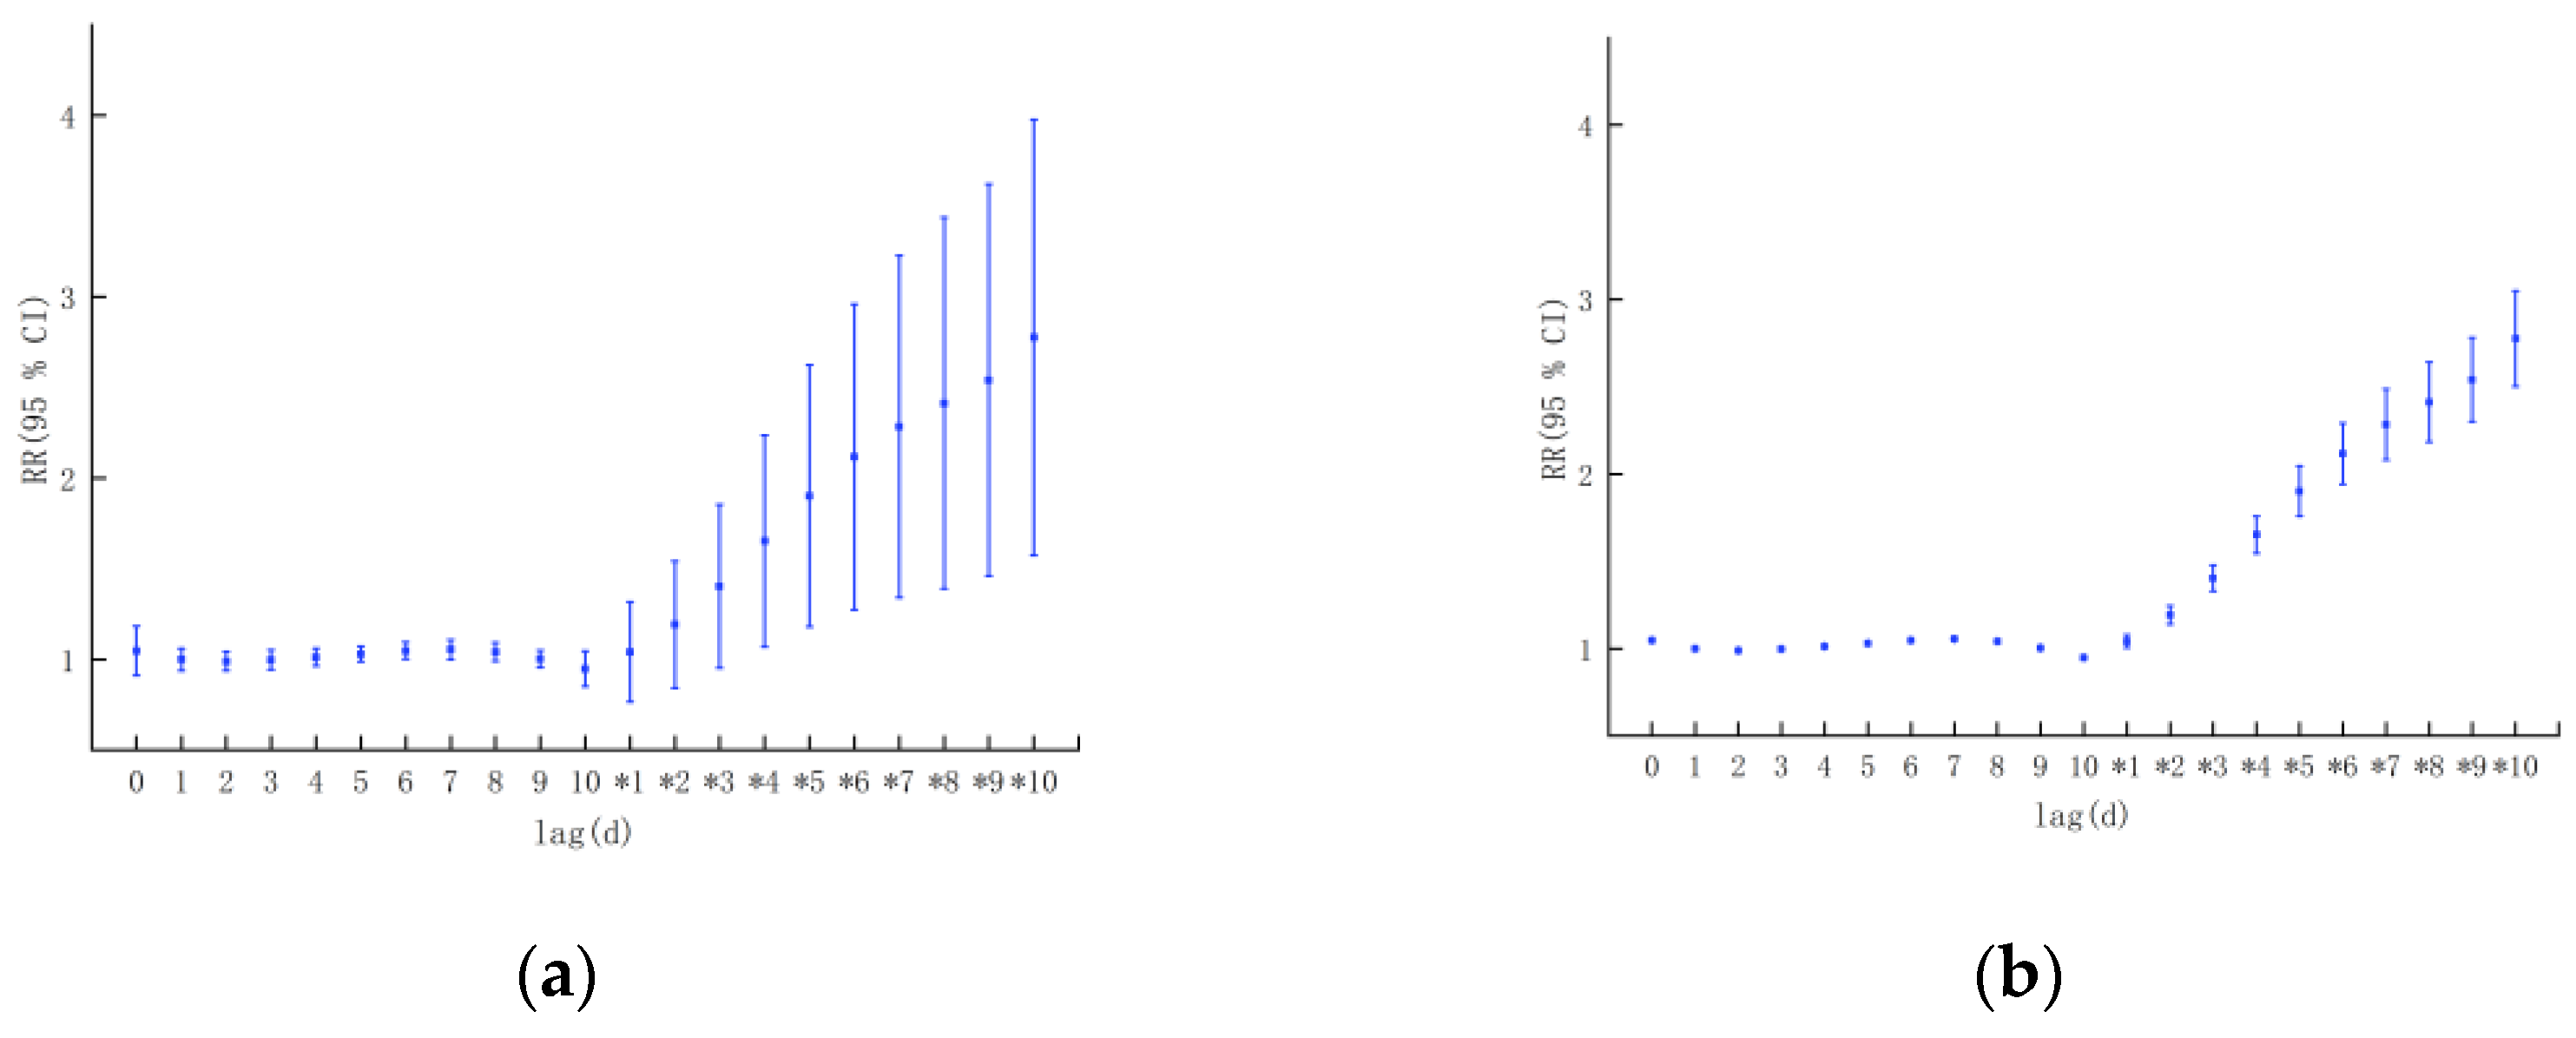
Overall, the impact of low temperature on the three CVD and CeVD was significantly greater than that of high temperature. From the perspective of the cumulative lag effect, the impact of the daily minimum temperature on the increase in the number of hypertension and CHD patients gradually increased, and the longer the cumulative lag period was, the more significant the impact on disease incidence, and the impact on the risk of stroke first increased and then decreased (Figure 8). The impact of the daily minimum temperature on the increase in the number of cases of hypertension and CHD was greater than that on the incidence of stroke.
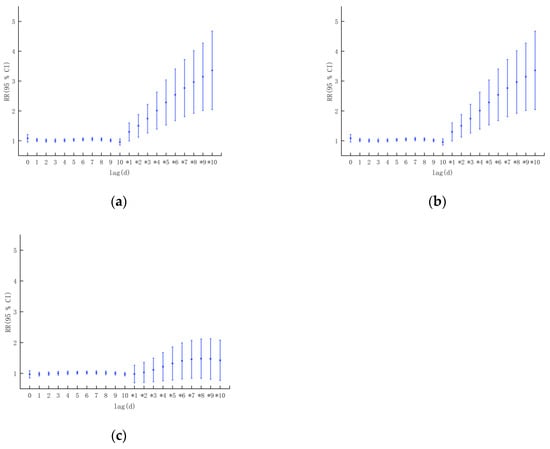
Figure 8.
Lagging effect of temperature on the incidence of CVD and CeVD in different subtypes: (a) hypertension, (b) CHD, and (c) stroke.
4. Discussion
Using outpatient consultation data on CVD and CeVD in Hainan Provincial People’s Hospital from 2016 to 2018, we conducted a study on the effects of temperature on the increase in the number of CVD and CeVD patients in Haikou city, which could provide a scientific basis for the prevention and treatment of CVD and CeVD in tropical areas and the allocation of health care resources.
- (1)
- The influence of temperature on the risk of CVD and CeVD development in Haikou city was dominated by the cold effect, and the health risk of the cold effect was greater than that of the heat effect, and this was consistent with the findings of Park S et al. [3] that an elevation in blood pressure during the colder seasons could potentially result in increased cardiovascular risk, and the findings of Mascarenhas MS et al. [13] that associations between suboptimal air temperatures and increased risk of death from CVD were observed in all of Brazil’s five regions. Meanwhile, the health risk of the cold effect had an obvious lag effect, and the risk of temperature exposure was greater among male working-age individuals, which was consistent with the findings of Zheng Shan [8] that the highest number of male and under 65 year old cardiovascular system diseases are seen in Beijing and Lanzhou during the winter and spring seasons. This study also found that high temperatures had a higher impact on women than men and exhibited acute effects, which was consistent with the findings of Achebak H et al. [29] that between 1980 and 2016 in Spain, 4,576,600 cardiovascular deaths were recorded. For warm temperatures, the increase in relative risk (RR) of death from cardiovascular diseases was higher for women than men, whereas for cold temperatures, RRs were higher for men than women. But Misailidou M et al. [7] found the cold effect was more prominent in the elderly, and no difference was detected according to sex. On the other hand, previous studies have shown that low temperature has an immediate effect on the incidence of circulatory diseases in Zunyi, China [25], which is different from the findings of the present study, which revealed a lagging effect of low temperatures and an immediate effect of high temperatures; changes in temperature have an effect on the incidence of CVD and CeVD [28,30], for example, Liu Bo et al. [9] found that 24-h temperature fluctuations in Beijing had the greatest impact on stroke and coronary heart disease that in spring and autumn, when the 24-h negative temperature below the threshold decreases by 1 ℃, the risk of onset increases by 18.1–34.5%, which was 2–10 times that of other meteorological changes causing an increase in risk and Rahman MM [30] found that a 1 °C increase in temperature variability (TV) was associated with a 1.00% (95% CI: 0.05%, 1.96%) increase in CVD visits at lag 0–1 days (TV0–1) in Dhaka, Bangladesh. But correlation analyses in the present study showed that the magnitude of the change in temperature had no correlation with the number of visits to the clinic for CVD and CeVD in Haikou city. These differences may be related to the different climatic conditions caused by the different study areas and the different selections of medical data.
- (2)
- The research results indicate that attention should be given to this topic and that efforts should be made to strengthen CVD and CeVD-related prevention, risk prediction, and early warning in tropical areas with climate conditions similar to those in Haikou, especially the acute effects of high temperatures and the cumulative effects of low temperatures. Collaboration between work and research groups should be established among multiple departments, such as those related to meteorology and medical health, emphasizing the health protection of special populations and formulating effective prevention and control strategies to reduce the health and economic burdens related to CVD and CeVD.
- (3)
- During the research process, we also analyzed the effects of the daily average temperature, water vapor pressure, air quality, and other factors on the number of CVD and CeVD patients. The effect of water vapor pressure on the increase in the number of CVD patients was not significant, but polluted weather conditions had an impact on the increase in the number of hypertension patients. Although the correlation between NO2 and the number of CVD and CeVD patients was statistically significant, according to the “Environmental Air Quality Standards” [GB/T 3095-2012] [31], NO2 in Haikou city did not reach the pollution threshold, which may be related to the excellent air quality caused by the regulation and purification of air by the island climate, environment, and vegetation conditions in Haikou city. Therefore, NO2 was not selected as an influencing factor, but the AQI, which characterizes air quality, was chosen as a model covariate.
- (4)
- In addition, previous studies have shown that air pollution has a significant impact on CVD and CeVD incidence and mortality. For example, Xiao Ye et al. [32] found that ischemic heart disease and stroke mortality were associated with exposure concentrations of PM10 and O3, and there was a significant lag; Britney Gaines et al. [33] found that PM2.5 exposure was associated with a higher ischemic stroke risk, with larger effect estimates at higher exposure levels with all stroke cases across Israel in 2014–2018. Therefore, it is necessary to conduct an analysis of the synergistic effects of air quality, meteorological factors, and air quality factors on the increase in the number of CVD and CeVD patients and different CVD and CeVD subtypes based on the collection of disease case data with longer time series.
5. Conclusions
In this study, we established a DLNM based on the nested GAM of meteorological element base variables. The model combines the flexibility of the GAM and DLNM and can capture the complex relationships between predictive variables and response variables, including nonlinear and lag effects. We used it to analyze the exposure–response relationship and lag effects between temperature and the increase in the number of CVD and CeVD patients and conducted subgroup analyses by sex, age, and CVD subtype. The differences in the impact of temperature on the increase in the number of CVD and CeVD patients in different subcategories were also studied, and sensitive populations were identified, providing technical support for the development of medical meteorological forecasting and warning services for CVD and CeVD. The main research conclusions are as follows:
- (1)
- From September 2016 to April 2018, the temperature in Haikou city showed an inverted J-shaped distribution with the number of CVD and CeVD patients, indicating that the impact of temperature on the risk of CVD and CeVD was mainly due to the cold effect. Regarding time lags, the cold effect began to appear and lasted much longer than the heat effect. A longer lag time led to a greater health risk from the accumulation of cold effects. High temperature manifested as an acute effect, which had a strong impact on the increase in the number of CVD and CeVD patients on the day of high temperature and then rapidly decreased. This could be summarized as an immediate high-temperature effect and a lagging low-temperature effect.
- (2)
- Regarding sex differences, the impact of low temperatures on women was weaker than that on men and lagged behind that on men, making women more susceptible to the effects of high temperatures. From the perspective of age classification, the lag period of the impact of low temperatures on the working-age group was longer than that on the elderly group, and the working-age group was more affected. A high temperature only had an impact on the risk of CVD and CeVD in the working-age group and reached its maximum on the day that the high temperature occurred. This may be related to the lifestyle habits of different groups of people. For example, in low-temperature weather, women and elderly people pay more attention to keeping warm and reducing outdoor activities. In high-temperature weather, elderly people perform fewer outdoor activities, while the working-age group still needs to go out to work. This indicated that attention should be given to the health risks of low-temperature weather conditions for men as well as the health risks of high temperatures for the working-age group. In addition, when comparing the impact of different CVD and CeVD subtypes on the risk of hypertension, it was found that the lag effect of low temperature on the risk of hypertension was the largest, with the longest lag period; the impact of low temperature on the three CVD and CeVD was significantly greater than that of high temperature; from the cumulative effect perspective, the impact of temperature on the risk of hypertension and CHD was greater than that of stroke.
Author Contributions
Conceptualization, methodology, and data collection: M.Z. and S.L.; data analysis, M.Z.; writing—original draft, M.Z.; supervision, J.Z.; project administration, M.Z.; writing—review and editing, M.Z. and Y.Z. All authors have read and agreed to the published version of the manuscript.
Funding
The work was supported by Hainan Provincial Natural Science Foundation of China: NO.420QN370, Hainan Province Science and Technology Special Fund:NO.ZDYF2022SHFZ036 and Hainan Provincial Natural Science Foundation of China (Grant Number: 821MS150).
Institutional Review Board Statement
Not applicable.
Informed Consent Statement
Not applicable.
Data Availability Statement
The original contributions presented in the study are included in the article, further inquiries can be directed to the corresponding authors.
Acknowledgments
We would like to thank all the participants in this study. We truly appreciate their time.
Conflicts of Interest
The authors declares no conflicts of interests.
Correction Statement
This article has been republished with a minor correction to resolve spelling and grammatical errors. This change does not affect the scientific content of the article.
References
- Available online: https://www.who.int/health-topics/cardiovascular-diseases#tab=tab_1 (accessed on 22 March 2024).
- The Writing Committee of the Report on Cardiovascular Health and Diseases in China. Summary of China Cardiovascular Health and Disease Report 2022. Chin. Circ. J. 2023, 38, 583–612. [Google Scholar]
- Park, S.; Kario, K.; Chia, Y.C.; Turana, Y.; Chen, C.H.; Buranakitjaroen, P.; Nailes, J.; Hoshide, S.; Siddique, S.; Sison, J. The influence of the ambient temperature on blood pressure and how it will affect the epidemiology of hypertension in Asia. J. Clin. Hypertens. 2020, 22, 438–444. [Google Scholar] [CrossRef] [PubMed]
- Huang, J.; Yang, Z. Correlation between air temperature, air pollutants, and the incidence of coronary heart disease in Liaoning Province, China: A retrospective, observational analysis. Ann. Palliat. Med. 2021, 10, 12412–12419. [Google Scholar] [CrossRef] [PubMed]
- Li, Z.; Wan, J.; Peng, S.; Wang, R.; Dai, Z.; Liu, C.; Feng, Y.; Xiang, H. Associations between cold spells of different time types and coronary heart disease severity. Environ. Pollut. 2024, 343, 123100. [Google Scholar] [CrossRef] [PubMed]
- Tian, Z.; Li, S.; Zhang, J.; Guo, Y. The characteristic of heat wave effects on coronary heart disease mortality in Beijing, China: A time series study. PLoS ONE 2013, 8, e77321. [Google Scholar] [CrossRef] [PubMed]
- Misailidou, M.; Pitsavos, C.; Panagiotakos, D.B.; Chrysohoou, C.; Stefanadis, C. Short-term effects of atmospheric temperature and humidity on morbidity from acute coronary syndromes in free of air pollution rural Greece. Eur. J. Cardiovasc. Prev. Rehabil. 2006, 13, 846–848. [Google Scholar] [CrossRef] [PubMed]
- San, Z. A Study on the Impact of Weather Changes on Cardiovascular System Diseases. Ph.D. Thesis, Lanzhou University, Lanzhou, China, 2013. [Google Scholar]
- Liu, B. A Study on the Response of Stroke and Coronary to Weather Change and the Prediction Model. Master’s Thesis, Lanzhou University, Lanzhou, China, 2014. [Google Scholar]
- Yu, Y. To Assess Effect of Temperature on Cardiovascular Diseases Out-Patient Visits in Shanghai Residents with Medical Insurance. Master’s Thesis, Fudan University, Shanghai, China, 2011. [Google Scholar]
- Lu, W.; Gu, S.; Sun, S.; Zhang, C.; Zhu, X. Quantitative lagged effects of extreme temperature on stroke deaths in a coastal city. Acta Meteorol. Sin. 2022, 80, 449–459. [Google Scholar] [CrossRef]
- Wang, Q. The Impact of Temperature and Air Pollution on Stroke and Acute Coronary Syndrome in Ningxia. Ph.D. Thesis, Ningxia Medical University, Yinchuan, China, 2022. [Google Scholar] [CrossRef]
- Mascarenhas, M.S.; Silva, D.D.D.; Nogueira, M.C.; Farias, W.C.M.; Ferreira, C.C.M.; Ferreira, L.C.M. The effect of air temperature on mortality from cerebrovascular diseases in Brazil between 1996 and 2017. Cien. Saude Colet. 2022, 27, 3295–3306. (In Portuguese) [Google Scholar] [CrossRef]
- Chen, H.; Zhang, X. Influences of temperature and humidity on cardiovascular disease among adults 65 years and older in China. Front. Public Health 2023, 10, 1079722. [Google Scholar] [CrossRef] [PubMed]
- Zhang, X.J.; Ma, W.P.; Zhao, N.Q.; Wang, X.L. Time series analysis of the association between ambient temperature and cerebrovascular morbidity in the elderly in Shanghai, China. Sci. Rep. 2016, 6, 19052. [Google Scholar] [CrossRef] [PubMed]
- Bai, L.; Li, Q.; Wang, J.; Lavigne, E.; Gasparrini, A.; Copes, R.; Yagouti, A.; Burnett, R.T.; Goldberg, M.S.; Cakmak, S.; et al. Increased coronary heart disease and stroke hospitalisations from ambient temperatures in Ontario. Heart 2018, 104, 673–679. [Google Scholar] [CrossRef] [PubMed]
- Pan, W.H.; Li, L.A.; Tsai, M.J. Temperature extremes and mortality from coronary heart disease and cerebral infarction in elderly Chinese. Lancet 1995, 345, 353–355. [Google Scholar] [CrossRef] [PubMed]
- Zhang, Y.; Xin, J.; Ma, P.; Feng, X.; Zhang, X.; Wang, S.; Zhang, J.; Feng, H.; Zheng, C. Interaction effects between ambient temperature and PM2.5 and O3 on mortality in Chengdu. China Environ. Sci. 2021, 41, 3887–3895. [Google Scholar] [CrossRef]
- Wang, D.Z.; Jiang, G.H.; Zhang, H.; Song, G.D.; Zhang, Y. Effect of air pollution on coronary heart disease mortality in Tianjin, 2001–2009: A time-series study. Zhonghua Liu Xing Bing Xue Za Zhi 2013, 34, 478–483. [Google Scholar] [PubMed]
- Fu, G.; Cheng, H.; Lu, Q.; Liu, H.; Zhang, X.; Zhang, X. The synergistic effect of high temperature and ozone on the number of deaths from circulatory system diseases in Shijiazhuang, China. Front. Public Health 2023, 11, 1266643. [Google Scholar] [CrossRef] [PubMed]
- Tan, Y. The Impact and Prediction of Meteorological Elements on Cardiovascular and Cerebrovascular Diseases in Different Regions of East and West China. Master’s Thesis, Chengdu University of Information Technology, Chengdu, China, 2019. [Google Scholar] [CrossRef]
- Dastoorpoor, M.; Khodadadi, N.; Khanjani, N.; Borsi, S.H. Physiological Equivalent Temperature (PET) index and cardiovascular hospital admissions in Ahvaz, southwest of Iran. Arch. Environ. Occup. Health 2022, 77, 653–661. [Google Scholar] [CrossRef] [PubMed]
- Cheng, B.J.; Li, H.; Meng, K.; Li, T.L.; Meng, X.C.; Wang, J.; Wang, C.; Jiang, N.; Sun, M.J.; Yang, L.S.; et al. Short-term effects of heatwaves on clinical and subclinical cardiovascular indicators in Chinese adults: A distributed lag analysis. Environ. Int. 2024, 183, 108358. [Google Scholar] [CrossRef] [PubMed]
- Zhang, Y.; Wang, S.G.; Zhang, J.; Feng, X.Y.; Zhang, X.L.; Hu, W.D.; Jia, X.W. Attributable risk assessment of the effects of different temperature on death of respiratory and cardiovascular diseases in Chengdu. Chin. Health Stat. 2019, 36, 818–823+828. [Google Scholar]
- Zhao, W. Research on the Response and Prediction Application of Circulating System Diseases to Weather and Climate Change in Zunyi Area. Master’s Thesis, Chengdu University of Information Technology, Chengdu, China, 2019. [Google Scholar]
- Wang, J.; Shi, Y.; Lu, S.; Feng, X.; Wang, S.; Zhang, Y. A Study on the Change Characteristics of Major Weather Sensitive Diseases and Their Medical Expenses in the County of Eastern and Western China. Desert Oasis Meteorol. 2019, 13, 133–140. [Google Scholar]
- Gasparrini, A. Modeling exposure-lag-response associations with distributed lag non-linear models. Stat. Med. 2014, 33, 881–899. [Google Scholar] [CrossRef] [PubMed]
- Tan, Y.; Yin, L.; Wang, S.; Chen, L.; Tan, Y.W.; Kang, Y.Z. Comparative research of the effects of temperature change on ischemic cardio-cere-brovascular diseases in different regions. J. Meteorol. Environ. 2019, 35, 94–99. [Google Scholar]
- Achebak, H.; Devolder, D.; Ballester, J. Trends in temperature-related age-specific and sex-specific mortality from cardiovascular diseases in Spain: A national time-series analysis. Lancet Planet. Health 2019, 3, e297–e306. [Google Scholar] [CrossRef] [PubMed]
- Rahman, M.M.; Garcia, E.; Lim, C.C.; Ghazipura, M.; Alam, N.; Palinkas, L.A.; McConnell, R.; Thurston, G. Temperature variability associations with cardiovascular and respiratory emergency department visits in Dhaka, Bangladesh. Environ. Int. 2022, 164, 107267. [Google Scholar] [CrossRef] [PubMed]
- GB/T 3095-2012; National Standards of the People’s Republic of China: Environmental Air Quality Standards. Standards Press of China: Beijing, China, 2012.
- Xiao, Y. Association of PM10 and O3 Exposure with Risk of Death from Specific Cardiovascular and Cerebrovascular Disease. Master’s Thesis, Chengdu Medical College, Chengdu, China, 2023. [Google Scholar]
- Gaines, B.; Kloog, I.; Zucker, I.; Ifergane, G.; Novack, V.; Libruder, C.; Hershkovitz, Y.; Sheffield, P.E.; Yitshak-Sade, M. Particulate Air Pollution Exposure and Stroke among Adults in Israel. Int. J. Environ. Res. Public Health 2023, 20, 1482. [Google Scholar] [CrossRef] [PubMed]

Disclaimer/Publisher’s Note: The statements, opinions and data contained in all publications are solely those of the individual author(s) and contributor(s) and not of MDPI and/or the editor(s). MDPI and/or the editor(s) disclaim responsibility for any injury to people or property resulting from any ideas, methods, instructions or products referred to in the content. |
© 2024 by the authors. Licensee MDPI, Basel, Switzerland. This article is an open access article distributed under the terms and conditions of the Creative Commons Attribution (CC BY) license (https://creativecommons.org/licenses/by/4.0/).