Abstract
To investigate the spatial and temporal changes in fractional vegetation coverage (FVC) and their driving forces in different regions of the Inner Mongolia section of the Yellow River Basin, this paper observed the spatial trends and stability of FVC in these regions based on the MOD13Q1 information regarding the 2000–2020 period as a data source. It used the dimidiate pixel model to invert FVC, and based on the centre of gravity migration model, the coefficient of variation and the Mann–Kendall and Sen’s slope estimator test, it studied the spatial variation trend and stability of FVC in the four relevant areas of the Inner Mongolia section; an attribution analysis using a geodetector was also conducted. The following results were found: (1) in terms of temporal FVC change in the relevant areas, from 2000 to 2020, the overall FVC showed an increasing trend, indicating an obvious hierarchy of change as per different seasonal scales (summer > growing season > fall > spring). There is a mutation point in FVC in different areas, and the FVC sequence is random. (2) Regarding spatial change, the overall FVC showed a trend of being high in the eastern regions and low in the western regions and low–high–low from the north to the south; the stability of the Hetao Irrigation District–Wuliangsuhai Area changed more significantly with the successive seasons, and the degraded areas of FVC were mainly distributed in the city centre of the Kundulun River–Daheihe River Area and in the Hetao Irrigation District in the summer. (3) In terms of driving factors, soil type had a relatively higher explanatory power regarding the Hetao Irrigation District–Wuliangsuhai Area, rainfall had a relatively higher explanatory power regarding the Morin River–Wuding River Area and the Kundulun River–Daheihe River Area, and land use had a relatively higher explanatory power regarding the Ten Kongtui–Heidaigou Area.
1. Introduction
The Inner Mongolia section of the Yellow River Basin is located in the middle and upper reaches of the Yellow River Basin. This section is distinctively marked by drought and paucity of rainfall, high evapotranspiration and fragile ecosystems [1]. Vegetation is an important component of the terrestrial ecosystems, and it serves as an important link between the soil, atmosphere and water resources in this section of the Yellow River Basin [2,3]. Moreover, vegetation plays an important role in regulating the climate, maintaining the biodiversity and balancing the ecosystem of this section [4]. Therefore, it is imperative to investigate the change in fractional vegetation coverage (FVC) and its driving mechanism in the Inner Mongolia section of the Yellow River Basin, with the aim of ensuring this region’s ecological restoration and management.
In this context, one must keep in mind the argument that the normalised difference vegetation index (NDVI) can reflect a region’s vegetation growth in a holistic manner; many scholars across the world have studied the changes in FVC in various regions based on the associated NDVI data [5,6]. However, due to easy saturation and noise in the NDVI data [7], their sensitivity to high FVC remains low. Fortunately, these issues can be effectively avoided by converting NDVI data into FVC data through the dimidiate pixel model [8]. In fact, in the recent years, many scholars in China and abroad have studied the spatial and temporal changes in FVC [9,10], their drivers [11], prediction of FVC growth [12,13] and their response to climate change [14,15] in different regions based on various kinds of remotely sensed data. One of these regions is the Inner Mongolia section of the Yellow River Basin. However, most of the studies regarding the FVC changes in this watershed section have hitherto used only remotely sensed data of low spatial resolution and low accuracy [16]. Moreover, there exist obvious differences in terms of natural conditions, land use, industrial expansion and agricultural development in different parts of the Inner Mongolia section of the Yellow River Basin; unfortunately, the existing studies have avoided considering the various dominant driving factors of FVC changes in these parts and overlooked not only the FVC differences in these regions over different time periods but also the interactions among the driving factors behind such regionally specific changes [17].
Based on the abovementioned information, in this study, we utilised the Google Earth Engine (GEE) platform and the MOD13Q1 product as the data sources in our study of the spatial and temporal changes in FVC in different patches of the Inner Mongolia section of the Yellow River Basin over the 2000–2020 period. In particular, we studied the climate factors (temperature and precipitation), topographic factors (altitude, slope and aspect), natural factors (vegetation type, soil type and land use) and anthropogenic factors (population density and gross domestic product (GDP)) relevant to these different patches. Additionally, we used a geodetector to analyse the degrees of influence of these factors and the interactions among them with respect to FVC changes at different time intervals (5-year intervals) and to detect the main drivers of the concomitant FVC changes. Overall, we conducted these studies with the aim of providing support regarding the restoration and construction of a robust ecological environment in this watershed section of China.
2. Materials and Methods
2.1. Study Area Overview
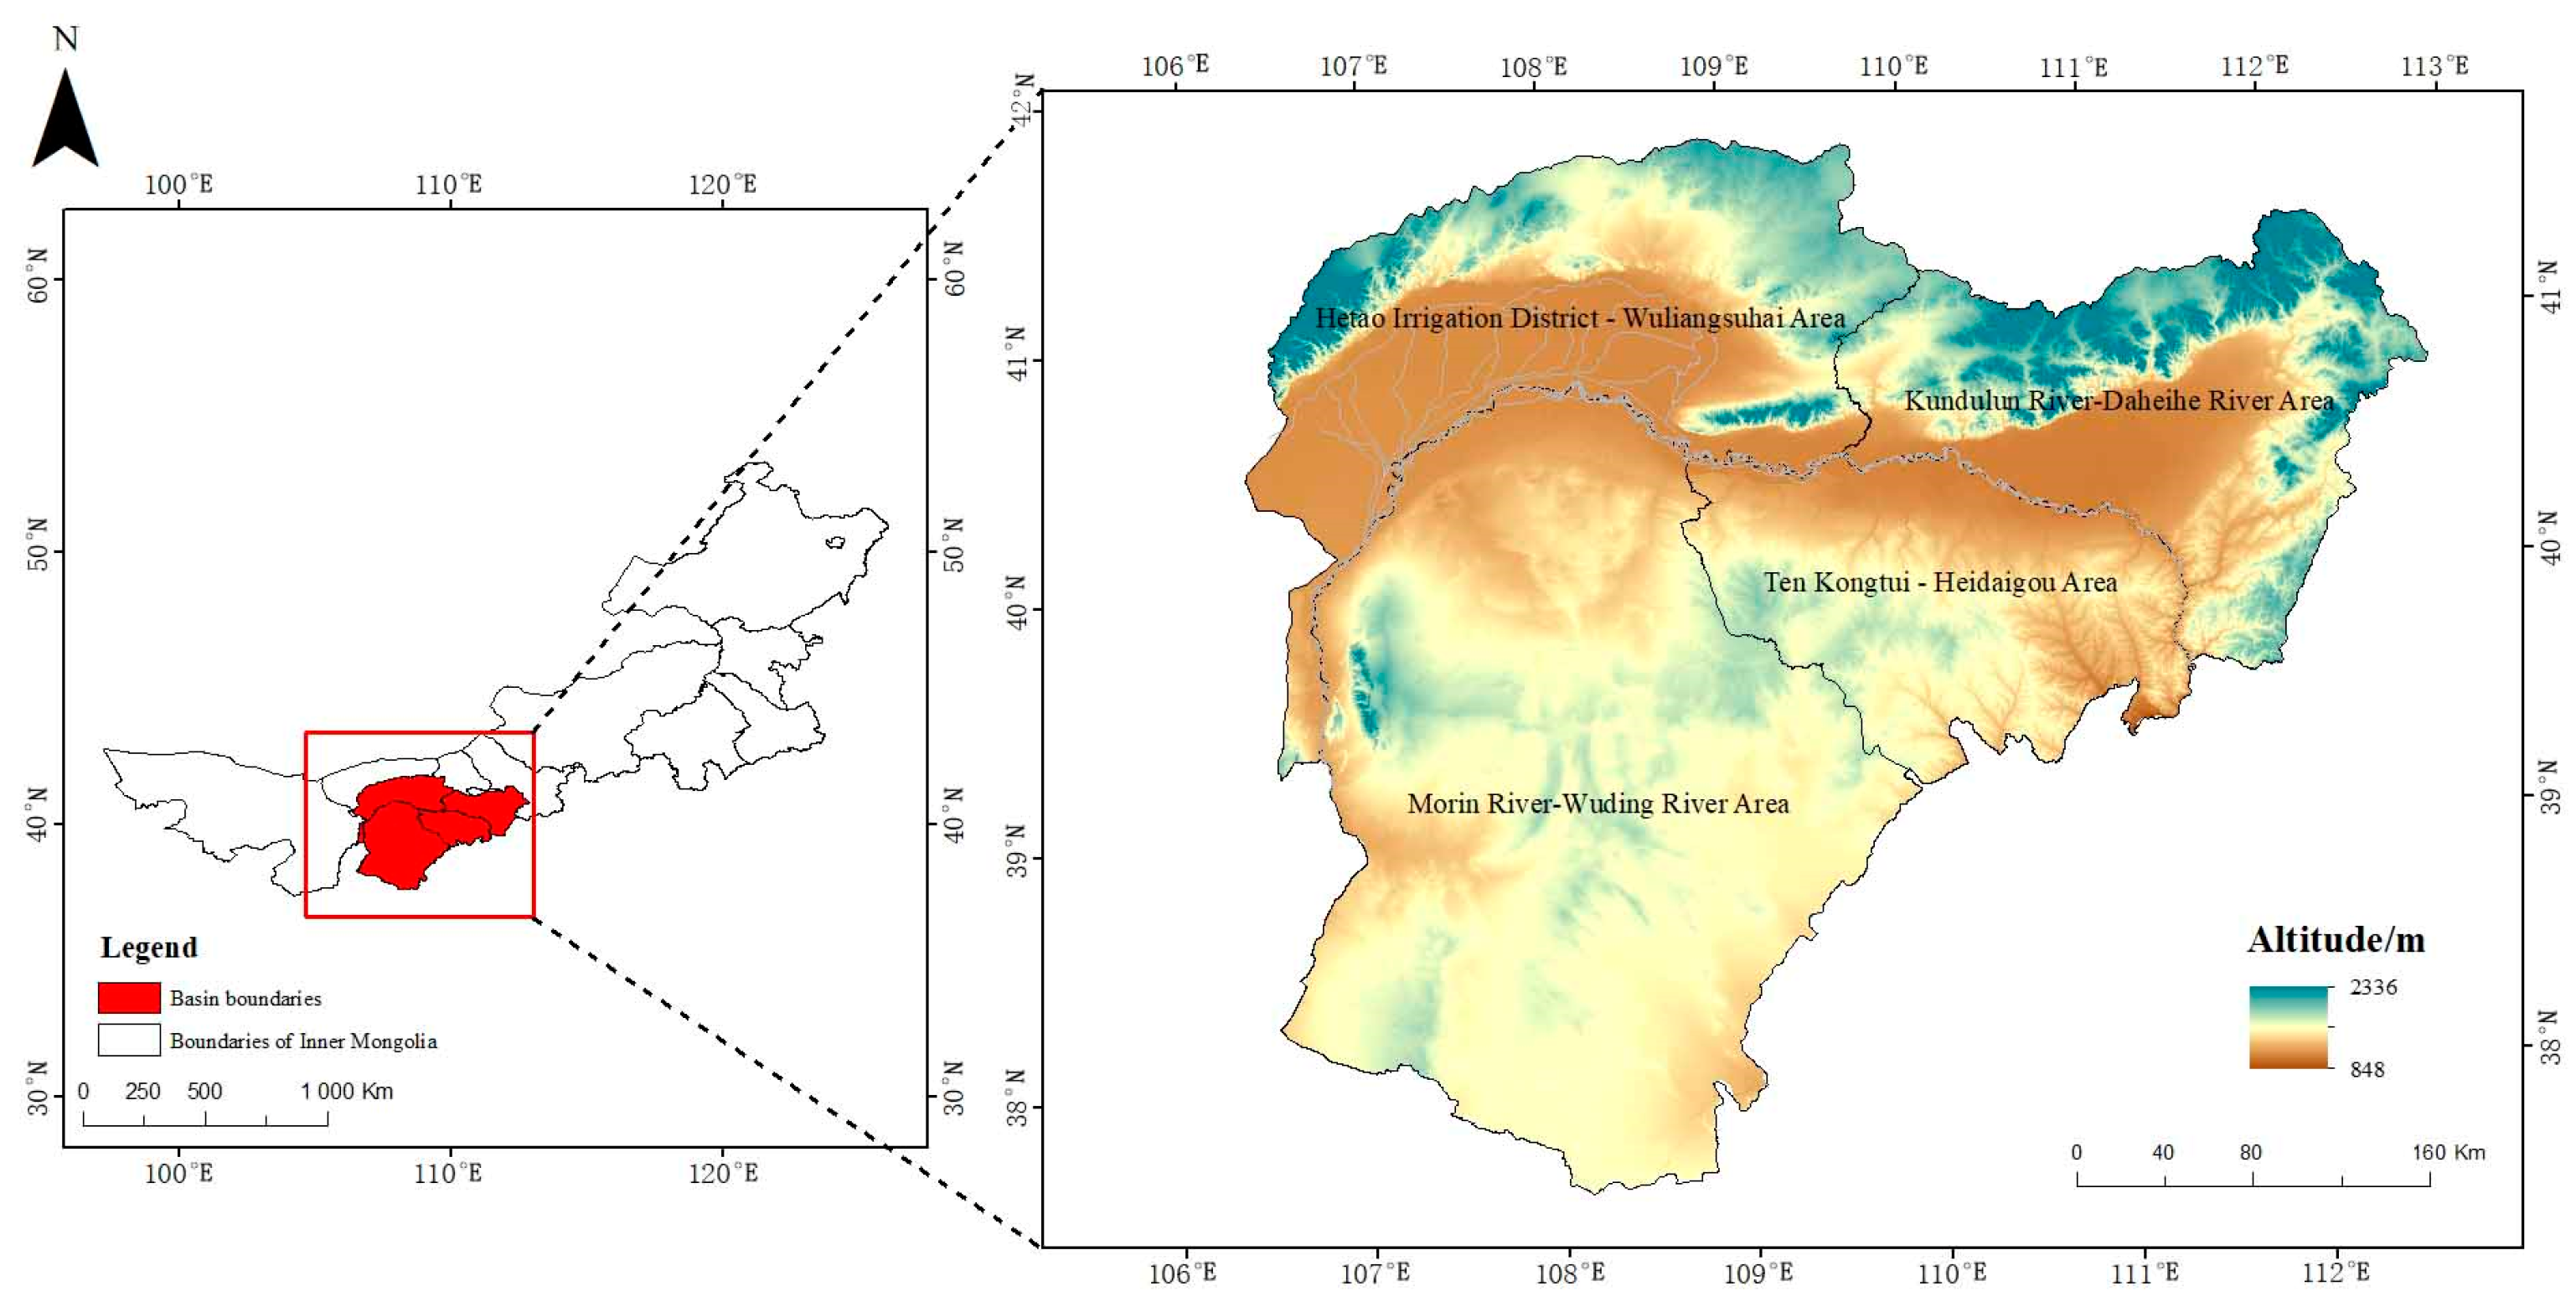
The Inner Mongolia section of the Yellow River Basin is located in the middle and upper reaches of the Yellow River Basin, which flows through seven leagues (Hohhot, Baotou, Wuhai, Ordos, Bayannur, Alashan and Ulanqab)—from Shizuishan to the exit point of Jungar Banner in Ordos City—and has a total length of 830 km and a total area of approximately 152,000 km2, accounting for 19% of the total area of the Yellow River Basin. To be precise, the Inner Mongolia section comprises the Ulanbuhe Desert, the Hetao Irrigation District, the Tumochuan Plain and the Kubuqi Desert, receiving an average annual temperature of about 6.7 °C and annual precipitation in the range of 120–420 mm. Thus, the section has a variety of topographic features: it is constituted by alluvial plains, mountains, hills, plateaus, deserts and lakes, all of which increase the richness of the vegetation species found here. In this context, to analyse the FVC changes in different patches of the Inner Mongolia section, we divided the main stream of the Yellow River in the basin into two parts (north and south); moreover, in accordance with the upstream and downstream relationship and the ecological functional attributes [18], we divided the Inner Mongolia section into four patches: the Hetao Irrigation District–Wuliangsuhai Area (agricultural development area), the Kundulun River–Daheihe River Area (town construction area), the Ten Kongtui–Heidaigou Area (hilly and gully ecological functional areas), and the Morin River–Wuding River Area (Ordos Plateau ecological function area) (Figure 1).

Figure 1.
Schematic diagram of the study area.
2.2. Data Sources and Preprocessing
Table 1 presents the data types and sources considered by this study. We utilised the GEE cloud platform to retrieve the MOD13Q1 product data regarding the Inner Mongolia section of the Yellow River Basin for the 2000–2020 period, cropped by vector boundaries, and we used the maximum value synthesis method to generate the respective 21-year monthly NDVI imagery dataset. Using the IDL8.5 programming software in ENVI, we resorted to online programming to calculate the FVC of the Inner Mongolia section in the spring (March–May), summer (June–August), fall (September–November) and growing seasons (April–October).

Table 1.
Data source.
In the ArcGIS software, we interpolated the data from a total of 40 meteorological stations in and around the study area by Kriging, using the Geostatistical Analyst module to obtain the raster data on precipitation and air temperature. Moreover, we used the 3D Analyst tool to analyse srtm dem data and obtain the raster data of slope and aspect, and we utilised resampling and projection raster functions to incorporate the climatic factors, terrain factors, anthropogenic factors and natural factors into the raster data with the same size and projection as the those of the NDVI data pixels. Further, we used the reclassification function to classify the natural factors into various fixed categories: the land-use types were classified into six categories, the vegetation types were classified into eight categories, and the soil types were classified into 13 categories. Additionally, we used the natural discontinuity method to classify the climatic factors, terrain factors and anthropogenic factors into nine categories. We also created the fishing net tool to generate a 5 km x 5 km grid, containing a total of 10,618 sampling points, with the aim of extracting the spatially corresponding values of impact factors and FVC attributes and finally import them into the geodetector software for processing.
2.3. Estimation of FVC
The following equation was used to calculate FVC:
where FVC is the fractional vegetation coverage, NDVI is the normalised difference vegetation index, is the portion of the image completely covered by vegetation, and is the portion of the image not completely covered by vegetation; their theoretical values are close to 1 and 0, respectively. Notably, combined with the actual situation of the study area, 5% and 95% were the cumulative frequencies of NDVI that were finally selected to represent the and . According to the work of Zhu et al. [17], we assumed that an area in the Inner Mongolia section could be classified as having low fractional vegetation cover (0 ≤ NDVI < 0.1), medium–low fractional vegetation cover (0.1 ≤ NDVI < 0.3), medium fractional vegetation cover (0.3 ≤ NDVI < 0.45), medium–high fractional vegetation cover (0.45 ≤ NDVI < 0.6) or high fractional vegetation cover (0.6 ≤ NDVI < 1).
2.4. Trend Treatment
In order to eliminate the trend component from the time series data and separate the trend and fluctuation terms of the data so as to reveal the essential characteristics of the data, the data were detrended in this study [19,20], using the following equations:
where is the FVC after detrending in year , is the original FVC in year , and k is the original interannual trend.
2.5. Stabilisation Analysis
In this study, we utilised the coefficient of variation (CV) to express the relative degree of fluctuation in vegetation cover [21] using the equation:
where CV is the coefficient of variation, n is the number of years considered, is the FVC in the ith year, and denotes the average value of FVC over the 2000–2020 period. A larger CV value would indicate a lower degree of stability whereas a smaller CV value would signify a higher degree of stability. Referring to the related studies by Kui et al. [22], we categorised CV into five grades: low volatility (<0.05), relatively low volatility (0.05 ≤ CV < 0.1), medium volatility (0.1 ≤ CV < 0.15), relatively high volatility (0.15 ≤ CV < 0.2) and high volatility (≥0.2).
2.6. Centre of Gravity Migration Analysis
We used the centre of gravity migration model [23] to analyse the direction of migration of different FVC types among the watersheds over the 2000–2020 period, using the following equations:
In the above equations, n is the number of patches of a particular FVC in year t, is the longitude of a certain FVC in year t, is the latitude of a certain FVC in year t, is the area of the ith patch of that FVC in year t, is the longitude coordinates of the geometric centre of gravity of the ith patch of that FVC in year t and is the longitude coordinates of the geometric centre of gravity of the ith patch of that FVC in year t.
2.7. Trends Analysis
We combined the Theil–Sen trend analysis with the Mann–Kendall significance test for the purpose of calculating trend analysis [24,25]; the Theil–Sen trend analysis was calculated as per the equation:
where Median is the median function, and denote the FVC values in the ith and jth years of the corresponding image element, and i and j are the corresponding years. A value of β > 0 would indicate an increasing trend of FVC while a relatively lower value would indicate a decreasing trend of FVC.
The Mann–Kendall significance [26,27] was calculated as per the following equations:
In the above equations, n is the number of years tested, Var is the variance function, Sgn is the sign function, is the FVC data in year j, Z is the significance test, and S is the normal distribution. The significance levels given in this paper are 0.05 and 0.01, which show an increasing trend when Z > 0 and a decreasing trend vice versa. means that it passes the 95% and 99% significance level tests, respectively.
The Mann–Kendall significance test allows for both trend analysis and mutation point testing [28,29]. Order columns are first constructed for the time series of the sample statistic:
where denotes the cumulative number of times when the value of at time i is greater than the value at time j.
The statistic in the case where the original sequence is random is defined as follows:
where is the mean, is the variance, and is the statistic series calculated according to the time series obeying normal distribution. Using this method to calculate the inverse series to obtain , the intersection of and in the confidence interval is the mutation point, the given significance level is 0.05, and the critical value of the statistic is ±1.96. If , then it shows an upward trend, and vice versa shows a downward trend; if exceeds the critical value, then it indicates that the sequence is in an upward or downward trend.
In accordance with the work of Liu and Guo et al. [30], and using the Z and β values, we classified the trend of FVC change into six categories, as shown in Table 2.
Table 2.
Fractional vegetation cover (FVC) change trend categories.
2.8. Geodetector
- (1)
- Factor Detection
We used the divergence and factor detection module in the geodetector [31,32] to detect the degree of influence of different factors on FVC, using the following equations:
In the above equations, q is the explanatory power of different factors regarding vegetation cover (the value range of q is [0, 1]; the larger the value of q, the greater the influence, and vice versa); h is the classification or partition number of the independent variable X; L is the total number of classifications or partitions; and N refer to the number of units in the stratum h and the region; and refer to the variance of each partition and the variance of the whole region’s Y-value, respectively; and SSW and SST refer to the total variance of the stratum and the total variance of the whole region, respectively.
- (2)
- Interaction Detection
We also detected the interaction effect of two different factors on FVC [31]; the interaction types are shown in Table 3.
Table 3.
Interaction types of the driving factors (X1, X2) of FVC.
3. Results
3.1. Characterisation of FVC Dynamics
3.1.1. Analysis of Changes in FVC Time in Different Areas
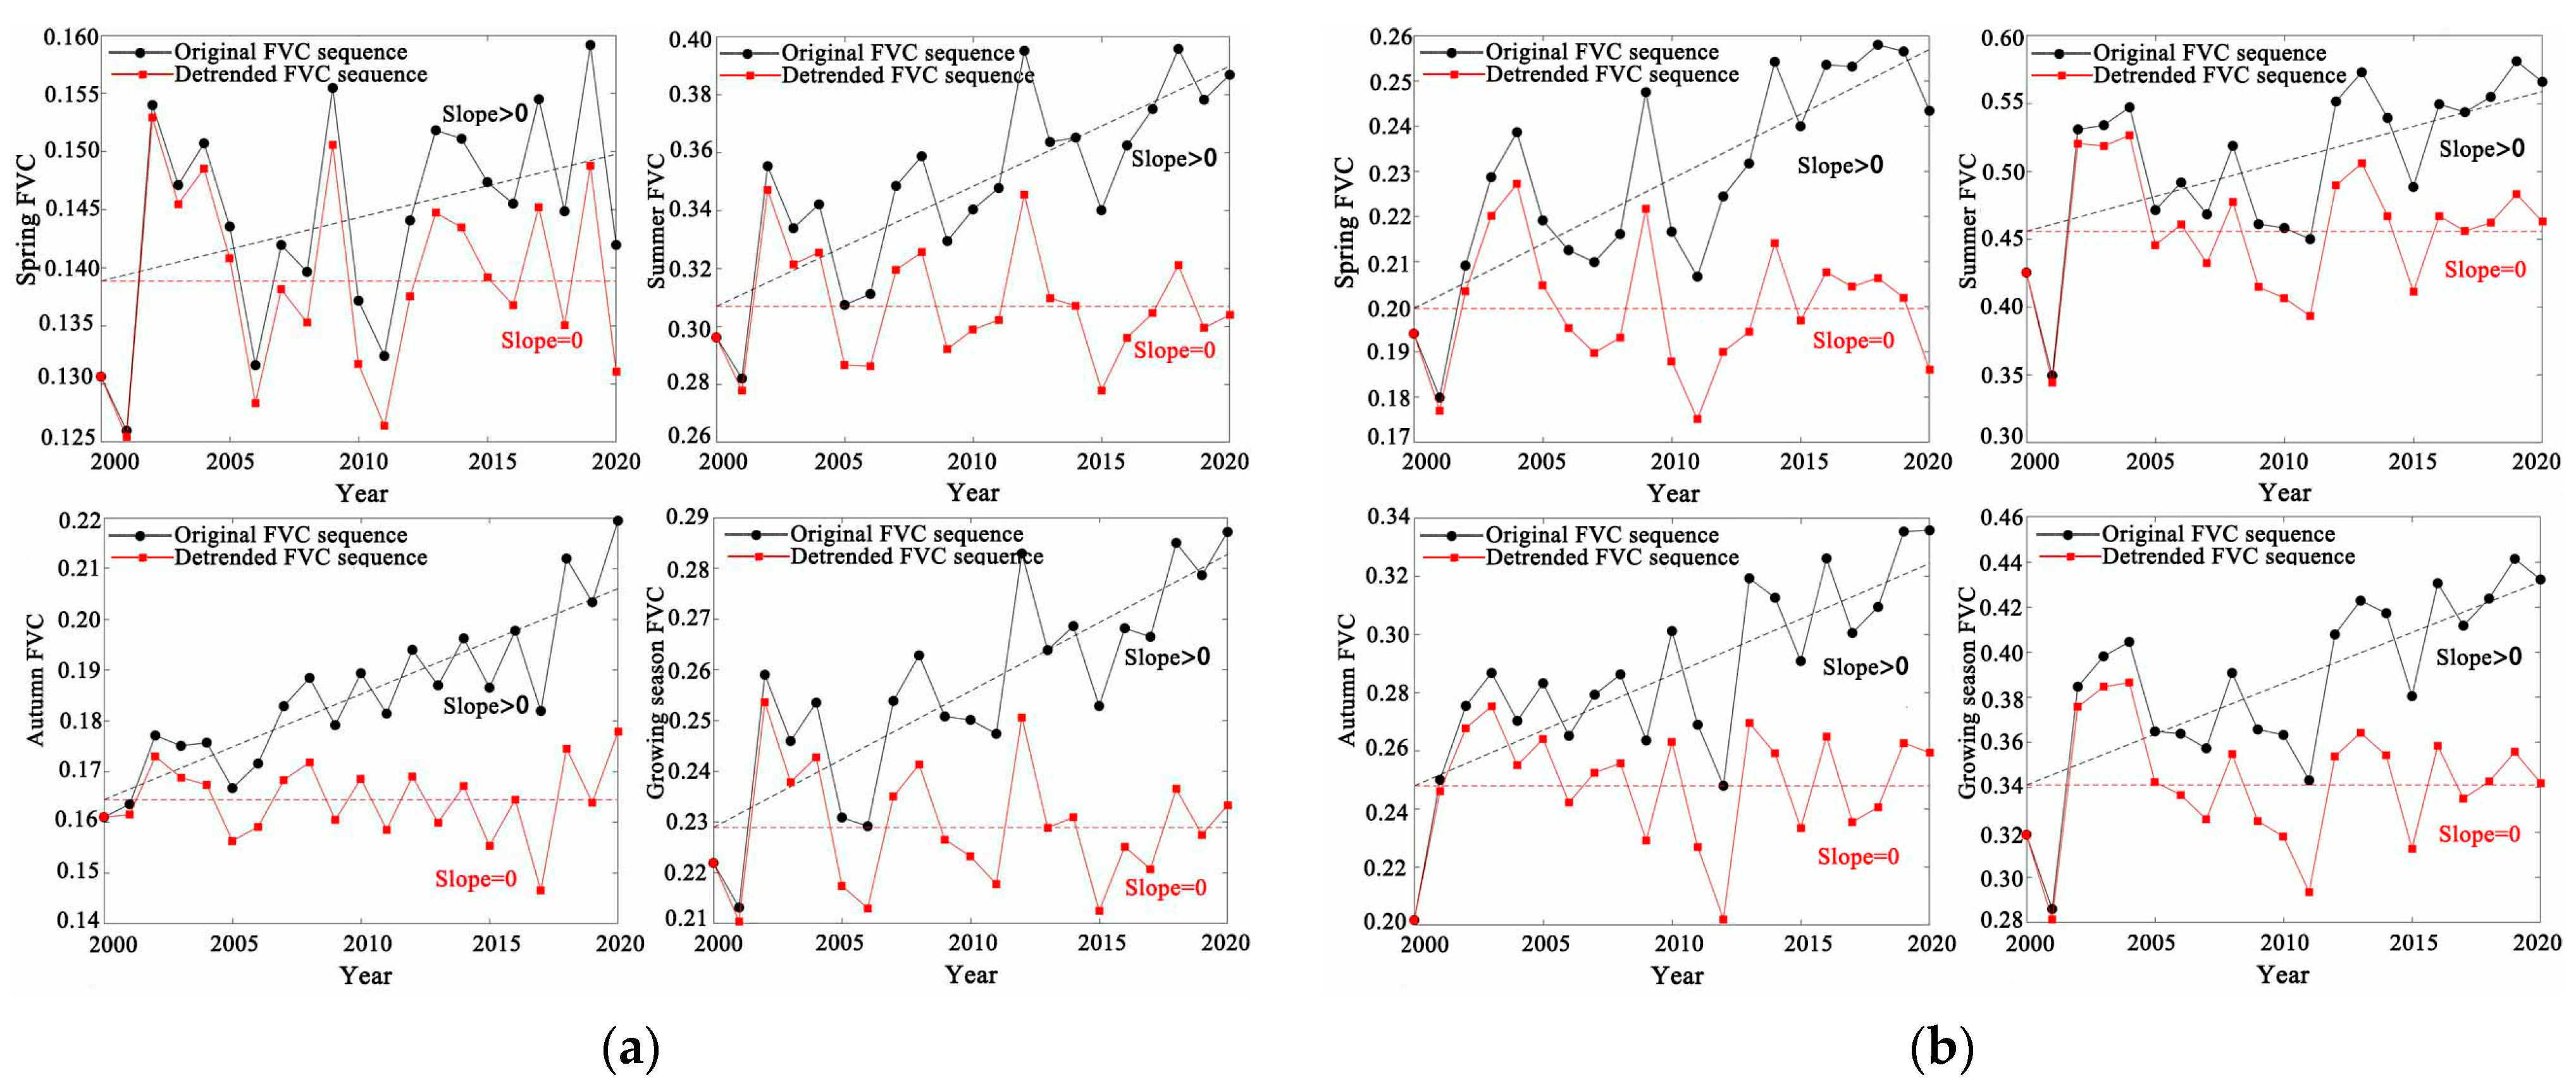
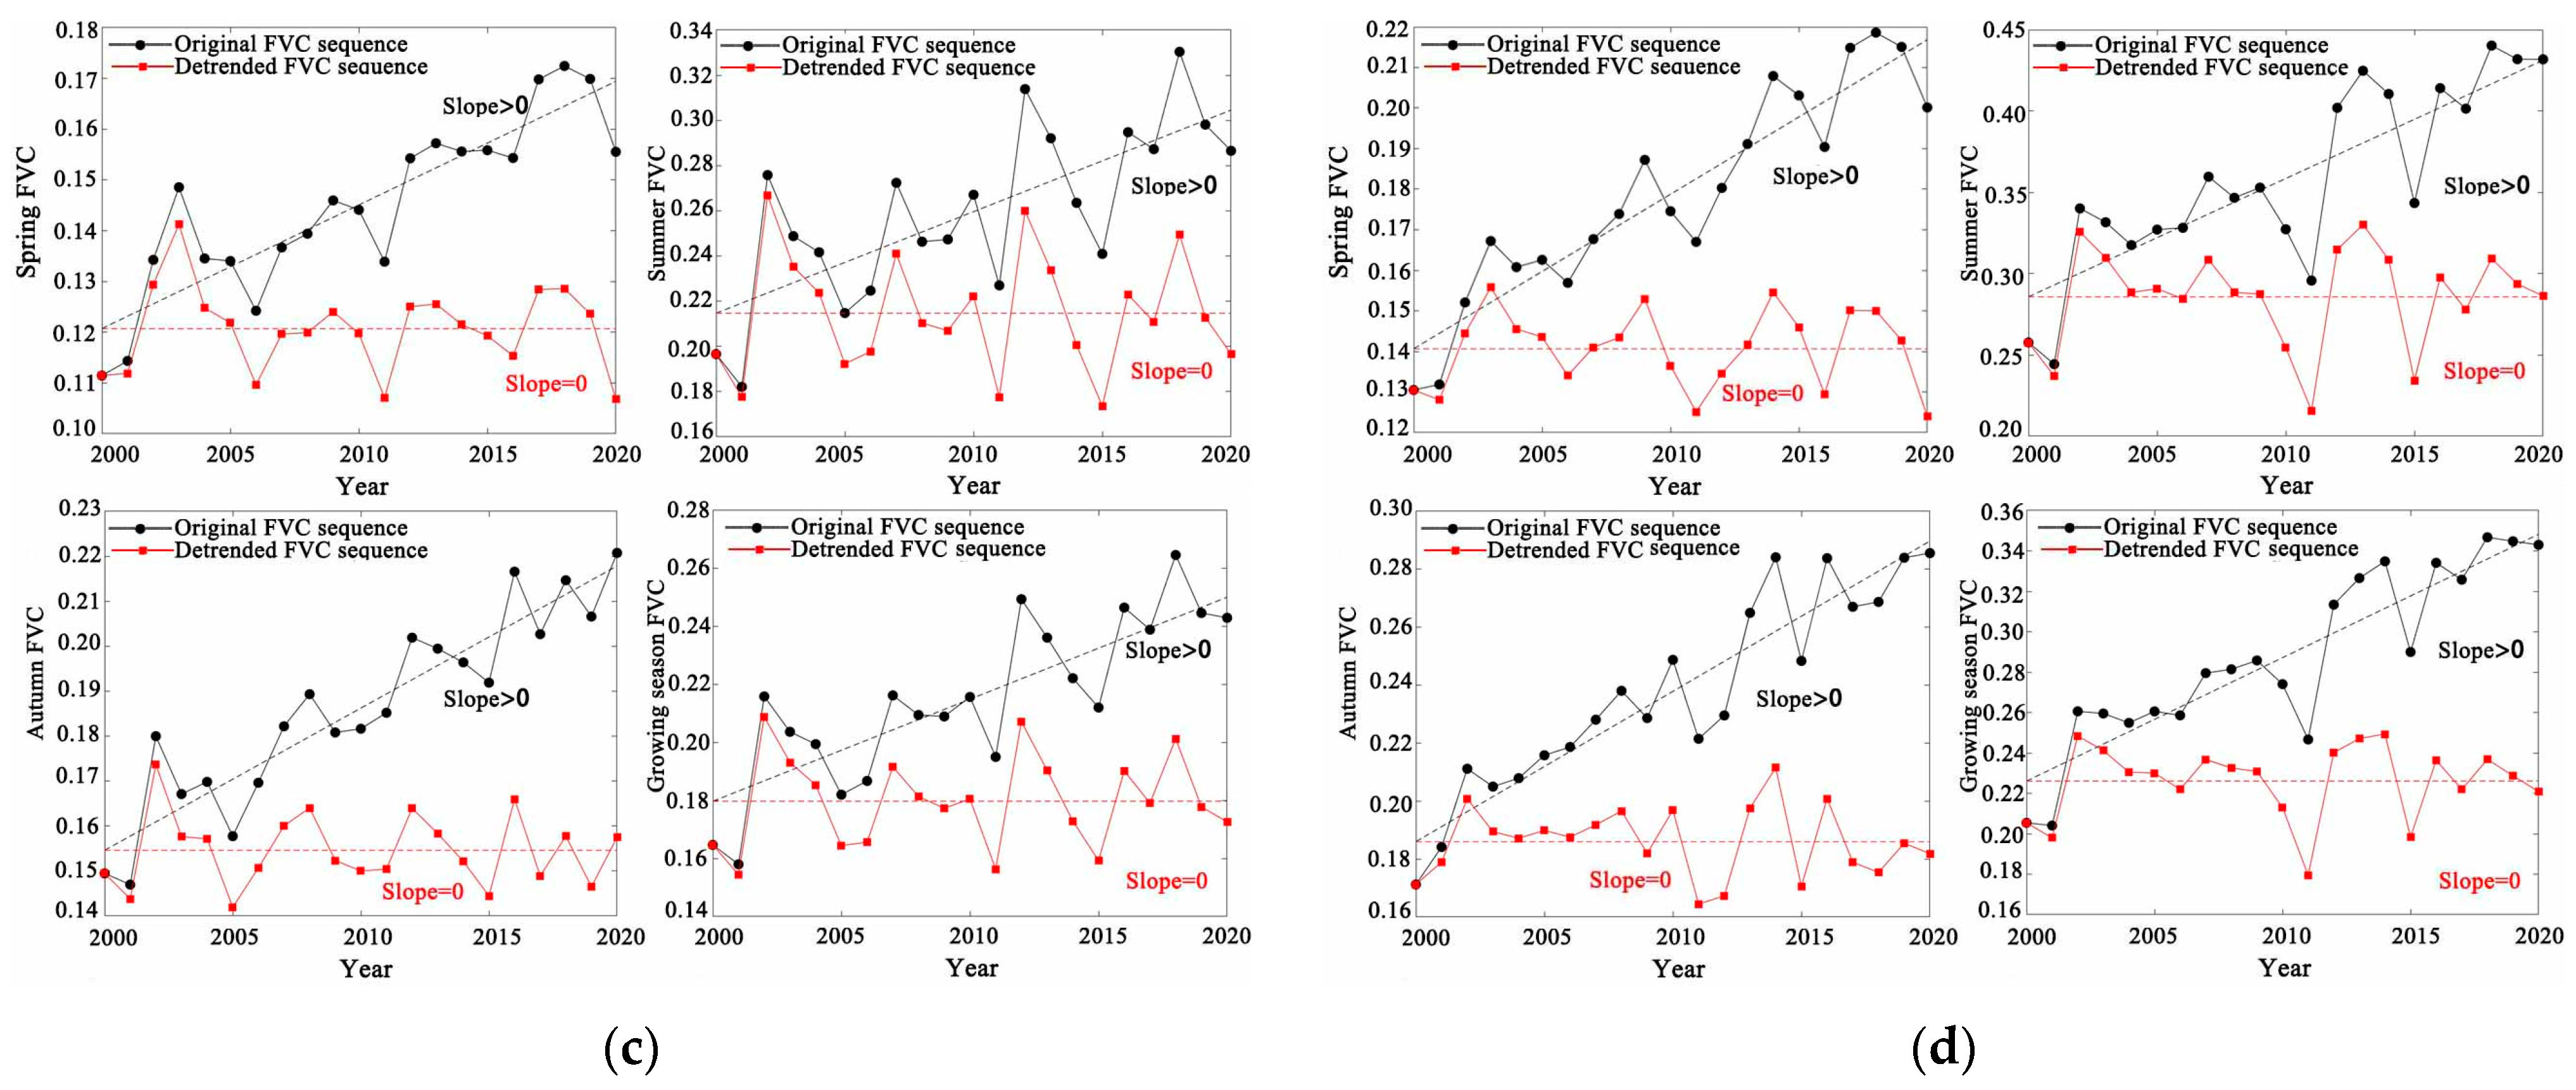
As illustrated in Figure 2, the FVC of different areas in the Inner Mongolia section showed an overall increasing trend over the past 21 years; this trend had an obvious hierarchy (summer > growing season > autumn > spring). FVC in the Hetao Irrigation District–Wuliangsuhai Area varies significantly with the seasons, with a significant upward trend in summer compared with spring, and a rapid decline in autumn, probably due to the fact that this area is a major grain-producing area, with a large area of agricultural cultivation, and the harvesting of crops in autumn leads to a rapid decline in FVC from the higher level in summer. Meanwhile, the FVC in the Kundulun River–Daheihe River Area is relatively good, and its peak appeared at 0.58 in the summer of 2019. Further, the FVC in the Morin River–Wuding River Area is poor compared to other basins, and its fluctuation degree is larger in the summer, and the overall fluctuation is in the range of 0.18–0.33. Finally, the FVC in the Ten Kongtui–Heidaigou Area showed a significant increase in the 2015–2018 period, having a maximum value of 0.44 in 2018.
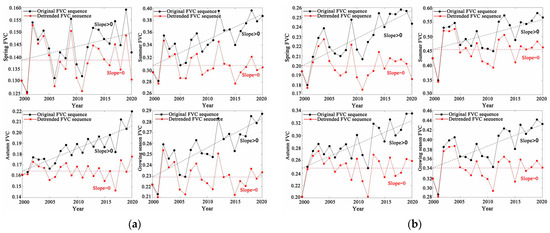
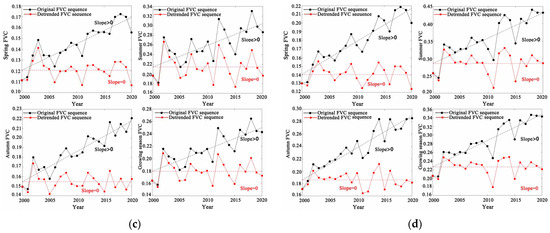
Figure 2.
Interannual trends of FVC before and after de-trending in different slices of the Inner Mongolia section of the Yellow River Basin (2000–2020), (a) Hetao Irrigation District–Wuliangsuhai Area; (b) Kundulun River–Daheihe River Area; (c) Morin River–Wuding River Area; (d) Ten Kongtui–Heidaigou Area.
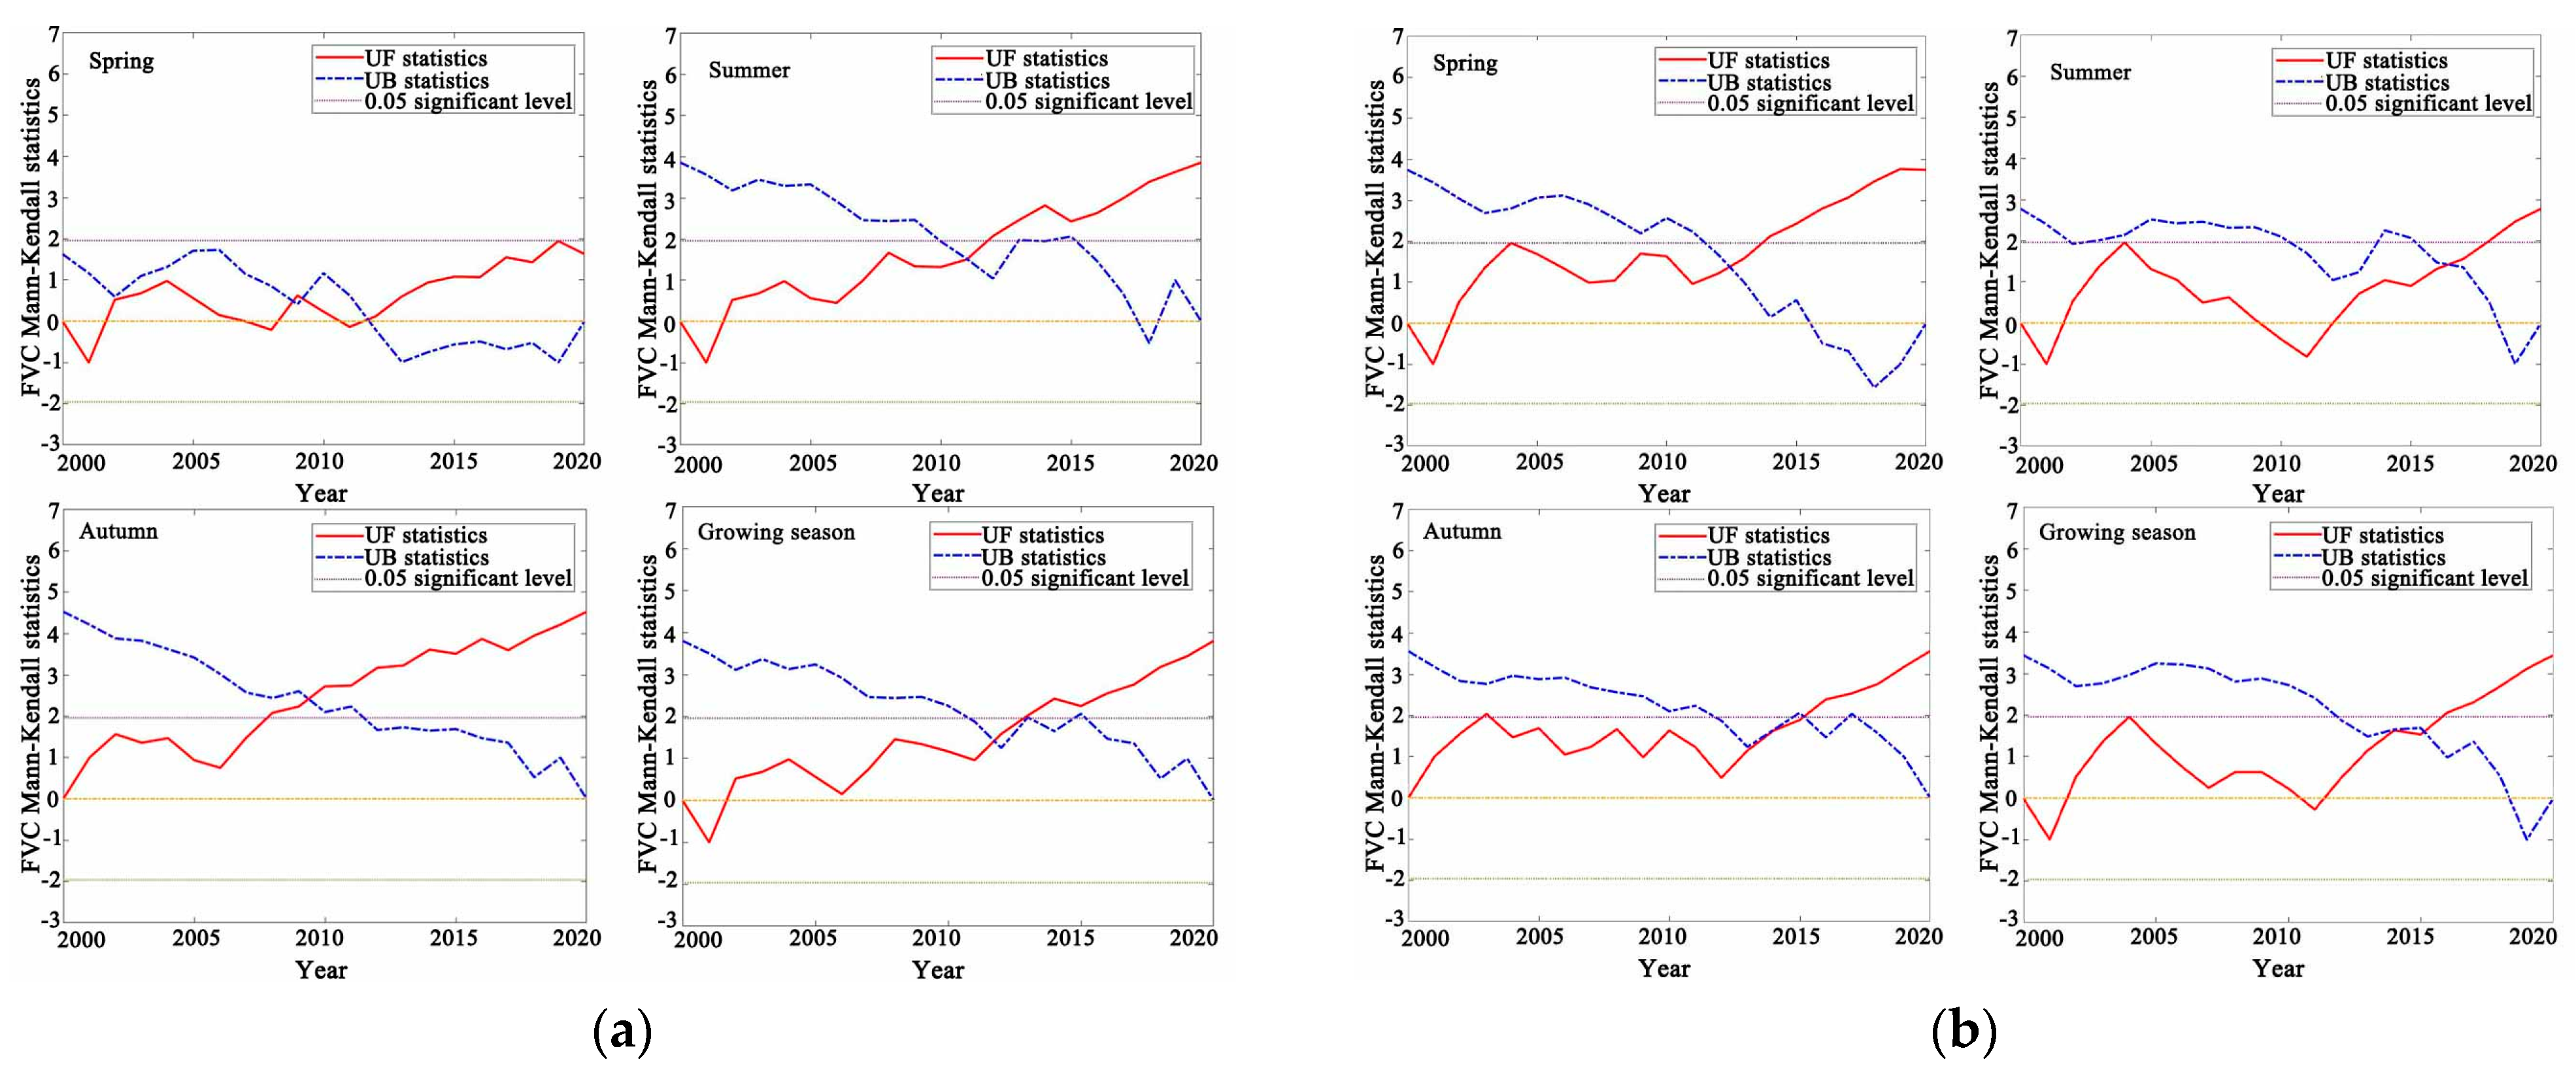
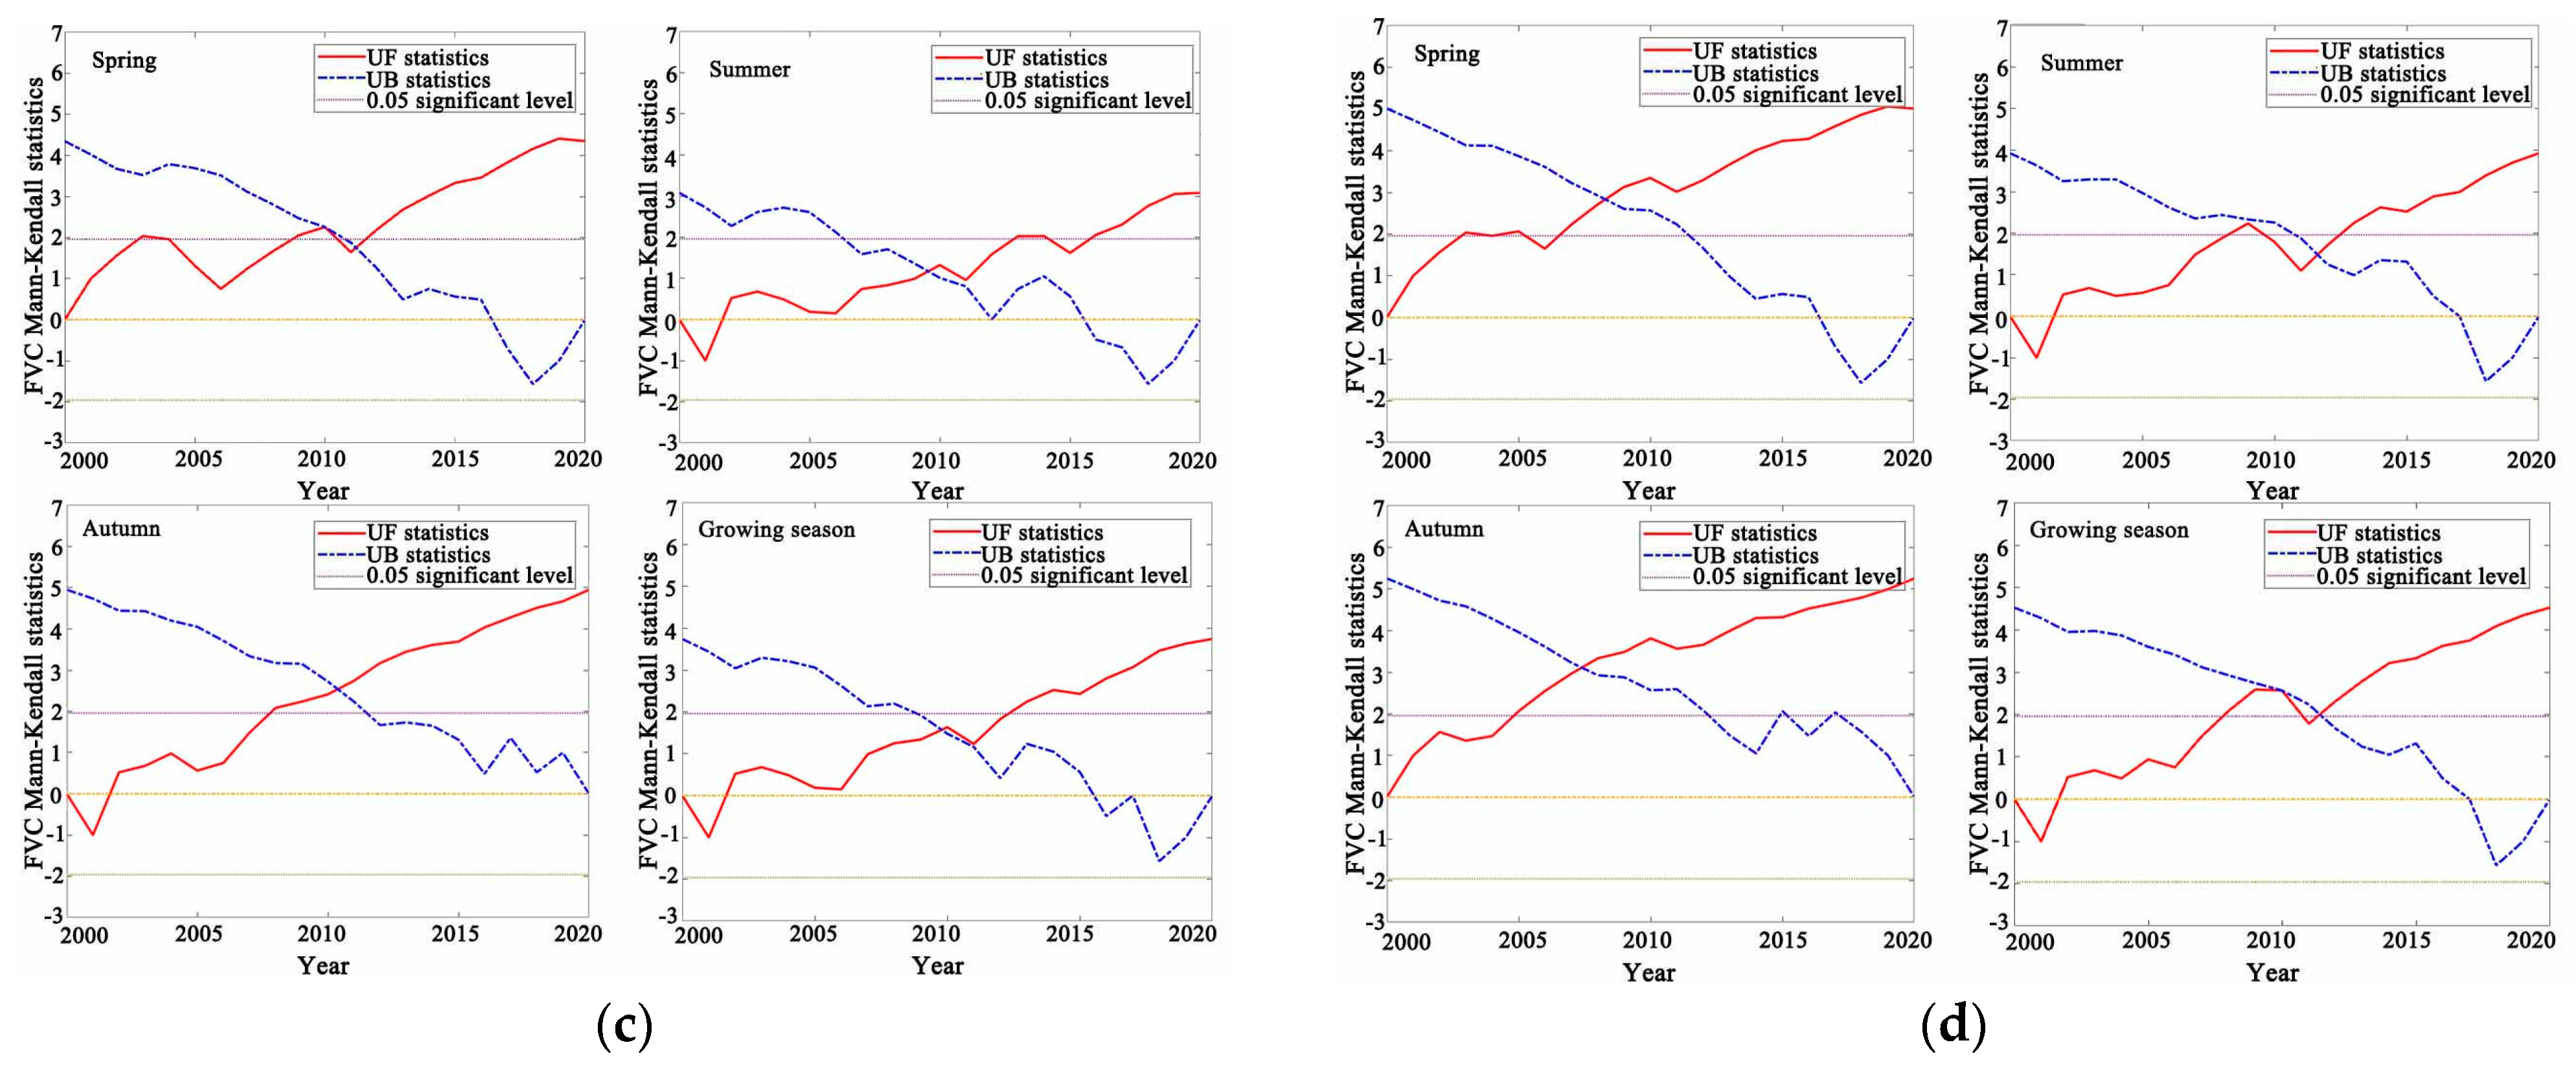
3.1.2. Mutational Analysis of FVC in Different Areas
As shown in Figure 3, the intersection of FVC UF and UB in the Hetao Irrigation District–Wuliangsuhai Area at the given significance level of α = 0.05 at all seasonal scales except autumn appeared during 2011–2012, and the UF curve exceeded the critical value after 2012, which indicated that the trend of increase in FVC was very obvious, whereas the intersection of UF and UB in autumn was more than 1.96, which it indicates that the test is not passed; thus, it is not mutable. The UF curve of FVC in the Kundulun River–Daheihe River Area slice in spring exceeded the critical value after 2014, and the mutation point was between 2012 and 2013, the summer mutation point was between 2016 and 2017, and the autumn and growing season mutation point was in 2014. The UF curve of FVC during spring in the Morin River–Wuding River Area exceeded 1.96 near 2012, and its mutation point existed between 2011 and 2012. During summer, autumn and the growing season, the UF curve ranged between −1.96 and 0 near 2000–2002, indicating that the trend of change and mutation were not obvious and the sequence showed a decreasing trend, and the summer and growing season mutation point existed during 2009–2010. In the summer and growing seasons, the mutation point was found in 2011–2012 in the area of the Ten Kongtui–Heidaigou Area.
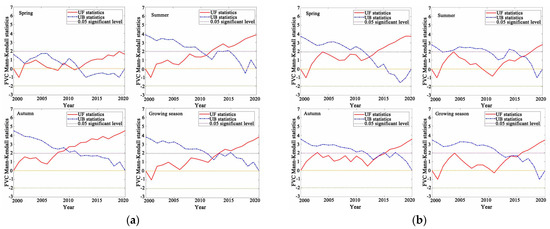
Figure 3.
Mann−Kendall mutation test for FVC in different slices of the Inner Mongolia section of the Yellow River Basin (2000−2020): (a) Hetao Irrigation District−Wuliangsuhai Area; (b) Kundulun River−Daheihe River Area; (c) Morin River−Wuding River Area; (d) Ten Kongtui−Heidaigou Area.
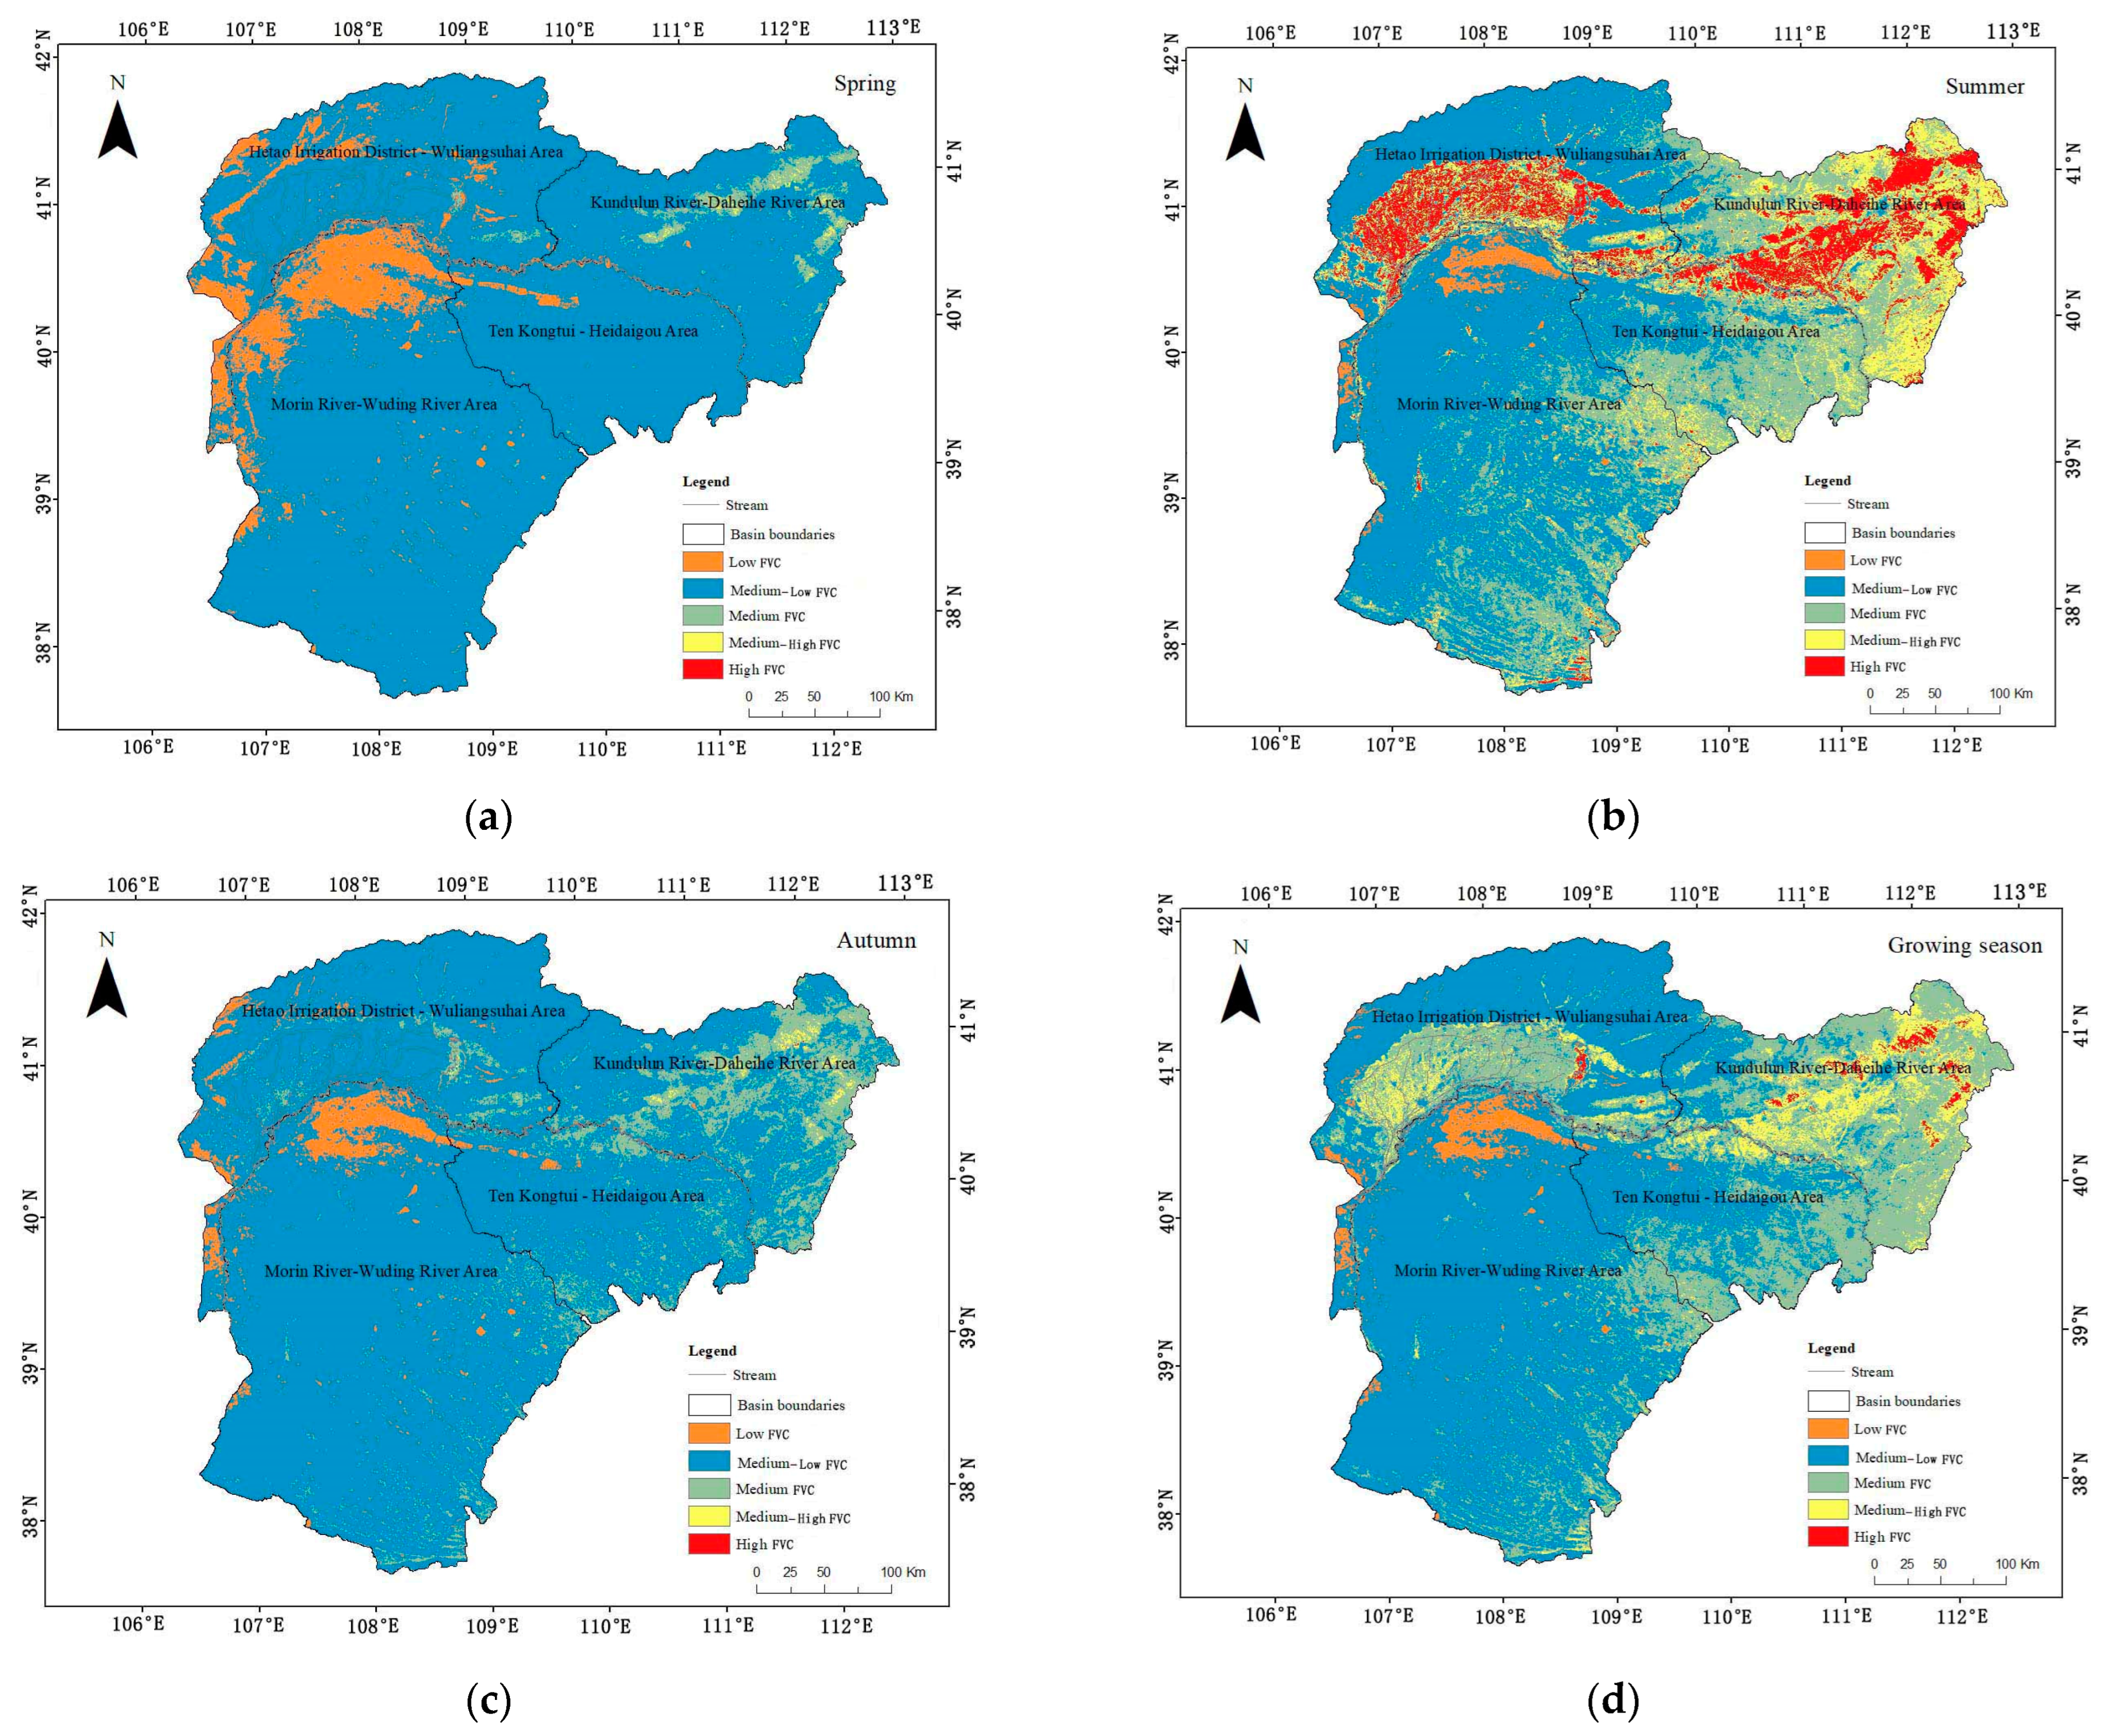
3.2. Characteristics of Spatial Variation in FVC
As shown in Figure 4, the proportion of FVC in each studied area of the Inner Mongolia section varied across different seasons in the watersheds; moreover, all these areas were reportedly dominated by medium–low FVC. The FVC was higher in the summer season, when the area with high FVC in the Kundulun River–Daheihe River Area amounted to 7128.34 km2, accounting for 25.60% of the total area of the Yellow River Basin; meanwhile, the Morin River–Wuding River Area accounted for the smallest proportion of FVC, accounting for 0.69% of the total area of the basin in the same season. The FVC proportion decreased in the spring season, when the percentage of medium–low FVC went up to 90% or more in all four areas comprising the Inner Mongolia section.
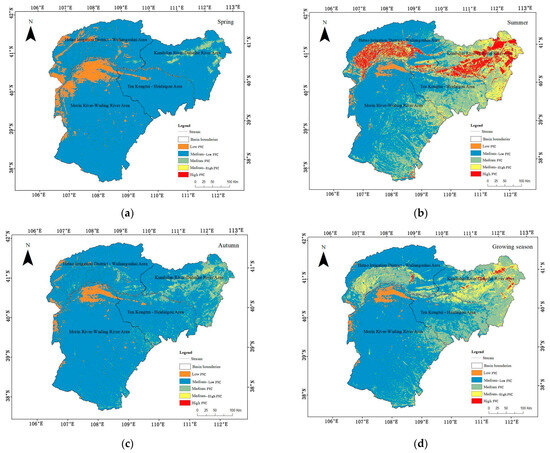
Figure 4.
Spatial distribution pattern of FVC in the Inner Mongolia section of the Yellow River Basin (2000–2020): (a) spring; (b) summer; (c) autumn; (d) growing season.
Notably, the spatial distribution of FVC in this section showed obvious geographical differences. Specifically, the Kundulun River–Daheihe River Area had a relatively higher FVC. Meanwhile, the Hetao Irrigation District–Wuliangsuhai Area was reportedly dominated by crops, and its FVC, measured with regard to the abovementioned time scale, was deemed more significant. Additionally, the Ten Kongtui–Heidaigou Area and the Morin River–Wuding River Area showed relatively insignificant differences regarding the changes in their FVCs across different seasons; primarily, they had medium–low and medium FVCs. Notably, a comparison of the spatial distribution of FVC showed that an overall trend was FVC weakening from east to west, mainly being related to the topography and precipitation distribution of the watershed.
3.3. Analysis of Spatial Trends in FVC
3.3.1. Stability Analysis of FVC
As shown in Figure 5, the degree of FVC fluctuation in summer was high in the four studied areas, which were marked by relatively high as well as high volatilities. The Ten Kongtui–Heidaigou Area accounted for a larger share of the fluctuation (comprising approximately 83.66% of the Inner Mongolia section). In spring, however, the degree of FVC fluctuation considerably decreased and the FVC stability improved, mainly in the Hetao Irrigation District–Wuliangsuhai Area and the Kundulun River–Daheihe River Area.
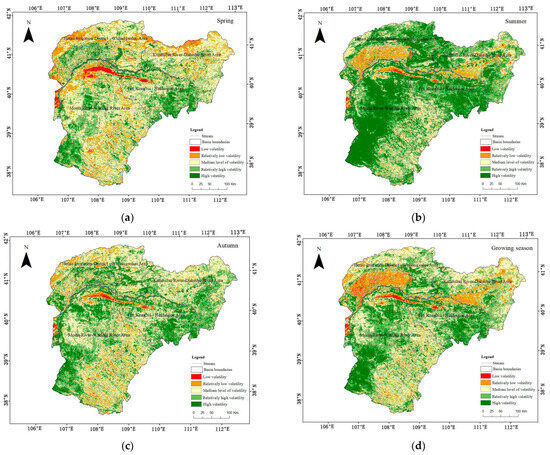
Figure 5.
Stability analysis of FVC in the Inner Mongolia section of the Yellow River Basin (2000–2020): (a) spring; (b) summer; (c) autumn; (d) growing season.
We found obvious differences in vegetation stability between the study areas in the same seasonal scale. The Hetao Irrigation District–Wuliangsuhai Area was reportedly more stable in the growing season, and the entire Inner Mongolia section predominantly had a medium volatility level in the spring and autumn seasons. This volatility level was mainly distributed across the northern part of the Kundulun River–Daheihe River Area, an observation that could be attributed to the fact that this area includes the Daqingshan Nature Reserve, which has a rich species diversity and whose ecosystems are more stable compared to the rest of the Inner Mongolia section. Further, all the four study areas were found to be mainly dominated by relatively high volatility as well as high volatility in the summer season. Among them, high volatility in the Ten Kongtui–Heidaigou Area accounted for 46.68% of the watershed. Such high volatility in this area could be attributed to its fragile ecological environment, wherein unstable precipitation facilitates a plethora of changes in vegetation growth.
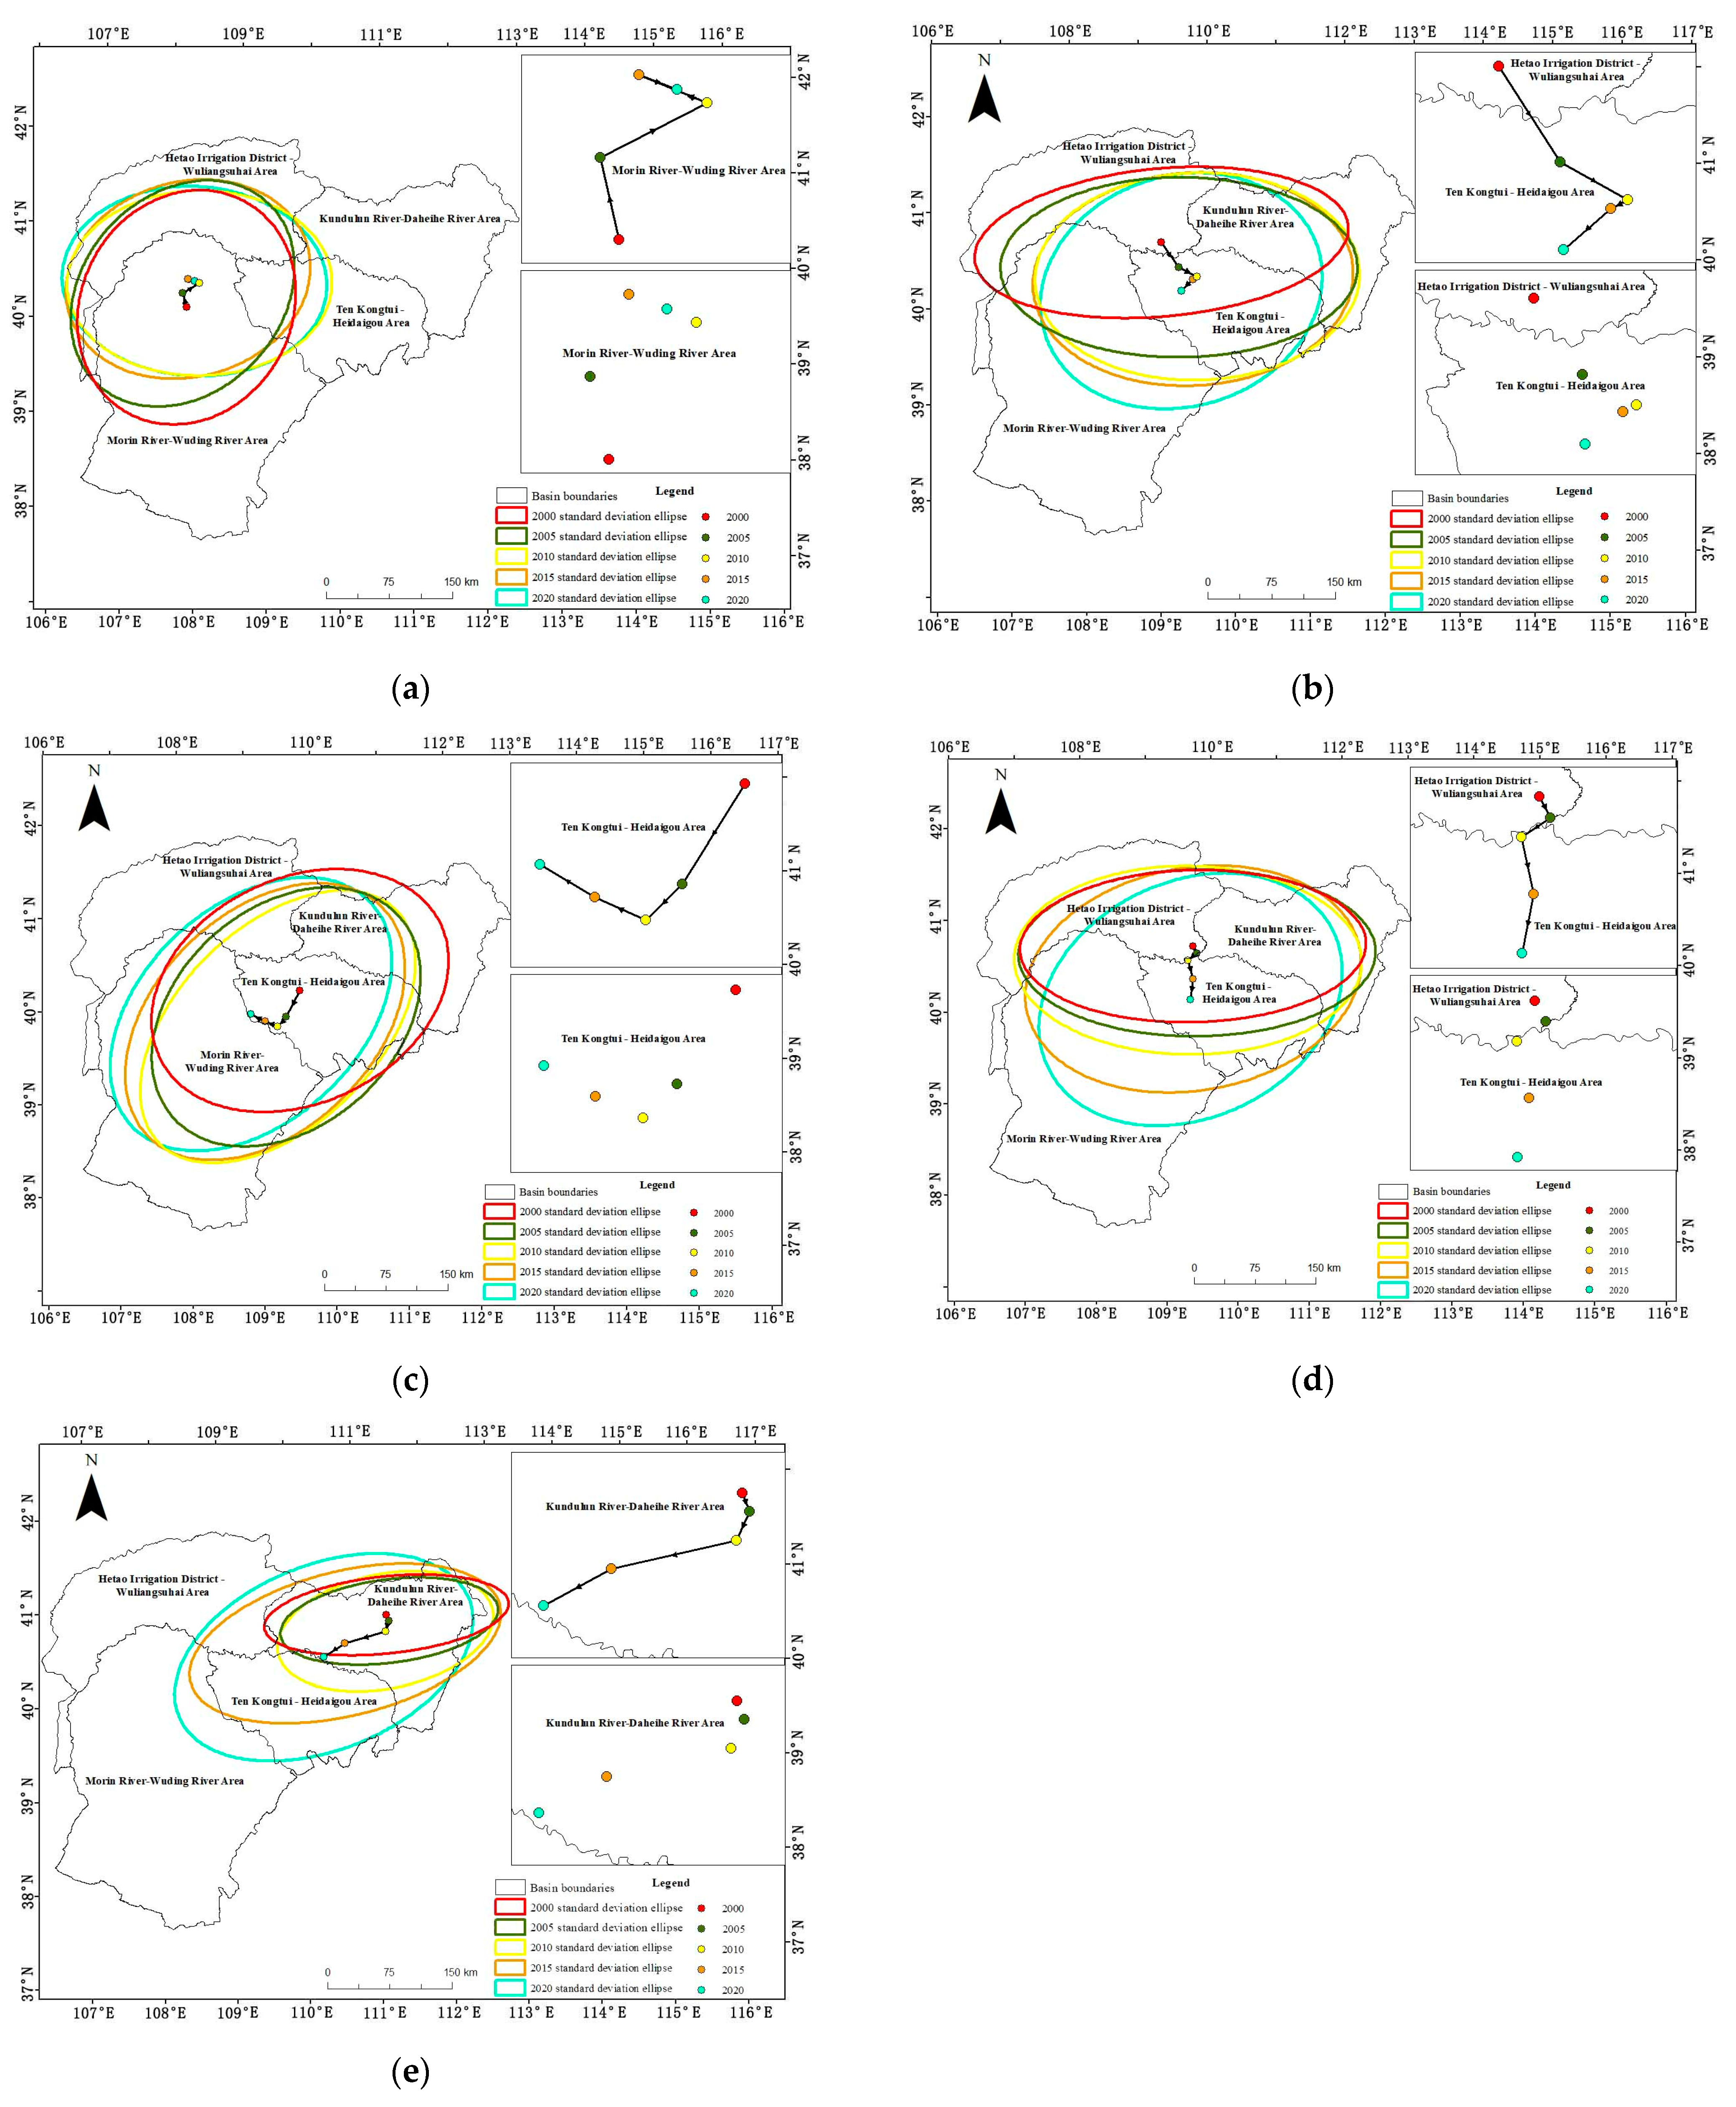
3.3.2. FVC Centre of Gravity Migration
As shown in Figure 6, the centre of gravity of low FVC showed a northward migration trend from 2000 to 2020, indicating a migration of about 63.16 km, mainly concentrated in the vicinity of Kubuqi Desert in the Morin River–Wuding River Area. Meanwhile, the middle–low FVC migrated from the Hetao Irrigation District–Wuliangsuhai Area to the Ten Kongtui–Heidaigou Area, indicating a total migration of 85.40 km. Moreover, the medium FVC shifted to the southwest by 51.48 km and to the northwest by 36.44 km in the 2000–2010 and 2010–2020 periods, respectively. Over the 2000–2020 period, the middle–high fractional vegetation coverage showed a southward migration trend, indicating a total migration of 72.62 km, while the high fractional vegetation coverage, mainly concentrated in the Kundulun River–Daheihe River Area, migrated 8.00 km to the southeast and 95.17 km to the southwest in the 2000–2005 and 2005–2020 periods, respectively. Owing to the overall increasing trend in FVC, the range of middle–high FVC and the high FVC scale error ellipses increase, while the overall area FVC expands to the western part of the Inner Mongolia section in the Yellow River Basin.
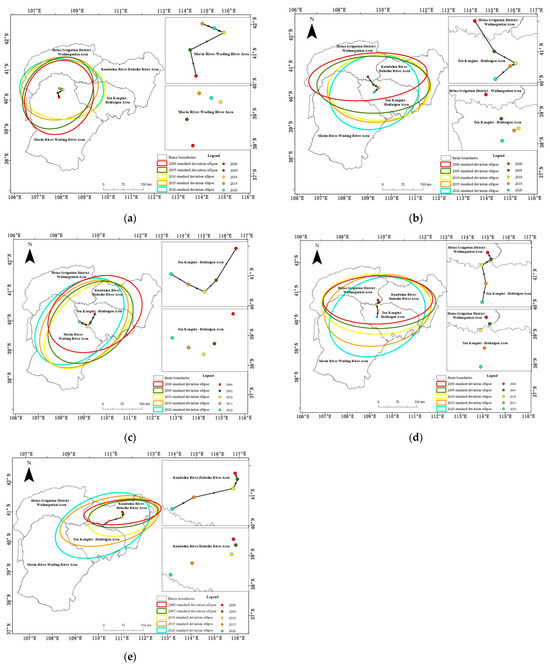
Figure 6.
FVC centre of gravity migration analysis in the Inner Mongolia section of the Yellow River Basin (2000–2020): (a) low FVC; (b) middle–low FVC; (c) medium FVC; (d) middle–high FVC; (e) high FVC.
3.3.3. Trend Analysis of FVC
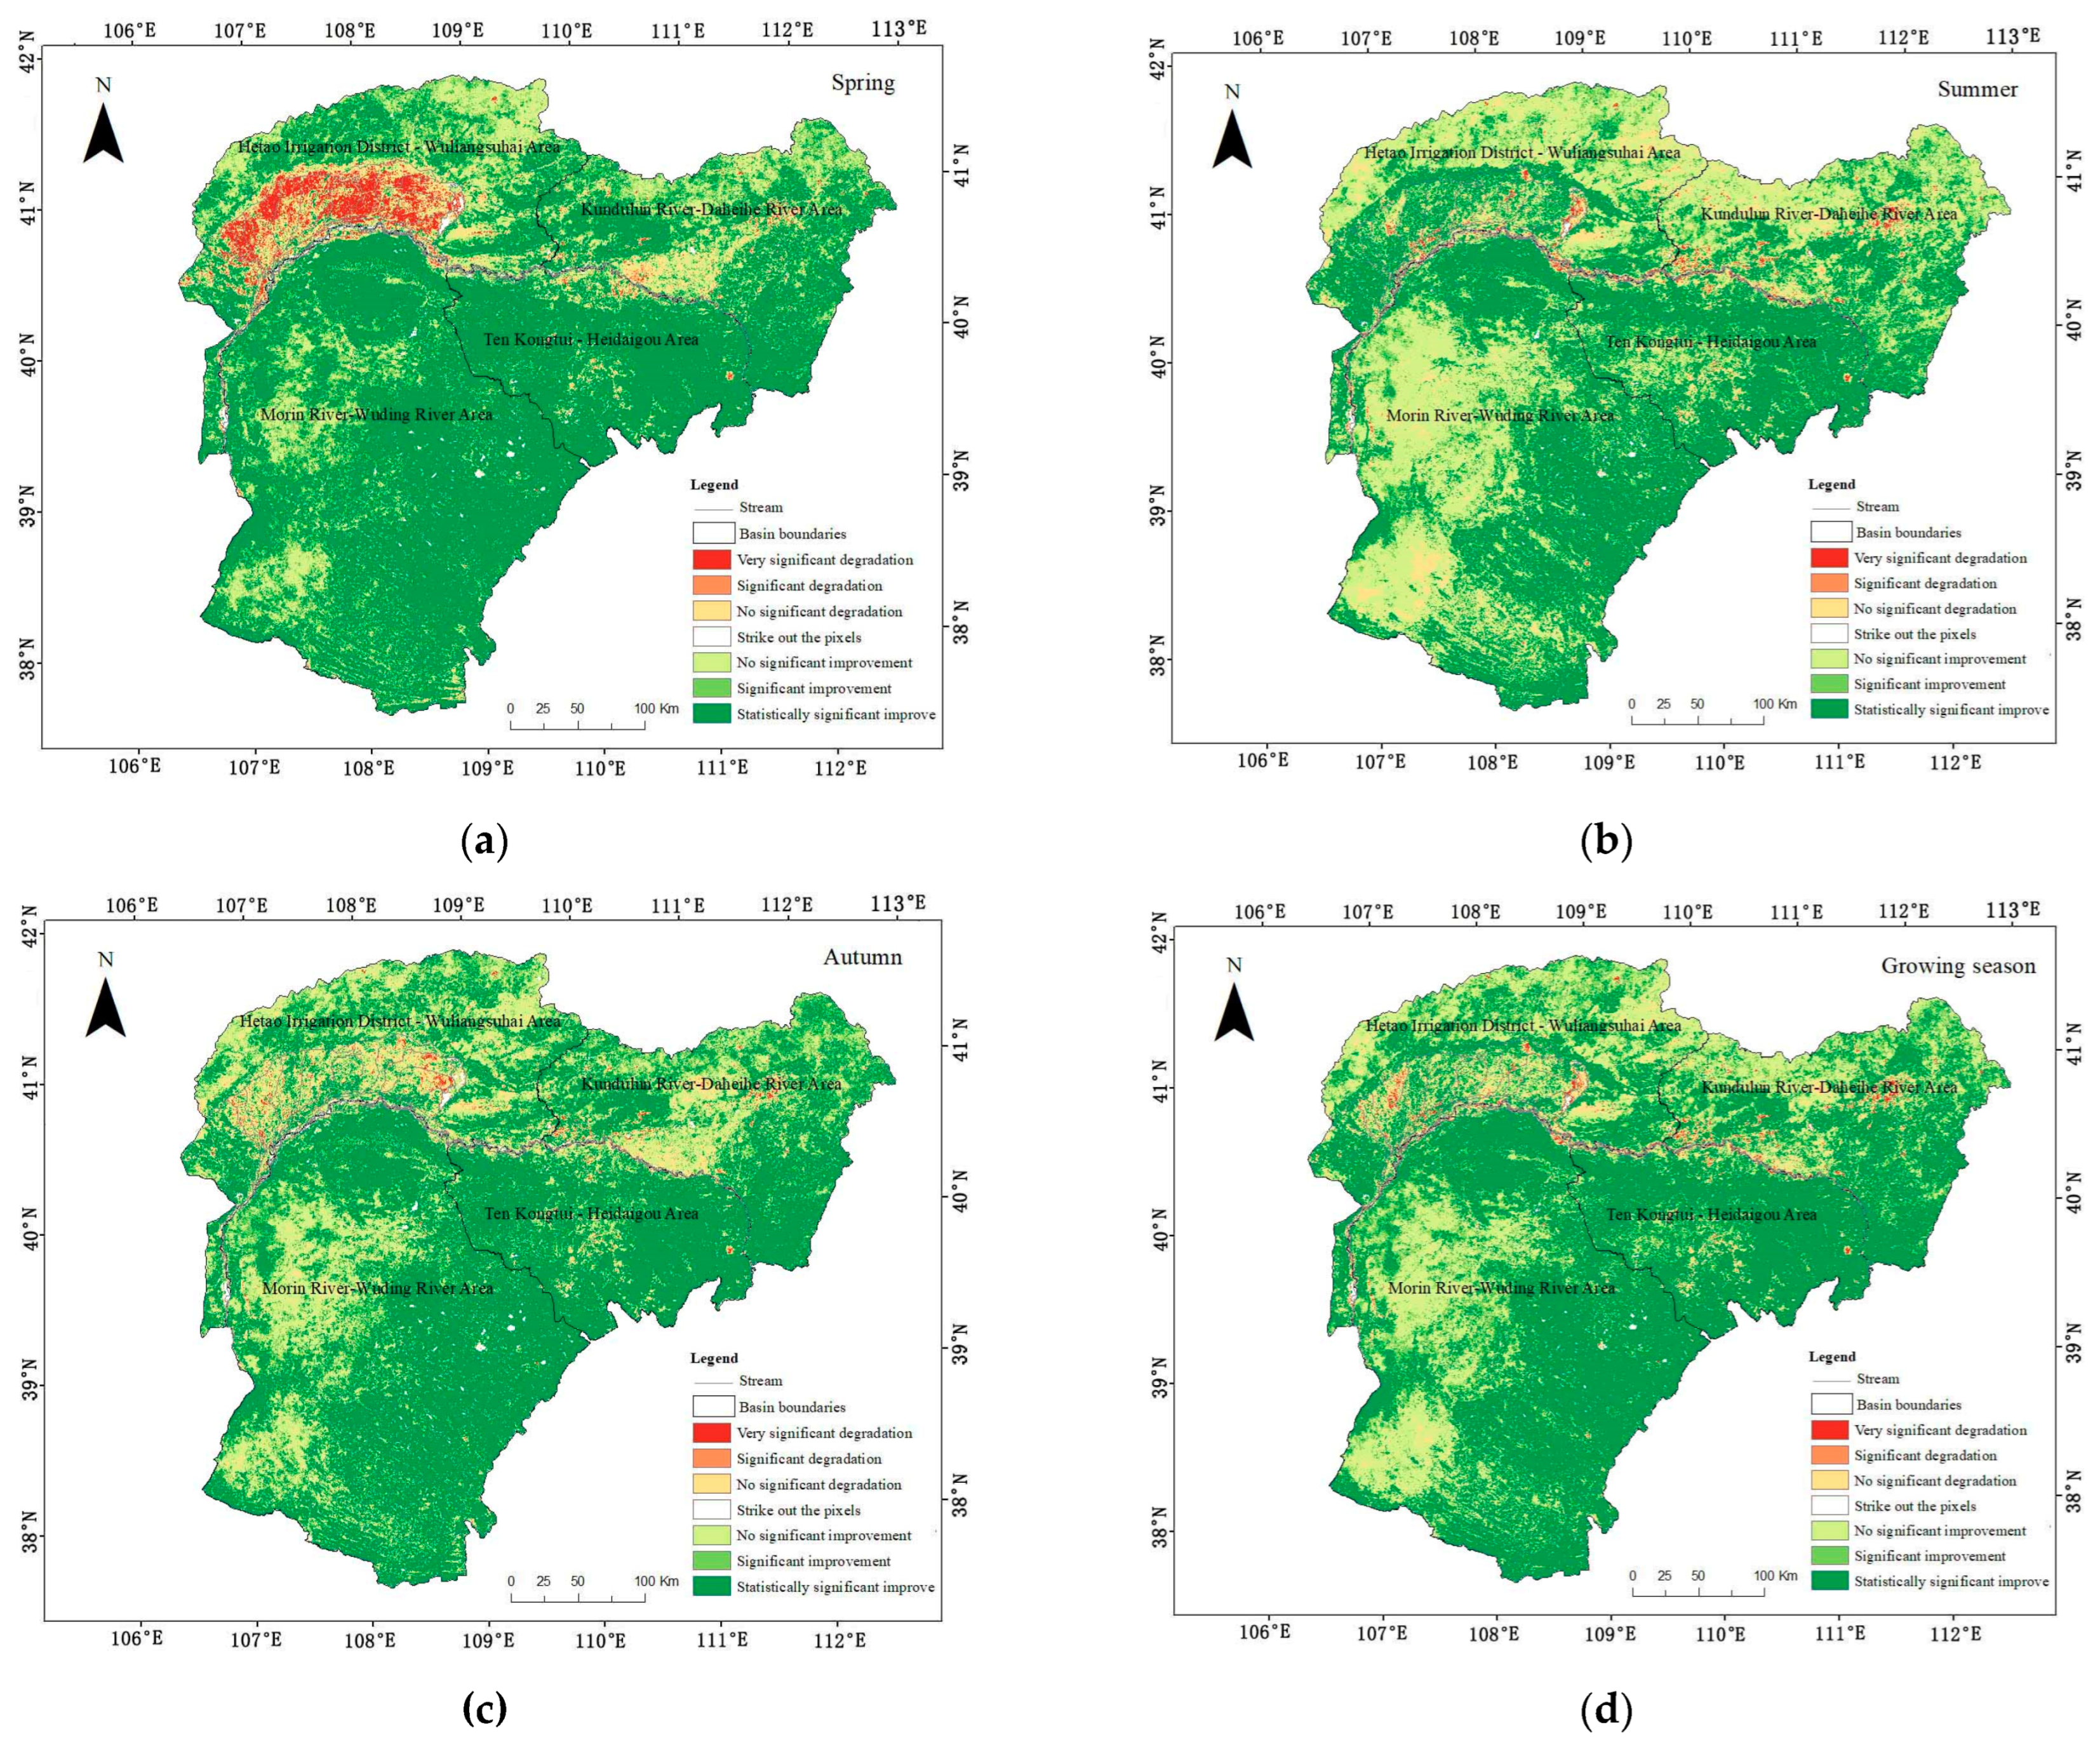
As shown in Figure 7, the FVC of each studied area showed a statistically significant improvement trend across different seasons, among which the Hetao Irrigation District–Wuliangsuhai Area showed more significant seasonal changes, which were related to the existence of a large area under agricultural cultivation in this area.

Figure 7.
Trend analysis of FVC in the Inner Mongolia section of the Yellow River Basin (2000–2020): (a) spring; (b) summer; (c) autumn; (d) growing season.
The overall improvement in FVC in the growing season and the spring season in the Yellow River Basin was observed in more than 90% of the basin’s total area, of which the Ten Kongtui–Heidaigou Area showed a statistically significant improvement in FVC, which, respectively, accounted for 81.99% and 85.23% of its total area. Moreover, in summer and autumn, the FVC in the Morin River–Wuding River Area showed a significant increasing trend and, respectively, accounted for 95.93% and 97.58% of the Inner Mongolia section. In summer, vegetation degradation became a more serious concern in the Kundulun River–Daheihe River Area, mainly distributed in the centre of the city; the accelerated urbanisation process in this area put considerable pressure on its vegetation ecosystem. Furthermore, in autumn, the Hetao Irrigation District–Wuliangsuhai Area showed a degradation trend over a larger area (accounting for 11.42% of the total area of the watershed).
3.4. Analysis of Drivers of FVC Change
3.4.1. Analysis of the Main Driving Factors
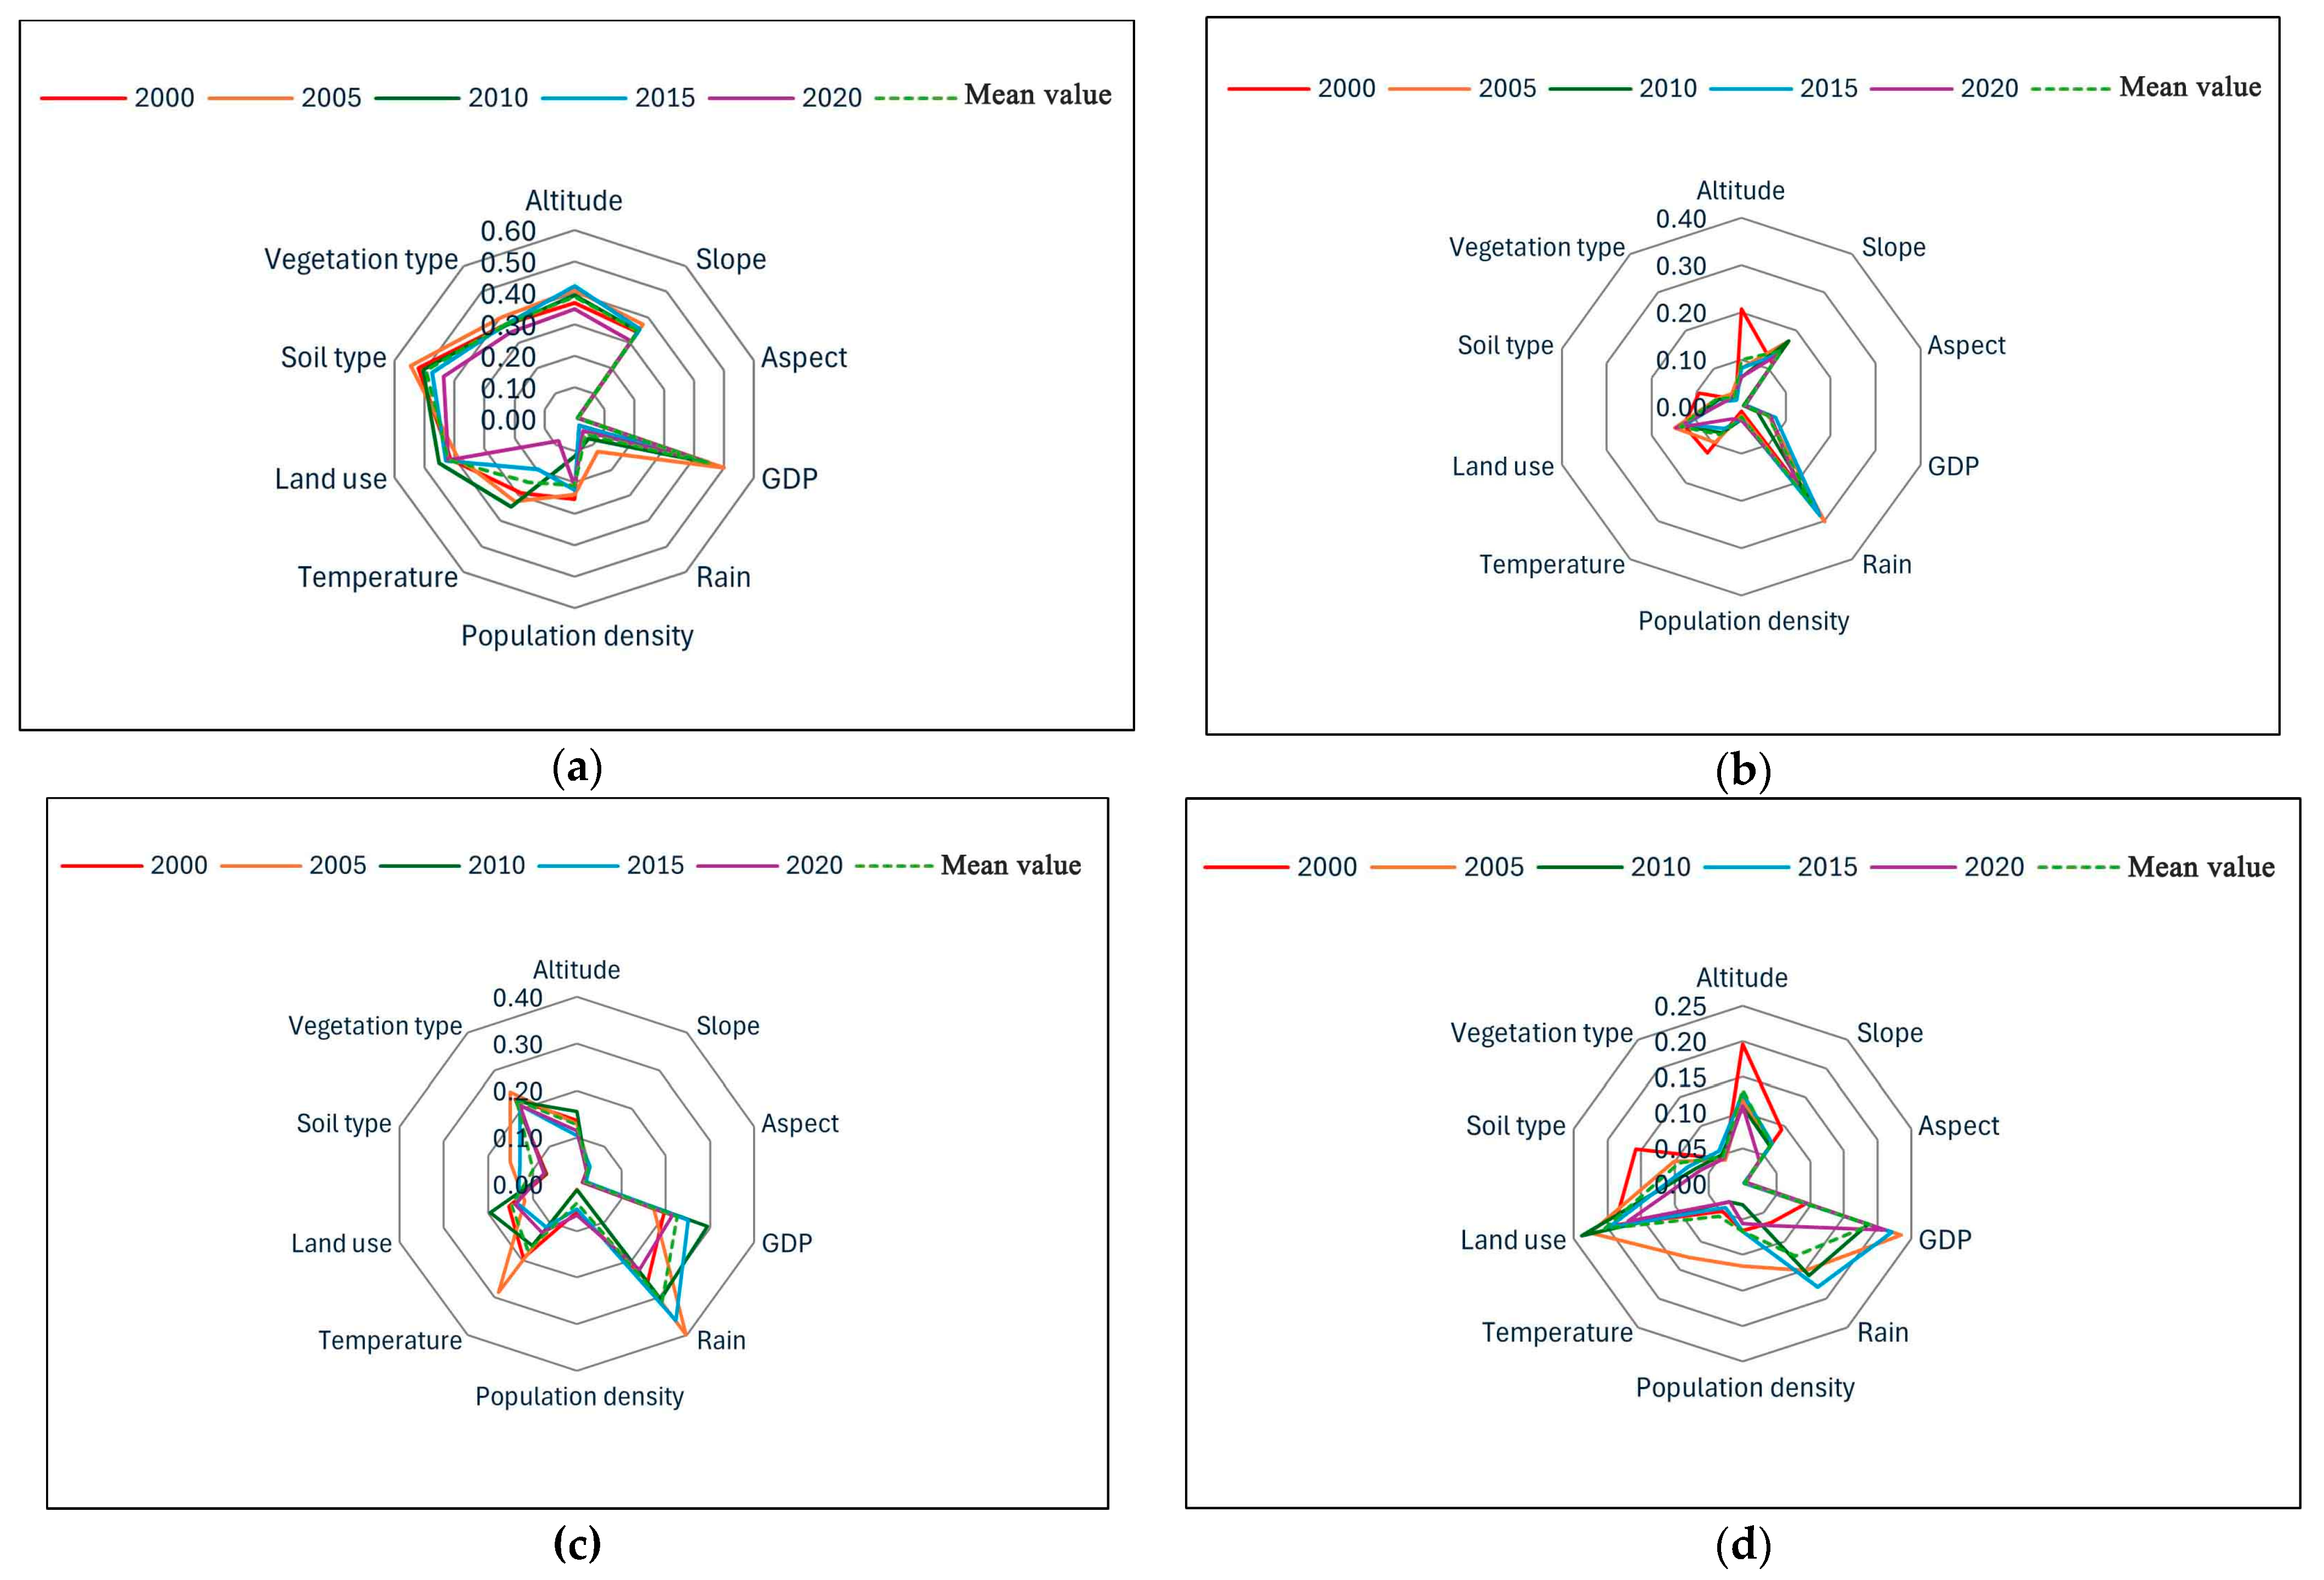
As shown in Figure 8, the influences of soil type, land use and GDP on FVC in the Hetao Irrigation District–Wuliangsuhai Area were consistently ranked among the top-three concomitant influences in the 2000–2020 period, with explanatory powers of more than 40%; however, the explanatory power of this area’s climatic and topographic factors regarding FVC change was found to be low. Moreover, the FVCs in Morin River–Wuding River Area and the Kundulun River–Daheihe River Area were mainly influenced by rainfall in the same period. The secondary driving factors in these areas were GDP and slope, while aspect and population density had low explanatory powers. Meanwhile, the mean values of the explanatory power of each driver in the Ten Kongtui–Heidaigou Area were classified in a descending order as follows: land use > GDP > altitude > rainfall > soil type > slope > population density > temperature > vegetation type > aspect. Additionally, land use, GDP and altitude were the main driving factors of FVC change in this area, possibly due to its topography as well as the implementation of various related policies in this area in recent years.
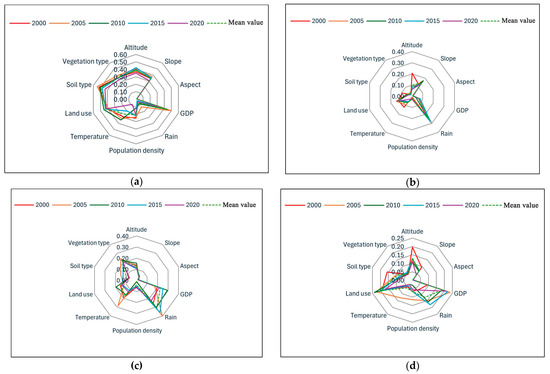
Figure 8.
Explanatory powers of drivers of spatial differentiation in vegetation cover in the Inner Mongolia section of the Yellow River Basin: (a) Hetao Irrigation District–Wuliangsuhai Area; (b) Kundulun River–Daheihe River Area; (c) Morin River–Wuding River Area; (d) Ten Kongtui–Heidaigou Area.
3.4.2. Interaction Analysis of Different Factors
As shown in Figure 9, the explanatory power of any two driving factors regarding FVC was greater than that of a single factor. Notably, all of them underwent either two-factor enhancement or nonlinear enhancement. Further, the interaction of different factors reportedly increased their explanatory power regarding FVC.
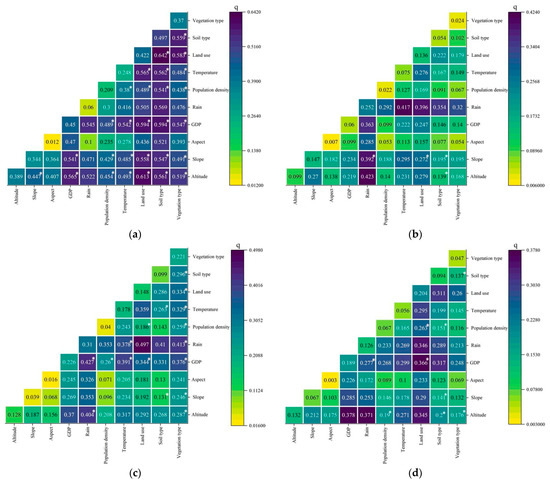
Figure 9.
Interaction detection and interpretation of the driving factors of FVC in the Inner Mongolia section of the Yellow River Basin: (a) Hetao Irrigation District–Wuliangsuhai Area; (b) Kundulun River–Daheihe River Area; (c) Morin River–Wuding River Area; (d) Ten Kongtui–Heidaigou Area, with * for two-factor enhancement, without * for non-linear enhancement.
The Hetao Irrigation District–Wuliangsuhai Area had more types of interaction involving two-factor enhancement; here, the q value of the interaction between land use and soil type reached the highest value of 0.642 in the 2000–2020 period, while the average q value of the interaction between land use and other factors was greater than 0.55, out of which only slope direction and rainfall showed nonlinear enhancement while interacting with other factors. In contrast, most of the FVC factor interactions in the Kundulun River–Daheihe River Area showed a nonlinear enhancement trend; for this area, the mean value of q was greater than 0.36 when rainfall interacted with other factors. Additionally, the q value of the rainfall–land use interaction in the Morin River–Wuding River Area was high (0.497), and its explanatory power increased when rainfall interacted with other factors. Furthermore, the q values regarding the interactions between altitude and rainfall, altitude and GDP and GDP and land use in the Ten Kongtui–Heidaigou Area were all above 0.36, among which only temperature and aspect showed nonlinear enhancement with respect to their interaction with other factors; all the other factors showed two-factor enhancement in their interactions with other factors. Thus, it is clear that the FVC in the Inner Mongolia section of the Yellow River Basin was due to the combined effect of various relevant factors.
4. Discussion
4.1. FVC Change
In this study, with respect to temporal change, the FVC in the Inner Mongolia section of the Yellow River Basin showed an increasing trend from 2000 to 2020, in alignment with the results of previous studies [33,34]. Regarding spatial change, the FVC in this section, on the whole, showed an overall trend of being high in the east, low in the west and low–high–low from the north to the south. This is in alignment with the results of Zhang et al. and other relevant studies [17,35].
The stability of FVC in the Inner Mongolia section of the Yellow River Basin also showed some differences in different seasons and different areas. The degree of volatility of FVC was larger in summer and smaller and more stable in spring [16]. The northern part of the Kundulun River–Daheihe River Area was mainly marked by relatively low volatility and medium volatility, while the northern part of Morin River–Wuding River Area had low volatility (as this area is a desert zone) [36].
Moreover, the Inner Mongolia section’s FVC showed a highly significant improvement trend from 2000 to 2020, mainly owing to the implementation of a series of ecological protection measures, such as the reversal of farmland to forests and grasslands since 2000 in Inner Mongolia [37], which accelerated the growth and recovery of vegetation in this section. While the vegetation degradation of the Hetao Irrigation District–Wuliangsuhai Area was initially rendered more obvious in spring, with the passage of time, the vegetation in this area started showing an improving trend in summer. This is perhaps due to the fact that the vegetation remained in the budding stage in spring, while in summer, it shifted to the leaf spreading and blossoming stage, and its growth became vigorous in nature; thus, the FVC in summer tended to improve compared to that in spring. Among the different areas of the Inner Mongolia section, the degradation of the Kundulun River–Daheihe River Area was more significant and mainly concentrated in the city centre, owing to the increases in urban population and construction land area in this location [35].
4.2. Analysis of FVC Drivers
This study’s analysis of factor explanatory power indicated that, among the climatic factors, rainfall was the dominant factor that affected vegetation cover in the Inner Mongolia section, a finding that was consistent with the results of Zhang et al. [38] and Chen et al. [33], among others. Soil type and land use were the other two important factors that influenced the growth of vegetation, providing enough space and nutrients conducive to the growth of vegetation, in alignment with the results of Fu et al. [39]. In fact, the interaction of climatic, natural and anthropogenic factors made the explanatory power of FVC increase significantly.
To sum up, in this paper, we calculated the FVC of the Inner Mongolia section of the Yellow River Basin using MOD13Q1 data, analysed the trends of its changes, and used a geodetector to study their driving factors, all of which provided support for the section’s future ecological development. However, this study had some limitations; for example, the performance of FVC at smaller characteristic times needs to be explored in depth, and it was subjective regarding the process of indicator selection, trend ranking and factor discretisation. Considering FVC is affected by various factors including climate, topography and human activities, more comprehensive and robust driving factors should be examined in future follow-up studies. Moreover, the number of years under study should be increased, the resolution should be improved, and the trend in and attribution analysis of vegetation cover should be carried out more deeply in future studies on FVC in the Inner Mongolia section of the Yellow River Basin.
5. Conclusions
(1) Characteristics of temporal changes: across different seasonal scales, the FVC in the Inner Mongolia section of the Yellow River Basin showed an increasing trend, with a clear hierarchy (summer > growing season > fall > spring). There is a mutation point in FVC in different areas, and the FCV sequence is random. Among the different areas of the section, the best FVC was found in the Kundulun River–Daheihe River Area, and the most obvious seasonal changes were found in the Hetao Irrigation District–Wuliangsuhai Area.
(2) Characteristics of spatial changes: FVC, on the whole, showed an overall trend of being high in the east and low in the west, with a low–high–low trend being observed from the north to the south of the Inner Mongolia section. The FVC in the growing season was found to be dominated by relatively high volatility and medium volatility, the FVCs in spring and fall were mainly marked by medium volatility, and the FVC in summer predominantly had a relatively high volatility as well as a high volatility. Moreover, among the studied areas, the northern part of the Kundulun River–Daheihe River Area was found to have a rich diversity of species, and its ecosystem was deemed relatively stable. In the 2000–2020 period, the FVC of the Inner Mongolia section mainly showed an improving trend, while its vegetation-degraded areas over this period were found to be mainly distributed in the city centre of the Kundulun River–Daheihe River Area and the farming areas of the summer Hetao Irrigation District.
(3) Driving factor analysis: Soil type, land use and GDP were the dominant factors that affected the FVC of the Hetao Irrigation District–Wuliangsuhai Area. Meanwhile, the main factor driving FVC change in the Morin River–Wuding River Area and the Kundulun River–Daheihe River Area was rainfall, and the secondary influencing factors were GDP and slope, respectively. Notably, the concomitant explanatory powers of land use, GDP and altitude were higher in the Ten Kongtui–Heidaigou Area. Furthermore, the interactions between driving factors were marked by two-factor enhancement or nonlinear enhancement, and the explanatory powers of the different factors’ interactions increased in comparison with those of the singular factors.
Author Contributions
All of the authors contributed significantly to this manuscript. Conceptualisation, data processing, writing—review and editing, D.H.; investigation, D.W.; methodology, review, editing, supervision, Y.W. (Yong Wang); software, Y.W. (Yu Wang); writing—review and editing, Y.Y.; writing—review and editing, W.F. All authors have read and agreed to the published version of the manuscript.
Funding
This research was funded by the key Project of Natural Science Foundation of Inner Mongolia Autonomous Region (No.2023ZD21) and Science and Technology Planning Project of Inner Mongolia Autonomous Region (No.2021GG0367). Thanks are due to the anonymous reviewers and editor for their constructive comments.
Institutional Review Board Statement
Not applicable.
Informed Consent Statement
Not applicable.
Data Availability Statement
The original contributions presented in the study are included in the article, further inquiries can be directed to the corresponding author.
Conflicts of Interest
The authors declare that they have no conflicts of interest.
References
- Xu, Y.; Wang, C. Ecological protection and high-quality development in the Yellow River Basin: Framework, path, and countermeasure. Bull. Chin. Acad. Sci. 2020, 35, 875–883. [Google Scholar]
- Zhou, S.; Zhang, W.; Wang, S.; Zhang, B.; Xu, Q. Spatial–Temporal Vegetation Dynamics and Their Relationships with Climatic, Anthropogenic, and Hydrological Factors in the Amur River Basin. Remote Sens. 2021, 13, 684. [Google Scholar] [CrossRef]
- Tang, L.; He, M.; Li, X. Verification of fractional vegetation coverage and NDVI of desert vegetation via UAVRS technology. Remote Sens. 2020, 12, 1742. [Google Scholar] [CrossRef]
- Li, H.; Liu, G.; Fu, B. Response of Vegetation to Climate Change and Human Activity Based on NDVI in the Three-River Headwaters Region. Acta Ecol. Sin. 2011, 31, 5495–5504. [Google Scholar]
- Hu, E.; Wang, X.; Tie, N.; Hong, G.; Su, H.; Zhang, Y. Spatial–Temporal Variation of NDVI and Influencing Factors in the Daqing Mountain National Nature Reserve, Inner Mongolia. Acta Ecol. Sin. 2022, 42, 5945–5955. [Google Scholar]
- Wang, Y.; Zhang, Z.; Chen, X. Quantifying influences of natural and anthropogenic factors on vegetation changes based on geodetector: A case study in the Poyang Lake Basin, China. Remote Sens. 2021, 13, 5081. [Google Scholar] [CrossRef]
- Zheng, Z.; Wu, Z.; Chen, Y.; Yang, Z.; Marinello, F. Exploration of eco-environment and urbanization changes in coastal zones: A case study in China over the past 20 years. Ecol. Indic. 2020, 119, 106847. [Google Scholar] [CrossRef]
- Huo, H.; Sun, C. Spatiotemporal variation and influencing factors of vegetation dynamics based on Geodetector: A case study of the northwestern Yunnan Plateau, China. Ecol. Indic. 2021, 130, 108005. [Google Scholar] [CrossRef]
- Kasoro, F.R. Spatial and temporal changes of vegetation cover in China based on modis NDVI. Appl. Ecol. Environ. Res. 2021, 19, 1371–1390. [Google Scholar] [CrossRef]
- Wang, Y.; Kong, X.; Guo, K.; Zhao, C.; Zhao, J. Spatiotemporal change in vegetation cover in the Yellow River Basin between 2000 and 2022 and driving forces analysis. Front. Ecol. Evol. 2023, 11, 1261210. [Google Scholar] [CrossRef]
- Zhang, S.; Gu, X.; Zhao, X.; Zhu, J.; Zhao, Y. Influences of Climatic Factors and Human Activities on Forest–Shrub–Grass Suitability in the Yellow River Basin, China. Forests 2023, 14, 1198. [Google Scholar] [CrossRef]
- Wang, M.; Fu, J.e.; Wu, Z.; Pang, Z. Spatiotemporal variation of NDVI in the vegetation growing season in the source region of the Yellow River, China. ISPRS Int. J. Geo-Inf. 2020, 9, 282. [Google Scholar] [CrossRef]
- Zhang, X.; Wang, G.; Xue, B.; Yinglan, A. Changes in vegetation cover and its influencing factors in the inner Mongolia reach of the yellow river basin from 2001 to 2018. Environ. Res. 2022, 215, 114253. [Google Scholar] [CrossRef] [PubMed]
- Liu, T.; Zhang, Q.; Li, T.; Zhang, K. Dynamic Vegetation Responses to Climate and Land Use Changes over the Inner Mongolia Reach of the Yellow River Basin, China. Remote Sens. 2023, 15, 3531. [Google Scholar] [CrossRef]
- Ren, Y.; Liu, J.; Liu, S.; Wang, Z.; Liu, T.; Shalamzari, M.J. Effects of Climate Change on Vegetation Growth in the Yellow River Basin from 2000 to 2019. Remote Sens. 2022, 14, 687. [Google Scholar] [CrossRef]
- Shen, C. Study on Temporal and Spatial Variation and Influencing Factors of NDVI in the Yellow River Basin of Inner Mongoli. Master’s Thesis, Inner Mongolia Agricultural University, Hohhot City, China, 2022. [Google Scholar]
- Zhang, H.; Zhan, C.; Xia, J.; Hu, S.; Ning, L.; Deng, X. Spatio-Temporal Variations and Strip Patterns of Vegetation in the Inner Mongolia of Yellow River Basin. Acta Ecol. Sin. 2022, 42, 8818–8829. [Google Scholar]
- Dept. of Lighting Planning & Design. Available online: http://lpd.thupdi.com/project/view?id=1534 (accessed on 4 March 2023).
- Bai, P.; Liu, X.; Zhang, Y.; Liu, C. Assessing the impacts of vegetation greenness change on evapotranspiration and water yield in China. Water Resour. Res. 2020, 56, e2019WR027019. [Google Scholar] [CrossRef]
- Cuo, L.; Zhang, Y.; Gao, Y.; Hao, Z.; Cairang, L. The impacts of climate change and land cover/use transition on the hydrology in the upper Yellow River Basin, China. J. Hydrol. 2013, 502, 37–52. [Google Scholar] [CrossRef]
- Shi, P.; Hou, P.; Gao, J.; Wan, H.; Wang, Y.; Sun, C. Spatial-Temporal Variation Characteristics and Influencing Factors of Vegetation in the Yellow River Basin from 2000 to 2019. Atmosphere 2021, 12, 1576. [Google Scholar] [CrossRef]
- Kui, G.; Shi, C.; Yang, J.; Li, R.; Wei, G.; Liu, J. Spatial-Temporal Variations of Vegetation Coverage and Its Driving Force in Inner Mongolia Grassland, China. Chin. J. Appl. Ecol. 2023, 34, 2713–2722. [Google Scholar]
- Wang, Y.; Yang, F.; He, F. Spatiotemporal Characteristics of Land Cover Change in the Yellow River Basin over the Past Millennium. Land 2024, 13, 260. [Google Scholar] [CrossRef]
- Cheng, Y.; Zhang, L.; Zhang, Z.; Li, X.; Wang, H.; Xi, X. Spatiotemporal Variation and Influence Factors of Vegetation Cover in the Yellow River Basin (1982–2021) Based on GIMMS NDVI and MOD13A1. Water 2022, 14, 3274. [Google Scholar] [CrossRef]
- Peng, H.; Wang, S.; Wang, X. Consistency and asymptotic distribution of the Theil–Sen estimator. J. Stat. Plan. Inference 2008, 138, 1836–1850. [Google Scholar] [CrossRef]
- Hamed, K.H.; Rao, A.R. A modified Mann-Kendall trend test for autocorrelated data. J. Hydrol. 1998, 204, 182–196. [Google Scholar] [CrossRef]
- Mann, H.B. Nonparametric tests against trend. Econom. J. Econom. Soc. 1945, 13, 245–259. [Google Scholar] [CrossRef]
- Mao, P.; Zhang, J.; Li, M.; Liu, Y.; Wang, X.; Yan, R.; Shen, B.; Zhang, X.; Shen, J.; Zhu, X. Spatial and temporal variations in fractional vegetation cover and its driving factors in the Hulun Lake region. Ecol. Indic. 2022, 135, 108490. [Google Scholar] [CrossRef]
- Xing, L.; Huang, L.; Chi, G.; Yang, L.; Li, C.; Hou, X. A dynamic study of a karst spring based on wavelet analysis and the Mann-Kendall Trend Test. Water 2018, 10, 698. [Google Scholar] [CrossRef]
- Gou, J.; Sang, H.; Zhai, L. Spatiotemporal Variations and Driving Factors of Vegetation Coverage on the Qinghai-Tibet Plateau. Chin. J. Ecol. 2023, 42, 2665–2674. [Google Scholar]
- Wang, J.; Xu, D. Geodetector: Principle and Prospective. Acta Geogr. Sin. 2017, 72, 116–134. [Google Scholar]
- Kang, Y.; Guo, E.; Wang, Y.; Bao, Y.; Bao, Y.; Mandula, N. Monitoring Vegetation Change and Its Potential Drivers in Inner Mongolia from 2000 to 2019. Remote Sens. 2021, 13, 3357. [Google Scholar] [CrossRef]
- Cheng, K.; Yang, C.; Bai, L.; Chen, Y.; Liu, R.; Chao, L. Effects of Natural and Human Factors on Vegetation Normalized Difference Vegetation Index Based on Geographical Detectors in Inner Mongolia. Acta Ecol. Sin. 2021, 41, 4963–4975. [Google Scholar]
- Mu, S.; Li, J.; Chen, Y.; Gang, C.; Zhou, W.; Ju, W. Spatial Differences of Variations of Vegetation Coverage in Inner Mongolia During 2001-2010. Acta Geogr. Sin. 2012, 67, 1255–1268. [Google Scholar]
- Sang, J. Climate and Vegetation Ecological Changes in the Yellow River Basin in Inner Mongolia from 1981 to 2017. Inn. Mong. Meteorol. 2021, 1, 33–38+45. [Google Scholar]
- Yi, X.; Zhang, D.; Liu, Y.; Xu, R.; Xie, S. Vegetation Change and Its Response to Climate Factors in Hanggin Banner, Inner Mongolia, China From 2000 to 2020. J. Desert Res. 2024, 44, 51–62. [Google Scholar]
- Feng, S.; Liu, X.; Zhao, W.; Yao, Y.; Zhou, A.; Liu, X.; Pereira, P. Key areas of ecological restoration in Inner Mongolia based on ecosystem vulnerability and ecosystem service. Remote Sens. 2022, 14, 2729. [Google Scholar] [CrossRef]
- Zhang, S.; Nie, Y.; Zhang, H.; Li, Y.; Han, Y.; Liu, X.; Wang, B. Spatiotemporal Variation of Vegetation NDVI and Its Driving Forces in Inner Mongolia Based on Geodetector. Acta Agrestia Sin. 2020, 28, 1460–1472. [Google Scholar]
- Fu, H.; Wang, R.; Wang, X. Analysis of Spatiotemporal Variations and Driving Forces of NDVI in the Yellow River Basin During 1999-2018. Res. Soiland Water Conserv. 2022, 29, 145–153+62. [Google Scholar]


Disclaimer/Publisher’s Note: The statements, opinions and data contained in all publications are solely those of the individual author(s) and contributor(s) and not of MDPI and/or the editor(s). MDPI and/or the editor(s) disclaim responsibility for any injury to people or property resulting from any ideas, methods, instructions or products referred to in the content. |
© 2024 by the authors. Licensee MDPI, Basel, Switzerland. This article is an open access article distributed under the terms and conditions of the Creative Commons Attribution (CC BY) license (https://creativecommons.org/licenses/by/4.0/).