Article

Assessment of Fluxes and Ecological and Health Risks of Toxic Trace Elements in Atmospheric Deposition from the Baicheng-Songyuan Area, Jilin Province, Northeast China

1
Nanning Branch, Guilin University of Technology, Nanning 530001, China
2
College of Earth Sciences, Guilin University of Technology, Guilin 541006, China
3
College of Geo-Exploration Science and Technology, Jilin University, Changchun 130026, China
*
Author to whom correspondence should be addressed.
Atmosphere 2024, 15(7), 744; https://doi.org/10.3390/atmos15070744
Submission received: 17 May 2024 / Revised: 15 June 2024 / Accepted: 18 June 2024 / Published: 21 June 2024
(This article belongs to the Special Issue Air Pollution Exposure and Health Impact Assessment (2nd Edition))

Abstract

:
A total of 56 atmospheric deposition samples were collected on a yearly basis from the Baicheng-Songyuan areas, Jilin Province, Northeast China. Each sample was subdivided into wet (soluble) and dry (insoluble) fractions, and the concentrations of toxic trace elements including As, Cd, Co, Cr, Cu, Hg, Mn, Mo, Ni, Pb, Se, and Zn in both fractions were analyzed. The bulk fluxes and ecological and human health risk of these toxic trace elements in atmospheric deposition were evaluated. The bulk deposition fluxes of toxic trace elements decreased in the order of Mn > Zn > Cr > Pb > Cu > Ni > As > Co >Mo > Cd > Se > Hg. The fluxes of toxic trace elements in dry fraction accounted for 74.7–99.9% of their bulk deposition fluxes, indicating that the atmospheric deposition of toxic trace elements in the study area is predominantly dry atmospheric deposition. The mean values of the geo-accumulation index (Igeo) and enrichment factor showed moderately heavy contamination with Cd via dry atmospheric deposition, but no contamination from other toxic trace elements; Cd and Hg in dry atmospheric deposition were in the moderate to considerable ecological risk levels, while other trace elements were at low ecological risk levels. The health risk assessment showed that the effects of toxic trace elements in dry atmospheric deposition via three exposure pathways were in the order of ingestion > inhalation > dermal contact for adults and children. The mean values of hazard quotient (HQ) and hazard index (HI) of toxic trace elements via three pathways were less than one, indicating that their non-carcinogenic risks in dry atmospheric deposition may be low or negligible for adults and children. The mean values of carcinogenic risk (CR) and total carcinogenic risk (TCR) of As and Cr via the three pathways for adults and children were between 10−6 and 10−4, indicating that the carcinogenic risk levels of As and Cr were tolerable or acceptable, and the mean TCR value of Cd through the three pathways for adult and children was less than 10−6, implying that the carcinogenic risk level of Cd was negligible. Mn, Ni, Cr, and Co in dry atmospheric deposition were mainly contributed from the crustal sources, while As, Cd, Cu, Hg, Mo, Pb, Se, and Zn in dry atmospheric deposition were derived from both crustal and anthropogenic sources. The results obtained in this study advocate the necessity for monitoring atmospheric deposition in some rural areas, and also provide a scientific basis for controlling contamination posed by toxic trace elements in dry atmospheric deposition.

1. Introduction

Atmospheric deposition in the forms of precipitation, particles, and aerosols is a significant pathway of pollutants entering natural ecosystems such as soils, wetlands, and lakes. Pollution by toxic trace elements, such as As, Cd, Cr, Cu, Hg, Ni, Pb, and Zn, in dry and wet atmospheric deposition processes into the ecosystems are of particular interest due to their negative effects on ecosystem safety and human health [1,2]. Therefore, atmospheric pollution by toxic trace elements from atmospheric deposition is still an environmental issue of public concern. Toxic trace elements in atmospheric deposition are contributed from two main sources: natural and anthropogenic. The natural sources are mainly soil dusts, while anthropogenic sources come predominately from industrial and agricultural activities, traffic emission, coal burning, and biomass incineration. In characterizing the sources of toxic trace elements in atmospheric deposition, multiple methods have been used, such as multivariate statistical analysis, and table isotope fingerprints, such as lead, carbon, and oxygen isotopes [3,4,5,6,7,8,9,10]. During the past decade, many investigations of atmospheric deposition of toxic trace elements in different areas, especially in the cities, were carried out worldwide. A large number of studies were focused on toxic trace elements, such as As, Co, Cd, Cr, Cu, Hg, Mn, Mo, Ni, Pb, Se, and Zn, etc., in atmospheric deposition with particular attention to their distribution, fluxes, and sources [11,12,13,14,15,16,17,18,19,20], and recently some other studies have focused on the pollution and health risks of varied toxic trace elements in atmospheric deposition with various pollution indexes and hazardous quotients and hazardous indices. Using multiple indices to assess the pollution extent of toxic trace elements in atmospheric deposition has become a common approach by researchers [21,22,23,24,25,26,27,28,29,30,31,32]. In health risk assessment of toxic trace elements, the method recommended by the US Environmental Protection Agency is widely used in regards to atmospheric deposition [33,34,35].
The combination of flux measurement, source identification, and evaluation of the ecological and human health risks of toxic trace elements has become the major approach in atmospheric deposition monitoring and atmospheric pollution evaluation. Comparatively, most researchers pay more attention to toxic trace element pollution of atmospheric deposition in urban areas than that in vast rural areas, especially arid and semi-arid areas with little rainfall, low vegetation coverage, and serious soil desertification and salinization [7,36,37,38].
Atmospheric pollution has become an important environmental concern in the urban and rural areas in China. Therefore, a comprehensive investigation in urban and rural areas of the emission inventory of pollutants such as toxic trace elements, nutrients such as nitrogen and phosphorus, and organics such as pesticides, is urgently needed in China. The study area is located in the Baicheng-Songyuan areas, the western Jilin Province, Northeast China, where plentiful grass resources, hundreds of ponds and lakes, and several very important wetlands are distributed. The area is situated in the ecological zone of transition between the agricultural planting area and the pastoral area, and also in the typical transition zone between the semi-arid and the arid climates, so the ecological environment in the area is fragile. Improper land use and climate change have caused degradation, desertification, and soil alkalization, resulting in dust and saline storms frequently occurring in the area during the spring time, which may increase the emission of soil dust particles into the atmosphere. Previous atmospheric deposition studies in China have mainly focused on urban or industrial areas [10,12,13,14,15,16,17,18,19,21,28,32,38], but limited information about atmospheric deposition is available on the vast rural areas that are seriously affected by dust storms in North China [10] and Northeast China [7,36]. So far, no systematic investigation has been conducted on toxic trace elements in atmospheric deposition in the study area.
The objective of this study was to measure the concentrations of 12 toxic trace elements (As, Cd, Co, Cr, Cu, Hg, Mn, Mo, Ni, Pb, Se, and Zn) in dry and wet fraction in atmospheric deposition in the Baicheng-Songyuan areas, to determine their bulk fluxes of atmospheric deposition, to evaluate the pollution extent of toxic trace elements with geo-accumulation index, enrichment factor, and ecological risk indices in dry atmospheric deposition, and to assess human health risk of toxic trace elements in dry atmospheric deposition on adults and children through three exposure pathways.

2. Materials and Methods

2.1. Study Area

The study area is located in the Baicheng-Songyuan area, Jilin Province, Northeast China (Figure 1). The area is characterized by a temperate continental monsoon climate, with a short, windy, and dry spring, warm and rainy summer, sunshiny and cool autumn, and long and cold winter, with an annual mean temperature of about 3–6 °C, a yearly average rainfall of 350–550 mm and potential evaporation of 1600–2000 mm. The climate of the study area reflects a transitional zone between the semi-arid and arid climates in the west and the semi-humid climates in the east. The topography of the area is high in the northwest and low in the middle. The prevailing wind in the area is northwest to west in the winter, and southwest in other seasons, with a mean wind speed of 3.4–4.4 m/s. The sand and dust storms mostly appear from March to June each year, lasting about 120–130 days, and a haze resulting from crop stalk incineration often occurs in the winter and spring. Both sandstorms and haze create serious atmospheric pollution in Changchun, the capital of Jilin Province, and other downwind cities. Soils in the study area comprise mainly chestnut soil, sub-chernozem soil, chernozem soil, saline-alkali soil, and aeolian sandy soil. The study area is covered by 40–75% grassland. The vegetation includes mainly terraced hills steppe, plain meadow steppe grassland, and plain meadow grassland [39]. Some important wetlands, such as the Chagan wetland, the Yueliang wetland and the Xianghai wetland, are distributed in the area, and are considered as ecological barriers and freshwater fishing bases in Jilin Province.

2.2. Sample Collection and Pretreatment

A total of 56 atmospheric deposition sampling sites were chosen in the study area (Figure 1). Atmospheric deposition samples were taken using a self-designed collection container followed the protocol set by China Geological Survey [40] from July 2017 to June 2018. The sample collector was a cylindric porcelain container with an inner diameter of 20 cm, a height of 45 cm, and an available section area of 314 cm2. Prior to the sample collection, preparatory cleaning methods were used on the sample containers as follows: the containers were presoaked with 10% HCl solution for 24 h, then rinsed with deionized water, and air-dried at room temperature (20–25 °C). The cleaned and dried containers were transported to the sampling sites where they were positioned on the rooves of the farmers’ houses at sampling sites (Figure 1), at a height of about 3–4 m above the ground, and filled with 3000 mL deionized water to avoid re-suspension of collected soil particles. Sample sites were not near major roads, high buildings, big trees, and industrial pollution sources.
The collected atmospheric deposition samples were transported into the laboratory, where the dry and wet fractions of samples were separated by pumping filtration with 0.45 μm cellulose polyester ester filters (Millipore, 47 mm i.d.).
The wet fraction of a sample was the filtrates passing through a 0.45 μm filter. The volume and weight of the wet fraction through the filter were measured; then, it was transferred to a 500 mL plastic container, and stirred uniformly after adding 5 mL HNO3 (1:1, v/v), serving as a stock solution for analyzing multiple elements.
The dry fraction of a sample was the filtrate over the filter, which was air-dried or oven-dried at temperatures lower than 60 °C, then, weighed and ground with an agate mortar and passed through a 200-mesh sieve. The digested method for analyzing Cd, Co, Cr, Cu, Mn, Mo, Ni, Pb, and Zn in the dry fraction of a sample was as follows: weigh 0.1 g of the sieved portion of dry fraction sample with an accuracy of 0.0001 g as the test portion, and transfer it into a 50 mL polytetrafluoroethylene (PTFE) crucible. Moisten it with a small amount of water. Add 2.0 mL concentrated nitric acid, 2.0 mL hydrofluoric acid, 2.0 mL hydrochloric acid, and 1.0 mL perchloric acid separately into the crucible. The solution in the crucible was heated on a hot plate at a temperature of 200 °C until it was digested and evaporated into a white fume. The crucible was removed from the hot plate, and cooled at room temperature; then, 5.0 mL concentrated nitric acid was added to dissolve the residual, and the solution in the crucible was transferred into a 25 mL colorimetric tube with water and diluted with water to reach a 25 mL volume and mixed w. The final solution in the tube was used for testing Cd, Co, Cr, Cu, Mn, Mo, Ni, Pb, and Zn.
The digested method for analyzing As, Hg, and Se in the dry fraction of a sample was as follows: weigh 0.25 g of the sieved portion of the dry fraction sample with an accuracy of 0.0001 g as the test portion, then transfer it into a 50 mL colorimetric tube, and wet it with a small amount of water. Add 10.0 mL mixture of concentrated hydrochloric acid-nitric acid (3:1, v/v) into the tube. Cover the tube with a lid, then mix it. The tube was placed on a boiling water bath and digested for 2 h, and stirred for several times during the water bath period. After removing the tube from the water bath, it was cooled to room temperature, and diluted with water until the solution reached a volume of 50 mL. Then, 10.0 mL solution was transferred into a 25 mL colorimetric tube, 5.0 mL of concentrated hydrochloric acid and 2.5 mL thiourea solution (50 g/L) was added, and it was diluted with water to reach a 25 mL volume, and mixed. Afterwards, we let the tube stand for 30 min, and the final digested solution in the tube was used for testing As, Hg, and Se.

2.3. Sample Analysis and Quality Controls

Both the dry and wet fractions of an atmospheric deposition sample were analyzed on the basis of the final digested solutions by pretreatment of the sample. For the wet fraction of a sample, As, Hg, and Se levels were determined with an atomic fluorescence spectrometer (AFS-230E, Langfang, China), and Cd, Co, Cr, Cu, Mn, Mo, Ni, Pb, and Zn were measured with an inductively coupled plasma mass spectrometer (ICP-MS, VG PQ ExCell, Thermo Elemental, Franklin, MA, USA). The detection limits of toxic trace elements were As 0.01 μg/L, Cd 0.01 μg/L, Co 1.0 μg/L, Cr 1.0 μg/L, Cu 1.0 μg/L, Hg 0.001 μg/L, Mn 1.0 μg/L, Mo 1.0 μg/L, Ni 1.0 μg/L, Pb 0.01 μg/L, Se 0.01 μg/L, and Zn 1.0 μg/L, respectively. For the dry fraction of a sample, Co, Cr, Cu, Mn, Ni, Pb, and Zn were measured by inductively coupled plasma atomic emission spectrometer (ICP-AES, IRIS Intrepid II XPS, Thermo Fisher, Waltham, MA, USA). As, Hg, and Se were measured with an atomic fluorescence spectrometer (AFS-230E, Langfang, China). Cd was analyzed by a graphite furnaced atomic absorption spectrometer (GF-AAS, M6, Thermo Elemental, Franklin, MA, USA), and Mo was determined by an inductively coupled plasma mass spectrometer (ICP-MS, VG PQ ExCell, Thermo Elemental, Franklin, MA, USA). The detection limits of toxic trace elements were As 0.6 mg/kg, Cd 0.01 mg/kg, Co 2 mg/kg, Cr 3 mg/kg, Cu 1 mg/kg, Hg 0.005 mg/kg, Mn 10 mg/kg, Mo 0.3 mg/kg, Ni 2 mg/kg, Pb 2 mg/kg, Se 0.01 mg/kg, and Zn 2 mg/kg, respectively. In order to facilitate the evaluation of contamination and sources of toxic trace elements, Al and Fe contents in both fractions of a sample were also analyzed. For the wet fraction of a sample, Al and Fe were measured with ICP-MS (VG PQ ExCell, Thermo Elemental, Franklin, MA, USA), and detection limits were 0.01 mg/L for Al, and 0.05 mg/L for Fe, respectively. For the dry fraction of a sample, Al and Fe were determined with ICP-AES (IRIS Intrepid II XPS, Thermo Fisher, Waltham, MA, USA); detection limits were 0.05% and 0.05%, respectively.
For quality control (QC) and quality assurance (QA), the reagents and chemicals used in the study were of the super grades, and blank control, duplicate samples, and standard reference materials from the Center for Certified Reference Materials, China (GSS-1 and GSS-3) were used to ascertain the accuracy and precision of analytical methods. Blank samples were used throughout all of the experiments as well. The analytical precision for duplicate samples was within ±5%. The precision (RSD) and accuracy (RE) for analyzing standard substances with different analytical methods were −5.01–4.95% and 1.07–5.75%, respectively. The recovery rate of toxic trace elements was in the range of 95.3–105.9%. The concentrations of toxic trace elements in both wet and dry fractions in atmospheric deposition samples were all above their corresponding detection limits. Therefore, the analytical results of toxic trace elements were reliable and could be used for this study.

2.4. Pollution and Ecological Risk Evaluation Methods

2.4.1. Geo-Accumulation Index

A geo-accumulation index (Igeo) was used to characterize contamination of toxic trace elements in dry atmospheric deposition, as defined in Equation (1):
I g e o = log 2 C i / 1.5 B i
where C i is the measured concentration of toxic trace element i, B i is a background or reference concentration of same metal i, and 1.5 is a correction constant. In general, the concentration of toxic trace elements in shale average value was often used for B i ; however, the averaged contents of toxic trace elements in the surface soil data from mid-west Jilin Province [41] were applied for B i in this study to facilitate the interpretation of EF of toxic trace elements. Seven contamination categories were classified based on Igeo [42]: Igeo < 0 practically uncontaminated; 0 < Igeo < 1 uncontaminated to moderately contaminated; 1 < Igeo < 2 moderately contaminated; 2 < Igeo < 3 moderately to heavily contaminated; 3 < Igeo < 4 heavily contaminated; 4 < Igeo < 5 heavily to very heavily contaminated; Igeo > 5 very heavily contaminated.

2.4.2. Enrichment Factor

The enrichment factor (EF) was used to assess the degree of the enrichment, depletion, or possible specific sources of toxic trace elements in dry atmospheric deposition [15], as defined in Equation (2):
E F = ( C i C r e f ) / ( B i B r e f )
where C i and C r e f are the measured concentrations of toxic trace element i and reference element for normalization, respectively; B i and B r e f are the contents of the toxic trace element i and reference element, respectively. In this study, Al was chosen as the reference element. Here, the surface soil data from the mid-west Jilin Province [41] rather than the upper continental crust data were used for EF calculations in order to reduce the primary uncertainty resulting from the differences between chemical composition of local soil and reference crustal composition. Five enrichment categories were recognized on the basis of EF [43,44]: EF < 2, deficiency to minimal enrichment; EF = 2–5, moderate enrichment; EF = 5–20, significant enrichment; EF = 20–40, very high enrichment; EF > 40, extremely high enrichment.

2.4.3. Potential Ecological Risk Index

The potential ecological risk index (RI) proposed by Hakanson [45] was used to assess the potential ecological risk posed by toxic trace elements in dry atmospheric deposition, which was calculated using Equation (3):
R I = i = 1 n E r i = i = 1 n T i C f i = i = 1 n T i C s i C n i
where E r i is the potential ecological risk factor (Er) of toxic trace element i, RI is the potential ecological risk index of multiple toxic trace elements, C f i is the pollution coefficient of toxic trace element i, Ti is the toxic response factor of toxic trace element i. The values for toxic trace elements were Cu = Ni = Pb = Co = 5, Mn = Zn = 1, As = 10, Cd = 30, Hg = 40, and Mo = Se = 15, respectively [46,47,48,49]. C s i is the concentration of toxic trace element i, C n i is the background level of toxic trace element i. The averaged concentrations of toxic trace elements in the surface soil data from mid-west Jilin Province [43] were used as the background level of toxic trace elements. The following criteria values were used to assess the ecological risk levels [45]: E r i < 40, low risk; 40 ≤ E r i < 80, moderate risk; 80 ≤ E r i < 160, considerable risk; 160 ≤ E r i < 320, high risk; E r i ≥ 320, serious risk. RI <150, low risk; 150 ≤ RI < 300, moderate risk; 300 ≤ RI < 600, considerable risk; RI ≥ 600, very high risk.

2.5. Health Risk Assessment

The health risks posed by toxic trace elements in dry atmospheric deposition were evaluated with the method recommended by the US Environmental Protection Agency [33,34,35].
For non-carcinogenic risk assessment of As, Cd, Co, Cr, Cu, Hg, Mn, Mo, Ni, Pb, Se, and Zn in dry atmospheric deposition, their average daily dose (ADD), hazard quotient (HQ), and the hazard index (HI) through ingestion (hand-mouth route), inhalation (mouth-nose route), and dermal absorption (skin contact) were estimated using Equations (4)–(8), respectively:
A D D i n g = C × I n g R × E F × E D × C F B W × A T
A D D i n h = C × I n h R × E F × E D P E F × B W × A T
A D D d e r m = C × S A × S L × A B F × E F × E D × C F B W × A T
H Q = A D D R f D
H I = i = 1 n H Q = H Q i n g + H Q i n h + H Q d e r m   = A D D i n g R f D   + A D D i n h R f D + A D D d e r m R f C
where ADD (mg/kg·d) represents the dose through ingestion (ADDing), inhalation (ADDinh), and dermal absorption (ADDderm). Hazard quotient (HQ) is calculated as ADD divided by reference dose (RfD). The hazard index (HI) is the sum of HQ. If HQ or HI values of toxic trace elements is below one, the non-carcinogenic risk or the adverse health effects may be low or negligible. If HQ or HI is over one, non-carcinogenic risk or adverse health effects may be indicated.
For carcinogenic risk assessment of As, Cd, and Cr in dry atmospheric deposition, their carcinogenic risks (CR) and total carcinogenic risk (TCR) were calculated as Equations (9)–(10), respectively:
C R = A D D × S F
T C R = i n C R i = i n A D D × S F = A D D i n g × S F i n g + A D D i n h × S F i n h + A D D d e r m × S F d e r m
where carcinogenic risk ( C R i ) for toxic trace element i via three exposure pathways is calculated by the chronic daily dose (ADD) with the corresponding cancer slope factor (SF), respectively. TCR is the sum of C R i . The carcinogenic risks can be divided into three levels: CR < 10−6, negligible; 10−6 < CR < 10−4, tolerable or acceptable; CR > 10−4, considerable or high.
The parameters and reference values used in the Equations (4)–(9) are listed in Table 1 and Table 2.

2.6. Multivariate Statistical Analysis

PCA with varimax rotation and Kaiser normalization was carried out to minimize the number of variables with high loading on each component, interpreted in accordance with the possible sources of toxic trace elements in dry atmospheric deposition.
CA was performed with the standardized data by Z score using Ward’s method with squared Euclidean distances to group toxic trace elements with similar origin or sources, and to check and supplement PCA results.
Geostatistical analysis was carried out employing MapGis 6.7 software with Kriging interpolation to characterize the spatial distribution of elements in atmospheric deposition.
Geostatistical analysis was carried out employing MapGis 6.7 software with Kriging interpolation to characterize the spatial distribution of toxic trace elements in dry atmospheric deposition, which was helpful for finding hot spots or assessing pollution sources of toxic trace elements in dry atmospheric deposition.

3. Results and Discussions

3.1. Concentrations of Toxic Trace Elements in Atmospheric Deposition

3.1.1. Dry Atmospheric Deposition

The concentrations of toxic trace elements in dry and wet fractions of atmospheric depositions from the study area are listed in Table 3. The toxic trace elements in dry atmospheric deposition followed a decreasing abundance order of Mn > Zn > Cr > Pb > Cu > Ni > As > Co > Mo > Cd > Se > Hg. Mn, Zn, and Cr had mean concentrations of 415.36 mg/kg, 105.69 mg/kg, and 46.53 mg/kg, respectively (Table 3), while Hg had the lowest mean concentration of 0.061 mg/kg. The mean concentrations of Cd, Zn, Hg, Cu, Mo, Se, and Pb in dry atmospheric deposition were higher than their corresponding values in soils from the mid-west Jilin Province [43]. The variation coefficients (VC, mean/standard derivation) of toxic trace elements in dry atmospheric deposition were less than one, with a decreasing order of Cd > Cu > Se > Hg > Zn > Mo > Ni > Pb > As > Co > Cr = Mn. Lower CV values for Co, Cr, and Mn indicate that their concentrations were less variable, implying that they were mainly from natural sources, while higher CV values for Cd, Cu, Hg, Mo, Se, and Zn suggested a wide variation in their concentrations, resulting from the effects of anthropogenic activities. Al had the lowest mean VC value of 0.12, reflecting that Al is a less variable and conservative element in dry atmospheric deposition, so Al was chosen as the reference element to calculate the enrichment factor in this study.

3.1.2. Wet Atmospheric Deposition

The mean concentrations of Mn and Zn were 495.02 μg/L, 318.75 μg/L, respectively (Table 3), while Hg had a minimum mean concentration of 0.041 μg/L. The concentrations of toxic trace elements in wet atmospheric deposition decreased in the order of Mn > Zn > As > Pb > Cr > Ni > Cu > Co > Mo > Se > Cd > Hg. In wet atmospheric deposition, Cd and Pb had VC values of more than one, while other toxic trace elements had values less than one. The concentrations of toxic trace elements in wet atmospheric deposition actually included the dissolved materials in precipitation and dry atmospheric deposition.

3.2. Atmospheric Deposition Fluxes

3.2.1. Bulk Atmospheric Deposition Fluxes

Bulk atmospheric deposition fluxes of toxic trace elements in the study area were obtained as the sum of both dry and wet deposition fluxes, which were calculated using Equation (11):
Q = ( C d × W d + C w × V w ) ÷ S
where Q is the annual atmospheric deposition fluxes (mg/m2/year) of toxic trace elements of interest, Cd and Wd represent the concentration (mg/kg) and the weight (g) of toxic trace elements of interest in the dry fraction of an atmospheric deposition sample, Cw and Vw denote the concentration (mg/L) and the volume of toxic trace elements of interest in the wet fraction of an atmospheric deposition sample, and S is the available section area of sampling container (314 cm2).
The annual mean atmospheric deposition fluxes of toxic trace elements are shown in Table 4. The yearly atmospheric depositional bulk fluxes of t toxic trace elements in the study area decreased in the order of Mn > Zn > Cr > Pb > Cu > Ni > As > Co > Mo > Cd > Se > Hg. Mn had bulk atmospheric depositions of 237.41 mg/m2/year, while Hg had the lowest annual mean atmospheric depositions of 0.02 mg/m2/year. The annual deposition fluxes of toxic trace elements in dry atmospheric depositions were much greater than those in wet atmospheric depositions, implying that dry atmospheric deposition predominated in the study area. Therefore, the main concern regarding toxic trace elements in dry atmospheric deposition in the study area should be evaluating their source, and ecological and health risks in atmospheric deposition.
The fluxes for As, Co, Cr, Mn, and Ni in dry atmospheric deposition exceeded those reported atmospheric deposition for other regions in China (Table 4), while the depositional fluxes for Cd, Cu, Hg, Pb, and Zn were comparatively lower than those reported for other regions in China [12,13,14,17,19,53], implying that the atmospheric emissions of As, Co, Cr, Mn, and Ni in the study area are higher than those in other areas.

3.2.2. Spatial Variations of Bulk Atmospheric Deposition Fluxes

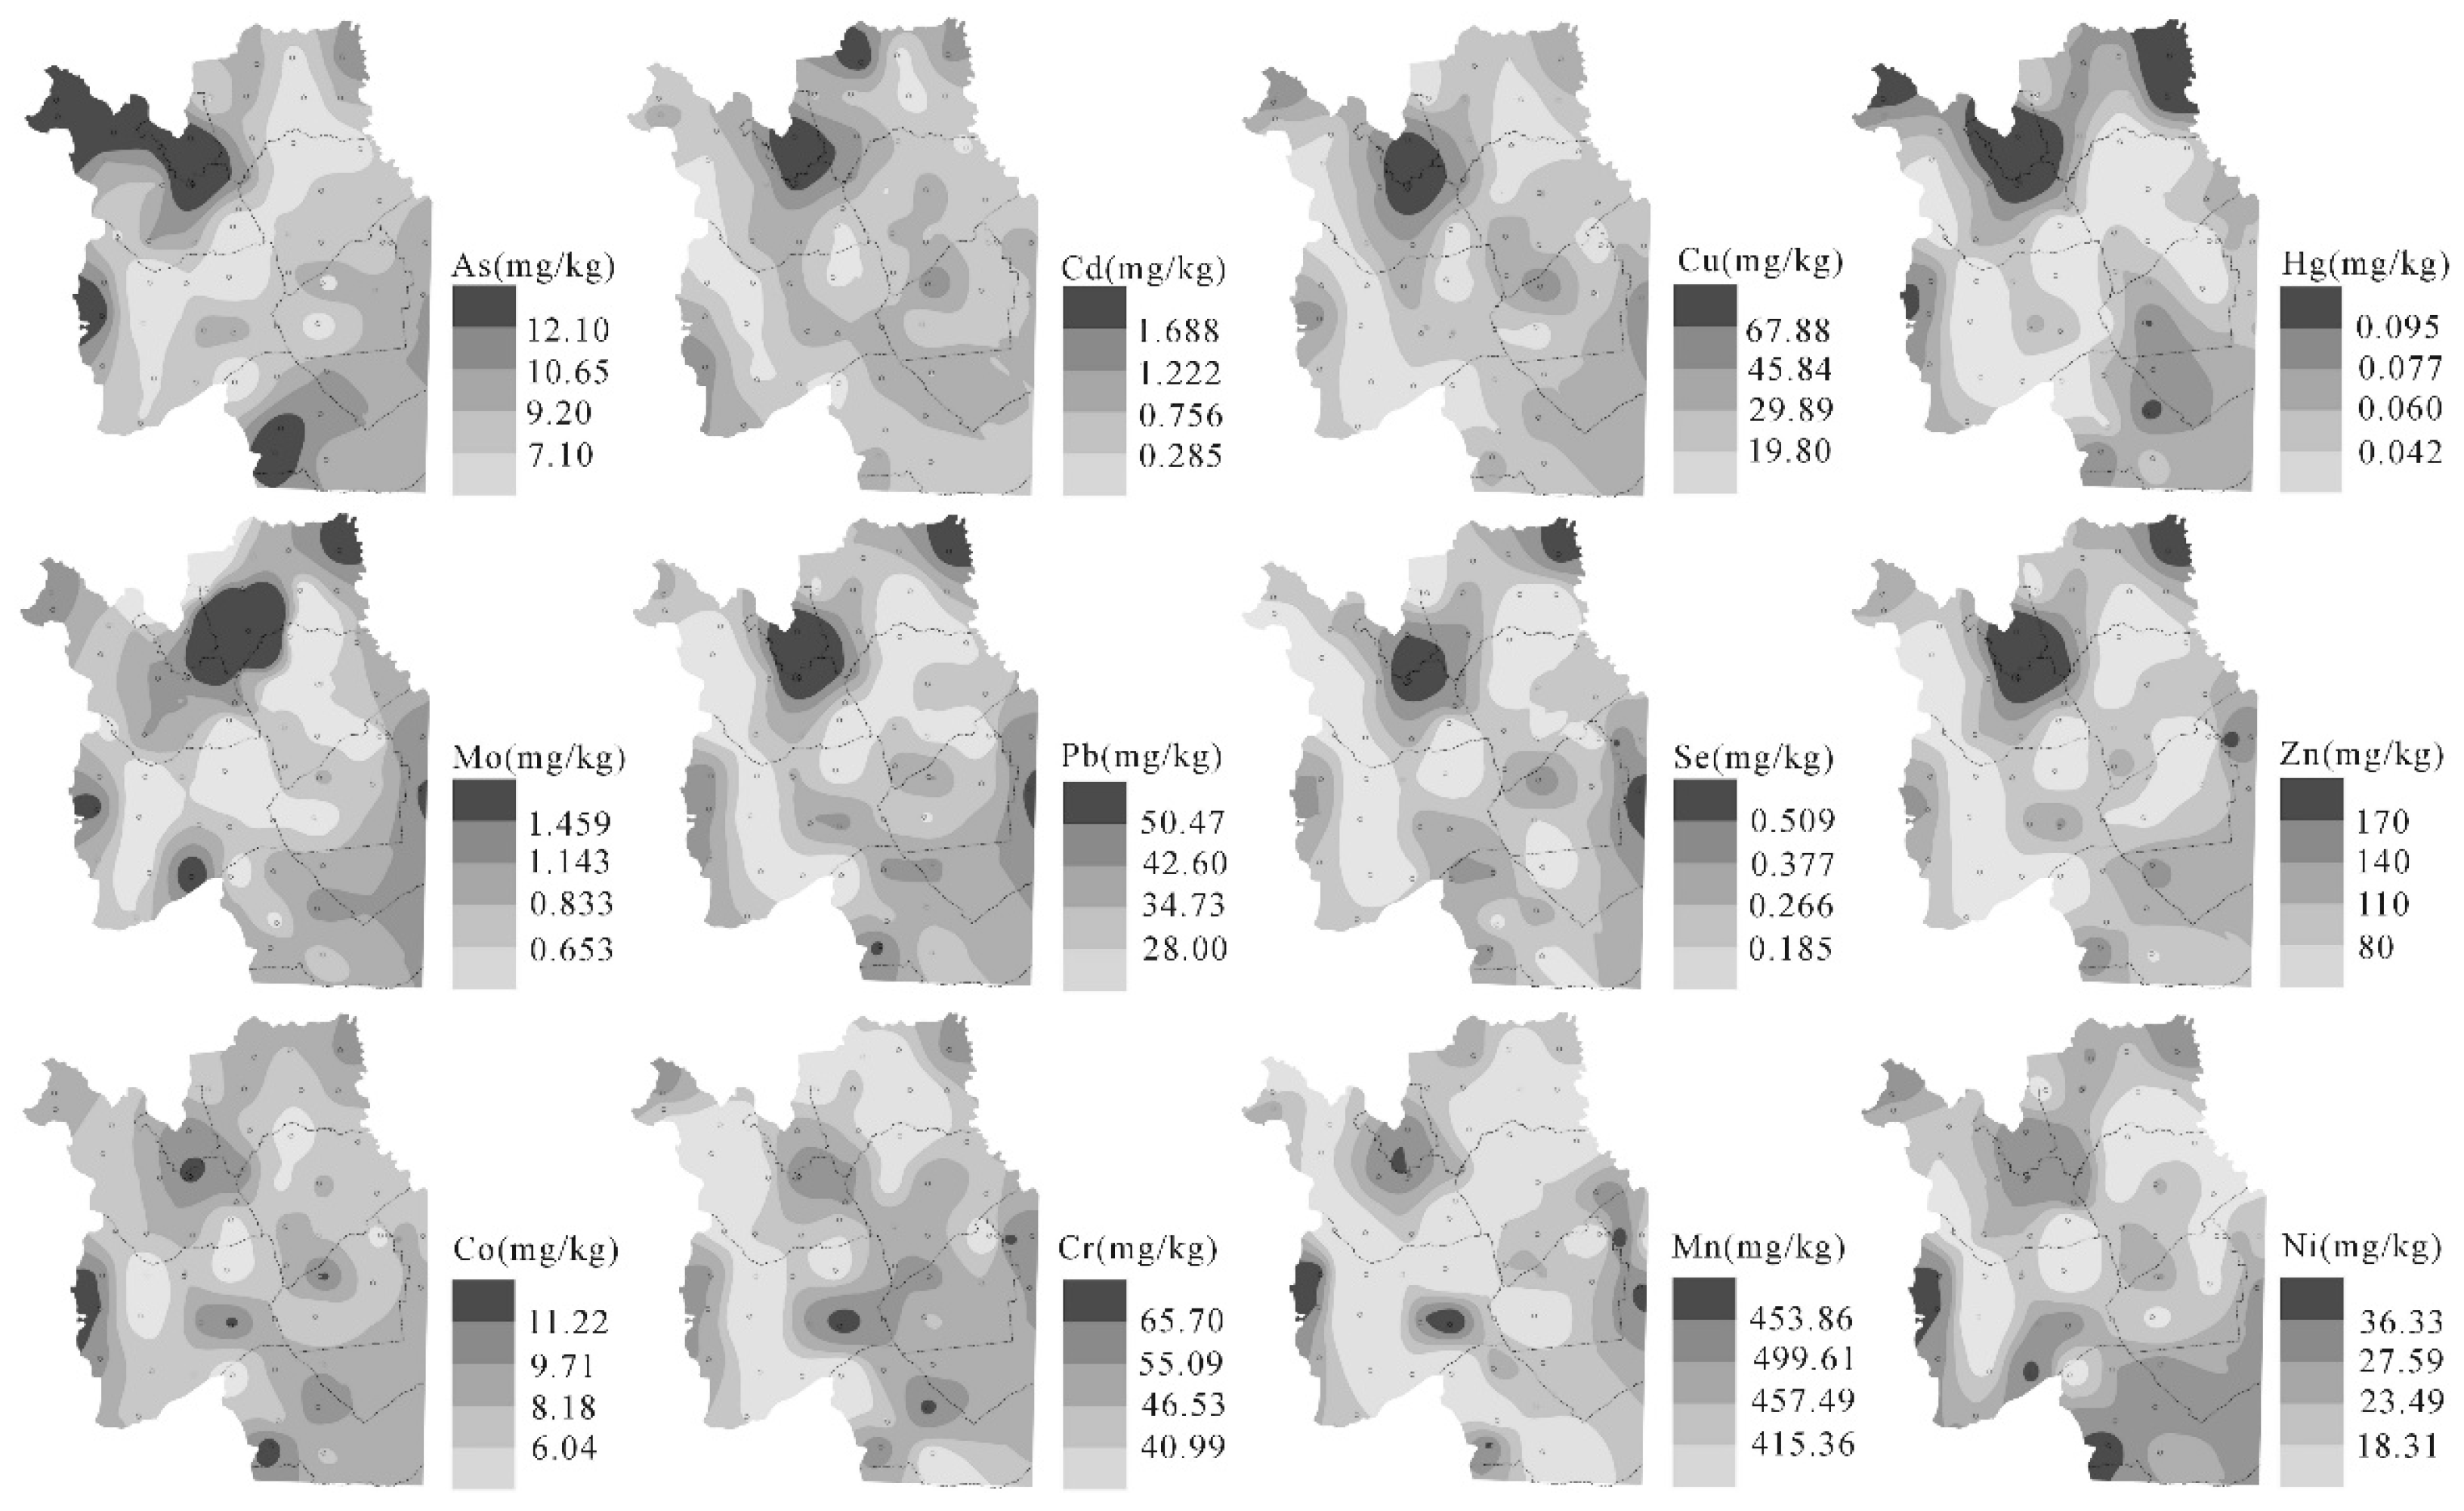
The annual bulk accessions of toxic trace elements through atmospheric deposition showed a clear spatial heterogeneity in different counties in the study area (Figure 2). Comparatively, the yearly depositional fluxes for most toxic trace elements in Tongyu and Taonan counties were substantially higher than those in other counties. The calculated bulk depositional fluxes for As, Co, Cr, Mn, and Ni in the study area exceeded those reported for other regions in China (Table 4), while the bulk depositional fluxes for Cd, Cu, Hg, Pb, and Zn were comparatively lower than those reported for other regions in China [12,13,17], implying that the atmospheric emissions of toxic trace elements such as As, Co, Cr, Mn, and Ni in the study area are higher than those in other regions.

3.3. Ecological Risk Assessment

3.3.1. Evaluation with Geo-Accumulation Index

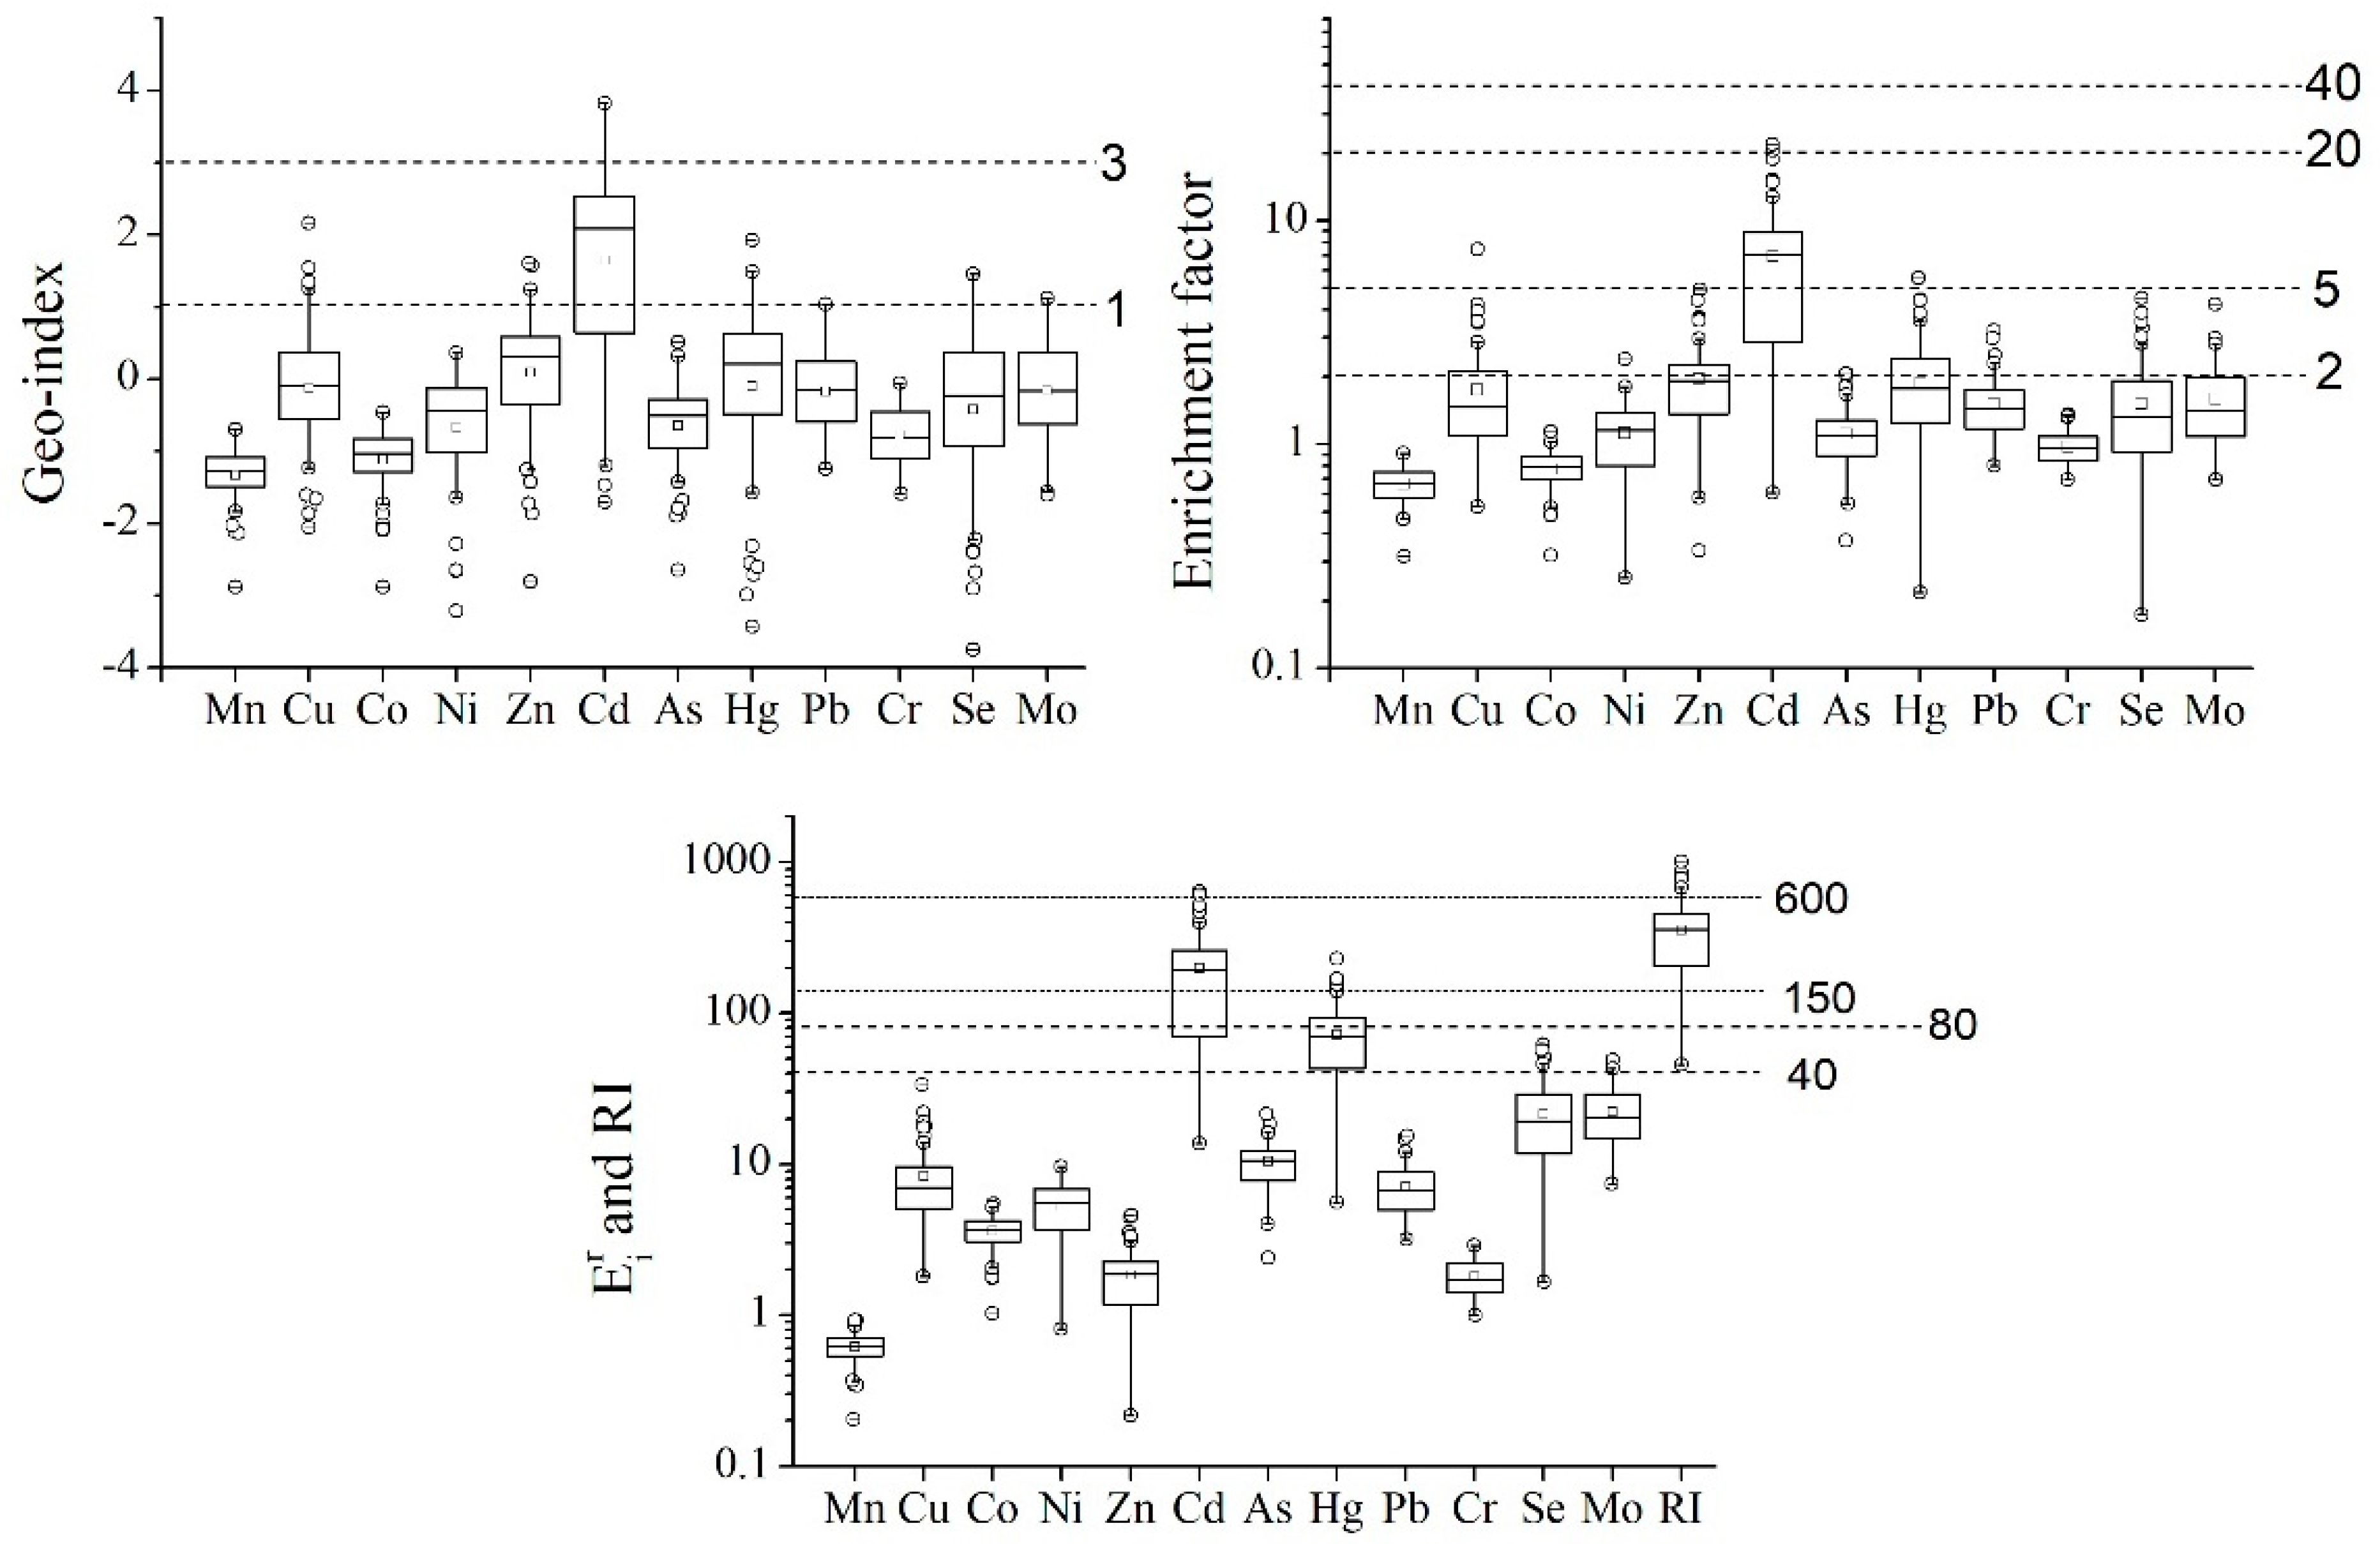
The variation ranges and mean Igeo values for toxic trace elements in dry atmospheric deposition are shown in Figure 3. Igeo values of As, Cd, Co, Cr, Cu, Hg, Mn, Mo, Pb, Se, Ni, and Zn were −2.65–0.52, −1.71–3.82, −2.88–−0.46, −1.59–−0.05, −2.06–2.17, −3.43–1.93, −2.89–−0.07, −1.61–1.12, −3.21–0.36, −1.24–1.04, −3.75–1.45, and −2.88–1.60, respectively. The mean Igeo values of toxic trace elements decreased in the order of Cd (1.65) > Zn (0.09) > Hg (−0.10) > Cu (−0.12) > Mo (−0.16) > Pb (−0.17) > Se (−0.42) > As (−0.64) > Ni (−0.67) > Cr (−0.77) > Co (−1.12) > Mn (−1.33). The Igeo values of Mn, Co, Ni, Cr, and As in all samples were less than one, indicating no contamination. Cu and Hg in 10.7% samples, Zn in 8.9%, Pb and Mo in 1.8%, and Se in 7.1% exceeded one, implying that these elements did not contaminate most samples. Igeo values of Cd of more than one were present in 70% of samples; 14%, 45%, and 11% of samples had Igeo values of Cd in the range of 1–2, 2–3, and 3–4, respectively, indicating that most samples were moderately to heavily contaminated with Cd.

3.3.2. Evaluation with Enrichment Factor

The EF values of toxic trace elements in dry atmospheric deposition of each sample were calculated related to their corresponding background values in soils from the mid-east Jilin province [41]. The EF variation ranges of As, Cd, Co, Cr, Cu, Hg, Mn, Mo, Pb, Se, Ni, and Zn were 0.37–2.07, 0.61–21.91, 0.32–1.14, 0.69–1.35, 0.53–7.44, 0.22–5.54, 0.32–0.91, 0.69–4.23, 0.25–2.41, 0.81–3.32, 0.17–4.53, and 0.34–4.93, respectively (Figure 3). The mean EF values of toxic trace elements were in a decreasing order of Cd (6.97) > Zn (1.96) > Hg (1.89) > Cu (1.76) > Mo (1.60) > Pb (1.52) = Se (1.52) > As (1.12) = Ni (1.12) > Cr (0.98) > Co (0.78) > Mn (0.66). The EF values of Mn, Co, and Cr in all samples were less than 2, indicating that they had little to minimal enrichment. Cd had 26.8% EF values in the range 2–5, 55.4% EF values in the range 5–20, and 3.6% EF values in the range 20–40, respectively, indicating that Cd was moderately to highly enriched in most samples. The EF values of Zn in 44.6% samples, Hg in 37.5%, Cu and Mo in 25%, Se in 23.2%, Pb in 12.5%, As in 3.6%, and Ni in 1.8% were in the range of 2–20, implying that those elements in some samples were moderately and significantly enriched.

3.3.3. Ecological Risk Evaluation

The potential ecological risk coefficient ( E r i ) and ecological risk index (RI) of toxic trace elements in dry atmospheric deposition are shown in Figure 3. The E r i values of Mn, Cu, Co, Ni, Zn, As, Pb, and Cr in all samples were less than 40, indicating these toxic trace elements had low ecological risk. The E r i values of Se, Mo, Hg, and Cd were in the ranges 1.67–61.58, 7.38–48.93, 5.58–228.54, and 13.77–637.41, with their average values being 21.44, 22.27, 71.76, and 198.25, respectively. The E r i values of Se in 10.7% samples, and Mo in 5.4% samples exceeded 40, implying that both elements in most samples were of low ecological risk. The E r i values of Cd in 87.5% samples, and Hg in 76.8% were over 40, indicating that Cd and Hg had the highest potential ecological risk in the study area. The samples with E r i values of Cd in the ranges 40–80, 80–160, 160–320, and over 320 accounted for 14.3%, 14.3%, 42.9%, and 16.1%, respectively, indicating Cd was a moderate to serious risk. The samples with E r i values of Hg in the ranges of 40–80, 80–160, and 160–320 accounted for 39.3%, 32.1%, and 19.4%, respectively, indicating Hg was a moderate to high risk. RI values ranged from 45.66 to 1010.1, with a mean value of 352.7. The samples with RI values of 150–300, 300–600, and over 600 accounted for 23.2%, 55.4%, and 3.6%, respectively, reflecting that toxic trace elements in dry atmospheric deposition in most samples posed a moderate to considerable potential ecological risk.

3.4. Health Risk Assessment

3.4.1. Non-Carcinogenic Risk Evaluation

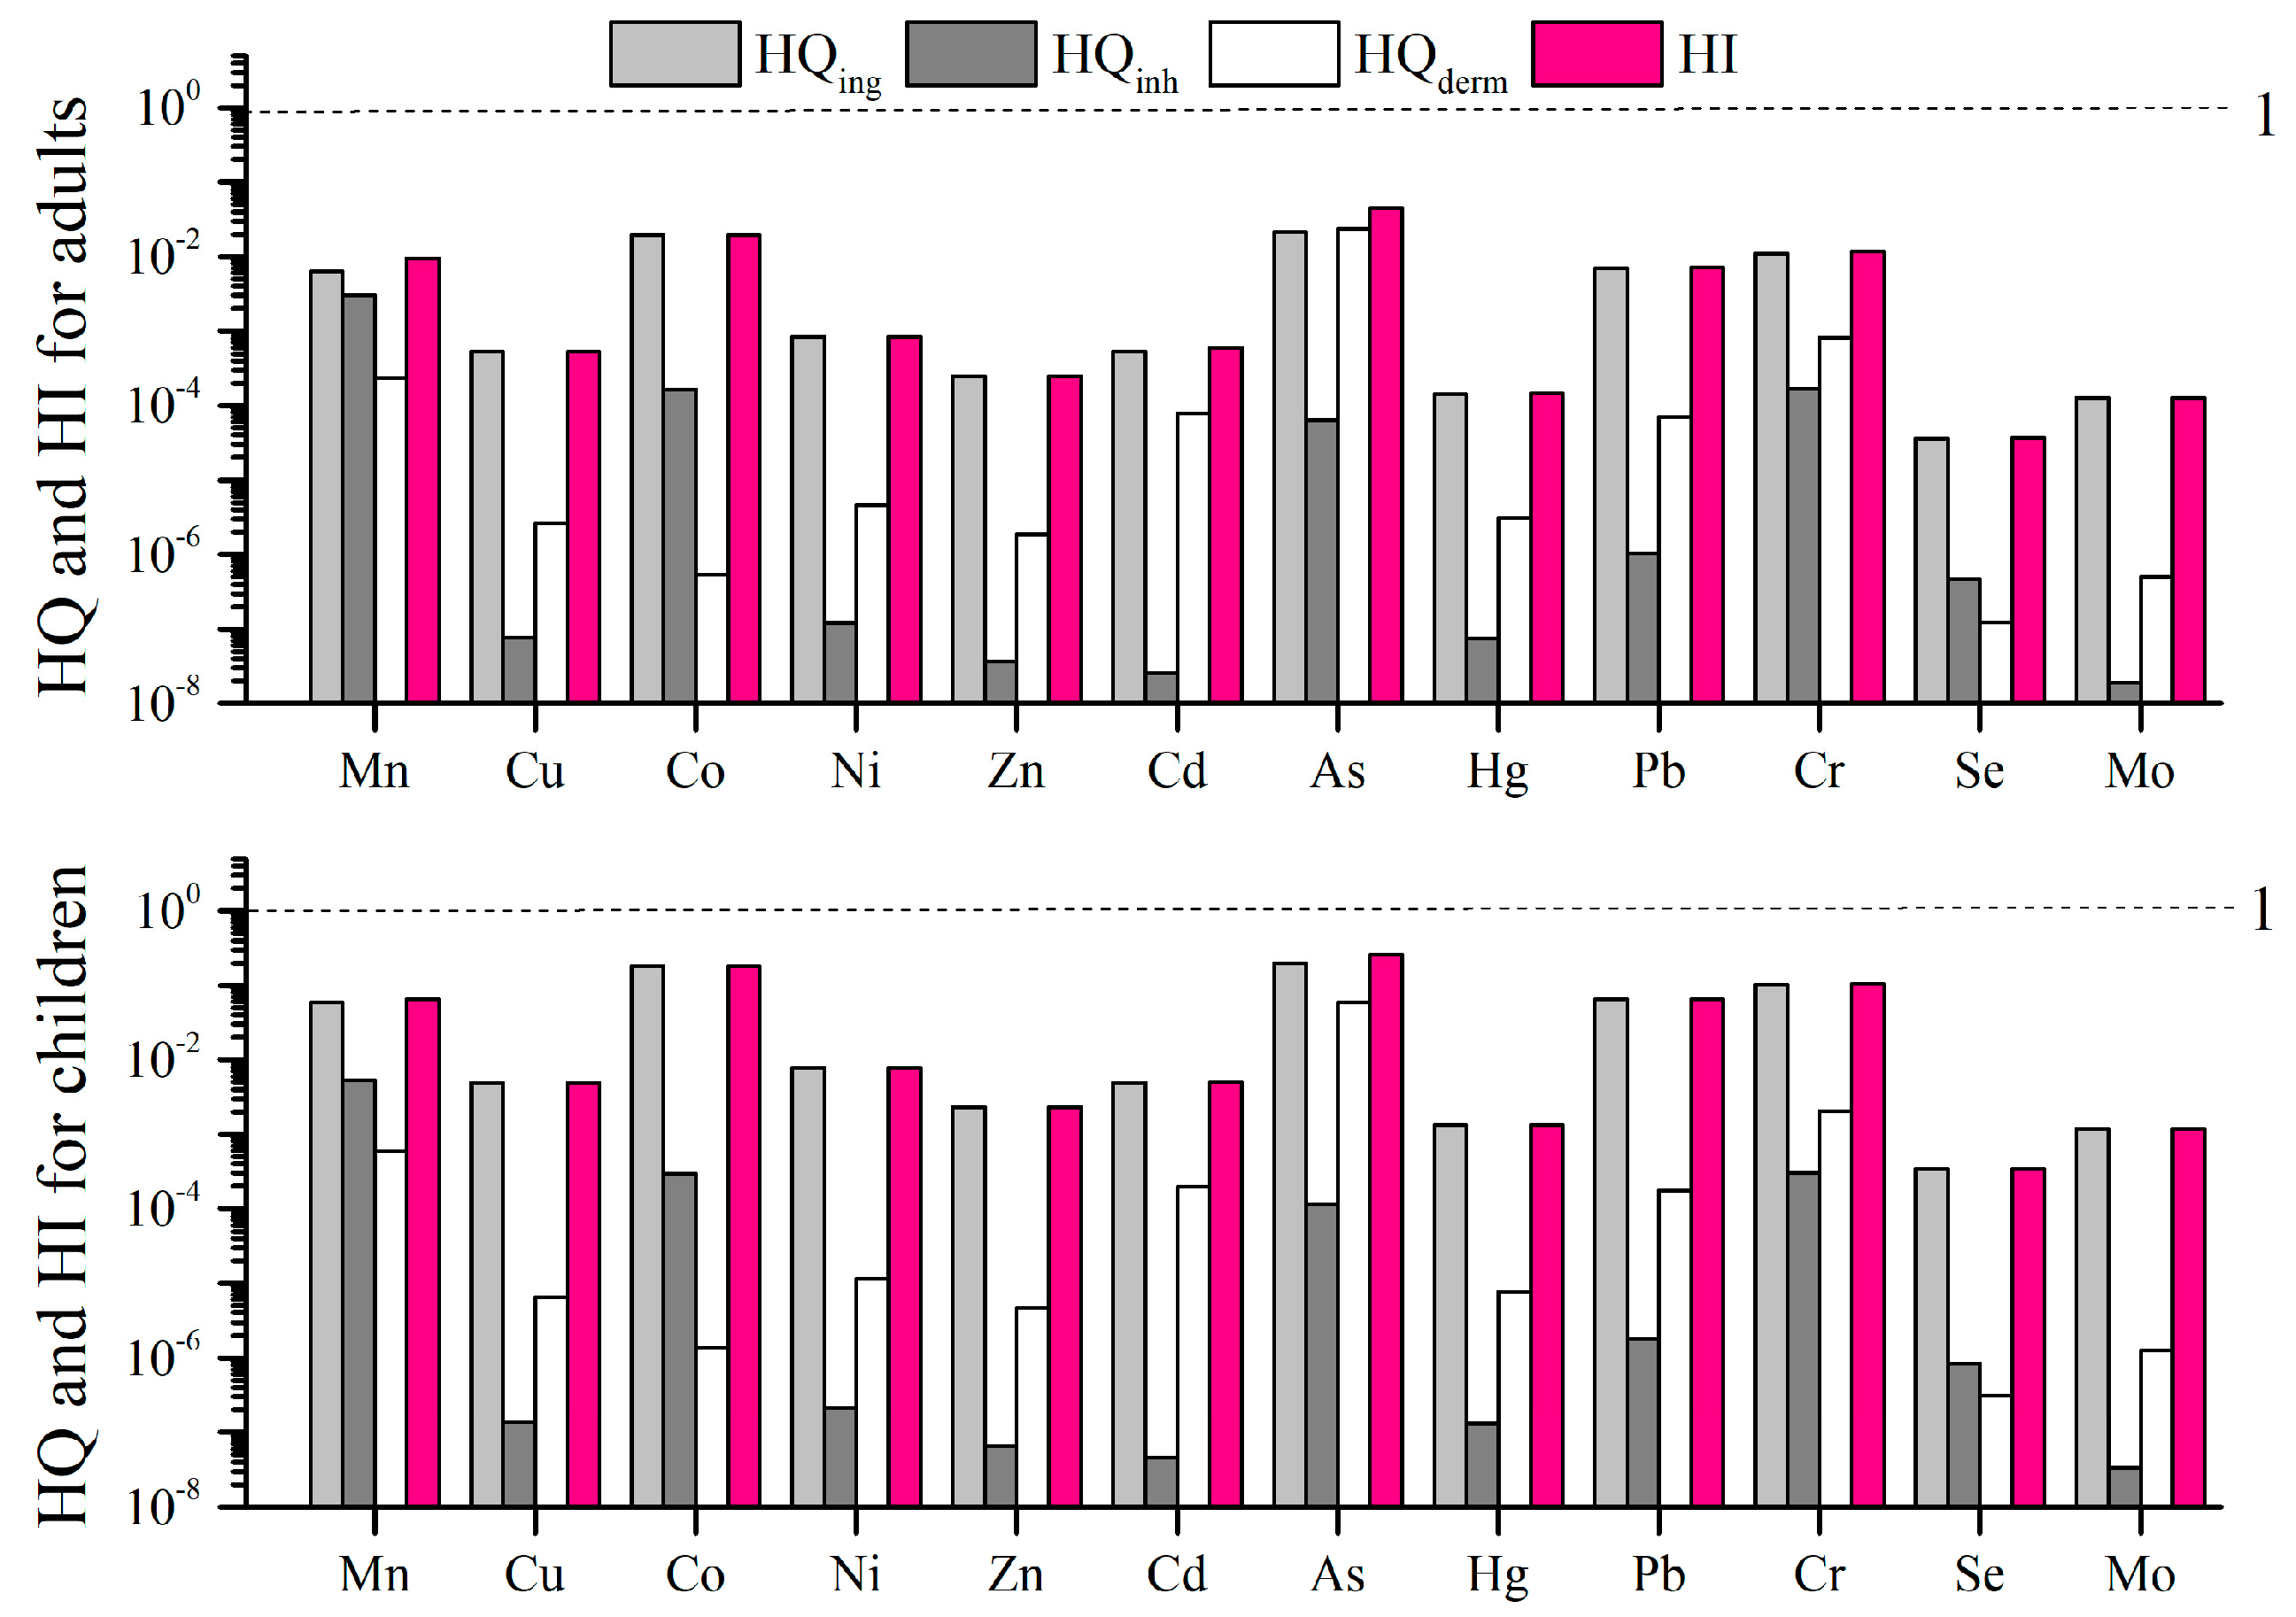
The results of health risk for non-carcinogenic and carcinogenic effects on children and adults are presented in Table 3. The average values of HQ via the ingestion pathway were generally higher than those through pathways of inhalation and dermal contact for adults and children (Figure 4). Moreover, HQ values of toxic trace elements calculated for children were generally greater than those for adults, meaning that adults have more tolerance than children. The HI values of As, Cd, Co, Cr, Cu, Hg, Mn, Mo, Pb, Se, Ni, and Zn for adults were in the range of 1.04 × 10⁻²–9.32 × 10⁻², 4.20 × 10⁻⁵–1.94 × 10⁻³, 5.46 × 10⁻³–2.92 × 10⁻², 6.57 × 10⁻³–1.90 × 10⁻², 1.14 × 10⁻⁴–2.14 × 10⁻³, 1.14 × 10⁻⁵–4.66 × 10⁻⁴, 3.16 × 10⁻³–1.44 × 10⁻², 4.24 × 10⁻⁵–2.82 × 10⁻⁴, 3.15 × 10⁻³–1.53 × 10⁻², 2.86 × 10⁻⁶–1.06 × 10⁻⁴, 1.28 × 10⁻⁴–1.52 × 10⁻³, 2.91 × 10⁻⁵–6.16 × 10⁻⁴, with the mean HI values of 4.52 × 10⁻², 6.05 × 10⁻⁴, 1.94 × 10⁻², 1.19 × 10⁻², 5.29 × 10⁻⁴, 1.46 × 10⁻⁴, 9.61 × 10⁻³, 1.28 × 10⁻⁴, 7.06 × 10⁻³, 3.68 × 10⁻⁵, 8.32 × 10⁻⁴, Zn 2.50 × 10⁻⁴, respectively. The HI value variations of As, Cd, Co, Cr, Cu, Hg, Mn, Mo, Pb, Se, Ni, and Zn for children were 5.98 × 10⁻²–5.37 × 10⁻¹, 3.55 × 10⁻⁴–1.64 × 10⁻², 5.06 × 10⁻³–2.70 × 10⁻¹, 5.75 × 10⁻²–1.66 × 10⁻¹, 1.06 × 10⁻³–1.99 × 10⁻², 1.05 × 10⁻⁴–4.28 × 10⁻³, 2.15 × 10⁻²–9.79 × 10⁻², 3.95 × 10⁻⁴–2.62 × 10⁻³, 2.92 × 10⁻²–1.42 × 10−1,2.64 × 10−5–9.75 × 10⁻⁴, 1.19 × 10⁻³–1.42 × 10⁻², 2.70 × 10⁻⁴–5.72 × 10⁻³, with the mean HI values of 2.60 × 10⁻¹, 5.11 × 10⁻³, 1.94 × 10⁻², 1.08 × 10⁻¹, 1.04 × 10⁻¹, 4.92 × 10⁻³, 6.53 × 10⁻², 1.19 × 10⁻³, 6.54 × 10⁻², 3.04 × 10⁻⁴, 7.73 × 10⁻³, 2.32 × 10⁻³, respectively. The mean HQ and HI (Table 5, Figure 4) values of toxic trace elements for all three pathways were less than one, indicating that no non-carcinogenic effects to adults and children were posed by toxic trace elements in dry atmospheric deposition the study area.

3.4.2. Carcinogenic Risk Evaluation

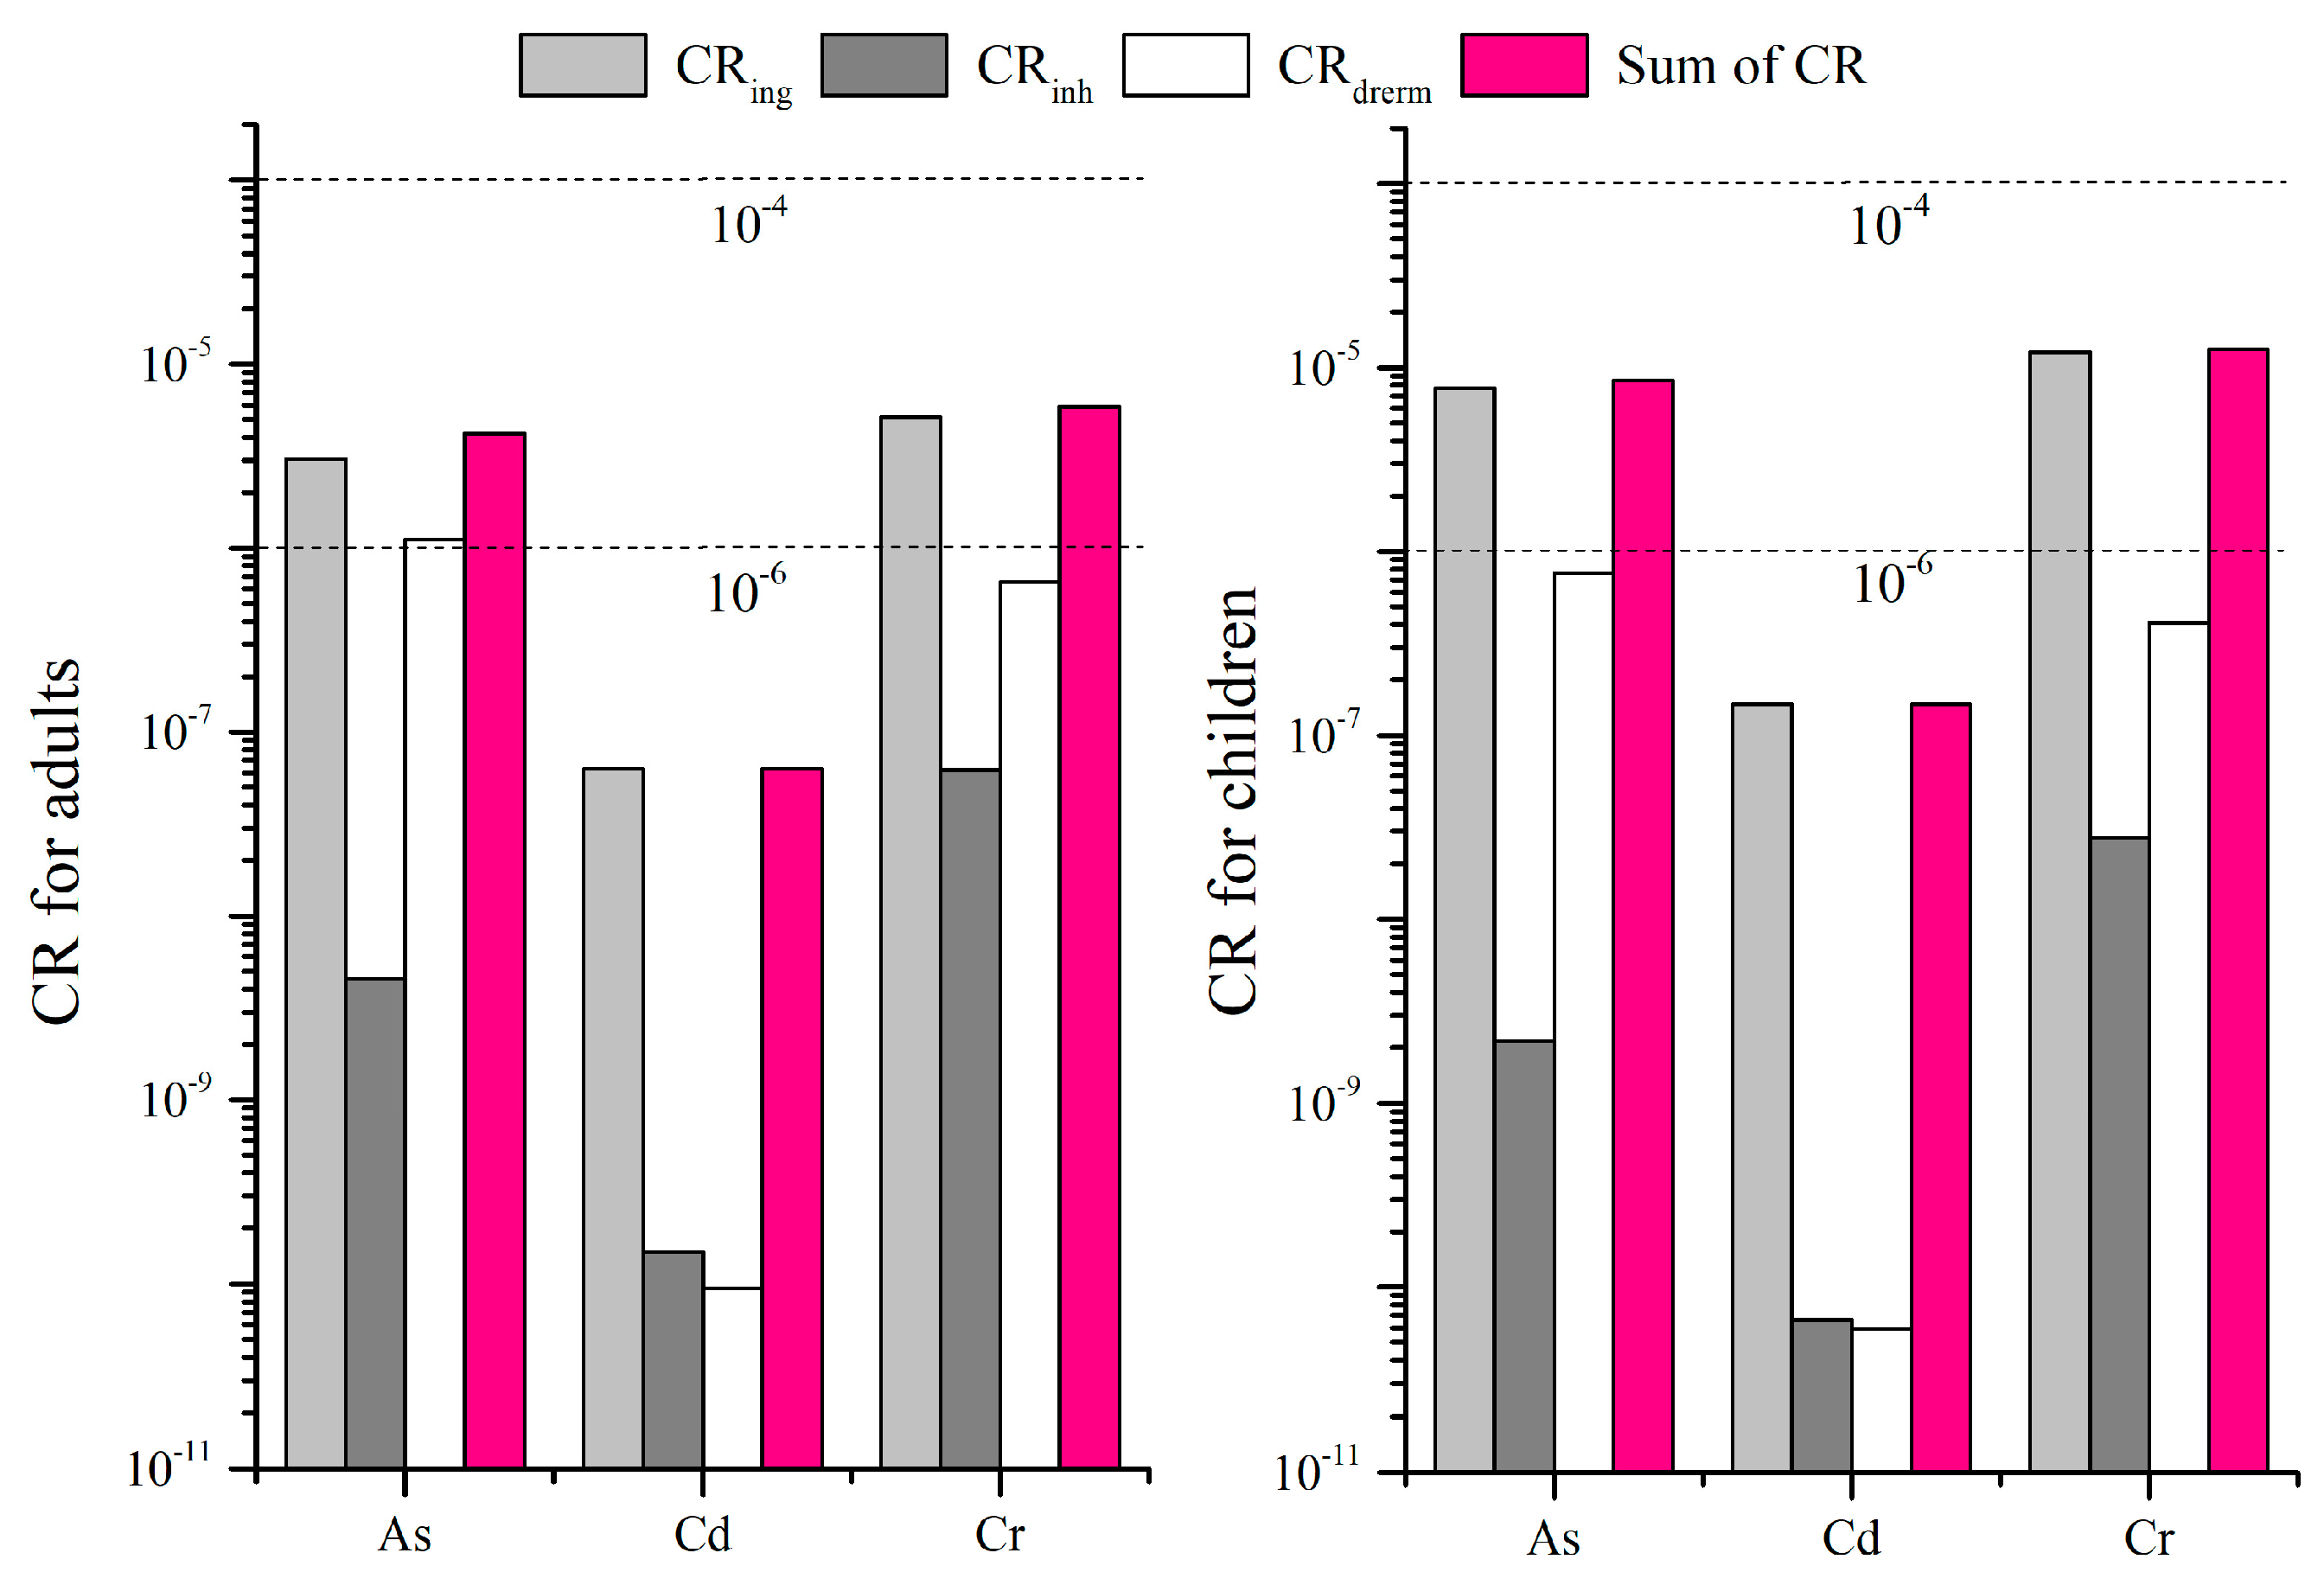
The averaged values of CR for As, Cd, and Cr via the ingestion pathway were generally higher than those through pathways of inhalation and dermal contact for both adults and children (Figure 5), implying that carcinogenic risk of As, Cd, and Cr through ingestion are higher than those through inhalation and dermal contact. The carcinogenic risks of As and Cr in dry atmospheric deposition through three exposure pathways decreased in the order of ingestion > inhalation > dermal contact for both adults and children, while the carcinogenic risks of Cd in dry atmospheric deposition through three exposure pathways decreased in the order of ingestion > dermal contact > inhalation for both adults and children. The mean TCR of As, Cd, and Cr for adults was 4.18 × 10⁶, 6.34 × 10⁻⁸, and 5.89 × 10⁻⁵, with a range of 9.60 × 10⁻⁷ –1.79 × 10⁻⁶, 4.40 × 10⁻⁹– 2.04 × 10⁻⁷, and 3.25 × 10⁻⁵–9.39 × 10⁻⁵, respectively. The average TCR of As, Cd, and Cr for children was 8.51 × 10⁻⁶, 1.47 ×1 0−7, and 1.21 × 10⁻⁵, with a range of 8.51 × 10⁻⁶–1.96 × 10⁻⁵, 1.02 × 10⁻⁸–4.74 × 10⁻⁷, and 6.89 × 10⁻⁶–1.99 × 10⁻⁷, respectively. The mean TCR values of As and Cr for adult and children were between 10−6 and 10−4, implying that the carcinogenic risks of As and Cr are tolerable or acceptable, and the mean TCR value of Cd for adult and children is below 10−6, indicating that the carcinogenic risk of Cd is negligible. Comparatively, adults suffer the carcinogenic risks posed by As and Cr more than children do.

3.4.3. The Uncertainty of Human Risk Assessment

It should be noted that the health risk assessment results have some uncertainties in this study. First, some exposure parameters used in the study come from the citizens of the USA, and may not be suitable for Chinese citizens. Second, some parameter values may be overestimated using the UAEPA risk assessment model. For example, the mean weight of dry atmospheric deposition was 21.87 mg/day with a range of 1.83–176.80 mg/day in this study area, and only 5.4% samples had weights of dry atmospheric deposition of more than 100 mg/day; while the intake via ingestion (IngR) values used in the study were 100 mg/day, and 200 mg/day for adults and children, respectively. Therefore, the overestimated daily dose of toxic trace elements through ingestion may have enhanced their corresponding non-carcinogenic risks. Third, the particle sizes of atmospheric deposition and available forms of toxic elements in atmospheric deposition may also have contributed some uncertainties in assessment of their human health risks. In order to deduce the uncertainty of risk assessment and obtain reliable results, the exposure parameter values suitable for China should be adopted and the particle sizes of atmospheric deposition and available forms of toxic elements in atmospheric deposition should also be considered.

3.5. Source Identification of Toxic Trace Elements in Dry Fraction of Atmospheric Deposition

3.5.1. Principal Component Analysis (PCA)

PCA is commonly used to distinguish the possible sources of toxic trace elements in dry atmospheric deposition. The concentration data of toxic trace elements in dry atmospheric deposition were suitable for PCA analysis according to the KMO value (0.907) and Bartlett spherical test (0.000). Two principal components were extracted with eigenvalues more than one, accounting for 76.223% of the total variance. PC1 accounted for 68.864% of the total variance, which was dominated by Cu, Zn, Hg, Pb, Se, Cd, Mo, As, and Ni, with positive loadings of more than 0.5, indicating their strong correlations with a common source. The anthropogenic sources of As, Cd, Hg, and Se in atmospheric emission in the study area are possibly coal combustion and biomass burning [10,19,21,53,54,55,56,57,58]. The anthropogenic sources of Cu, Pb, and Zn are mainly coal combustion, traffic emission, and waste incineration [21,59,60]. The anthropogenic Mo more likely originated from coal combustion, waste incineration, and biomass burning [60]. Therefore, toxic trace elements in the first component are considered as the impacts of anthropogenic activities. PC2 with a total variance of 7.359% was heavily loaded by Al, Co, Fe, Cr, Mn, Ni, Pb, and As, with positive loadings over 0.5, suggesting that they have a good correlation and a similar source. Al and Fe in this component are naturally distributed as major elements in soil minerals. Al is mainly associated with aluminosilicate minerals such as plagioclase (14.91%), alkali feldspar (13.14%), and clay minerals such as illite (3.41%), mixed-layer illite-smectite (2.82%) and kaolinite (1.59%), while Fe and Mn mainly occur as oxide minerals, and Co, Cr, and Ni are commonly adsorbed onto clay and oxide mineral surfaces or substituted for Fe and Mn into amphiboles or other silicate minerals [61]. The toxic trace elements in this component are those typical of soil-derived dust particles (crustal source). Ni, As, and Pb occurred in two components with loadings of more than 0.5, implying that they may have been from natural and anthropogenic sources.
In Figure 6, the toxic trace elements, together with Al an Fe, in dry atmospheric deposition can be divided into two groups: group one includes Co, Cr, Mn, Ni, Al, and Fe, and another group is composed of As, Mo, Se, Pb, Hg, Zn, Cu, and Cd.

3.5.2. Cluster Analysis (CA)

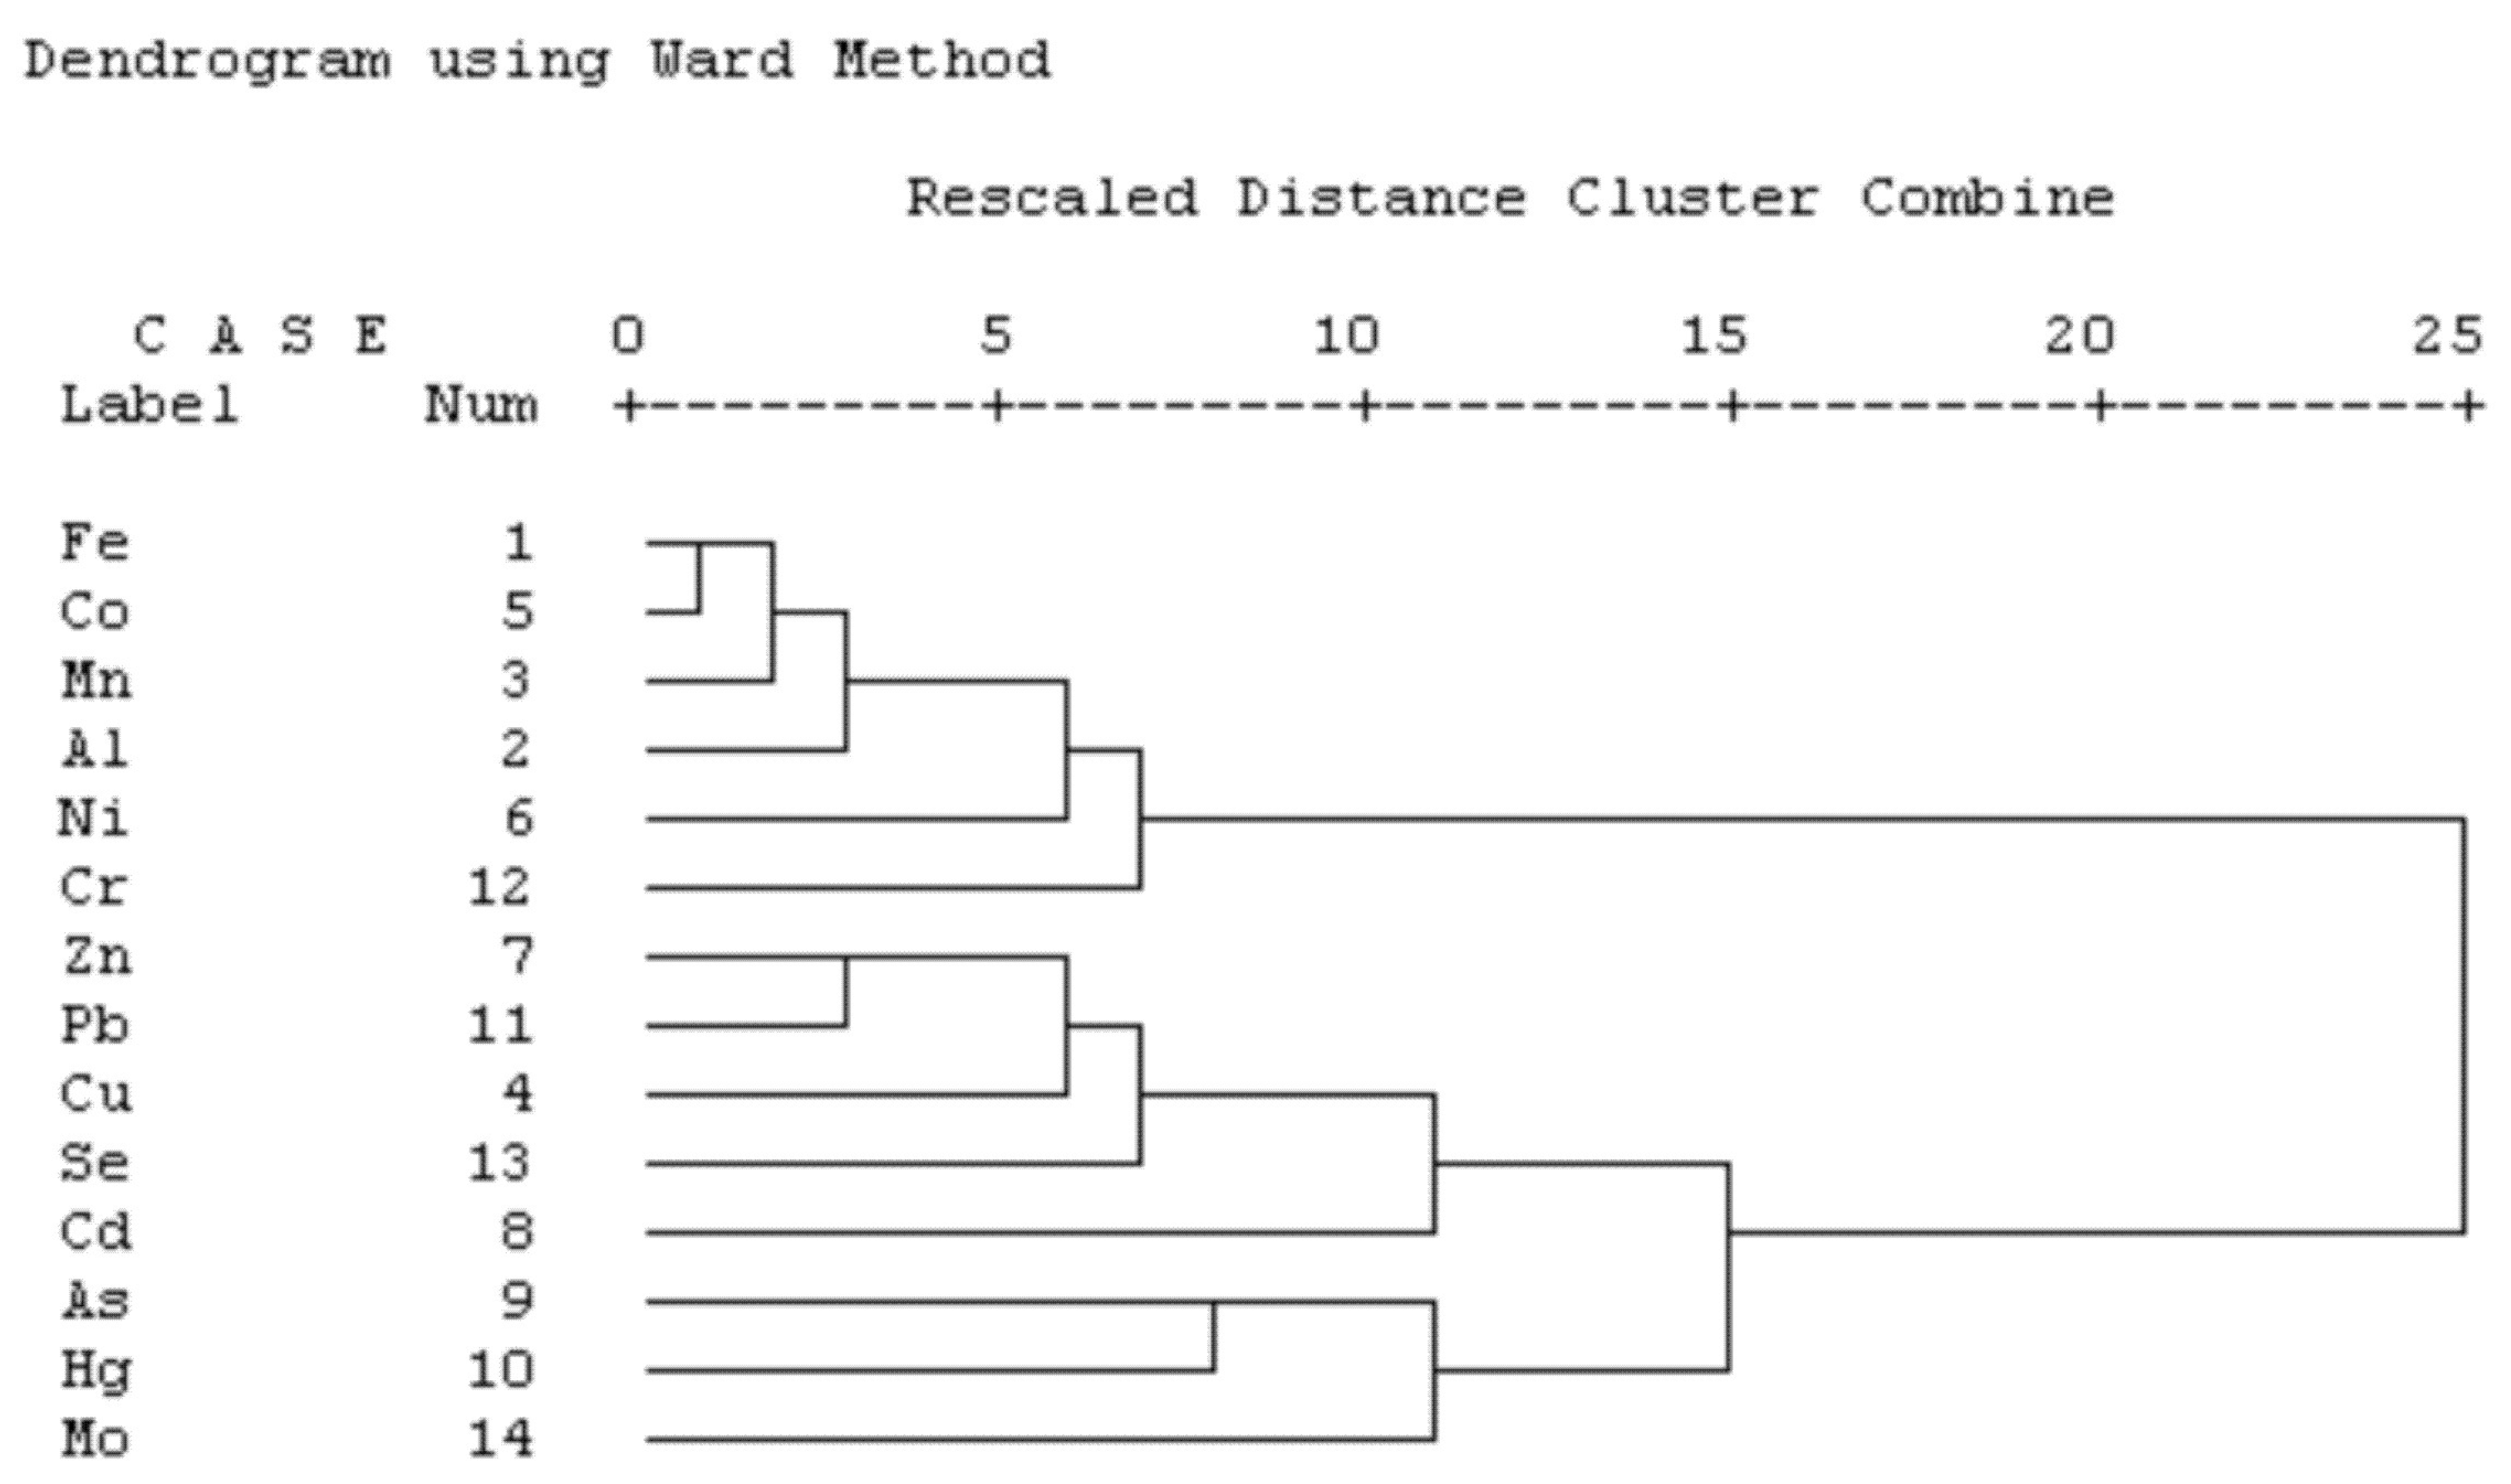
The CA results for toxic trace element contents in dry atmospheric deposition are illustrated in Figure 7. Two distinct clusters are distinguished from the dendrogram of CA. The first cluster includes Fe, Co, Mn, Al, Ni, and Cr. The second cluster consists of Zn, Pb, Cu, Se, Cd, As, Hg, and Mo. The results of CA fit those of PCA well. Moreover, toxic trace elements in cluster 1 and cluster 2 join together at a relatively higher correlation level, implying toxic trace elements in both clusters are correlated. The high correlation coefficients may imply that the dry atmospheric deposition is partly contaminated to some extent by Mo, As, Hg, Zn, Pb, Cu, Se, and Cd. The CA result suggests that toxic trace elements in cluster 2 may have originated from both crustal and anthropogenic sources.

3.5.3. Spatial Distribution of Toxic Trace Elements

The spatial distribution of toxic trace elements can be used as an aid to identify hot spots and their possible sources. The spatial distributions of toxic trace elements in dry atmospheric deposition in the study area are shown in Figure 8. As, Cd, Cu, Hg, Mo, Pb, Se, and Zn show a similar spatial distribution pattern, with a relatively higher concentration or hot spots in the densely populated urban area of the Baicheng city (sampling location 37) and its surrounding areas (sampling locations 31, 32, and 43), where the mean concentrations of As, Cd, Cu, Hg, Mo, Pb, Se, and Zn are over 12.1, 1.688, 67.88, 0.095, 1.459, 50.47, and 0.509, 170 mg/kg, respectively, implying that their sources may be anthropogenic activities, such as coal combustion, traffic, and industrial emissions. Some hot spots of As, Cd, Hg, Mo, Pb, Se, and Zn appear in the sparsely populated rural areas, suggesting their crustal sources. Co, Cr, Mn, and Ni have quite different distribution patterns from other elements, without the hot spots in the urban area of the Baicheng city, indicating that these four elements may have primarily originated from crustal sources.

4. Conclusions

This study was carried out to measure the concentrations, to assess the risks, and to identify the sources of toxic trace elements in atmospheric deposition in the Baicheng-Songyuan area, Jilin province, China. The bulk fluxes of toxic trace elements decreased in the order of Mn > Zn > Cr > Pb > Cu > Ni > As > Co > Mo > Cd > Se > Hg. The dry deposition fluxes of toxic trace elements accounted for 74.7–99.9% of their bulk deposition fluxes, indicating that dry atmospheric deposition predominates in the atmospheric deposition in the study area. Cd showed moderate to heavy contamination in dry atmospheric deposition, while other toxic trace elements showed no contamination; Cd and Hg in dry atmospheric deposition showed moderate to considerable ecological risk, while other toxic trace elements were at low ecological risk levels. The non-carcinogenic risks of toxic trace elements in dry atmospheric deposition through three exposure pathways decreased in the order of ingestion > inhalation > dermal contact for adults and children. HQ and HI of toxic trace elements via three pathways in dry atmospheric deposition were less than one, suggesting a low non-carcinogenic risk. The averaged values of CR for As, Cd, and Cr via the ingestion pathway were generally higher than those through pathways of inhalation and dermal contact for both adults and children. The mean TCR values of As and Cr for adult and children were between 10−6 and 10−4, sugesting that the carcinogenic risk levels of As and Cr were tolerable or acceptable, and the mean TCR value of Cd for adult and children was less than 10−6, implying that the carcinogenic risk level of Cd was negligible. Mn, Ni, Cr, and Co in dry atmospheric deposition were mainly originated from the crustal sources, while As, Cd, Cu, Hg, Mo, Pb, Se, and Zn in dry atmospheric deposition were derived from both crustal and anthropogenic sources.
It should be emphasized that health risk assessment of toxic elements in atmospheric deposition may be uncertain due to the exposure parameters being unsuitable to Chinese, and consideration only of the total concentration of toxic elements rather than their speciation in atmospheric deposition, and the particle sizes of atmospheric deposition.
The results obtained in this study advocate the necessity for monitoring atmospheric deposition in the vast rural area, and also provide a scientific basis for controlling contamination posed by toxic trace elements in atmospheric deposition. The approach by integration of multiple analysis and spatial distribution to identify the source of toxic trace elements in dry atmospheric deposition is available for other researchers.

Author Contributions

Y.L.: methodology, supervision, draft preparation, writing original draft, writing and editing. W.G.: investigation, data curation. S.C.: conceptualization, writing review. All authors have read and agreed to the published version of the manuscript.

Funding

This research received no external funding.

Institutional Review Board Statement

Not applicable.

Informed Consent Statement

Not applicable.

Data Availability Statement

Data are available upon request from the corresponding author. ([email protected]). The data are not publicly available due to privacy.

Conflicts of Interest

The authors declare no conflicts of interest.

References

  1. Nriagu, J.O. A global assessment of natural sources of atmospheric trace metals. Nature 1989, 338, 47–49. [Google Scholar] [CrossRef]
  2. Wong, C.S.C.; Li, X.D.; Zhang, G.; Qi, S.H.; Peng, X.Z. Atmospheric deposition of heavy elements in the Pearl River Delta, China. Atmos. Environ. 2003, 37, 767–776. [Google Scholar] [CrossRef]
  3. Alastuey, A.; Querol, X.; Plana, F.; Viana, M.; Ruiz, C.R.; Campa, A.S.; Rosa, J.; Mantilla, E.; Santos, S.G. Identification and chemical characterization of industrial particulate matter sources in southwest Spain. J. Air Waste Manag. Assoc. 2006, 56, 993–1006. [Google Scholar] [CrossRef] [PubMed]
  4. Duan, F.K.; Liu, X.; Yu, T.; Cachier, H. Identification and estimate of biomass burning contribution to the urban aerosol organic carbon concentrations in Beijing. Atmos. Environ. 2004, 38, 1275–1282. [Google Scholar] [CrossRef]
  5. Adachi, K.; Tainosho, Y. Characterization of heavy element particles embedded in tire dust. Environ. Int. 2004, 30, 1009–1017. [Google Scholar] [CrossRef] [PubMed]
  6. Ogulei, D.; Hopke, P.K.; Zhou, L.; Pancras, J.P.; Nair, N.; Ondov, J.M. Source apportionment of Baltimore aerosol from combined size distribution and chemical composition data. Atmos. Environ. 2006, 40, S396–S410. [Google Scholar] [CrossRef]
  7. Chen, B.; Kitagawa, H.; Jie, D.; Hu, K.; Lim, J. Dust transport from Northeastern China inferred from carbon isotopes of atmospheric dust carbonate. Atmos. Environ. 2008, 42, 4790–4796. [Google Scholar] [CrossRef]
  8. Odabasi, M.; Muezzinoglu, A.; Bozlaker, A. Ambient concentrations and dry deposition fluxes of trace elements in Izmir, Turkey. Atmos. Environ. 2002, 36, 5841–5851. [Google Scholar] [CrossRef]
  9. Sandroni, V.; Migon, C. Atmospheric deposition of metallic pollutants over the Ligurian Sea: Labile and residual inputs. Chemosphere 2003, 47, 753–764. [Google Scholar] [CrossRef]
  10. Streets, D.G.; Hao, H.J.; Wu, Y.; Jiang, J.K.; Chan, M.; Tian, H.Z.; Feng, X.B. Anthropogenic mercury emissions in China. Atmos. Environ. 2005, 39, 7789–7806. [Google Scholar] [CrossRef]
  11. Tsukuda, S.; Sugiyama, M.; Harita, Y.; Nishimura, K. Atmospheric bulk deposition of soluble phosphorus in Ashiu Experimental Forest, Central Japan: Source apportionment and sample contamination problem. Atmos. Environ. 2005, 39, 823–836. [Google Scholar] [CrossRef]
  12. Tang, Q.F.; Yang, Z.F.; Zhang, B.R.; Feng, H.Y.; Wang, H.G. A study of elements flux and sources from atmospheric bulk deposition in the Chengdu Economic Region. Earth Sci. Front. 2007, 14, 213–222, (In Chinese with English Abstract). [Google Scholar]
  13. Cong, Y.; Chen, Y.L.; Yang, Z.F.; Hou, Q.Y.; Wang, H.C. Dry and wet atmospheric deposition fluxes of elements in the Plain area of Beijing Municipality China. Geol. Bull. China. 2008, 27, 257–264, (In Chinese with English Abstract). [Google Scholar]
  14. Huang, S.S.; Tu, J.; Liu, H.Y.; Hua, M.; Liao, Q.L.; Feng, J.B.; Weng, Z.H.; Huang, G.M. Multivariate analysis of trace element concentrations in atmospheric deposition in the Yangtze River Delta, East China. Atmos. Environ. 2009, 43, 5781–5790. [Google Scholar] [CrossRef]
  15. Tang, J.; Han, W.Z.; Li, N.; Li, Z.Y.; Bian, J.M.; Li, H.Y. Multivariate analysis of heavy metal element concentrations in atmospheric deposition in Harbin city, Northeast China. Spectrosc. Spect. Anal. 2011, 31, 3087–3091, (In Chinese with English abstract). [Google Scholar]
  16. Duan, J.C.; Tan, J.H.; Wang, S.L.; Hao, J.M.; Chai, F.H. Size distributions and sources of elements in particulate matter at curbside, urban and rural sites in Beijing. J. Environ. Sci. 2012, 24, 87–94. [Google Scholar] [CrossRef] [PubMed]
  17. Yang, Z.P.; Lu, W.X.; Long, Y.Q. Atmospheric dry and wet deposition of heavy metals in Changchun city, China. Res. Environ. Sci. 2009, 22, 28–34, (In Chinese with English Abstract). [Google Scholar]
  18. Duan, J.C.; Tan, J.H. Atmospheric heavy metals and arsenic in China: Situation, sources and control policies. Atmos. Environ. 2013, 74, 93–101. [Google Scholar] [CrossRef]
  19. Zhong, C.; Yang, Z.F.; Jiang, W.; Yu, T.; Hou, Q.Y.; Li, D.S.; Wang, J.W. Annual input fluxes and source identification of trace elements in atmospheric deposition in Shanxi Basin, the largest coal base in China. Environ. Sci. Pollut. Res. 2014, 21, 12305–12315. [Google Scholar] [CrossRef]
  20. Qiao, Q.Q.; Huang, B.C.; Zhang, C.X.; Piper, J.D.A.; Pan, Y.P.; Sun, Y. Assessment of heavy metal contamination of dust fall in northern China from integrated chemical and magnetic investigation. Atmos. Environ. 2013, 74, 182–193. [Google Scholar] [CrossRef]
  21. Lu, X.W.; Zhang, X.L.; Li, L.Y.; Chen, H. Assessment of metals pollution and health risk in dust from nursery schools in Xi’an, China. Environ. Res. 2014, 128, 27–34. [Google Scholar] [CrossRef] [PubMed]
  22. Abuduwailil, J.; Zhang, Z.; Jiang, F. Evaluation of the pollution and human health risks posed by heavy metals in the atmospheric dust in Ebinur Basin in Northwest China. Environ. Sci. Pollut. Res. 2015, 22, 14018–14031. [Google Scholar] [CrossRef] [PubMed]
  23. Han, X.; Lu, X.; Qinggeletu; Wu, Y. Health risks and contamination levels of heavy metals in dusts from parks and squares of an industrial city in semi-arid area of China. Int. J. Environ. Res. Public Health 2017, 14, 886. [Google Scholar] [CrossRef] [PubMed]
  24. Sobhanardakani, A. Human health risk assessment of potentially toxic heavy metals in the atmospheric dust of city of Hamedan, west of Iran. Environ. Sci. Pollut. Res. 2018, 25, 28086–28093. [Google Scholar] [CrossRef]
  25. Weerasundara, A.; Magana-Arachchi, D.N.; Ziyath, A.M.; Goonetilleke, A.; Vithanage, M. Health risk assessment of heavy metals in atmospheric deposition in a congested city environment in a developing country: Kandy City, Sri Lanka. J. Environ. Manag. 2018, 220, 198–206. [Google Scholar] [CrossRef] [PubMed]
  26. Bahloul, M. Pollution characteristics and health risk assessment of heavy metals in dry atmospheric deposits from Sfax solar saltern area in southeast of Tunisia. J. Environ. Health Sci. 2019, 17, 1085–1105. [Google Scholar] [CrossRef] [PubMed]
  27. Cai, K.; Li, C.; Na, S.Y. Spatial distribution, pollution source, and health risk assessment of heavy metals in atmospheric depositions: A case study from the sustainable city of Shijiazhuang, China. Atmosphere 2019, 10, 222. [Google Scholar] [CrossRef]
  28. Gholizadeh, A.; Taghavi, M.; Moslem, A.; Neshat, A.A.; LariNajafi, M.; Alahabadi, A.; Ahmadi, E.; Ebrahimi, A.H.; Asour, A.A.; Rezaei, H.; et al. Ecological and health risk assessment of exposure to atmospheric heavy metals. Ecotox. Environ. Saf. 2019, 184, 109622. [Google Scholar] [CrossRef] [PubMed]
  29. Sobhanardakani, S. Ecological and human health risk assessment of heavy metal content of atmospheric dry deposition, a case study: Kermanshah, Iran. Biol. Trace Elem. Res. 2019, 187, 602–610. [Google Scholar] [CrossRef]
  30. Guo, G.H.; Zhang, D.G.; Wang, Y.T. Characteristics of heavy metals in size-fractionated atmospheric particulate matters and associated health risk assessment based on the respiratory deposition. Environ. Geochem. Health 2021, 43, 285–299. [Google Scholar] [CrossRef]
  31. Marjovvi, A.; Soleimani, M.; Mirghaffari, N.; Karimzadeh, H.; Yuan, Y.Z.; Fang, L.P. Monitoring, source identification and environmental risk of potentially toxic elements of dust in Isfahan Province, Central Iran. Bull. Environ. Contam. Toxicol. 2022, 108, 901–908. [Google Scholar] [CrossRef] [PubMed]
  32. Liu, T.; Zhao, C.S.; Chen, Q.F.; Li, L.Z.; Si, G.R.; Li, L.; Guo, B.B. Characteristics and health risk assessment of heavy metal pollution in atmospheric particulate matter in different regions of the Yellow River Delta in China. Environ. Geochem. Health 2023, 45, 2013–2030. [Google Scholar] [CrossRef] [PubMed]
  33. United States Environmental Protection Agency (USEPA). Human health evaluation manual. In Risk Assessment Guidance for Superfund; EPA/540/1e89/002; Office of Solid Waste and Emergency Response: Washington, DC, USA, 1989; Volume l. [Google Scholar]
  34. United States Environmental Protection Agency (USEPA). Risk Assessment Guidance for Superfund: Volume III-Part A, Process for Conducting Probabilistic Risk Assessment; EPA540-R-02-002; U.S. Environmental Protection Agency: Washington, DC, USA, 2001. [Google Scholar]
  35. United States Environmental Protection Agency (USEPA). Child Specific Exposure Factors Handbook; EPA-600-P-00-002B; National Center for Environmental Assessment: Washington, DC, USA, 2001. [Google Scholar]
  36. Chen, B.; Kitagawa, H.; Hu, K.; Jie, D.M.; Yang, J.P.; Lim, J. Element and mineral characterization of dust emission from the saline land at Songnen Plain, Northeastern China. J. Environ. Sci. 2009, 21, 1363–1370. [Google Scholar] [CrossRef] [PubMed]
  37. Zhang, R.J.; Fu, C.B.; Han, Z.W.; Zhu, C.S. Characteristics of elemental composition of PM 2. 5 in the spring period at Tongyu in the semi-arid region of Northeast China. Adv. Atmos. Sci. 2008, 25, 922–931. [Google Scholar] [CrossRef]
  38. Zhang, Q.; Shen, Z.X.; Cao, J.J.; Ho, K.F.; Zhang, R.J.; Bie, Z.J.; Chang, H.R.; Liu, S.X. Chemical profiles of urban fugitive dust over Xi’an in the south margin of the Loess Plateau, China. Atmos. Pollu. Res. 2014, 5, 421–430. [Google Scholar] [CrossRef]
  39. Zhang, B.; Hong, M.; Zhao, Y.S.; Lin, X.Y.; Zhang, X.L.; Dong, J. Distribution and risk assessment of fluoride in drinking water in the west plain region of Jilin province, China. Environ. Geochem. Health 2003, 25, 421–431. [Google Scholar]
  40. China Geological Survey. Specification of Regional Eco-Geochemical Assessment (DD2005-02); China Geological Survey: Beijing, China, 2005. (In Chinese) [Google Scholar]
  41. Zhang, Q.W.; Chai, S.L.; Cai, J.; Gao, L.N. Baseline concentrations of trace metals in grassland topsoils from West Jilin province, Northeast China. Adv. Mater. Res. 2012, 347–353, 2140–2145. [Google Scholar] [CrossRef]
  42. Müller, G. Index of geoaccumulation in sediments of the Rhine River. GeoJournal 1969, 2, 108–118. [Google Scholar]
  43. Sutherland, A. Bed sediment-associated trace metals in an urban stream, Oahu, Hawaii. Environ. Geol. 2002, 39, 611–627. [Google Scholar] [CrossRef]
  44. Meza-Figueroa, D.; DelaO-Villanueva, M.; DelaParra, M.L. Toxic trace element distribution in dust from elementary schools in Hermosillo, Sonora, México. Atmos. Environ. 2007, 41, 276–288. [Google Scholar] [CrossRef]
  45. Hakanson, L. An ecological risk index for aquatic pollution control-a sedimentological approach. Water Res. 1980, 14, 975–1001. [Google Scholar] [CrossRef]
  46. Xu, Z.Q.; Ni, S.J.; Tuo, X.G. Calculation of heavy metals toxicity coefficient in the evaluation of potential ecological risk index. Environ. Sci. Technol. 2008, 31, 112–115. (In Chinese) [Google Scholar]
  47. Wang, Y.X.; Cao, H.Y.; Deng, Y.Y.; Zhang, Q. Distribution and health risk assessment of heavy metals in atmospheric particulate matter and dust. Environ. Sci. 2017, 38, 3575–3584. (In Chinese) [Google Scholar]
  48. Zheng, N.; Liu, J.S.; Wang, Q.C.; Liang, Z.Z. Health risk assessment of heavy metal exposure to street dust in the zinc smelting district, Northeast of China. Sci. Total Environ. 2010, 408, 726–733. [Google Scholar] [CrossRef] [PubMed]
  49. Zhang, M.M.; Lu, X.W.; Chen, H.; Gao, P.P.; Fu, Y. Multi-element characterization and source identification of trace metal in road dust from an industrial city in semi-humid area of Northwest China. J. Radioanal. Nucl. Chem. 2015, 303, 637–646. [Google Scholar] [CrossRef]
  50. Wang, Z.; Liu, S.Q.; Chen, X.M.; Lin, C.Y. Estimates of the exposed dermal surface area of Chinese in view of human health risk assessment. J. Saf. Environ. 2008, 8, 152–156. (In Chinese) [Google Scholar]
  51. United States Environmental Protection Agency (USEPA). Exposure Factors Handbook; EPA/600/R-09/052F; National Center for Environmental Assessment: Washington, DC, USA, 2011. [Google Scholar]
  52. Kamunda, C.; Mathuthu, M.; Madhuku, M. Health risk assessment of heavy metals in soils from Witwatersrand gold mining basin, South Africa. Int. J. Environ. Res. Public Health 2016, 13, 663. [Google Scholar] [CrossRef] [PubMed]
  53. Xia, X.Q.; Yang, Z.F.; Cui, Y.J.; Li, Y.S.; Hou, Q.Y.; Yu, T. Soil heavy metal concentrations and their typical input and output fluxes on the southern Songnen Plain Heilongjiang Province China. J. Geochem. Explor. 2014, 139, 85–96. [Google Scholar] [CrossRef]
  54. Xie, R.; Seip, H.M.; Wibetoe, G.; Nori, S.; Mcleod, C.W. Heavy coal combustion as the dominant source of particulate pollution in Taiyuan, China, corroborated by high concentrations of arsenic and selenium in PM10. Sci. Total Environ. 2006, 370, 409–415. [Google Scholar] [CrossRef]
  55. Tian, H.Z.; Wang, Y.; Xue, Z.G.; Cheng, K.; Qu, P.Y.; Chai, F.H.; Hao, J.M. Trend and characteristics of atmospheric emissions of Hg, As, and Se from coal combustion in China, 1980–2007. Atmos. Chem. Phys. 2010, 10, 11905–11919. [Google Scholar] [CrossRef]
  56. Khan, M.F.; Masunaga, S.; Masunaga, S. Assessment of the sources of suspended particulate matter aerosol using US EPA PMF 3.0. Environ. Monitor. Assess. 2012, 184, 1063–1083. [Google Scholar] [CrossRef] [PubMed]
  57. Li, Q.; Cheng, H.G.; Zhou, T.; Lin, C.Y.; Guo, S. The estimated atmospheric lead emissions in China, 1990–2009. Atmos. Environ. 2012, 60, 1–8. [Google Scholar] [CrossRef]
  58. Shao, X.; Cheng, H.G.; Li, Q.; Lin, C.Y. Anthropogenic atmospheric emissions of cadmium in China. Atmos. Environ. 2013, 79, 155–160. [Google Scholar] [CrossRef]
  59. Hjortenkrans, D.S.T.; Bergback, B.G.; Haggerud, A.V. Metal emissions from brake linings and tires: Case studies of Stockholm, Sweden 1995/1998 and 2005. Sci. Total Environ. 2007, 41, 5224–5230. [Google Scholar] [CrossRef] [PubMed]
  60. Xia, L.L.; Gao, Y. Characterization of trace elements in PM2. 5 aerosols in the vicinity of highways in northeast New Jersey in the U.S. east coast. Atmos. Pollut. Res. 2011, 2, 34–44. [Google Scholar] [CrossRef]
  61. Chai, Y.; Guo, J.; Chai, S.L.; Cai, J.; Xue, L.; Zhang, Q.W. Source identification of eight heavy metals in grassland soils by multivariate analysis from the Baicheng-Songyuan area, Jilin Province, Northeast China. Chemosphere 2015, 134, 67–75. [Google Scholar] [CrossRef]
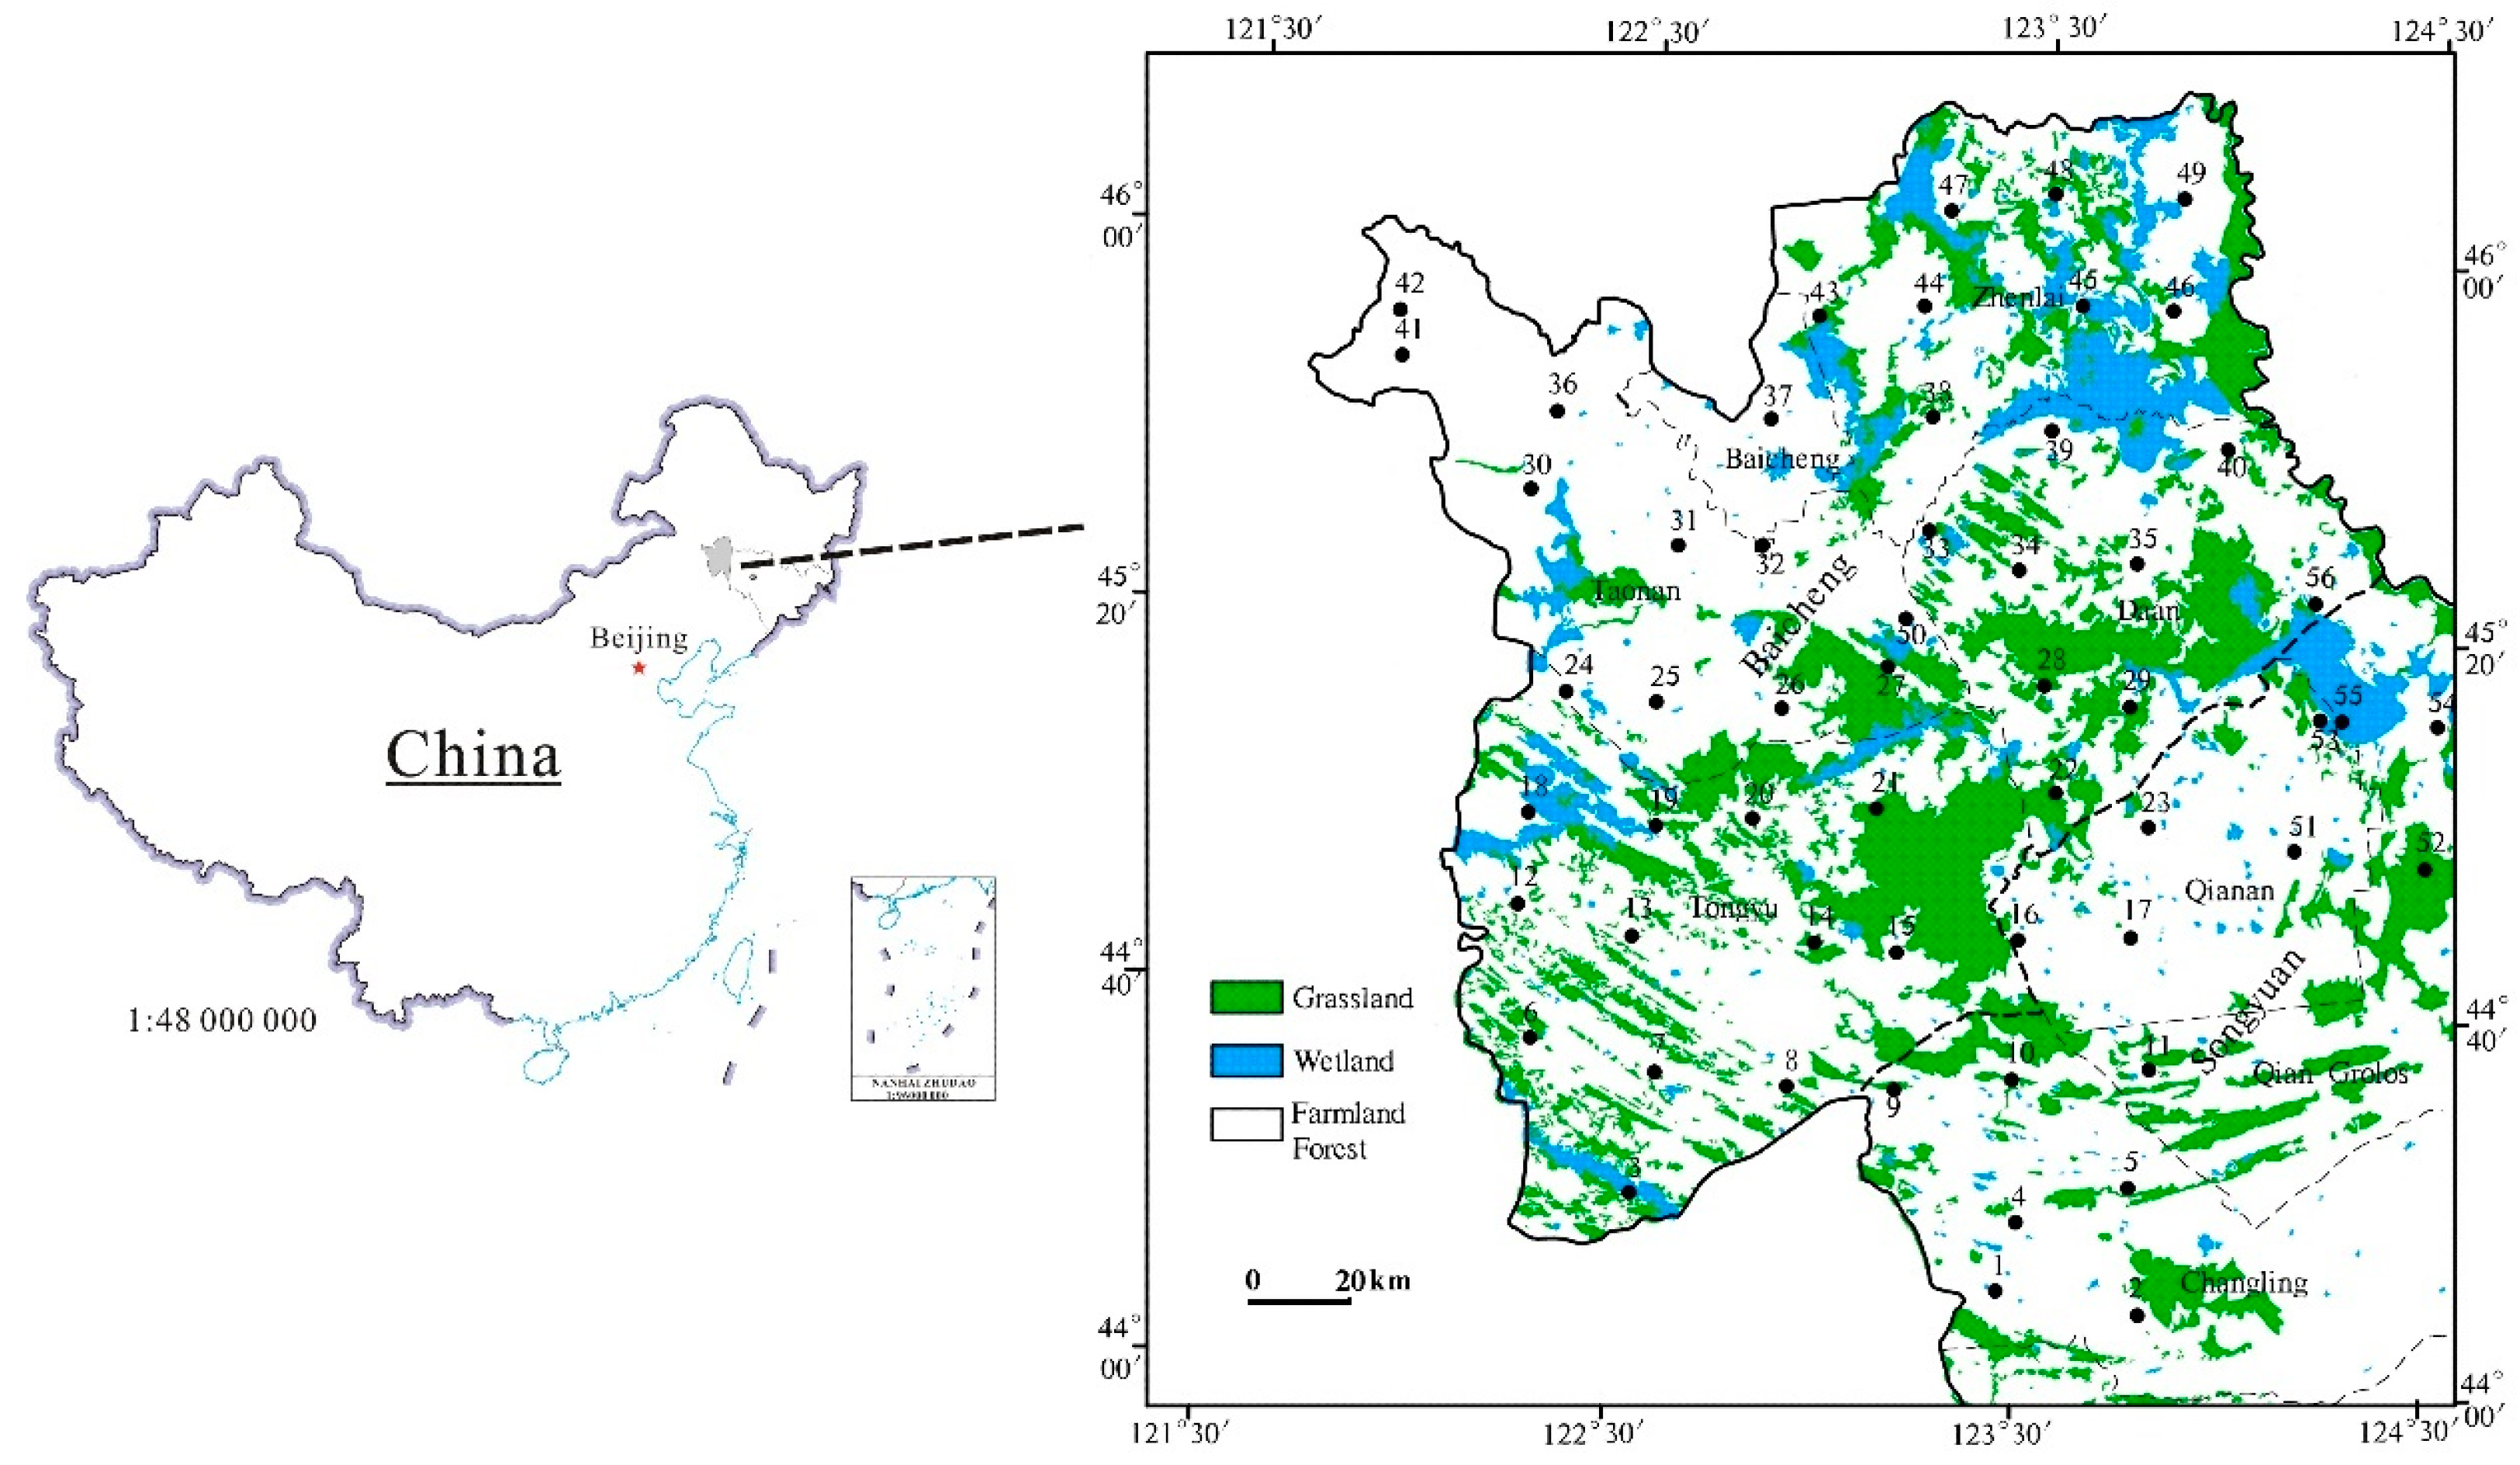
Figure 1. Sample locations of atmospheric deposition in the study area.
Atmosphere 15 00744 g001
Figure 2. Comparison of yearly depositional fluxes of toxic trace elements in different counties of the study area.
Atmosphere 15 00744 g002
Figure 3. Igeo, EF, and potential risk index of toxic trace elements in dry fraction of atmospheric deposition.
Atmosphere 15 00744 g003
Figure 4. Comparison of HQ values of toxic trace elements via three pathways for adults and children.
Atmosphere 15 00744 g004
Figure 5. CR and TCR values of As, Cd, and Cr via three pathways for adults and children.
Atmosphere 15 00744 g005
Figure 6. Plot PC1 against PC2 for toxic trace elements in dry atmospheric deposition.
Atmosphere 15 00744 g006
Figure 7. Dendogram from Ward’s method of hierarchical cluster analysis of toxic trace elements in dry atmospheric deposition.
Atmosphere 15 00744 g007
Figure 8. The spatial distribution of toxic trace elements in dry atmospheric deposition.
Atmosphere 15 00744 g008
Table 1. Parameters for assessing exposure and health risk of toxic trace elements via intake, inhalation, and dermal contact pathways [27,33,34,35,47,48,50].
Exposure
Parameter
DescriptionValueUnit
AdultsChildren
CConcentration of metals in dry atmospheric deposition mg/Kg
IngRIngestion rate100200mg/day
EFExposure frequency180180days/year
EDExposure duration246year
BWBody weight7015Kg
ATAverage time for non-carcinogenic effectED × 350ED × 350days
Average time for carcinogenic effect70 × 35070 × 350days
InhRInhalation rate207.63m3/day
PEFParticular emission factor1.36 × 1091.36 × 109m3/Kg
SAExposed skin surface area21401150cm2
SLSkin adherence factor0.070.07mg/cm2/day
ABFDermal absorption factor0.0010.001unitless
CFconversion factor1.00 × 10−61.00 × 10⁻⁶Kg/mg
Table 2. Reference dosage and slope factors for toxic trace elements [21,22,23,24,25,26,27,28,29,33,34,35,51,52].
Toxic Trace ElementsRfDing
(mg/kg·d)
RfDinh
(mg/kg·d)
RfDderm
(mg/kg·d)
CFing
(mg/kg·d)−1
CFinh
(mg/kg·d)−1
CFderm
(mg/kg·d)−1
As3.00 × 10−41.50 × 10−53.00 × 10−31.515.11.5
Cd1.00 × 10−31.00 × 10−31.00 × 10−50.386.10.38
Co3.00 × 10−45.11 × 10−51.66 × 10−2
Cr3.00 × 10−32.86 × 10−56.00 × 10−50.54142
Cu4.00 × 10−24.02 × 10−21.20 × 10−2
Hg3.00 × 10−48.57 × 10−52.10 × 10−5
Mn4.60 × 10−21.43 × 10−51.84 × 10−3
Mo5.00 × 10−34.95 × 10−31.90 ×10−3
Ni2.00 × 10−22.04 × 10−25.40 × 10−3
Pb3.50 × 10−33.52 × 10−35.25 ×10−4
Se5.00 × 10−35.70 × 10−52.20 × 10−3
Zn3.00 × 10−13.00 × 10−16.00 × 10−2
Table 3. Descriptive statistics of toxic trace elements in dry and wet atmospheric depositions.
Heavy
Metals
Dry DepositionHeavy
Metals
Wet Deposition Soil (mg/kg) [46]
MeanStandard DerivationVariation CoefficientMeanStandard DerivationVariation Coefficient
As (mg/kg)9.17 3.36 0.37 As (μg/L)39.9415.840.408.82
Cd (mg/kg)0.75 0.55 0.73 Cd (μg/L)1.104.834.400.113
Co (mg/kg)8.18 2.26 0.28 Co (μg/L)3.512.810.8011.3
Cr (mg/kg)46.53 11.73 0.25 Cr (μg/L)16.4810.750.6551.39
Cu (mg/kg)29.89 20.26 0.68 Cu (μg/L)14.016.530.4717.97
Hg (mg/kg)0.061 0.038 0.62 Hg (μg/L)0.0410.0120.280.034
Mn (mg/kg)415.36 102.58 0.25 Mn (μg/L)495.02333.080.67674
Mo (mg/kg)0.91 0.40 0.44 Mo (μg/L)2.491.420.570.61
Ni (mg/kg)23.49 9.36 0.40 Ni (μg/L)15.8610.730.6822.3
Pb (mg/kg)34.73 13.10 0.38 Pb (μg/L)34.3271.952.1024.42
Se (mg/kg)0.26 0.16 0.64 Se (μg/L)1.150.630.550.18
Zn (mg/kg)105.69 52.36 0.50 Zn (μg/L)318.75309.850.9757.22
Al (%)6.23 0.75 0.12Al (mg/L)14500204651.416.79
Fe (%)2.22 0.73 0.33Fe (mg/L)0.330.471.432.71
Table 4. Flux comparisons of toxic trace elements from atmospheric deposition in the study area and others (mg/m2/year).
Toxic Trace ElementsThis StudyChangchun
[17]
Southern
Songnen [53]
Beijing
[13]
Shanxi
Basin [19]
Chengdou
[12]
Pear River Delta [14]
Wet FluxDry FluxBulk Flux
As1.63 4.28 5.92 4.794.612.93.782.77NA
Cd0.044 0.237 0.281 0.250.360.240.381.770.07
Co0.15 3.99 4.14 NANANA2.31NA0.19
Cr0.67 25.29 25.96 10.6720.3311.8613.4NA6.43
Cu0.58 10.85 11.43 8.2216.9314.1912.2NA18.6
Hg0.002 0.018 0.020 0.030.030.020.060.1NA
Mn20.08 217.33 237.41 NANA111.1611564.968.98
Mo0.67 9.31 9.98 NANA0.660.470.92NA
Ni1.38 16.72 18.10 NANA6.6NANA8.35
Pb0.047 0.108 0.155 12.3119.1821.9925.345.9512.7
Se13.14 41.71 54.85 NANANA0.85NANA
Zn1.63 4.28 5.92 48.1596.5254.4972.4147.83104
Notes: NA, not available.
Table 5. Non-carcinogenic and carcinogenic risks for adults and children.
Toxic Trace ElementsNon-Carcinogenic RiskCarcinogenic Risk
HQingHQinhHQdermHICRingCRinhCRdermTCR
Adults
As2.15 × 10−26.33 × 10−52.36 × 10−24.52 × 10−23.06 × 10−64.53 × 10−91.12 × 10−64.18 × 10⁻⁶
Cd5.26 × 10−42.58 × 10−87.88 × 10−56.05 × 10−46.31 × 10−81.49 × 10−109.46 × 10−116.34 × 10⁻⁸
Co1.92 × 10−21.66 × 10−45.40 × 10−71.94 × 10⁻²
Cr1.09 × 10−21.69 × 10−48.18 × 10−41.19 × 10−25.17 × 10−66.24 × 10−86.51 × 10−75.89 × 10⁻⁵
Cu5.26 × 10−47.70 × 10−82.63 × 10−65.29 × 10⁻⁴
Hg1.43 × 10−47.37 × 10−83.07 × 10−61.46 × 10⁻⁴
Mn6.36 × 10−33.01 × 10−32.38 × 10−49.61 × 10⁻³
Mo1.28 × 10−41.90 × 10−85.03 × 10−71.28 × 10⁻⁴
Ni8.27 × 10−41.19 × 10−74.59 × 10−68.32 × 10⁻⁴
Pb6.99 × 10−31.02 × 10−66.98 × 10−57.06 × 10⁻³
Se3.63 × 10−54.68 × 10−71.23 × 10−73.68 × 10⁻⁵
Zn2.48 × 10−43.65 × 10−81.86 × 10−62.50 × 10⁻⁴
Children
As2.01 × 10−11.13 × 10−45.92 × 10−22.60 × 10−17.75 × 10−62.19 × 10−97.61 × 10−78.51 × 10⁻⁶
Cd4.91 × 10−34.59 × 10−81.98 × 10−45.11 × 10−31.47 × 10−76.63 × 10−115.93 × 10−111.47 × 10⁻⁷
Co1.79 × 10−12.95 × 10−41.35 × 10−61.80 × 10⁻¹
Cr1.02 × 10−13.00 × 10−42.05 × 10−31.04 × 10−11.21 × 10−52.78 × 10−84.08 × 10−71.21 × 10⁻⁵
Cu4.91 × 10−31.37 × 10−76.59 × 10−64.92 × 10⁻³
Hg1.34 × 10−31.31 × 10−77.69 × 10−61.34 × 10⁻³
Mn5.94 × 10−25.36 × 10−35.97 × 10−46.53 × 10⁻²
Mo1.19 × 10−33.37 × 10−81.26 × 10−61.19 × 10⁻³
Ni7.72 × 10−32.12 × 10−71.15 × 10−57.73 × 10⁻³
Pb6.52 × 10−21.82 × 10−61.75 × 10−46.54 × 10⁻²
Se3.38 × 10−48.33 × 10−73.10 × 10−73.40 × 10⁻⁴
Zn2.32 × 10−36.50 × 10−84.66 × 10−62.32 × 10⁻³
Disclaimer/Publisher’s Note: The statements, opinions and data contained in all publications are solely those of the individual author(s) and contributor(s) and not of MDPI and/or the editor(s). MDPI and/or the editor(s) disclaim responsibility for any injury to people or property resulting from any ideas, methods, instructions or products referred to in the content.