Abstract
Recent studies indicate that mass concentration alone is not the best parameter to assess the toxicity and the health effects of particulate matter (PM). Indeed, the chemical composition of the particles plays an important role, and oxidative potential (OP) measurements are being proposed as an alternative way to assess toxicity. The European Union (EU) is currently proposing a draft of the new air quality directive which includes OP measurements but does not specify the methods and/or protocols of analysis. In this light, the purpose of this study was to evaluate the feasibility of two literature assays, namely ascorbic acid (AA) and dithiothreitol (DTT), for routine PM analysis by testing urban PM filters from a one-year sampling campaign conducted by ARPA Lombardia. Indoor PM samples were also tested to emphasize the importance of monitoring closed spaces in which people spend most of their time. Following the optimization of the DTT assay, both methods proved to be suitable for large-scale PM analysis. The results show that the oxidative strength of urban PM is constant throughout the year for the outdoor samples (OPAA: 0.067–0.39 nmol min−1 m−3; OPDTT: 0.033–0.109 nmol min−1 m−3), indicating the need for routine OP monitoring. Instead, indoor areas were characterized by particles with a lower oxidative capacity (OPAA: 5.40–24 pmol min−1 m−3; OPDTT: 9.7–32 pmol min−1 m−3), driven both by lower concentrations and a different chemical composition. All the data collected highlight the need to add this parameter as part of the chemical characterization of PM, moving in the same direction as the new EU air quality directive.
1. Introduction
Atmospheric particulate matter (PM) is one of the most monitored air pollutants due to the negative effects it can have on human health. It is estimated that PM is the thirteenth leading cause of mortality worldwide, causing approximately 800,000 premature deaths each year [1]. Moreover, chronic exposure to PM has been identified as one of the causes of the increase in hospital admissions for respiratory problems and cardiovascular diseases. According to most epidemiological studies conducted to date, 3% of cardiopulmonary deaths and 5% of lung cancer deaths are attributable to PM exposure [2]. PM is also one of the major indoor air pollutants, due to its ability to accumulate in confined spaces and to its numerous indoor sources [3]. In the absence of adequate ventilation and/or air purification systems, concentration levels exceeding the WHO health alert thresholds can easily be reached [4]. Given that, on average, people spend more than 80% of their time indoors, this represents a major health concern for the population.
Until recent years, the concentration of airborne particles was considered the only metric to assess the health hazard they pose; however, chemical composition may also play an important role [5]. Indeed, studies suggest that the adverse effects caused by atmospheric PM can be attributed to the oxidative stress that PM causes in our bodies. These studies highlight how certain redox active species present in PM, such as heavy metals and quinones, can catalyze the formation of ROS (reactive oxygen species): highly reactive molecules that can react indiscriminately with the body’s cells [6]. The overall oxidative capacity of PM has been proposed as a metric that is more closely related to the biological responses caused by PM exposure and thus may be more informative than particulate mass alone in assessing the health hazard of PM [7].
Currently, oxidative potential (OP) is being proposed as a parameter with which to measure the oxidative stress directly caused by PM. This is defined as the ability of PM to oxidize target molecules that have similar functional groups and reactivity to endogenous molecules [8]. Based on this definition, various methods have been developed to measure this parameter, including both cellular and acellular assays. The former are more widespread since they offer a lower degree of complexity and have the advantages of being fast, inexpensive, and allowing for the rapid development of large data sets [9]. Most of these assays are based on oxidation reactions promoted by components of PM, which generate ROS. The only method that allows direct determination of these radical species employs electron spin resonance (ESR) [10] but is seldom used due to several drawbacks such as high costs, high complexity, and low sensitivity. Instead, particle-bound methods measure ROS within and on PM particles with fluorescent techniques, such as the dichlorofluorescein (DCFH) test. However, recent studies are questioning their relevance and therefore research is shifting mainly towards OP measurements [9].
Indirect methods evaluate the progress of specific reactions by assessing the depletion rate of the reagent (target molecule) or the formation rate of the products with different analytical techniques. Numerous alternatives are currently being proposed in the literature for the determination of OP, such as ascorbic acid (AA), dithiothreitol (DTT), reduced glutathione (GSH), and chemiluminescence reductive acridinium triggering (CRAT) tests [11]. Each assay has different strengths and weaknesses, but most importantly every test has a different sensitivity towards the oxidizing components found in PM [12]. To date, there is still no acellular assay that can respond to all PM components that generate ROS [9]. Moreover, in some cases the application procedures of the various protocols vary from author to author, complicating data comparison [6]. This is a critical issue if OP is to be regarded as the main parameter assessing the toxicity of PM.
Many different protocols can be found in the literature, including varying extraction solvents, filter types, incubation times, metal chelators, and other parameters [9]. For instance, Teflon filters are associated with higher OP values if compared to quartz fiber [13]. Also, extraction with methanol, as opposed to ultrapure water or buffer solutions, can result in better efficiencies and therefore higher OP readings [14]. However, since OP readings should reproduce real-life conditions as faithfully as possible, methanol may not be the best option to evaluate OP in relation to potential adverse health effects. Another parameter that varies between studies is the filter area [12,15]. This may also potentially be an issue because linearity with increasing filter area has not been yet studied.
Indeed, regulatory bodies and agencies have started to express their interest in implementing OP measurements to the other routine analyses carried out on PM samples. The EU is currently proposing a draft of the new air quality directive [16], in substitution of the old 2008/50/CE, which includes OP measurements in PM filters without specifying the methods of analysis. The new directive states that OP measurements will need to be carried out in both rural and urban sites in at least 45% of monitored fixed sites, highlighting the importance of this parameter to comprehend the effect of PM on health and the environment. However, to do so it is necessary to select a test with a common procedure to be universally applied.
In this study, two acellular tests (AA and DTT) were applied in parallel to a series of PM filters collected during a one-year sampling conducted by ARPA Lombardia, a local technical agency that supports the implementation of environmental policy, at an urban background site in the city of Milan. The same tests were also applied to another set of samples collected in two different indoor sites. Literature protocols that best simulated endogenous conditions were implemented for both assays and the DTT test was also optimized to ensure reproducibility of the measurements and improve accuracy of the results. The choice of the AA and DTT assays was made based on their widespread applications in literature, but mostly their speed and affordable costs, which make them good candidates for routine applications of OP measurements. Moreover, having different sensitivities towards the two main categories of oxidizing species in PM: metals and quinones; the two tests provide complementary information on the oxidative properties of PM.
Initially, optimization of the DTT assay was performed to obtain a reliable and reproducible protocol with which to carry out the tests. Eventually, calibration and limit of quantification (LOQ) determination were performed to establish the working ranges and sensitivity of the two methods. Before carrying out the assays on the PM samples, standard solutions of metals and quinones were tested and results were compared with similar studies to evaluate instrumental response. Finally, both outdoor and indoor PM samples were assessed using the AA and optimized DTT assays.
2. Materials and Methods
OP measurements were carried out on all PM samples with the AA and DTT assays following the procedures described in Visentin et al. 2016 [7]. These protocols were chosen because they are the ones that best simulate physiological conditions. This must be one of the main factors when selecting the type of test to carry out since the aim of the measurement is to assess the oxidative capacity of PM in the human body.
2.1. Reagents and Materials
The AA assay was carried out with a UV-VIS spectrophotometer (DU 800, Beckman Coulter, Fullerton, CA, USA) using quartz cuvettes. Ascorbic acid (Fluka Chemika, 99.5%, Buchs, Switzerland) was used to prepare the starting reagent solution in ultrapure water (milli-Q, Millipore, Darmstadt, Germany). The pH 7.4 buffer used to extract PM was prepared starting from Na2HPO4 (Sigma Aldrich, 99%, Saint Louis, MO, USA) and NaH2PO4 (Carlo Erba Reagents, 99%, Milan, Italy) salts and purified with a cationic exchange resin (Chelex 100, sodic form, Sigma Aldrich) to remove trace metals. Quarters of 47-mm diameter PM filters were extracted using an ultrasonic bath (Branson 2510, Branson Ultrasonics Corp., Danbury, CT, USA) for 30 min and filtered with 0.45 μm filters before analysis.
The DTT assay was performed with a UV-VIS spectrophotometer (Jasco V-730) using quartz cuvettes. The reaction was carried out in amber vials covered in tin foil using a stirring and heating plate (RCT basic, IKA Werke, Staufen, Germany) and digital thermoregulation (vertex, Velp scientifica). Ultrapure water (milli-Q, Millipore) was used to prepare all solutions: dithiothreitol (Sigma Aldrich, 99%), trichloroacetic acid (Fluka BioChemika, 99.5%), DTNB (Sigma Aldrich). The same pH 7.4 buffer was used to extract PM, whereas the pH 8.9 buffer was prepared from TRIS (Sigma Aldrich, 99%) and HCl (Sigma Aldrich, 37% w/w) with the addition of EDTA (Sigma Aldrich, 98%).
To verify the correct response of the two tests, standard solutions of metals and quinones were tested before applying the methods to the samples: Cu2+ (CuSO4·H2O; Sigma Aldrich; 98%) Cr3+ (CrO3, Carlo Erba Reagents, 99%, Milan, Italy), Mn2+ (MnO2, Carlo Erba Reagents, 90%), 1,2-naphthoquinone (1,2-NPQ), 9,10-phenatrenechinone (9,10-PNQ), and 1,4-naphthoquinone (1,4-NPQ). Quinone standard solutions were prepared in acetonitrile, whereas milli-Q water was selected as the solvent for the metal solutions.
2.2. Optimization of the DTT Assay
Two modifications were made to the DTT method described in Visentin et al. 2016 [7] to ensure the reproducibility of the data and linearity of the results. First, the time between two successive withdrawals (data points) was set to 10 min. This allowed us to observe a statistically significant difference between data points, improving linearity and therefore trueness of the final OP result. Second, the time between the last step of the method (addition of the pH 8.9 buffer) and the spectrophotometric analysis was set at a minimum of five minutes. This guaranteed the stability of the absorbance of the solution being tested.
2.3. Calibration and LOD, LOQ Determination
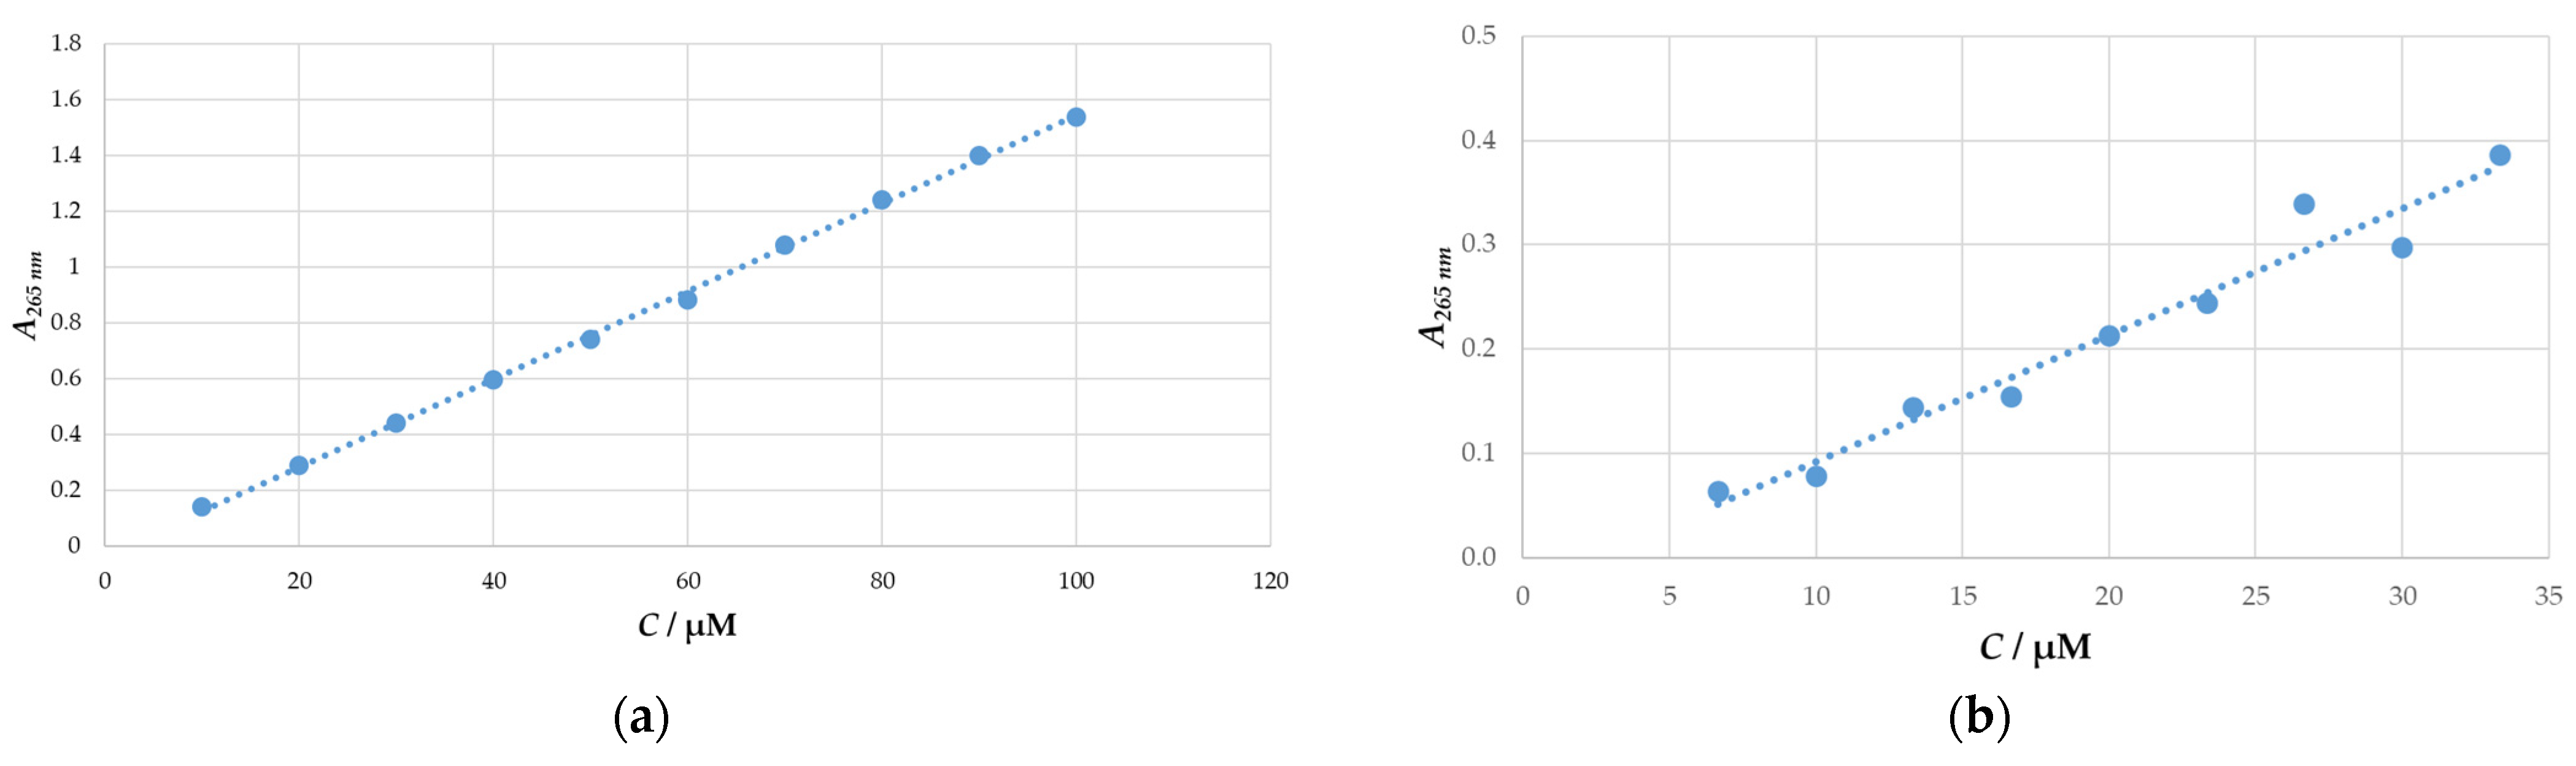
Calibration curves were constructed for both methods (AA and DTT) to verify linearity in the working range. For the AA assay, standard solutions of ascorbic acid at different concentrations between 10 µM and 100 µM were prepared and analyzed. Instead, a different approach was taken for the DTT assay since the molecule that is determined spectrophometrically, namely 2-nitro-5-tiobenzoic acid (TNB), is not commercially available. In this case, the calibration curve was constructed by running several tests following the optimized procedure with different starting concentrations of DTT in pH 7.4 buffer (6.7 µM–33.3 µM).
Ten blank measurements were carried out to determine the limit of detection (LOD) and LOQ of both methods:
where: µb is the mean average absorbance of blank measurements, σb is the standard deviation of blank measurements and m is the slope of the calibration curve.
LOD = (µb + 3σb)/m,
LOQ = (µb + 10σb)/m,
2.4. Outdoor Particulate Matter Samples
Twenty-four particulate matter (PM10) filters were selected from a one-year sampling campaign conducted at an urban background site in the city of Milan in the year 2022 (Figure 1). The filters were collected following the specifications of the UNI EN 12341:2014 technical standard [17] on quartz fiber filters (Ø = 47 mm) and each one corresponds to 24 h of sampling (Table 1).
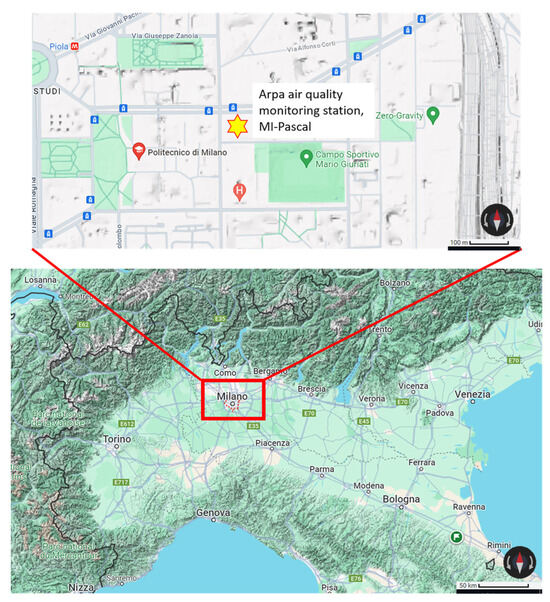
Figure 1.
Location of the sampling site. Milan, Italy.

Table 1.
Outdoor PM10 samples.
2.5. Indoor Particulate Matter Samples
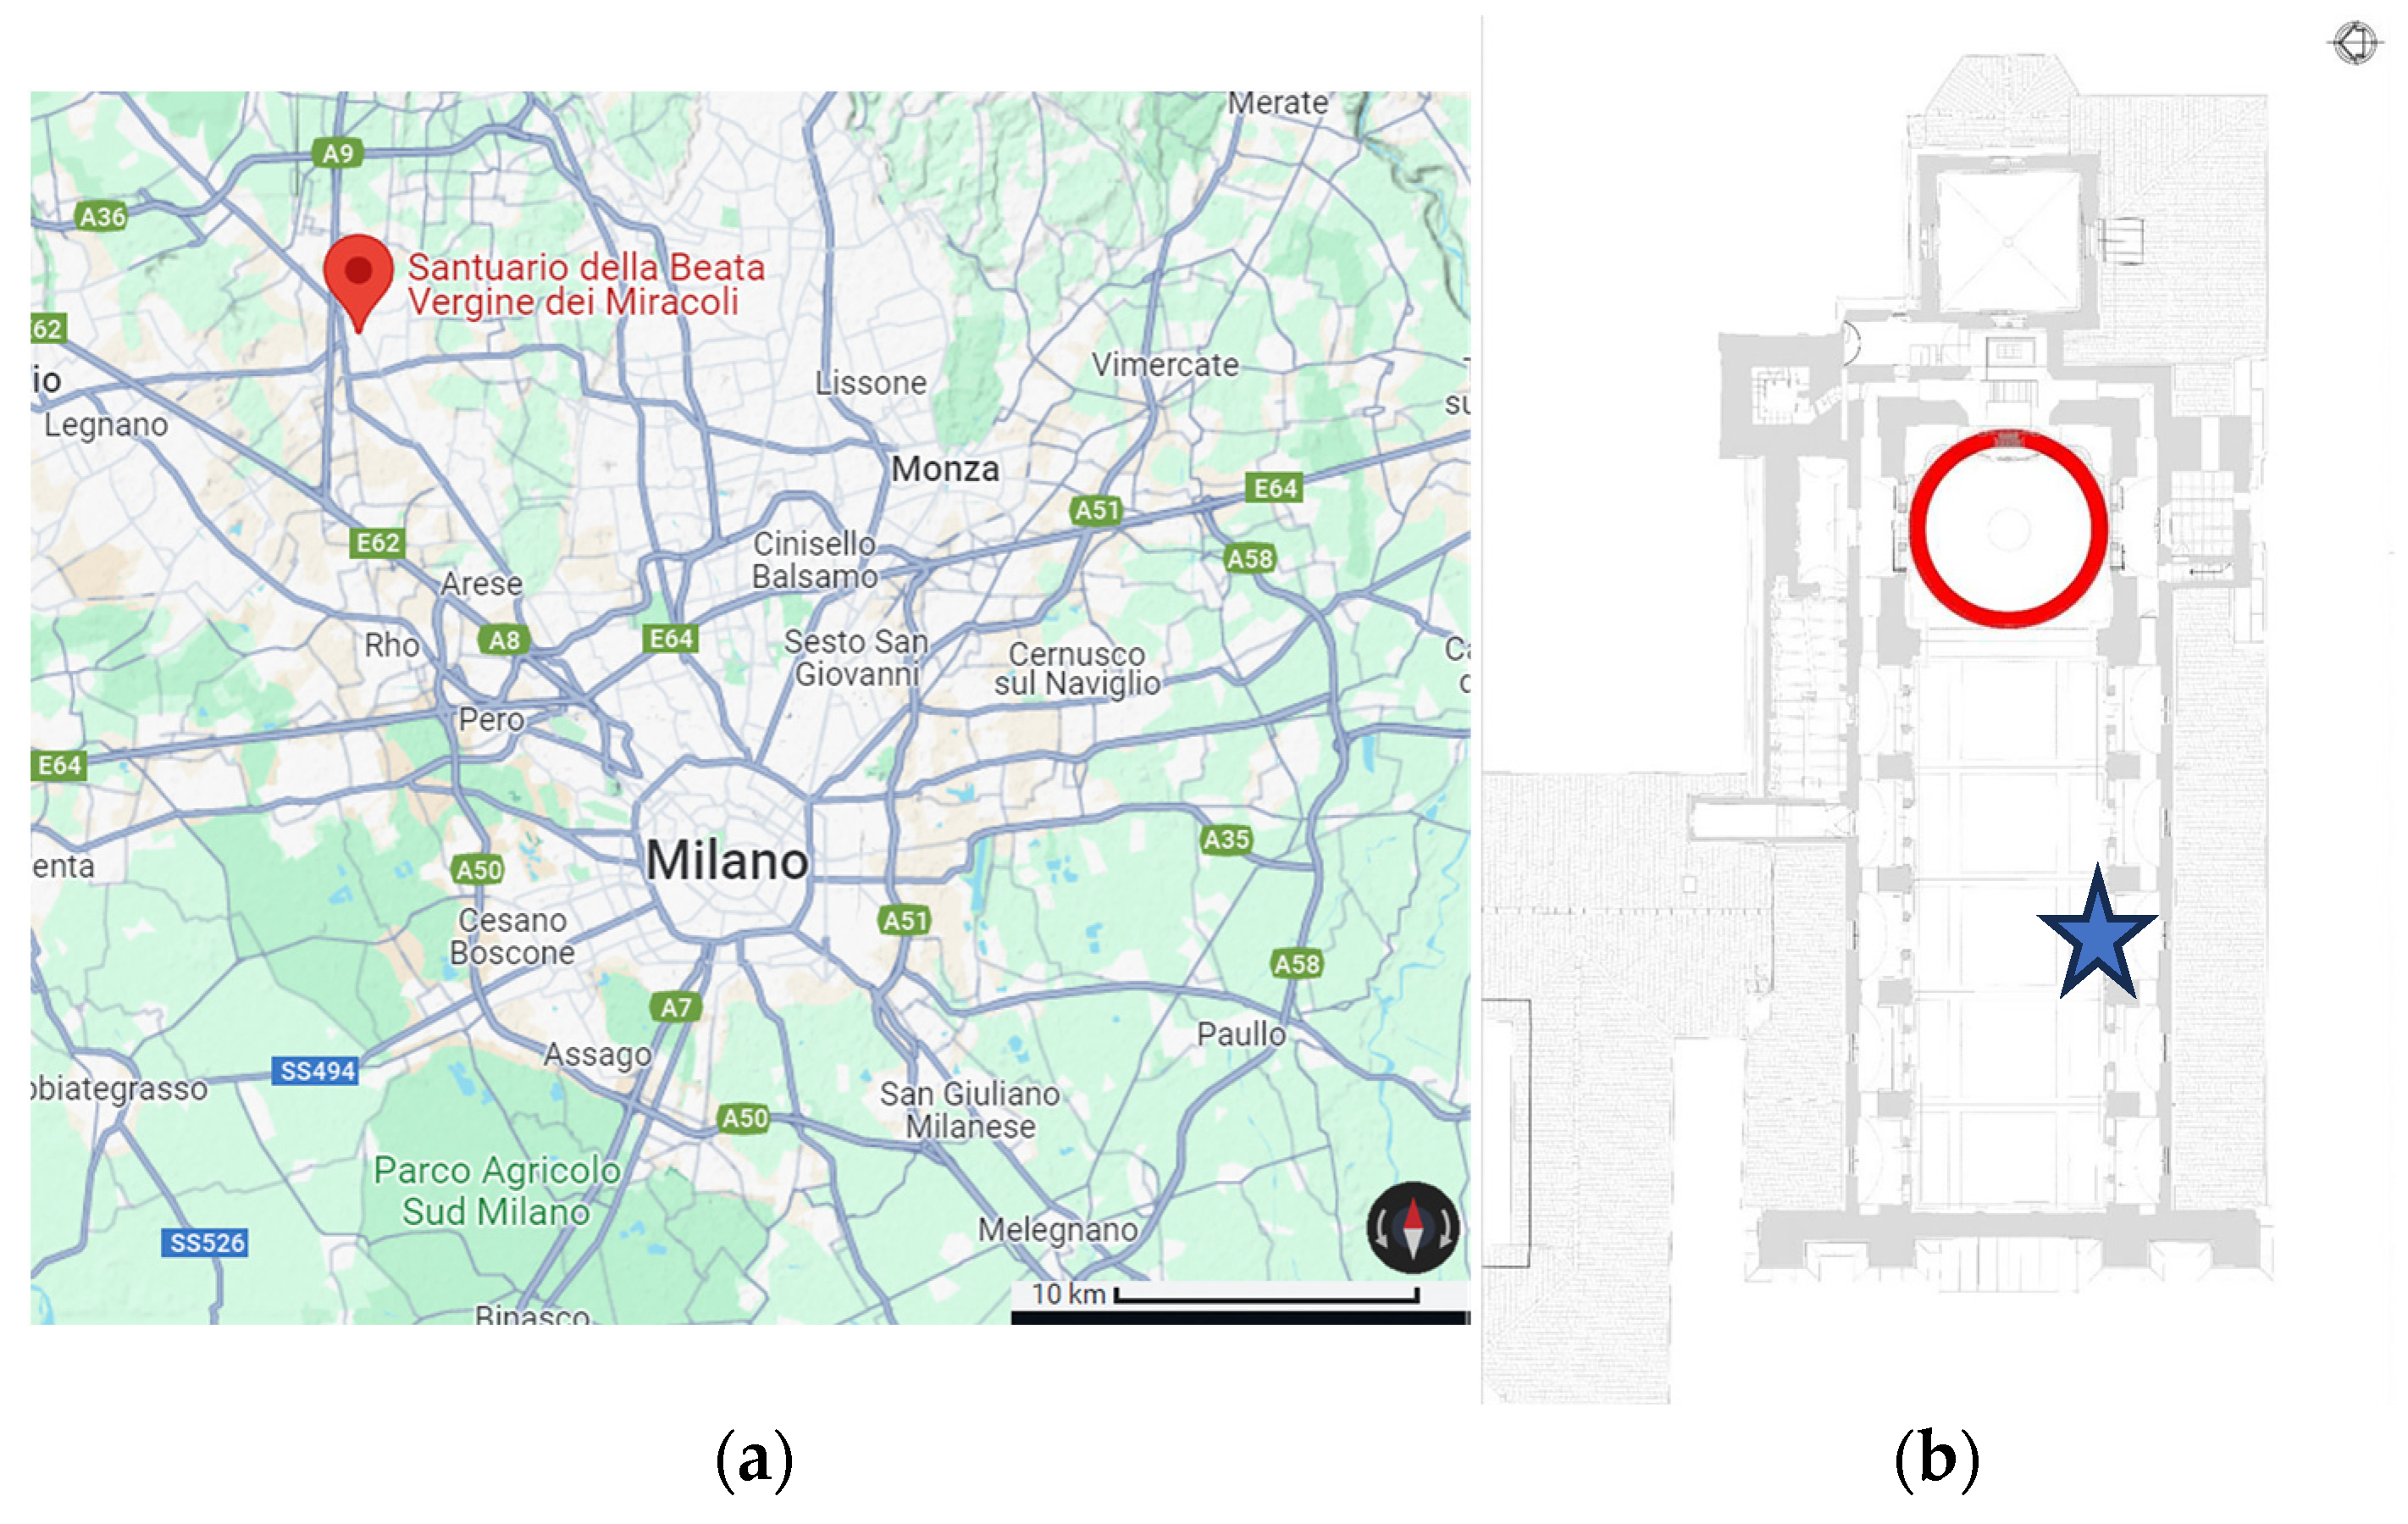
PM filters from a previous sampling campaign conducted in the Santuario della Beata Vergine dei Miracoli in Saronno (VA) [18] were selected for this study as indoor samples (Figure 2). One filter collected in a laboratory of the University of Milan was also analyzed as a reference.

Figure 2.
(a) Location of the Santuario della Beata Vergine dei Miracoli with respect to Milan, Italy; (b) Planimetry of the first floor of the Sanctuary. The blue star indicates the location of the high-volume sampler and the red ring indicates the position of valuable wooden sculptures.
Sampling was carried out using a high-volume sampler (ECHO Emergency, Tecora, Cogliate, Italy) on quartz fiber filters (Ø = 101.6 mm) and each one corresponds to multiple days of sampling (Table 2).
Table 2.
Indoor particulate matter samples.
3. Results
3.1. Optimization of the DTT Assay
OP measurements in this study were carried out using the procedure described in Visentin et al., 2016 [7]. Two modifications were made to this method, which improved the linearity of the data and therefore reproducibility of the results, especially for PM samples with low OP. First, the time between the last step of the method (addition of the pH 8.9 buffer) and the analysis was set to a minimum of 5 min. Table 3 shows the increase in absorbance with increasing time between the addition of the buffer and the analysis performed on a test filter. A basic pH is necessary to obtain TNB in its deprotonated form which absorbs at 412 nm. The results show that five minutes is the time necessary to obtain a complete conversion of the molecule.
Table 3.
The absorbance of a test sample measured at different times from pH 8.9 buffer addition.
The second parameter that was optimized is the time interval between successive withdrawals (data points). Test samples were analyzed performing withdrawals at 5 and 10 min time intervals (Table 4).
Table 4.
Measurement comparison with different time intervals of the data points.
These trials show that taking data points every 10 min ensures better linearity and therefore greater reliability of the OP value. Indeed, in some cases the result of the two trials is significantly different: 0.7 μM min−1 against 0.45 μM min−1. As indicated in Visentin et al., 2016 [7], the data points should have a linear relationship to obtain reproducible and reliable results. Therefore, 10 min was chosen as the time between successive withdrawals. Moreover, a longer time allows us to better observe the small differences in absorbance which are characteristic of this assay.
3.2. Calibration and LOD, LOQ Determination
For the calibration curves of the AA and DTT assays (Figure 3), standard solutions were prepared as described in Section 2.3. In both cases, the upper concentration was chosen equal to the concentration of the reagent at the start of the test, while the lower limit was chosen such that all values obtained within the experimental tests on the samples fell within the working range. Good linearity within the entire working range was observed in both cases. Therefore, all OP values were calculated from the calibration curve instead of directly using Lambert Beer’s law.
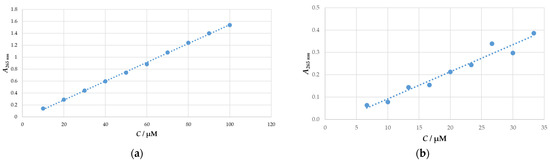
Figure 3.
Calibration curves (a) AA assay (y = 0.0157–0.03; R2 = 0.9991) (b) DTT assay (y = 0.012–0.03; R2 = 0.96).
In addition, 10 blank measurements were performed to calculate the LOD and LOQ: respectively, 5.53 μM and 6.06 μM for the AA assay; and 2.40 μM and 4.43 μM for the DTT assay. The data shows that the order of magnitude of LOD and LOQ is the same between the two methods, with the DTT assay being more sensitive analytically than the AA method. However, the precision of the measurement calculated as a relative standard deviation was 1.45% for the AA assay and 19.4% for the DTT test.
3.3. Testing the Methods on Standard Solutions
Following the example in Visentin et al., 2016 [7], standard solutions of metals and quinones were tested with both assays to verify the analytical response of the methods. Solutions of Cu2+, Cr3+, Mn2+, 1,2-NPQ, 1,4-NPQ, and 9,10-PQN were tested at a concentration of 1 μM or 5 μM (Table 5).
Table 5.
Oxidative potential values of standard solutions of metals and quinones.
The results for the AA assay are in line with the values indicated in Visentin et al. 2016 [7], indicating the effectivity of the method. Our laboratory is more sensitive towards quinones and less sensitive towards metals, except for Mn2+. Instead, a different trend was found for the DTT assay, in which our laboratory was less sensitive towards quinones whereas results for metals were comparable.
3.4. Outdoor Particulate Matter Samples
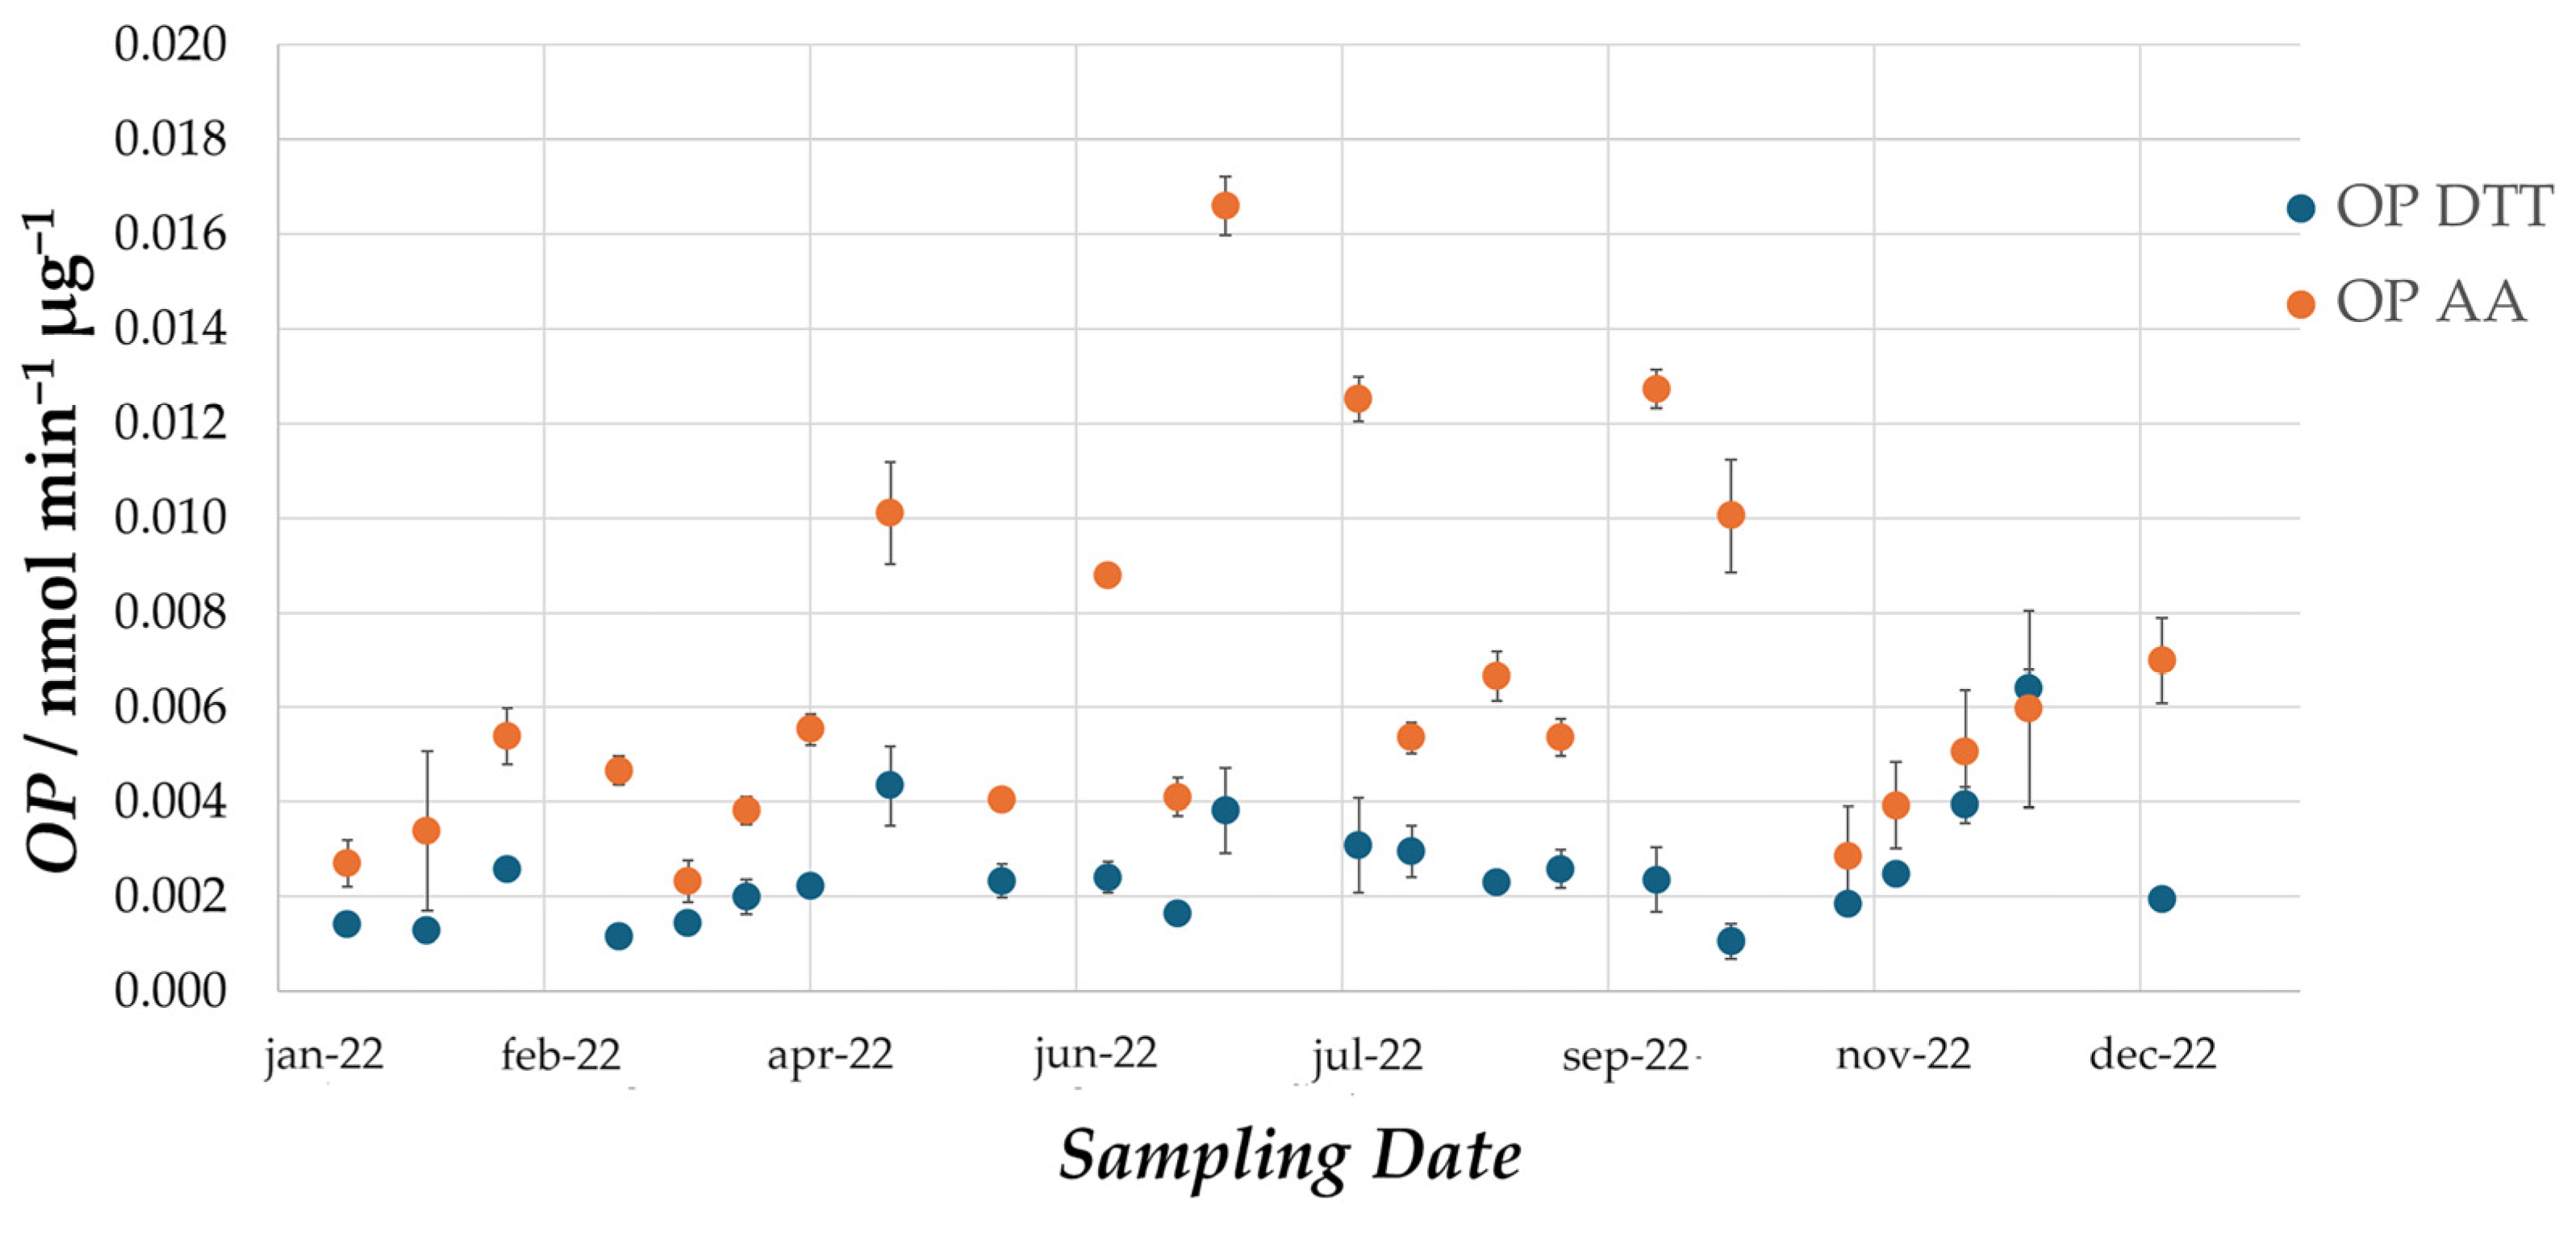
To obtain representative results, two samples were chosen from each month of the one-year sampling campaign in Milan. All filters were extracted and analyzed using both the AA and DTT assays and both mass-normalized (nmol min−1 μg−1) and volume-normalized (nmol min−1 m−3) OP values were calculated (Table 6).
Table 6.
Oxidative potential values of outdoor PM10 samples.
Figure 4 highlights the yearly trends of mass-normalized OP for both assays.
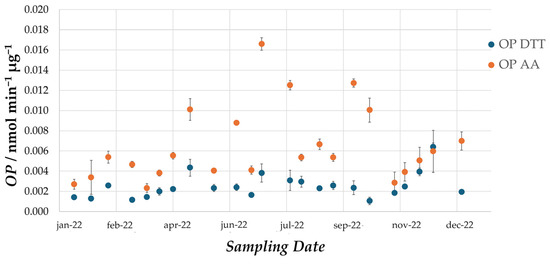
Figure 4.
Mass-normalized oxidative potential of outdoor PM10 samples.
The results showed that almost all the samples are more sensitive to the AA assay, in line with values from a similar study in which the same protocols were applied [19]. Indeed, mass-normalized OPAA values ranged between 0.0023 nmol min−1 µg−1 and 0.0166 nmol min−1 µg−1; whereas mass-normalized OPDTT values ranged between 0.0011 nmol min−1 µg−1 and 0.0064 nmol min−1 µg−1. As already observed in previous literature works, no correlation was observed between the two assays, as revealed by the Pearson correlation coefficient (r < 0.4). Moreover, OPDTT values do not highlight seasonal trends, whereas higher OPAA values were registered in the summer months.
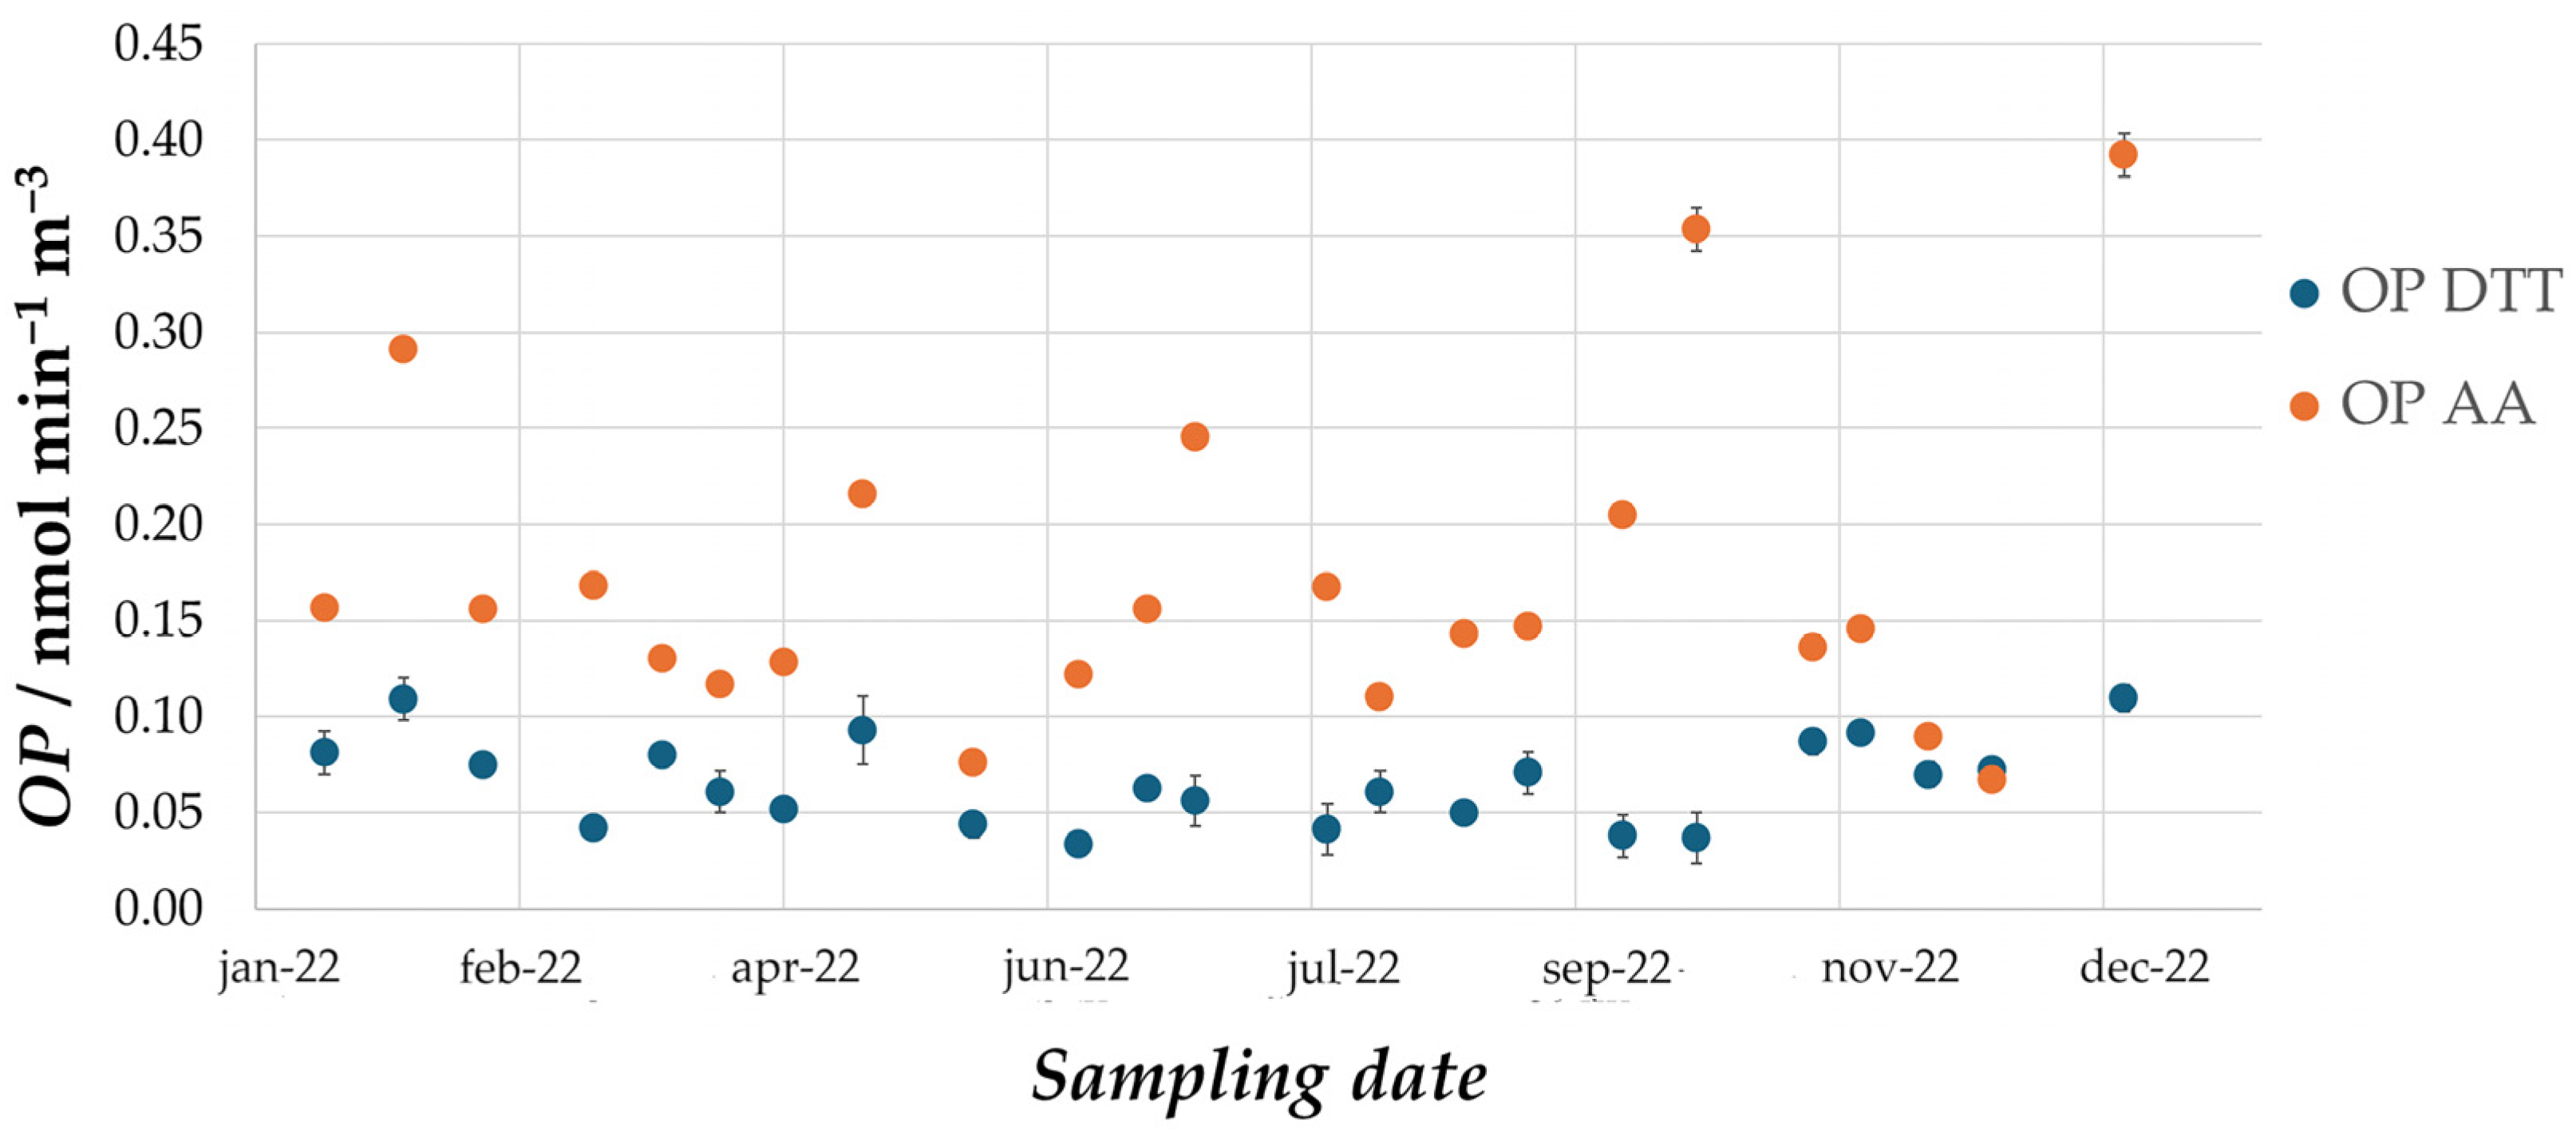
OP values were also calculated and normalized for the sampled volume (Figure 5). These values are the data of greatest toxicological interest because they represent the amount of air inhaled, and thus the actual human exposure to oxidative stress.
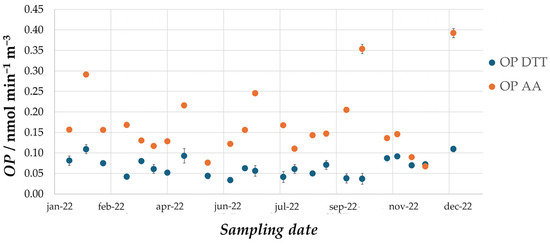
Figure 5.
Volume-normalized oxidative potential of outdoor PM10 samples.
As was the case for the mass-normalized values, no significant correlation was observed between the two tests, as revealed by the Pearson correlation coefficient (r < 0.4), and OPAA is higher for almost all samples than OPDTT. The observed values ranged between 0.067 nmol min−1 m−3 and 0.39 nmol min−1 m−3 for OPAA and between 0.033 nmol min−1 m−3 a 0.109 nmol min−1 m−3 for OPDTT. Unlike the mass-normalized OP, in this case, no significant seasonal trends could be observed for both the AA and DTT assay, aside from a few samples with high OPAA in the winter months.
3.5. Indoor Particulate Matter Samples
AA and DTT assays were also performed on indoor PM samples and both mass- and volume-normalized OP values were calculated (Table 7).
Table 7.
Oxidative potential values of indoor PM10 samples.
These results show that OP values of indoor PM sampled at the Santuario della Beata Vergine dei Miracoli and at the University of Milan are lower than the ones registered for outdoor samples in the city of Milan and no significant differences can be observed between the two indoor sites in terms of OP. In this case, OPDTT values are higher than OPAA values for all the filters, once again highlighting a significant difference in terms of oxidative properties between outdoor and indoor PM.
4. Discussion
PM has a very complex chemical composition which depends on the type of pollutant sources, their intensity, and atmospheric conditions. Therefore, the composition can vary greatly depending on location, season, and other contributing factors. Even though the negative effects that PM has on the human body are known, the complexity of the chemical composition makes it difficult to establish a direct relationship between toxicity and its different components. However, toxicological studies are trying to shed light on this important issue and significant steps forward have been made. OP is currently being proposed as an alternative metric to particulate mass alone, able to assess the toxicity of airborne particles. Several methods have been proposed in the literature, but a universally accepted one is lacking. This makes it difficult to compare data from different studies worldwide, even more so considering the great variations in terms of the chemical composition of PM.
Some agencies and regulatory bodies have started to express their interest in adding OP measurements to the other routine analyses aimed at the chemical characterization of PM. In the draft of the new air quality directive, the EU introduced OP as an additional parameter to be monitored, covering a minimum of 45% of yearly PM samples. However, the draft does not indicate measurement methods or protocols, leaving the choice to the member states. Given the large number of methods and protocols in the literature, it is crucial to have a single reference methodology with an accepted protocol for results to be comparable. For such large-scale applications, measurement methods need to be fast and easily applicable. Two of the most widespread methods in literature that display these characteristics are the AA and the DTT assay.
In this study, these two methods were optimized and validated to assess their potential applicability for routine PM analysis carried out by regulatory bodies and agencies. With regards to the integrations made, fixing a minimum time before analysis was important because in several samples the differences in absorbance values between two successive data points were comparable to the difference in absorbance between the analysis carried out after 1 and 5 min following the addition of the pH 8.9 buffer. This was especially true for samples with a low OP, in which the absorbance difference between successive data points is very small. Moreover, setting a time interval between withdrawals also helped to improve the quality of the measurement, especially for these types of samples, in which it was often difficult to measure observable differences between data points taken separated by only five minutes. Both integrations have a direct impact on the linearity of the data points, and therefore on the accuracy and reliability of OP values.
Calibration curves were also constructed for both assays to evaluate the linearity of the absorbance instrumental response within the working range. To the knowledge of the authors, most literature studies that employed the AA and/or DTT assays calculated analyte concentrations from absorbance values through a direct application of the Lambert-Beer law using tabulated molar absorption coefficients. Some studies use an alternative approach for the calculation of OP [20] and employ calibration curves to obtain initial analyte concentration. However, analyte rate decay is calculated without considering the linearity of the response, which is a distinctive element of AA and DTT OP measurements. While it is true that the low concentrations involved in these assays are within the range of application of the Lambert-Beer law, it is good practice to check the linearity of the response with a calibration curve due to possible instrumental deviations which may be non-negligible. Once again, this is even more important given the very small differences in absorbance between data points, especially for the DTT assay. Moreover, the determination of the LOQ was also important to establish a working range and discard any outlying data points that would otherwise affect linearity and therefore the reliability of the OP value.
Method validation and protocol optimization (DTT) carried out in this study confirmed the potential large-scale applicability of both assays for routine PM analysis, which is crucial for regional and international regulation agencies looking to introduce OP as an alternative parameter to be monitored. For this reason, a first-ever application of OP measurements was carried out on PM filters from a yearly sampling campaign conducted by the regional protection agency of Lombardy, Italy (ARPA Lombardia). Once the new EU air quality directive is adopted, ARPA Lombardia amongst the bodies responsible for carrying out OP measurements. It is therefore in their interest to evaluate the applicability of different methods for routine PM analysis.
The results of the campaign show that OP values fall within the wide range of values observed in literature for urban sites [5,20,21]. Mean values observed for PM10 in Milan are lower than mean values observed in most of the other similar studies carried out in the literature; however, it is difficult to compare absolute values when the reproducibility of OP measurements remains to be established. Indeed, intercomparisons between different laboratories still have to be carried out and differences in the protocols probably lead to differences in the final results. Instead, relevant conclusions can be drawn based on seasonal trends, which highlight that exposure to oxidative airborne particles is constant throughout the entire year. In fact, OPDTT and volume-normalized OPAA values do not show significant variations between the different months of sampling. On the other hand, mass-normalized OPAA values are higher in the summer months. Given that the average mass concentration of PM is lower in summer than in winter, this is probably due to a greater percentage contribution of organic oxidizing species generated by photochemical aging. As reported by Antinolo et al. 2015 [22], these molecules are part of secondary organic aerosol and promote the formation of ROS in the human body.
This suggests that the chemical composition of the particles plays a fundamental role in defining the oxidative properties of PM. Nevertheless, the fact that volume-normalized OPAA does not highlight a similar seasonal trend indicates that a different factor is driving the oxidative capacity of the particles collected in winter. Possibly, the high mass concentrations in the colder months are enough to counterbalance a lower percentage contribution of oxidizing species. Instead, some studies suggest that enhanced partitioning of semi-volatile organic compounds (SVOCs) in the particulate phase contributes to high OP in winter. Overall, the results of this study indicate that both the chemical composition and the mass concentrations play an important role in defining the OP of atmospheric PM, further highlighting the importance of carrying out such measurements on a yearly basis.
The results observed for the indoor samples also support this conclusion. On the one hand, reduced photochemical activity in indoor sites decreases secondary organic aerosol formation therefore reducing the oxidative capacity of the particles. On the other hand, average PM concentrations were lower than outdoors in the monitored site [18]. Other factors that may have played a role are different sampling conditions and locations between indoors and outdoors. With regards to the former, studies suggest that the response of acellular assays tends to be low for particles with an aerodynamic diameter lower than 10 µm [23], therefore sampling without a size-selective inlet in indoor areas may explain part of the difference. However, the number of particles greater than 10 µm is minimal compared to the smaller size ranges [18]. Despite them having a greater impact on the total mass, it is unlikely that these particles are responsible for the large differences in OP observed. It is also unlikely that the different sampling locations may have played a significant role. First, the Santuario della Beata Vergine dei Miracoli is located close to another urban background ARPA monitoring station (Saronno-Santuario) [18], highlighting similar characteristics of the two sites. Moreover, the PM10 concentrations recorded by the monitoring stations do not highlight significant differences in the concentrations (Table S1).
This also reinforces the conclusion that OP values were mainly influenced by the conditions within the indoor site. Therefore, chemical composition and mass concentration were the main factors explaining the differences between indoors and outdoors in this case study. Given the large variability of indoor PM chemical composition and the large number of sources and factors which are involved, this may not reflect the situation in different indoor environments. It is therefore important to promote and carry out these types of investigations on other sites. With the aim of further understanding the relationship between OP and the chemical composition of PM, future work will include a complete chemical characterization of the filters analyzed in this study. It is important to underline that scientific research on this topic is still in the early stages from a methodological point of view and the best methods and procedures to make OP a routine analysis are still being considered. In this regard, the proposed methods and protocols in this study represent valid candidates. As briefly mentioned in the discussion, the next step will be to carry out interlaboratory comparisons to test for reproducibility and robustness. The final goal is to obtain a unique method and established protocol that would enable full application of the new air quality directive whilst ensuring comparability of measurements carried out in unmonitored areas such as indoor spaces.
5. Conclusions
Optimization and application of the two most widespread methods for the determination of OP (AA and DTT assays) were carried out on PM10 filters from a one-year sampling campaign conducted by ARPA Lombardia and on indoor PM samples. The protocols employed in this study meet the necessary requirements to be potentially applied on a larger scale, as part of routine measurements to assess the oxidative properties of PM. Moreover, analyses of the samples reveal that exposure to potentially harmful particles outdoors is constant throughout the year (OPAA: 0.067–0.39 nmol min−1 m−3; OPDTT: 0.033–0.109 nmol min−1 m−3) highlighting the importance of conducting these studies in yearly campaigns. Differently, indoor PM shows a lower OP (OPAA: 5.40–24 pmol min−1 m−3; OPDTT: 9.7–32 pmol min−1 m−3) on average. On the one hand, this suggests the lower oxidative capacity of particles in indoor areas; however, air pollution can vary greatly between different indoor sites, and therefore more extensive research needs to be conducted in order to validate the previous conclusion. Overall, both chemical composition and mass concentrations play an important role, contributing in different but equally important ways to oxidative properties. Since OP measurements will be required by official regulations, extensive efforts are needed in order to arrive at standardized and approved methods for its measurement.
Supplementary Materials
The following supporting information can be downloaded at: https://www.mdpi.com/article/10.3390/atmos15070772/s1, Table S1: PM10 concentrations in Milan and Saronno measured by the ARPA air quality monitoring stations of Saronno-Santuario and MI-Pascal for the year 2022. Blank spaces indicate missing measurements.
Author Contributions
Conceptualization, A.B. and P.F.; methodology, A.B., E.C. (Elena Carrara) and E.F.; validation, A.B., E.C. (Elena Carrara) and E.F.; formal analysis, A.B., E.C. (Elena Carrara) and E.F.; investigation, A.B., V.C. and P.F.; resources, C.C., E.C. (Eleonora Cuccia), B.B. and P.F.; data curation, A.B., E.C. (Elena Carrara) and E.F.; writing—original draft preparation, A.B.; writing—review and editing, C.C., E.C. (Elena Carrara), B.B., V.C., E.C. (Eleonora Cuccia), E.F. and P.F.; supervision, C.C. and P.F.; project administration, P.F. All authors have read and agreed to the published version of the manuscript.
Funding
This research received no external funding.
Institutional Review Board Statement
Not applicable.
Informed Consent Statement
Not applicable.
Data Availability Statement
The raw data supporting the conclusions of this article will be made available by the authors upon request. The data are not publicly available due to privacy.
Conflicts of Interest
The authors declare no conflicts of interest.
References
- Anderson, J.O.; Thundiyil, J.G.; Stolbach, A. Clearing the Air: A Review of the Effects of Particulate Matter Air Pollution on Human Health. J. Med. Toxicol. 2012, 8, 166–175. [Google Scholar] [CrossRef]
- Kim, K.H.; Kabir, E.; Kabir, S. A Review on the Human Health Impact of Airborne Particulate Matter. Environ. Int. 2015, 74, 136–143. [Google Scholar] [CrossRef]
- Irga, P.J.; Paull, N.J.; Abdo, P.; Torpy, F.R. An Assessment of the Atmospheric Particle Removal Efficiency of an In-Room Botanical Biofilter System. Build. Environ. 2017, 115, 281–290. [Google Scholar] [CrossRef]
- Fermo, P.; Artíñano, B.; De Gennaro, G.; Pantaleo, A.M.; Parente, A.; Battaglia, F.; Colicino, E.; Di Tanna, G.; Goncalves da Silva Junior, A.; Pereira, I.G.; et al. Improving Indoor Air Quality through an Air Purifier Able to Reduce Aerosol Particulate Matter (PM) and Volatile Organic Compounds (VOCs): Experimental Results. Environ. Res. 2021, 197, 111–131. [Google Scholar] [CrossRef]
- Pietrogrande, M.C.; Russo, M.; Zagatti, E. Review of PM Oxidative Potential Measured with Acellular Assays in Urban and Rural Sites across Italy. Atmosphere 2019, 10, 626. [Google Scholar] [CrossRef]
- Patel, A.; Rastogi, N. Oxidative Potential of Ambient PM and Related Health Endpoints over South Asia: A Review. Asian J. Atmos. Environ. 2021, 15, 2020123. [Google Scholar] [CrossRef]
- Visentin, M.; Pagnoni, A.; Sarti, E.; Pietrogrande, M.C. Urban PM2.5 Oxidative Potential: Importance of Chemical Species and Comparison of Two Spectrophotometric Cell-Free Assays. Environ. Pollut. 2016, 219, 72–79. [Google Scholar] [CrossRef]
- Borm, P.J.A.; Kelly, F.; Künzli, N.; Schins, R.P.F.; Donaldson, K. Oxidant Generation by Particulate Matter: From Biologically Effective Dose to a Promising, Novel Metric. Occup. Environ. Med. 2007, 64, 73–74. [Google Scholar] [CrossRef]
- Bates, J.T.; Fang, T.; Verma, V.; Zeng, L.; Weber, R.J.; Tolbert, P.E.; Abrams, J.Y.; Sarnat, S.E.; Klein, M.; Mulholland, J.A.; et al. Review of Acellular Assays of Ambient Particulate Matter Oxidative Potential: Methods and Relationships with Composition, Sources, and Health Effects. Environ. Sci. Technol. 2019, 53, 4003–4019. [Google Scholar] [CrossRef]
- Janssen, N.A.H.; Yang, A.; Strak, M.; Steenhof, M.; Hellack, B.; Gerlofs-Nijland, M.E.; Kuhlbusch, T.; Kelly, F.; Harrison, R.; Brunekreef, B.; et al. Oxidative Potential of Particulate Matter Collected at Sites with Different Source Characteristics. Sci. Total Environ. 2014, 472, 572–581. [Google Scholar] [CrossRef]
- Rao, L.; Zhang, L.; Wang, X.; Xie, T.; Zhou, S.; Lu, S.; Liu, X.; Lu, H.; Xiao, K.; Wang, W.; et al. Oxidative Potential Induced by Ambient Particulate Matters with Acellular Assays: A Review. Processes 2020, 8, 1410. [Google Scholar] [CrossRef]
- Romano, S.; Becagli, S.; Lucarelli, F.; Russo, M.; Pietrogrande, M.C. Oxidative Potential Sensitivity to Metals, Br, P, S and Se in PM10 Samples: New Insights from a Monitoring Campaign in Southeastern Italy. Atmosphere 2020, 11, 367. [Google Scholar] [CrossRef]
- Yang, A.; Jedynska, A.; Hellack, B.; Kooter, I.; Hoek, G.; Brunekreef, B.; Kuhlbusch, T.A.J.; Cassee, F.R.; Janssen, N.A.H. Measurement of the Oxidative Potential of PM2.5 and Its Constituents: The Effect of Extraction Solvent and Filter Type. Atmos. Environ. 2014, 83, 35–42. [Google Scholar] [CrossRef]
- Rattanavaraha, W.; Rosen, E.; Zhang, H.; Li, Q.; Pantong, K.; Kamens, R.M. The Reactive Oxidant Potential of Different Types of Aged Atmospheric Particles: An Outdoor Chamber Study. Atmos. Environ. 2011, 45, 3848–3855. [Google Scholar] [CrossRef]
- Patel, A.; Rastogi, N.; Gandhi, U.; Khatri, N. Oxidative Potential of Atmospheric PM10 at Five Different Sites of Ahmedabad, a Big City in Western India. Environ. Pollut. 2021, 268, 115909. [Google Scholar] [CrossRef]
- European Parliament. Directive (EU) of the European Parliament and of the Council on Ambient Air Quality and Cleaner Air for Europe; Draft; European Parliament: Strasbourg, France, 2024. [Google Scholar]
- UNI EN 12341:2014; Ambient Air—Standard Gravimetric Measurement Method for the Determination of the PM10 or PM2.5 Mass Concentration of Suspended Particulate Matter. Slovenian Institute for Standardization: Ljubljana, Slovenia, 2014.
- Bergomi, A.; Comite, V.; Guglielmi, V.; Borelli, M.; Lombardi, C.A.; Bonomi, R.; Pironti, C.; Ricciardi, M.; Proto, A.; Mariani, C.; et al. Preliminary Air Quality and Microclimatic Conditions Study in the Santuario Della Beata Vergine Dei Miracoli in Saronno (VA). Molecules 2023, 28, 1615. [Google Scholar] [CrossRef]
- Serafeim, E.; Besis, A.; Kouras, A.; Farias, C.N.; Yera, A.B.; Pereira, G.M.; Samara, C.; de Castro Vasconcellos, P. Oxidative Potential of Ambient PM2.5 from São Paulo, Brazil: Variations, Associations with Chemical Components and Source Apportionment. Atmos. Environ. 2023, 298, 119593. [Google Scholar] [CrossRef]
- Li, J.M.; Zhao, S.M.; Miao, Q.Y.; Wu, S.P.; Zhang, J.; Schwab, J.J. Changes in Source Contributions to the Oxidative Potential of PM2.5 in Urban Xiamen, China. J. Environ. Sci. 2025, 149, 342–357. [Google Scholar] [CrossRef]
- Perrone, M.R.; Bertoli, I.; Romano, S.; Russo, M.; Rispoli, G.; Pietrogrande, M.C. PM2.5 and PM10 Oxidative Potential at a Central Mediterranean Site: Contrasts between Dithiothreitol- and Ascorbic Acid-Measured Values in Relation with Particle Size and Chemical Composition. Atmos. Environ. 2019, 210, 143–155. [Google Scholar] [CrossRef]
- Antiñolo, M.; Willis, M.D.; Zhou, S.; Abbatt, J.P.D. Connecting the oxidation of soot to its redox cycling abilities. Nat. Commun. 2015, 6, 6812. [Google Scholar] [CrossRef]
- Massimi, L.; Ristorini, M.; Simonetti, G.; Frezzini, M.A.; Astolfi, M.L.; Canepari, S. Spatial Mapping and Size Distribution of Oxidative Potential of Particulate Matter Released by Spatially Disaggregated Sources. Environ. Pollut. 2020, 266, 115271. [Google Scholar] [CrossRef] [PubMed]

Disclaimer/Publisher’s Note: The statements, opinions and data contained in all publications are solely those of the individual author(s) and contributor(s) and not of MDPI and/or the editor(s). MDPI and/or the editor(s) disclaim responsibility for any injury to people or property resulting from any ideas, methods, instructions or products referred to in the content. |
© 2024 by the authors. Licensee MDPI, Basel, Switzerland. This article is an open access article distributed under the terms and conditions of the Creative Commons Attribution (CC BY) license (https://creativecommons.org/licenses/by/4.0/).