Article

Northeast China Cold Vortex Amplifies Extreme Precipitation Events in the Middle and Lower Reaches Yangtze River Basin

1
Hubei Key Laboratory of Intelligent Yangtze and Hydroelectric Science, China Yangtze Power Co., Ltd., Yichang 443000, China
2
Huafeng Meteorological Media Group Co., Ltd., Beijing 100081, China
3
International Center for Climate and Environment Sciences, Institute of Atmospheric Physics, Chinese Academy of Sciences, Beijing 100029, China
4
Northern Research Center of Key Laboratory for Basin Heavy Rainfall, Jilin Provincial Key Laboratory of Changbai Mountain Meteorology & Climate Change, Institute of Meteorological Sciences of Jilin Province, China Meteorological Administration, Changchun 130062, China
*
Authors to whom correspondence should be addressed.
Atmosphere 2024, 15(7), 819; https://doi.org/10.3390/atmos15070819
Submission received: 14 May 2024 / Revised: 13 June 2024 / Accepted: 15 June 2024 / Published: 8 July 2024

Abstract

:
The middle and lower reaches of the Yangtze River (MLYR) frequently experience extreme precipitation events (EPEs) during June and July, the so-called Meiyu season. This study investigated EPEs in the MLYR during Meiyu seasons over 1961–2022, using rain gauge observations and ERA5 reanalysis data. EPEs associated with the Northeast China cold vortex featured more undulating westerlies with a distinct wave train pattern from Europe to Northeast Asia. Due to robust Rossby wave energy, the trough deepened from Northeast China towards the MLYR and was confronted with a westward extension of the western Pacific subtropical high. Such a configuration enhanced the warm and moist monsoon conveyor belt and convergence of water vapor flux from southwestern China to the MLYR. The warm and moist air favored upward motion. The increased rainfall prevailed from southwestern China to the MLYR. In contrast, ordinary EPEs were characterized by zonal westerlies and weaker Rossby wave propagation. The Meiyu trough was comparatively shallow and confined to the MLYR with less westward expansion of the subtropical high. In response, the warm and moist monsoon conveyor belt was more localized, resulting in weaker EPEs in the MLYR.

1. Introduction

Extreme precipitation events (EPE) are relatively frequent and intense across eastern Chinese during the East Asian monsoon season [1]. EPEs usually lead to severe flooding, landslides, debris flow, urban waterlogging, and other secondary disasters, which significantly impact societies with losses of human lives and property and the disruption of infrastructure services [2,3]. Due to EPEs, annual economic losses accounted for CNY 139 billion, and the number of individual deaths was about 984 per year in China from 2011 to 2015 [4].
One area of China that merits close attention is the middle and lower reaches of the Yangtze River (MLYR), which is located in central and eastern China. The MLYR, being densely populated and an important economic area, is significantly impacted by the East Asian summer monsoon [5]. The East Asian summer monsoon dominates the MLYR from June and July, known as the Meiyu season [6,7], and favors the occurrences of EPEs and floods. For example, during the summer of 2020, the MLYR experienced widespread and persistent EPEs, which led to extreme floods across its rural and urban areas. Surprisingly, these record-breaking EPEs were not preceded by a significant El Niño event [8]. However, the major primary cause was the unprecedentedly pronounced western Pacific subtropic high, whose southeasterly winds transported abundant warm and moist air toward the MLYR [9,10,11]. Meanwhile, the advection of cold air from the mid-high latitudes by the northeasterly winds over northeastern Asia triggered the high recurrence of EPEs over the MLYR [12]. Therefore, EPEs can be considered as the drastic interaction between low and mid-high latitude atmospheric circulation [13], with the MLYR being one typical region of such interactions.
The middle- and upper-level atmospheric circulation systems responsible for EPEs over MLYR mainly include the western Pacific subtropical high, the westerly trough (or the Meiyu trough), blocking high, and the East Asian jet stream [14,15,16,17,18,19,20]. The leading three systems constitute the dominant climate mode over East Asia (i.e., East Asia–Pacific teleconnection pattern) that can induce persistent EPEs in the MLYR [21,22,23]. During the negative phase of East Asia–Pacific pattern, the western Pacific subtropical high advances northward, while the Meiyu trough and blocking maintains over eastern China and Yakutsk, respectively. This configuration fosters a confrontation between warm, moist, and cold air over the MLYR, forming the Meiyu front that is conducive to EPEs [24,25,26]. The upper tropospheric East Asian jet stream not only serves as a waveguide for Rossby wave energy that maintains the East Asia–Pacific pattern but creates divergence that facilitates the development of convective precipitation.
It has been recognized that the Northeast China cold vortex (NCCV) can cause extensive EPEs over eastern China, including the MLYR [27,28,29]. Unlike the Meiyu trough, NCCV is a closed low that deepens further from the westerly trough due to the amplification of Rossby waves [30]. The NCCV is a prevalent weather system in East Asia, which accounts for one-third of the total number of days in the summer season [31,32]. When its eastward progression is obstructed by atmospheric blocking over northeastern Asia, it is more prone to triggering EPEs in eastern China [33]. In addition, NCCV has been considered to have “climate effects” on the Meiyu rainfall in the MLYR as it leads to the extensive intrusion of cold air into eastern China, resulting in a significant increase in precipitation in the MLYR [34]. However, the features of EPEs associated with the NCCV over the MLYR, as compared to those associated with the Meiyu trough, are not yet well understood.
This study attempts to understand the influences of NCCV on EPEs over the MLYR by answering the following question: what are the differences in circulation patterns, water vapor, and upward motion between EPEs associated with NCCV and those without NCCV? The rest of this paper is structured as follows: Section 2 describes the datasets and methods, Section 3 presents differences in atmospheric environment fields for EPEs that are associated with NCCV compared to those that are not associated with NCCV, and Section 4 provides a summary and discussion.

2. Data and Methods

2.1. Study Area

Since this study focuses on EPEs during the Meiyu season, we adopted the Chinese Meiyu area as defined by the China Meteorological Administration in 2014 (Figure 1). According to this definition, the Chinese Meiyu is mainly distributed in the Yangtze–Huaihe River basin, which is ranges from the Hubei Province to the coast of East China and from the northern boundary of Nanling Mountainous area to the Huaihe River. This area lies within the latitude and longitude range of 28–34° N, 110–123° E. The China Meteorological Administration, with the purpose of monitoring the onset of Meiyu, has divided this area into four sub-regions. However, for the scope of this study on EPEs, we chose the entire Meiyu area as our study area, herein referred to as the MLYR [35].

2.2. Data

In this study, we used the fifth-generation daily reanalysis dataset produced by ECMWF [36]. This dataset has an hourly time resolution and covers the period from 1940 to the present day. We acquired this dataset on a 1° × 1° longitude–latitude grid. The pressure-level variables considered in this study include geopotential, temperature, and u- and v-components of wind. Meanwhile, the single-level data consists of the vertical integral of eastward and westward water vapor flux as well as the vertical integral of the divergence of moisture flux. The daily mean meteorological fields were computed from the hourly data.
We also utilized the daily precipitation data from 251 rain gauge stations over the MLYR, provided by the National Meteorological Information Center of China Meteorological Administration (Figure 1). To reduce interpolation uncertainty, we adopted a suite of gridded precipitation datasets produced by Gao et al. [37,38] for plotting the distribution of precipitation. This suite of gridded data is generated by applying the thin plate smoothing splines method and the angular distance weighting method to precipitation data from rain gauge stations and is the most accurate dataset of gridded near-surface meteorological fields [39,40]. Since this data is available from 1961 to 2022 and the number of rain gauge stations has been stable since 1959, the study period focus on the Meiyu season over the MLYR, from 1 June to 31 July, spanning the years 1961–2022.

2.3. EPE Identification

Taking into account the variability in the spatial distribution of precipitation, we chose a percentile-based value approach to define the threshold for EPEs [41]. For each station, rainy days with daily precipitation above 1.0 mm d−1 were selected and sorted in ascending order. The extreme precipitation threshold value was defined as the 95th percentile of daily precipitation, sorted in ascending order. If the number of stations with precipitation above their respective threshold values was at least 5% of all stations over MLYR (i.e., 251) on the same day, an EPE was identified [42]. Following these procedures, we identified 440 EPEs over MLYR during the 62 Meiyu seasons.

2.4. NCCV Identification

NCCVs were identified using an automatic method according to their conventional definition [43]. First, closed contours of 500 hPa geopotential height were searched within 35° N–60° N, 115° E–145° E over Northeast China. Second, we calculated the Laplacian of the temperature to identify whether a cold trough or core was associated with the closed contour over Northeast China. Third, if a closed contour associated with a cold trough or core lasted at least three days, it was regarded as an NCCV event.

2.5. Rossby Wave Activity Flux

We used the wave activity flux defined by Takaya and Nakamura [44] to analyze the lateral Rossby wave propagation. The vertical component is most pronounced in the lower troposphere, and its magnitude is generally two orders smaller than that of the horizontal components. Since we focused on the Rossby wave propagation at the upper troposphere, we used the horizontal Rossby wave activity flux, which can be expressed as follows:
W = p cos ϕ 2 | U | U a 2 cos 2 ϕ ψ λ 2 ψ 2 ψ λ 2 + V a 2 cos ϕ ψ λ ψ ϕ ψ 2 ψ λ ϕ U a 2 cos ϕ ψ λ ψ ϕ ψ 2 ψ λ ϕ + V a 2 ψ ϕ 2 ψ 2 ψ ϕ 2
where U = ( U ,   V ) represents the climatological mean flow velocity, which is taken to be the long-term daily climatology over the full 1961–2022 period; ψ is the quasi-geostrophic stream function perturbations relative to the climatological mean; a is the Earth’s radius; ϕ and λ are and the latitude and longitude; p is the air pressure normalized by 1000 hPa. The derivatives are approximated using central difference.
In addition, we calculated all the anomalies by subtracting the climatological mean from the value for each grid point and then composited these anomalies by averaging the events. Given that most variables, except for precipitation, follow a normal distribution, we utilized the Student’s t-test method to evaluate the statistical significance of their composite values. As for composite precipitation in Figure 2, we adopted the bootstrap method. This approach involved applying the Matlab function bootci to the 157 and 228 samples of each grid for NCCV and ordinary EPEs, respectively [28,45].

3. Results

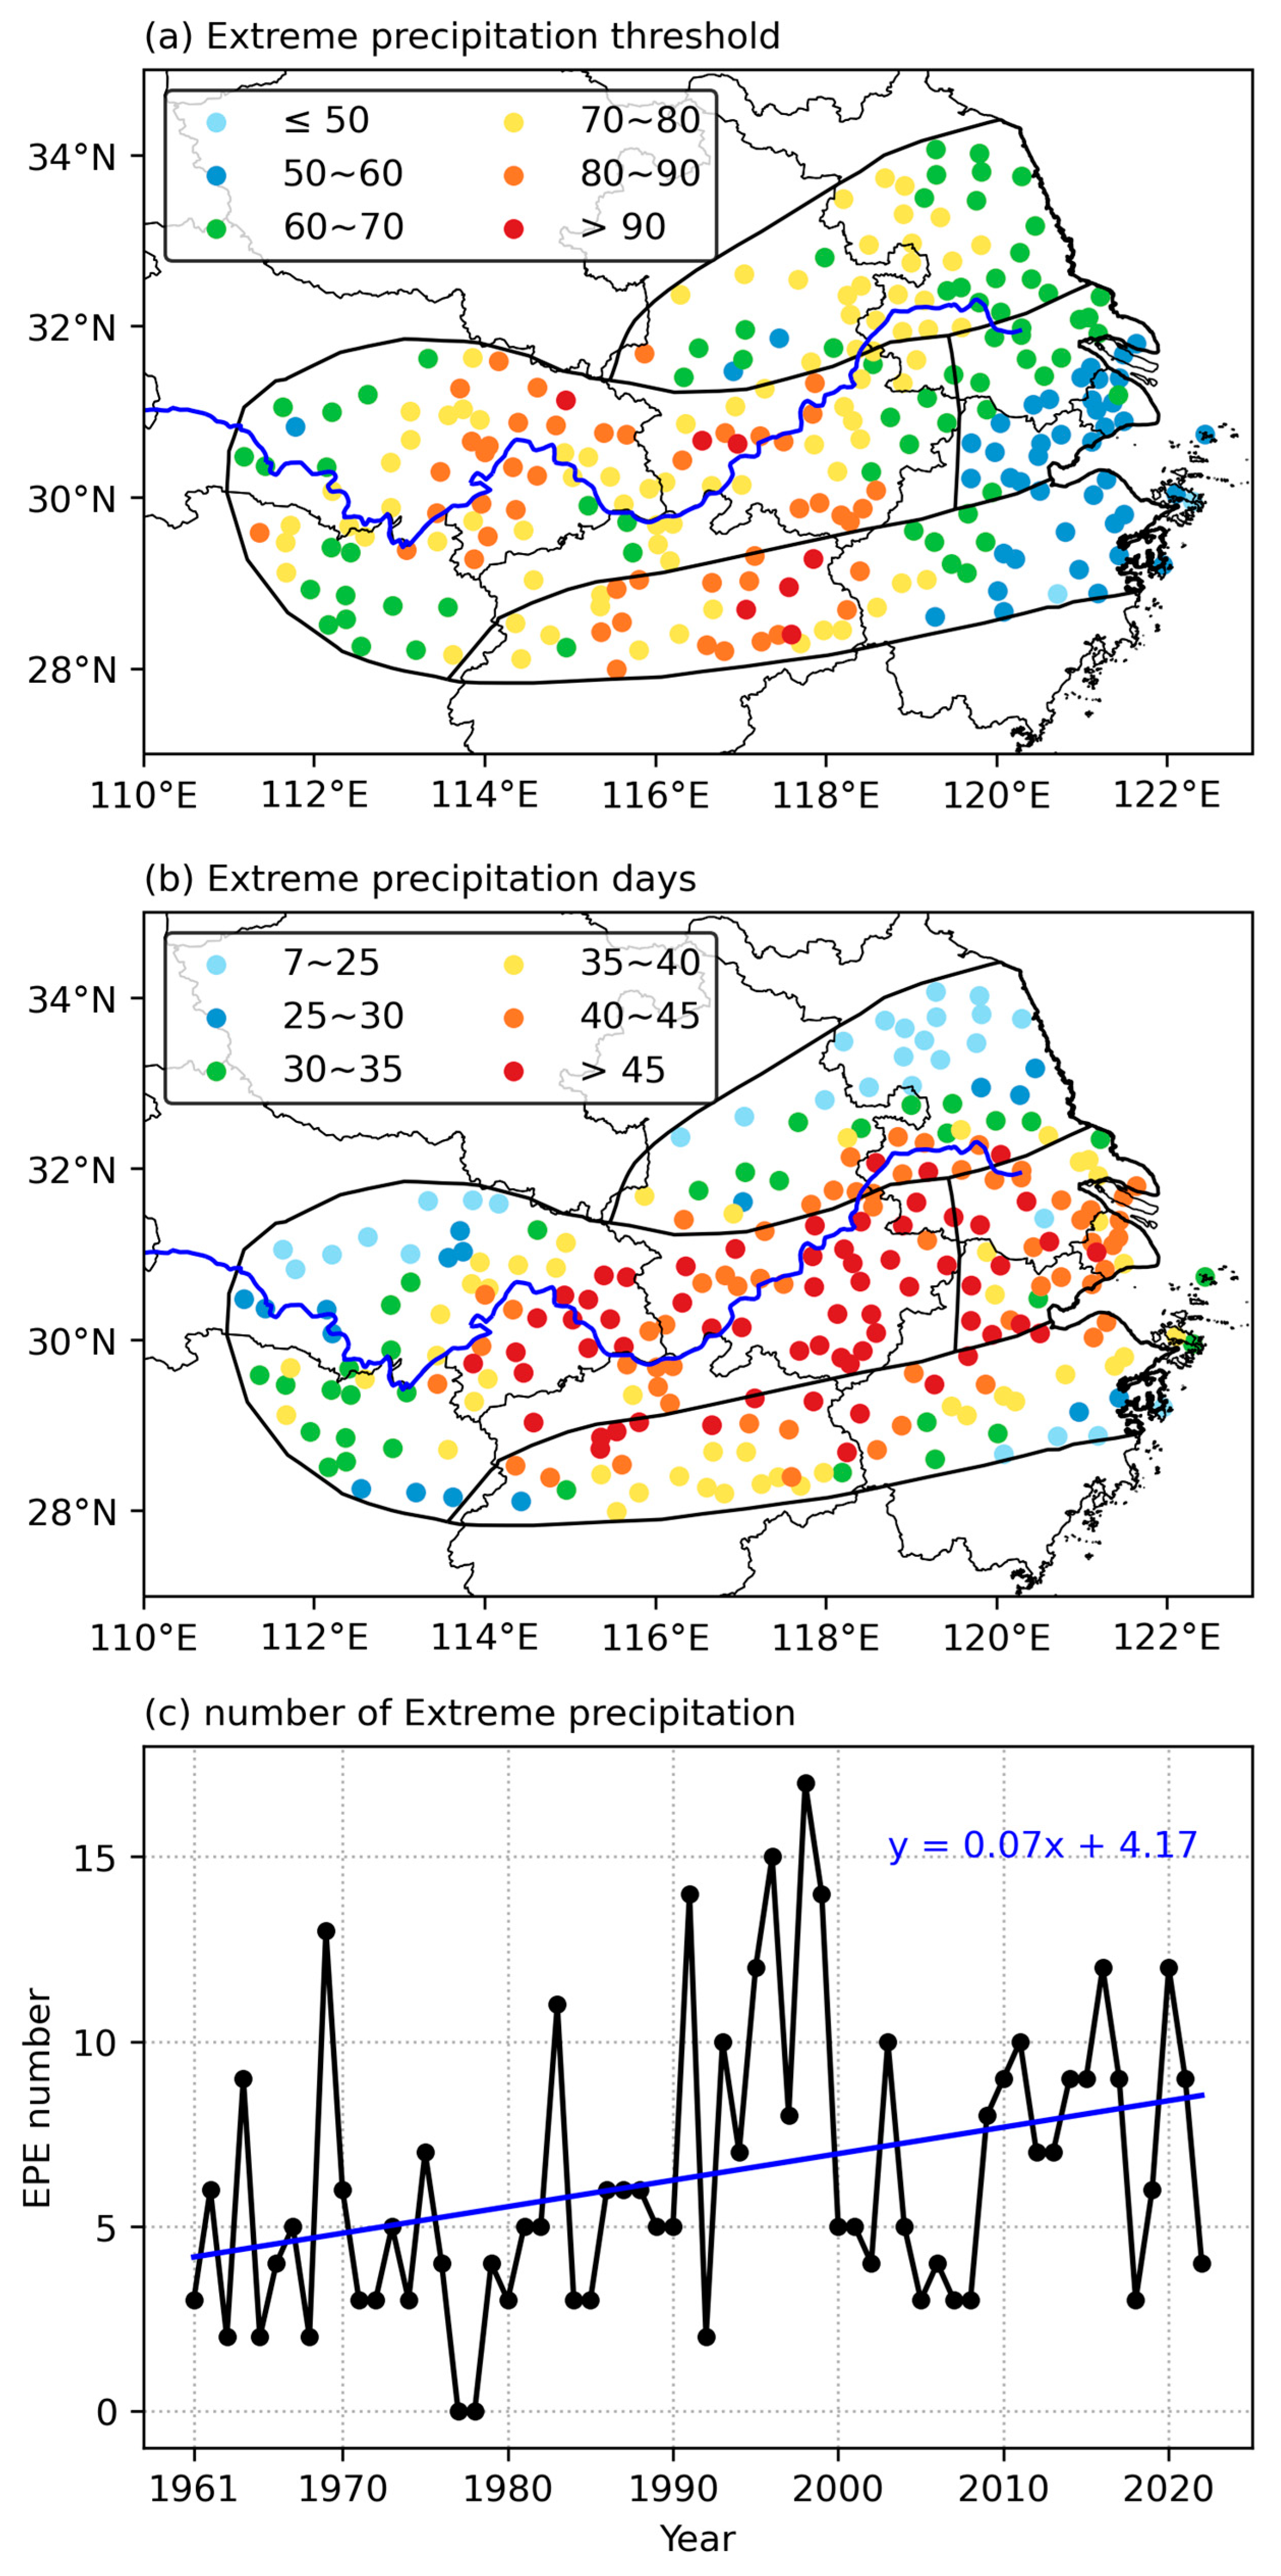
3.1. Distribution of Extreme Precipitation

Figure 1 displays the spatial distribution of extreme precipitation threshold values and occurrence frequencies for the 251 rain gauge stations in the MLYR. Extreme precipitation threshold values are higher in the central MLYR and apparently decrease toward the eastern China coast (Figure 1a). In particular, extreme precipitation thresholds above 80 mm d−1 are located alongside the Yangtze River. Among 251 stations, 84 (33.5%) with extreme precipitation threshold values ranging between 70–80 mm·d−1 distributed throughout most of this area, with the exception of the southeast and northwest parts. Another 71 stations (28.3%), with thresholds between 60–70 mm d−1, are dispersed in the eastern and western sections of this region. Thresholds below 60 mm·d−1 occur at 45 stations (17.9%), mainly situated in coastal areas of eastern China.
Unlike the threshold value, the frequency of extreme precipitation is not only higher in the middle reach of the Yangtze River but also in the coast region of eastern China (Figure 1b). The frequency conspicuously declines both northward and westward, suggesting that EPEs are indeed concurrent with Meiyu rainfall in the MLYR during June and July. As can be seen, 209 (83%) stations with frequency above 30 days concentrate around the Yangtze River, particularly to its south. The frequency of extreme precipitation is relatively higher in the southern section than in the northern section, which is characterized by a prevalence of stations with numbers below 30. This result demonstrates the northward progression of the East Asian monsoon and its significant influence on EPEs. The number of extreme precipitation days indeed exhibits a significant upward trend (Figure 1c). However, the extreme precipitation is most prevalent in the 1990s.
To investigate the influence of NCCV on EPEs over MLYR, we classify EPEs into two groups: EPEs that occur concurrently with NCCV (NCCV-EPEs) and ordinary EPEs that occur without the presence of NCCV. There are 157 and 228 EPEs for these two clusters. Figure 2 displays composite precipitation anomalies of two EPEs groups stratified by NCCV and their differences. The precipitation of the NCCV-EPE group exhibits more intensity and broader coverage in comparison with the ordinary EPE cluster. Considering NCCV-EPEs, significant positive anomaly precipitation is not only dominant in the MLYR, but also in the upper reach of the Yangtze River (Figure 2a). The maximum reaches 29.3 mm d−1 in the middle reaches of the Yangtze River. In contrast, the positive precipitation anomaly is generally confined to the MLYR and is significant in its southern and western parts. Meanwhile, the amplitude is much smaller, with a maximum of 25.2 mm d−1. The difference of precipitation between these two categories shows increased precipitation over Jiangsu–Anhui Province in East China, Hubei–Hunan Province in Middle China, as well as Chongqing and Guizhou Provinces in Southwest China for NCCV-EPEs (Figure 2c). However, decreased precipitation is seen over most of the rest of China, particularly southern China.

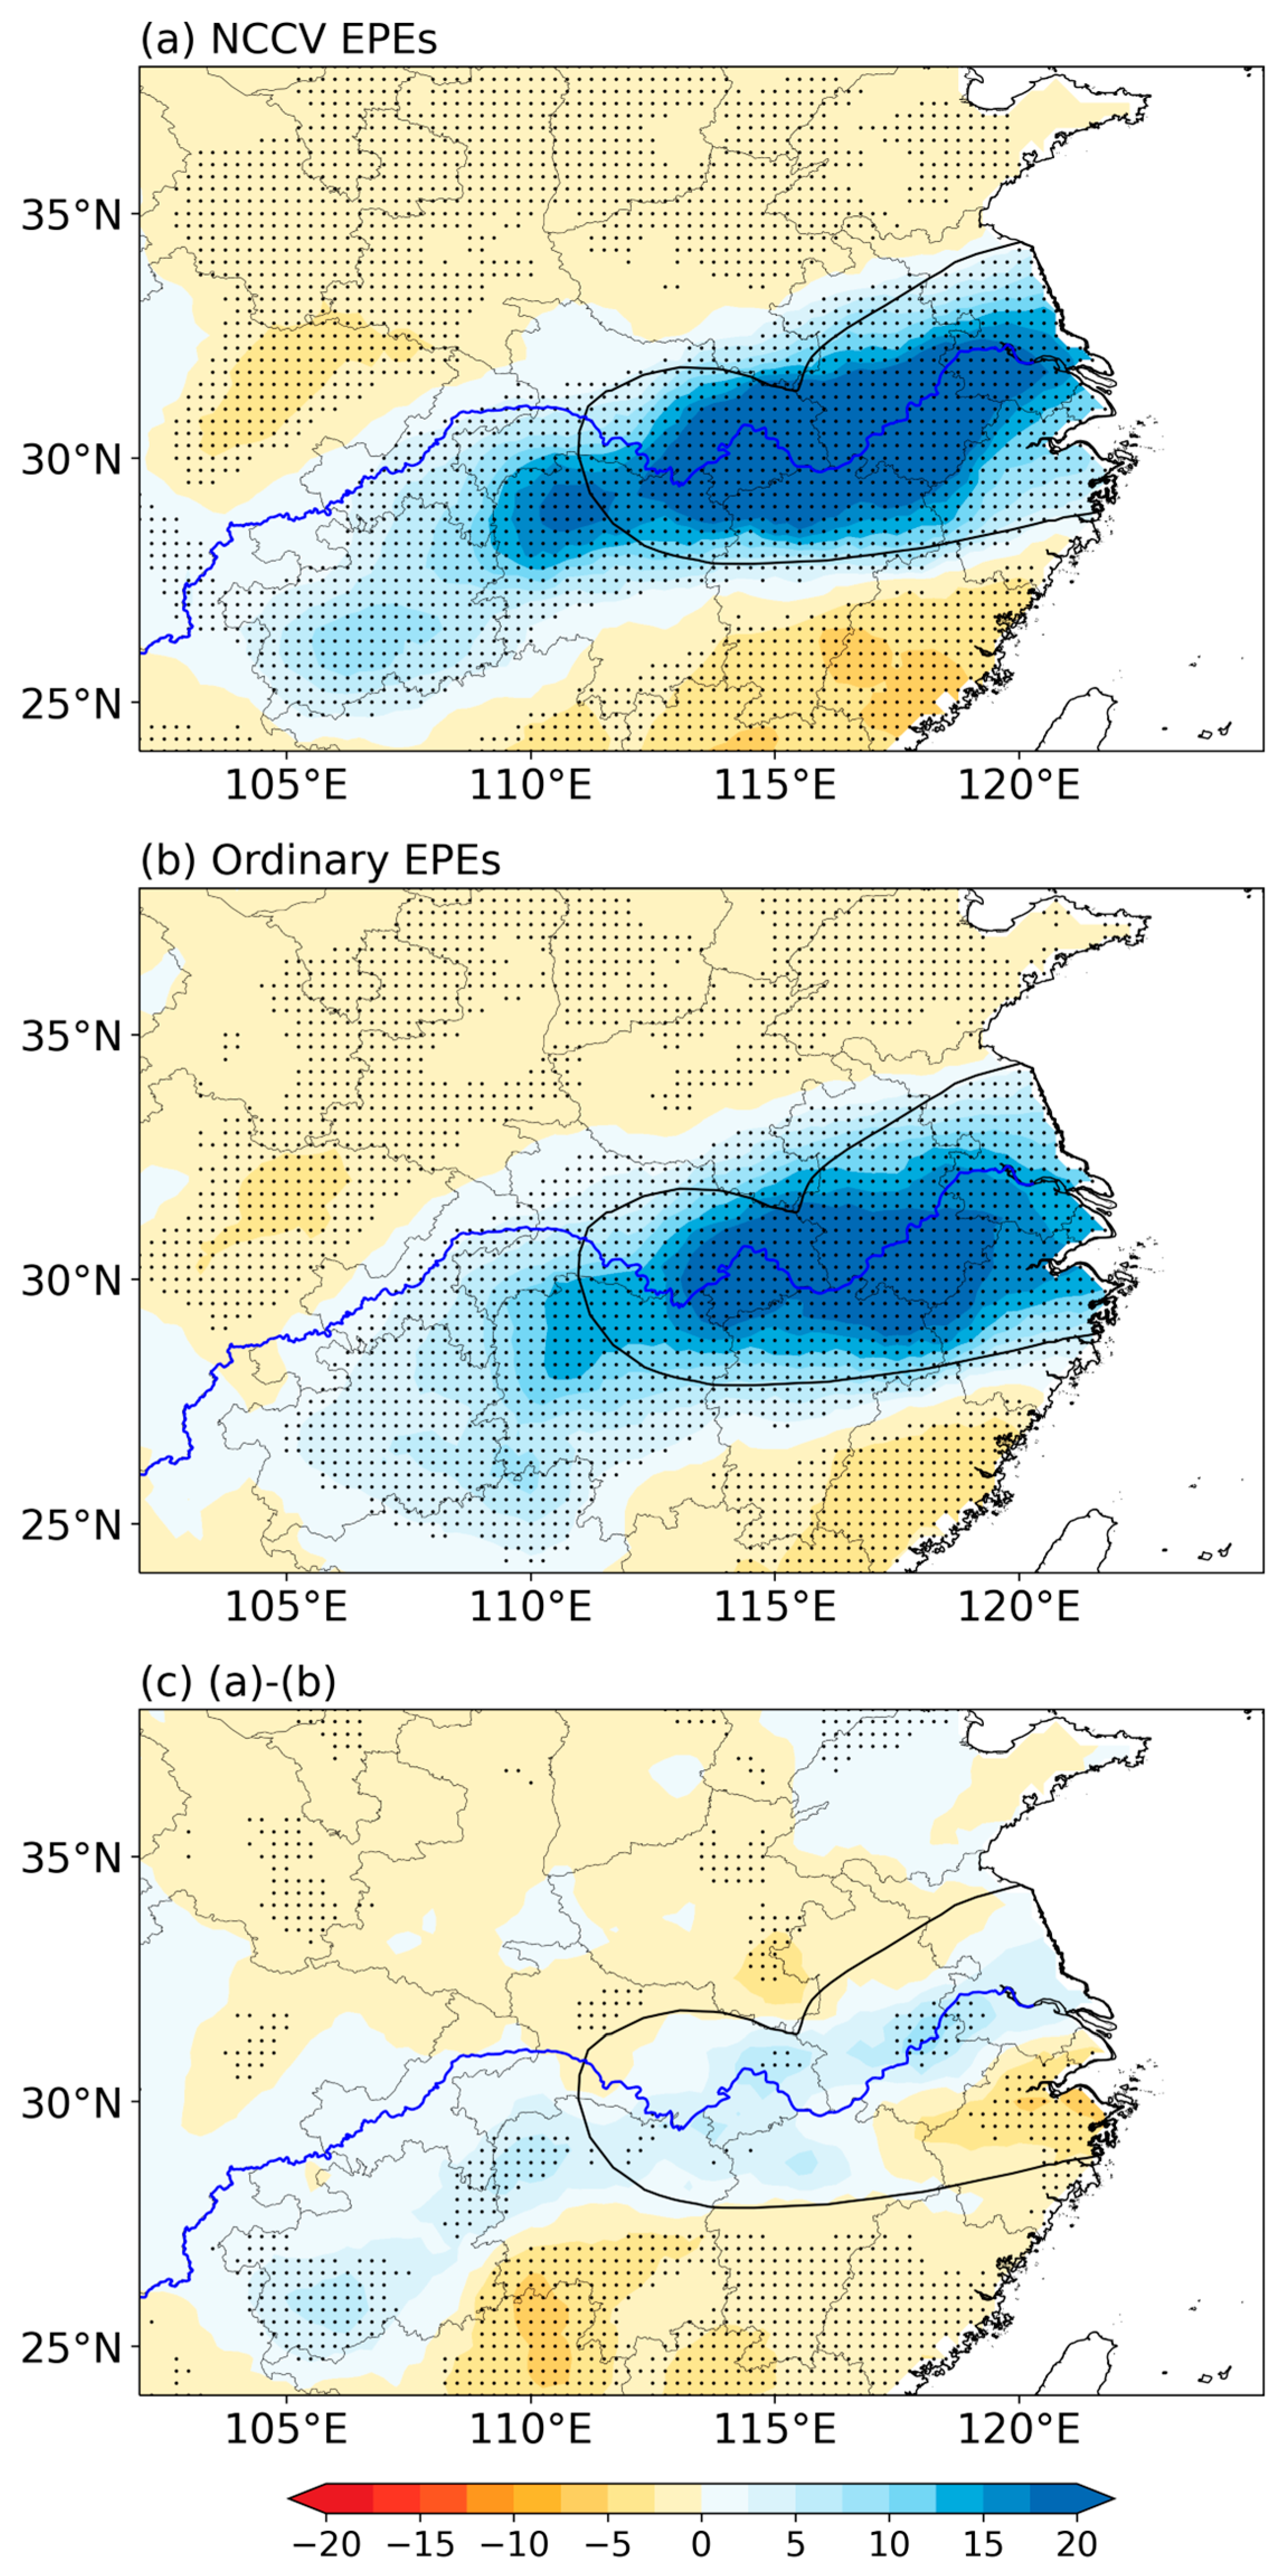
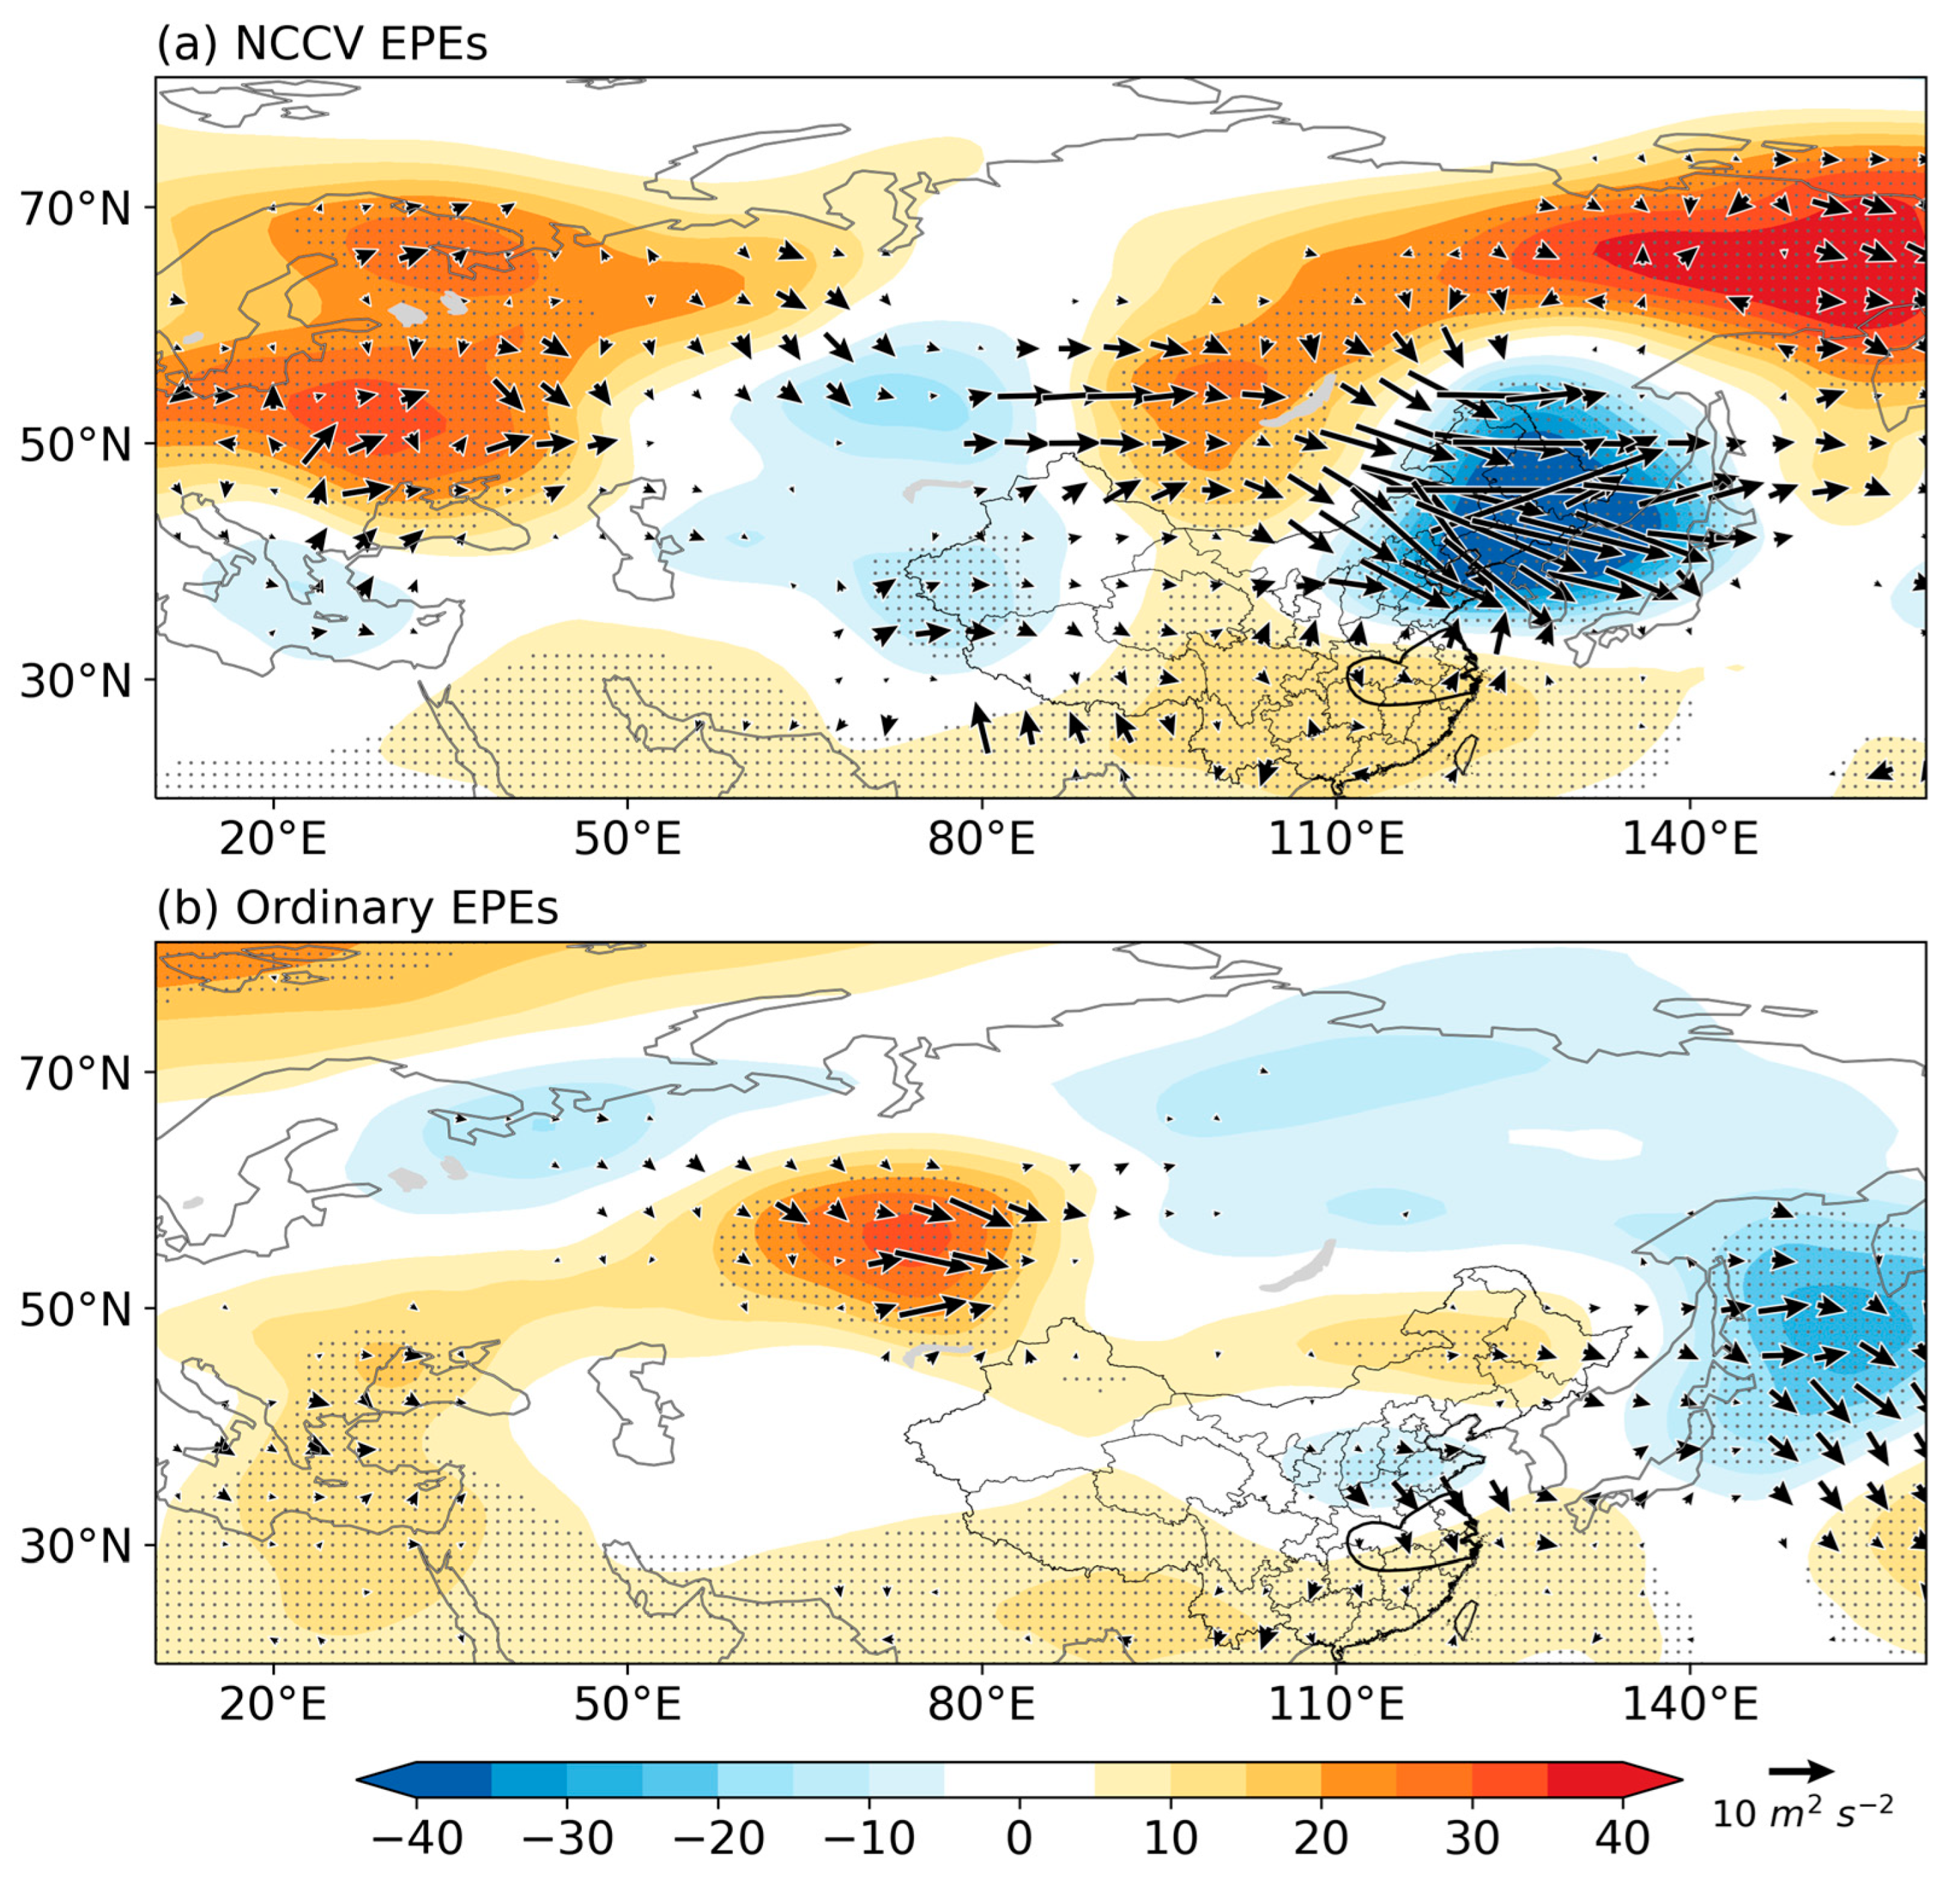
3.2. Ciruclation Configuration

Figure 3 shows composite 500 hPa geopotential height and corresponding anomalies for the two EPE groups. These two EPE groups are associated with substantially different mid-tropospheric circulation, in which their anomaly patterns are anti-symmetric with each other in the mid–high latitude. The NCCV-EPEs are characterized by a wavier flow featuring ridge–trough–ridge from eastern Europe via Lake Balkhash to northeastern Asia, indicating a more pronounced Rossby wave propagation (Figure 3a). Notably, the westerlies are split over Northeast China with a deepened trough extending from eastern Northeast China to the MLYR. This favors extensive cold air intrusion into eastern China. The closed contour is not shown in Northeast China because it was considerably filtered out during the composite process. The western Pacific tropical heigh is amplified and extended westward with its western edge near the southeast coast of China, which helps the northward transport of warm and moist air to the MLYR. The anomaly field features zonal and meridional “+ − +” wave trains over the high latitudes and East Asia, respectively. Positive anomalies are observed over eastern Europe, northeastern Asia, and the South China Sea, while negative anomalies are witnessed over Balkhash Lake and Northeast China.
In contrast, the ordinary EPE group is associated with more zonal westerlies and depressed troughs and ridges in the mid–high latitude (Figure 3b). A shallow trough is confined to the MLYR. Although the western Pacific subtropical high is also amplified, its westward extension is weaker compared to that of the NCCV-EPE cluster. The corresponding anomaly pattern is anti-symmetric to that of the NCCV-EPE cluster in the mid–high latitude. Therefore, the difference in the mid-tropospheric circulation highlights the configuration pattern of the NCCV-EPE cluster, which is characterized by zonal and meridional “+ − +” wave trains over the high latitudes and East Asia, intersecting at northeastern Asia (Figure 3c). In comparison with the ordinary EPE, the western Pacific subtropical high is relatively stronger in southern China for the NCCV-EPE cluster, resulting in less precipitation.
To investigate the precursors that distinguish the resonant circulation of NCCV EPEs from the ordinary EPEs, Figure 4 displays composite 300-hPa geopotential height anomaly and Rossby wave activity flux for the two EPE groups. We chose the upper tropospheric level instead of the mid-tropospheric level, considering that Rossby wave activity is more distinct at 300 hPa. The composite process across large numbers of 157 and 228 events acts as a pronounced filter on the stream function, which can remove the transient eddies with a timescale of 2~6 days. Therefore, the Rossby wave activity flux displayed here is mainly associated with quasi-stationary anomalies relative to the climatological mean flow. Indeed, Rossby wave energy is more apparent for the NCCV-EPEs. As can be seen from Figure 4a, Rossby wave packets emit eastward from the positive anomaly extending from the White Sea to the Ural Mountains via Lakes Balkhash and Baikal to the negative anomaly over Northeast China. Meanwhile, a weak Rossby wave flux is directed northward from the MLYR to a negative anomaly over Northeast China. In contrast, although an eastward emission of Rossby wave energy is seen from the negative anomaly over northeastern Europe, the flux does not propagate as far as Lake Baikal for the ordinary EPEs (Figure 4b). In addition, Rossby wave energy is directed southward from the negative height anomaly over northern China toward the MLYR. The findings suggest the Meiyu trough is likely to be influenced by regional forcing, while the NCCV is linked to remote forcings, particularly the positive anomaly or ridge over the White Sea. This agrees well with previous findings that more powerful westerly disturbances, such as the NCCV, are primarily due to the injection of upstream Rossby wave energy [46].

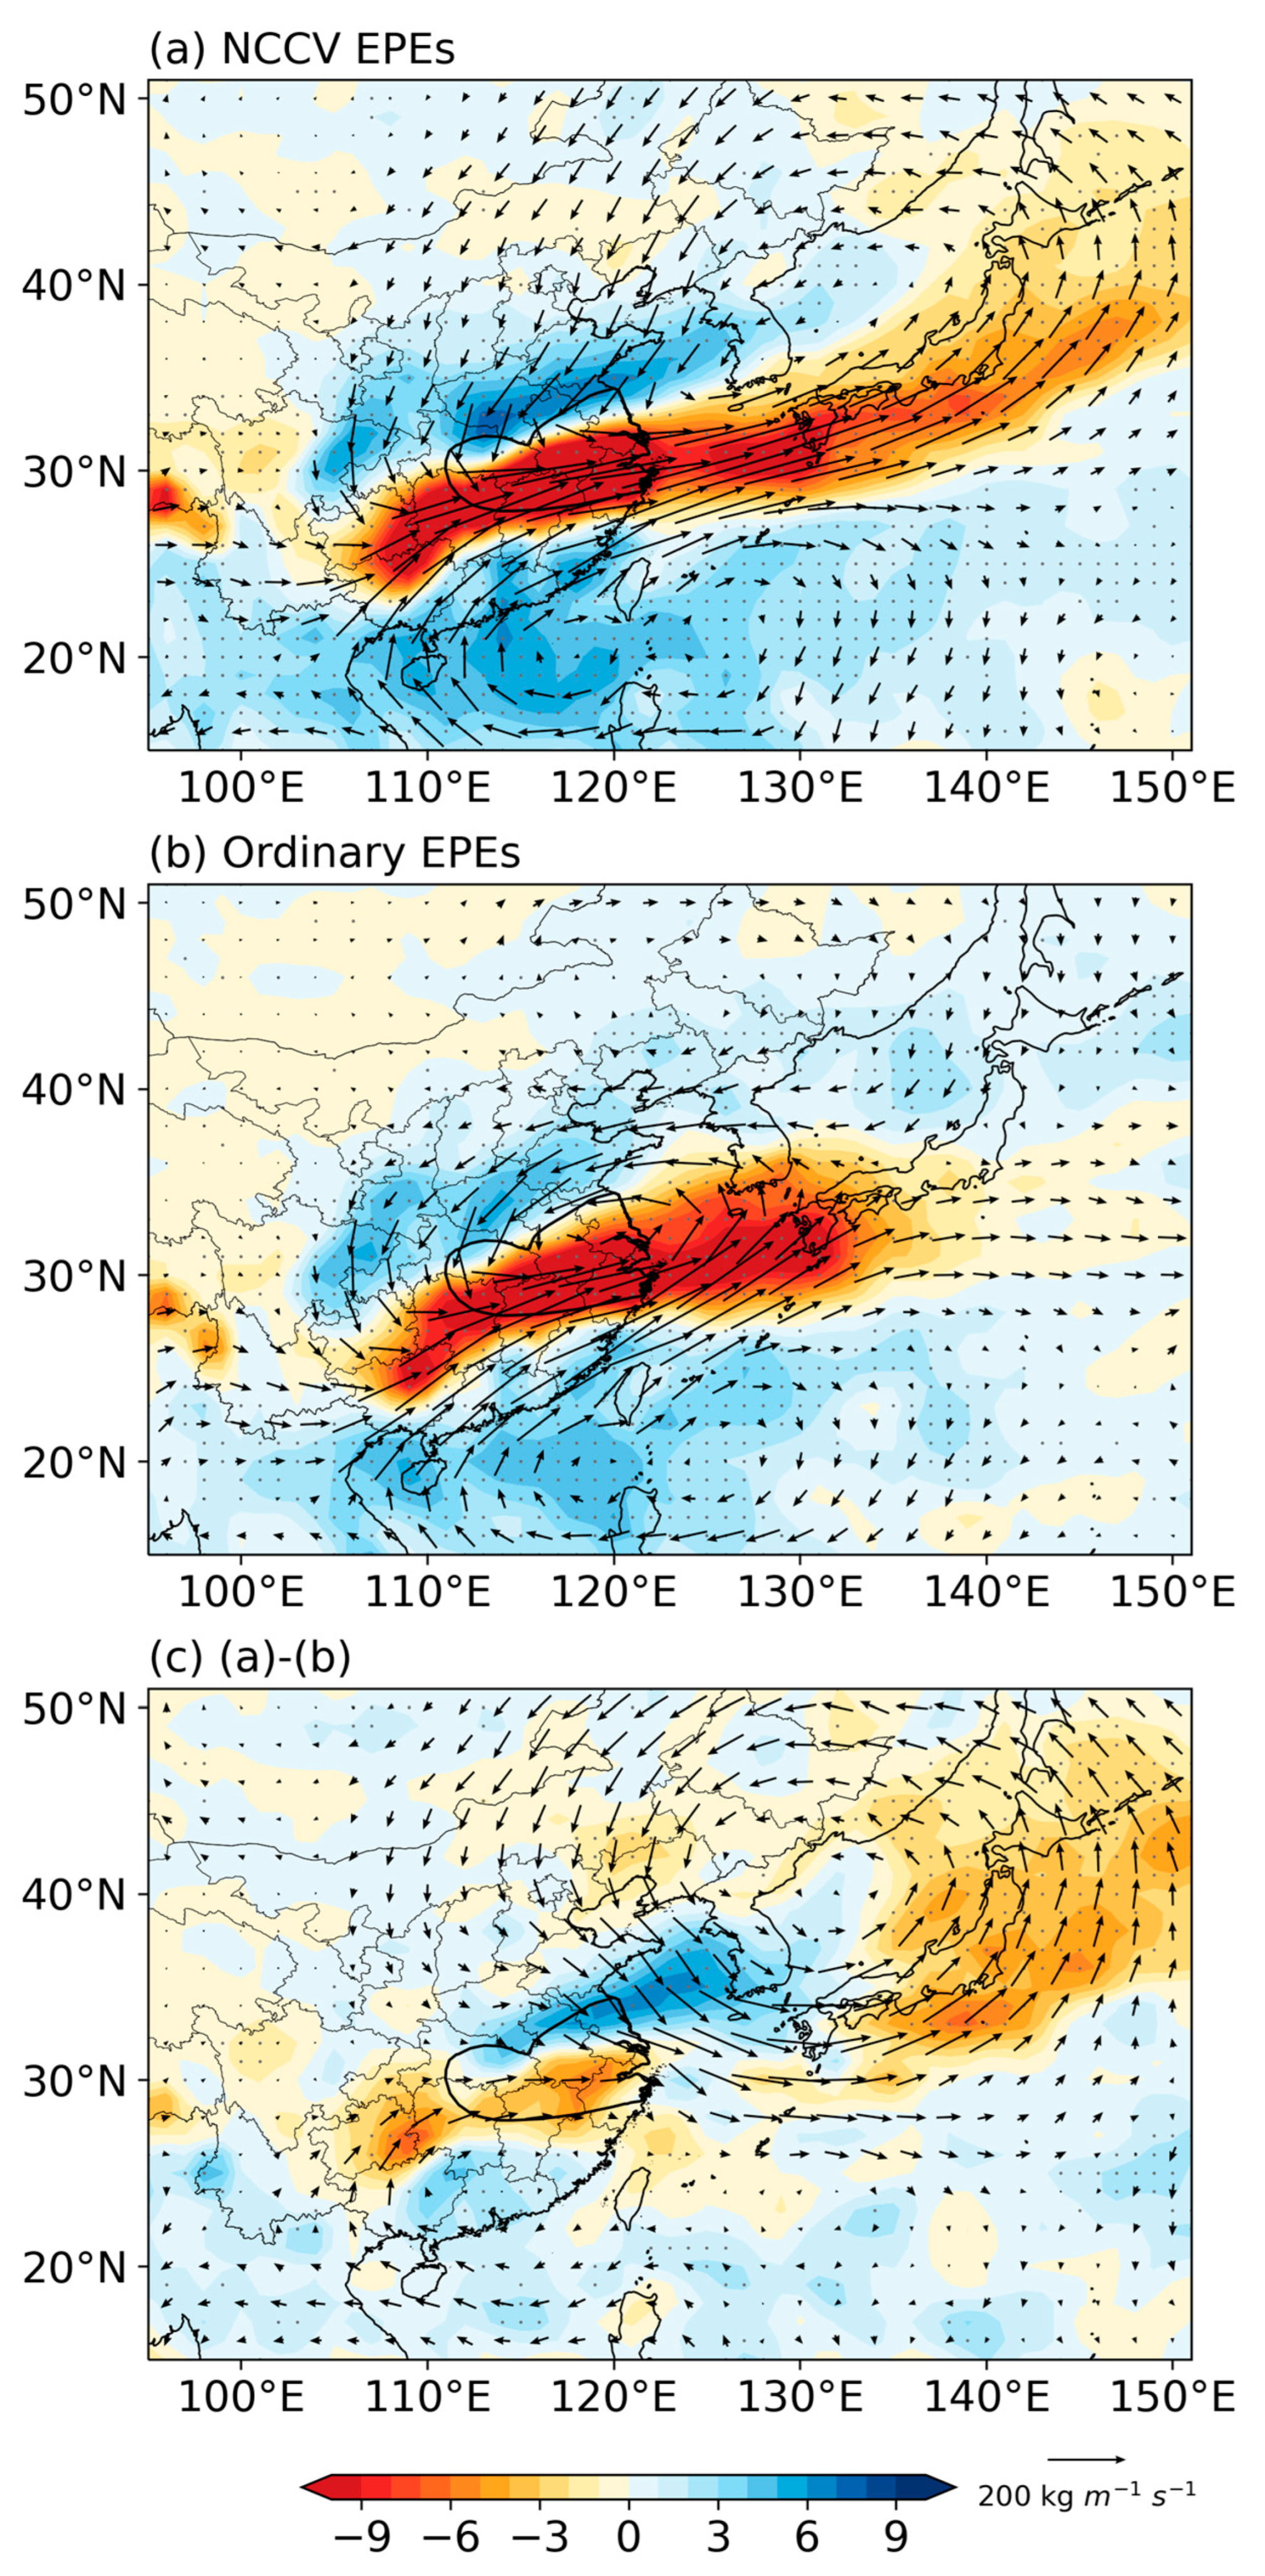
3.3. Differences in Factors Governing Precipitation

The preceding sections have shown the differences in precipitation distribution and circulation configurations. This section tries to delve into three basic physical factors affecting precipitation: water vapor, upward motion, and stability. Figure 5 presents anomalies in composite vertically integrated water vapor flux and its divergence for the two EPE groups. These EPEs feature an increased southwesterly water vapor flux and a significant convergence of moist flux over the MLYR.
Considering the NCCV-EPEs (Figure 5a), eastern Asia is dominated by a pair of cyclonic and anticyclonic anomalies of water vapor flux straddling the MLYR. The cyclonic anomaly related to the NCCV extends from southwestern China to the Sea of Japan. To its south, the anticyclonic anomaly associated with the westward extension of the subtropical high dominates the South China Sea. Such a pair of anomalies renders an extensive warm and moist monsoon conveyor belt and pronounced convergence of moist flux from southwestern China via the MLYR to Japan. Therefore, an increased rainfall is observed not only in the MLYR but also in southwestern China. In contrast, the ordinary EPEs are characterized by a more localized cyclonic anomaly of water vapor flux with the eastward extension confined to the Yellow Sea and a more eastward-displaced anticyclonic anomaly of water vapor flux (Figure 5b). This configuration aligns with a weaker Meiyu trough and a subtropical high that is less extended westward. The difference between the two EPE groups underscores the more pronounced warm and moist monsoon conveyor belt and convergence of water vapor flux from southwest China to the MLYR (Figure 5c). There is an enhanced water vapor flux from the South China Sea to the MLYR, which converges with the southward water vapor flux associated with the NCCV. This southward water vapor flux possibly originated from the water vapor that’s lifted by the NCCV in its southeast from the warm and moist monsoon conveyor belt [47]. Consequently, increased rainfall is seen from southwestern China to the MLYR for the NCCV EPEs.
Given that water vapor is mainly concentrated in the lower troposphere, we selected a 700 hPa pressure level to examine vertical motion driving water vapor upwards. Figure 6 displays the composite 700 hPa vertical motion anomaly for the NCCV and ordinary EPEs. The distribution of vertical motion is in good agreement with that of the convergence anomaly of the vertically integrated water vapor flux, in which the upward (downward) motion corresponds to convergence (divergence). Considering the NCCV EPEs first (Figure 6a), the significantly enhanced upward motion, indicated by the negative anomaly, prevails from southwestern China to Japan and coincides with the regions with increased convergence of water vapor flux and precipitation (Figure 2a and Figure 5a). It can be inferred that enhanced convergences of water vapor and updraft contribute to increased precipitation in these areas.
Though the distribution of vertical motion associated with the ordinary EPEs resembles that of the NCCV EPEs, the intensity of the anomalies is less pronounced (Figure 6b,c). Under the influence of NCCV, there is a considerable increase in vertical velocity, especially in the areas with significant negative vertical velocity anomalies, including northern Guizhou–southern Chongqing Province, northern Hunan Province, southeastern Hubei Province, and southern Anhui Province. In addition, the intensified downward motion over northern China suggests the cold intrusion associated with the NCCV.

4. Conclusions and Discussion

This study investigated EPEs in the MLYR during the Meiyu seasons from 1961 to 2022, using rain gauge observations and the ERA5 reanalysis data. The EPEs were classified into two groups: NCCV EPEs, which coincided with the North China Cold Vortex (NCCV), and ordinary EPEs, which occurred in the absence of the NCCV. The NCCV EPEs are associated with a higher amount of precipitation in both the MLYR and southwestern China compared to the ordinary EPEs. Their differences in circulation configuration and three basic physical factors for precipitation: water vapor, ascending motion, and instability, were examined.
EPEs feature a trough poleward and the westward extension of the western Pacific subtropical high equatorward of the MLYR. However, the circulation patterns associated with NCCV EPEs and ordinary EPEs in the mid–high latitude are anti-symmetric with each other. The NCCV EPEs are characterized by a wavier flow with a pronounced ridge-trough-ridge wave train extending from eastern Europe via Lake Balkhash to northeastern Asia, associated with pronounced Rossby wave energy propagation. Due to the injection of Rossby wave energy, the trough deepens from eastern Northeast China to the MLYR and is confronted with a westward extension of the western Pacific tropical high. In contrast, the ordinary EPEs are characterized by more zonal westerlies and relatively weaker Rossby wave propagation to East Asia. The Meiyu trough is shallow and confined to the MLYR with less westward extension of the subtropical high.
The configuration of EPEs favors both cyclonic and anticyclonic water vapor flux over East Asia, resulting in an enhanced warm and moist monsoon conveyor belt, convergence of water vapor flux, and updraft over the MLYR. The NCCV induced an extensive and pronounced cyclonic water vapor flux from southwestern China to the Sea of Japan. This, along with a more westward extension of the western Pacific subtropic high, leads to the warm and moist monsoon conveyor belt and convergence of water vapor flux becoming more distinct from southwestern China via the MLYR to Japan. Given more westward extension and stronger warm and moist air, the atmosphere is associated with more apparent and extensive upward motion. Therefore, an increased rainfall is observed not only in the MLYR but also in southwestern China. In contrast, the ordinary EPEs are associated with more regional and weaker warm and moist monsoon conveyor belts due to shallow Meiyu troughs and less westward extending subtropical highs. Correspondingly, the warm air is located more eastward, the upward motion is weaker and concentrated in the MLYR, and, thus, there is less regional rainfall.
Prior studies have noted that a high frequency of NCCV occurrence can lead to elevated precipitation in the MLYR [34]. Although Xie and Bueh [28] pointed out that the increase in rainfall in the MLYR linked to NCCV generally occurs concurrently with the blocking ridge over northeastern Asia, the specific pathways of NCCV influence remain unclear. This study tries to explore the pathways by examining characteristics such as water vapor, upward motion, and stability through a comparison of EPEs with and without the presence of NCCVs. We suspect that the more wavering circulation associated with NCCVs weakens the westerlies, allowing for the westward extension of weather systems such as blocking ridge and subtropic high. As such, the presence of NCCVs possibly causes a more pronounced warm and moist monsoon conveyor belt for the EPEs. In future work, we will attempt to explore the physical linkage between NCCVs and EPEs in the MLYR.

Author Contributions

Conceptualization and formal analysis, H.C. and Z.X.; data curation and visualization, H.C., X.Z. (Xiaodong Zhao), B.W., J.Z. and X.Z. (Xiangxi Zou); writing—original draft preparation, H.C.; writing—review and editing, Z.X., X.H. and Z.G. All authors have read and agreed to the published version of the manuscript.

Funding

This research was funded by the National Key R&D Program of China (Grant Nos. 2023YFC3007700, 2023YFC3007702), the Hubei Key Laboratory of Intelligent Yangtze and Hydroelectric Science Open Research Project “Research on Monthly Precipitation Forecast Technology over Yangtze River Basin” (2422020009), and the Key Scientific and Technology Research and Development Program of Jilin Province (20180201035SF).

Institutional Review Board Statement

Not applicable.

Informed Consent Statement

Not applicable.

Data Availability Statement

The ERA5 dataset are available at https://cds.climate.copernicus.eu/cdsapp#!/dataset/reanalysis-era5-pressure-levels?tab=overview (accessed on 20 May 2024) and gridded precipitation data are available at https://ccrc.iap.ac.cn/resource/detail?id=228 (accessed on 1 May 2024).

Acknowledgments

The authors thank two anonymous reviewers for their constructive suggestions and comments.

Conflicts of Interest

The authors declare no conflicts of interest. This paper was funded by Hubei Key Laboratory of Intelligent Yangtze and Hydroelectric Science, China Yangtze Power Co., Ltd. The company had no roles in the design of the study; in the collection, analysis, or interpretation of data; in the writing of the manuscript, or in the decision to publish the articles. The paper reflects the views of the scientists and not the company.

References

  1. Gu, X.; Ye, L.; Xin, Q.; Zhang, C.; Zeng, F.; Nerantzaki, S.; Papalexiou, S. Extreme precipitation in China: A review on statistical methods and applications. Adv. Water Resour. 2022, 163, 104144. [Google Scholar] [CrossRef]
  2. Jones, C.; Waliser, D.; Lau, K.M.; Stern, W. Global Occurrences of Extreme Precipitation and the Madden–Julian Oscillation: Observations and Predictability. J. Clim. 2004, 17, 4575–4589. [Google Scholar] [CrossRef]
  3. Liang, X. Extreme rainfall slows the global economy. Nature 2022, 601, 193–194. [Google Scholar] [CrossRef] [PubMed]
  4. He, B.; Huang, X.; Ma, M.; Chang, Q.; Tu, Y.; Li, Q.; Zhang, K.; Hong, Y. Analysis of flash flood disaster characteristics in China from 2011 to 2015. Nat. Hazards 2018, 90, 407–420. [Google Scholar] [CrossRef]
  5. Tao, M.; Yan, L.; Zheng, S.; Xu, J.; Chen, Y. Contrasting the Impacts of Intraseasonal Oscillations on Yangtze Precipitation during the Summer of 1998 and 2016. Atmosphere 2023, 14, 1695. [Google Scholar] [CrossRef]
  6. Ding, Y. Summer monsoon rainfalls in China. J. Meteor. Soc. Jpn. 1992, 70, 373–396. [Google Scholar] [CrossRef]
  7. Ding, Y.; Chan, J. The East Asian summer monsoon: An overview. Meteor. Atmos. Phys. 2005, 89, 117–142. [Google Scholar]
  8. Feng, L.; Liu, C.; Zhang, R.; Han, X.; Yu, B.; Gao, C. On the second-year warming in late 2019 over the tropical Pacific and its triggering mechanism attributed to Indian Ocean effects. Adv. Atmos. Sci. 2021, 38, 2153–2166. [Google Scholar] [CrossRef]
  9. Cui, C.; Dong, X.; Wang, B.; Yang, H. Phase two of the integrative monsoon frontal rainfall experiment (IMFRE-II) over the middle and lower reaches of the Yangtze River in 2020. Adv. Atmos. Sci. 2021, 38, 346–356. [Google Scholar] [CrossRef]
  10. Hu, Y.; Deng, Y.; Zhou, Z.; Cui, C.; Dong, X. A statistical and dynamical characterization of large-scale circulation patterns associated with summer extreme precipitation over the middle reaches of Yangtze river. Clim. Dyn. 2019, 52, 6213–6228. [Google Scholar] [CrossRef]
  11. Liu, B.; Yan, Y.; Zhu, C.; Ma, S.; Li, J. Record-breaking Meiyu rainfall around the Yangtze River in 2020 regulated by the subseasonal phase transition of the North Atlantic Oscillation. Geophys. Res. Lett. 2020, 47, e2020GL090342. [Google Scholar] [CrossRef]
  12. Ding, Y.; Liu, Y.; Hu, Z. The record-breaking mei-yu in 2020 and associated atmospheric circulation and tropical SST anomalies. Adv. Atmos. Sci. 2021, 38, 1980–1993. [Google Scholar] [CrossRef] [PubMed]
  13. Zhang, R.; Zhang, R.; Zuo, Z. Impact of Eurasian spring snow decrement on East Asian summer precipitation. J. Clim. 2017, 30, 3421–3437. [Google Scholar] [CrossRef]
  14. Liang, X.; Wang, W. Associations between China monsoon rainfall and tropospheric jets. Quart. J. Roy. Meteor. Soc. 1998, 124, 2597–2623. [Google Scholar] [CrossRef]
  15. Lin, Z.; Lu, R. Interannual meridional displacement of the East Asian upper-tropospheric jet stream in summer. Adv. Atmos. Sci. 2005, 22, 199–211. [Google Scholar]
  16. Huang, D.; Zhu, J.; Zhang, Y.; Huang, A. The different configurations of the East Asian polar front jet and subtropical jet and the associated rainfall anomalies over Eastern China in summer. J. Clim. 2014, 27, 8205–8220. [Google Scholar] [CrossRef]
  17. Zhang, P.; Yang, S.; Kousky, V. South Asian high and Asian-Pacific-American climate teleconnection. Adv. Atmos. Sci. 2005, 22, 915–923. [Google Scholar]
  18. Ning, L.; Liu, J.; Wang, B. How does the South Asian high influence extreme precipitation over eastern China? J. Geophys. Res. Atmos. 2017, 122, 4281–4298. [Google Scholar] [CrossRef]
  19. Li, J.; Wang, B. Origins of the decadal predictability of East Asian land summer monsoon rainfall. J. Clim. 2018, 31, 6229–6243. [Google Scholar] [CrossRef]
  20. Zhu, Z.; Zhou, Y.; Jiang, W.; Fu, S.; Hsu, P. Influence of compound zonal displacements of the South Asia high and the western Pacific subtropical high on Meiyu intraseasonal variation. Clim. Dyn. 2023, 61, 3309–3325. [Google Scholar] [CrossRef]
  21. Huang, G. An index measuring the interannual variation of the East Asian summer monsoon—The EAP index. Adv. Atmos. Sci. 2004, 21, 41–52. [Google Scholar] [CrossRef]
  22. Shi, N.; Bueh, C.; Ji, L.; Wang, P. The impact of mid-and high-latitude Rossby wave activities on the medium-range evolution of the EAP pattern during the pre-rainy period of South China. Meteorol. Res. 2009, 23, 300–314. [Google Scholar]
  23. Wang, L.; Wang, C.; Guo, D. Evolution mechanism of synoptic-scale EAP teleconnection pattern and its relationship to summer precipitation in China. Atmos. Res. 2018, 214, 150–162. [Google Scholar] [CrossRef]
  24. Tang, Y.; Huang, A.; Wu, P.; Huang, D.; Xue, D.; Wu, Y. Drivers of summer extreme precipitation events over East China. Geophys. Res. Lett. 2021, 48, e2021GL093670. [Google Scholar] [CrossRef]
  25. Takahashi, H.; Fujinami, H. Recent decadal enhancement of Meiyu–Baiu heavy rainfall over East Asia. Sci. Rep. 2021, 11, 13665. [Google Scholar] [CrossRef] [PubMed]
  26. Hu, Y.; Lin, Y.; Deng, Y.; Bao, J. Summer extreme rainfall over the middle and lower reaches of Yangtze River: Role of synoptic patterns in historical changes and future projections. J. Geophys. Res. Atmos. 2023, 128, e2023JD039608. [Google Scholar] [CrossRef]
  27. Hu, K.; Lu, R.; Wang, D. Cold Vortex over Northeast China and its climate effect. Sci. Atmos. Sin. 2011, 35, 179–191. [Google Scholar]
  28. Xie, Z.; Bueh, C. Diferent types of cold vortex circulations over Northeast China and their weather impacts. Mon. Wea Rev. 2015, 143, 845–863. [Google Scholar] [CrossRef]
  29. Chen, X.; Zhuge, X.; Zhang, X.; Wang, Y.; Xue, D. Objective identification and climatic characteristics of heavy-precipitation northeastern China cold vortexes. Adv. Atmos. Sci. 2023, 40, 305–316. [Google Scholar] [CrossRef]
  30. Pinault, J.-L. Resonant forcing by solar declination of Rossby waves at the tropopause and implications in extreme events, precipitation, and heat waves—Part 1: Theory. Atmosphere 2024, 15, 608. [Google Scholar] [CrossRef]
  31. Xie, Z.; Bueh, C. Low frequency characteristics of northeast China cold vortex and its background circulation pattern. Acta Meteorol. Sin. 2012, 70, 704–716. (In Chinese) [Google Scholar]
  32. Wu, X.; Meng, F.; Liu, P.; Zhou, J.; Liu, D.; Xie, K.; Zhu, Q.; Hu, J.; Sun, H.; Xing, F. Contribution of the northeast cold vortex index and multiscale synergistic indices to extreme precipitation over Northeast China. Earth Space Sci. 2021, 8, e2020EA001435. [Google Scholar] [CrossRef]
  33. Zhao, S.; Sun, J. Study on cut-off low-pressure systems with floods over Northeast Asia. Meteorol. Atmos. Phys. 2007, 96, 159–180. [Google Scholar] [CrossRef]
  34. He, J.; Wu, Z.; Jiang, Z.; Miao, C.; Han, G. “Climate effect” of the northeast cold vortex and its influences on Meiyu. Chin. Sci. Bull. 2006, 52, 671–679. [Google Scholar] [CrossRef]
  35. Zhao, J.; Chen, L.; Xiong, K. Climate characteristics and influential systems of Meiyu to the south of the Yangtze River based on the new monitoring rules. Acta Meteorol. Sin. 2018, 76, 680–698. [Google Scholar]
  36. Hersbach, H.; Bell, B.; Berrisford, P.; Hirahara, S.; Horányi, A.; Muñoz-Sabater, J.; Nicolas, J.; Peubey, C.; Radu, R.; Schepers, D. The ERA5 global reanalysis. Q. J. R. Meteorol. Soc. 2020, 146, 1999–2049. [Google Scholar] [CrossRef]
  37. Xu, Y.; Gao, X.; Shen, Y.; Xu, C.; Shi, Y.; Giorgi, F. A Daily Temperature Dataset over China and Its Application in Validating a RCM Simulation. Adv. Atmos. Sci. 2009, 26, 763–772. [Google Scholar] [CrossRef]
  38. Wu, J.; Gao, X.J. A gridded daily observation dataset over China region and comparison with the other datasets. Chin. J. Geophys. 2013, 56, 1102–1111. (In Chinese) [Google Scholar]
  39. Wang, D.; Wang, A. Applicability assessment of GPCC and CRU precipitation products in China during 1901 to 2013. Clim. Environ. Res. 2017, 22, 446–462. (In Chinese) [Google Scholar]
  40. Luo, Y.; Xu, C.; Chu, Z.; Sun, Q.; Chen, L. Application of CN05.1 meteorological data in watershed hydrological simulation: A case study in the upper reaches of Kaidu River basin. Clim. Chang. Res. 2020, 16, 287–295. (In Chinese) [Google Scholar]
  41. Lai, S.; Xie, Z.; Bueh, C.; Gong, Y. Fidelity of the APHRODITE dataset in representing extreme precipitation over Central Asia. Adv. Atmos. Sci. 2020, 37, 1405–1416. [Google Scholar] [CrossRef]
  42. Zhao, S.; Deng, Y.; Black, R.X. A dynamical and statistical characterization of U.S. extreme precipitation events and their associated large-scale meteorological patterns. J. Clim. 2017, 30, 1307–1326. [Google Scholar] [CrossRef]
  43. Sun, L.; Zheng, X.; Wang, Q. The climatological characteristics of northeast cold vortex in China. Q. J. Appl. Meteorol. 1994, 5, 297–303. (In Chinese) [Google Scholar]
  44. Takaya, K.; Nakamura, H. A Formulation of a Phase-Independent Wave-Activity Flux for Stationary and Migratory Quasigeostrophic Eddies on a Zonally Varying Basic Flow. J. Atmos. Sci. 2001, 58, 608–627. [Google Scholar] [CrossRef]
  45. Wilks, D. Statistical Methods in the Atmospheric Sciences; Academic Press: San Diego, CA, USA, 1995; p. 121. [Google Scholar]
  46. Xie, Z.; Bueh, C. Cold vortex events over Northeast China associated with the Yakutsk-Okhotsk blocking. Int. J. Climatol. 2017, 37, 381–398. [Google Scholar] [CrossRef]
  47. Hu, P.; Xie, Z.; Zhou, T.; Bueh, C. Analysis of water vapor transport and trigger mechanisms for severe rainstorms associated with a Northeast China cold vortex in 2022. Atmosphere 2023, 14, 1363. [Google Scholar] [CrossRef]
Figure 1. Spatial distribution of (a) the threshold values of extreme precipitation (units: mm d−1) corresponding to the 95th percentile of rainy days for each station; (b) the total numbers of extreme precipitation days (unit: d); and (c) the time series of the annual occurrence number of extreme precipitation days in the MLYR during Meiyu season from 1961 to 2022.
Atmosphere 15 00819 g001
Figure 2. Composite precipitation anomalies for (a) NCCV-EPE, (b) ordinary EPE groups, and (c) the difference between NCCV and ordinary EPE groups (units: mm d−1). The stippling indicates the composite anomalies are statistically significant at a 95% confidence level.
Atmosphere 15 00819 g002
Figure 3. Composite 500 hPa geopotential height (contour, units: gpm) and corresponding anomalies (shading) for (a) NCCV-EPE and (b) ordinary EPE groups, as well as (c) their difference. The stippling indicates the composite anomalies are statistically significant at a 95% confidence level.
Atmosphere 15 00819 g003
Figure 4. Composite 300 hPa geopotential height anomalies (shading; units: gpm) and wave activity fluxes (arrows; units: m2 s−2) for (a) the NCCV-EPEs and (b) ordinary EPEs. The stippling indicates the composite anomalies are statistically significant at a 95% confidence level.
Atmosphere 15 00819 g004
Figure 5. Composite anomalies of vertically integrated water vapor flux (arrows; kg s−1 m−1) and its divergence (color shading; 10−4 kg m−2 s−1) for (a) the NCCV-EPEs and (b) the ordinary EPEs as well as (c) the differences between them. Stippling indicates the composite anomalies of vertically integrated divergence of moisture flux are statistically significant at a 95% confidence level.
Atmosphere 15 00819 g005
Figure 6. Composite 700 hPa vertical velocity anomalies (unit: Pa s−1) for (a) NCCV EPEs and (b) ordinary EPEs, as well as (c) the difference between them. Stippling marks regions where the composite anomalies are statistically significant at a 95% confidence level.
Atmosphere 15 00819 g006
Disclaimer/Publisher’s Note: The statements, opinions and data contained in all publications are solely those of the individual author(s) and contributor(s) and not of MDPI and/or the editor(s). MDPI and/or the editor(s) disclaim responsibility for any injury to people or property resulting from any ideas, methods, instructions or products referred to in the content.

