Abstract
Childhood asthma is a major health issue in Australia, and traffic emissions play a causative role. Two urban planning policies that impact children’s exposure to traffic emissions are considered in terms of the potential health risks to children in a Melbourne suburb with high truck volumes and hospital attendances for childhood asthma. Firstly, the health impact assessment component of the state planning approval of a major road project, and secondly, local government placement of childcare centres and schools in relation to freight routes. Three sources of air quality monitoring data were examined: (i) a Victorian EPA reference site; (ii) a site with planning approval for development into a childcare centre; and (iii) five sites within the boundary of the West Gate Tunnel Project, an AUD 10 billion road and tunnel project. The Australian Urban Research Infrastructure Network data was utilised to assess distances of childcare centres and schools from major truck routes. A range of cconcentration–response functions for childhood asthma (0–18 years) from international systematic meta-analyses and a smaller Australian cross-sectional study were applied to comparative elevations in fine particulate matter (PM2.5) and nitrogen dioxide (NO2) concentrations between the EPA reference monitor (used for project risk assessment) and local roadside data. It was found that comparative elevations in NO2 concentrations were associated with the following risk increases: developing asthma 13%, active asthma 12%, and lifetime asthma 9%. Overall, 41% of childcare centres (n = 51) and 36% of schools (n = 22) were ≤150 m to a high-density truck route. Truck emissions likely make a substantial contribution to childhood asthma outcomes in the project area. This study exemplifies how current practices may not be commensurate with guiding policy objectives of harm minimisation and equitable protection.
1. Introduction
Asthma is the most common chronic disease among children [1] and is a major contributor to the global burden of disease [2]. Air pollution is a major risk factor for childhood asthma, with up to one-third of European cases attributable to traffic-related air pollution (TRAP) [3]. Two key pollutants are commonly used to assess TRAP in urban areas—fine particulate matter (PM2.5) and nitrogen dioxide (NO2)—with the latter being the more specific for TRAP [4]. Globally, NO2 has been estimated to account for more than 4 million cases of new paediatric asthma [5]. The primary driver of outdoor NO2 concentrations in Australian cities is vehicle exhaust pipe emissions [6]. Australia has one of the highest prevalence rates of asthma, and it is the leading cause of total disease burden in Australian children (5–14 years) [7]. Annual costs associated with total asthma burden are estimated to be AUD 27.9 billion [8].
The Ambient Air Quality National Environmental Protection Measures (NEPM AAQ) regulate air pollution at the federal level in Australia, and the policy goal is that people should receive equivalent protection from air pollution wherever they live. The NEPM AAQ methodology document acknowledges the high childhood asthma rates in Australia and recommends specific attention be placed on protecting children [9]. However, NEPM methods for setting pollutant thresholds rely on air pollution data supplied by a network of air quality monitors that are too sparse to accurately reflect population exposure [10]. The implementation of the agreed national standards is subject to local variations at state and local government levels, where some key decisions that impact children’s exposure to TRAP are made. Examples of these decisions include:
- The approval process for major road projects.
- The siting (proximity) of childcare centres and schools in relation to traffic routes.
Yarraville, an inner western suburb of Melbourne, provides a contemporary example of how these two policy decisions may be implicated in the local prevalence of childhood asthma. Yarraville forms part of the local government area (LGA) of the City of Maribyrnong and is located between the Port of Melbourne and shipping container yards. Heavy freight-related truck traffic travelling through the small suburban streets of Yarraville has led to community concerns about childhood asthma [11], which are compounded by hospital data revealing that the LGA has the highest respiratory-related admissions for children aged 3–19 years in the state [12].
The Westgate Road Tunnel project, a major road project transecting this LGA, was proposed in 2016. The Environmental Effects Assessment process undertaken in 2017 involved the establishment of five air quality monitoring stations within the project vicinity; however, the Health Impact Assessment (HIA) was undertaken using air quality data from the previously established EPA reference monitor located several kilometres from the project area. The primary health endpoints used were all-cause mortality in the population aged ≥ 30 years for long-term exposure and cardiorespiratory-related hospital admissions in the population aged ≥ 65 years for short-term exposure. The HIA formed the conclusion that the health of the local community was consistent with or better than the Victorian population and that air quality in the area did not present any health concern for the community [13]. However, there was no quantitative assessment of childhood asthma risk, nor did the HIA consider local air quality data. The HIA methods and conclusions offer an insight into current practices used in other major road projects and developments across Australia [14]. With an anticipated 51% surge in the population of children aged 0–4 years expected over the next 15 years [15], a marked increase in the construction of childcare centres is likely. State planning schemes and their application by local councils control the siting of ‘sensitive’ facilities such as childcare centres and schools. These decisions prioritise residential concerns and amenities, resulting in the placement of these facilities on or near major roads due to ease of access [16].
This study aims to provide an interpretation of potential asthma risks to children in this area that is counterfactual to the Westgate Tunnel Project HIA. The study does not constitute a comprehensive epidemiological risk assessment; instead, it serves to illustrate the substantial variability inherent in HIAs contingent on data collection methodologies and selection of endpoints and dose–response functions. Furthermore, we seek to evaluate the alignment between existing practices regulating children’s exposure to TRAP and environmental policy objectives at federal and state levels.
2. Methods
A range of recently developed concentration–response functions (CRFs) that are specific to TRAP and childhood asthma risks are applied to data from both the local air quality monitoring network and the non-local EPA monitor. The data and associated risks are also evaluated against the recommended thresholds of the Australian standards and the World Health Organization (WHO). Additionally, the proximity of childcare centres and schools to high-traffic areas is assessed in relation to the Health Effects Institute literature review on asthma risks and traffic proximity.
2.1. Study Area
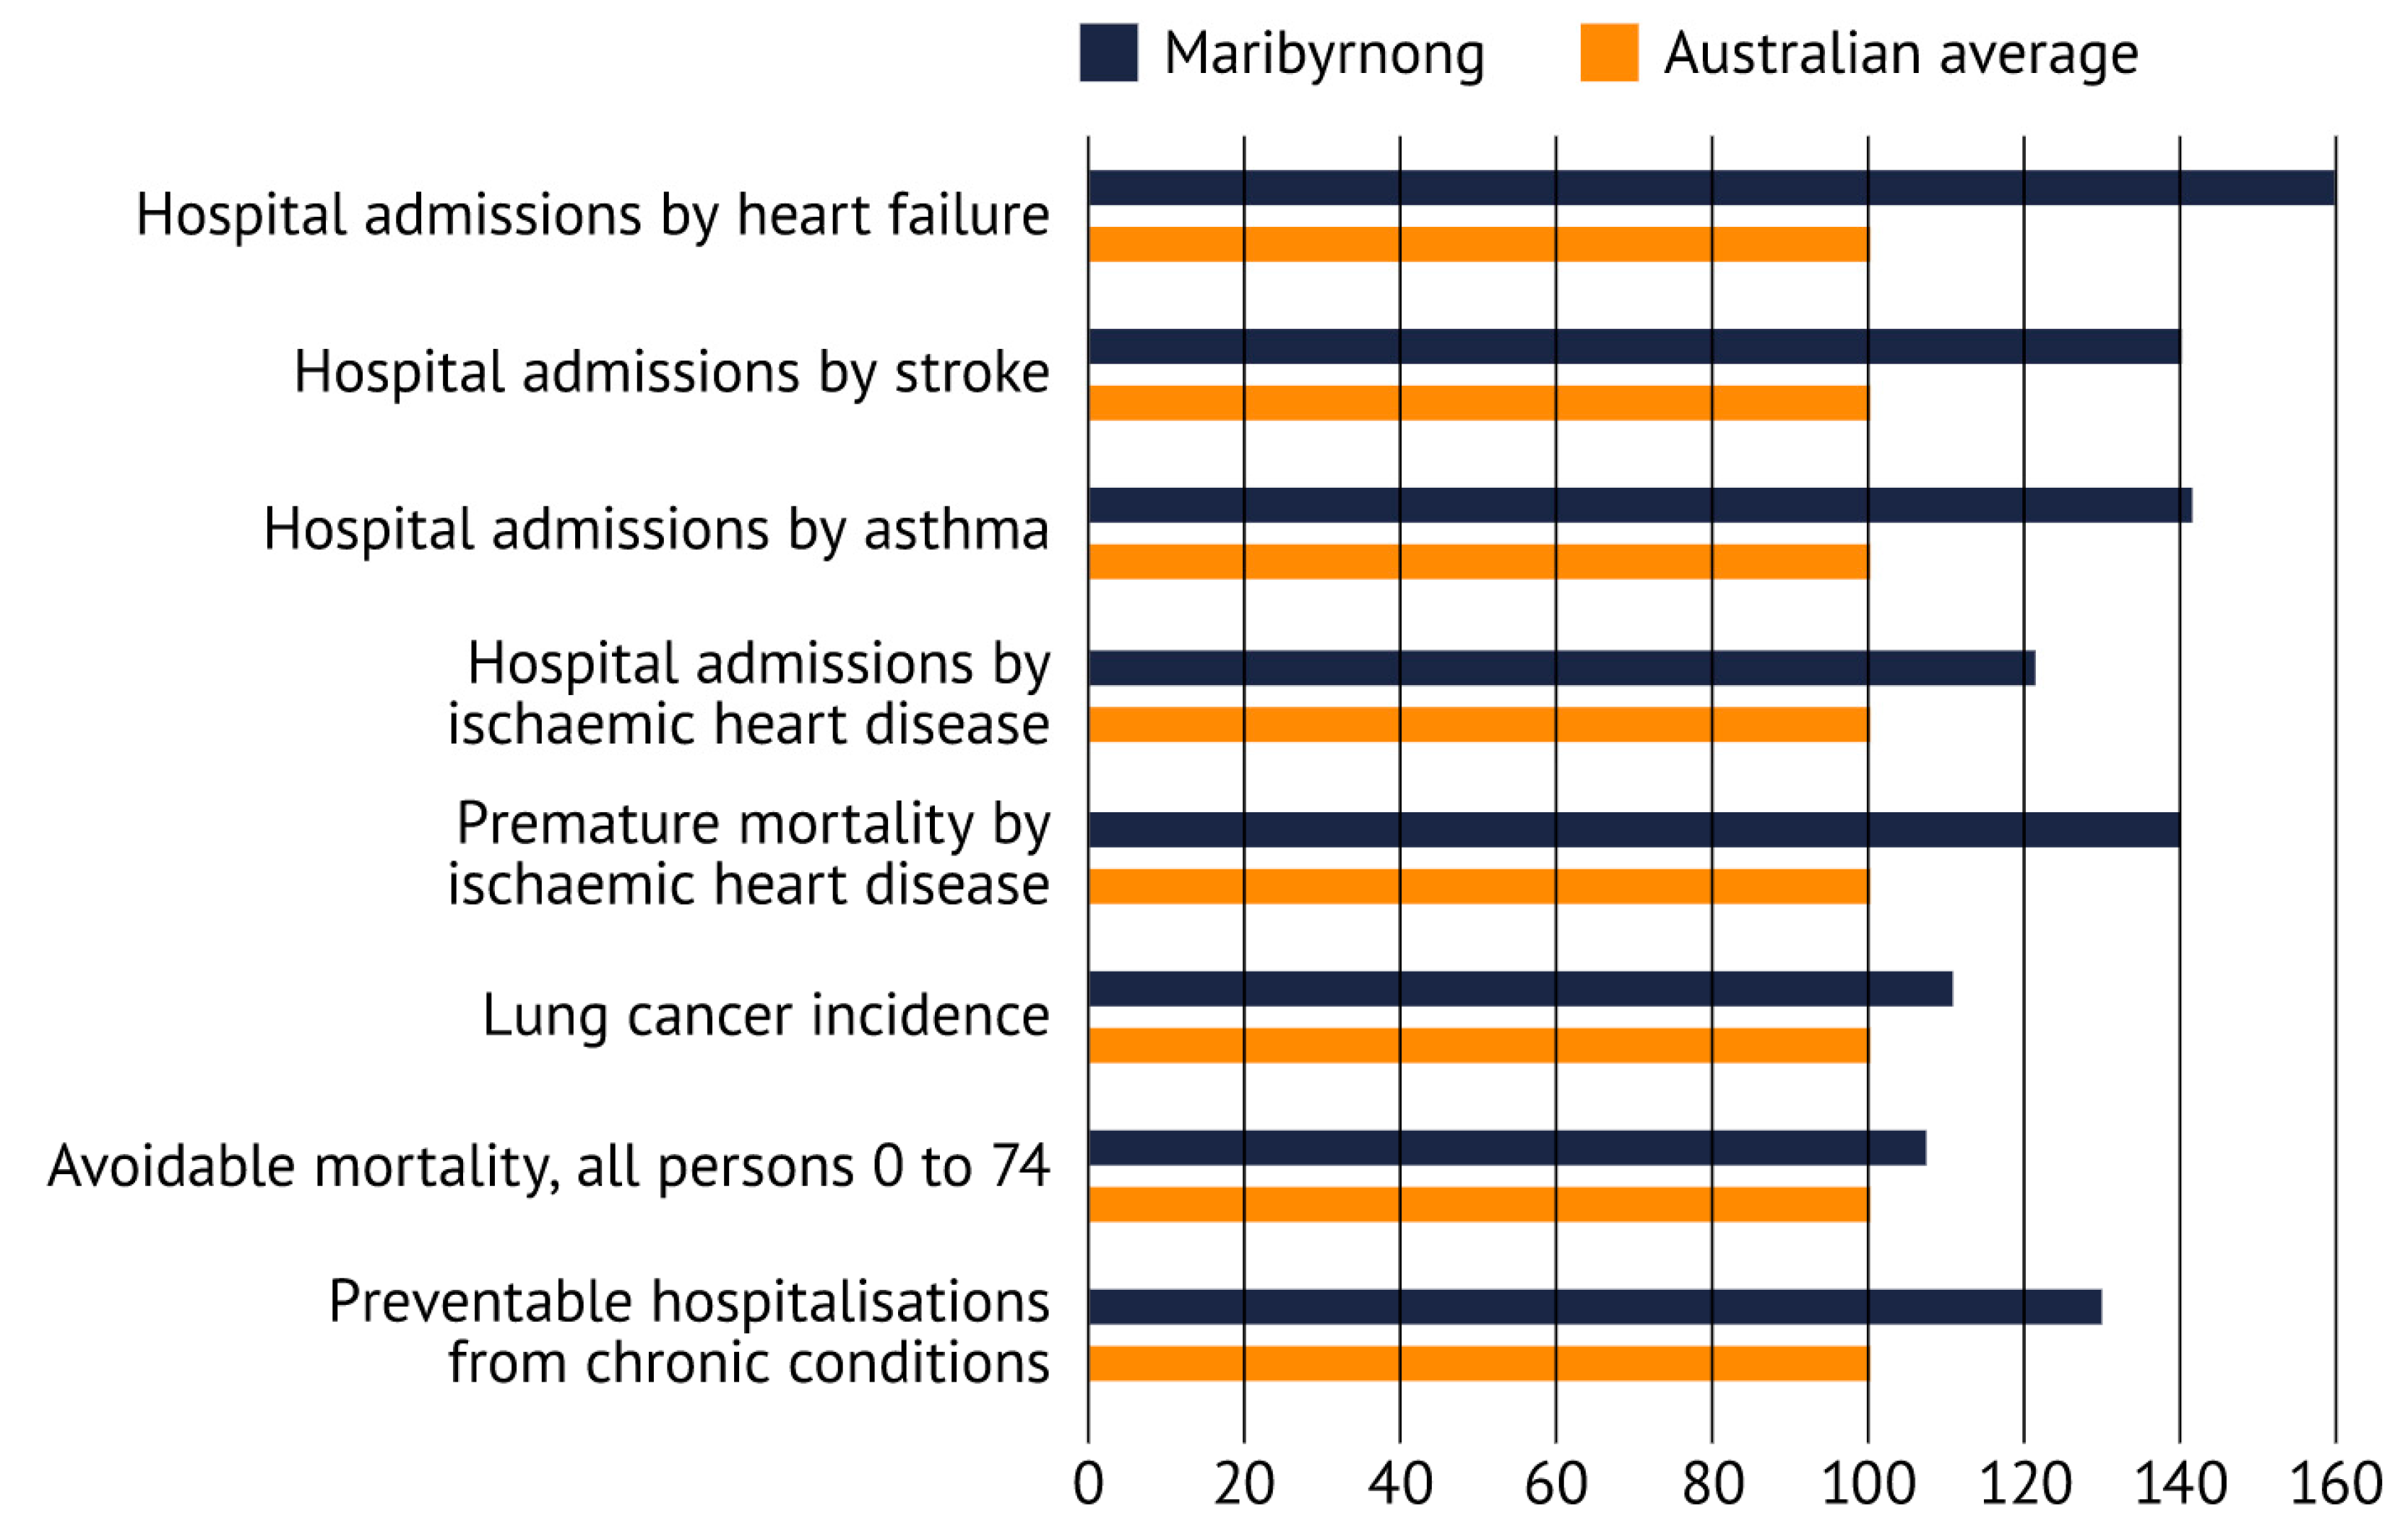
The City of Maribyrnong is located 5 km west of Melbourne city centre. It is the smallest (31 km2) and most densely populated (91,397) municipality (Local Government Area; LGA) in metropolitan Melbourne, and 25% of households have children [17]. The LGA is located between Australia’s largest port and many container yards, resulting in commercial vehicles (predominantly container trucks) making up to 30% of the total vehicle counts in this LGA [18]. Compared against Australian averages, this LGA has notably higher hospitalisation rates for a range of cardiorespiratory diseases, lung cancer and chronic conditions (Figure A1).
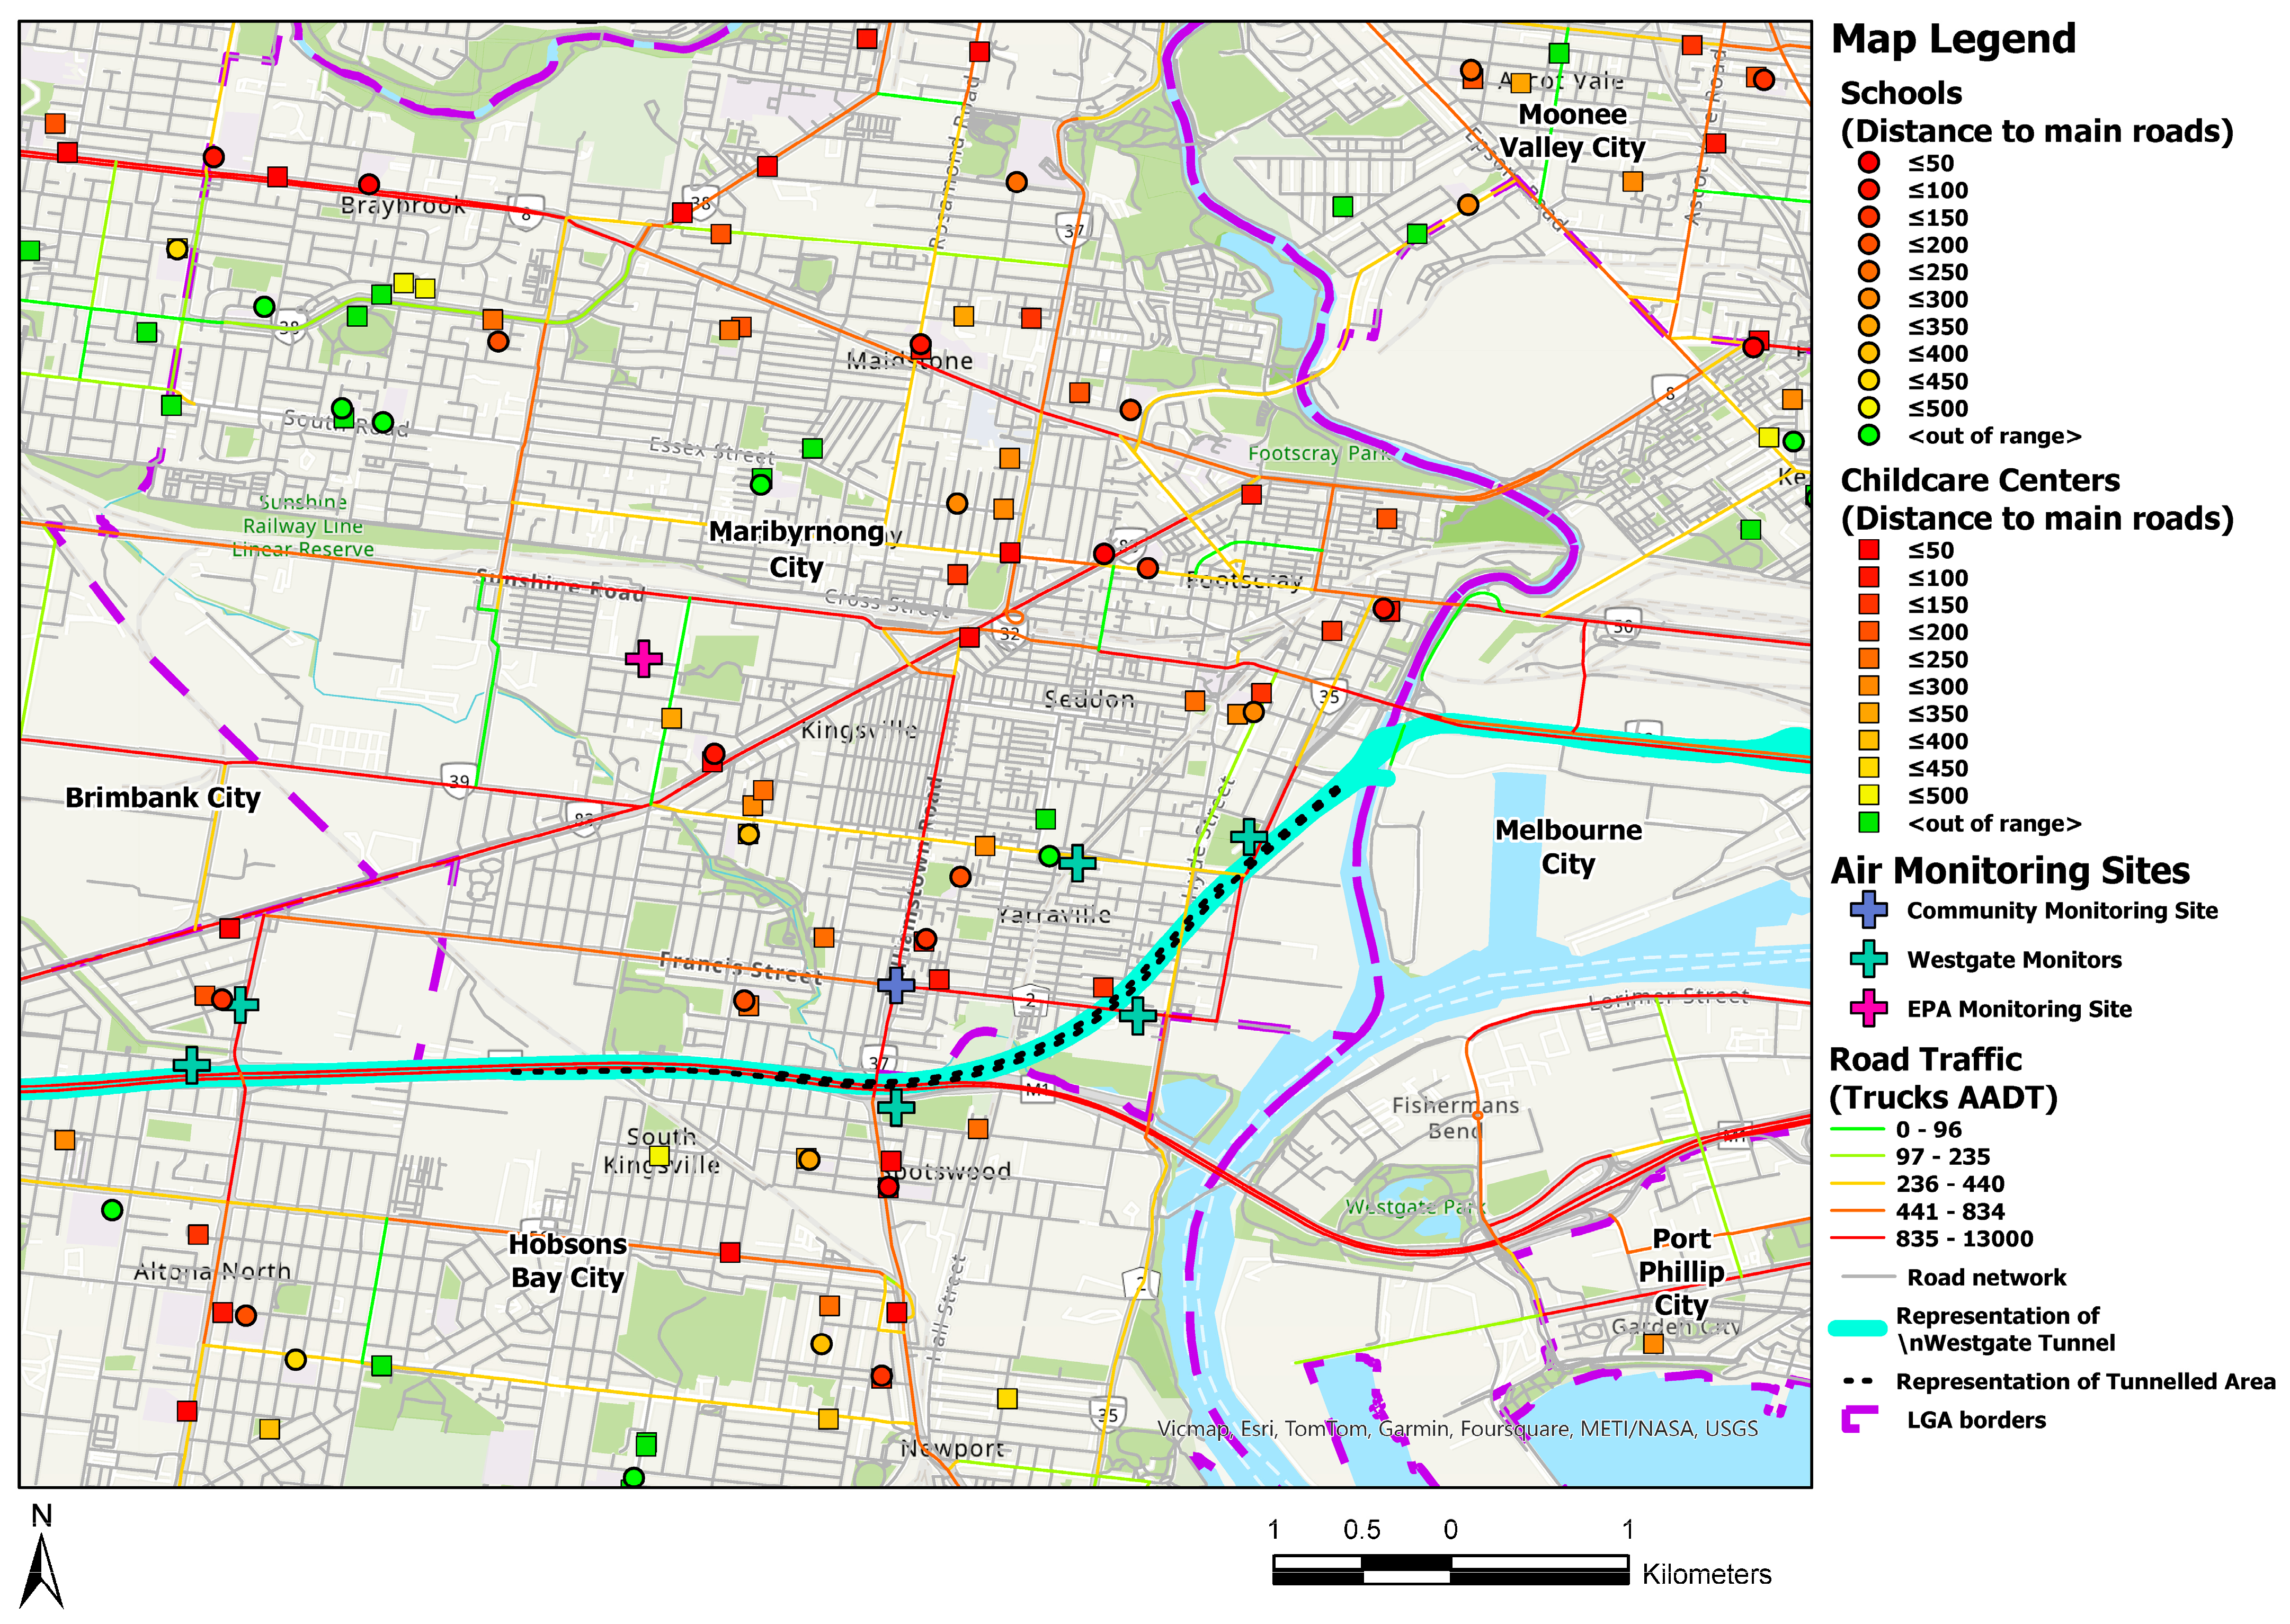
Figure 1 presents a map of Melbourne’s Inner West, focused on the City of Maribyrnong. The roads are shaded according to truck density, and the locations of schools and childcare centres are shaded by distance to high-volume truck routes. The map highlights the Westgate Tunnel Project, obtained from the project maps [19], and the location of air quality monitors discussed in Section 2.3.
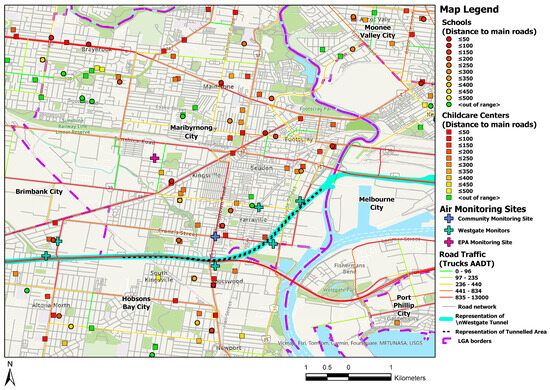
Figure 1.
Melbourne’s Inner West. Truck traffic density, schools, childcare centres, and the proposed Westgate Tunnel Project area. Source: Australian Urban Research Infrastructure Network (AURIN, 2022).
2.2. Westgate Road Tunnel Project
In 2017, the Victorian government released the Environmental Effects Statement (EES) for the proposed Westgate Road Tunnel Project. The project is intended to alleviate traffic congestion in Melbourne’s western suburbs, providing an additional route to cross the Maribyrnong River via an underground tunnel 4 km long outbound and 2.8 km long city-bound from Yarraville to Footscray (Figure 1). Tunnel emissions will be dispersed into the airshed via two large unfiltered ventilation stacks sited close to the portals. The Health Impact Assessment assumed any changes in pollution levels (NO2 and PM2.5) would not lead to measurable health impacts within the community. This assumes traffic would not increase, but would be redistributed across the road network [13]. The HIA did not include any quantitative assessments using concentration–response functions (CRFs) for roadside TRAP or childhood asthma risks. Baseline pollution exposure was estimated using data from the nearest EPA reference monitor in a park located more than 1 kilometre north (Figure 1), upwind of the project area [20].
2.3. Air Quality Data
During the planning process, the use of non-local data was raised as an issue likely to lead to a downward bias in pollution concentrations and the under-estimation of health risks [21]. Six new air quality monitoring stations, henceforth referred to as ‘Westgate monitors (WG 1–6)’ were established to monitor air quality around the project zone. WG2, 4, and 5 are in roadside locations, while WG1 and WG 3 capture background air quality [22]. The sixth monitor is located close to an industrial precinct and data are omitted here, given the likely influence of dust and industrial emissions. All monitors measured PM2.5, and only two monitors (WG4 and EPA) measured NO2. A community group placed an additional low-cost PM2.5 Koala monitor immediately adjacent to a site approved for development into a childcare centre (Figure 1). Monitoring methods of the Westgate and EPA monitors were the same (beta-attenuation monitoring and chemiluminescence), and data averages were only collected for periods where the 5 min data constituted at least 75% of data capture. The instrumentation used to measure air pollutants across all ten stations met the United States EPA Federal Register (part 53) for Ambient Air Monitoring Equivalent Methods [23].
The Victorian EPA reviewed and summarised the data from July 2016 to December 2019, produced annual averages from the EPA and WG monitors for 2017–2019, and undertook a comparative analysis of hourly samples over one week from the community monitor and EPA reference monitor to verify comparability. Annual averages from the EPA reference and community monitor obtained from May 2020 to April 2021 were presented [11].
Table 1 presents the annual PM2.5 and NO2 concentrations, as calculated by the EPA, obtained from across the air quality monitoring network and includes the current NEPM AAQ and World Health Organization (WHO) standards. To minimise any skewing of the data caused by the widespread bushfires affecting the eastern states of Australia during the latter part of 2019, Westgate and EPA monitor data were averaged over the full three years. Traffic reductions related to COVID lockdowns in March–April 2021 may have impacted data collected from the roadside community monitor; however, they are compared to the background EPA data from the same time frame, and therefore any bias is likely to result in under-estimation of health impacts.

Table 1.
Annual pollutant concentrations in Melbourne’s Inner West *.
2.4. Assigning Risk Estimates
Table 2 presents the concentration–response functions (CRFs) for childhood asthma and TRAP that were used in the present study. In recent years, two comprehensive meta-analyses have been conducted that specifically investigated the correlation between TRAP and childhood asthma outcomes. One was conducted by the Health Effects Institute (HEI), and the other by Khreis et al. Most studies meeting inclusion criteria for these meta-analyses pertained to NO2 [4]. The HEI meta-risk functions for TRAP associations included incident (onset) of asthma prevalence of active asthma (within the past year) and prevalence of ‘asthma ever’ [24]. A systematic review and meta-analysis of TRAP associations with asthma incidence over the course of childhood (birth–18 years) in large birth cohorts (predominantly European and North American) provided additional CRFs for both NO2 and PM2.5 [25].
Table 2.
Selected CRFs for long-term TRAP exposure and asthma-related outcomes in children.
The Australian Children’s Health and Air Pollution Study (ACHAPS) provides an Australian context. It examined TRAP associations with ‘current asthma’ in 2630 primary school-aged children across 12 Australian cities in 2007–2008 [26]. The ACHAPS cross-sectional study is smaller than currently available international cohort studies, but it provides risk estimates that reflect underlying population health, which is important given Australia’s high rate of childhood asthma and atopy [27,28].
2.5. Data Analysis
There is no identified lower concentration of TRAP below which health impacts do not occur [10]. For the purposes of this review, selected CRFs for NO2 and PM2.5 from Table 2 are applied to the difference in the local pollution concentrations and the background value (obtained from the EPA monitor), as well as the relevant Australian standards (NEPM AAQs) and recently revised WHO standards (Table 1). The assumption is made that there is no excess risk at the lower concentration in each comparison. When the pollution values were lower than the applicable Australian or WHO standard, no risk was estimated.
2.6. Distance of Schools and Childcare Centres to High-Traffic-Volume Routes (HVRs)
The Australian Urban Research Infrastructure Network (AURIN) accessed a range of databases to produce a map displaying the location of schools and childcare centres in Melbourne’s inner west and high-density truck routes (Figure 1). The location of air quality monitoring stations (Table 1) was also marked on the map. The decision to consider truck traffic was based on the assumption that trucks were generating over 90% of the TRAP in this area. We assessed data on traffic composition in the area [18], Australian truck fleet characteristics [29], an inventory of Australian vehicle fleet particle emissions [30], and nitrogen dioxide emissions at low-speed urban driving conditions [31]. Roads were divided into quintiles of annual average daily truck traffic (AADT). The two highest quintiles (≥833 AADT and ≥13,000 AADT) were deemed ‘high-volume routes’ (HVRs). Childcare centres and schools located on the map were shaded according to distance (50-metre increments) to the nearest HVR. The proximity of these childcare centres and schools is then considered in the context of the body of evidence presented in the HEI report using ‘distance to traffic’ as a proxy measurement of asthma risk in children.
The HEI report considered four categories of childhood asthma outcomes: onset of asthma (incidence), prevalence of asthma ever, prevalence of active asthma (within the past year), and asthma exacerbation [24]. The first two categories revealed mixed results with wide confidence intervals and were therefore discounted. Evidence in the latter two categories was more homogeneous. The twenty-one studies that met HEI inclusion criteria for proxy TRAP exposure and ‘prevalence of active asthma’ or ‘asthma exacerbation’ were then considered in terms of relevance for this study. Studies were excluded if they did not contain the following.
- A specific distance metric that was relevant to this study area.
- Were conducted in countries with significantly higher air pollution concentrations than Australia.
- Did not include adjustments for potentially confounding variables, including socio-economic status, ethnicity, housing characteristics, and pre-existing health risks.
The remaining studies are summarised in Table 3, with an additional Australian study [32] included to provide an Australian risk estimate. No meta-risk function is available due to variances in definitions and metrics across studies. Risk functions for each study are plotted against the relevant 50-metre increments between childcare centres, schools, and HVRs in the City of Maribyrnong.
Table 3.
Associations of distance to traffic with the prevalence of current asthma and asthma exacerbations.
Six of the seven studies found positive associations, with four of these studies reporting a risk estimate of statistical significance. One study, set in small rural towns on the Dutch–German border found a negative point estimate (RR 0.82) with a very wide confidence interval (0.51–1.32) [34]. This study had a low threshold (10,000 vehicles per day) for major road definition.
3. Results
3.1. Pollution Concentrations and Associated Risks
Using annual concentrations of PM2.5 and NO2 measured at the EPA monitor and the Australian and WHO standards to create three different baseline scenarios, Table 4 presents the range of increased childhood asthma risks derived by applying the selected concentration–response functions (Table 2) to the differences in annual PM2.5 and NO2 concentrations across the inner western air quality monitors (Table 1). The annual average pollution concentration was averaged over three years, except in the comparison between the community and EPA monitor, where only one year’s data were available.
Table 4.
Childhood asthma concentration–response functions applied to TRAP concentration gradients across the inner west of Melbourne.
Annual PM2.5 concentrations across all monitors exceeded WHO standards, and four of the five Westgate monitors also exceeded Australian standards. The comparatively higher annual PM2.5 concentrations at the Westgate monitors were associated with a 0–4% increase in the risk of developing childhood asthma relative to the background concentrations at the EPA monitor. Comparison to the Australian standard produced similar risks, and against the more stringent WHO standard risk elevations ranged from 9% to 13%.
The community monitor recorded a significantly higher annual PM2.5 concentration, exceeding both WHO and Australian thresholds. The difference in concentration between the community and EPA monitors was associated with a 28% increase in the risk of childhood asthma and a 23% and 34% increase when compared against the Australian and WHO standards, respectively.
The ACHAPS risk ratio produced a 38% increase in the risk of current asthma for NO2 concentration at the Westgate (WG4) monitor compared to the WHO standard. The WG4 monitor was the only project monitor to capture NO2 data, recording a three-yearly average of 16 ppb, 5.3 ppb (50%) higher than the reference EPA monitor. Applying the different concentration–response functions (Table 2) to the 5.3 ppb difference in NO2 concentration produced the following excess risks: 13% increase in the risk of asthma incidence over childhood (0–18 years), a 5% increase in the risk of asthma onset, a 9% increase in lifetime asthma and a 12% increase in the risk of active asthma. The ACHAPS risk ratio associated a 33% increase in risk of current asthma for the concentration at WG4 compared to the EPA monitor. There was only a 1 ppb difference between the Westgate monitor and the Australian standard (15 ppb) and thus negligible excess risks for this comparison. With the WHO standard, the risk increases were 6% (asthma onset), 14% (active asthma), 10% (asthma ever), and 15% (development of asthma).
3.2. Truck Traffic Density and Location of Childcare Centres and Schools
Analysis of the schools and childcare centres in the City of Maribyrnong LGA captured 51 childcare centres and 22 schools. In sum, 21 (41%) of these childcare centres and 8 schools (36%) were 150 m or closer to a high-volume route (HVR) (depicted as red roads, Figure 1).
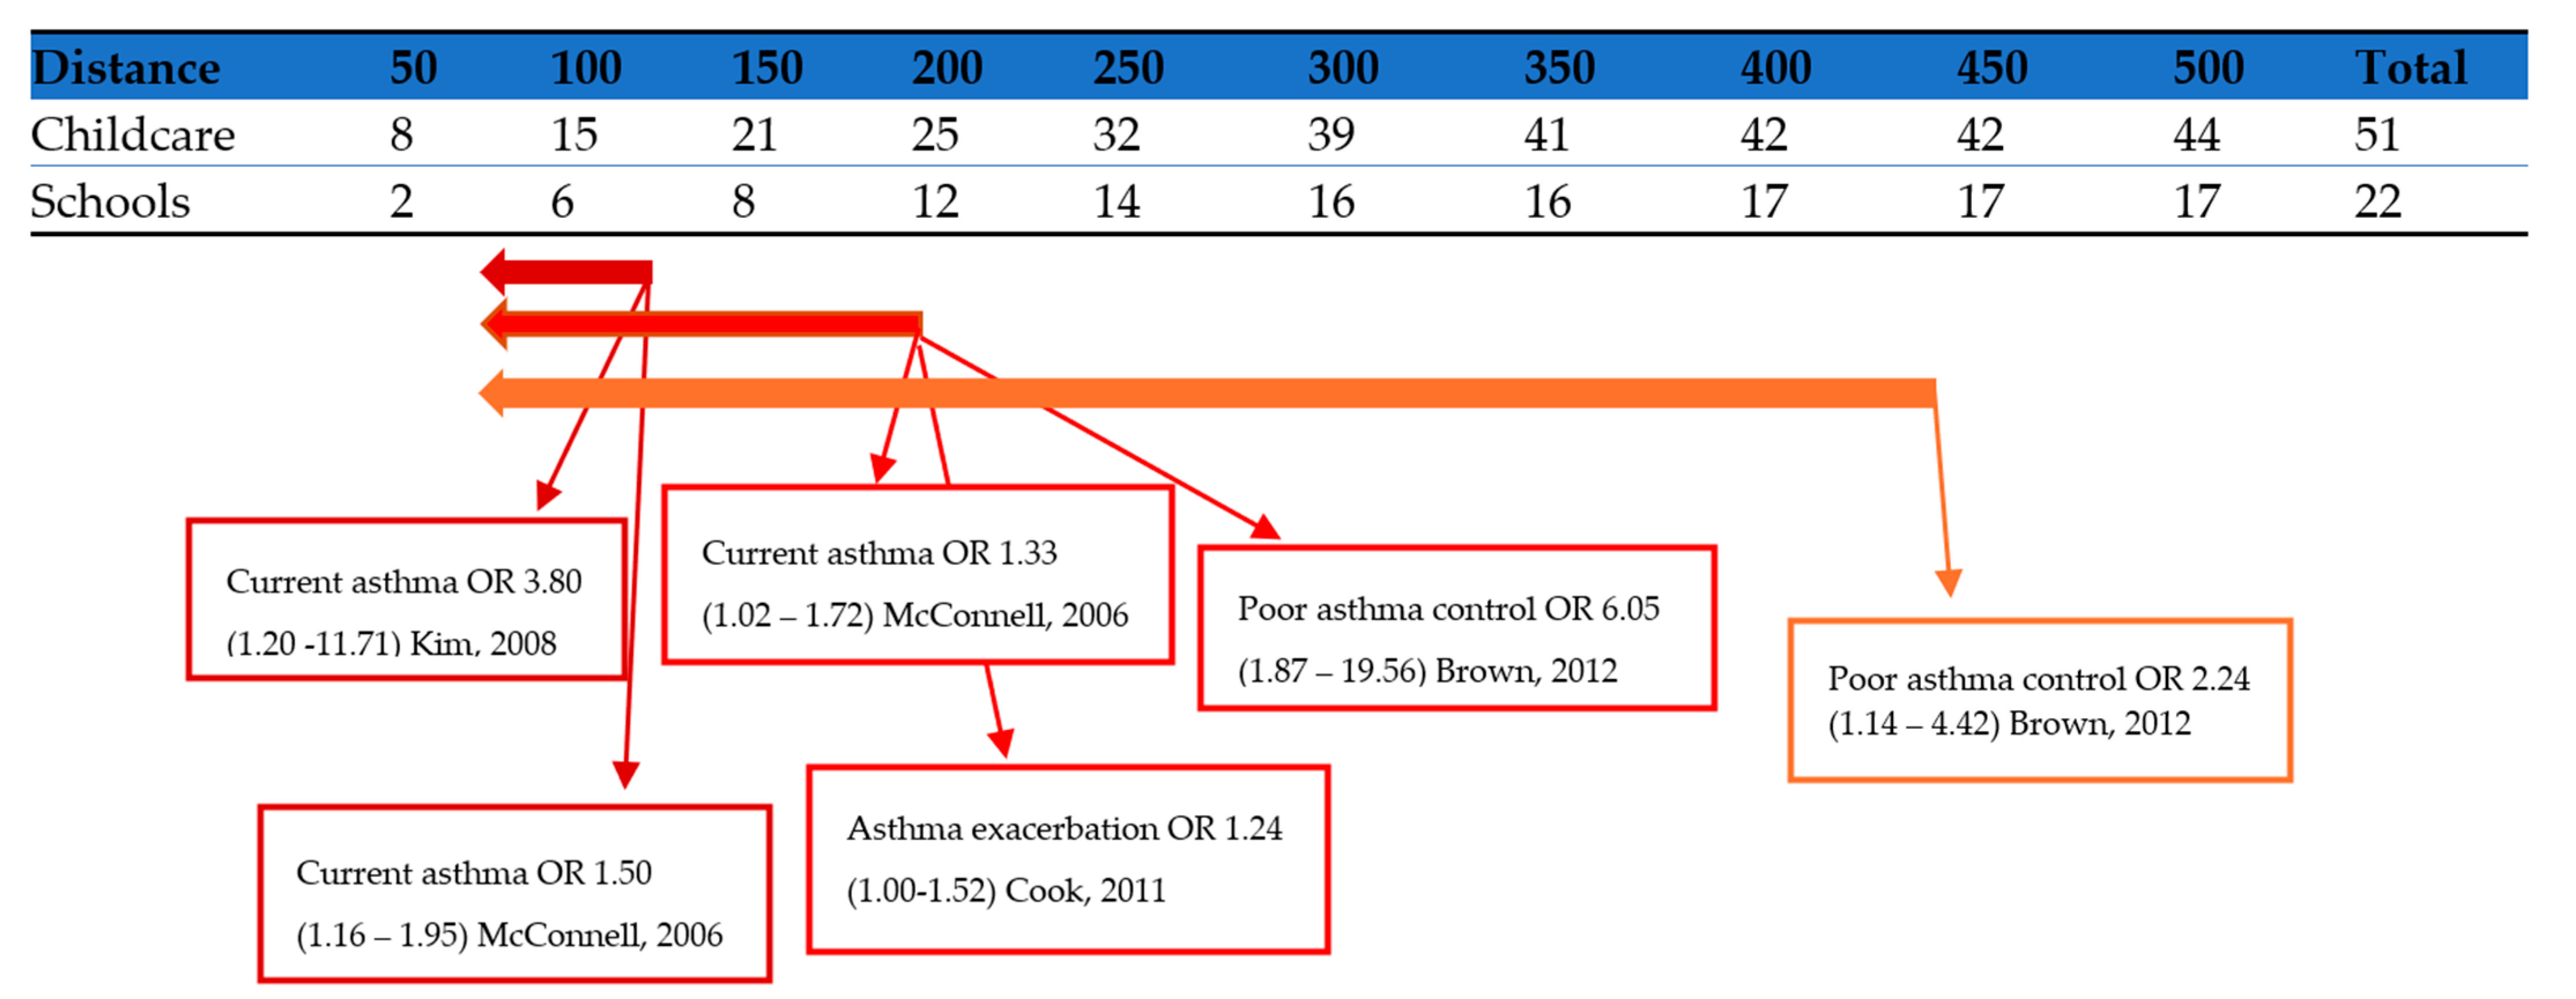
Figure 2 presents the cumulative number of childcare centres and schools falling within 50-metre increments of HVRs and overlays risk estimates from the studies that reached statistical significance summarised in Table 3. The risk estimates are shaded according to distance cut offs in the cited study: <75 m [33,35], <150 m [32,35,37], and <417 m [37].

Figure 2.
Distance between children’s learning facilities and high-volume routes in the City of Maribyrnong and asthma risk estimates from selected studies using traffic proximity as a proxy measurement [32,33,35,37]. Source: Australian Urban Research Infrastructure Network (AURIN) [38] and Health Effects Institute [24].
4. Discussion
This study illustrates the importance of scrutinising data used in health impact assessments, ensuring data inputs reflect local conditions and that they adequately represent the lived experience of an affected population. If Environmental Effects Assessments are to align with core policy health objectives, like ‘minimise adverse effects on health,’ then these objectives must be at the forefront of every methodological step. In the present study, air pollution data used to assess health risks for a community were obtained from an area that was not representative of the community’s exposure. Applying data from alternative monitoring stations inside the project area showed significant increases in asthma risks. Secondly, childhood asthma, a key concern of the affected community, was not quantitively assessed in the official HIA.
Annual NO2 concentration at the Westgate project roadside monitor (WG4) exceeded the World Health Organization standard by 60%, and this was associated with a 38% increase in the risk of asthma. Compared with the EPA monitor concentration used to assess project risks, the WG4 concentration was associated with a 33% higher asthma risk in children. The WG4 monitor was in one of the most heavily trafficked areas, but was also immediately adjacent to a residential street with a school and childcare centre less than 300 m away. PM2.5 roadside concentrations exceeded both Australian and WHO standards, with PM2.5 concentrations three times the WHO standards recorded at the community monitor. Over one-third of childcare centres and schools in this area were located within 150 m or closer to a high-volume truck route, exposing children in attendance to high levels of airborne pollutants.
The HIA methods used for the Westgate Tunnel Project are emblematic of approaches used across Australia. These methods were developed into a published guideline designed to assist in development and planning decisions across Australia [14], perpetuating the underestimation of health risks from environmental exposures to communities across Australia.
4.1. Public Health Implications
The health impacts of TRAP extend well beyond childhood asthma. Causal associations include ischaemic heart disease, stroke, chronic obstructive pulmonary disease (COPD), lung cancer, acute lower respiratory infection, type 2 diabetes, and most recently birthweight and gestational age shifts [39]. A review of TRAP exposure in schoolchildren has revealed adverse effects on student cognition and nervous system development, with reductions in a range of metrics, including reaction time, academic performance, and working memory. The review also confirmed established impacts such as asthma, respiratory infections, allergic symptoms, and raised blood pressure [40]. Recent evidence demonstrates exposures as short as 4 h may cause epigenetic changes to signalling pathways for cardiovascular and nervous systems, inflammation processes, immune response, and metabolism [41], and short-term maternal exposures have also been associated with distress in the unborn child [42]. Schools and childcare centres are frequently visited by pregnant women dropping off or collecting older siblings of the unborn child. Depending on the trimester, exposure to TRAP may be casually associated with the unborn child developing asthma, allergic rhinitis, and eczema throughout childhood [43].
Comparative prevalence data for adult hospital attendances across Victorian local government areas (LGAs) reveal the study area exceeds the 95% percentile for COPD, respiratory disease, circulatory disease, heart failure, ischaemic heart disease, stroke, diabetes, and high blood pressure [11]. Demographic factors of age, smoking, obesity, and socio-economic status fall within the 95th percentile [11]. It is highly plausible that TRAP is implicated in, or at least contributing to, the high hospital attendance rates of this area, and further investigation is warranted.
4.2. Applying Domestic and International Concentration–Response Functions
The present study used concentration–response functions from both large international systemic literature reviews and from much smaller domestic studies to highlight potential gaps arising from differences in underlying population health and pollution concentrations.
Recent literature demonstrates an augmented dose–response relationship at lower pollution concentrations [44,45,46]. The mortality hazard ratio of 1.06 for a 10 µg/m3 increase in PM2.5 is commonly used in Australian risk assessments [14], including the Westgate Tunnel Project. This figure was determined by results of large epidemiological studies undertaken across metropolitan areas in the US that have since been revised, acknowledging that mortality was underestimated by using PM2.5 in a one pollutant model (Krewski et al., 2003). Most recently, the European ELAPSE cohorts produced a mortality risk estimate of 1.13 (CI = 1.11, 1.16) for a 5 µg/m3 increase of PM2.5 at low concentrations [47], fourfold higher than the figure used in the Westgate analysis. Applying ratios from these older studies, which were conducted in higher pollution concentrations, are likely to underestimate risks in contemporary Australian settings.
Where studies examining childhood asthma associations with TRAP stratified cohorts as ‘high risk’ (pre-existing wheeze, asthma diagnosis, or parent with atopy/asthma) against ‘general’ [24], much higher risks were noted in the former group. Dell et al. (2014) found non-significant risk estimates for active childhood asthma and proximity (100 m or less) to a major road that when stratified for allergic status became significant and much higher for children with pre-existing allergic diseases. Australia has a high baseline prevalence of asthma and atopy [48,49,50], meaning that applying international CRFs may underestimate risks in the Australian context.
The Australian risk estimates from the AHCAPS (Table 2) and distance to road (Table 3) were much higher than the comparable international meta-analyses (Table 2) and studies (Table 3). Given the smaller study populations and reduced statistical power compared to international CRFs, applying Australian and international CRFs in a weighted approach with sensitivity analyses that balance statistical power against a reflection of local population health may be the most appropriate method to incorporate both a robust weight-of-evidence approach and a preventative approach in keeping with the precautionary principle.
In addition to ensuring data inputs are as relevant as possible to the assessed population, our study demonstrates the importance of considering the full range of available evidence when selecting relevant health endpoints to assess in an HIA. Most of the cohort studies that informed the meta-estimates were published prior to 2017 and could have been utilised to guide an assessment of roadside asthma risks to children. A national independent intermediary between project proponents and government guiding the selection of appropriate CRFs for the EES processes may help ensure project planning better reflects underlying policy objectives related to health and environment in the often-tight time frames required for policy decisions.
4.3. Disconnects between Policy Objectives and Current Practices
We also discovered disconnections between documented policy objectives and observed current practices, particularly the federal policy objectives of equitable protection and consideration of vulnerable groups and state-based policy objectives of intergenerational equity, community engagement, and harm minimisation from the Victorian Environmental Effects Act 1978 and the Environmental Protection Act 2017, respectively.
4.3.1. Equitable Protection, Precautionary Principle, and Vulnerable Groups
Federal air quality policy is underpinned by the objective of ‘equitable protection’. It also requires the precautionary principle be observed and that specific consideration be given to vulnerable groups including children [9]. This policy was intended for adoption into relevant state government legislature; however, there is no specific legislative lever to enforce this. Current Victorian state and local government policies have no provision to account for children’s health when constructing new roads or siting new childcare centres and schools, both of which play a large role in dictating children’s exposure to air pollution. The community monitor discussed in this paper recorded an annual PM2.5 concentration threefold higher than the WHO standard, with an associated 34% increase in the risk of developing childhood asthma. This site was approved for a childcare centre, placing the most vulnerable group (children aged 0–4 years) in what may be one of the most polluted intersections in Melbourne, indicating a serious misalignment between policy objectives and actual practice.
4.3.2. Intergenerational Equity
The Victorian Environmental Effects Act 1978 directs that major projects follow the principles of environmentally sustainable development (ESD). This includes equity, with a specific focus on intergenerational equity. Despite childhood asthma being a prominent and measurable health impact of TRAP exposure, the HIA omitted this endpoint from the quantitative risk assessment. The long-term health and environmental impacts for future generations were also ignored. By contrast, in 2021, the Welsh government effectively suspended the building of any new roads, based on protecting the immediate and long-term future health of children [51].
4.3.3. Community Engagement
The Victorian Environmental Effects Act 1978 includes provision for public consultation to be undertaken to help inform decisions. Community input is used to identify issues of concern and to seek feedback on project options or potential mitigation measures (D.O.T.a.Planning 2023). The Westgate monitoring network was established due to community concerns about local air quality. However, unlike data from the EPA monitoring station, data from the Westgate monitors (WG1–WG6) are not made available to the public in real time. Public consultation for the Westgate Tunnel Project highlighted that childhood asthma was a distinct and specific concern for the community, among other issues [11]. The HIA omission of childhood asthma and failure to provide data in a meaningful way for the community is indicative of tokenistic public consultation, fitting the description of ‘window-dressing participation’ [52].
4.3.4. Harm Minimisation
By omitting childhood asthma risks, related mitigation strategies were not considered in the HIA either. The Victorian Environmental Protection Act 2017 requires any risks to human health and the environment br minimised as far as reasonably practicable. HIA objectives included ‘to minimise’ adverse impacts, including of poor air quality, on the health of nearby communities. Such harm minimisation could be explored with more extensive mitigation, such as low-emission zones, buffer zones between schools and major roads, vegetation barriers, and design considerations of schools (i.e., placement of windows, playground location etc.). International jurisdictions that have instigated a range of these strategies have been rewarded with measurable improvements in air quality and children’s health. For example, 150–300 m buffer zones, upgrading of school buses, and improved building design criteria for schools were significantly associated with a reduction in the number of children with clinically low lung function in Southern California [53]. A recent UK study found that green screens along school perimeters, HEPA filters in classrooms, and clean air zones ‘school streets program’ reduced TRAP particle concentrations by 44%, 57%, and 36% respectively [54]. In failing to consider whether any of these strategies could be incorporated into the Westgate project, a valuable opportunity to improve the health of children in this community was missed.
4.4. Broader Implications
Despite the narrative of ‘good’ air quality in Australia [6], we have highlighted the uneven distribution of air pollution and how it is already associated with tangible health risks for a particular Australian community. Risks posed to communities in high-traffic areas are likely to be underestimated by current methods that rely on EPA reference monitor data. Estimates of air pollution impacts in Australia vary widely [55,56,57,58], and are typically based on a sparse network of PM2.5 data monitors, omitting the impacts of NO2. The most recent and robust national figure uses data from 2006–2016 to estimate an annual 2616 premature deaths attributable to anthropogenic PM2.5 [57]. In contrast, New Zealand estimates are based from a denser air quality network with a higher geographical resolution and CRFs that are adjusted for underlying population health and account for both anthropogenic PM2.5 and NO2 [59]. Vehicle emissions were identified as the most dominant source of population-weighted exposure to ambient air pollution, with an annual attributable 2200 premature deaths and 13,218 asthma hospitalisations in children [60]. The New Zealand population is one-fifth of Australia’s, which makes the comparative figures between these neighbouring countries incongruous. If fleet emissions, population exposure, and population health between the two countries were equal, then an estimated 11,105 annual premature deaths and 66,090 annual hospitalisations for childhood asthma would be attributed to TRAP in Australia. Australian figures currently used to guide policy decisions are significantly underestimated. Previous attempts to upgrade Australian fuel and vehicle regulations were effectively negated by the petroleum industry [6], resulting in an aged fleet with higher emissions compared to other countries [6].( If methods were updated to align with recent evidence, there would be a greater economic impetus for policymakers to adopt TRAP mitigation measures and accelerate transport decarbonisation.
Policy decisions related to air pollutants, including greenhouse gases, are particularly beleaguered by political–economic interests in Australia, proving a poisoned chalice for leaders of both major political parties [61]. Previous US governments have gained traction on more progressive climate policies by shifting the narrative’s focus to the immediate health impacts on children [62]. Following suit may provide a safer and more politically palatable angle for Australian policymakers seeking climate action. Updated health estimates starting with TRAP and childhood asthma may provide a valuable narrative to help achieve political consensus, hasten the decarbonisation of transport, and generate momentum towards policies with broader long-term health and environmental benefits.
5. Limitations
Our study did not set out to provide an alternative approach to the HIA methodology. Instead, it provides a counterfactual perspective designed to illustrate the variances that may occur contingent on data inputs and explore whether current HIA methods adequately account for impacts on children’s health. The calculated risks apply only to the pollution concentration values as measured by the monitors, and only one monitor supplied NO2 data. Due to it being in a densely trafficked area, it is likely to over-represent the population exposure throughout the whole community, in the same way the EPA data are likely to under-represent population exposure throughout the area. Future research could include more complete pollution modelling that includes fleet composition, emission factors, traffic patterns, and meteorological parameters in developing HIA. An example of such an assessment is provided by Khreis et al. (2019), where they developed a full-chain model that combined traffic, vehicle emission, and atmospheric dispersion and validated it against land use regression NO2 modelling [3]. They used the UK incidence rate for childhood asthma and applied meta-risk functions for NO2 to determine that between 7% and 12% of childhood asthma cases in the UK city of Bradford were specifically attributable to traffic-related NO2 [3].
In this present study, annual averages were obtained from hourly measurements taken 24 h a day, including weekends; however, hourly data were not accessible, and therefore temporal patterns of short-term pollution exposure were not considered. Residential exposures and attendance frequency in childcare centres were not considered either. Some children attend childcare daily during the week, others only for certain days. It is reasonable to expect most children attending schools and childcare centres in this area live locally; however; there is likely to be wide variation in the proximity of residential addresses to TRAP in addition to the proportion of time spent at home versus childcare. Even so, studies that have considered both residential and school exposures have found associations for TRAP exposure at schools that were independent of and a similar size to risk estimates at home addresses [26,63].
As previously mentioned, annual pollution data within and adjacent to the project vicinity were averaged over three years, except the comparison between the community monitor, where only one year’s PM2.5 data were available. Significant widespread non-traffic sources (e.g., bushfire smoke) should in theory affect all PM2.5 concentrations in the broader area (EPA reference site and roadside) relatively evenly; however, given the larger mass of these particles, they will significantly reduce the TRAP proportion of the mass-based PM2.5 concentration measurements. NO2 is more specific for TRAP and not influenced by any other major sources in this area, so this comparison is likely to be more robust. We found that the community KOALA monitor was co-located with an EPA monitor and assessed against US EPA equivalence for one week; however, given that there was only one monitor in this location for the remainder of a year, results may be spurious.
In addition to a full-chain health risk assessment, it would be informative for future research in this area to access retrospective hourly NO2 data and identify peak exposure periods and whether these short-term exposures are associated with measurable asthma outcomes. High-resolution definition of temporal and spatial patterns of pollution in this area would be beneficial in developing targeted mitigation strategies. Some of these may include mapping of walkable cleaner-air routes, identifying appropriate areas for vegetation barriers, prioritised HEPA filter supply to schools and childcare centre rooms, and targeted asthma surveillance and education programs.
6. Conclusions
This local study underscores the failure of road infrastructure and urban planning practices to adequately address the impacts on children’s health. The omission of mitigation strategies represents a missed opportunity to address the high local prevalence of childhood asthma and observe core policy objectives such as ‘harm minimisation’. Current health impact assessment (HIA) methods require updating to ensure that the selection of health endpoints and concentration–response functions (CRFs) align with the most recent evidence and appropriately address the concerns of the affected community. As illustrated by the siting of childcare centres and the Westgate Tunnel Project in Melbourne’s inner west, existing practices and policy outcomes concerning children’s exposure to TRAP fall short of aligning with key federal and state environmental objectives. In view of these findings, urgent action is warranted to bridge the gap between current practices and desired policy outcomes, ensuring the protection of children’s health and the fulfilment of broader environmental and public health goals.
Author Contributions
Conceptualisation, C.W.; methodology, C.W., and P.D.S.; software, AURIN; validation, P.D.S., and B.W.H.; resources, C.W.; data curation, C.W.; writing—original draft preparation, C.W.; writing—review and editing, P.D.S., B.W.H., D.K. and N.L.; supervision, N.L. All authors have read and agreed to the published version of the manuscript.
Funding
C.W. is supported by an Australian Government Research Training Program Scholarship from the University of Queensland and received a career development grant from Asthma Australia. P.D.S. is a Leadership Fellow (L3) of the Australian National Health and Medical Research Council (NHMRC).
Institutional Review Board Statement
Not applicable.
Informed Consent Statement
Not applicable.
Data Availability Statement
This research utilised data available from the National Collaborative Research Infrastructure (NCRIS)- enabled Australian Urban Research Infrastructure Network (AURIN).
Acknowledgments
We would like to acknowledge the kind support from Masoud Rahimi, AURIN geospatial data scientist and thank Simon Batterbury (University of Melbourne) for his advice and edits made to the manuscript.
Conflicts of Interest
The authors declare no conflict of interest.
Appendix A
Figure A1 displays average Australian hospitalisation rates for a range of health outcomes linked to TRAP against the rates for this LGA (ABS 2017–2018).
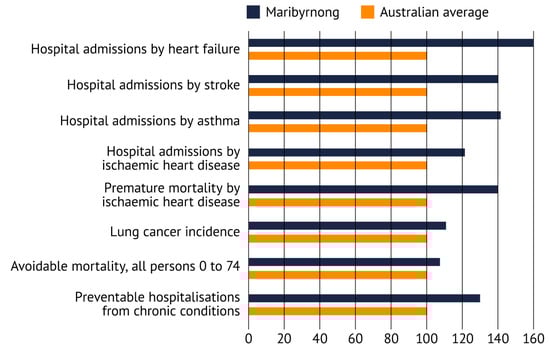
Figure A1.
Hospitalisation rates in Australia and the City of Maribyrnong. Source: Dr Kate Lycett, Torrens University Australia, Inner West Air Quality Community Reference Group Report [11].
Figure A1.
Hospitalisation rates in Australia and the City of Maribyrnong. Source: Dr Kate Lycett, Torrens University Australia, Inner West Air Quality Community Reference Group Report [11].
References
- World Health Organisation. Asthma; World Health Organisation WHO: Geneva, Switzerland, 2022. [Google Scholar]
- Global Asthma Network. The Global Asthma Report; Global Asthma Network: Auckland, New Zealand, 2018. [Google Scholar]
- Khreis, H.; Cirach, M.; Mueller, N.; de Hoogh, K.; Hoek, G.; Nieuwenhuijsen, M.J.; Rojas-Rueda, D. Outdoor air pollution and the burden of childhood asthma across Europe. Eur. Respir. J. 2019, 54, 1802194. [Google Scholar] [CrossRef] [PubMed]
- Boogaard, H.; Patton, A.; Atkinson, R.; Brook, J.; Chang, H.; Crouse, D.; Fussell, J.; Hoek, G.; Hoffmann, B.; Kappeler, R. Long-term exposure to traffic-related air pollution and selected health outcomes: A systematic review and meta-analysis. Environ. Int. 2022, 164, 107262. [Google Scholar] [CrossRef] [PubMed]
- Achakulwisut, P.; Brauer, M.; Hystad, P.; Anenberg, S.C. Global, national, and urban burdens of paediatric asthma incidence attributable to ambient NO2 pollution: Estimates from global datasets. Lancet Planet. Health 2019, 3, e166–e178. [Google Scholar] [CrossRef] [PubMed]
- Emmerson, K.M. Australia State of the Environment 2021: Air Quality, Independent Report to the Australian Government Minister for the Environment; Commonwealth of Australia: Canberra, Australia, 2021. [Google Scholar]
- Australian Bureau of Statistics. National Health Survey: First Results; Australian Bureau of Statistics: Canberra, Australia, 2018.
- Deloitte Access Economics Pty Ltd. The Hidden Cost of Asthma; Asthma Australia and National Asthma Council Australia: South Melbourne, VIC, Australia, 2015. [Google Scholar]
- NEPC. Methodology for Setting Air Quality Standards in Australia. Part A; Federal Government: Canberra, Australia, 2011.
- Zosky, G.R.; Vander Hoorn, S.; Abramson, M.J.; Dwyer, S.; Green, D.; Heyworth, J.; Jalaludin, B.B.; McCrindle-Fuchs, J.; Tham, R.; Marks, G.B. Principles for setting air quality guidelines to protect human health in Australia. Med. J. Aust. 2021, 214, 254–256.e1. [Google Scholar] [CrossRef] [PubMed]
- Inner West Air Quality Community Reference Group. Air Pollution in Melbourne's Inner West; Victorian Government: Melbourne, VIC, Australia, 2020.
- Australian Commission on Safety and Quality in Health Care. Australian Atlas of Healthcare Variation; Australian Commission on Safety and Quality in Health Care: Sydney, Australia, 2015.
- Wright, J. West Gate Tunnel Project: Technical Report J–Human Health Impact Assessment; EnRisks: Carlingford, Australia, 2017. [Google Scholar]
- Capon, A.; Wright, J. An Australian incremental guideline for particulate matter (PM2. 5) to assist in development and planning decisions. Public Health Res. Pract. 2019, 29, e2941928. [Google Scholar] [CrossRef]
- Informed Decisions. Population and Household Forecasts, 2021 to 2051. Maribyrnong City Council, Population Forecast 2023. Available online: https://forecast.id.com.au/maribyrnong/population-age-structure (accessed on 12 January 2024).
- Walter, C.; Schneider-Futschik, E.; Irving, L. Traffic pollution near childcare centres in Melbourne. Aust. N. Z. J. Public Health 2019, 43, 410–412. [Google Scholar] [CrossRef] [PubMed]
- Australian Bureau of Statistics. Regional Population Growth, Australia, 2017–2018: Population Estimates by Local Government Area (ASGS 2018), 2017 to 2018; Australian Bureau of Statistics: Canberra, Australia, 2019.
- GHD. Inner West Truck Survey; Victorian State Government: Melbourne, Australia, 2014.
- Westgate Distributor Authority. Westgate Tunnel Project Environment Effects Statement; Victorian State Government: Melbourne, VIC, Australia, 2017; pp. 4–7.
- Bureau of Meteorology. Wind Speed and Direction Rose; Bureau of Meteorology: Canberra, Australia, 2016.
- Inquiry and Advisory Committee. West Gate Tunnel Project; V.S.G. Planning Panels Victoria, Ed.; Victorian State Government: Melbourne, VIC, Australia, 2017.
- Environment Protection Authority Victoria. EPA Submission on the Westgate Tunnel Project Environmental Effects Statement (under the Environment Effects Act 1978); EPA: Melbourne, VIC, Australia, 2017.
- Environmental Protection Authority Victoria. Analysis of WGTP Air Monitoring Data during the Construction Phase; EPA: Melbourne, VIC, Australia, 2023.
- Health Effects Institute. Systematic Review and Meta-Analysis of Selected Health Effects of Long-Term Exposure to Traffic-Related Air Pollution; Health Effects Institute: Boston, MA, USA, 2022. [Google Scholar]
- Khreis, H.; Kelly, C.; Tate, J.; Parslow, R.; Lucas, K.; Nieuwenhuijsen, M. Exposure to traffic-related air pollution and risk of development of childhood asthma: A systematic review and meta-analysis. Environ. Int. 2017, 100, 1–31. [Google Scholar] [CrossRef] [PubMed]
- Knibbs, L.D.; de Waterman, A.M.C.; Toelle, B.G.; Guo, Y.M.; Denison, L.; Jalaludin, B.; Marks, G.B.; Williams, G.M. The Australian Child Health and Air Pollution Study (ACHAPS): A national population-based cross-sectional study of long-term exposure to outdoor air pollution, asthma, and lung function. Environ. Int. 2018, 120, 394–403. [Google Scholar] [CrossRef]
- Walter, C.; Schneider-Futschik, E.; Knibbs, L. The health impacts of ambient air pollution in Australia: A systematic review. Intern. Med. J. 2021, 51, 1567–1579. [Google Scholar] [CrossRef]
- Dell, S.D.; Jerrett, M.; Beckerman, B.; Brook, J.R.; Foty, R.G.; Gilbert, N.L.; Marshall, L.; Miller, J.D.; To, T.; Walter, S.D. Presence of other allergic disease modifies the effect of early childhood traffic-related air pollution exposure on asthma prevalence. Environ. Int. 2014, 65, 83–92. [Google Scholar] [CrossRef]
- Hensher, D.; Wei, E. A Comparative Assessment of Zero and Low Emission Strategies for the Australian Truck Fleet: An industry perspective. Transp. Res. Part A Policy Pract. 2024, 185, 104108. [Google Scholar] [CrossRef]
- Keogh, D.U.; Ferreira, L.; Morawska, L. Development of a particle number and particle mass vehicle emissions inventory for an urban fleet. Environ. Model. Softw. 2009, 24, 1323–1331. [Google Scholar] [CrossRef]
- Badshah, H.; Posada, F.; Muncrief, R. Current State of NOₓ Emissions from In-Use Heavy-Duty Diesel Vehicles in the United States; Transportation Research Board (TRB): Washington, DC, USA, 2019. [Google Scholar]
- Cook, A.G.; deVos, A.; Pereira, G.; Jardine, A.; Weinstein, P. Use of a total traffic count metric to investigate the impact of roadways on asthma severity: A case-control study. Environmental Health 2011, 10, 52. [Google Scholar] [CrossRef]
- Kim, J.J.; Huen, K.; Adams, S.; Smorodinsky, S.; Hoats, A.; Malig, B.; Lipsett, M.; Ostro, B. Residential traffic and children’s respiratory health. Environ. Health Perspect. 2008, 116, 1274–1279. [Google Scholar] [CrossRef]
- Krämer, U.; Sugiri, D.; Ranft, U.; Krutmann, J.; von Berg, A.; Berdel, D.; Behrendt, H.; Kuhlbusch, T.; Hochadel, M.; Wichmann, H.-E. Eczema, respiratory allergies, and traffic-related air pollution in birth cohorts from small-town areas. J. Dermatol. Sci. 2009, 56, 99–105. [Google Scholar] [CrossRef]
- McConnell, R.; Berhane, K.; Yao, L.; Jerrett, M.; Lurmann, F.; Gilliland, F.; Künzli, N.; Gauderman, J.; Avol, E.; Thomas, D. Traffic, susceptibility, and childhood asthma. Environ. Health Perspect. 2006, 114, 766–772. [Google Scholar] [CrossRef]
- Chang, J.; Delfino, R.J.; Gillen, D.; Tjoa, T.; Nickerson, B.; Cooper, D. Repeated respiratory hospital encounters among children with asthma and residential proximity to traffic. Occup. Environ. Med. 2009, 66, 90–98. [Google Scholar] [CrossRef]
- Brown, M.S.; Sarnat, S.E.; DeMuth, K.A.; Brown, L.A.S.; Whitlock, D.R.; Brown, S.W.; Tolbert, P.E.; Fitzpatrick, A.M. Residential proximity to a major roadway is associated with features of asthma control in children. PLoS ONE 2012, 7, e37044. [Google Scholar]
- AURIN. Australian Urban Research Infrastructure Network; AURIN: Melbourne, Australia, 2022. [Google Scholar]
- Health Effects Institute. State of Global Air 2019; Health Effects Institute: Boston, MA, USA, 2019. [Google Scholar]
- An, F.; Liu, J.; Lu, W.; Jareemit, D. A review of the effect of traffic-related air pollution around schools on student health and its mitigation. J. Transp. Health 2021, 23, 101249. [Google Scholar] [CrossRef]
- Du, X.; Jiang, Y.; Li, H.; Zhang, Q.; Zhu, X.; Zhou, L.; Wang, W.; Zhang, Y.; Liu, C.; Niu, Y. Traffic-related air pollution and genome-wide DNA methylation: A randomized, crossover trial. Sci. Total Environ. 2022, 850, 157968. [Google Scholar] [CrossRef]
- Xiao, H.; Yao, C.; Qi, Z.; Liu, J.; Liu, X.; Zhou, Y.; Tang, E.; Hu, Y.; Jiang, Y.; Li, D. Association between maternal short-term exposure to ambient air pollution and the risk of fetal distress: A matched case-control study. Sci. Total Environ. 2022, 860, 160438. [Google Scholar] [CrossRef]
- Deng, Q.; Lu, C.; Li, Y.; Sundell, J.; Norbäck, D. Exposure to outdoor air pollution during trimesters of pregnancy and childhood asthma, allergic rhinitis, and eczema. Environ. Res. 2016, 150, 119–127. [Google Scholar] [CrossRef]
- Shi, L.; Zanobetti, A.; Kloog, I.; Coull, B.A.; Koutrakis, P.; Melly, S.J.; Schwartz, J.D. Low-Concentration PM2.5 and Mortality: Estimating Acute and Chronic Effects in a Population-Based Study. Environ. Health Perspect. 2015, 124, 46–52. [Google Scholar] [CrossRef]
- Di, Q.; Wang, Y.; Zanobetti, A.; Wang, Y.; Koutrakis, P.; Choirat, C.; Dominici, F.; Schwartz, J.D. Air Pollution and Mortality in the Medicare Population. N. Engl. J. Med. 2017, 376, 2513–2522. [Google Scholar] [CrossRef]
- Pinault, L.; Tjepkema, M.; Crouse, D.L.; Weichenthal, S.; van Donkelaar, A.; Martin, R.V.; Brauer, M.; Chen, H.; Burnett, R.T. Risk estimates of mortality attributed to low concentrations of ambient fine particulate matter in the Canadian community health survey cohort. Environ. Health 2016, 15, 18. [Google Scholar] [CrossRef]
- Strak, M.; Weinmayr, G.; Rodopolou, S.; Tewis, M.; de Hoogh, K.; Forastiere, F.; Andersen, Z.; Brunekreef, B.; Hoek, G.; Katsouyanni, K. Natural and cause-specific mortality and low-level air pollution in a pooled cohort of 392,826 participants in Europe: The ELAPSE project. Environ. Epidemiol. 2019, 3, 383–384. [Google Scholar]
- Toelle, B.G.; Ng, K.; Belousova, E.; Salome, C.M.; Peat, J.K.; Marks, G.B. Prevalence of asthma and allergy in schoolchildren in Belmont, Australia: Three cross sectional surveys over 20 years. BMJ 2004, 328, 386–387. [Google Scholar] [CrossRef]
- Hansell, A.L.; Rose, N.; Cowie, C.T.; Belousova, E.G.; Bakolis, I.; Ng, K.; Toelle, B.G.; Marks, G.B.; Team, C.A.P.S. Weighted road density and allergic disease in children at high risk of developing asthma. PLoS ONE 2014, 9, e98978. [Google Scholar] [CrossRef]
- Owens, L.; Laing, I.A.; Zhang, G.; Turner, S.; Le Souëf, P.N. Prevalence of allergic sensitization, hay fever, eczema, and asthma in a longitudinal birth cohort. J. Asthma Allergy 2018, 11, 173. [Google Scholar] [CrossRef]
- Howe, S. Sophie Howe, Future Generations Commissioner for Wales, Welcomes the News that All New Road Building Projects in Wales Are Being Paused by the Welsh Government; Office of the Future Generations Commissioner for Wales: Cardiff, UK, 2021. [Google Scholar]
- Arnstein, S.R. A ladder of citizen participation. J. Am. Inst. Plan. 1969, 35, 216–224. [Google Scholar] [CrossRef]
- Gauderman, W.J.; Urman, R.; Avol, E.; Berhane, K.; McConnell, R.; Rappaport, E.; Chang, R.; Lurmann, F.; Gilliland, F. Association of improved air quality with lung development in children. N. Engl. J. Med. 2015, 372, 905–913. [Google Scholar] [CrossRef]
- Abhijith, K.; Kukadia, V.; Kumar, P. Investigation of air pollution mitigation measures, ventilation, and indoor air quality at three schools in London. Atmos. Environ. 2022, 289, 119303. [Google Scholar] [CrossRef]
- AIHW. Australian Burden of Disease Study: Impact and Causes of Illness and Death in Australia 2015; Australian Federal Government: Canberra, Australia, 2019.
- IHME. Global Burden of Disease Study (GBD 2017). Burden by Risk 1990–2017; Institute for Health Metrics and Evaluation (IHME): Seattle, WA, USA, 2018. [Google Scholar]
- Hanigan, I.C.; Broome, R.A.; Chaston, T.B.; Cope, M.; Dennekamp, M.; Heyworth, J.S.; Heathcote, K.; Horsley, J.A.; Jalaludin, B.; Jegasothy, E. Avoidable Mortality Attributable to Anthropogenic Fine Particulate Matter (PM2. 5) in Australia. Int. J. Environ. Res. Public Health 2021, 18, 254. [Google Scholar] [CrossRef]
- Schofield, R.; Walter, C.; Silver, J.; Brear, M.; Rayner, P.; Bush, M. Submission to the Department of Environment and Energy in Response to Their “Better Fuel for Cleaner Air” Discussion Paper; Clean Air and Urban Landscapes Hub, Melbourne Energy Institute: Melbourne, VIC, Australia, 2017. [Google Scholar]
- Hales, S.; Atkinson, J.; Metcalfe, J.; Kuschel, G.; Woodward, A. Long term exposure to air pollution, mortality and morbidity in New Zealand: Cohort study. Sci. Total Environ. 2021, 801, 149660. [Google Scholar] [CrossRef]
- Kuschel, G.; Metcalf, J.; Berentson-Shaw, J.; Hales, S.; Atkinson, J.; Woodward, A. Health and Air Pollution in New Zealand 2016 (HAPINZ 3.0): Volume 1–Finding and Implications. 2022. Available online: https://environment.govt.nz/publications/health-and-air-pollution-in-new-zealand-2016-findings-and-implications/ (accessed on 14 June 2024).
- Tangney, P. Between conflation and denial—The politics of climate expertise in Australia. Aust. J. Political Sci. 2019, 54, 131–149. [Google Scholar] [CrossRef]
- Workman, A.; Blashki, G.; Bowen, K.J.; Karoly, D.J.; Wiseman, J. Political leadership on climate change: The role of health in Obama-era US climate policies. Environ. Res. Lett. 2020, 15, 105003. [Google Scholar] [CrossRef]
- McConnell, R.; Islam, T.; Shankardass, K.; Jerrett, M.; Lurmann, F.; Gilliland, F.; Gauderman, J.; Avol, E.; Künzli, N.; Yao, L. Childhood incident asthma and traffic-related air pollution at home and school. Environ. Health Perspect. 2010, 118, 1021–1026. [Google Scholar] [CrossRef]
Disclaimer/Publisher’s Note: The statements, opinions and data contained in all publications are solely those of the individual author(s) and contributor(s) and not of MDPI and/or the editor(s). MDPI and/or the editor(s) disclaim responsibility for any injury to people or property resulting from any ideas, methods, instructions or products referred to in the content. |
© 2024 by the authors. Licensee MDPI, Basel, Switzerland. This article is an open access article distributed under the terms and conditions of the Creative Commons Attribution (CC BY) license (https://creativecommons.org/licenses/by/4.0/).