Abstract
This study investigates the evolution of soil pore structure and shear strength deterioration in compacted clayey soil under controlled wetting and drying (wd) cycles, which are expected to become more frequent due to climate change. Thirty soil samples were compacted at optimal moisture content and 90% maximum dry density. These samples were then subjected to 0, 1, 5, 10, and 15 controlled wd cycles from saturation to the wilting point, and volumetric changes were recorded during each cycle. After the wd treatment, the soil samples were scanned using X-ray computed tomography (CT) at 50 μm resolution and then sheared under unconsolidated–undrained and consolidated–undrained conditions in a triaxial test. Significant shrinkage and swelling of soil samples were observed during wd cycles, with average volumetric strain fluctuating between +12% at saturation and −5% at the wilting point. X-ray CT visualisation and analysis revealed higher porosity, more prominent pores, and increased pore length in soil samples with increasing wd cycles. Both undrained and effective soil shear strength markedly decreased with increasing wd cycles. CT-derived macroporosity and pore length were significant predictors of the soil’s undrained and effective shear strength when exposed to wd cycles. The findings emphasise the considerable impact of climate change, specifically wd cycles, on clayey soil, highlighting the need for consideration in the design of earth-based infrastructure.
1. Introduction
Climate change and its impact on the performance of earth-based infrastructure is a growing concern for many countries [1,2]. According to the IPCC [3], heavy precipitation events are expected to become more intense and frequent in most regions as global warming continues. The life and performance of earth-based infrastructure, which we rely on for our daily activities, are significantly affected by variations in precipitation and temperature. Increased precipitation leads to higher moisture content in earth-based infrastructure through infiltration, causing swelling strain to accumulate. Conversely, drying earth-based infrastructure during dry periods results in shrinkage strain [4]. With climate change, the cyclical swelling and shrinkage caused by wetting and drying (wd) cycles is becoming more intense, posing a significant threat to the overall performance of earth-based infrastructure. These cycles are believed to introduce cracks to the soil’s structure due to the nonuniform development of volumetric strain. These cracks reduce the strength and stiffness of the soil, potentially leading to structural failures and costly repairs. Clay-rich soils are particularly susceptible to this phenomenon. For instance, in the UK, geological clay formations such as Woolwich and Reading beds, London, Gault, Weald, Kimmeridge, Oxford, and Lias clays found within the southeast area of England are particularly prone to shrink–swell and pose a higher risk of damage to lightly loaded foundations and other earth-based infrastructures such as subgrade, embankments, and cuttings.
The shear strength of soil is believed to decrease as wd cycles increase. For instance, Zha et al. [5] found that the unconfined compressive strength of soil increased after the first wd cycle but decreased over subsequent cycles. Similarly, Moayed et al. [6] discovered that the soil’s California bearing ratio (CBR) increased after the first cycle of wd but decreased with additional cycles. In contrast, Hu et al. [7] observed a decrease in the unconfined compressive strength of soil with increasing wd cycles from the beginning. Gowthaman et al. [8] also reported a reduction in the unconfined compressive strength of soil treated with microbial-induced calcium carbonate precipitation as wd cycles increased. Rasul et al. [9] noted that samples subjected to wd cycles exhibited significantly more permanent deformation and had lower resilient modulus values than those not subjected to wd. Stirling et al. [10] found a sharp decrease in deviator stress at failure under wd cycles. Other studies have reported comparable results [11,12,13,14,15].
Imaging techniques, such as X-ray computed tomography (CT), have the potential to visualise and analyse how changes in soil pore structure affect the soil’s shear strength and stiffness during wd cycles. X-ray CT has been used for soil analysis since the 1980s [16]. The three-dimensional (3D) analysis of X-ray CT images enables the evaluation of various soil pore structural parameters such as porosity, pore size distribution, pore volume distribution, pore tortuosity, and connectivity [17,18,19,20,21]. X-ray CT imaging of soil can provide crucial insights into how wetting and drying impact soil pore structure at a microscale level. For example, Ma et al. [22] reported that porosity, the percentage of pores > 100 μm, and the fraction of elongated pores significantly increased with increasing wd cycles. Helliwell et al. [23] observed significant changes in soil structure in repacked cores after a single wd event, although further wd had negligible impact. Pires et al. [21] found an increase in porosity and the amount of pores larger than ten mm3 with increasing wd cycles.
The impact of wetting and drying on soil shear strength has been the subject of extensive research. However, most of these studies have primarily focused on short-term (unconfined or undrained) shear strength. Furthermore, previous research methodologies for wetting and drying are needed to mirror real-world conditions accurately. Typically, experimental specimens were oven-dried and subjected to a limited number of wd cycles, which fails to represent actual climate conditions and the complete life cycle of the earth’s structures. To address these knowledge gaps, our study utilised X-ray CT to visualise soil pore structure and analyse its properties during repeated wd cycles. Our objective was to comprehend the impact of these cycles on shrinkage–swelling behaviour and the soil’s undrained and effective shear strength. Furthermore, we aimed to investigate potential correlations between the number of wd cycles, soil pore characteristics, and shear strength of the soil. To our knowledge, this is the first study that integrates X-ray CT visualisation with an undrained and effective shear strength of soil exposed to a series of wetting and drying cycles.
2. Materials and Methods
2.1. Materials
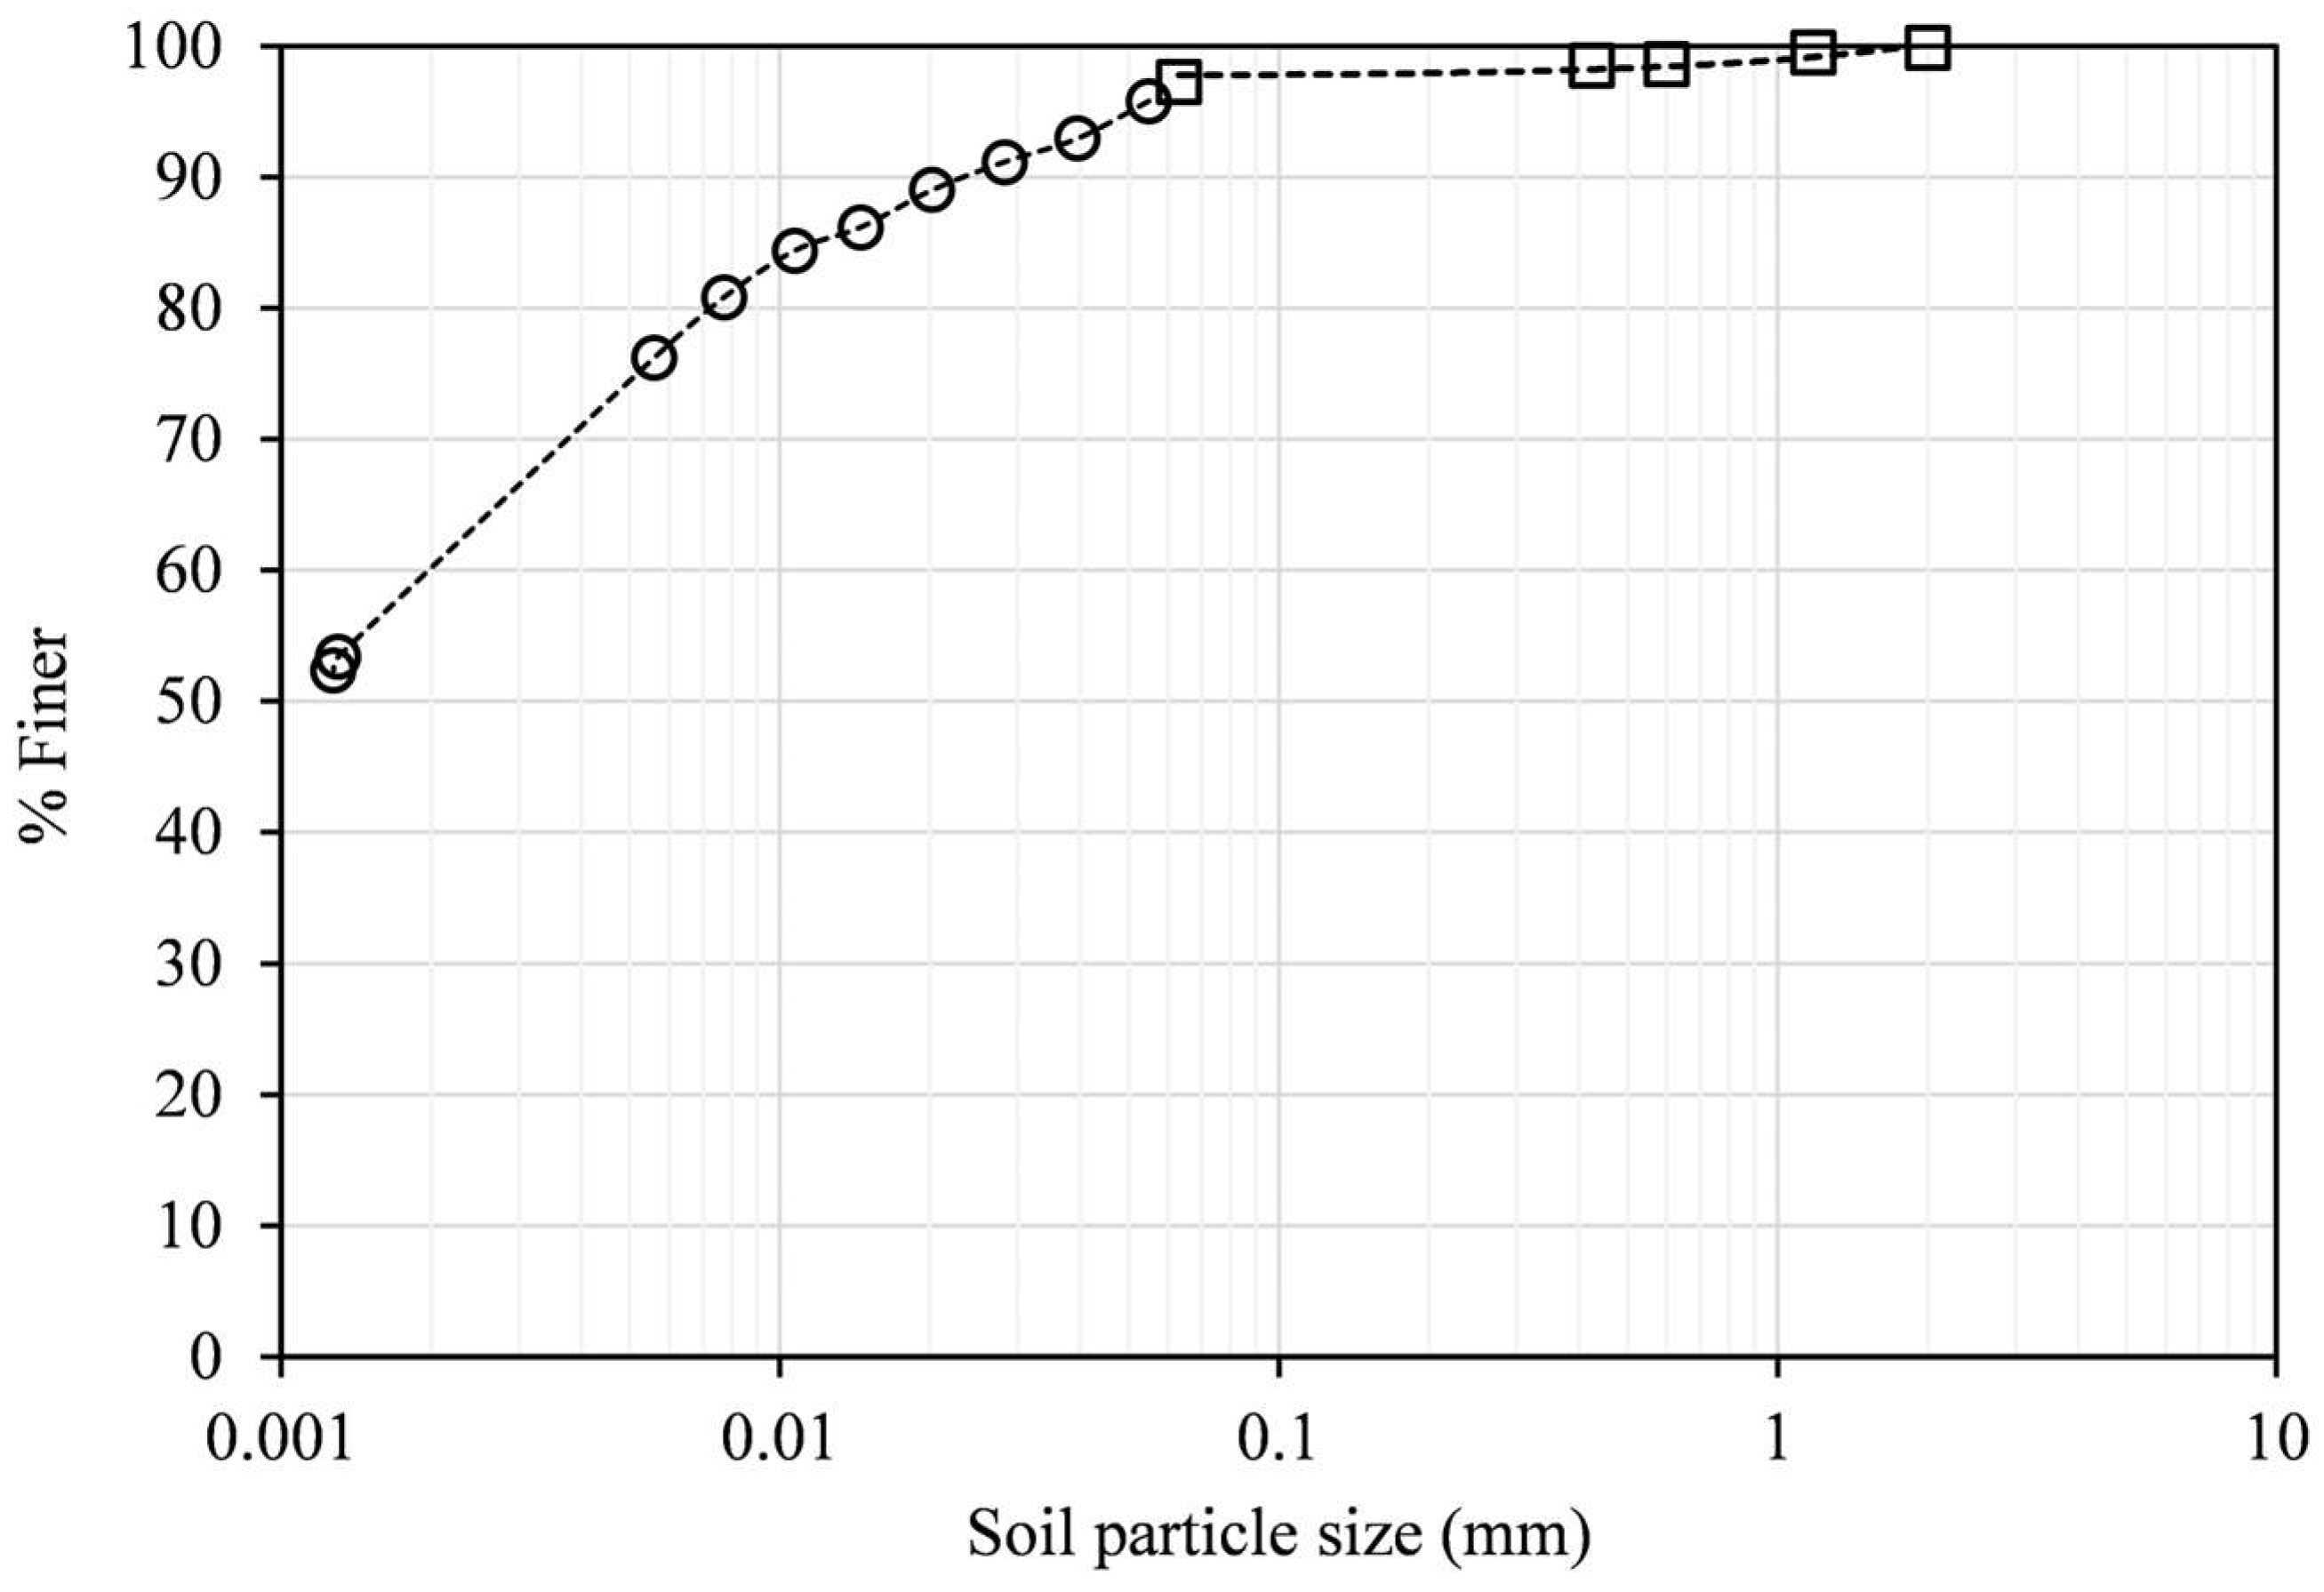
The investigation focused on the Oxford clay sourced from Eynsham, Oxfordshire, United Kingdom (51°46′55″ N, 001°23′05″ W) at a depth ranging from 0.25 m to 3 m below the existing ground level. Groundwater fluctuations were recorded between 0.9 and 2.93 m below the existing ground level. The site is characterised by superficial deposits of sand and gravel underlain by impermeable Oxford clay formations. The Oxford clay is a grey silty clay with a natural organic odour and sporadic shelly fragments. The in situ moisture content of the Oxford clay exhibited variations between 26% and 42%. Standard penetration tests (N value) ranged from 4 to 16. In compliance with BS 1377-1 [24], the soil underwent oven drying at a constant temperature of 105 °C for a minimum of 24 h, with periodic turning to prevent localised drying. Subsequently, the soil was pulverised, passed through a 2 mm sieve, and readied for further analysis. Particle size distribution was determined using wet-sieving analysis and hydrometer methods [25]. Liquid and plastic limits were measured per the method outlined in [25]. The soil composition consists of 60% clay, 37% silt, and 3% sand, with the complete particle size distribution outlined in Figure 1. The liquid limit, plastic limit, and plasticity index were measured as 53%, 22%, and 31%, respectively. The water-soluble sulphate (SO4) ranged from 14 to 16 mg/L, and the pH ranged from 4 to 8.4 [26]. Considering the liquid limit and plasticity index, the swelling potential of Oxford clay was assessed to be medium to high [27].

Figure 1.
Particle size distribution for the soil used in this study. The square symbols refer to the data measured using sieve analysis, and the circles represent the data measured using hydrometer analysis.
2.2. Samples Preparation
Standard and modified Proctor compaction tests were conducted by BS 1377-4 [28] to establish the relationship between moisture content and dry density of the soil (refer to Figure 2). The standard Proctor test yielded a maximum dry density of 1665 kg/m³ at an optimum moisture content of 18%. Meanwhile, the modified Proctor test resulted in a maximum dry density of 1800 kg/m³ at an optimum moisture content of 12%. Following the modified Proctor test, 30 cylindrical soil samples measuring 100 mm in height and 50 mm in diameter were prepared at an optimum moisture content of 12% and 90% of the maximum dry density. Using a splitting stainless-steel mould, these samples were compacted to the required dry density of 1620 kg/m³ in 4 layers. After compaction, the soil samples were immediately removed from the mould, wrapped in plastic film, and placed in sealed plastic bags. They were left at room temperature (25 ± 1 °C) for 48 h to achieve moisture equilibrium.
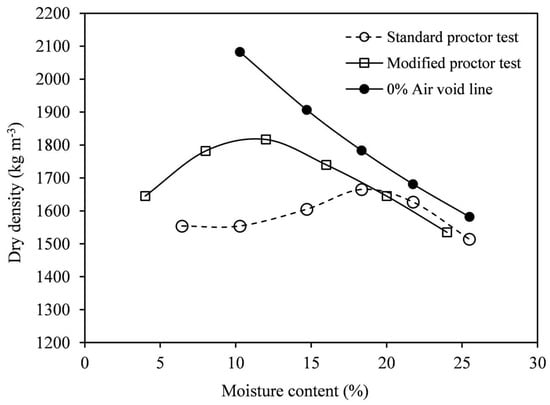
Figure 2.
Dry density vs. moisture content relations measured using standard and modified Proctor tests.
2.3. Application of Wetting and Drying Cycles
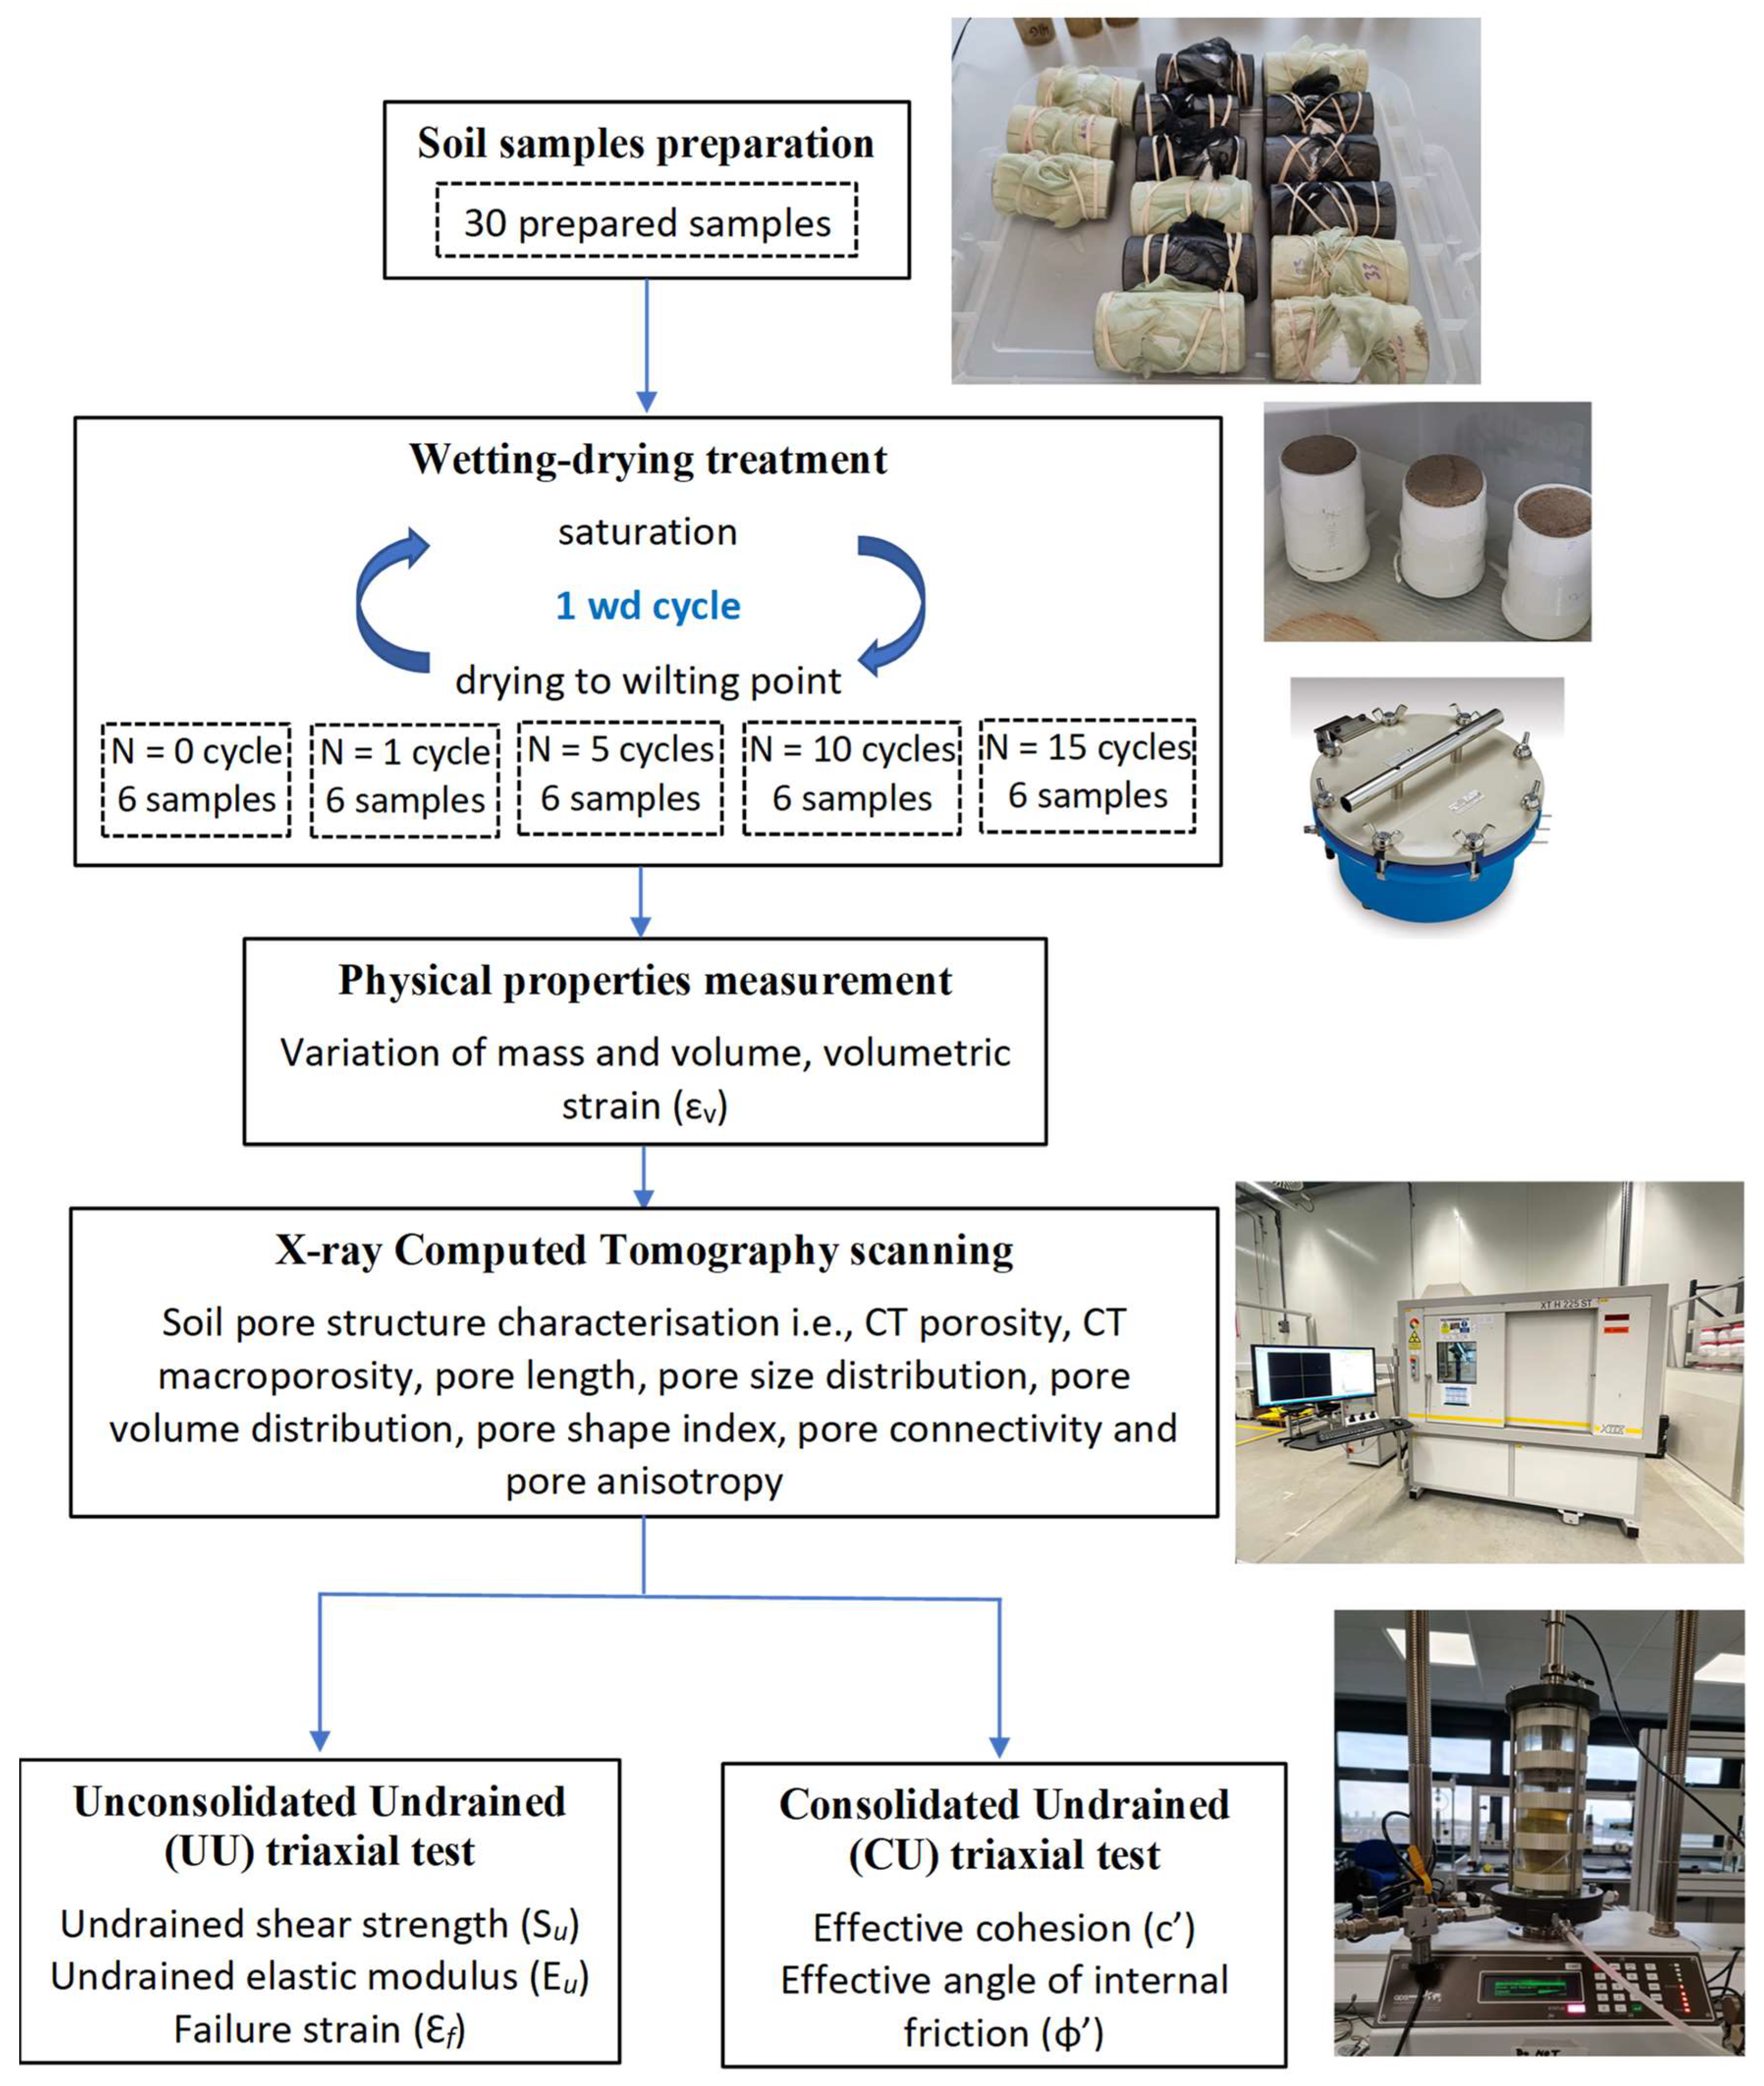
The prepared soil samples were treated with 0, 1, 5, 10, and 15 wd cycles, with six replicates for each treatment. Figure 3 provides a complete flowchart of the experimental program. During each wd cycle, the samples were first saturated by submerging half in water through the capillary rise and then dried to −1500 kPa matric potential (wilting point) on the pressure plate.

Figure 3.
This study’s experimental program and analysis involved preparing and testing 30 soil samples. The treated soil samples underwent X-ray computed tomography scanning and were tested under undrained–unconsolidated and consolidated-–drained conditions.
To achieve saturation, the soil samples were wrapped in a rubber membrane, keeping the top free and the bottom on porous stone, and then encased in a split plastic core to prevent damage and free lateral swelling. The soil samples were then saturated from the bottom through capillary rise by submerging half in water under an overburden pressure of 20 kPa, simulating an overburden of 1 m depth. The soil samples were kept under saturation until the rate of mass change of samples became insignificant, which took an average of five days. After saturation, the soil samples were transferred to the pressure plate for drying at a matric suction of −1500 kPa. It is worth noting that oven drying was not used for the soil samples, as it is not recommended for clayey soils due to the creation of fissures in samples and the inability to reflect actual field conditions.
2.4. Measurements of Volumetric Change
The volumetric behaviour during wd cycles was analysed by conducting volume measurements on specimens after each cycle. An electronic Vernier calliper with an accuracy of 0.005 mm was used for the measurements. Diameter (referred to as d1, d2, and d3) and height (referred to as h1, h2, and h3) measurements were taken at three respective cross sections evenly distributed on the surface of the specimens. Care was taken to ensure the measurements were conducted gently to avoid disturbing the specimens, particularly the weaker, wet specimens after saturation. The average values of the diameter and height measurements were used to calculate the volume of the specimens and the volumetric strain (εv) for each wd cycle. The εv of the specimens was calculated using Equation (1).
εv = (VN − V0)/V0 × 100%
The parameter V0 denotes the initial volume of the specimen upon compaction, while VN represents its volume after N wetting and drying cycles. A positive εv value indicates swelling, whereas a negative εv denotes shrinkage.
2.5. X-ray Computed Tomography Imaging and Analysis
The X-ray CT scanning of 30 soil samples was conducted after 0, 1, 5, 10, and 15 wd cycles, with six replicates for each treatment. Before scanning, the samples were equilibrated at −1500 kPa matric suction on a pressure plate. A Nikon X-Trek XTH225ST machine was used for scanning, with a maximum accelerating voltage of 195 kV at 105 mA current. To reduce beam hardening, the beam was prefiltered using 0.5 mm Cu. A total of 1800 projections were taken over a 360-degree rotation with a two-second exposure time. The data were reconstructed using the Nikon proprietary filtered back-projection algorithm, resulting in a voxel resolution of 50 μm. The radiographs of each scan were reconstructed in 32-bit format to prevent compression of the greyscale histogram. The original grey-level X-ray microtomographic images were processed using ImageJ 1.54 software [29]. The images were imported into ImageJ and cropped to a cylindrical shape with a diameter of 50 mm (no. of voxels = 1000) and a height of 90 mm (no. of pixels = 1800). Five mm of the soil samples was cropped from each end to remove the imaging, wetting, and drying artefacts. After cropping, an enhanced contrast was achieved using a histogram-stretching procedure with saturated pixels of 0.4%. Following contrast enhancement, the greyscale volumes were segmented using a locally adaptive thresholding method proposed by Sauvola and Pietikenien [30]. This method, implemented in ImageJ, computes the threshold t (x, y) based on the mean m (x, y) and standard deviation s (x, y) of the pixel intensities in a 15 × 15 window centred around the pixel p (x, y).
The segmented CT data for each soil sample were further analysed with the ImageJ software (1.54h) package to obtain CT porosity, CT macroporosity, pore length, pore size distribution, pore volume distribution, pore shape index, pore connectivity, and pore anisotropy. CT porosity, the area of CT segmented pores to the cross-sectional area of the soil sample for each slice, was calculated using the ImageJ tool Analyse Particles. CT macroporosity, defined as the volume of segmented pore clusters larger than 100 mm3 compared to the volume of the soil sample, was calculated using the ImageJ plugin Particle Analyser [31]. Pore length was measured using the ImageJ plugin Bone J after skeletonising the pore clusters and analysing the pore skeleton [31]. Macropore size distribution was calculated using the maximum inscribed sphere method using the ImageJ 3D plugin called Local Thickness. Macropore volume distribution was measured using the volume enclosed by each pore’s surface mesh using the ImageJ plugin Particle Analyser [31]. The pore shape index (PSI) was calculated using Equation (2).
where A represents the cross-sectional area and P represents the perimeter of the pore. Both A and P were calculated using the ImageJ tool Analyse Particles. A higher PSI indicates spherical pores, while a lower PSI indicates elongated pores such as cracks. Pore connectivity was determined by calculating the second moment of cluster size distribution [32] using Equation (3).
where Np is the number of all pore voxels, Ni is the number of all clusters, and nk is the number of pore voxels in cluster k. Pore connectivity can range from 0 (indicating many unconnected clusters) to 1 (indicating that all pore voxels belong to a single connected cluster). Pore anisotropy was measured using the ImageJ plugin Bone J [31]. A pore anisotropy of 0 indicates an isotropic pore structure, while a value of 1 indicates an anisotropic pore structure.
PSI = A/P2
2.6. Triaxial Tests
For each wetting and drying treatment, three samples were tested using the unconsolidated–undrained (UU) triaxial test, and the remaining three samples were tested following the consolidated–undrained (CU) triaxial test.
The UU tests were conducted after equilibrating soil samples at a matric suction of −1500 kPa on a pressure plate. The cell pressure was set at 25, 50, and 75 kN m−2 for each treatment of 3 samples. Testing three replicates at three stress levels was deemed the most suitable approach to address concerns about specimen variability affecting the results. The specimens were sheared under undrained conditions at an axial displacement rate of 0.01 mm/min until the axial strain reached 15%. The deviator stress at the failure of the soil samples was used to calculate the soil’s undrained shear strength (Su). The slope of the initial linear curve of deviator stress versus axial strain represents the soil’s undrained elastic modulus (Eu). The failure strain (εf) was determined as the point at which either the sample failed or the peak of axial stress was reached.
The CU tests were performed after saturating soil samples in a triaxial cell. The cell pressure was set as 50, 100, and 200 kN m−2 for each treatment of three samples. The effective cohesion (c′) and angle of internal friction (ϕ′) were calculated using the Mohr–Coulomb failure criterion.
2.7. Statistical Analysis
The statistical analysis was performed using IBM SPSS Statistics 28. A two-way analysis of variance (ANOVA) with a Bonferroni post hoc test was used to examine the significant differences among the treatments.
3. Results
3.1. Volumetric Behaviour of Soil
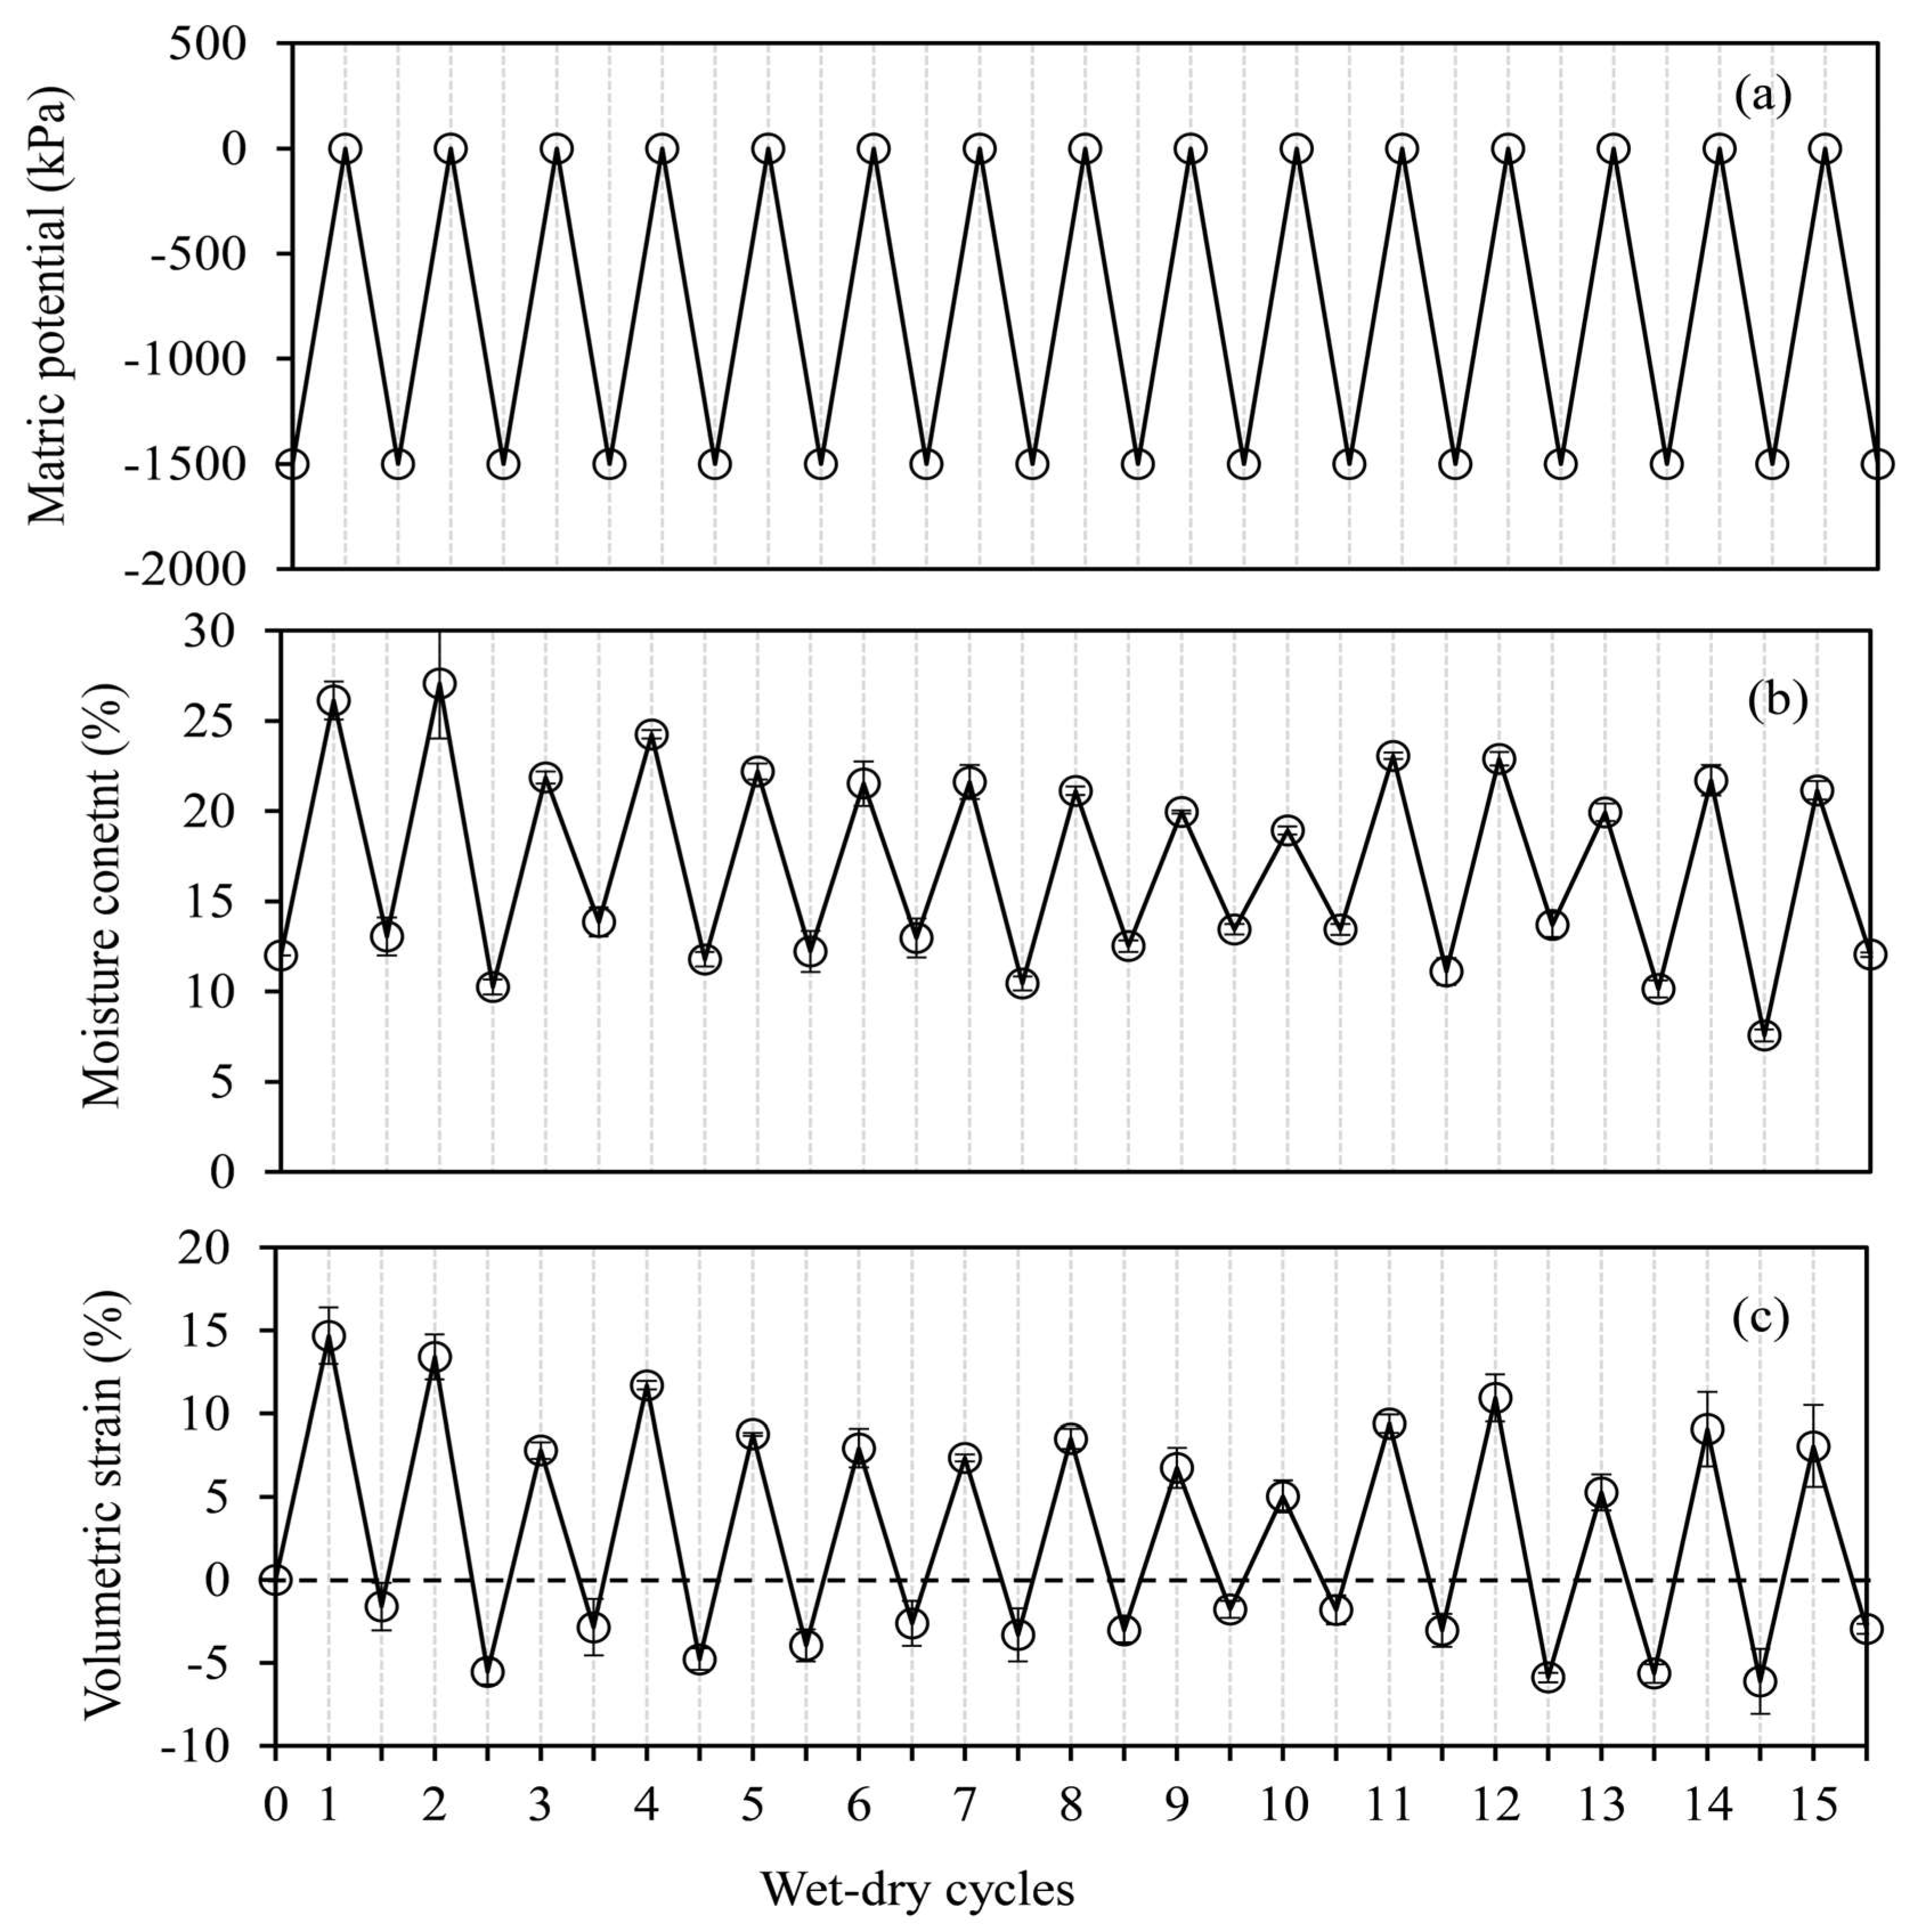
Samples were measured for volume change after each wetting and drying (wd) cycle. The initial wetting phases were relatively quick, and the moisture content at saturation was notably higher than in the following cycles. Similarly, the volume change during the initial wetting phases was significantly more higher than in the subsequent cycles (Figure 4). For the first and second wetting cycles, the moisture content of the soil samples reached 26% and 27% at saturation, respectively. In the subsequent wetting cycles, the moisture content at saturation fluctuated between 20% and 25%. During the drying cycles, the soil samples were dried to a matric suction of −1500 kPa, corresponding to a moisture content of 12 ± 3% (Figure 4b). The volumetric strain for the first two wetting cycles was almost 14%, while for the subsequent cycles, it ranged from 8% to 10% at saturation. Following the first drying cycle, the volumetric strain yielded a negative value ranging from −2% to −7% for all successive drying cycles (Figure 4c). This indicated that the soil samples experienced significant swelling and shrinking compared to their original volume during the wetting and drying cycles.

Figure 4.
(a) Matric potential, (b) average moisture content, and (c) volumetric strain (%) plotted as a function of wetting and drying cycles for the six replicates subjected to 15 wetting and drying cycles. The dotted line represents the repacked samples.
3.2. Evolution of Soil’s Pore Structure
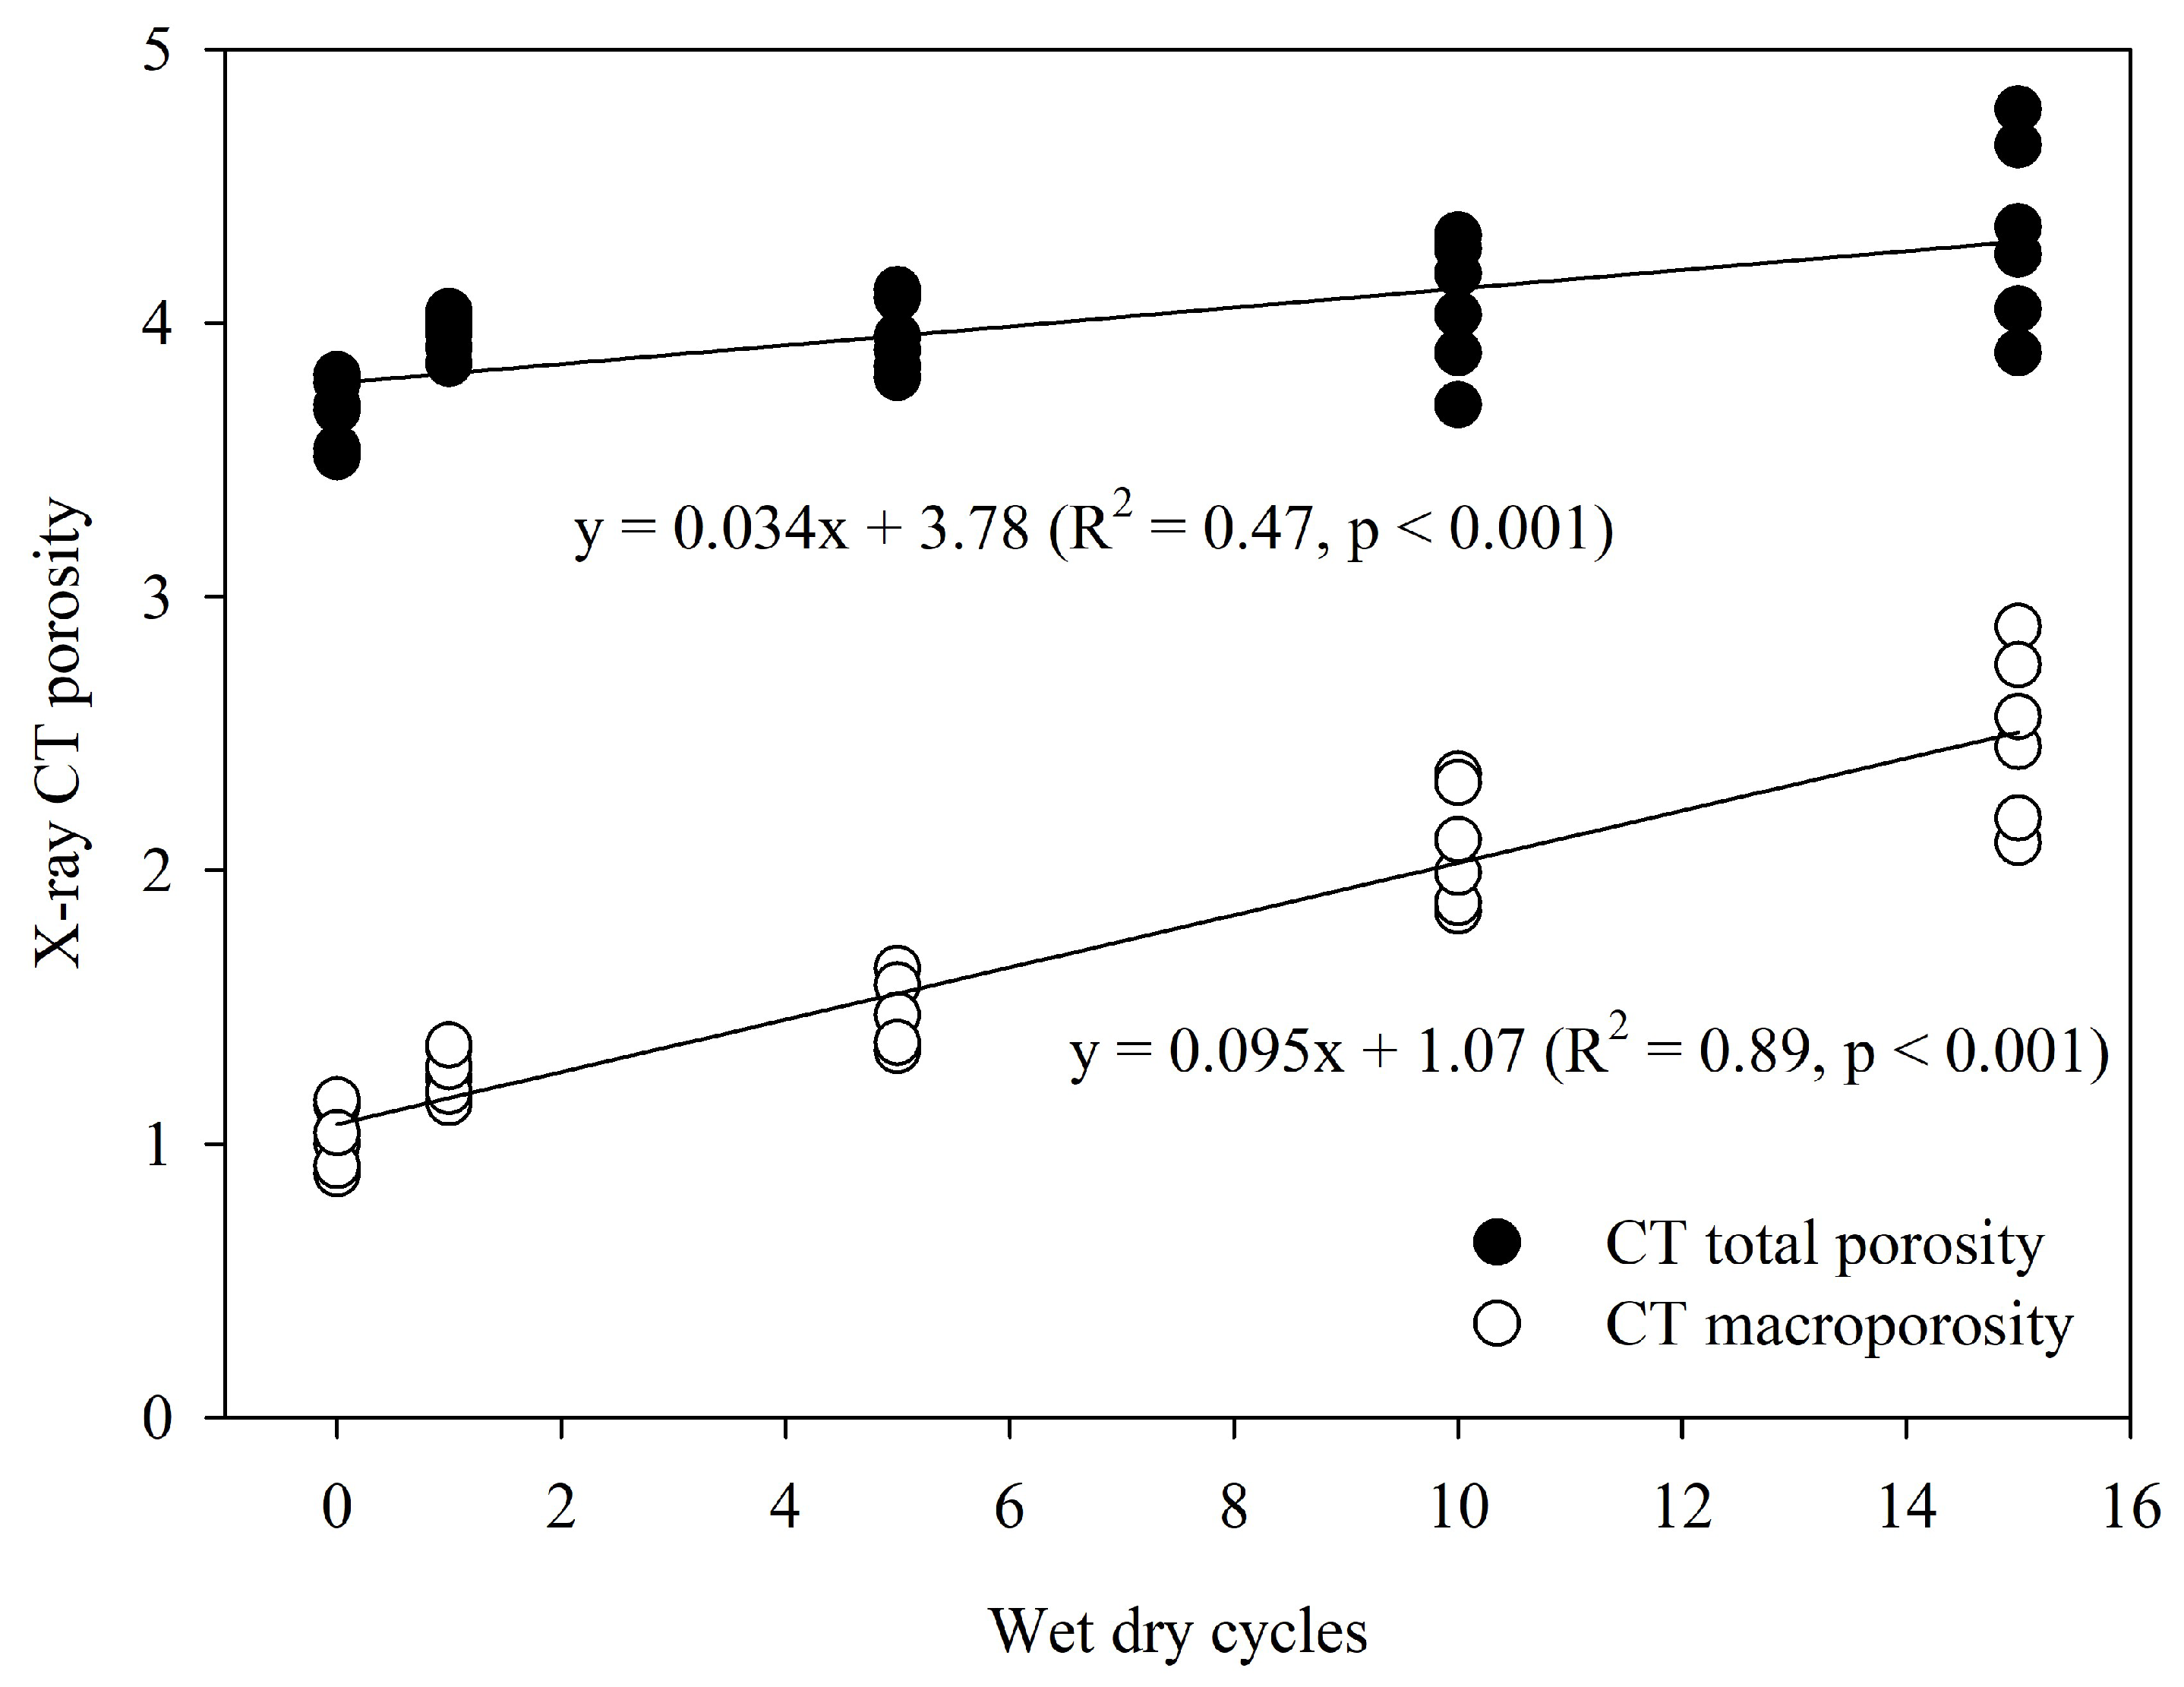
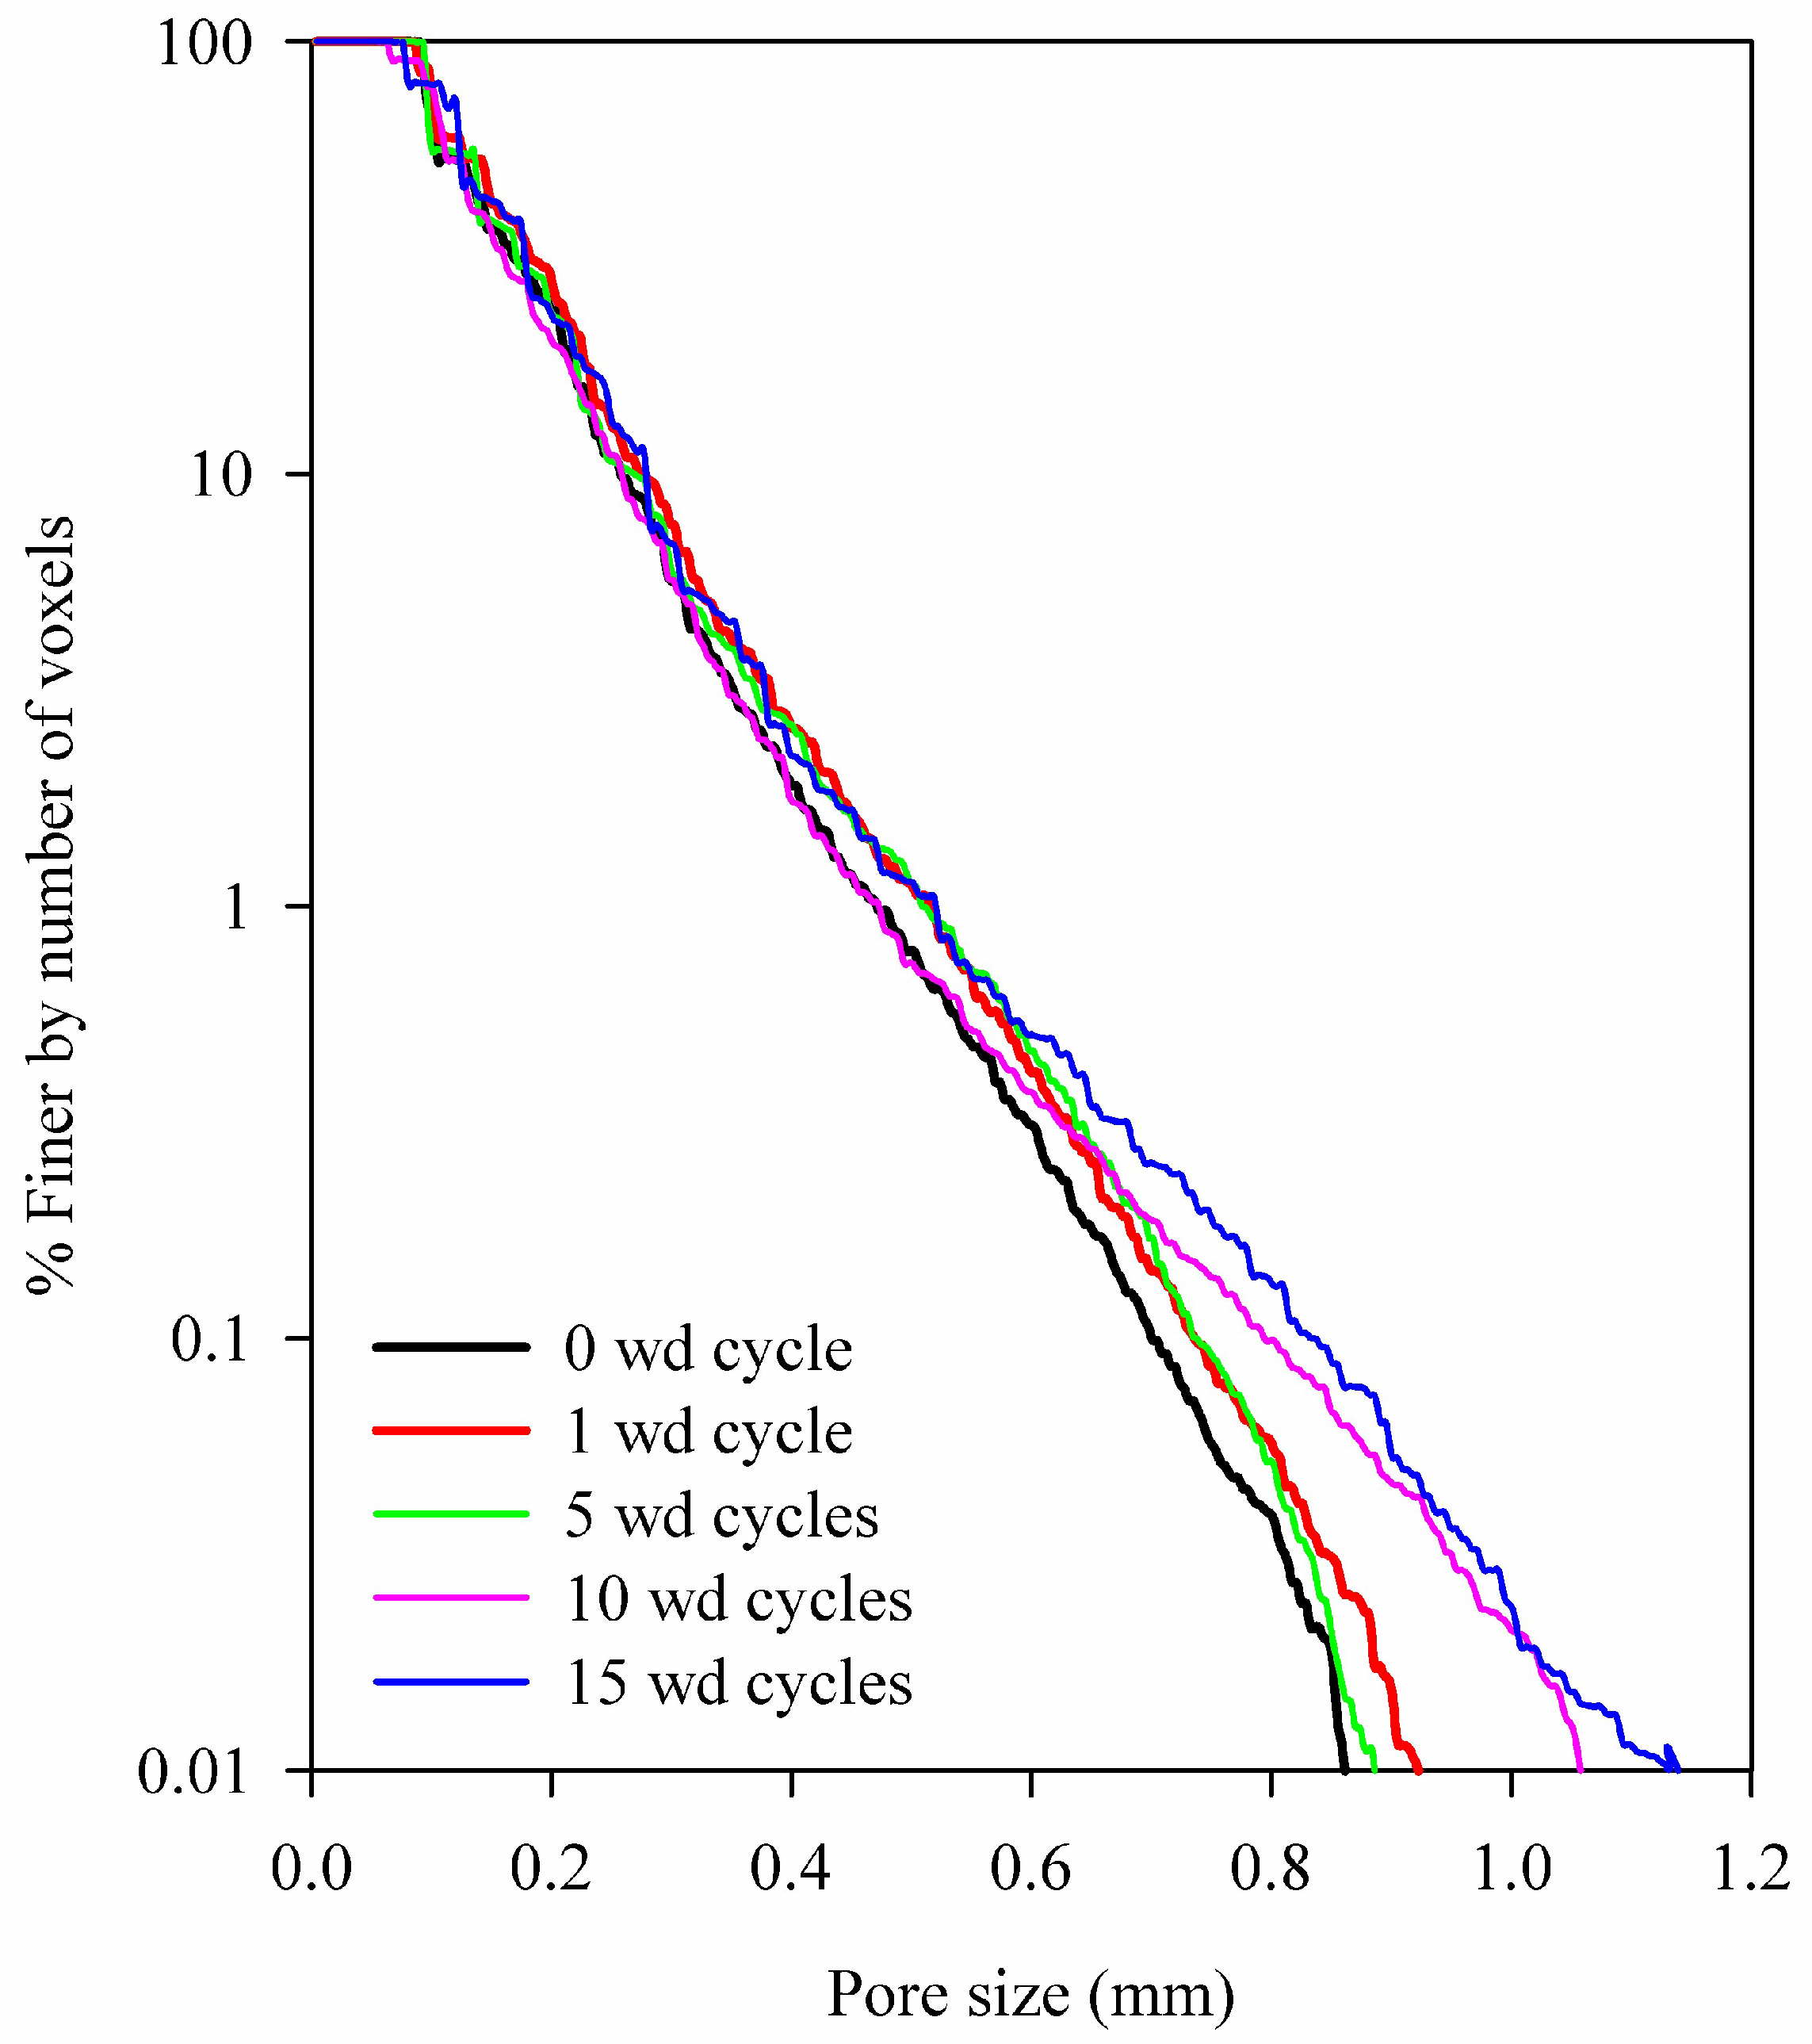
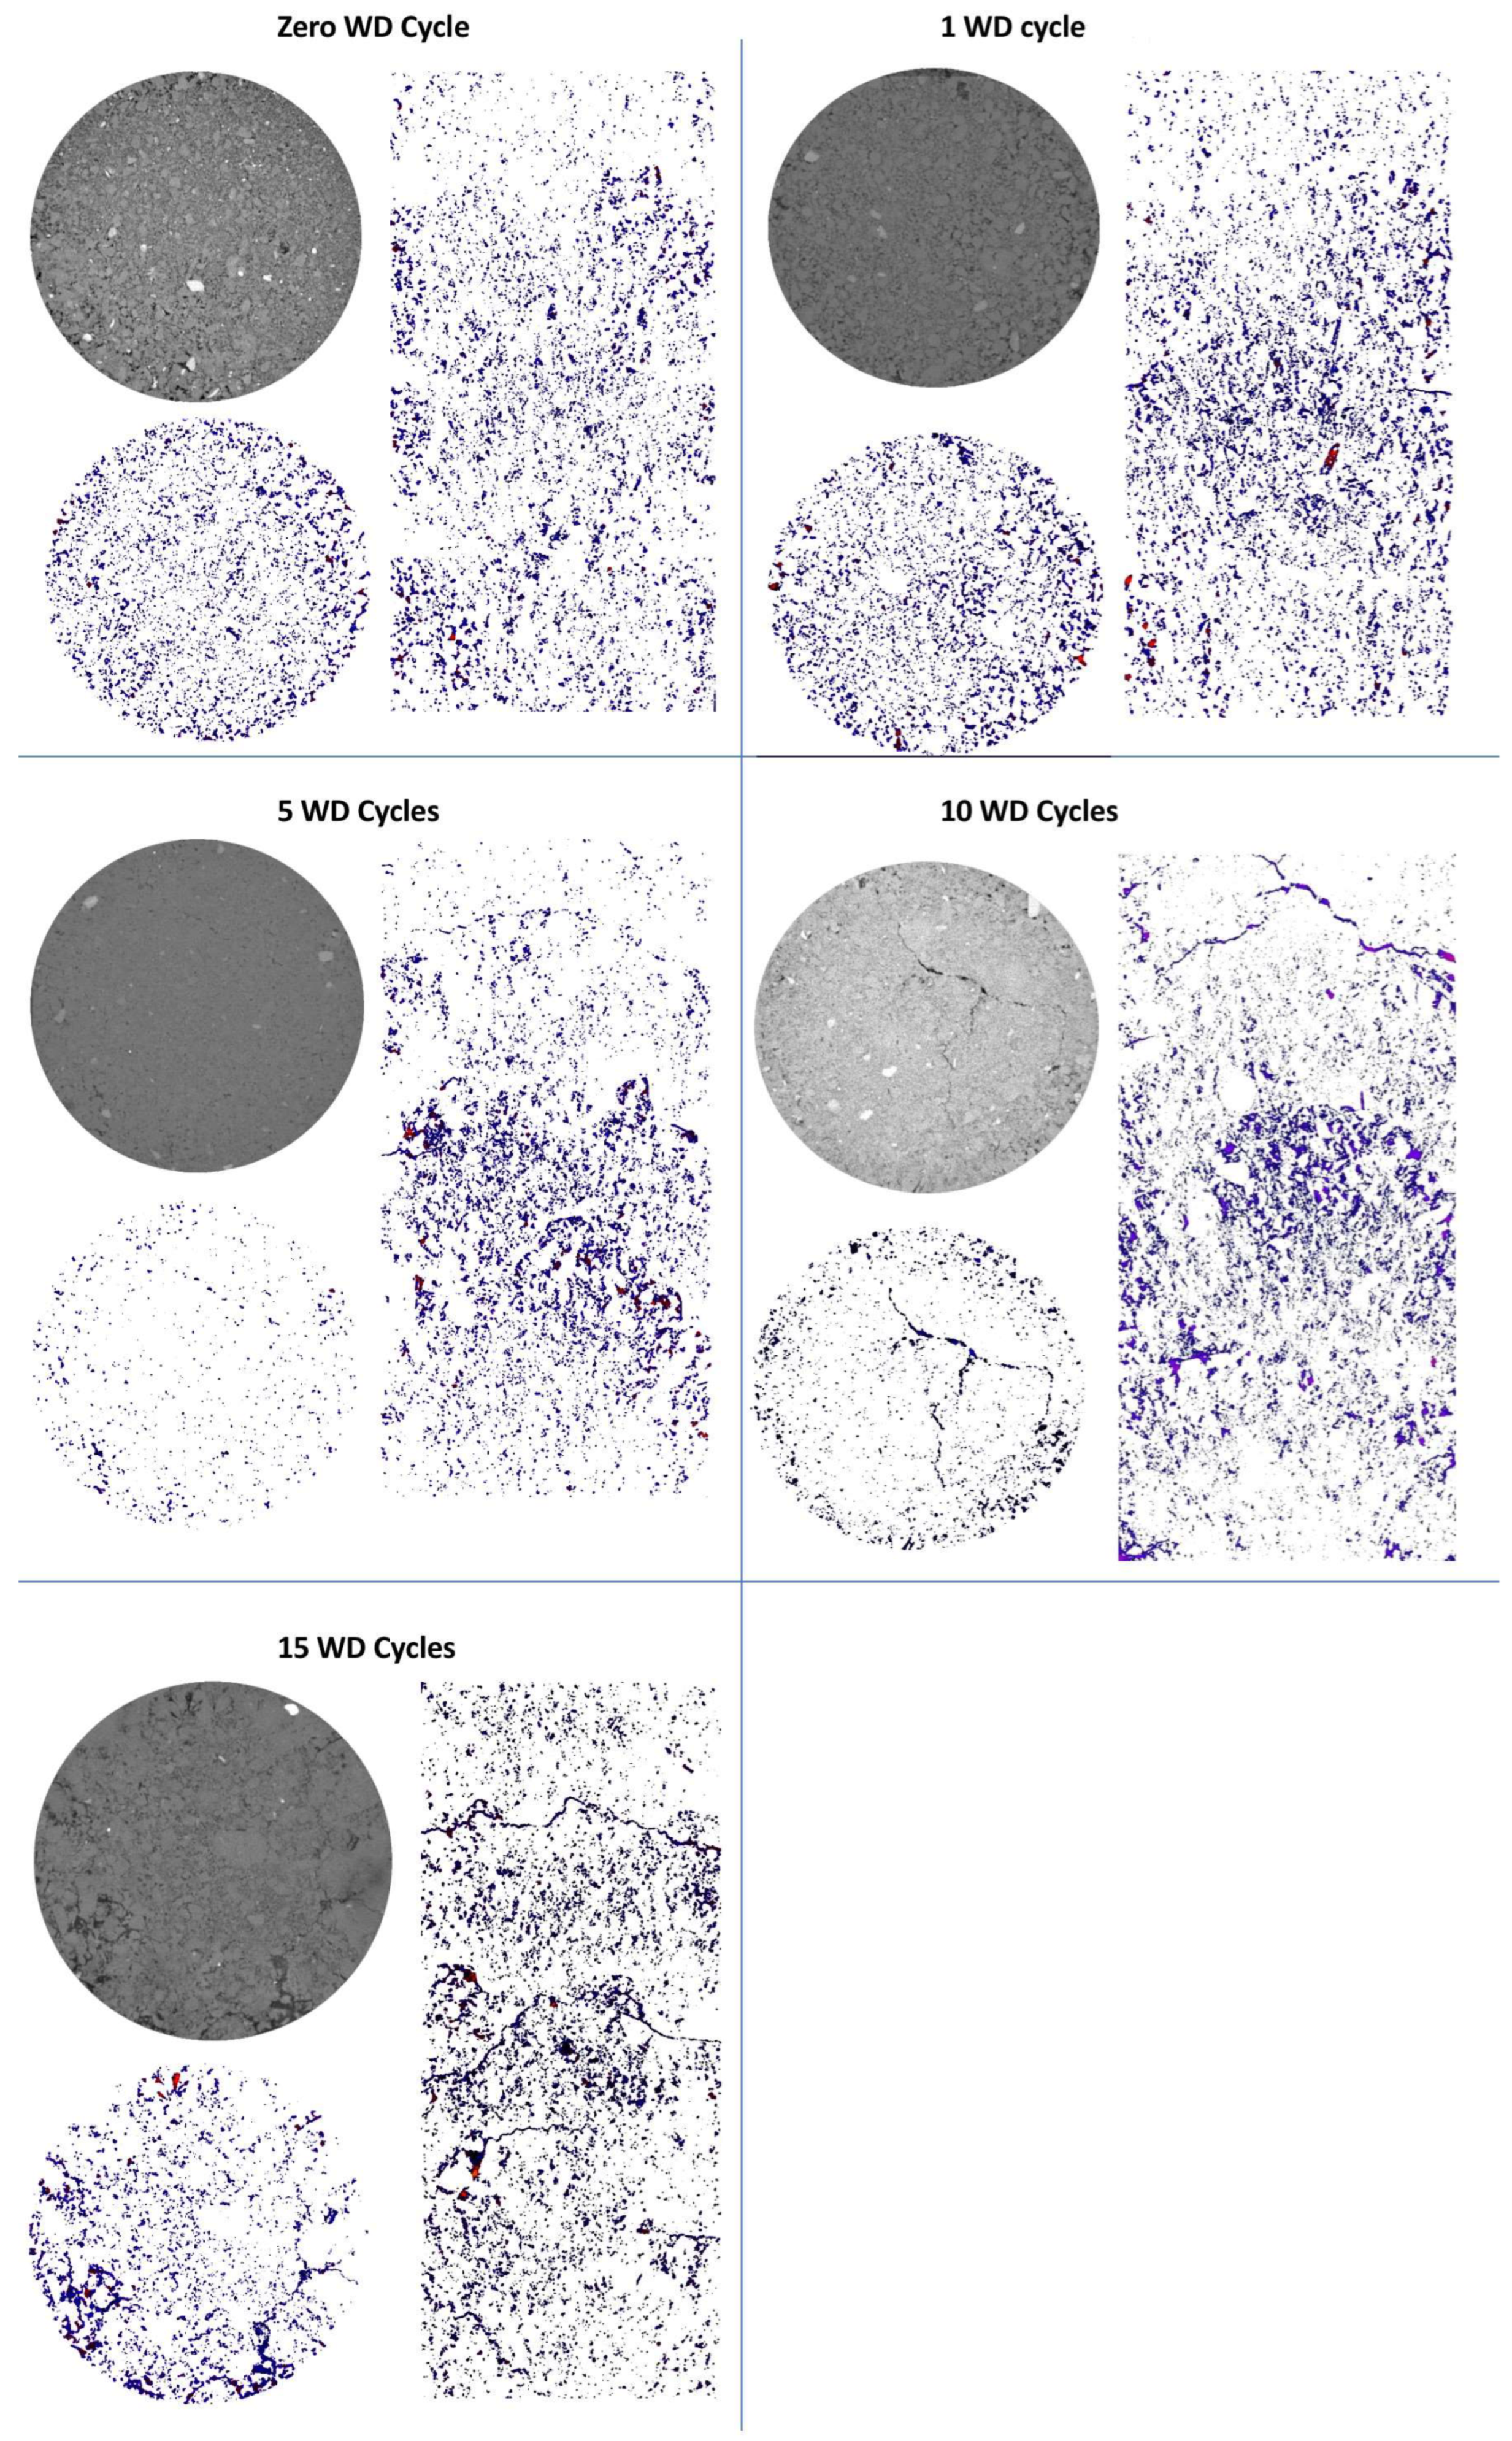
The X-ray CT porosity increased with the number of wetting and drying (wd) cycles, and CT macroporosity (based on pore clusters > 100 mm3) showed a significant positive linear correlation with wd cycles, as shown in Figure 5. Pore volume distribution for soil samples treated with 0, 1, 5, 10, and 15 wd cycles is shown in Figure 6. The pores with a volume of <0.01, 0.01–0.1, 0.1–1, 1–10, and 10–100 mm3 decreased with increasing wd cycles. However, the amount of pores with a volume of more than 100 mm3 significantly increased with increasing wd cycles (Figure 6). Specifically, the pores with a volume of more than 100 mm3 were found to be 26% at 0 wd cycles, 33% at 1 wd cycle, 43% at 5 wd cycles, 52% at 10 wd cycles, and 54% at 15 wd cycles. This indicates that pore clusters increased in volume with increasing wd cycles. The X-ray CT also analysed the pore size distribution of soil samples at 0, 1, 5, 10, and 15 wd cycles, as shown in Figure 7. The equivalent pore diameter (mm) increased with increasing wd cycles. Additionally, increasing wd cycles significantly increased pore length (m) (Table 1). This increase in pore length is attributed to the overall increase in macroporosity and the number of elongated pores with wd cycles. Pore connectivity also significantly increased with increasing wd cycles, as shown in Table 1, reflecting more connected pore clusters and fewer isolated pores with increasing wd cycles. The pore shape index (PSI) is significantly lower at 5, 10, and 15 wd cycles than at 0 and 1 wd cycles. This reduction in PSI with wd cycles indicates a decrease in spherical pores and an increase in elongated pores. The degree of anisotropy is small and quite similar for all the soil samples, irrespective of their wetting and drying treatment (Table 1). This indicates an isotropic soil pore structure in all the soil samples, regardless of their treatment. The changes in pore structure through wetting and drying cycles can be visually observed in the greyscale and segmented images (Figure 8). Many isolated pores were visible in the repacked soil samples at 0 wetting and drying cycles, disappearing after the first wetting and drying cycle, as shown in Figure 8. After five wetting and drying cycles, isolated pores reappeared between soil particles/aggregates. At ten wd cycles, along with soil pores, cracks and elongated pores were formed in interfaces between silt grain and clay particles and in the clay fractions. These cracks and elongated pores in soil samples became more prevalent and longer with increasing wd cycles, as observed after the 15-wd-cycle treatment (Figure 8).
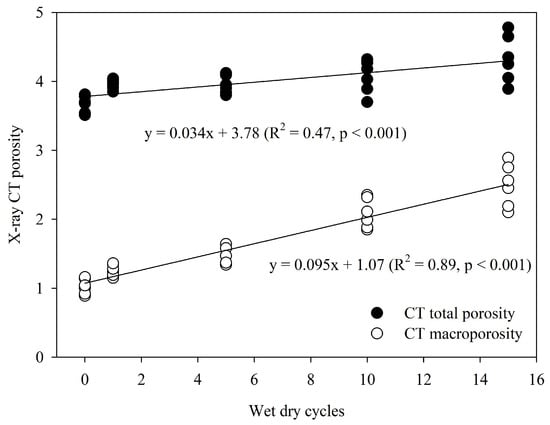
Figure 5.
X-ray CT porosity and macroporosity plotted as a function of wetting and drying cycles (6 samples per treatment).
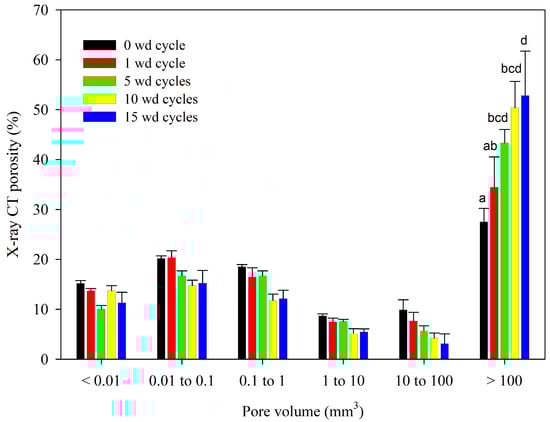
Figure 6.
X-ray CT-analysed pore volume (m3) distribution for the soil samples treated with 0, 1, 5, 10, and 15 wetting and drying cycles (6 samples per treatment), different letters show significant differences at p < 0.05.
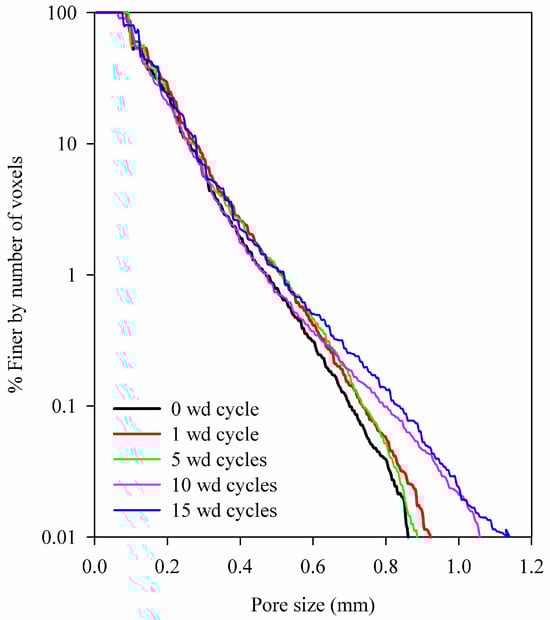
Figure 7.
X-ray CT-analysed pore size distribution (equivalent diameter) for the soil samples treated with 0, 1, 5, 10, and 15 wetting and drying cycles (6 samples per treatment).

Table 1.
Results of X-ray CT analysis of soil samples treated under different wetting and drying cycles.
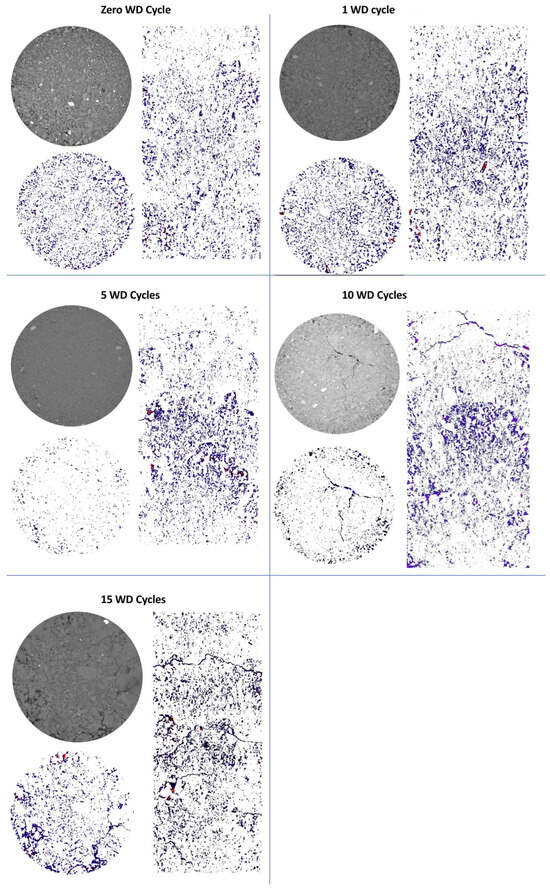
Figure 8.
Representative greyscale and segmented images for the soil samples treated with 0, 1, 5, 10, and 15 wetting and drying cycles. The left images (grayscale and segmented) show an x-y view and the right image shows an x-z view of soil columns under the labelled wetting and drying treatment.
3.3. Undrained Shear Strength of Soil
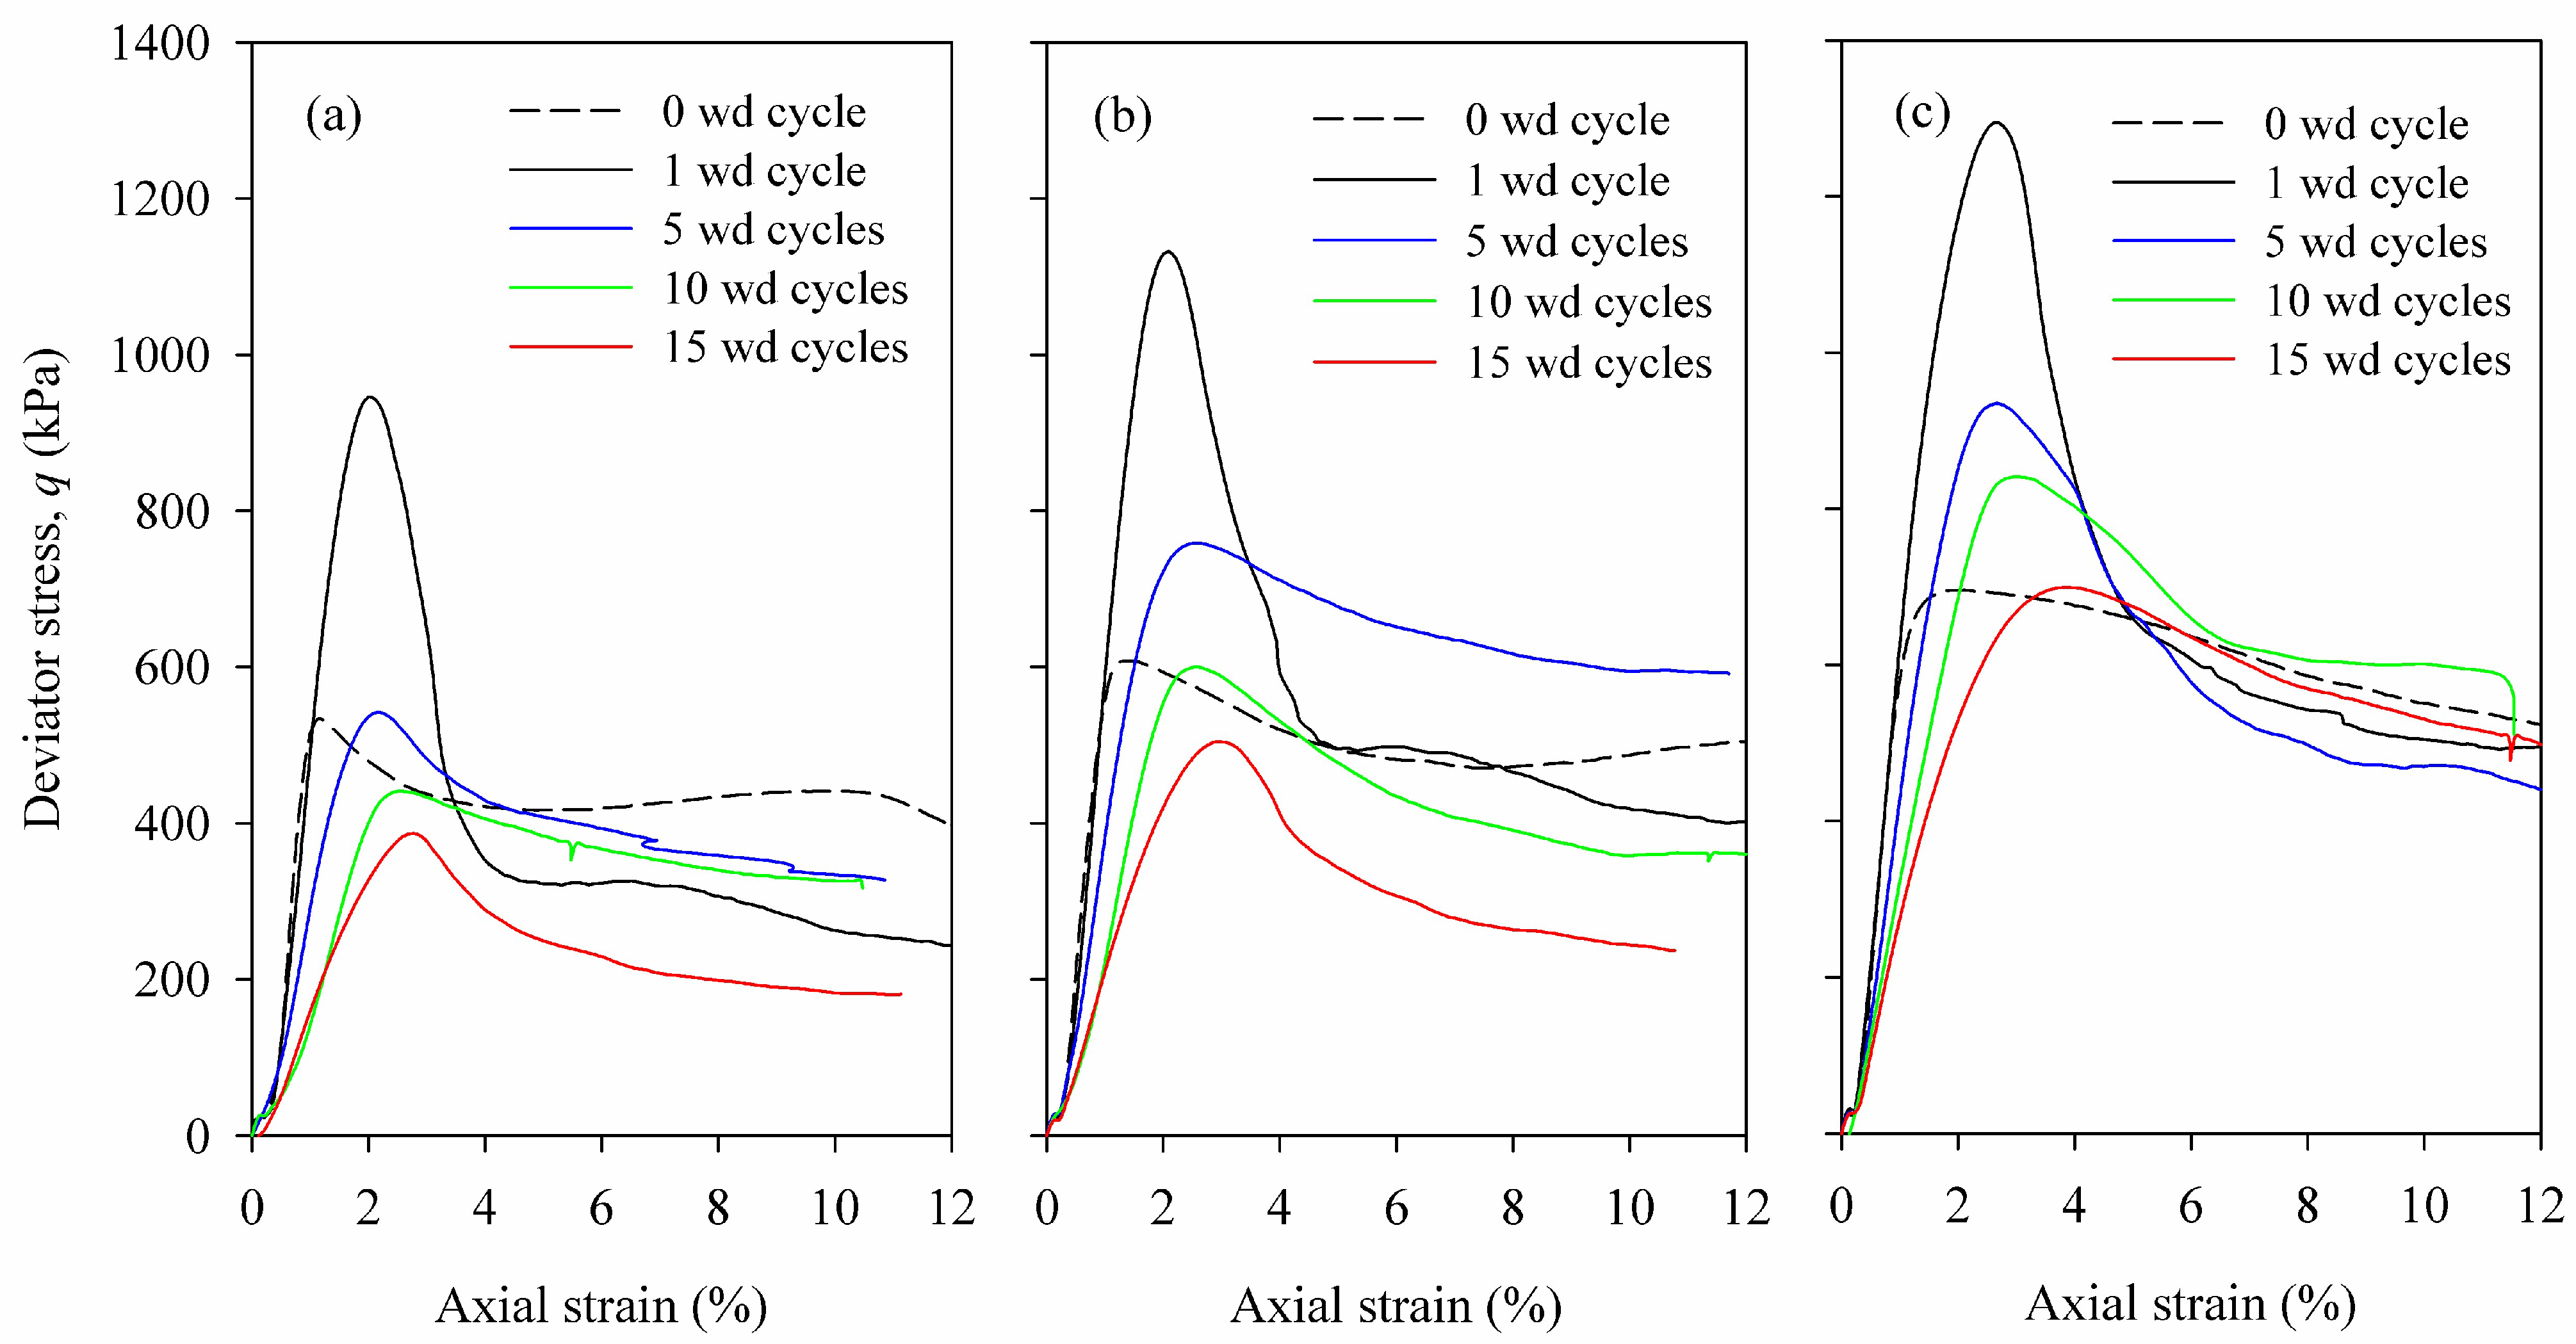
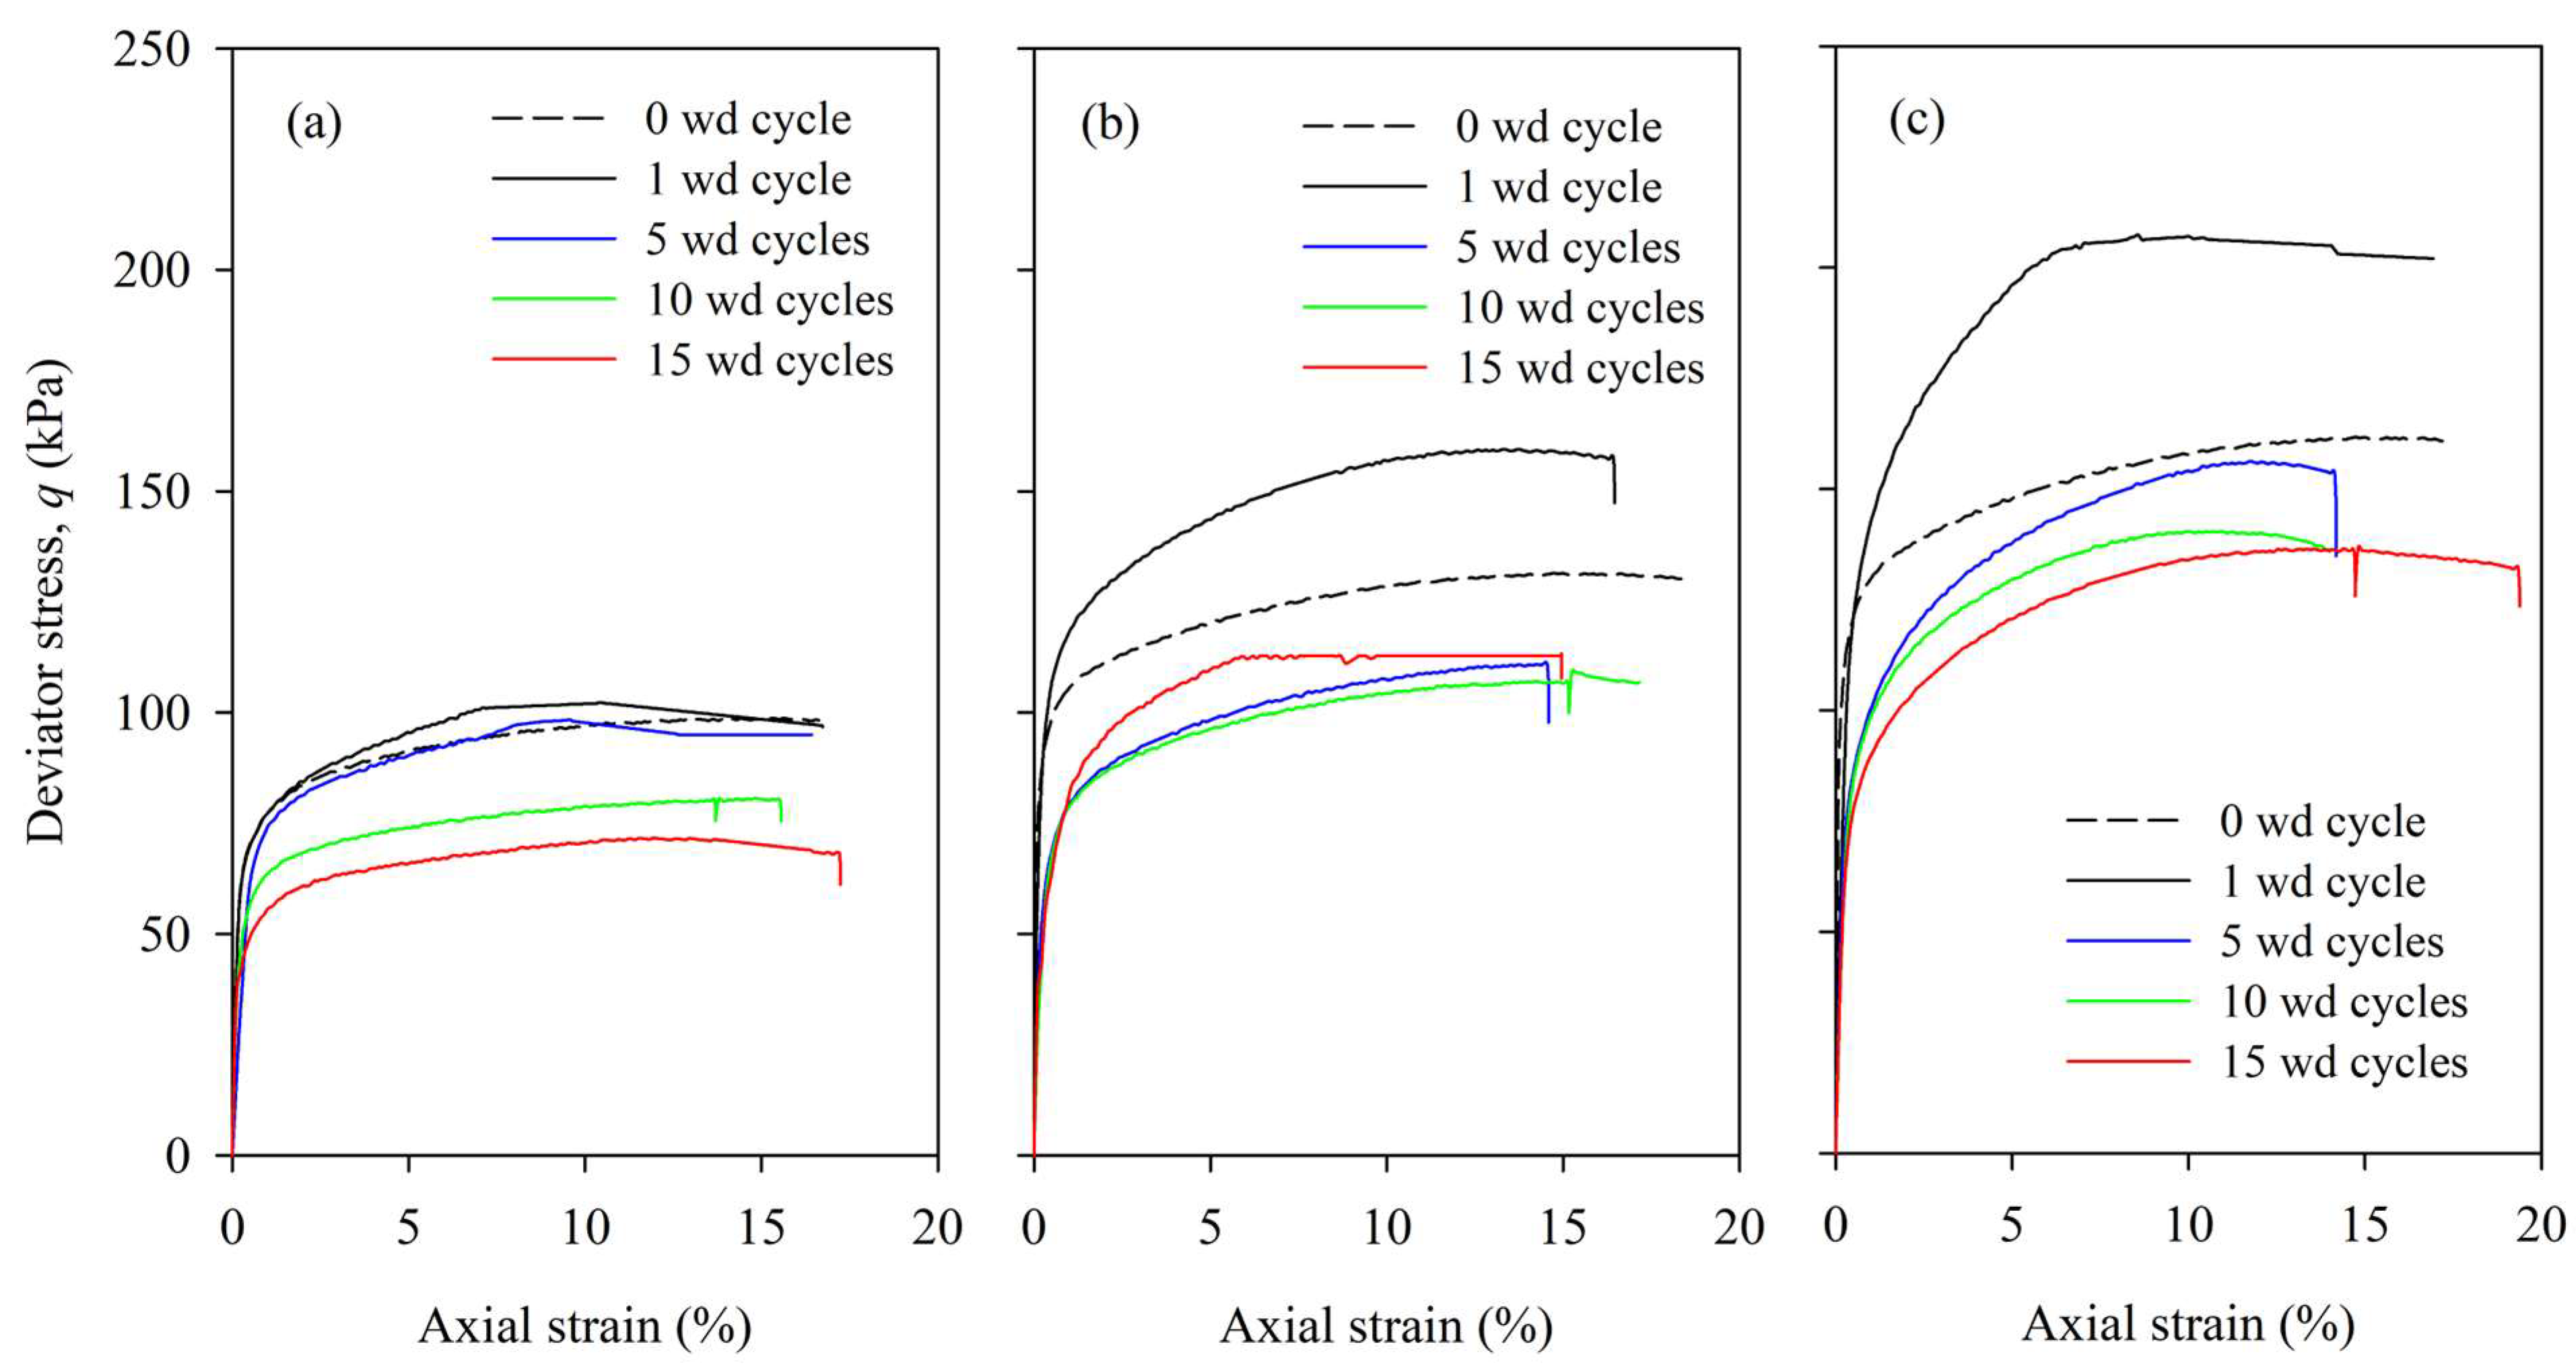
The stress-strain analysis results from unconsolidated–undrained (UU) triaxial tests indicate a decrease in peak deviator stress with increasing wetting and drying (wd) cycles, as depicted in Figure 9. Notably, a distinct peak in deviator stress at failure was observed for all the soil samples, irrespective of their treatment, The impact of wd cycles on the soil’s deviator stress versus axial strain behaviour remains consistent across different cell pressures, as illustrated in Figure 9.
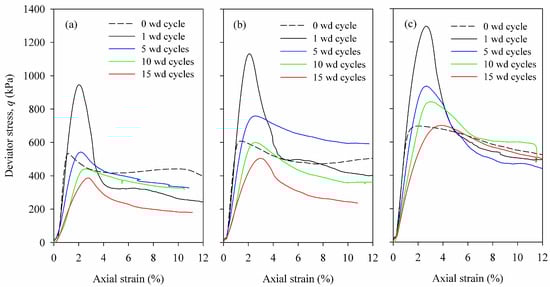
Figure 9.
The deviator stress (kPa) is plotted as a function of axial strain (%), measured using unconsolidated–undrained triaxial tests conducted at an optimum moisture content of 12% for different wetting–drying cycles under a cell pressure of (a) 25 kPa, (b) 50 kPa, and (c) 75 kPa.
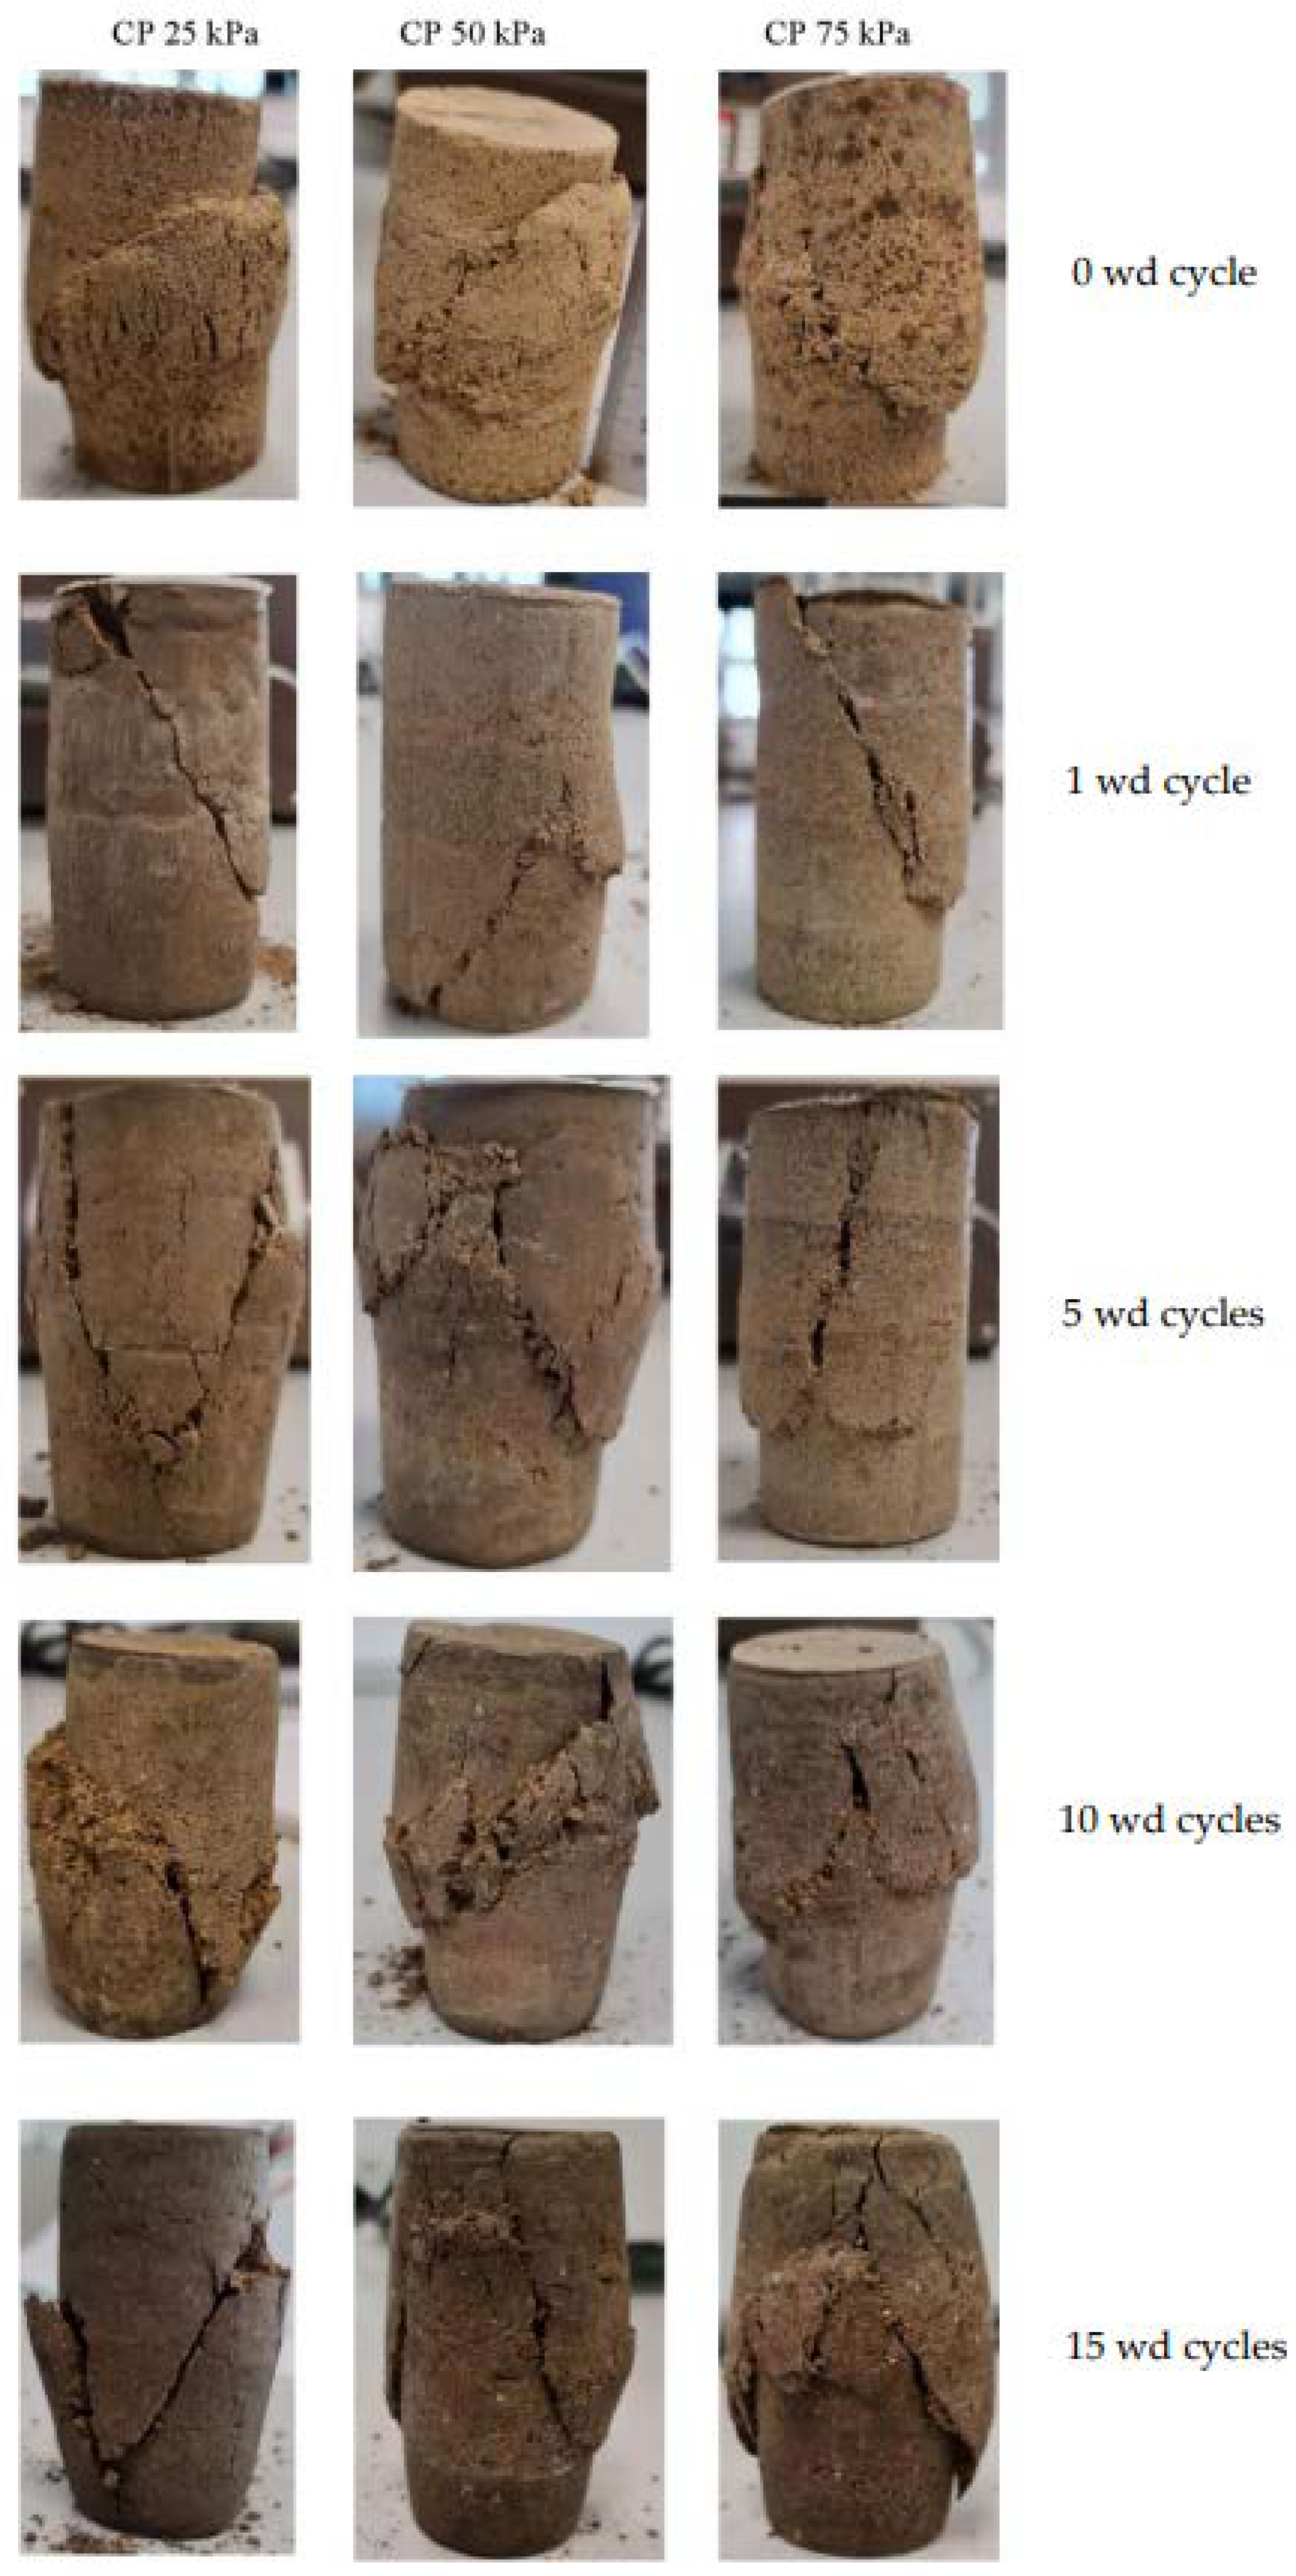
In the soil samples tested with different numbers of wd cycles, distinct failure modes were observed. For samples subjected to zero wd cycles, barrelling coupled with shear-failure mode was observed (Figure 10). In contrast, soil samples treated with one wd cycle exhibited a pure shear-failure mode. Although all the tested soil samples failed in shear-failure mode, the extent of barrelling increased with the number of wd cycles, particularly for 5, 10, and 15 cycles (Figure 10).

Figure 10.
Images of the failed soil samples were tested using unconsolidated–undrained triaxial tests, showing the failure mode for different wetting–drying cycles (CP = cell pressure, wd = wetting and drying).
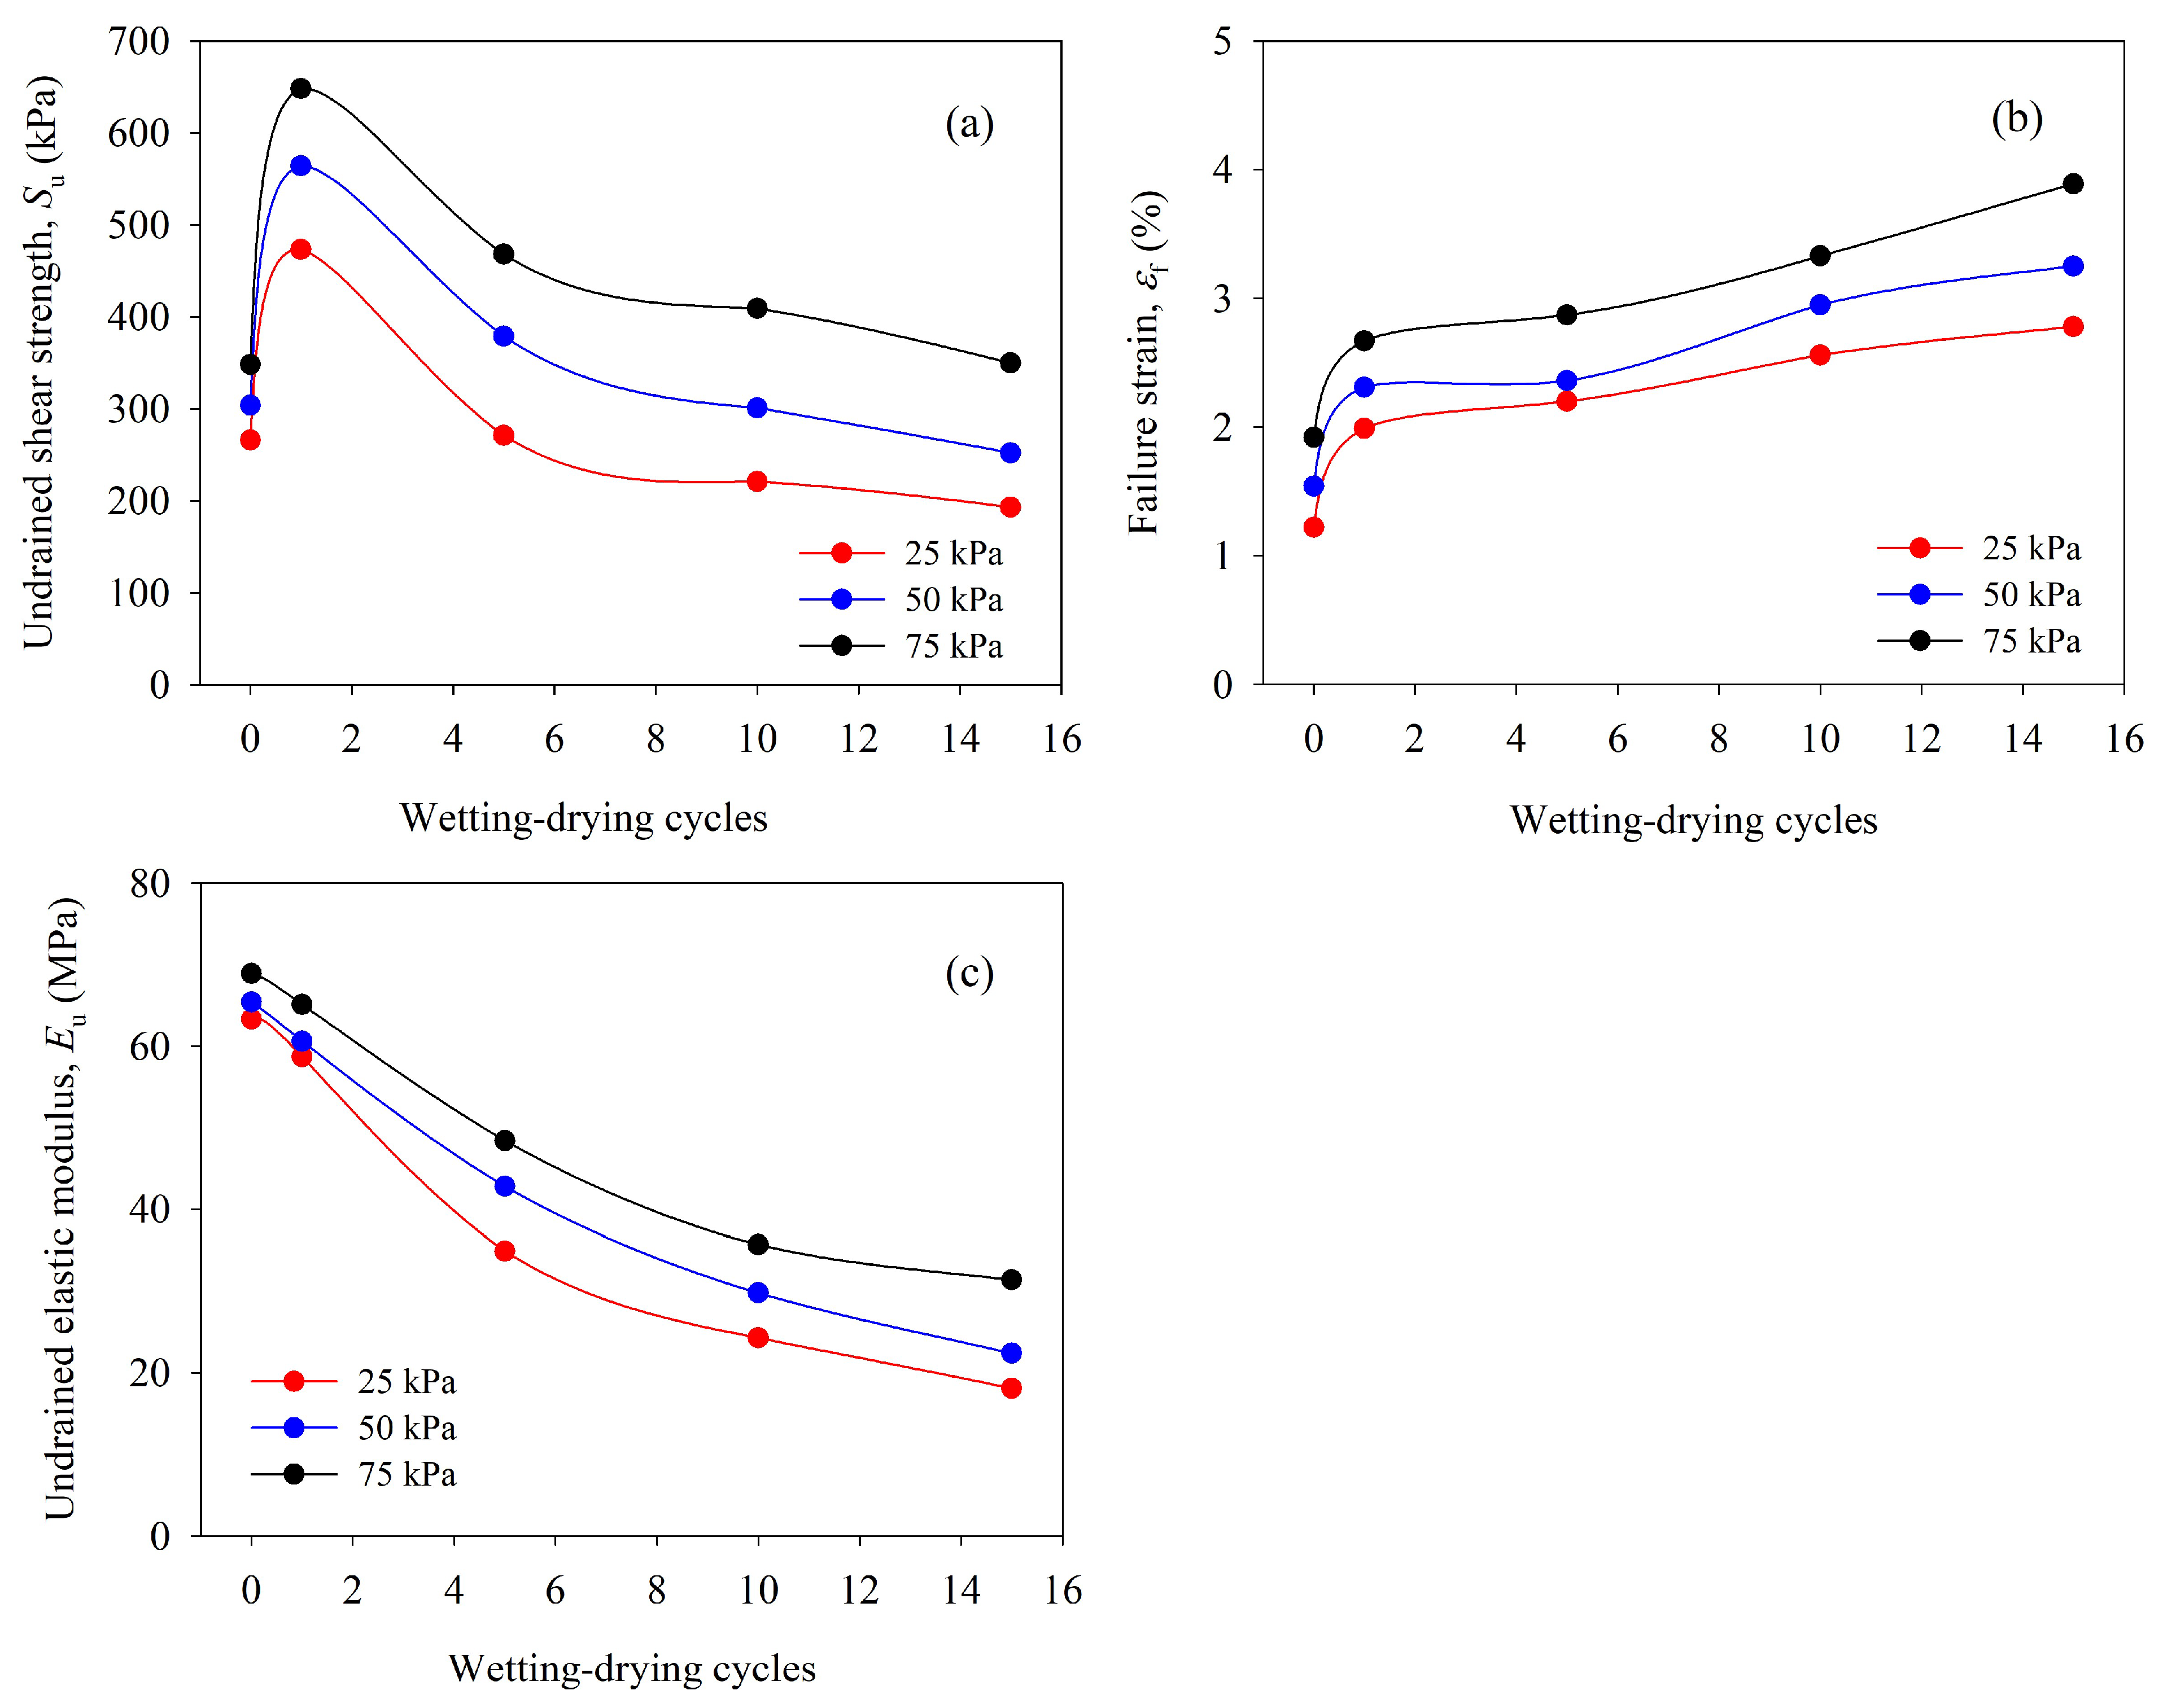
The undrained shear strength (Su) of soil decreased with increasing wd cycles, as illustrated in Figure 11a. Notably, the Su of repacked soil samples at 0 wd cycles closely resembled severely deteriorated soil samples at 15 wd cycles. At one wd cycle, the Su was measured as 473, 564, and 648 kPa under 25, 50, and 75 kPa cell pressures, respectively. In contrast, at 15 wd cycles, the shear strengths reduced to 193, 252, and 350 kPa under the same cell pressures, indicating a reduction of approximately 50%. Moreover, the failure strain increased with increasing wetting and drying cycles, as depicted in Figure 11b. Additionally, the soil’s undrained elastic modulus (Eu) decreased with increasing wetting and drying cycles, as shown in Figure 11c. The Eu was consistent regardless of cell pressure at 0 and 1 wd cycles. However, subsequent reductions in the Eu with increasing wd cycles were observed, with the most significant reduction occurring under the lowest cell pressure of 25 kPa. For instance, under a cell pressure of 25 kPa, the Eu decreased from 74.3 MPa at 0 wd cycles to 18.1 MPa at 15 wetting and drying cycles. Similarly, under 50 kPa and 75 kPa cell pressures, the Eu decreased from 68.6 MPa to 22.4 MPa and 68.9 MPa to 31.4 MPa, respectively, over the same wetting and drying cycles.
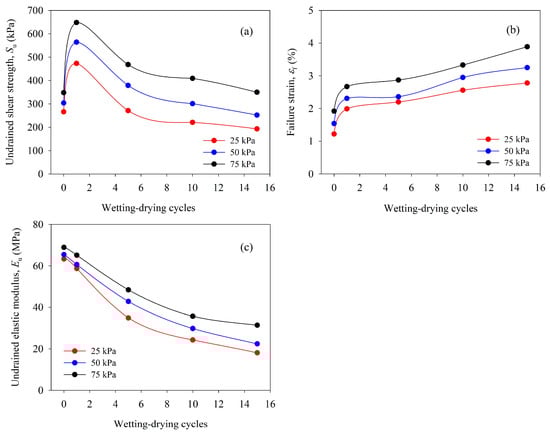
Figure 11.
The (a) undrained shear strength, (b) failure strain, and (c) undrained elastic modulus plotted as a function of wetting and drying cycles.
3.4. Effective Shear Strength of Soil
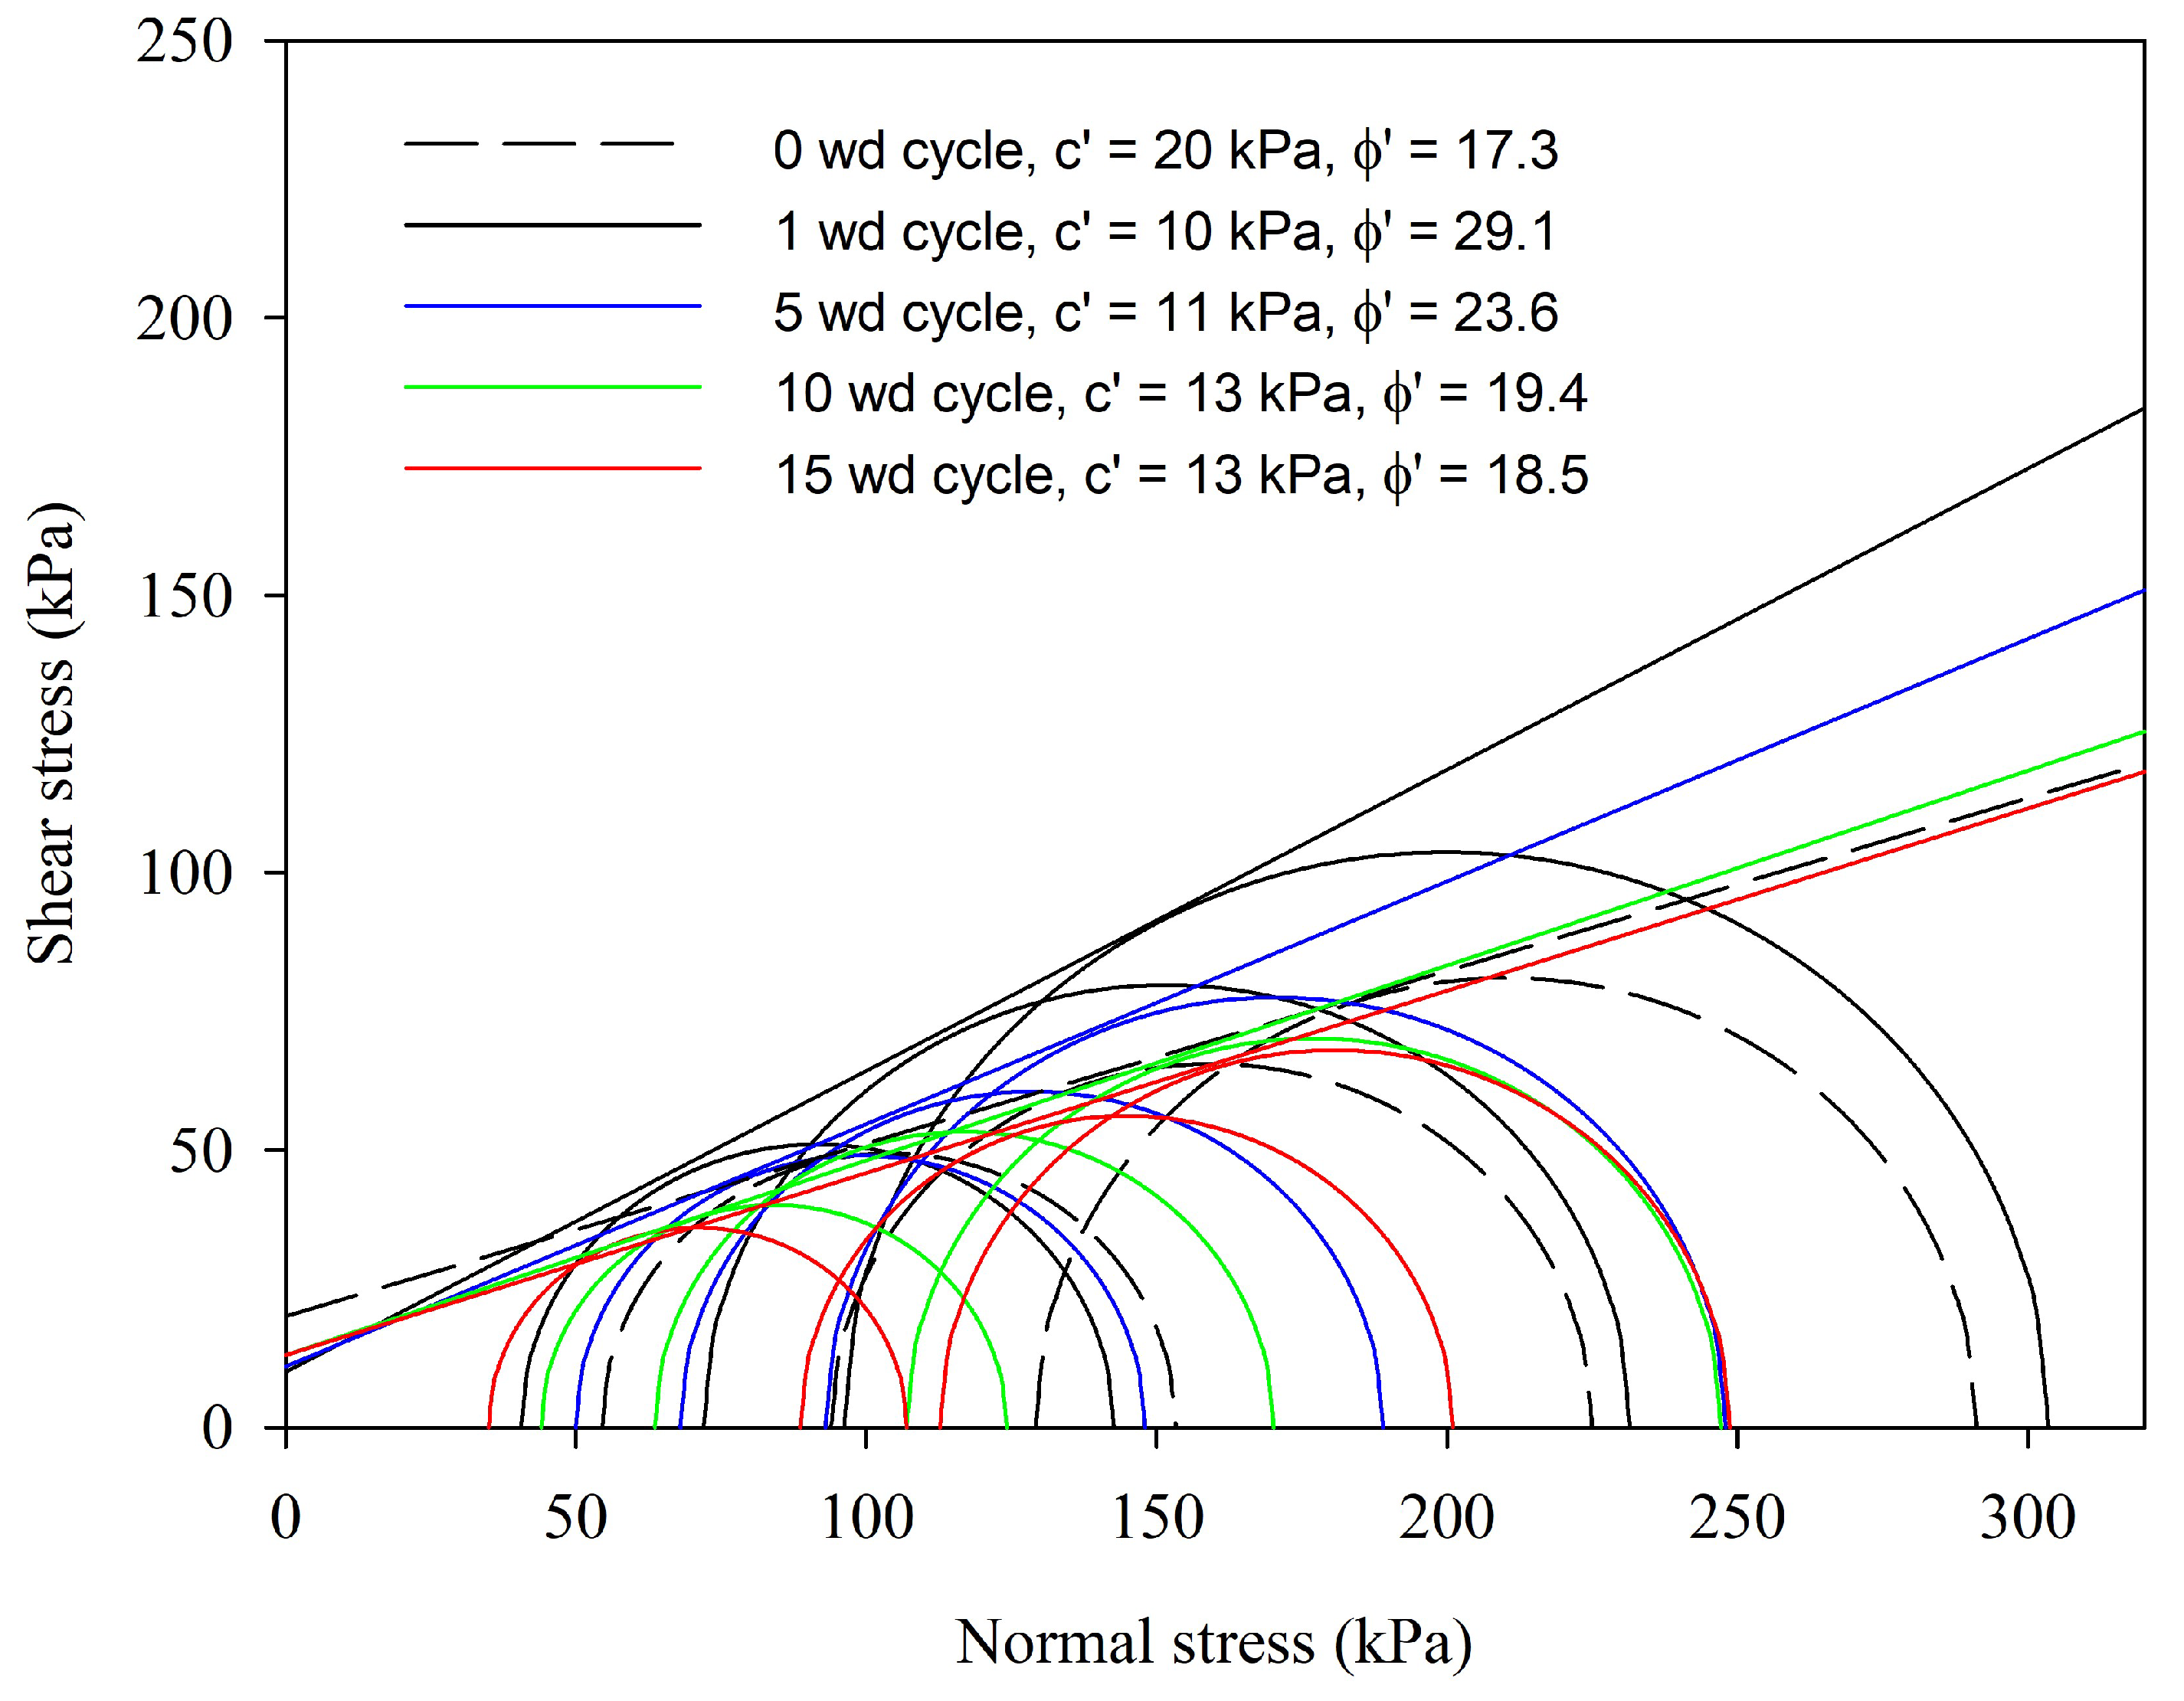
The consolidated–undrained (CU) triaxial test results demonstrate the relationship between deviator stress and axial strain, as depicted in Figure 12, across various confining pressures and wetting and drying cycles. Most stress–strain responses exhibit strain-hardening behaviours. Notably, the highest deviator stress was measured for a single wd cycle, after which the deviator stress consistently decreased with increasing wd cycles regardless of the cell pressure. At one wd cycle, the effective cohesion was measured as 10 kN/m2, and the effective angle of internal friction was 29.1 degrees. While the effective cohesion of the soil remained constant, the effective angle of internal friction diminished with increasing wd cycles, as depicted in Figure 13. Following 15 wd cycles, the effective cohesion was 13 kN/m2, and the effective angle of internal friction diminished to 18.5 degrees, marking a 36% reduction in the soil’s internal friction angle. The effective angle of internal friction of the repacked soil (at 0 wd cycle) closely resembled that of severely deteriorated soil (at 15 wd cycles).
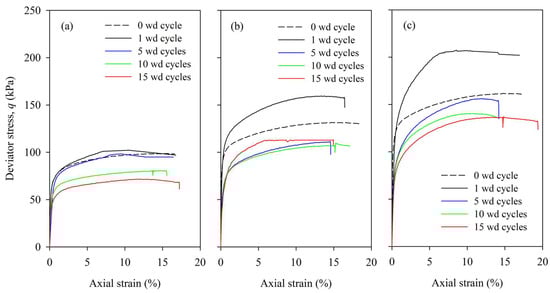
Figure 12.
The deviator stress (kPa) is graphed against axial strain (%) measured using consolidated–undrained triaxial tests for different wetting–drying cycles under cell pressures of (a) 50 kPa, (b) 100 kPa, and (c) 200 kPa.
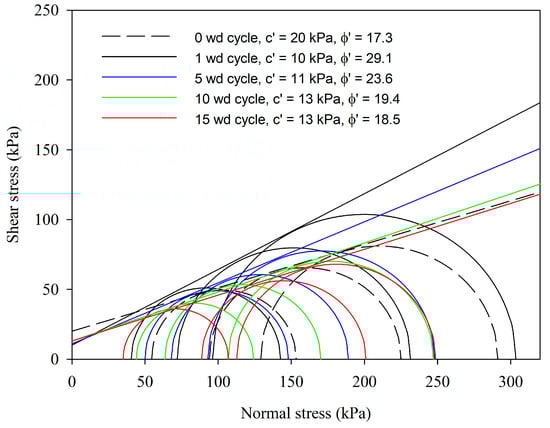
Figure 13.
Mohr circles plotted as a function of wetting and drying cycles for the calculation of effective cohesion (c′) and angle of internal friction of soil (ϕ′).
3.5. Correlation Analysis
The analysis revealed significant negative correlations between the number of wetting and drying cycles and the undrained shear strength and the undrained elastic modulus of the soil. Conversely, a positive correlation was observed between the failure strain and wetting and drying cycles (Table 2). Results from the multiple linear regression modelling show that the number of wetting and drying cycles (N) and cell pressure (CP) are the best predictors for undrained shear strength, failure strain, and undrained elastic modulus of the soil, as demonstrated in Equations (4)–(6).
Su = 351.7 − 19.8N + 3.58CP (R2 = 0.89, p < 0.001, RMSE = 44)
εf = 1.39 − 0.073N + 0.016CP (R2 = 0.96, p < 0.001, RMSE = 0.1)
Eu = 48.5 − 2.61N + 0.22CP (R2 = 0.92, p < 0.001, RMSE = 4.25)
Table 2.
Spearman’s correlation analysis between X-ray computed tomography-derived parameters and soil shear strength treated with different wetting and drying cycles. The * represents a significant difference at p < 0.05.
The soil’s internal friction angle also exhibited a significant negative correlation with wetting and drying cycles, as indicated in Table 2. The recurrent shrinkage and swelling of soils induced irreversible changes in soil pore structure and led to more prominent pore clusters and crack formation in soil samples that affected the mechanical behaviour of soil significantly, as discussed above. This is confirmed in Table 2, where X-ray CT-derived macroporosity, pore diameter, pore shape index, and pore length are shown to be the significant predictors for undrained shear strength, undrained elastic modulus, and angle of internal friction of soil subjected to increasing wetting and drying cycles.
4. Discussion
The soil samples underwent significant shrinkage and swelling due to wetting and drying (wd) cycles. These cyclic changes in soil volume led to permanent alterations in pore structure and the formation of cracks. Wetting resulted in a gradual increase in both the quantity and size of intra- and interaggregate pores [33]. The evolutionary characteristics of soil microstructure during the wetting process are closely associated with the wetting conditions. Under unconfined conditions, aggregates expand and break into smaller aggregates, increasing intra and interaggregate pore sizes, with the former being dominant [34]. In confined wetting, interaggregate pores gradually close, while the volume of intra-aggregate pores increases [35,36]. Our findings align with the latter, as our soil samples were also partially confined during wetting. Conversely, during the drying process, soil suction increases, and the total volume decreases. The significant shrinkage of macropores primarily causes this, while the micropores remain unchanged or slightly increase [37]. Repeated wetting and drying cycles result in cumulative deterioration within the soil, leading to the broadening enlargement of localised weak zones, characterised by developing cracks at the mesoscopic scale [38]. This is confirmed by X-ray CT analysis of soil samples subjected to increasing wetting and drying cycles in this study. The results suggest that soil samples exposed to repetitive wd cycles exhibited higher macroporosity, pore diameter, pore volume, pore connectivity, and increased length of cracks and elongated pores. These findings align with several studies conducted in the last decade, where researchers simulated wd cycles and performed quantitative analysis of soil pore structure using image processing techniques such as CT [39], SEM [40], and MIP [41]. It is widely acknowledged that the soil pore structure undergoes significant changes after experiencing wd cycles. For example, Pires et al. [21] found macroporosity percentages of 6%, 9%, and 10% at 0, 6, and 12 wd cycles on undisturbed topsoil samples. Similarly, Diel et al. [20] observed increased macroporosity with wd cycles. Clayey soils generally shrink and swell upon wetting and drying. The expansion and contraction of such soils caused by wetting and drying processes are not entirely reversible phenomena, leading to an increase in macropores and pore length and a decrease in micropores. This rise in macropores and pore length is attributed to the development of nonuniform volumetric strain after a series of wetting and drying cycles. Additionally, the wetting and drying of soils progressively interconnect more isolated pores, resulting in an overall enhancement of pore connectivity [42]. At the same time, the decrease in micropores due to wetting and drying cycles is believed to stem from the coalescence of soil aggregates [43].
The repeated wetting and drying cycles caused irreversible structural changes that significantly reduced the soil’s undrained shear strength and elastic modulus. Previous studies have reported similar findings [5,6,7,8,9,12,13,14]. Understanding the effective shear strength of clayey soil is crucial for assessing the long-term stability of foundations, slopes, and other engineering projects. It can also help in predicting future stability and safety warnings. Our research revealed that the effective angle of internal friction of the soil significantly decreased with increasing wetting and drying cycles. In contrast, the effective cohesion of the soil remained relatively unaffected. Fewer studies have been reported on the drained/effective shear strength of soil influenced by wetting and drying cycles, and contradictory findings are present in the literature. For instance, Zhou et al. [38] found that the internal friction angle fluctuates within a narrow range, while the reduction in cohesion is the primary cause of shear strength degradation during wd cycles. Zhu et al. [41] and Khan et al. [11] reported a decrease in both cohesion and angle of internal friction of soil with wd cycles for expansive soils. Hafhouf et al. [44] reported a significant reduction in cohesion but an increase in the angle of internal friction of Sebkha soil with wd cycles. The deterioration of soil shear strength due to wetting and drying cycles results from interactions across multiple levels. The accumulation of damage at the microscopic level is manifested in the formation and propagation of cracks at the mesoscopic level. The structural degradation triggered by the microscopic and mesoscopic levels eventually causes a decline in the macroscopic mechanical performance of the soil with increasing wd cycles. These three levels are interconnected, influencing each other and progressing step by step, collectively constituting the complex mechanism of structural response in soils under the influence of wetting and drying cycles.
Crack formation in soils is a significant problem in earth-based infrastructure and other disciplines [45,46]. Shrinkage cracks can cause severe damage to the serviceability of earth-based infrastructure. In recent years, significant effort has been directed to better analyse ground and climate interactions as applicable to a range of earth-based structures. It is essential to mention that different soil types will likely present different results under wetting and drying cycles. Clay minerals present in the soil can differ considerably in several properties, such as specific surface area and shape of the minerals, which will influence the clay particle dynamics under wetting and drying [47]. For example, we would expect less severe changes in the soil structure due to the wetting and drying cycles for sandy soils compared to clayey soils, as investigated in our work. This means the impact of wetting and drying cycles on the performance of earth-based structures depends on the soil type and mineralogy. Further, the magnitude and rate of soil shrinkage and swelling during wetting and drying cycles are influenced by the stress state. The soil samples in a free state (as in our study) swell more than soil samples under stress upon wetting. Additionally, the shrinkage of soil samples during drying is a nonlinear process, and it is influenced by the stress state as well [48]. Chiu and Ng et al. [49] demonstrated that soil samples under stress exhibit greater shrinkage than those in an unstressed state at a given suction. Therefore, the stress state under which wetting and drying of soil samples occurs should be considered when interpreting soil behaviour [48].
The wetting and drying cycles adopted in this research cover one of the indicators of climate change. Another parameter that could be considered is temperature change. So, the combination of wetting and drying at different temperatures would provide a better understanding of the effect of climate change on the serviceability of earth-based structures. Thus, in the future, such studies should be carried out on a range of soil types with different mineralogies under more comprehensive climate change treatments to develop a universal model to predict the impact of climate change on the design, construction, and performance of earth-based infrastructure.
5. Conclusions
This study aimed to examine how multiple wetting and drying cycles affect the volumetric change, micro soil pore structure, and mechanical behaviour of clayey soil. X-ray computed tomography was used to analyse the soil pore structure, while unconsolidated–undrained and consolidated–undrained triaxial testing was conducted to study the stress–strain behaviour of the soil samples. The key findings of this study are as follows:
- The soil samples exhibited notable shrinkage and swelling when subjected to wetting and drying cycles. Volumetric strain ranged from +12% at saturation to −6% at a matric potential of −1500 kPa.
- Shrinkage and swelling induced irreversible changes in the soil pore structure, leading to higher macroporosity, larger pore diameter, increased pore volume clusters, and longer pore length in soil samples with more wetting and drying cycles.
- The soil’s average undrained shear strength decreased the most, by 34%, after the first five wetting and drying cycles at cell pressures of 25, 50, and 75 kN/m2. This reduction was followed by an 11% decrease as the cycles increased from 5 to 10. A further 8% reduction was observed for the wetting and drying cycles from 10 to 15.
- The effective angle of internal friction of the soil decreased the most, by 19%, after the first five wetting and drying cycles. A further 14% reduction was observed as the cycles increased from 5 to 10. However, during 10 to 15 wetting and drying cycles, only a nominal reduction of 3% in the effective angle of internal friction of soil was observed.
- Correlation analysis revealed significant negative correlations between the number of wetting–drying cycles, CT-derived macroporosity, pore diameter, and pore length with undrained shear strength, undrained elastic modulus, and the effective angle of internal friction of the soil.
Author Contributions
Conceptualization, M.N. and K.S.T.; methodology, M.N., K.S.T. and S.S.A.S.; formal analysis, M.N. and K.S.T.; investigation, M.N., K.S.T. and S.S.A.S.; writing—original draft preparation, M.N. and K.S.T.; writing—review and editing, M.N., K.S.T. and S.S.A.S.; visualisation, M.N., K.S.T. and S.S.A.S.; supervision, M.N.; project administration, M.N.; funding acquisition, M.N. and K.S.T. All authors have read and agreed to the published version of the manuscript.
Funding
This research was funded by the PhD Vice Chancellor Scholarship for Kanishka S. Turrakheil at the University of West London.
Institutional Review Board Statement
Not applicable.
Informed Consent Statement
Not applicable.
Data Availability Statement
Due to privacy the data presented in this study are available on request from the corresponding author.
Acknowledgments
We thank the anonymous reviewers for their time and comments. The X-ray computed tomography scanning was supported by the National Research Facility for Lab X-ray CT (NXCT) at the µ-VIS X-ray Imaging Centre, University of Southampton, through EPSRC grant EP/T02593X/1.
Conflicts of Interest
The authors declare no conflicts of interest.
References
- Kandalai, S.; John, N.J.; Patel, A. Effects of climate change on geotechnical infrastructures—State of the art. Environ. Sci. Pollut. Res. 2023, 30, 16878–16904. [Google Scholar] [CrossRef] [PubMed]
- Tzanis, C.; Varotsos, C.; Ferm, M.; Christodoulakis, J.; Assimakopoulos, M.N.; Efthymiou, C. Nitric acid and particulate matter measurements at Athens, Greece, in connection with corrosion studies. Atmos. Chem. Phys. 2009, 9, 8309–8316. [Google Scholar] [CrossRef]
- IPCC. Climate Change 2022: Impacts, Adaptation, and Vulnerability. In Contribution of Working Group II to the Sixth Assessment Report of the Intergovernmental Panel on Climate Change; Pörtner, H.-O., Roberts, D.C., Tignor, M., Poloczanska, E.S., Mintenbeck, K., Alegría, A., Craig, M., Langsdorf, S., Löschke, S., Möller, V., et al., Eds.; Cambridge University Press: Cambridge, UK, 2022. [Google Scholar]
- Nowamooz, H.; Masrouri, F. Influence of suction cycles on the soil fabric of compacted swelling soil. Comptes Rendus Geosci. 2010, 342, 901–910. [Google Scholar] [CrossRef]
- Zha, F.S.; Liu, J.-J.; Xu, L.; Cui, K.-r. Effect of cyclic drying and wetting on engineering properties of heavy metal contaminated soils solidified/stabilized with fly ash. J. Cent. South Univ. 2013, 20, 1947–1952. [Google Scholar] [CrossRef]
- Moayed, R.Z.; Lahiji, B.P. Effect of wetting-drying cycles on CBR values of silty subgrade soil of Karaj railway. In Proceedings of the 18th International Conference on Soil Mechanics and Geotechnical Engineering 2013, Paris, France, 2–5 September 2013. [Google Scholar]
- Hu, C.; Yuan, Y.; Mei, Y.; Wang, X.-Y.; Liu, Z. Comprehensive strength deterioration model of compacted loess exposed to drying-wetting cycles. Bull. Eng. Geol. Environ. 2019, 79, 383–398. [Google Scholar] [CrossRef]
- Gowthaman, S.; Nakashima, K.; Kawasaki, S. Effect of wetting and drying cycles on the durability of bio-cemented soil of expressway slope. Int. J. Environ. Sci. Technol. 2022, 19, 2309–2322. [Google Scholar] [CrossRef]
- Rasul, J.M.; Ghataora, G.S.; Burrow, M.P.N. The effect of wetting and drying on the performance of stabilized subgrade soils. Transp. Geotech. 2018, 14, 1–7. [Google Scholar] [CrossRef]
- Stirling, R.A.; Toll, D.G.; Glendining, S.; Helm, P.R.; Yildiz, A.; Hughes, P.N.; Asquith, J.D. Weather-driven deterioration processes affecting the performance of embankment slopes. Géotechnique 2021, 71, 57–969. [Google Scholar] [CrossRef]
- Khan, M.A.; Hossain, M.S.; Khan, M.S.; Samir, S.; Aramoon, A. Impact of wet-dry cycles on the shear strength of high plastic clay based on direct shear testing. Geotech. Front. 2017, GSP 280. [Google Scholar]
- Xu, X.; Shao, L.; Huang, J.; Xiang, X.; Liu, D.; Xian, Z.; Jian, W. Effect of wet-dry cycles on shear strength of residual soil. Soil Found. 2021, 61, 782–797. [Google Scholar] [CrossRef]
- Zhao, G.; Han, G.; Zou, W.; Wang, X. Evolution of mechanical behaviours of an expansive soil during drying-wetting, freeze–thaw, and drying-wetting-freeze–thaw cycles. Bull. Eng. Geol. Environ. 2021, 80, 8109–8121. [Google Scholar] [CrossRef]
- Niu, Z.L.; Xu, J.; Li, Y.F.; Wang, Z.F.; Wang, B. Strength deterioration mechanism of bentonite modified loess after wetting–drying cycles. Sci. Rep. 2022, 12, 3130. [Google Scholar] [CrossRef] [PubMed]
- Tu, Y.; Zhang, R.; Zhong, Z.; Chai, H. The strength behavior and desiccation crack development of silty clay subjected to wetting-drying cycles. Front. Earth Sci. 2022, 10, 852820. [Google Scholar] [CrossRef]
- Petrovic, A.M.; Siebert, J.E.; Rieke, P.E. Soil bulk density analysis in three dimensions by computed tomographic scanning. Soil Sci. Soc. Am. J. 1982, 46, 445–450. [Google Scholar] [CrossRef]
- Luo, L.; Lin, H.; Li, S. Quantification of 3-D soil macropore networks in different soil types and land uses using computed tomography. J. Hydrol. 2010, 393, 53–64. [Google Scholar] [CrossRef]
- Naveed, M.; Moldrup, P.; Schaap, M.G.; Tuller, M.; Kulkarni, R.; Vogel, H.-J.; de Jonge, L.W. Prediction of biopore- and matrix-dominated flow from X-ray CT-derived macropore network characteristics. Hydrol. Earth Sys. Sci. 2016, 20, 4017–4030. [Google Scholar] [CrossRef]
- Muddle, D.M.; Briggs, K.M. Macropore structure and permeability of clay fill samples from a historic clay fill earthwork. Transp. Geotech. 2019, 19, 96–109. [Google Scholar] [CrossRef]
- Diel, J.; Vogel, H.-J.; Schlüter, S. Impact of wetting and drying cycles on soil structure dynamics. Geoderma 2019, 345, 63–71. [Google Scholar] [CrossRef]
- Pires, L.F.; Auler, A.C.; Roque, W.L.; Mooney, S.J. X-ray microtomography analysis of soil pore structure dynamics under wetting and drying cycles. Geoderma 2020, 362, 114103. [Google Scholar] [CrossRef] [PubMed]
- Ma, R.; Cai, C.; Li, Z.; Wang, J.; Xiao, T.; Peng, G.; Yang, W. Evaluation of soil aggregate microstructure and stability under wetting and drying cycles in two Ultisols using synchrotron-based X-ray micro-computed tomography. Soil Till. Res. 2015, 149, 1–11. [Google Scholar] [CrossRef]
- Helliwell, J.R.; Sturrock, C.J.; Mairhofer, S.; Craigon, J.; Ashton, R.W.; Miller, A.J.; Whalley, R.; Mooney, S.J. The emergent rhizosphere: Imaging the development of the porous architecture at the root-soil interface. Sci. Rep. 2017, 7, 14875. [Google Scholar] [CrossRef] [PubMed]
- BS 1377-1: 2016; Methods of Test for Soils for Civil Engineering Purposes—Part 1: General Requirements and Sample Preparation. The British Standards Institution: London, UK, 2016.
- BS 1377-2: 2022; Methods of Test for Soils for Civil Engineering Purposes—Part 2: Classification Tests and Determination of Geotechnical Properties. The British Standards Institution: London, UK, 2016.
- BS 1377-3: 2022; Methods of Test for Soils for Civil Engineering Purposes—Part 3: Chemical and Electro-Chemical Tests. The British Standards Institution: London, UK, 2016.
- Peck, R.B.; Hanson, W.E. Thoronburn and T. Foundation Engineering, 2nd ed.; John Welly and Sons, Inc.: New York, NY, USA, 1974; pp. 372–384. [Google Scholar]
- BS 1377-4: 1990; Methods of Test for Soils for Civil Engineering Purposes—Compaction Related Tests. The British Standards Institution: London, UK, 2016.
- Rasband, W. ImageJ 1.54h 2023; U.S. National Institutes of Health: Bethesda, MD, USA, 2023.
- Sauvola, J.; Pietikenien, M. Adaptive document image binarization. Pattern Recognit. 2000, 33, 225–236. [Google Scholar] [CrossRef]
- Domander, R.; Felder, A.A.; Doube, M. BoneJ2—Refactoring established research software. Wellcome Open Res. 2016, 6, 37. [Google Scholar] [CrossRef]
- Renard, P.; Allard, D. Connectivity metrics for subsurface flow and transport. Adv. Water Resour. 2013, 51, 168–196. [Google Scholar] [CrossRef]
- Tang, C.-S.; Cheng, Q.; Gong, X.; Shi, B.; Inyang, H.I. Investigation on microstructure evolution of clayey soils: A review focusing on wetting/drying process. J. Rock Mech. Geotech. Eng. 2023, 15, 269–284. [Google Scholar] [CrossRef]
- Ye, W.M.; Wan, M.; Chen, B.; Cui, Y.; Wang, J. Micro-structural behaviors of densely compacted GMZ01 bentonite under drying/wetting cycles. Chin. J. Geotech. Eng. 2011, 33, 1173–1177. [Google Scholar]
- Cui, Y.J.; Yahia-Aissa, M.; Delage, P. A model for the volume change behavior of heavily compacted swelling clays. Eng. Geol. 2002, 64, 233–250. [Google Scholar] [CrossRef]
- Liu, Y. Investigation on the swelling properties and microstructure mechanism of compacted Gaomiaozi bentonite. J. Eng. Geol. 2016, 24, 451–458. [Google Scholar]
- Cuisinier, O.; Auriol, J.C.; Le Borgne, T.; Deneele, D. Microstructure and hydraulic conductivity of a compacted lime-treated soil. Eng. Geol. 2011, 123, 187–193. [Google Scholar] [CrossRef]
- Zhou, R.; Wang, B.; Han, S.; Wang, D.; Zhang, F. Mechanisms of crack development and strength deterioration in compacted expansive soils under controlled wetting-drying conditions. Eng. Fail. Anal. 2024, 159, 108133. [Google Scholar] [CrossRef]
- Huang, Z.; Zhang, H.; Liu, B.; Wei, B.; Wang, H. Using CT to test the damage characteristics of the internal structure of expansive soil induced by dry-wet cycles. AIP Adv. 2021, 11, 075305. [Google Scholar] [CrossRef]
- Lin, B.; Cerato, A.B. Applications of SEM and ESEM in the microstructural investigation of shale-weathered expansive soils along swelling-shrinkage cycles. Eng. Geol. 2014, 177, 66–74. [Google Scholar] [CrossRef]
- Zhu, R.; Cai, Z.; Huang, Y.; Zhang, C.; Guo, W.; Wang, Y. Effects of wetting-drying-freezing-thawing cycles on mechanical behaviours of expansive soil. Cold Reg. Sci. Technol. 2022, 193, 103422. [Google Scholar] [CrossRef]
- Wen, T.; Shao, L.; Guo, X.; Zhao, Y. Experimental investigations of the soil water retention curve under multiple drying–wetting cycles. Acta Geotech. 2020, 15, 3321–3326. [Google Scholar] [CrossRef]
- Shi, L.L.W.; Liang, J.; Yuan, Y.; Hao, Q. Soil macropore characteristics and aggregate stability with poly-γ-glutamic acid amendment under wetting–drying cycles. Eur. J. Soil Sci. 2023, 74, e13361. [Google Scholar] [CrossRef]
- Hafhouf, I.; Khelifa, A. Impact of drying-wetting cycles on shear properties, suction, and collapse of Sebkha soils. Heliyon 2023, 9, e13594. [Google Scholar] [CrossRef] [PubMed]
- Jayatilaka, R.; Lytton, R.; Wray, W.K. Effectiveness of controlling pavement roughness due to expansive clays with vertical moisture barriers. Tex. Dep. Transp. 1992, 1, 136963161. [Google Scholar]
- Puppala, A.J.; Thammanoon, M.; Soheil, N.; Hoyos, L.R. Threshold moisture content and matric suction potentials in expansive clays prior to initiation of cracking in pavements. Can. Geotech. J. 2011, 48, 519–531. [Google Scholar] [CrossRef]
- Jury, W.A.; Horton, R. Soil Physics; Willey: Hoboken, NJ, USA, 2004. [Google Scholar]
- Ng, C.W.W.; Zhou, C.; Chiu, C.F. Constitutive modelling of state-dependent behaviour of unsaturated soils: An overview. Acta Geotech. 2020, 15, 2705–2725. [Google Scholar] [CrossRef]
- Chiu, C.F.; Ng, C.W.W. Coupled water retention and shrinkage properties of a compacted silt under isotropic and deviatoric stress paths. Can. Geotech. J. 2012, 49, 928–938. [Google Scholar] [CrossRef]


Disclaimer/Publisher’s Note: The statements, opinions and data contained in all publications are solely those of the individual author(s) and contributor(s) and not of MDPI and/or the editor(s). MDPI and/or the editor(s) disclaim responsibility for any injury to people or property resulting from any ideas, methods, instructions or products referred to in the content. |
© 2024 by the authors. Licensee MDPI, Basel, Switzerland. This article is an open access article distributed under the terms and conditions of the Creative Commons Attribution (CC BY) license (https://creativecommons.org/licenses/by/4.0/).