Article

High-Resolution Characterization of Aerosol Optical Depth and Its Correlation with Meteorological Factors in Afghanistan

1
Division of Environmental Design, Graduate School of Natural Science and Technology, Kanazawa University, Kanazawa 920-1192, Ishikawa, Japan
2
Faculty of Geosciences and Civil Engineering, Institute of Science and Engineering, Kanazawa University, Kanazawa 920-1192, Ishikawa, Japan
3
Department of Geography, Faculty of Social Sciences, Chiang Mai University, Muang, Chiang Mai 50200, Thailand
4
Department of Environmental Science and Engineering, Ewha Womans University, Seoul 03760, Republic of Korea
*
Author to whom correspondence should be addressed.
Atmosphere 2024, 15(7), 849; https://doi.org/10.3390/atmos15070849
Submission received: 29 May 2024 / Revised: 10 July 2024 / Accepted: 17 July 2024 / Published: 19 July 2024

Abstract

:
Atmospheric aerosols pose a significant global problem, particularly in urban areas in developing countries where the rapid urbanization and industrial activities degrade air quality. This study examined the spatiotemporal variations and trends in aerosol optical depth (AOD) at a 550 nm wavelength, alongside key meteorological factors, in Kabul, Afghanistan, from 2000 to 2022. Using the Google Earth Engine geospatial analysis platform, daily AOD data were retrieved from the Moderate Resolution Imaging Spectroradiometer to assess monthly, seasonal, and annual spatiotemporal variations and long-term trends. Meteorological parameters such as temperature (T), relative humidity (RH), precipitation (PCP), wind speed (WS), wind direction, and solar radiation (SR) were obtained from the Modern Era Retrospective Analysis for Research and Applications. The Mann–Kendall test was employed to analyze the time-series trends, and a Pearson correlation matrix was calculated to assess the influence of the meteorological factors on AOD. Principal component analysis (PCA) was performed to understand the underlying structure. The results indicated high AOD levels in spring and summer, with a significant upward trend from 2000 to 2022. The findings revealed a positive correlation of AOD value with T, RH, WS, and PCP and a negative correlation with SR. The PCA results highlighted complex interactions among these factors and their impact on the AOD. These insights underscore the need for stringent air quality regulations and emission control measures in Kabul.

Graphical Abstract

1. Introduction

Air pollution has become a serious global concern in recent years, particularly in developing countries and urban areas. The rapid urbanization and industrialization in these regions have led to excessive emissions, which are harmful to human health and the climate system [1]. Increased population density and vehicular traffic in urban areas result in higher emissions of pollutants such as nitrogen oxides and particulate matter (PM). Additionally, industrial activities and low-quality fuels for residential heating further degrade air quality. These emissions lead to severe health issues, including respiratory and cardiovascular diseases, and significantly impact the climate system [2,3].
Atmospheric PM is recognized as one of the crucial components of the atmosphere [1]. PM, or atmospheric aerosol, refers to fine solid particles or liquid droplets suspended in air [4]. The formation of aerosol particles results from complex interactions among various environmental factors, including meteorology, industrial emissions, and dust from roads and construction activities [5]. Industrial activities release substantial amounts of PM, while vehicular traffic and construction activities significantly contribute to PM levels. These particles can vary in size, composition, and origin, impacting air quality and human health [6].
In Kabul, the PM levels frequently exceed Afghanistan’s national air quality standards for PM10 and PM2.5, set at 150 and 75 µg/m3, respectively [7]. This variation in PM levels can be attributed to several factors, including mountainous terrain, weather patterns, and human activities such as vehicular emissions, coal combustion, wood, solid waste, used oil, soil dust, thermal generators, and residential combustion processes. Natural sources such as dust storms, soil resuspension, and socioeconomic factors such as rapid urbanization and population growth also contribute to these PM levels. Furthermore, the effectiveness of regulatory measures and public awareness regarding pollution control play crucial roles in determining PM concentrations. The issue of air pollution in Kabul remains inadequately studied to comprehensively address all aspects of the city [5,7,8]. Furthermore, no comprehensive inventory of air pollutant emissions has been compiled by the government. Moreover, source apportionment remains inadequate for assessing the contribution of each source to atmospheric aerosols owing to the absence of sufficient monitoring stations for recording air quality data. Given these challenges, the significance of this study is in leveraging the remote sensing of aerosols to map aerosol distribution, enhance air quality management efforts, and provide guidance for policymakers and future research.
Ground-based monitoring stations provide accurate and periodic monitoring of air pollution, with intervals ranging from a few minutes to several hours. Recent initiatives to enhance space-based and ground-based observations of aerosols have significantly improved our understanding of their impact on climate systems and air quality. Global aerosol models have also become more sophisticated, capable of capturing features such as aerosol optical depth (AOD) [9]. Remote aerosol retrieval methods, such as those used by NASA’s Terra and Aqua satellites with the Moderate Resolution Imaging Spectroradiometer (MODIS), provide accurate data [10]. The key parameters used in the analysis of aerosols include AOD, single-scattering albedo, Angström exponent, complex refractive index, aerosol extinction coefficient, and aerosol layer height [11,12,13,14,15]. AOD, a widely used metric, quantifies the distribution of aerosols in the atmospheric column from Earth’s surface to the top of the atmosphere [16,17,18]. Atmospheric particles such as dust or smoke can block sunlight through absorption or scattering. AOD measures the extent to which direct sunlight is prevented from reaching the ground. This dimensionless metric correlates with aerosol concentrations in the vertical atmospheric column, with values typically ranging from 0.01 (indicating a clean atmosphere) to over 1 (associated with dust and sandstorms) [19].
To date, evaluations of MODIS Terra and Aqua Multiangle Implementation of Atmospheric Correction (MAIAC) have been performed across several geographical regions, including North America [20] and South America [21], and have been employed alongside ancillary parameters to obtain surface PM concentrations in the USA [22,23], Mexico City [24], Italy [25], and Israel [22]. South Asia is a complex geoclimatic region characterized by significant diversity in aerosol loading and optical properties, especially over the Indo-Gangetic Plain [26,27,28,29]. Several studies have explored the relationship between AOD and ground-level meteorological factors, uncovering variations in their influence across different regions and time scales. For instance, a spatial correlation study [30] found coefficients of 0.014, 0.042, −0.126, and 0.004 for RH, T, PCP, and WS with AOD, respectively. These results suggest a weak positive influence of T and a negative influence of PCP on AOD. [31] In the abovementioned study, the researchers performed a correlation analysis and reported correlations of 0.34, 0.23, and −0.04 for AOD with T, RH, and WS, respectively. These findings indicate moderate positive correlations with T, weak positive correlations with RH, and weak negative correlations with WS. Similarly, [32] observed a positive correlation with T and WS and a negative correlation with RH, further corroborating these trends. Detailed solar radiation (SR) studies have also been performed [33,34,35].
This study aimed to investigate the spatiotemporal distribution of AOD at a wavelength of 550 nm and its correlation with ground-level meteorological factors in Kabul, Afghanistan, from 2000 to 2022. The specific objectives were to (1) evaluate monthly, seasonal, and annual variations in AOD; (2) analyze long-term trends in AOD and meteorological factors including temperature (T), relative humidity (RH), precipitation (PCP), wind speed (WS), and SR; and (3) explore the potential relationships between AOD and ground-level meteorological factors in Kabul. The collected data support air quality management efforts in Afghanistan and the mitigation of the adverse effects of aerosols on global climate systems and human health.

2. Data and Methods

Figure 1 comprehensively illustrates the methodology used in this study. This investigation focused on Kabul, using two distinct datasets. AOD data at 1 km resolution were acquired from the MODIS instrument aboard NASA’s Terra and Aqua satellites. These satellite-derived data provide valuable insights into the distribution of airborne PM. Additionally, key meteorological factors were obtained from the Modern Era Retrospective Analysis for Research and Application (MERRA-2). To align with the coarser resolution of the meteorological data, the finer-resolution AOD data were aggregated by calculating average values in each grid cell. Various visualization techniques were employed to analyze their spatiotemporal patterns and characteristics, including spatial maps, histograms, time-series graphs for AOD, and time-series graphs for meteorological factors. Furthermore, relationships between AOD and each meteorological factor were explored by plotting them together and calculating the Pearson correlation coefficient. This approach facilitated the quantification of the strength and direction of potential associations between these variables.

2.1. Study Site

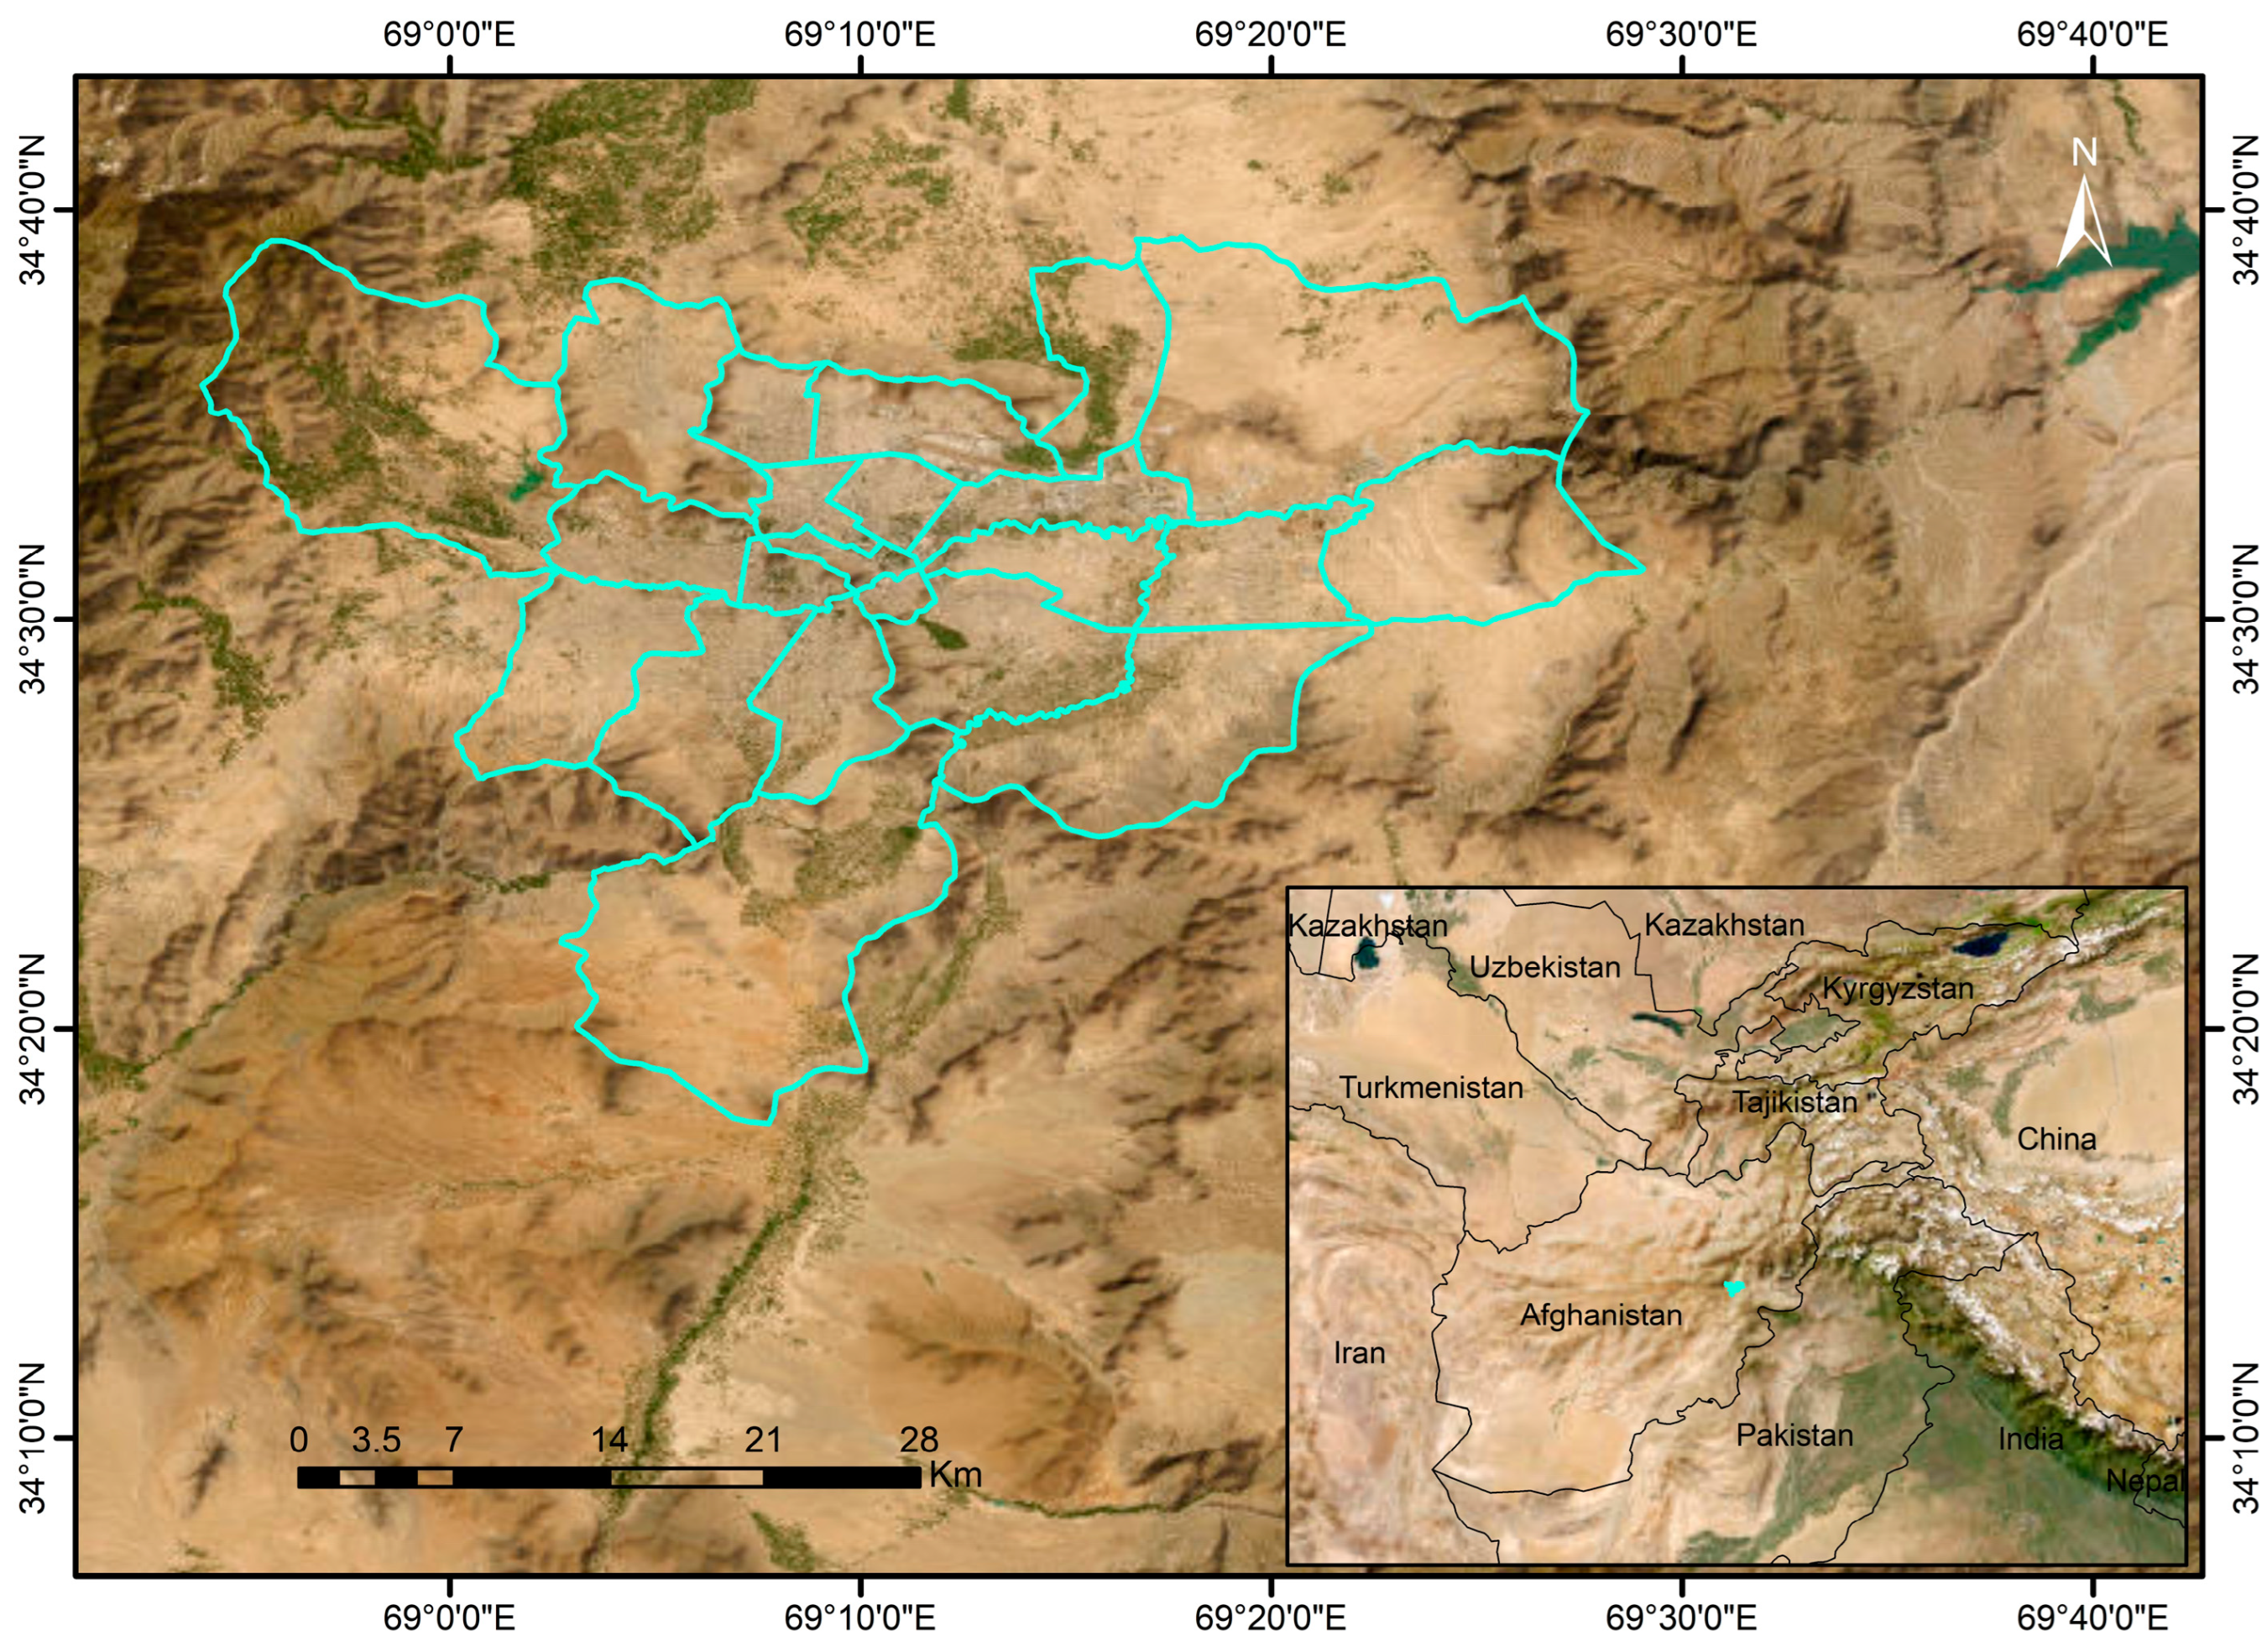
Kabul, the capital of Afghanistan, is located at 34°30′ N and 69°10′ E in the northeastern part of the country, as depicted in Figure 2. The city is surrounded by mountains in a semiarid zone, with 56% of the area characterized by mountainous and rugged terrain and 38% being flat. Kabul spans 22 administrative districts (Nahiya), covering an area of 1047 km2, and is approximately 1800 m above sea level. Anthropogenic activities, such as power plants, vehicles, and the combustion of wood, coal, and plastic in stoves, are the primary sources of air pollution in Kabul. Following two decades of civil war and political conflict, Kabul has transformed into one of the world’s fastest-growing cities [36], securing its position as Afghanistan’s most populous and influential urban center. However, this rapid expansion has come at a cost: street obstructions, downtown crowds, and a significant increase in traffic have worsened city congestion [37]. Owing to the absence of a reliable census, the population of Kabul remains unknown, with estimates varying significantly from 3.5 million to 6 million [38].

2.2. Satellite Datasets

2.2.1. MODIS Products

As a vital component of NASA’s Earth Observing System, the MODIS instrument has been aboard Terra and Aqua since 2000. MODIS provides data on aerosol levels over land and ocean. The sensor measures radiances at 0.25, 0.5, and 1.0 km spatial resolutions. With a viewing width of 2330 km, MODIS captures 36 spectral channels spanning from 0.415 to 14.235 μm [39]. AOD data at a wavelength of 550 nm were acquired from the MODIS instrument. Specifically, the MCD19A2 Version 6 data products from 2000 to 2022 were employed to visualize the spatial distribution of AOD and analyze its monthly, seasonal, and annual variations; distribution density; and long-term trends. These data are daily, 1 km pixel resolution products combining MODIS Terra and Aqua MAIAC AOD data at Level 2 processing [40]. Google Earth Engine (GEE), a platform for planetary-scale Earth science data analysis [41,42], was used to access the data. The spatial distributions of AOD across monthly, seasonal, and annual timescales were visualized using ArcGIS 10.7.1 software.

2.2.2. MERRA-2

Key factors such as T at 2 m, RH at 2 m, PCP, WS, and wind direction (WD) at 10 m were obtained from the MERRA-2 assimilation model [43] to explore the characteristics and impact of meteorological factors on AOD. MERRA-2 provides meteorological data at a spatial resolution of 0.5 degrees latitude by 0.625 degrees longitude. It offers distinct advantages by incorporating long-term global space-based observations of aerosols since 1980 [44,45], allowing for the representation of their interactions with other physical processes in the climate system [46,47]. In addition to various diagnostics such as surface and atmospheric fluxes, diabatic terms, and data assimilation adjustments, MERRA-2 also provides similar meteorological data (wind, precipitation, temperature, and humidity) to other reanalyses of its type [48]. As the latest atmospheric reanalysis product from NASA’s Global Modeling and Assimilation Office, MERRA-2 builds on the original MERRA with advancements in the assimilation system [44,49,50,51].

2.3. Data Preprocessing

Preprocessing is a crucial first step in ensuring reliable AOD and meteorological data analysis. This cleaning process ensures data consistency and addresses potential issues. Daily AOD data were obtained from GEE, and any outliers or missing values were removed during preprocessing to maintain dataset integrity. An outlier was an AOD measurement that significantly deviated from a dataset’s expected range of values, possibly owing to cloud contamination, transient atmospheric events, data processing errors, or instrumentation issues. Because AOD data have a fine resolution, we aggregated them to match the coarse resolution of meteorological data by calculating the average AOD values in each grid cell. This step ensured that the spatial resolution of AOD data aligned with that of meteorological data, enabling accurate comparisons and analysis. The retrieved MODIS AOD data were averaged to present a comprehensive view of air quality across monthly, seasonal, and annual timescales.

2.4. Statistical Analysis

Statistical values, such as minimum, maximum, mean, and standard deviation, were calculated using descriptive statistics, providing a foundational understanding of data central tendency and distribution. The log–normal distribution for each season was calculated to comprehensively explore AOD variations across seasons, aiding in the identification of potential seasonal patterns. The Mann–Kendall nonparametric test was also applied to detect statistically significant trends in AOD, T, RH, PCP, and WS. This robust test is particularly effective for analyzing time-series data, especially in identifying monotonic trends. Furthermore, a Pearson correlation matrix analysis was performed to assess the relationship between MODIS AOD and meteorological parameters (T, RH, WS, PCP, and SR). The correlation coefficient (r) was calculated using Equation (1):
r = x i x ¯ y i y ¯ x i x ¯ 2 y i y ¯ 2   ,
where x i   is the value of the x variable in a sample, x ¯   is the mean of the x variable, y i is the value of the y variable in a sample, and y ¯ is the mean of the values of the y variable.
To evaluate the discrepancy between AOD and meteorological factor values, we computed the root mean square error (RMSE) using Equation (2):
R M S E = 1 n i = 1 n y i y ^ i 2   ,
where y i is AOD values, y ^ i is meteorological factors, and n is the number of observations.
To examine the underlying structure and relationships among the meteorological factors and their influence on AOD, we used principal component analysis (PCA). PCA is a dimensionality reduction technique that transforms the original correlated variables into a set of uncorrelated components arranged by the variance they explain in the data.

3. Results and Discussion

3.1. Spatial and Temporal Variations in AOD

The monthly minimum, maximum, mean, and standard deviation of the AOD data recorded in Kabul from 2000 to 2022 are summarized in Table 1, showing a mean AOD of 0.214 with a standard deviation of 0.090, indicating moderate variability. The minimum AOD dropped as low as 0.040, while the maximum reached a concerning 0.998. December exhibited the lowest mean AOD (0.166), whereas April showed the highest (0.249). The spatial distribution of the average AOD across the study period is depicted in Figure 3, revealing a distinct pattern with concentrations of high AOD values exceeding 0.4 in the central city area. Particularly hazy conditions in the city center were observed in April, July, and August. Various factors, including high levels of anthropogenic activities and specific meteorological conditions such as low surface wind speeds, high air temperatures, and humidity in the area, likely influenced this spatial variability. Additionally, the complex terrain surrounding Kabul significantly affected the transport and dispersion of air pollutants. This finding underscores the significant role of regional air pollution transport in contributing to elevated aerosol concentrations in Kabul province. Interestingly, the western region consistently showed low AOD values, suggesting a potential cleansing effect of the mountainous landscape. Furthermore, high mountain ranges may act as natural barriers, limiting the horizontal dispersion of air pollution. Additionally, the anthropogenic emissions in sparsely populated mountainous regions are typically lower.

3.2. Seasonal and Interannual Variations in AOD

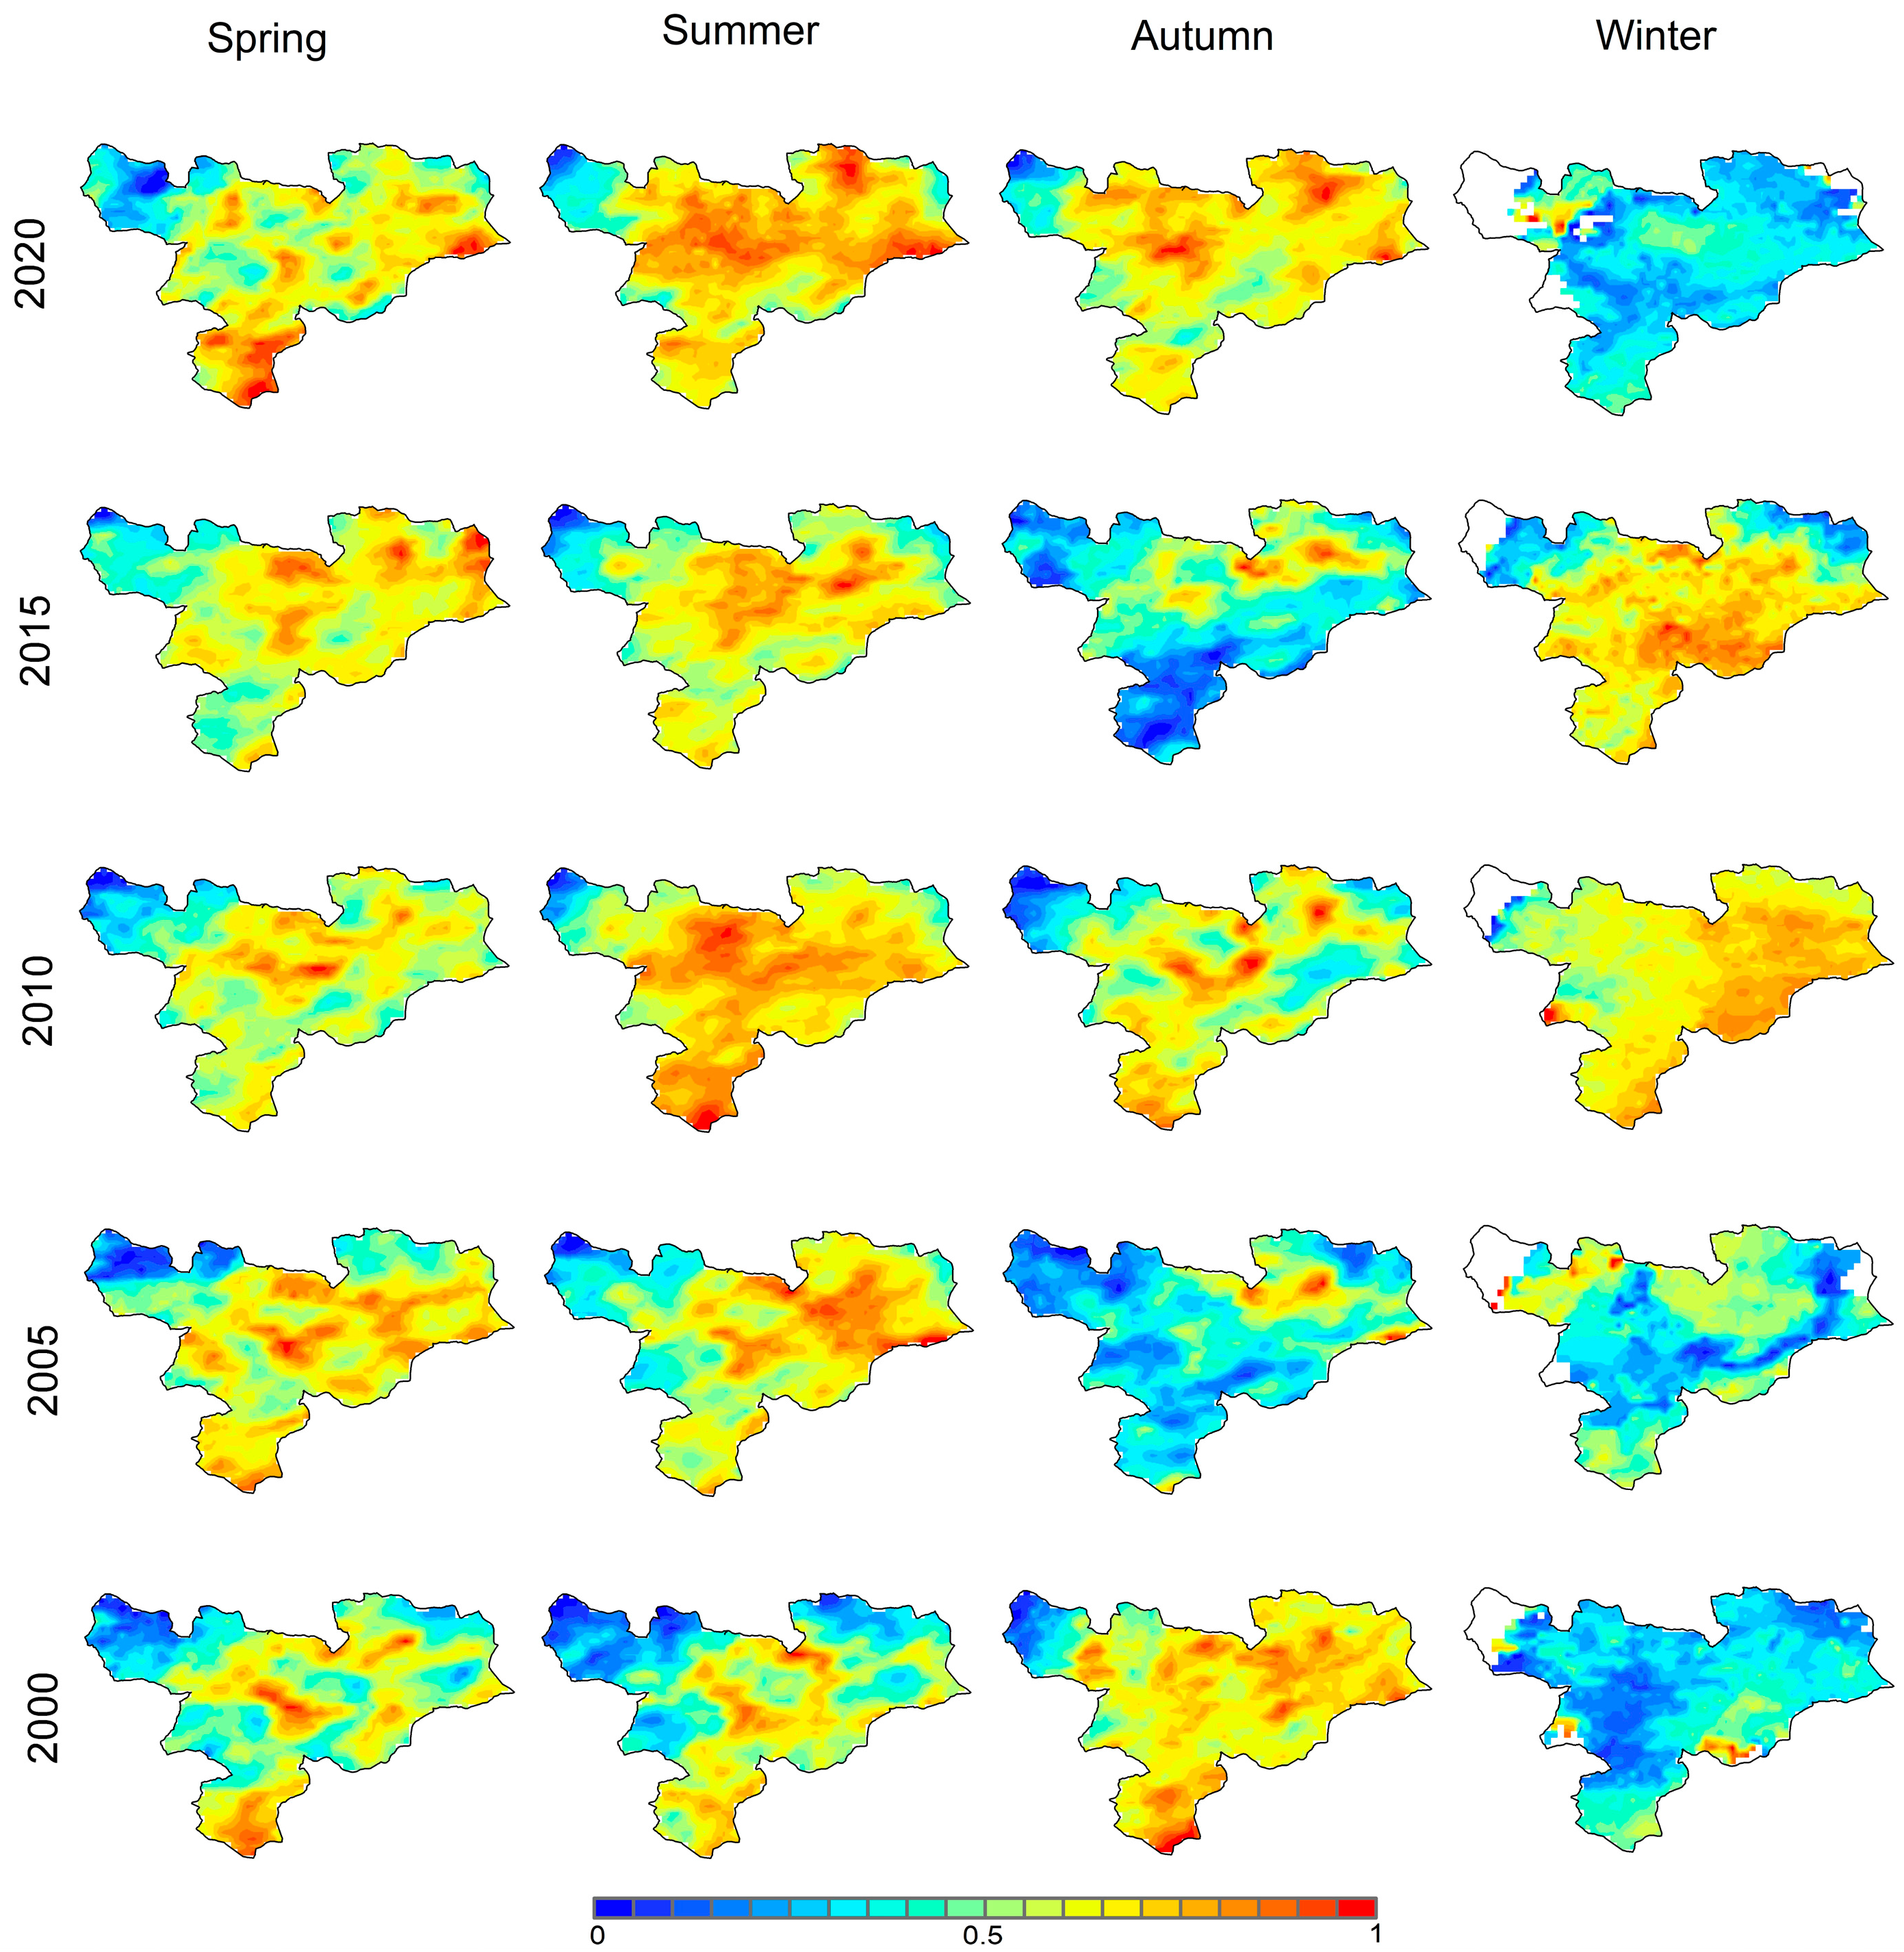
The analysis of monthly, seasonal, and interannual variations in the AOD provided critical insights into the dynamics of the aerosol distribution in the study area. The AOD data were averaged across four seasons: spring (April–June), summer (July–September), autumn (October–December), and winter (January–March). The seasonal AOD statistics for the entire observation period are summarized in Table 2. During, spring and summer showed statistically similar AOD values (0.233 and 0.232, respectively), indicating minimal seasonal variations during these warmer months. In contrast, autumn (0.171) and winter (0.215) displayed lower seasonal AOD values. The seasonal spatial distributions of the AOD in Kabul for the years 2000, 2005, 2010, 2015, and 2020 are presented in Figure 4. The results illustrate a consistent pattern in the city center, with spring and summer showing the highest average AOD values, followed by autumn and winter. Notably, winter exhibited high concentrations of fine particles owing to the increased residential fuel burning (coal and wood) and solid waste incineration, resulting in significant PM emissions [37,52]. During winter, AOD may involve complex physical and chemical processes such as gas-to-particle conversion, hygroscopic growth, and coagulation, resulting in the formation of larger particles [28,53]. The high AOD in summer is likely due to increased aerosol loading in the atmospheric column, especially in the upper atmosphere, attributed to long-range dust transport from northern and western regions [54]. Moreover, humidity may enhance the hygroscopic growth of particles, thereby contributing to the elevated AOD levels observed in summer [55]. The process of gas-to-particle conversion may be accelerated by rising summer temperatures, thereby further influencing the AOD [31].
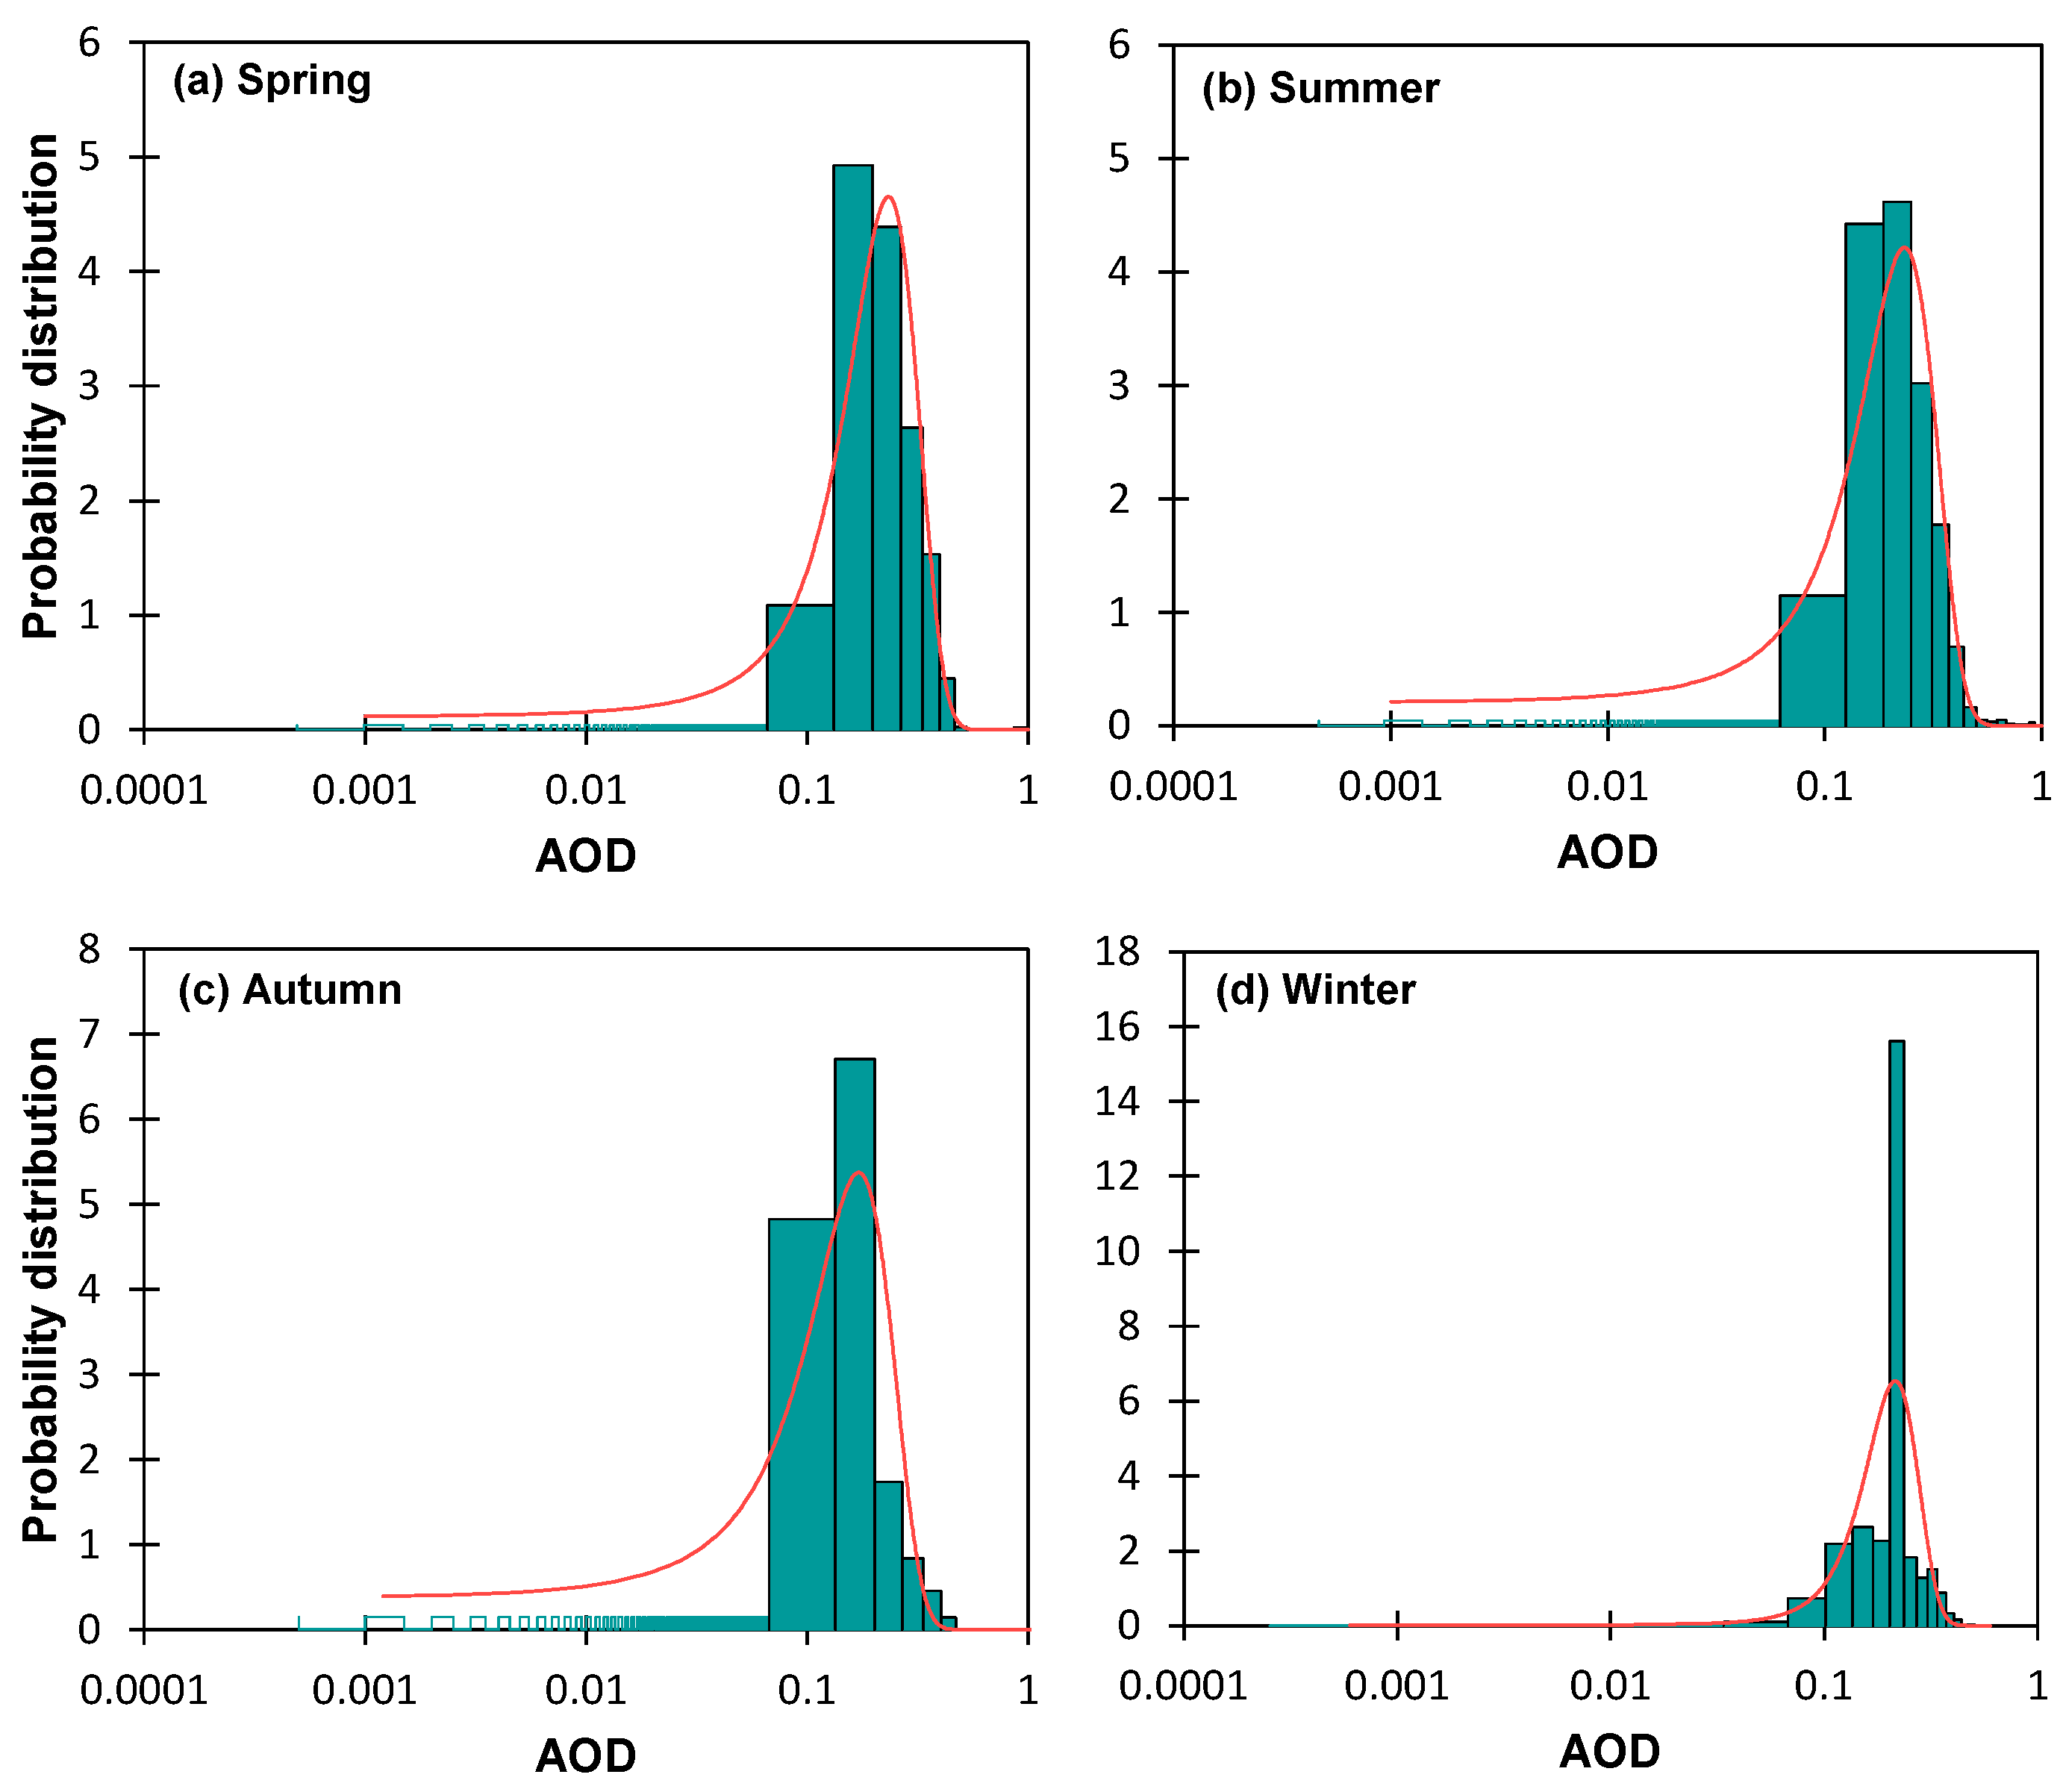
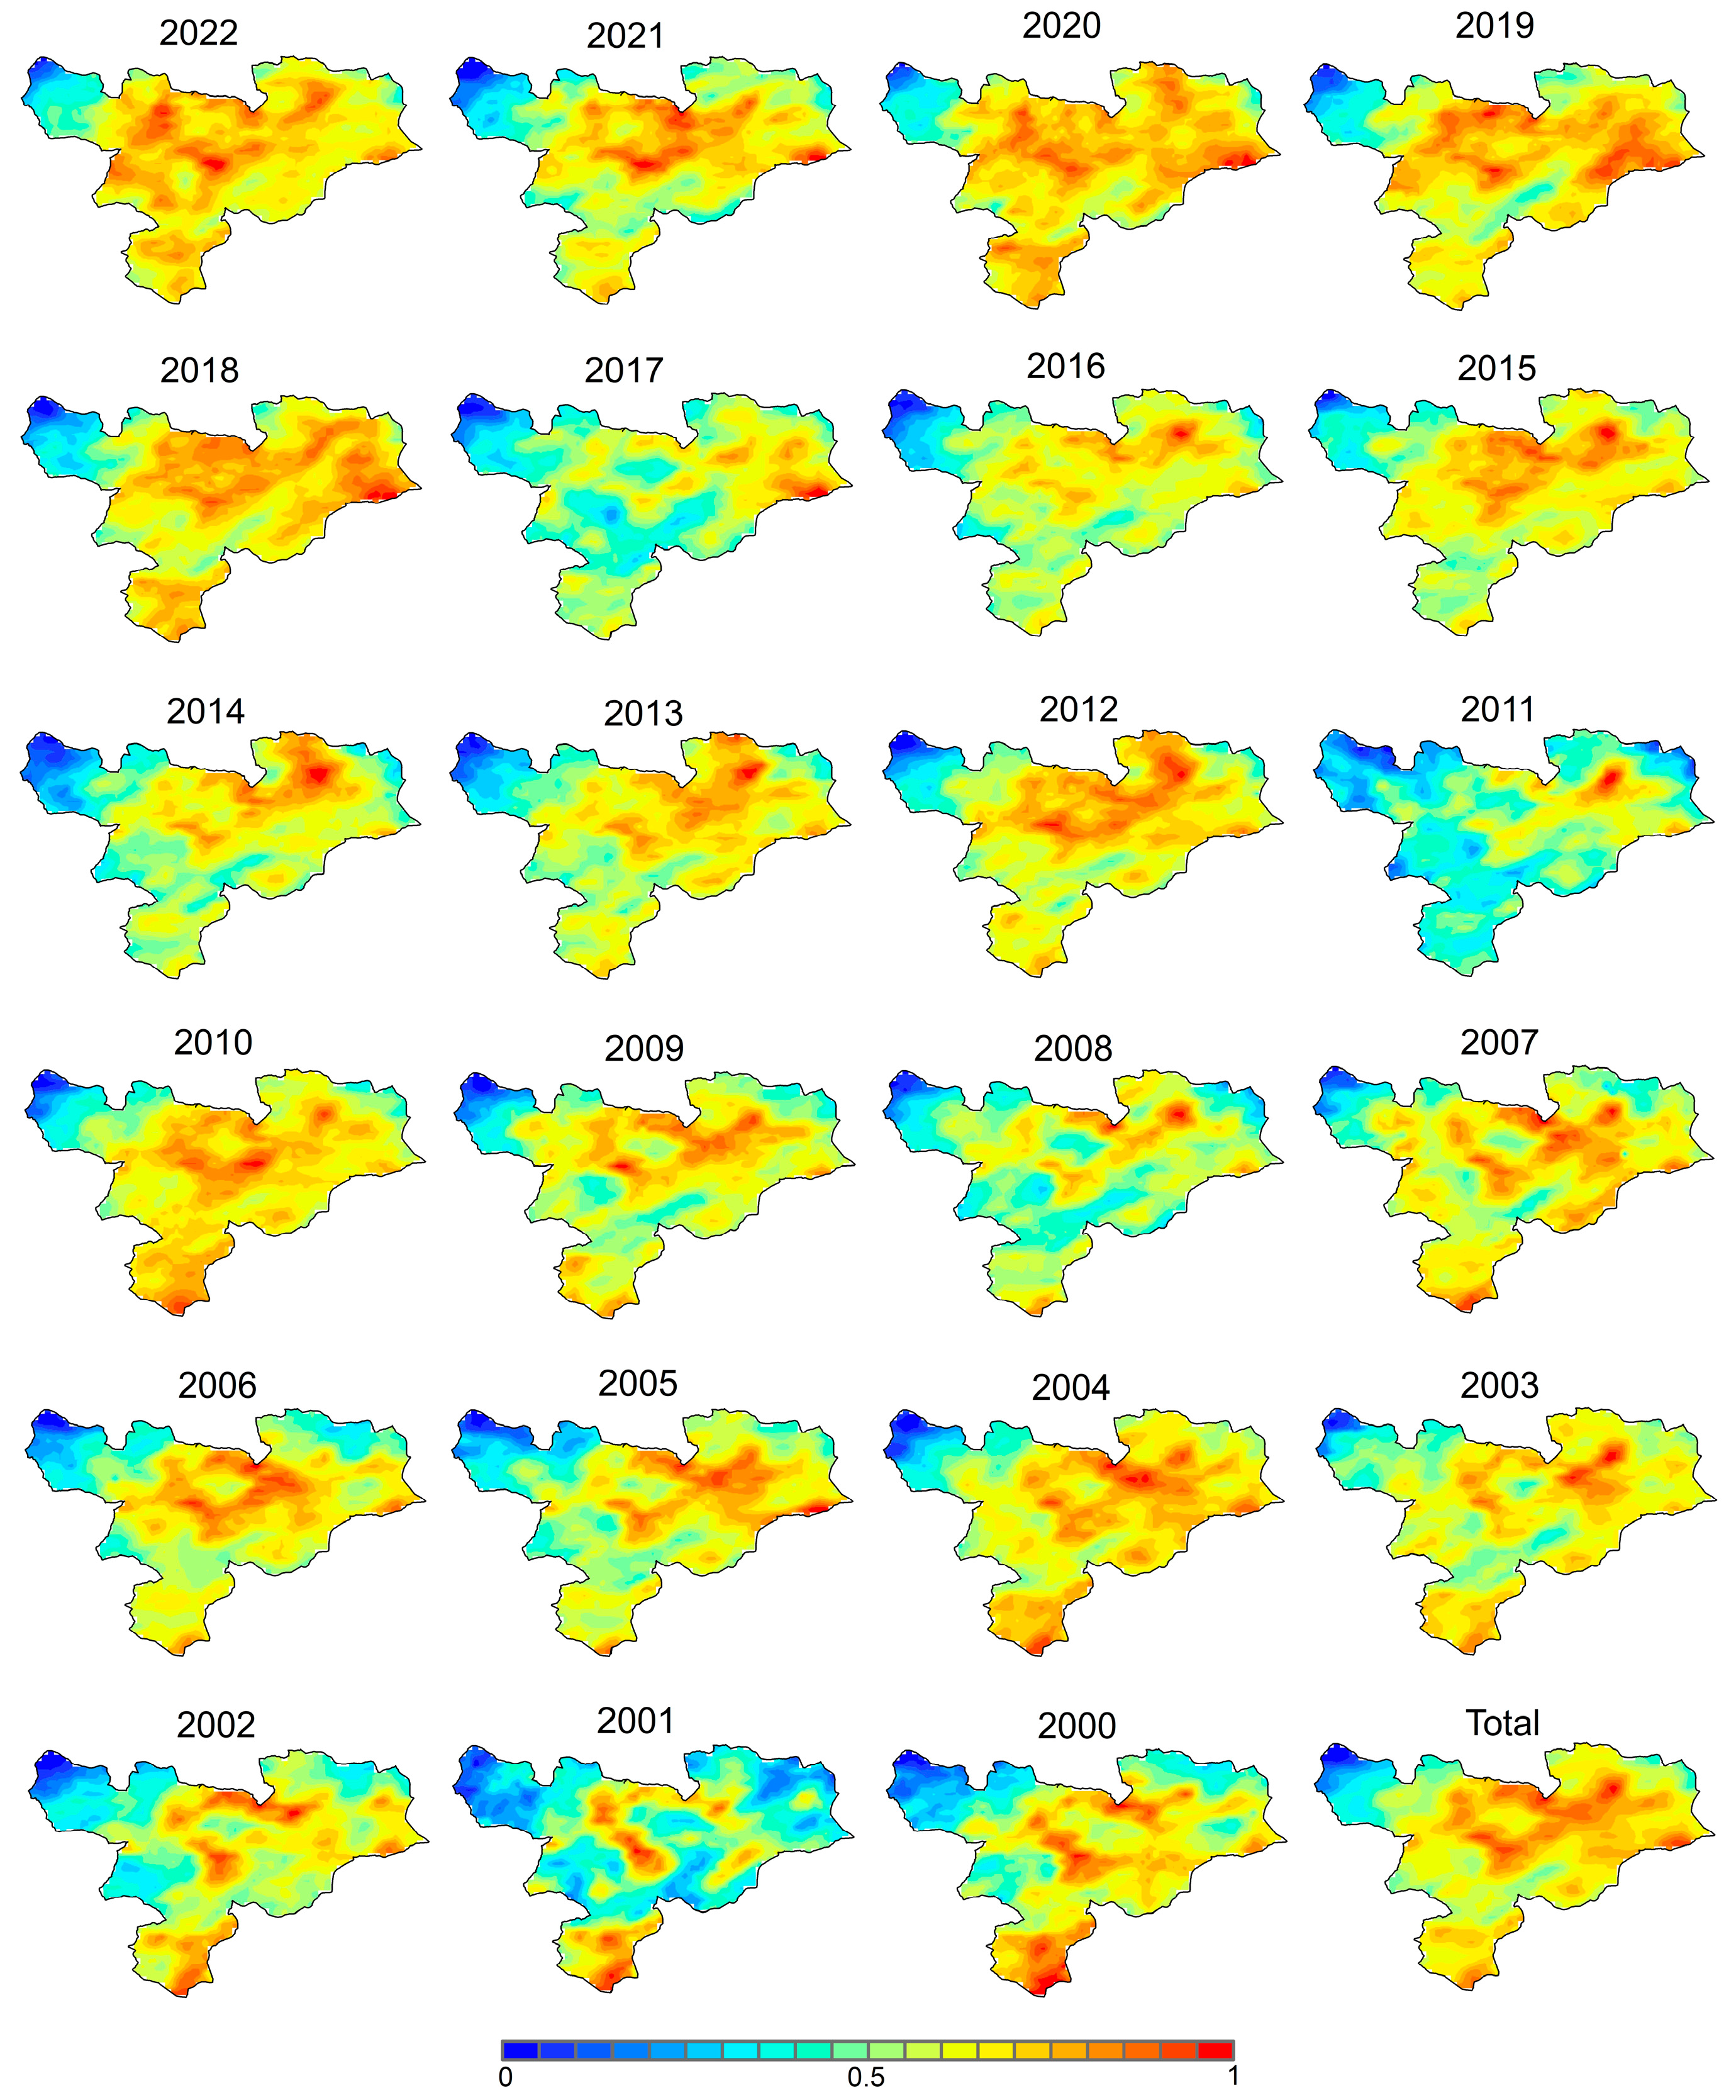
A probability histogram of AOD across all four seasons from 2000 to 2022 in Kabul is illustrated in Figure 5. The seasonal variations in the AOD distribution were analyzed using a log–normal distribution model. All seasons exhibited a unimodal distribution with a peak frequency of approximately 0.2, closely aligning with the annual average AOD of 0.21. However, the greater variability in the probability distribution during winter compared to other seasons indicates a wider range of particle types originating from various emission sources during that season, such as coal, wood, and solid waste burning. The interannual spatial distribution reveals significant variability over the study period from 2000 to 2022. Figure 6 depicts annual average AOD values, highlighting fluctuations that reflect both natural and anthropogenic influences and consistently high AOD concentrations in downtown areas. Figure 7 compares the AOD between 2000 and 2002 to visualize the long-term annual variation in the AOD over Kabul. This comparison reveals an upward trend by 2022, attributed to increasing anthropogenic activities and the associated aerosol emissions in the city. The average AOD in 2022 exceeded 0.23, being significantly higher than the 0.18 in 2000.

3.3. Long-Term Trend in AOD and Meteorological Factors

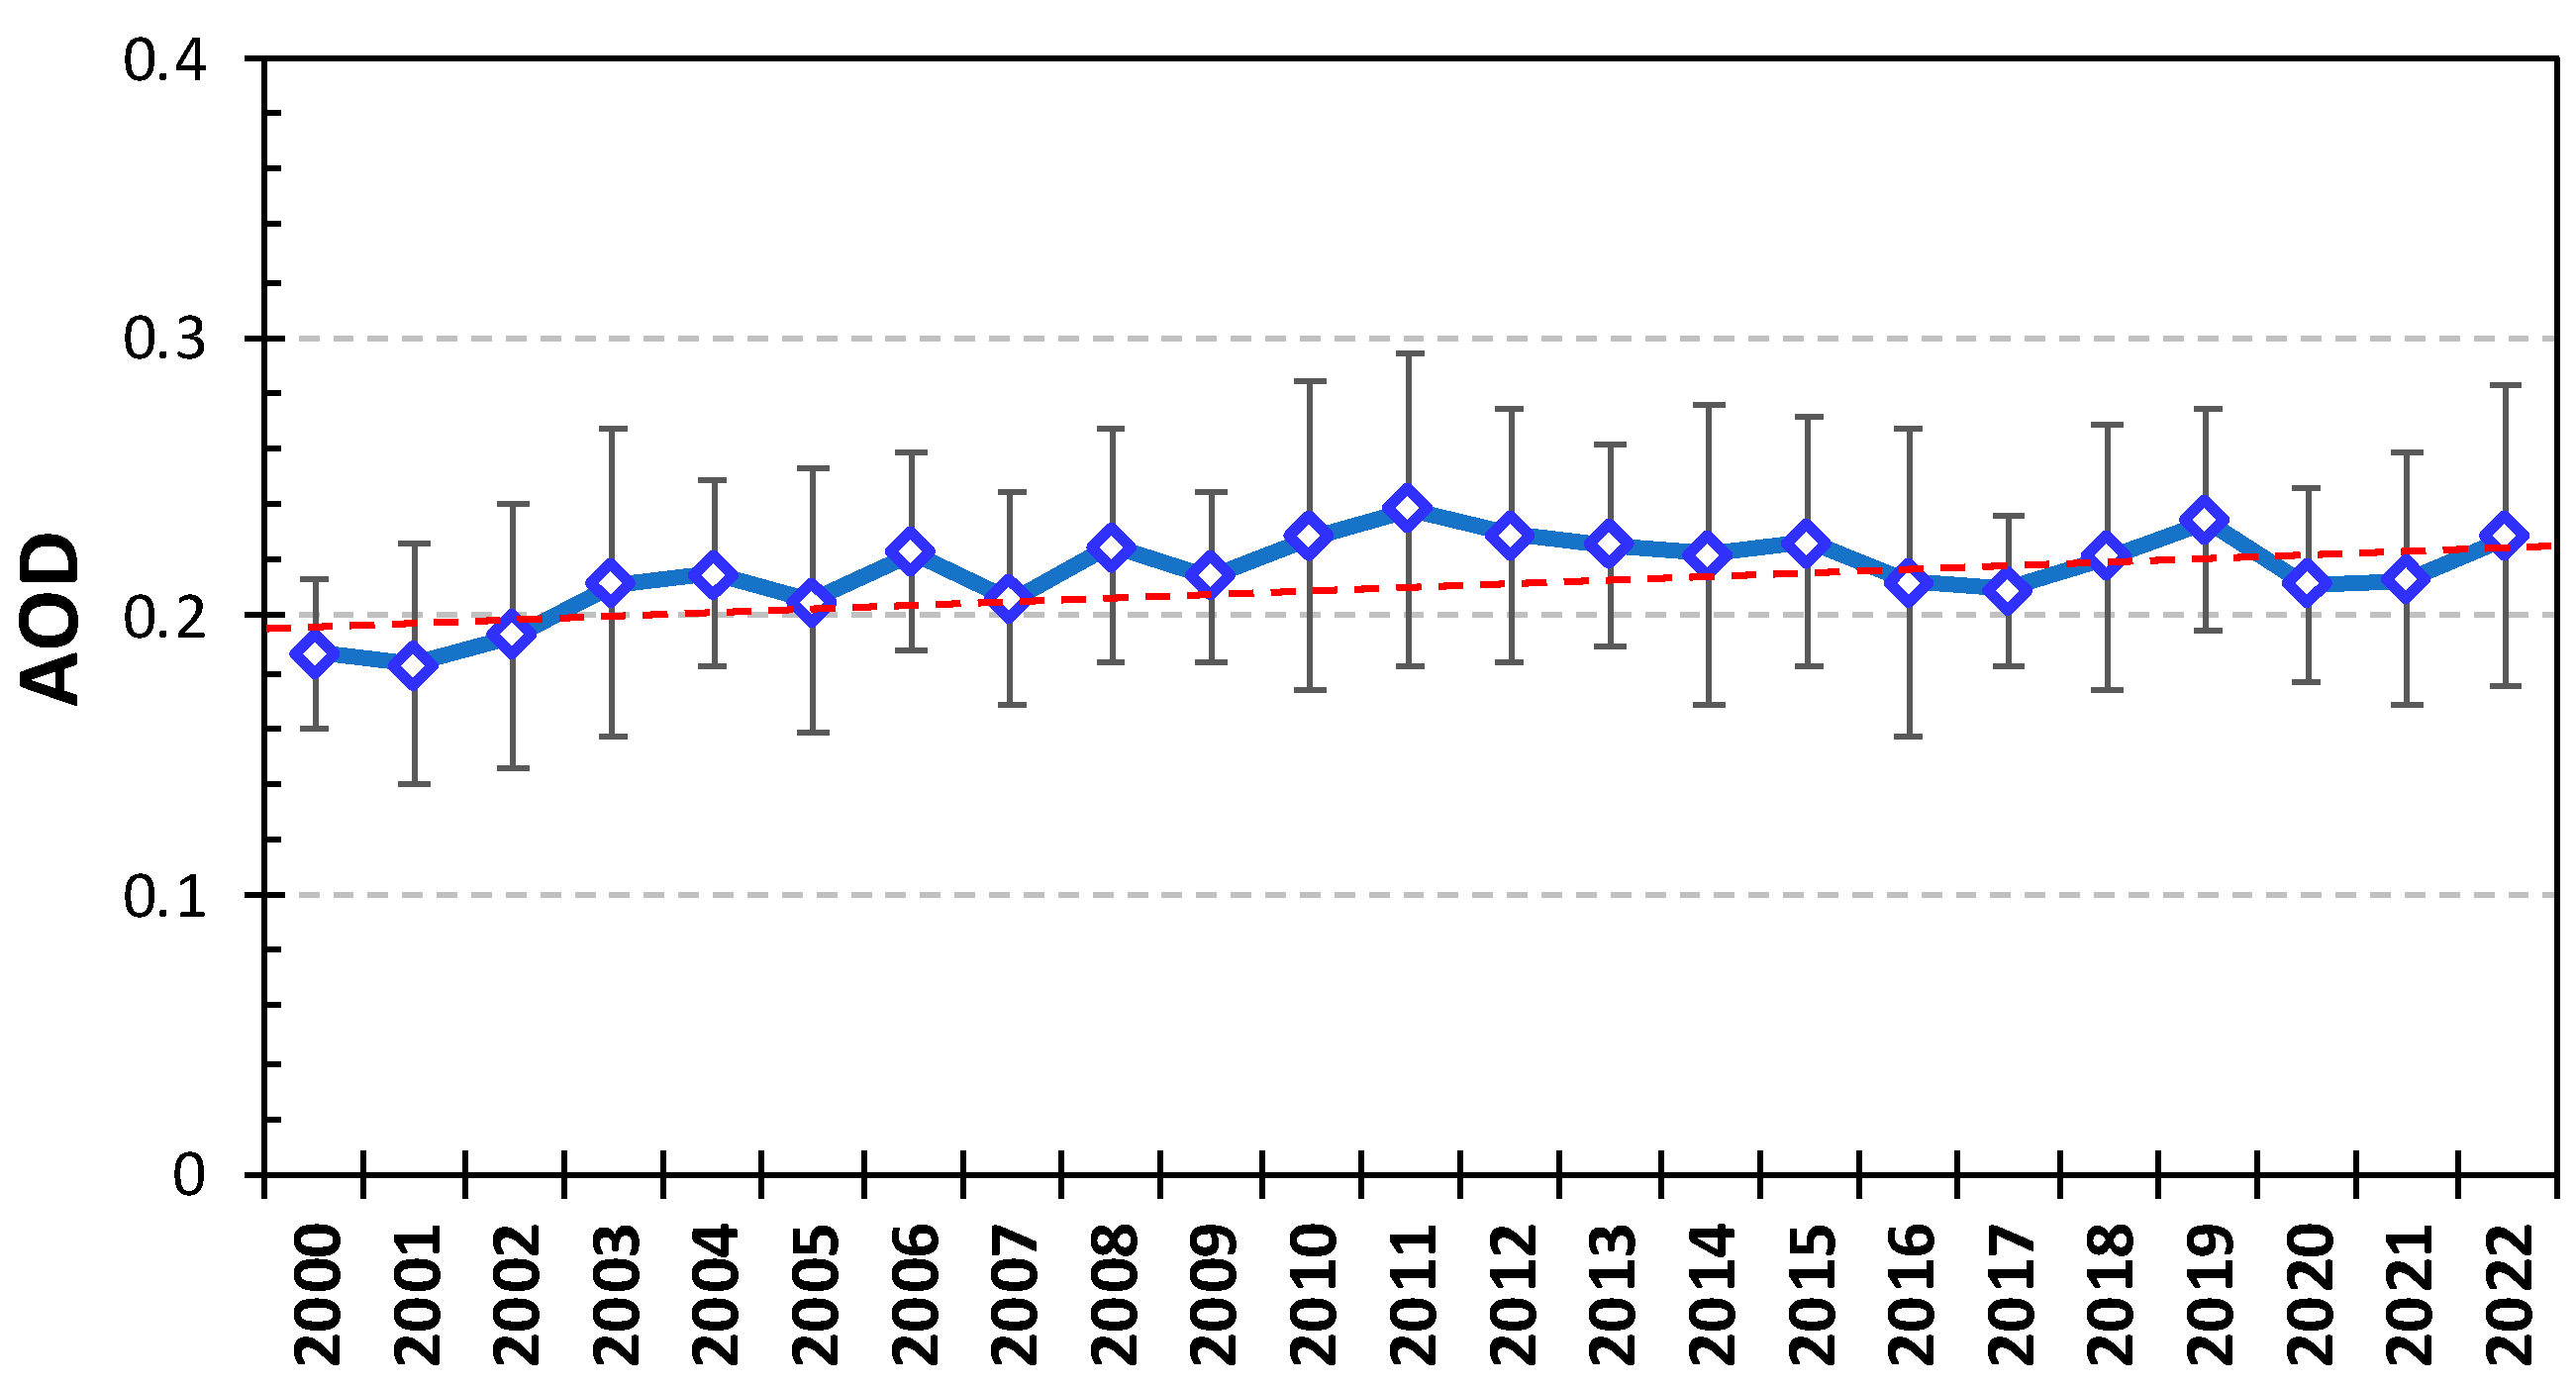
A Mann–Kendall trend test was used to assess trends in AOD from 2000 to 2022. The annual mean AOD for Kabul over the 23 years is shown in Figure 8. The time-series exhibited a fluctuating pattern, with a predominantly increasing trend, peaking in 2011 with an AOD of 0.21. The annual mean AOD indicated a statistically significant upward trend (slope of 0.001), with a slight decrease observed in 2020. This temporary decline in 2020 was attributed to the reduced anthropogenic activities during COVID-19 lockdowns. The Mann–Kendall test results for the AOD and meteorological factors are summarized in Table 3. The findings confirmed a statistically significant positive trend for AOD, with a p-value, (z), and S score of 0.044, 2, and 77, respectively. The p-value indicates the probability that the observed trend occurred by chance, the z-value represents the standardized test statistic from the Mann–Kendall test, and the S- core is the Mann–Kendall test statistic, which summarizes the magnitude of the trend. The results confirm a statistically significant positive trend for AOD. The analysis also reveals statistically significant trends for RH and PCP, with p-values of 0.002 and 0.0003, respectively. In contrast, no significant trends were observed for WS and T during this period.

3.4. Relationship between AOD and Meteorological Factors

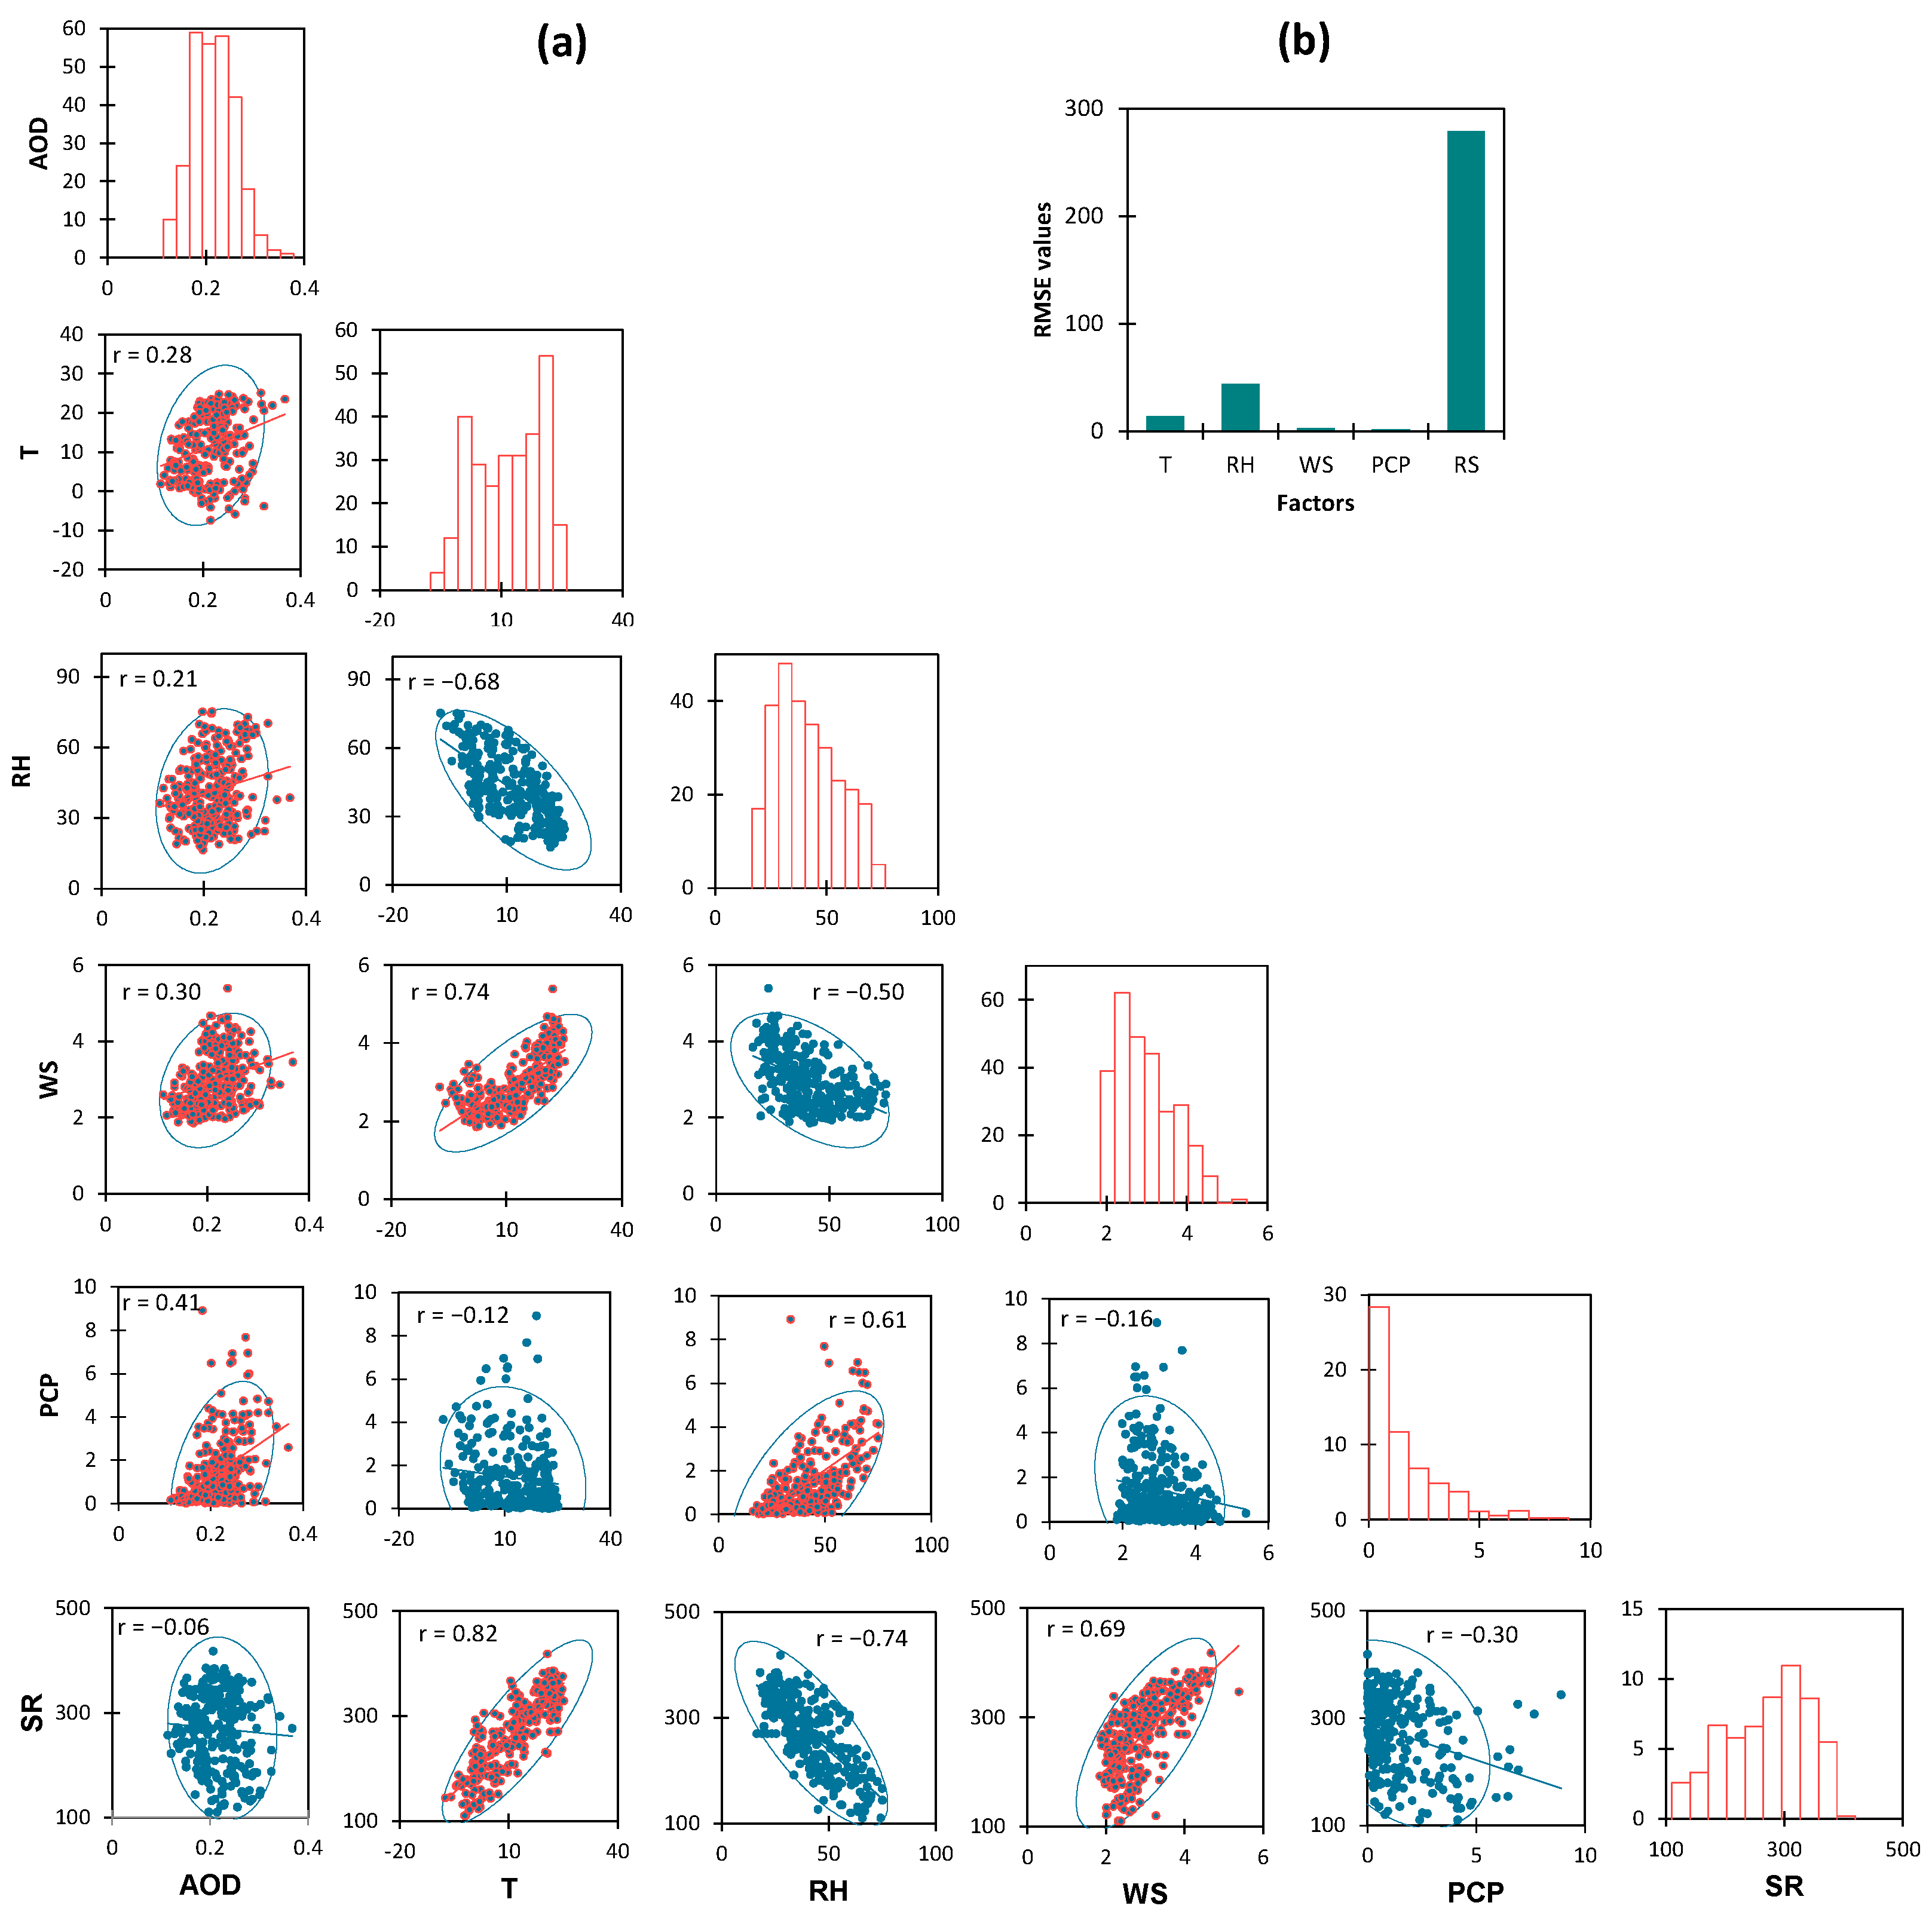
The influence of meteorological factors on AOD was found to be complex and dynamic, with various ground-level meteorological factors contributing to the observed variations in AOD, as depicted in Figure 9a. Overall, AOD showed positive correlations with T, RH, PCP, and WS and a negative correlation with SR. Specifically, PCP exhibited the strongest positive correlation with AOD with a coefficient of 0.41, followed by WS, T, RH, and SR with 0.30, 0.28, 0.21, and −0.06, respectively. A moderate positive correlation (0.28) suggested that a higher T led to an increased AOD. A high T promotes the formation of secondary aerosols through photochemical reactions and enhances the emission of biogenic and anthropogenic aerosols. A high T increases aerosol concentrations and AOD by increasing secondary aerosol formation through photochemical reactions. Increased water vapor concentration contributes to high humidity, causing atmospheric particles to absorb additional water, thereby increasing their size and mass. The moderate positive correlation (0.30) between AOD and WS can be attributed to dust and other particulates being resuspended from the surface into the atmosphere, thereby enhancing aerosol concentrations. The strongest positive correlation with PCP suggests that precipitation plays a significant role in influencing AOD levels. An increased PCP contributes to a higher AOD owing to wet deposition processes that remove particles from the atmosphere but can also lead to increased particle sizes through hygroscopic growth. While precipitation removes particles from the atmosphere, it also enhances particle growth through hygroscopic processes, thereby increasing AOD. Higher WS can lift dust and other particulates into the atmosphere, contributing to higher aerosol concentrations and subsequently increasing the AOD. The weak negative correlation (−0.06) between AOD and SR suggested that SR had a minimal direct impact on AOD. However, an increased SR can drive photochemical reactions, leading to the production of secondary aerosols, thereby indirectly influencing AOD levels. Despite its weak direct correlation with AOD, SR influences the photochemical reactions that generate secondary aerosols, indirectly affecting AOD. Figure 9b presents the RMSE values for predictive models of AOD based on various meteorological factors. These results indicate that WS and PCP had the strongest predictive relationships with AOD, indicated by their lower RMSE values of 2.83 and 2.01, respectively. Conversely, RH and SR were less effective predictors, showing higher RMSE values of 43.86 and 279.26, respectively. T exhibited moderate predictive capability, with an RMSE value of 14.19. Additionally, WS influences AOD in complex ways. Strong winds disperse aerosols [56] and serve as transporters from surrounding regions. Particularly noteworthy are the strong winds originating from the northwest, west, and southwest, which encompass desert areas in Afghanistan, Iran, and Baluchistan. These winds likely transport air masses carrying high concentrations of desert particles, potentially contributing to elevated aerosol levels in the study area. In contrast, winds from the northeast, southeast, and southwest are generally weaker, resulting in lesser contributions to particle movement.
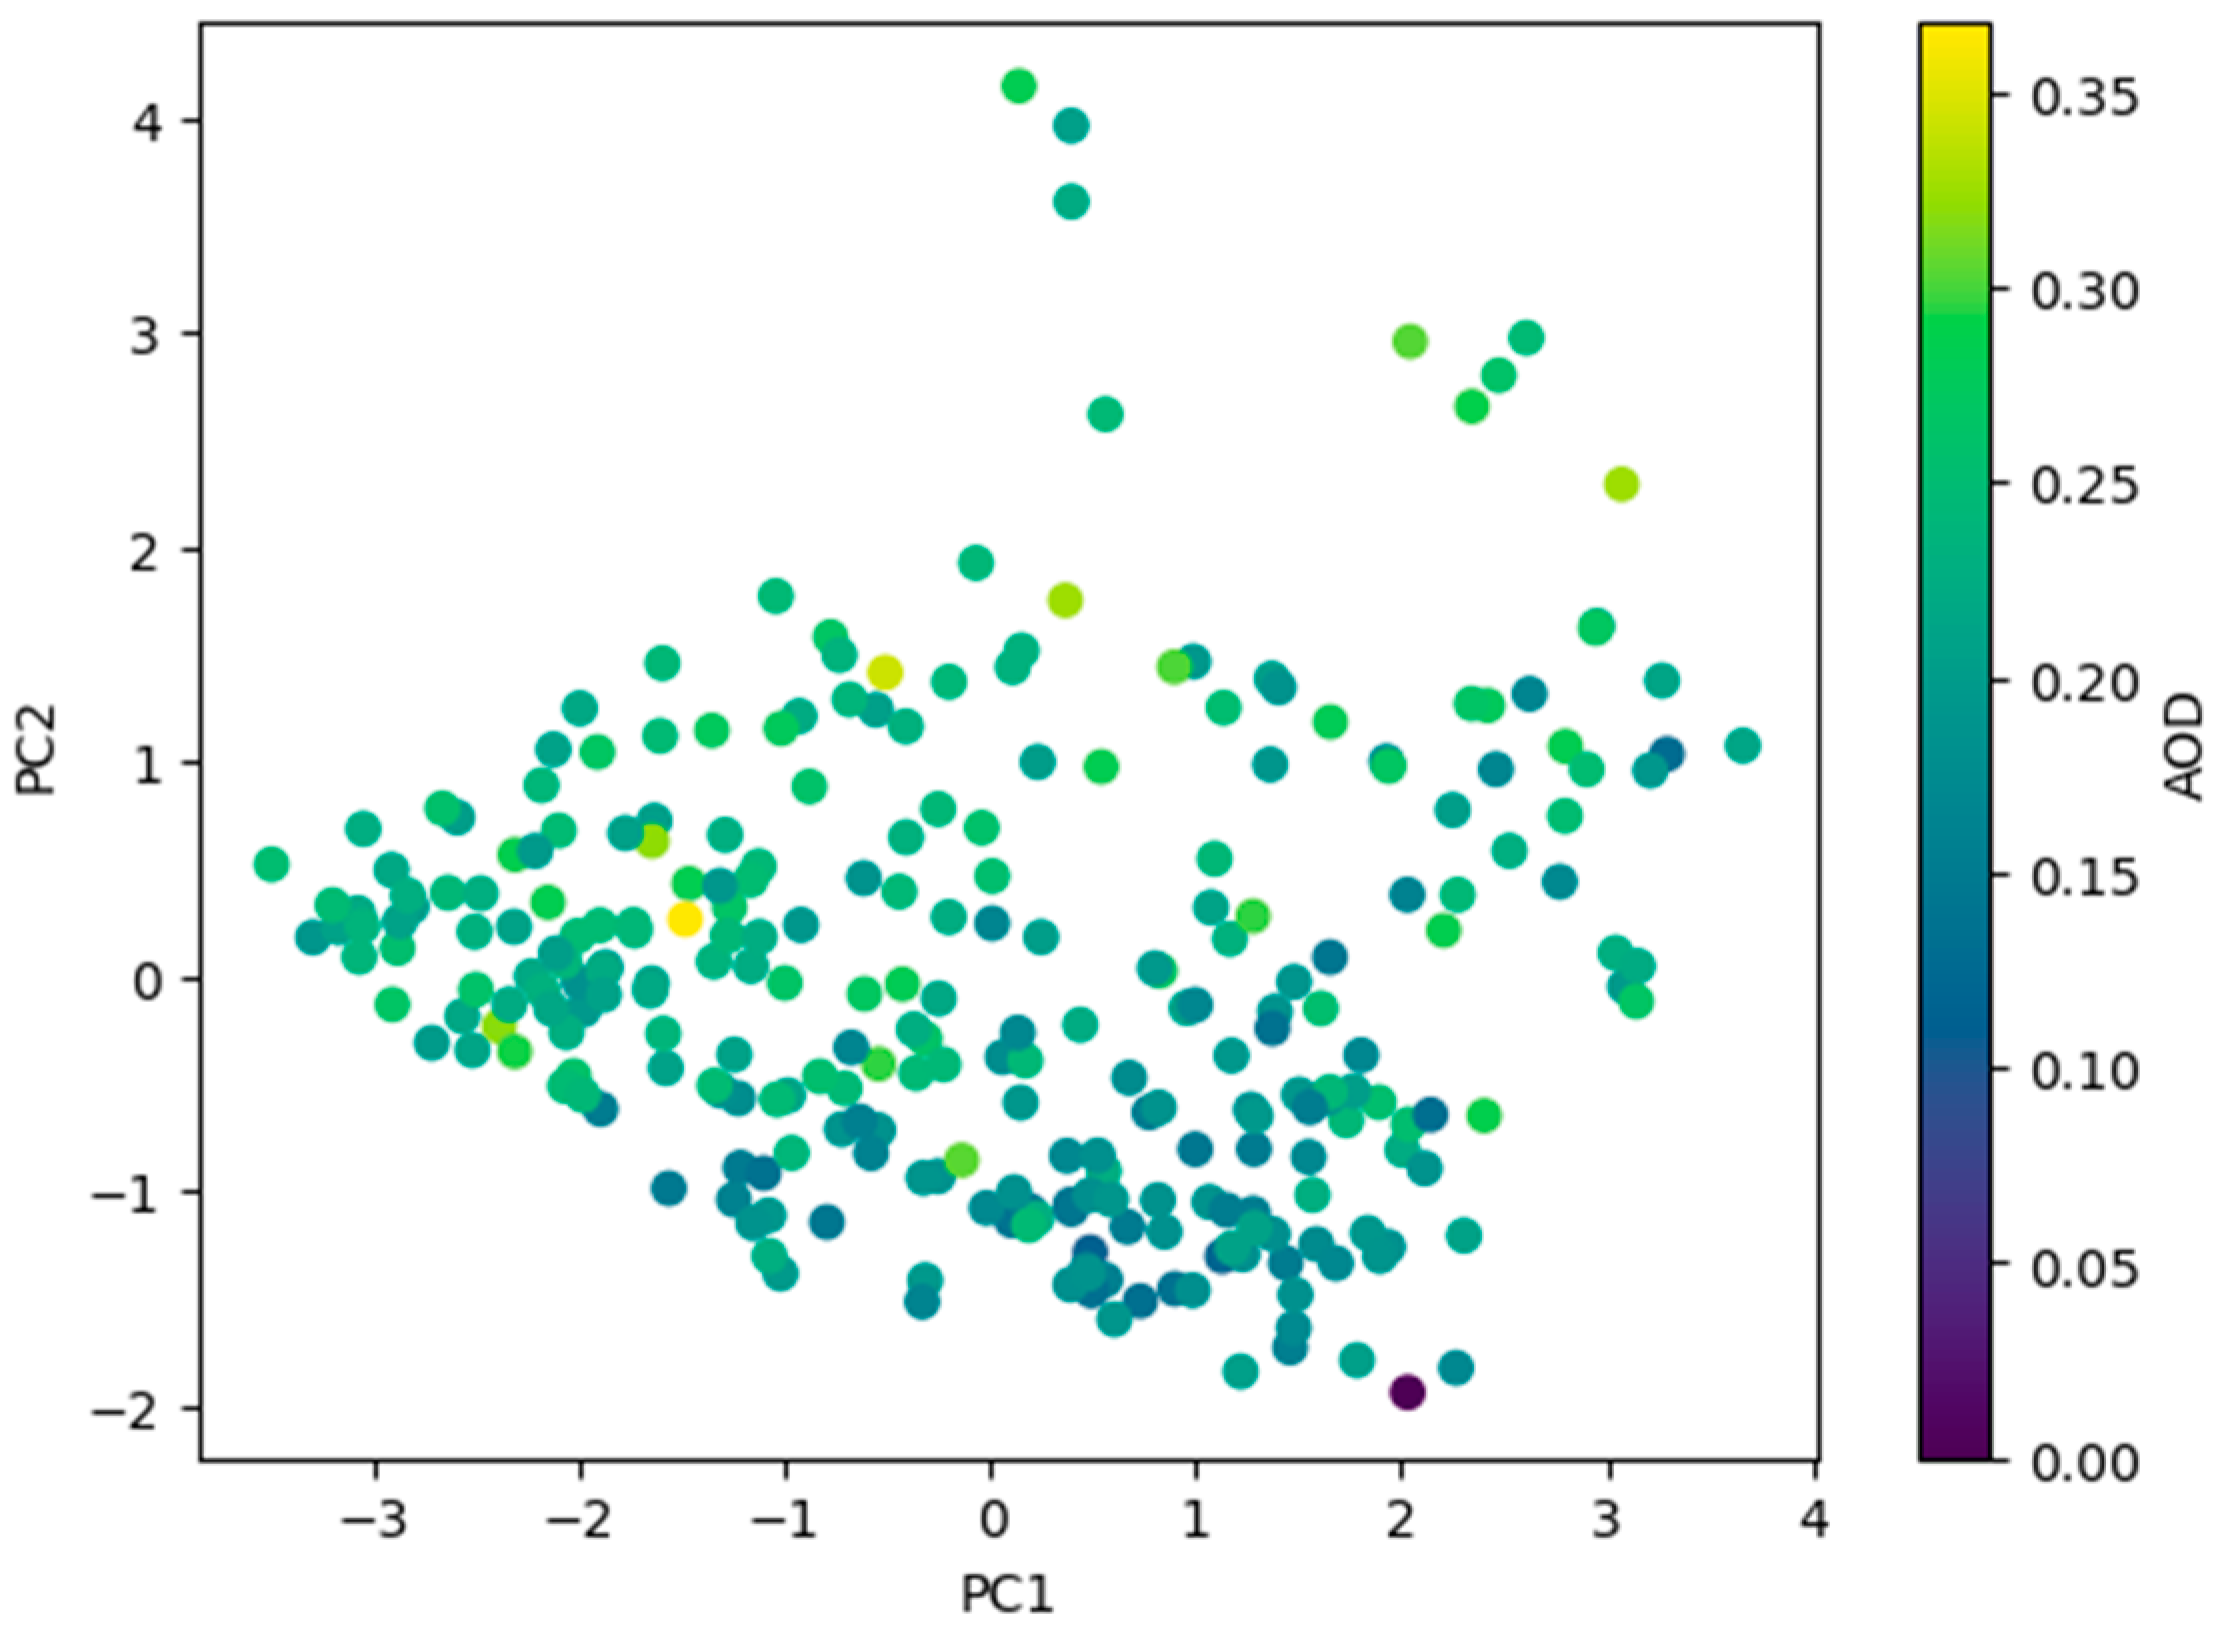
To explore the underlying structure and reduce the dimensionality of the dataset, PCA was performed on the meteorological factors T, RH, WS, PCP, and SR in relation to AOD. The PCA results revealed that the first two principal components (PC1 and PC2) accounted for a substantial portion of the variance, with PC1 explaining 58.17% and PC2 contributing an additional 22.50% (Table 4). Together, these components explained 80.67% of the total variance, effectively summarizing the primary patterns in the dataset. Figure 10 illustrates the scatter plot of the first two principal components, with data points color-coded by AOD value. The plot reveals distinct patterns that depict the relationships between the principal components and AOD. In PC1, T, WS, and SR exhibited strong negative loadings, whereas RH showed a strong positive loading. This indicated that PC1 captured a pattern where lower T, WS, and SR and higher RH correspond to higher AOD values. PCP showed a positive loading on PC1, although weaker than RH, suggesting a less prominent role in this component. On the other hand, PC2 was mainly influenced by PCP, which exhibited a very strong positive loading, implying that PC2 encapsulated variability primarily associated with PCP levels. T, RH, WS, and SR showed moderate positive loadings on PC2, suggesting that these factors also contribute to the variability captured by this component, albeit to a lesser degree compared to PCP. These findings highlight the complex interactions among different meteorological factors and their collective impact on AOD. The high cumulative explained variance of 80.67% by the first two principal components indicated that PCA effectively captured the key patterns in the dataset.

4. Conclusions

This study conducted a comprehensive analysis of the spatiotemporal variations and trends in the AOD at a 550 nm wavelength and its correlation with ground-level meteorological factors in Kabul, Afghanistan, from 2000 to 2022. The findings revealed several key insights: Kabul exhibits moderate AOD levels, with peak values concentrated in the central area, likely attributable to intensive anthropogenic activities. Higher AOD values occur predominantly during spring and summer, possibly owing to the increased emissions and dust transport from neighboring regions, whereas winter AOD levels reflect various aerosol sources.
A statistically significant increasing trend in AOD was observed from 2000 to 2022, likely driven by the increasing anthropogenic activities in the region. Meteorological factors are crucial in influencing AOD levels. PCP exhibited a stronger positive correlation with AOD. WS demonstrated complex interactions, with strong winds facilitating the transport of dust particles from nearby deserts. Additionally, T and RH were found to have moderate positive correlations with AOD. High temperatures can enhance the formation of secondary aerosols via photochemical reactions, thereby increasing AOD levels. RH contributes to the hygroscopic growth of aerosol particles, further increasing AOD.
These findings underscore the critical need for stringent air quality regulations and effective emission control measures to mitigate the adverse impacts of air pollution on public health and the environment in Kabul. The observed increasing trend in AOD emphasizes the immediate need for actions to address pollution sources and enhance air quality management strategies. Future research should focus on investigating pollutants in a broader context, encompassing other urban environments and megacities across Afghanistan.

Author Contributions

Conceptualization, data curation, visualization, original draft writing, and editing S.E.T.; writing—review and editing M.A., W.P., H.-M.L., M.H., and M.F.; resources, S.E.T., H.-M.L.; supervision, M.H., and M.F. All authors have read and agreed to the published version of the manuscript.

Funding

This research received no external funding.

Institutional Review Board Statement

Not applicable.

Informed Consent Statement

Not applicable.

Data Availability Statement

The original contributions presented in the study are included in the article, further inquiries can be directed to the corresponding author.

Acknowledgments

The authors thank the anonymous reviewers for their valuable comments.

Conflicts of Interest

The authors declare no conflicts of interest.

Abbreviations

AbbreviationExplanation
AODAerosol Optical Depth
GEEGoogle Earth Engine
MAIACMultiangle Implementation of Atmospheric Correction
MERRAModern Era Retrospective Analysis for Research and Application
MODISModerate Resolution Imaging Spectroradiometer
NASANational Aeronautics and Space Administration
NEPANational Environmental Protection Agency
NOAANational Oceanic and Atmospheric Administration
PC1Principle Component 1
PC2Principle Component 2
PCAPrinciple Component Analysis
PCPPrecipitation
PMParticulate Matter
RHRelative Humidity
RMSERoot Mean Square Error
SRSolar Radiation
TTemperature
US.EPAUnited States Environmental Protection Agency
WDWind Speed
WHOWorld Health Organization
WSWind Directions

References

  1. Inerb, M.; Phairuang, W.; Paluang, P.; Hata, M.; Furuuchi, M.; Wangpakapattanawong, P. Carbon and Trace Element Compositions of Total Suspended Particles (TSP) and Nanoparticles (PM0.1) in Ambient Air of Southern Thailand and Characterization of Their Sources. Atmosphere 2022, 13, 626. [Google Scholar] [CrossRef]
  2. Landrigan, P.J.; Fuller, R.; Acosta, N.J.R.; Adeyi, O.; Arnold, R.; Basu, N.; Baldé, A.B.; Bertollini, R.; Bose-O’Reilly, S.; Boufford, J.I.; et al. The Lancet Commission on Pollution and Health. Lancet 2018, 391, 462–512. [Google Scholar] [CrossRef] [PubMed]
  3. WHO. Ambient Air Pollution: A Global Assessment of Exposure and Burden of Disease; WHO: Geneva, Switzerland, 2016. [Google Scholar]
  4. US.EPA Particulate Matter (PM) Basics. Available online: https://www.epa.gov/pm-pollution/particulate-matter-pm-basics (accessed on 20 February 2024).
  5. Magnusson, R.; Hägglund, L.; Wingfors, H. Broad Exposure Screening of Air Pollutants in the Occupational Environment of Swedish Soldiers Deployed in Afghanistan. Mil. Med. 2012, 177, 318–325. [Google Scholar] [CrossRef] [PubMed]
  6. Hoet, P.H.M.; Brüske-Hohlfeld, I.; Salata, O.V. Nanoparticles—Known and Unknown Health Risks. J. Nanobiotechnology 2004, 2, 12. [Google Scholar] [CrossRef] [PubMed]
  7. NEPA. The Daily Air Pollution Figures for Various Areas of Kabul City; NEPA: Kabul, Afghanistan, 2023. Available online: https://www.nepa.gov.af/airpollution (accessed on 10 March 2024).
  8. Khpalwak, W.; Jadoon, W.A.; Abdel-dayem, S.M.; Sakugawa, H. Polycyclic Aromatic Hydrocarbons in Urban Road Dust, Afghanistan: Implications for Human Health. Chemosphere 2019, 218, 517–526. [Google Scholar] [CrossRef] [PubMed]
  9. Kinne, S.; Schulz, M.; Textor, C.; Guibert, S.; Balkanski, Y.; Bauer, S.E.; Berntsen, T.; Berglen, T.F.; Boucher, O.; Chin, M.; et al. An AeroCom Initial Assessment—Optical Properties in Aerosol Component Modules of Global Models. Atmos. Chem. Phys. 2006, 6, 1815–1834. [Google Scholar] [CrossRef]
  10. Remer, L.A.; Kaufman, Y.J.; Tanré, D.; Mattoo, S.; Chu, D.A.; Martins, J.V.; Li, R.R.; Ichoku, C.; Levy, R.C.; Kleidman, R.G.; et al. The MODIS Aerosol Algorithm, Products, and Validation. J. Atmos. Sci. 2005, 62, 947–973. [Google Scholar] [CrossRef]
  11. Bencherif, H.; Bounhir, A.; Bègue, N.; Millet, T.; Benkhaldoun, Z.; Lamy, K.; Portafaix, T.; Gadouali, F. Aerosol Distributions and Sahara Dust Transport in Southern Morocco, from Ground-Based and Satellite Observations. Remote Sens. 2022, 14, 2454. [Google Scholar] [CrossRef]
  12. Caido, N.G.; Ong, P.M.; Rempillo, O.; Galvez, M.C.; Vallar, E. Spatiotemporal Analysis of MODIS Aerosol Optical Depth Data in the Philippines from 2010 to 2020. Atmosphere 2022, 13, 939. [Google Scholar] [CrossRef]
  13. Chau, K.; Franklin, M.; Lee, H.; Garay, M.; Kalashnikova, O. Temporal and Spatial Autocorrelation as Determinants of Regional Aod-Pm2.5 Model Performance in the Middle East. Remote Sens. 2021, 13, 3790. [Google Scholar] [CrossRef]
  14. Ettehadi Osgouei, P.; Roberts, G.; Kaya, S.; Bilal, M.; Dash, J.; Sertel, E. Evaluation and Comparison of MODIS and VIIRS Aerosol Optical Depth (AOD) Products over Regions in the Eastern Mediterranean and the Black Sea. Atmos. Environ. 2022, 268, 118784. [Google Scholar] [CrossRef]
  15. Gouda, K.C.; Gogeri, I.; ThippaReddy, A.S. Assessment of Aerosol Optical Depth over Indian Subcontinent during COVID-19 Lockdown (March–May 2020). Environ. Monit. Assess. 2022, 194, 195. [Google Scholar] [CrossRef] [PubMed]
  16. Shin, M.; Kang, Y.; Park, S.; Im, J.; Yoo, C.; Quackenbush, L.J. Estimating Ground-Level Particulate Matter Concentrations Using Satellite-Based Data: A Review. GIScience Remote Sens. 2020, 57, 174–189. [Google Scholar] [CrossRef]
  17. Colbeck, I.; Lazaridis, M. Aerosol Science: Technology and Appliactions; Wiley: Chichester, UK, 2014; ISBN 9781119977926. [Google Scholar]
  18. Srivastava, A.K.; Devara, P.C.S.; Rao, Y.J.; Bhavanikumar, Y.; Rao, D.N. Aerosol Optical Depth, Ozone and Water Vapor Measurements over Gadanki, a Tropical Station in Peninsular India. Aerosol Air Qual. Res. 2008, 8, 459–476. [Google Scholar] [CrossRef]
  19. NOAA SURFRAD Aerosol Optical Depth. Available online: https://gml.noaa.gov/grad/surfrad/aod/#:~:text=Aerosol optical depth is a,ground by these aerosol particles (accessed on 18 April 2024).
  20. Superczynski, S.D.; Kondragunta, S.; Lyapustin, A.I. Evaluation of the Multi-angle Implementation of Atmospheric Correction (MAIAC) Aerosol Algorithm through Intercomparison with VIIRS Aerosol Products and AERONET. J. Geophys. Res. Atmos. 2017, 122, 3005–3022. [Google Scholar] [CrossRef] [PubMed]
  21. Martins, V.S.; Lyapustin, A.; Carvalho, L.A.S.; Barbosa, C.C.F.; Novo, E.M.L.M. Validation of High-resolution MAIAC Aerosol Product over South America. J. Geophys. Res. Atmos. 2017, 122, 7537–7559. [Google Scholar] [CrossRef]
  22. Kloog, I.; Sorek-Hamer, M.; Lyapustin, A.; Coull, B.; Wang, Y.; Just, A.C.; Schwartz, J.; Broday, D.M. Estimating Daily PM 2.5 and PM 10 across the Complex Geo-Climate Region of Israel Using MAIAC Satellite-Based AOD Data. Atmos. Environ. 2015, 122, 409–416. [Google Scholar] [CrossRef] [PubMed]
  23. Lee, H.J.; Chatfield, R.B.; Strawa, A.W. Enhancing the Applicability of Satellite Remote Sensing for PM 2.5 Estimation Using MODIS Deep Blue AOD and Land Use Regression in California, United States. Environ. Sci. Technol. 2016, 50, 6546–6555. [Google Scholar] [CrossRef] [PubMed]
  24. Just, A.C.; Wright, R.O.; Schwartz, J.; Coull, B.A.; Baccarelli, A.A.; Tellez-Rojo, M.M.; Moody, E.; Wang, Y.; Lyapustin, A.; Kloog, I. Using High-Resolution Satellite Aerosol Optical Depth To Estimate Daily PM 2.5 Geographical Distribution in Mexico City. Environ. Sci. Technol. 2015, 49, 8576–8584. [Google Scholar] [CrossRef] [PubMed]
  25. Stafoggia, M.; Schneider, A.; Cyrys, J.; Samoli, E.; Andersen, Z.J.; Bedada, G.B.; Bellander, T.; Cattani, G.; Eleftheriadis, K.; Faustini, A.; et al. Association Between Short-Term Exposure to Ultrafine Particles and Mortality in Eight European Urban Areas. Epidemiology 2017, 28, 172–180. [Google Scholar] [CrossRef] [PubMed]
  26. Sen, A.; Abdelmaksoud, A.S.; Nazeer Ahammed, Y.; Alghamdi, M.A.; Banerjee, T.; Bhat, M.A.; Chatterjee, A.; Choudhuri, A.K.; Das, T.; Dhir, A.; et al. Variations in Particulate Matter over Indo-Gangetic Plains and Indo-Himalayan Range during Four Field Campaigns in Winter Monsoon and Summer Monsoon: Role of Pollution Pathways. Atmos. Environ. 2017, 154, 200–224. [Google Scholar] [CrossRef]
  27. Sayer, A.M.; Munchak, L.A.; Hsu, N.C.; Levy, R.C.; Bettenhausen, C.; Jeong, M.J. Modis Collection 6 Aerosol Products: Comparison between Aqua’s e-Deep Blue, Dark Target, and “Merged” Data Sets, and Usage Recommendations. J. Geophys. Res. 2014, 119, 13965–13989. [Google Scholar] [CrossRef]
  28. Singh, N.; Murari, V.; Kumar, M.; Barman, S.C.; Banerjee, T. Fine Particulates over South Asia: Review and Meta-Analysis of PM2.5 Source Apportionment through Receptor Model. Environ. Pollut. 2017, 223, 121–136. [Google Scholar] [CrossRef] [PubMed]
  29. Singh, N.; Banerjee, T.; Raju, M.P.; Deboudt, K.; Sorek-Hamer, M.; Singh, R.S.; Mall, R.K. Aerosol Chemistry, Transport, and Climatic Implications during Extreme Biomass Burning Emissions over the Indo-Gangetic Plain. Atmos. Chem. Phys. 2018, 18, 14197–14215. [Google Scholar] [CrossRef]
  30. Meng, H.; Bai, G.; Wang, L. Analysis of the Spatial and Temporal Distribution Characteristics of AOD in Typical Industrial Cities in Northwest China and the Influence of Meteorological Factors. Atmos. Pollut. Res. 2024, 15, 101957. [Google Scholar] [CrossRef]
  31. Li, S.; Wang, T.; Xie, M.; Han, Y.; Zhuang, B. Observed Aerosol Optical Depth and Angstrom Exponent in Urban Area of Nanjing, China. Atmos. Environ. 2015, 123, 350–356. [Google Scholar] [CrossRef]
  32. Li, J.; Ge, X.; He, Q.; Abbas, A. Aerosol Optical Depth (AOD): Spatial and Temporal Variations and Association with Meteorological Covariates in Taklimakan Desert, China. PeerJ 2021, 9, e10542. [Google Scholar] [CrossRef] [PubMed]
  33. Przybylak, R.; Svyashchennikov, P.N.; Uscka-Kowalkowska, J.; Wyszyński, P. Solar Radiation in the Arctic during the Early Twentieth-Century Warming (1921-50): Presenting a Compilation of Newly Available Data. J. Clim. 2021, 34, 21–37. [Google Scholar] [CrossRef]
  34. Ulfat, I.; Javed, F.; Abbasi, F.A.; Kanwal, F.; Usman, A.; Jahangir, M.; Ahmed, F. Estimation of Solar Energy Potential for Islamabad, Pakistan. Energy Procedia 2012, 18, 1496–1500. [Google Scholar] [CrossRef]
  35. Ismail, A.H.; Dawi, E.A.; Almokdad, N.; Abdelkader, A.; Salem, O. Estimation and Comparison of the Clearness Index Using Mathematical Models—Case Study in the United Arab Emirates. Evergreen 2023, 10, 863–869. [Google Scholar] [CrossRef]
  36. Foschini, F. Kabul Unpacked: A Geographical Guide to a Metropolis in the Making. 2019. Available online: https://www.afghanistan-analysts.org/en/special-reports/kabul-unpacked-a-geographical-guide-to-a-metropolis-in-the-making/ (accessed on 22 February 2024).
  37. ADB Kabul Air Quality Management: Strategy Report; Asian Development Bank location: Metro Manila, Philippines, 2007.
  38. Foschini, F. Kabul and the Challenge of Dwindling Foreign Aid; United States Institute of Peace: Washington, DC, USA, 2017; ISBN 9781601276414. [Google Scholar]
  39. Hsu, N.C.; Gautam, R.; Sayer, A.M.; Bettenhausen, C.; Li, C.; Jeong, M.J.; Tsay, S.C.; Holben, B.N. Global and Regional Trends of Aerosol Optical Depth over Land and Ocean Using SeaWiFS Measurements from 1997 to 2010. Atmos. Chem. Phys. 2012, 12, 8037–8053. [Google Scholar] [CrossRef]
  40. Lyapustin, A.; Wang, Y.; Laszlo, I.; Kahn, R.; Korkin, S.; Remer, L.; Levy, R.; Reid, J.S. Multi-Angle Implementation of Atmospheric Correction (MAIAC): 2. Aerosol Algorithm. J. Geophys. Res. Atmos. 2011, 116, 1–15. [Google Scholar] [CrossRef]
  41. Gorelick, N.; Hancher, M.; Dixon, M.; Ilyushchenko, S.; Thau, D.; Moore, R. Google Earth Engine: Planetary-Scale Geospatial Analysis for Everyone. Remote Sens. Environ. 2017, 202, 18–27. [Google Scholar] [CrossRef]
  42. Kumar, L.; Mutanga, O. Google Earth Engine Applications; Mdpi AG: Basel, Switzerland, 2019; ISBN 9783038978848. [Google Scholar]
  43. NASA Modern-Era Retrospective Analysis for Research and Applications, Version 2. Available online: https://gmao.gsfc.nasa.gov/reanalysis/MERRA-2/ (accessed on 13 April 2024).
  44. Gelaro, R.; McCarty, W.; Suárez, M.J.; Todling, R.; Molod, A.; Takacs, L.; Randles, C.A.; Darmenov, A.; Bosilovich, M.G.; Reichle, R.; et al. The Modern-Era Retrospective Analysis for Research and Applications, Version 2 (MERRA-2). J. Clim. 2017, 30, 5419–5454. [Google Scholar] [CrossRef]
  45. NASA POWER Data Methodology. Available online: https://power.larc.nasa.gov/docs/methodology/ (accessed on 8 April 2024).
  46. Randles, C.A.; da Silva, A.M.; Buchard, V.; Colarco, P.R.; Darmenov, A.; Govindaraju, R.; Smirnov, A.; Holben, B.; Ferrare, R.; Hair, J.; et al. The MERRA-2 Aerosol Reanalysis, 1980 Onward. Part I: System Description and Data Assimilation Evaluation. J. Clim. 2017, 30, 6823–6850. [Google Scholar] [CrossRef]
  47. Buchard, V.; Randles, C.A.; da Silva, A.M.; Darmenov, A.; Colarco, P.R.; Govindaraju, R.; Ferrare, R.; Hair, J.; Beyersdorf, A.J.; Ziemba, L.D.; et al. The MERRA-2 Aerosol Reanalysis, 1980 Onward. Part II: Evaluation and Case Studies. J. Clim. 2017, 30, 6851–6872. [Google Scholar] [CrossRef]
  48. Buchard, V.; da Silva, A.M.; Randles, C.A.; Colarco, P.; Ferrare, R.; Hair, J.; Hostetler, C.; Tackett, J.; Winker, D. Evaluation of the Surface PM2.5 in Version 1 of the NASA MERRA Aerosol Reanalysis over the United States. Atmos. Environ. 2016, 125, 100–111. [Google Scholar] [CrossRef]
  49. Rienecker, M.; Keppenne, C.; Kovach, R.; Jacob, J.; Marshak, J. The GMAO’s Ensemble Kalman Filter Ocean Data Assimilation System. In Proceedings of the Third WCRP International Conference on Reanalysis, Tokyo, Japan, 28 January–1 February 2008; pp. 9–15. [Google Scholar]
  50. Reichle, R.H.; Liu, Q.; Koster, R.D.; Draper, C.S.; Mahanama, S.P.P.; Partyka, G.S. Land Surface Precipitation in MERRA-2. J. Clim. 2017, 30, 1643–1664. [Google Scholar] [CrossRef]
  51. Bosilovich, M.; Akella, S.; Coy, L.; Cullather, R.; Draper, C.; Gelaro, R.; Kovach, R.; Liu, Q.; Molod, A.; Norris, P.; et al. MERRA-2: Initial Evaluation of the Climate. NASA Tech. Rep. Ser. Glob. Model. Data Assim. 2015, 43, 139. [Google Scholar]
  52. ADB. Country Synthesis Report on Urban Air Quality Management: Afghanistan; ADB: Metro Manila, PH, USA, 2006. [Google Scholar]
  53. Di Lella, L.A.; Loppi, S.; Protano, G.; Riccobono, F. Toxic Trace Elements and Organic Compounds in the Ambient Air of Kabul, Afghanistan. Atmos. Environ. 2006, 40, 225–237. [Google Scholar] [CrossRef]
  54. Torabi, S.E.; Amin, M.; Phairuang, W.; Hata, M.; Furuuchi, M. Preliminary Discussion about the Air Pollution Status in Afghanistan from Aerosol Optical Depth. IOP Conf. Ser. Earth Environ. Sci. 2023, 1199, 012022. [Google Scholar] [CrossRef]
  55. Shen, L.; Wang, H.; Zhao, T.; Liu, J.; Bai, Y.; Kong, S.; Shu, Z. Characterizing Regional Aerosol Pollution in Central China Based on 19 Years of MODIS Data: Spatiotemporal Variation and Aerosol Type Discrimination. Environ. Pollut. 2020, 263, 114556. [Google Scholar] [CrossRef]
  56. Cugerone, K.; De Michele, C.; Ghezzi, A.; Gianelle, V. Aerosol Removal Due to Precipitation and Wind Forcings in Milan Urban Area. J. Hydrol. 2018, 556, 1256–1262. [Google Scholar] [CrossRef]
Figure 1. Flowchart of this study’s process.
Atmosphere 15 00849 g001
Figure 2. Location and base map of the study site. The blue lines represent the boundary of Kabul, including 22 districts.
Atmosphere 15 00849 g002
Figure 3. Spatial distribution of monthly average AOD from 2000 to 2022 over Kabul. The blue and red colors indicate clear and polluted environments, respectively.
Atmosphere 15 00849 g003
Figure 4. Seasonal spatial variations in AOD over the study site in different periods: 2000, 2005, 2010, 2015, and 2020.
Atmosphere 15 00849 g004
Figure 5. Frequency distribution based on daily AOD values at 550 nm across four seasons in Kabul from 2000 to 2022.
Atmosphere 15 00849 g005
Figure 6. Annual spatial distribution of AOD from 2000 to 2022 over the study site.
Atmosphere 15 00849 g006
Figure 7. Difference in average AOD between 2000 and 2022.
Atmosphere 15 00849 g007
Figure 8. Average and standard deviation of AOD from 2000 to 2022. The red line indicates the trend.
Atmosphere 15 00849 g008
Figure 9. (a) Correlation matrices among AOD, T, RH, WS, PCP, and SR, calculated using Pearson correlation based on the monthly mean of these variables from 2000 to 2022. Red and blue scatterplots indicate positive and negative correlations, respectively. (b) The RMSE values for AOD are based on meteorological factors.
Atmosphere 15 00849 g009
Figure 10. Scatter plot of principal components (PC1 and PC2) colored by AOD value.
Atmosphere 15 00849 g010
Table 1. Observational statistics of AOD from 2000 to 2022 over Kabul.
VariableObservationsMinimumMaximumMeanStd.
Jan3570.0610.4130.1920.055
Feb2480.0750.4040.2260.042
Mar4240.0610.4980.2300.068
Apr5940.0510.9820.2490.085
May5780.0730.4510.2270.071
Jun6960.0550.9530.2300.084
Jul7210.0390.9230.2480.094
Aug5810.0680.8990.2440.090
Sep5920.0550.7360.1980.073
Oct5920.0460.8890.1750.076
Nov5180.0400.4310.1710.067
Dec4820.0570.9980.1660.065
Annual 0.2140.090
Table 2. The minimum, maximum, mean, and standard deviation of seasonal AOD values from 2000 to 2022 over Kabul.
SeasonObservationsMinimumMaximumMeanStd.
Spring18640.0510.9820.2330.086
Summer18940.0390.9230.2320.095
Autumn15920.0400.9980.1710.074
Winter10470.0610.4980.2150.061
Table 3. Results of the Mann–Kendall test for AOD and meteorological factors from 2000 to 2022.
Variablezsp ValueSlope
AOD2770.0440.001
T−1.563−1660.117−0.015
RH3.0631170.0020.813
PCP3.5911370.000333.159
WS−0.475−190.634−0.002
Table 4. Loadings of meteorological factors on the first two principal components.
FactorsPC1PC2
T−0.520.29
RH0.490.35
WS−0.470.26
PCP0.260.80
SR−0.430.26
Disclaimer/Publisher’s Note: The statements, opinions and data contained in all publications are solely those of the individual author(s) and contributor(s) and not of MDPI and/or the editor(s). MDPI and/or the editor(s) disclaim responsibility for any injury to people or property resulting from any ideas, methods, instructions or products referred to in the content.