Article

Variations in Cloud Concentration Nuclei Related to Continental Air Pollution Control and Maritime Fuel Regulation over the Northwest Pacific Ocean

1
Frontiers Science Center for Deep Ocean Multispheres and Earth System, Ministry of Education, Ocean University of China, Qingdao 266100, China
2
Sanya Oceanographic Institution, Ocean University of China, Sanya 572024, China
3
Institute for Environmental and Climate Research, Jinan University, Guangzhou 510632, China
4
Environment Research Institute, Shandong University, Qingdao 266237, China
5
Laboratory for Marine Ecology and Environmental Sciences, Laoshan Laboratory, Qingdao 266237, China
*
Authors to whom correspondence should be addressed.
Atmosphere 2024, 15(8), 972; https://doi.org/10.3390/atmos15080972
Submission received: 10 July 2024 / Revised: 11 August 2024 / Accepted: 12 August 2024 / Published: 14 August 2024

Abstract

:
Here, we compared the concentrations of cloud condensation nuclei (CCN) and particle number size distributions (PNSDs) measured during the transient period from the winter to the summer East Asian monsoon in 2021 with those in 2014 to explore possible responses to how CCN responds to upwind continental air pollutant mitigation and marine traffic fuel sulfur content (FSC) regulation over the northwest Pacific Ocean (NWPO). We also employed the Positive Matrix Factorization (PMF) analysis to apportion concentrations of CCN (Nccn) to different sources in order to quantify its source-specified responses to mitigation of air pollution during the transient period. Our results showed that (1) upwind continental mitigation likely reduced Nccn by approximately 200 cm−3 and 400 cm−3 at 0.2% and 0.4% supersaturation (SS), respectively, in the marine background atmosphere over the NWPO; (2) FSC regulation resulted in a decrease in Nccn at 0.4% SS by about 50 cm−3 and was nearly negligible at 0.2% SS over the NWPO. Additionally, a PMF-resolved factor, characterized by a dominant nucleation mode, was present only in 2014 and disappeared in 2021, likely due to the reduction. This estimation, however, suffered from uncertainties since seasonal changes were hard to be deducted accurately. PMF-resolved factors accurately represented Nccn in 80–90% of cases, but this accuracy was not observed in the remaining cases. Finally, an integrated analysis of satellite-derived cloud parameters and ship-based measurements indicated that the reduced Nccn over the NWPO might be co-limited with meteorological factors in forming cloud droplets during the transient period.

Graphical Abstract

1. Introduction

Global warming is reportedly inducing an increase in natural disasters, such as strong hurricanes, severe heat waves, extreme droughts, etc., and this has led to significant efforts to accurately quantify its key driving factors [1]. Despite these efforts, large uncertainties remain regarding the effective climate forcing from these key factors, particularly in the area of aerosol–cloud interactions. These interactions are complex, involving modifications of cloud droplet effective radius, number concentration, cloud fraction, cloud thickness, and lifetime [1,2]. Covering approximately two-thirds of the Earth’s surface, the ocean serves as a significant source of moisture, resulting in the frequent formation of low clouds. These low-cloud systems, sensitive to changes in atmospheric cloud condensation nuclei (CCN) levels from both natural and anthropogenic sources [2,3,4,5,6,7,8,9,10,11], add considerable uncertainties to current climate modeling. This sensitivity is particularly pronounced in remote marine atmospheres with low CCN loading [2,4,9,12], and the impact of anthropogenic air pollutants in these areas remains a subject of debate [2,11,13]. To minimize the uncertainties, various campaigns have been recently undertaken to quantify sources and dynamic changes of CCN using ship-based and aircraft measurements over clean and polluted marine atmospheres [10,12,13,14,15,16].
In the northwest Pacific Ocean (NWPO), located downwind of the Asian continents, notable impacts on CCN number concentrations (Nccn) and associated low-clouds are observed due to long-range transport of primary and secondary anthropogenic aerosols [5,13,17,18,19,20,21,22,23,24]. These aerosols demonstrate diverse cloud activation properties [4,5,11]. Given that China is a major source of air pollutant emissions upwind of the NWPO, the country’s significant reduction in emissions has been ongoing since 2013 [25,26]. This led to significant decreases in atmospheric particle mass concentrations and ambient SO2 together with atmospheric particle number concentrations (PNCs) being decreased to some extent therein [24,27]. How the reduction affects PNCs and Nccn at various supersaturations in downwind marine atmospheres is poorly understood. The same can be said for the possible impact of the changes on clouds over the NWPO [23]. Additionally, the NWPO encompasses busy marine traffic routes [8,28]. Since 2020, the international fuel sulfur content (FSC) regulation on marine traffic has been in effect, with certain coastal countries implementing similar measures even earlier [29,30]. However, the specific effect of the FSC regulation on Nccn over the NWPO is still largely unexplored. With these reduced anthropogenic interferences, two important questions were raised: (1) How can the decrease of PNCs and Nccn over the NWPO be quantified with the reduction from observations? (2) Does the reduction increase the susceptibility of cloud droplet numbers to Nccn over the NWPO?
To investigate the issues, i.e., the reduction-derived decrease of PNCs and Nccn and the possible impact on cloud properties over the NWPO, we participated in three cruise campaigns spanning the transition from the East Asian winter monsoon to the summer monsoon in 2021, 2022, and 2023, gathering data to compare with previous measurements over the NWPO from 2014 [11,31]. This study conducted a comprehensive comparison of Nccn and PNCs measured in 2021 with those from the later spring of 2014, taking into account potential seasonal changes. We utilized particle size distribution as tracers for specific aerosol sources and adjusted Nccn under different supersaturation conditions to match the aerosol particle size distribution characteristics, representing the largest particle size. Based on this, we employed an adjusted Positive Matrix Factorization (PMF) to identify and apportion Nccn sources during the two campaigns, which were conducted under significantly different emission scenarios from air pollutant sources in upwind continental regions and maritime traffic. Additionally, we explored instances where PMF either underestimated or overestimated Nccn by 10–20% during each campaign, an aspect often overlooked in the literature, analyzing these discrepancies in light of episodic changes in mixed contributions from identified factors. Finally, we derived atmospheric implications by analyzing both satellite-derived cloud parameters and ship-based measurements, providing insights into the combined effect of upwind continental mitigation and FSC regulation on cloud droplet formation over the NWPO during the transition period.

2. Materials and Methods

2.1. Ship-Based Measurements

In 2021, 2022, and 2023, the Frontiers Science Center for Deep Ocean Multispheres and Earth System (MOE of the People’s Republic China) organized three multidisciplinary cruise campaigns over the NWPO during the transitional period of the East Asian Monsoon using an R/V Dongfanghong-3. In 2021, the campaign covered the day of year (DOY) 129–168, which involved four weeks of cruising from the edge of the ocean desert to the Kuroshio Extension, as illustrated in Figure 1a. In 2014, a cruise campaign over the northwest Pacific was organized on DOY 77–112 using an R/V Dongfanghong-2 (Figure 1b). Both campaigns focused on the oceanic zone at 28–37° N Latitude and 145–150° E Longitude, dedicating approximately three weeks to comprehensive oceanic and atmospheric observations.
Detailed information pertaining to the online and offline measurements of atmospheric particles, CCN, and reactive gases during the campaign of 2014 is available in our previous studies [11,31] and the online measurements of atmospheric particles and CCN are summarized as follows: (1) A Fast Mobility Particle Sizer (FMPS, TSI Model 3091, Shoreview, MN, USA) was used to measure PNCs of 5.6–560 nm atmospheric particles with 32 size bins downstream of a diffusion dryer; (2) a continuous flow CCN counter (CCNC, DMT Model 100, Longmont, CO, USA) was calibrated immediately before the campaign through the commercial service from a DMT vendor in China and used to measure the bulk Nccn at supersaturation (SS) varying from 0.2% to 1.0%; (3) the FMPS data were corrected on the basis of Jeong and Evans [32]; (4) the ship’s self-emission signals were exhaustively screened out, leaving approximately half of all measurements available for data analysis.
In 2021, we set up an air-conditioned container to house a suite of instruments on the forward deck of the R/V Dongfanghong-3. The design can largely minimize the interference from pollutants emitted by the research vessel [33]. In the container, a scanning mobility particle sizer (SMPS, Grimm DMA + CPC5416, Hamburg, Germany) equipped with a long differential mobility analyzer and an additional condensation particle counter (CPC, TSI Model 3775, Shoreview, MN, USA) were combined to measure particle number size distributions from 11 nm to 1110 nm downstream of a diffusion dryer. The same CCN counter with the calibration from the DMT vendor immediately before the campaign was used to measure Nccn at 0.2–1.0% SS. In addition, a URG-9000D Ambient Ion Monitor-Ion chromatography system (AIM-IC, Thermo Fisher, Waltham, MA, USA) was used to semi-continuously measure hourly averaged concentrations of gaseous and water-soluble ions in PM2.5. The details of AIM-IC can be found in Chen et al. [34]. More online and offline measurements of gaseous and particulate species in the marine atmosphere were also conducted, but the data were not directly related to this study and not included here.
In 2022 and 2023, the cruise campaigns were performed over the NWPO during the seasonal period later than in 2021. During the cruise campaigns performed over the NWPO in 2015–2017 and 2020, one of the CPC, FMPS, and CCN counters did not work properly. Thus, the cruise campaigns in 2014 and 2021 were selected for comparison.

2.2. Web-Based Satellite and Meteorological Data

The 24 h air mass back trajectories were calculated using the Hybrid Single-Particle Lagrangian Integrated Trajectory (HYSPLIT) model from the National Oceanic and Atmospheric Administration (NOAA) Air Resources Laboratory to identify the origins of air masses. The 24 h backward trajectories starting at 500 m and 1000 m above mean sea level (a.m.s.l.) were performed every 6 h. Meteorological data, including wind speed and direction, temperature, pressure, and relative humidity, were measured simultaneously on board the R/V.
Satellite-based cloud parameters, including cloud fraction (CF), liquid water path (LWP), cloud effective droplet radius (CER), and aerosol optical depth (AOD) were downloaded from The National Aeronautics and Space Administration (NASA, https://ladsweb.modaps.eosdis.nasa.gov/search/order/2/MYD08_D3--61, last access: 5 September 2023). The cloud number droplet concentrations (CDNCs) were calculated from the satellite data as detailed in Supporting Information (Text S1) [35,36,37]. Considering spatial variations of the variables, three oceanic zones were classified, as shown in Figure 1, to obtain the zone averages for analysis. However, the products suffered from uncertainties on LWP and CER, particularly those data associated with drizzling stratus clouds.

2.3. PMF Analysis

The PMF stands as a widely adopted analytical tool for source apportionment in atmospheric particle number size distributions [27,38] and has been used for apportioning Nccn to different sources in the marine atmosphere [5,6,10]. Here, the U.S. Environmental Protection Agency (US-EPA) PMF (5.0) was applied to apportion Nccn based on PNSDs and corresponding Nccn in 2014 and 2021. Unlike those reported in the literature, this study applied the mode pattern of PNSDs associated with each PMF-derived source profile as a tracer for Nccn. The details are presented below.
In 2014, the hourly-averaged 29-size bin PNSDs were used, and each size bin datum was considered as an input variable. The corresponding Nccn at 0.2% (or 0.4%) SS was multiplied by a factor of 1/100 and used to replace the data of the largest size bin, which usually suffered from collection efficiency drop or low data capture. In comparison with the final apportioned factor source profiles of PNSDs using the original data and those that replaced the largest bin by 1/100 Nccn, the differences of the first 28-size bins in each factor source profile were within the margin of 6% and sufficiently smaller than the inherent measurement errors.
In 2021, the size bins of atmospheric particles were also reduced to 27 plus the additional bin with 1/100 Nccn at 0.2% (or 0.4%) SS to prevent homologous factors from being decomposed and reduce the uncertainty so that the reasonable solution can be obtained [38]. Unlike in the continental atmosphere, strong new particle formation (NPF) events did not occur, and additional data screening was not necessary. No auxiliary data, such as ion species, gaseous pollutants, and meteorological parameters, were included in PMF modeling, as they were not unique enough to help separate and identify the sources of Nccn.
The measurement uncertainty was one important parameter for PMF analysis and was calculated on the basis of equations provided by Ogulei et al. [39]. A similar approach has been adopted in various studies [6,40,41]. To gain the optimal solution, we adopted additional modeling uncertainties designed in US-EPA PMF (5.0), i.e., 8% and 25% for the data in 2014 and 2021, respectively. The fifth- and sixth-best number of factors were finally gained by running the model 20 times for the data in 2014 and 2021, respectively. The diagnostic parameter, i.e., the Q/Qexp ratio designed in the model, converged to 1.00–1.03 (2014) and 1.02–1.04 (2021) for Nccn at 0.2% and 0.4% SS.
PMF solutions are interpreted mainly based on unique factor source profiles and our measurements of PNSDs in various ambient conditions and combustion plumes from the mainland of China to the remote NWPO in the last two decades, as selectively presented in Figure S1. In addition, the correlation between concentrations of identified factors and air mass trajectories and concentrations SO42− and Na+ in PM2.5 are used to identify the location of the sources.

3. Results and Discussion

3.1. Overview of the Total Ncn and Bulk Nccn Values during 2021 and 2014 Cruise Campaigns

Figure 2 shows the minute-averaged total number concentration of particles (Ncn) and bulk Nccn values at 0.2% and 0.4% SS during two cruise campaigns, one conducted in DOY 77–112 of 2014 and the other in DOY 129–168 of 2021. The total Ncn was measured by the CPC and not available after 11:24 on DOY 158 of 2021 due to instrument malfunction, although bulk Nccn were still measured properly. The data measured in 2014 have been reported by Wang et al. [31]. Here, this study focused on the observational results in 2021 and the comparison between the two cruises. During the 2021 cruise from China’s marginal seas to the NWPO, we observed a pronounced downward trend in both Ncn and Nccn, amounting to an overall decrease of approximately 80%. Conversely, Nccn levels increased when the vessel returned from the NWPO to the marginal seas (Figure 2a–d). For example, the mean Ncn decreased from 4.4 ± 1.1 × 103 cm−3 (mean ± standard deviation) over the marginal seas on DOY 131–132 to 0.65 ± 0.51 × 103 cm−3 over the NWPO on DOY 133–158. On DOY 133–134, the vessel entered the NWPO, within Latitude 29.50–31.47° N and Longitude 127.61–135.99° E (Figure 1). During the cruise over the open oceanic zones, sailing far from the Asian continents on DOY 135–167 (referred to as Period-a-2021 thereafter), the Nccn varied around 0.44 ± 0.33 × 103 cm−3 at 0.2% SS and 0.52 ± 0.35 × 103 cm−3 at 0.4% SS. The mean values accounted for 70–80% of the corresponding Ncn, suggesting the high aerosol CCN activation [42,43]. Note that the Ncn and Nccn sometimes narrowly varied at the lower level for a week over the NWPO, e.g., on DOY 135–142 (referred to as Low-Period-2021 thereafter) when Ncn, Nccn at 0.2% and 0.4% SS fluctuated around 0.33 ± 0.13 × 103 cm−3, 0.17 ± 0.06 × 103 cm−3, and 0.22 ± 0.08 × 103 cm−3, respectively (Figure 2a,c). The lower values approached those previously observed in clean marine background atmospheres [4,44,45,46,47]. However, the Ncn and Nccn varied at higher levels afterward. For example, on DOY 143–167, the three variables fluctuated around 0.81 ± 0.53 × 103 cm−3, 0.53 ± 0.34 × 103 cm−3, and 0.62 ± 0.35 × 103 cm−3, respectively. The increased Ncn and Nccn during the period may be attributed to continental transport and other occasional inputs [4,11,31,48].
It is noteworthy that the 2014 cruise also showed a similar trend of Ncn and Nccn decreasing while traversing from the marginal seas to the NWPO and increasing upon return (Figure 2b,d). The demarcation line of this trend aligns with the Kuroshio Current trajectory [31]. The warmer waters of the Kuroshio raised the height of the mixing layer above it, and the southwest monsoon averted air masses towards the northeast bound. If the cruise route was to the north, the signal from the far route would be theoretically observed. For example, the elevated Ncn and Nccn were observed after Low-Period-2021 when the vessel cruised over the oceanic zone in the north. However, addressing the full implications of these trends would require a combination of observations from the sea level to the free troposphere therein and a 3D modeling of Ncn and Nccn, which is beyond this study’s scope.
The observational zone, characterized by busy marine traffic routes (https://www.marinetraffic.com, last access: 5 September 2023) and located downwind of Asia, is influenced by strong emissions of air pollutants [18]. The Ncn and Nccn differences measured between 2021 and 2014 might be related to direct contributions and/or indirect influences of the FSC regulation implemented in 2020 and the unprecedented reduction in air pollutant emissions from upwind continents [8,24,27,30]. However, the difference might also be affected by the change of the planetary scale weather system every 3–10 days and smaller-scale meteorological conditions (meteorological conditions were used afterward) as well as the seasonal change. Thus, the Ncn and Nccn measured between the two cruise campaigns were further compared under constrained conditions in terms of responses of the two variables to the reduction of air pollutant emissions. The week-long lower values of Ncn and Nccn recorded over the 1000–1500 km route (Figure 1) in the NWPO during each campaign may represent baseline levels for early spring 2014 and early summer 2021, which might be less affected by meteorological conditions. Quantitatively, during the week-long Low-Period-2021, the Ncn and Nccn at 0.2% SS and 0.4% SS were only 12%, 32%, and 27% of the values observed on DOY 81–88 in 2014 (referred to as Low-Period-2014 thereafter). This significant difference between the two campaigns likely resulted from the combined effects of seasonal variations and the reduced air pollutant emissions [20,24]. To isolate the two factors from each other, we further analyzed the observed decreases with the seasonal correction below:
(1)
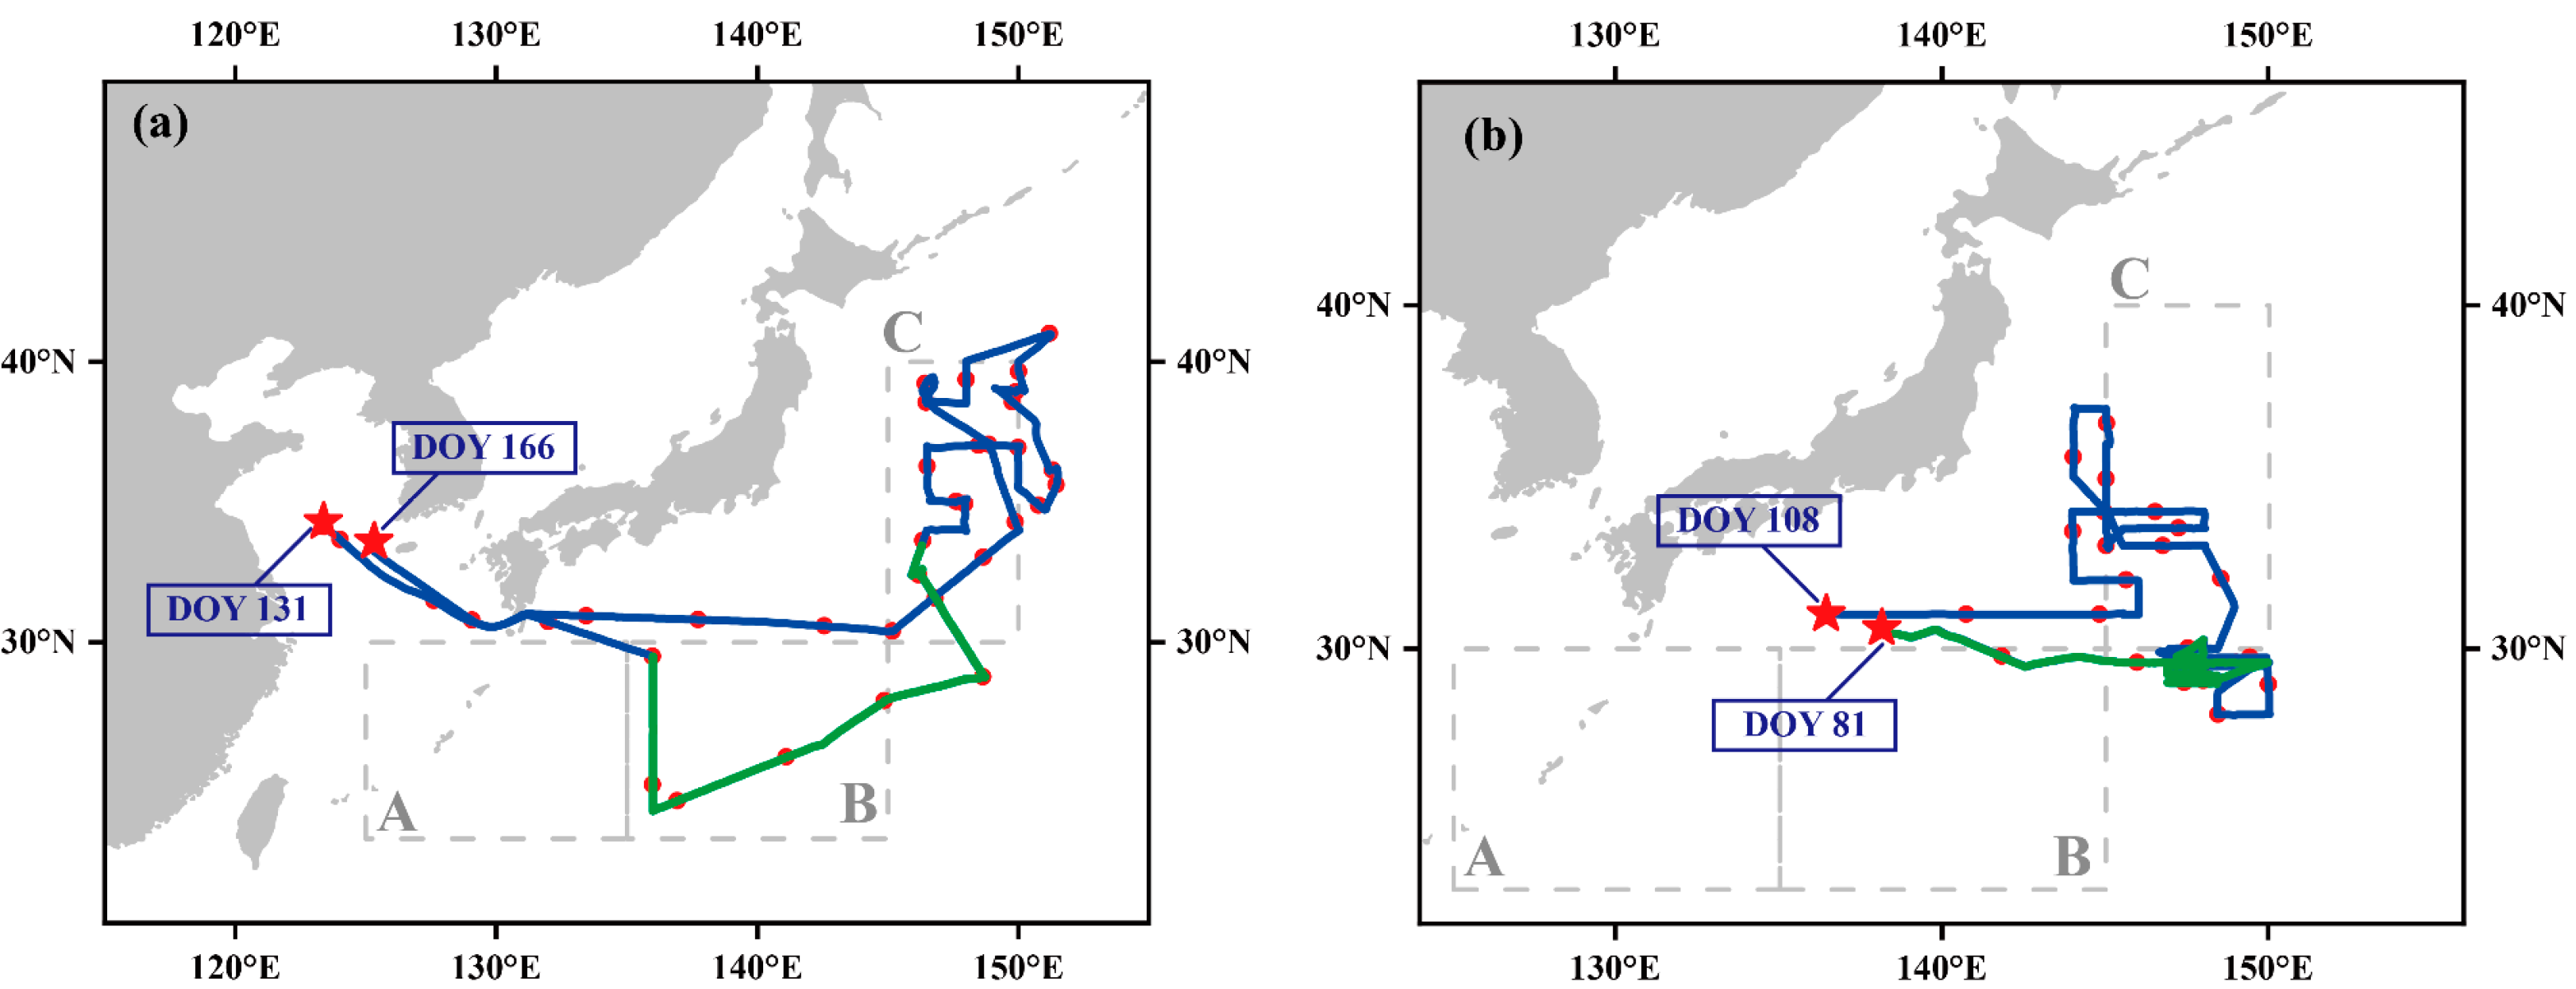
We first calculated seasonal correction factors during the cruise campaigns. Here, satellite AOD data (MYD08_D3 dataset) over the NWPO were used to achieve the target (Table S1, highlighted in yellow), considering that AOD data can be statistically used to derive Nccn, e.g., Nccn at 0.4% SS = 1.2824e5 × [AOD500 × α]2.3941, where AOD500 and α represent the AOD value at 500 nm and Angstrom wavelength exponent, respectively [49,50,51,52]. The seasonal correction factors for DOY 135–167 in 2014 (referred to as Period-a-2014 thereafter), based on those obtained on DOY 74–105 in 2014 (referred to as Period-b-2014 thereafter), were 1.1 at A zone (Latitude 23.00–30.00° N and Longitude 125.00–135.00° E), 0.8 at B zone (Latitude 23.00–30.00° N and Longitude 135.00–145.00° E), and at 0.9 at C zone (Latitude 30.00–40.00° N and Longitude 145.00–150.00° E). However, the seasonal correction factors for DOY 74–105 in 2021 (referred to as Period-b-2021 thereafter), based on those obtained in Period-a-2021, largely increased to 2.9 at the A zone, 3.4 at the B zone, and 1.2 at the C zone. The latter substantial difference in the seasonal correction factors among different oceanic zones in 2021 implied that large uncertainties might exist in the correction under drastic seasonal changes in AOD (Figure S2). Thus, the latter correction factors were not used afterward. More details on the seasonal changes are presented in Supporting Information;
(2)
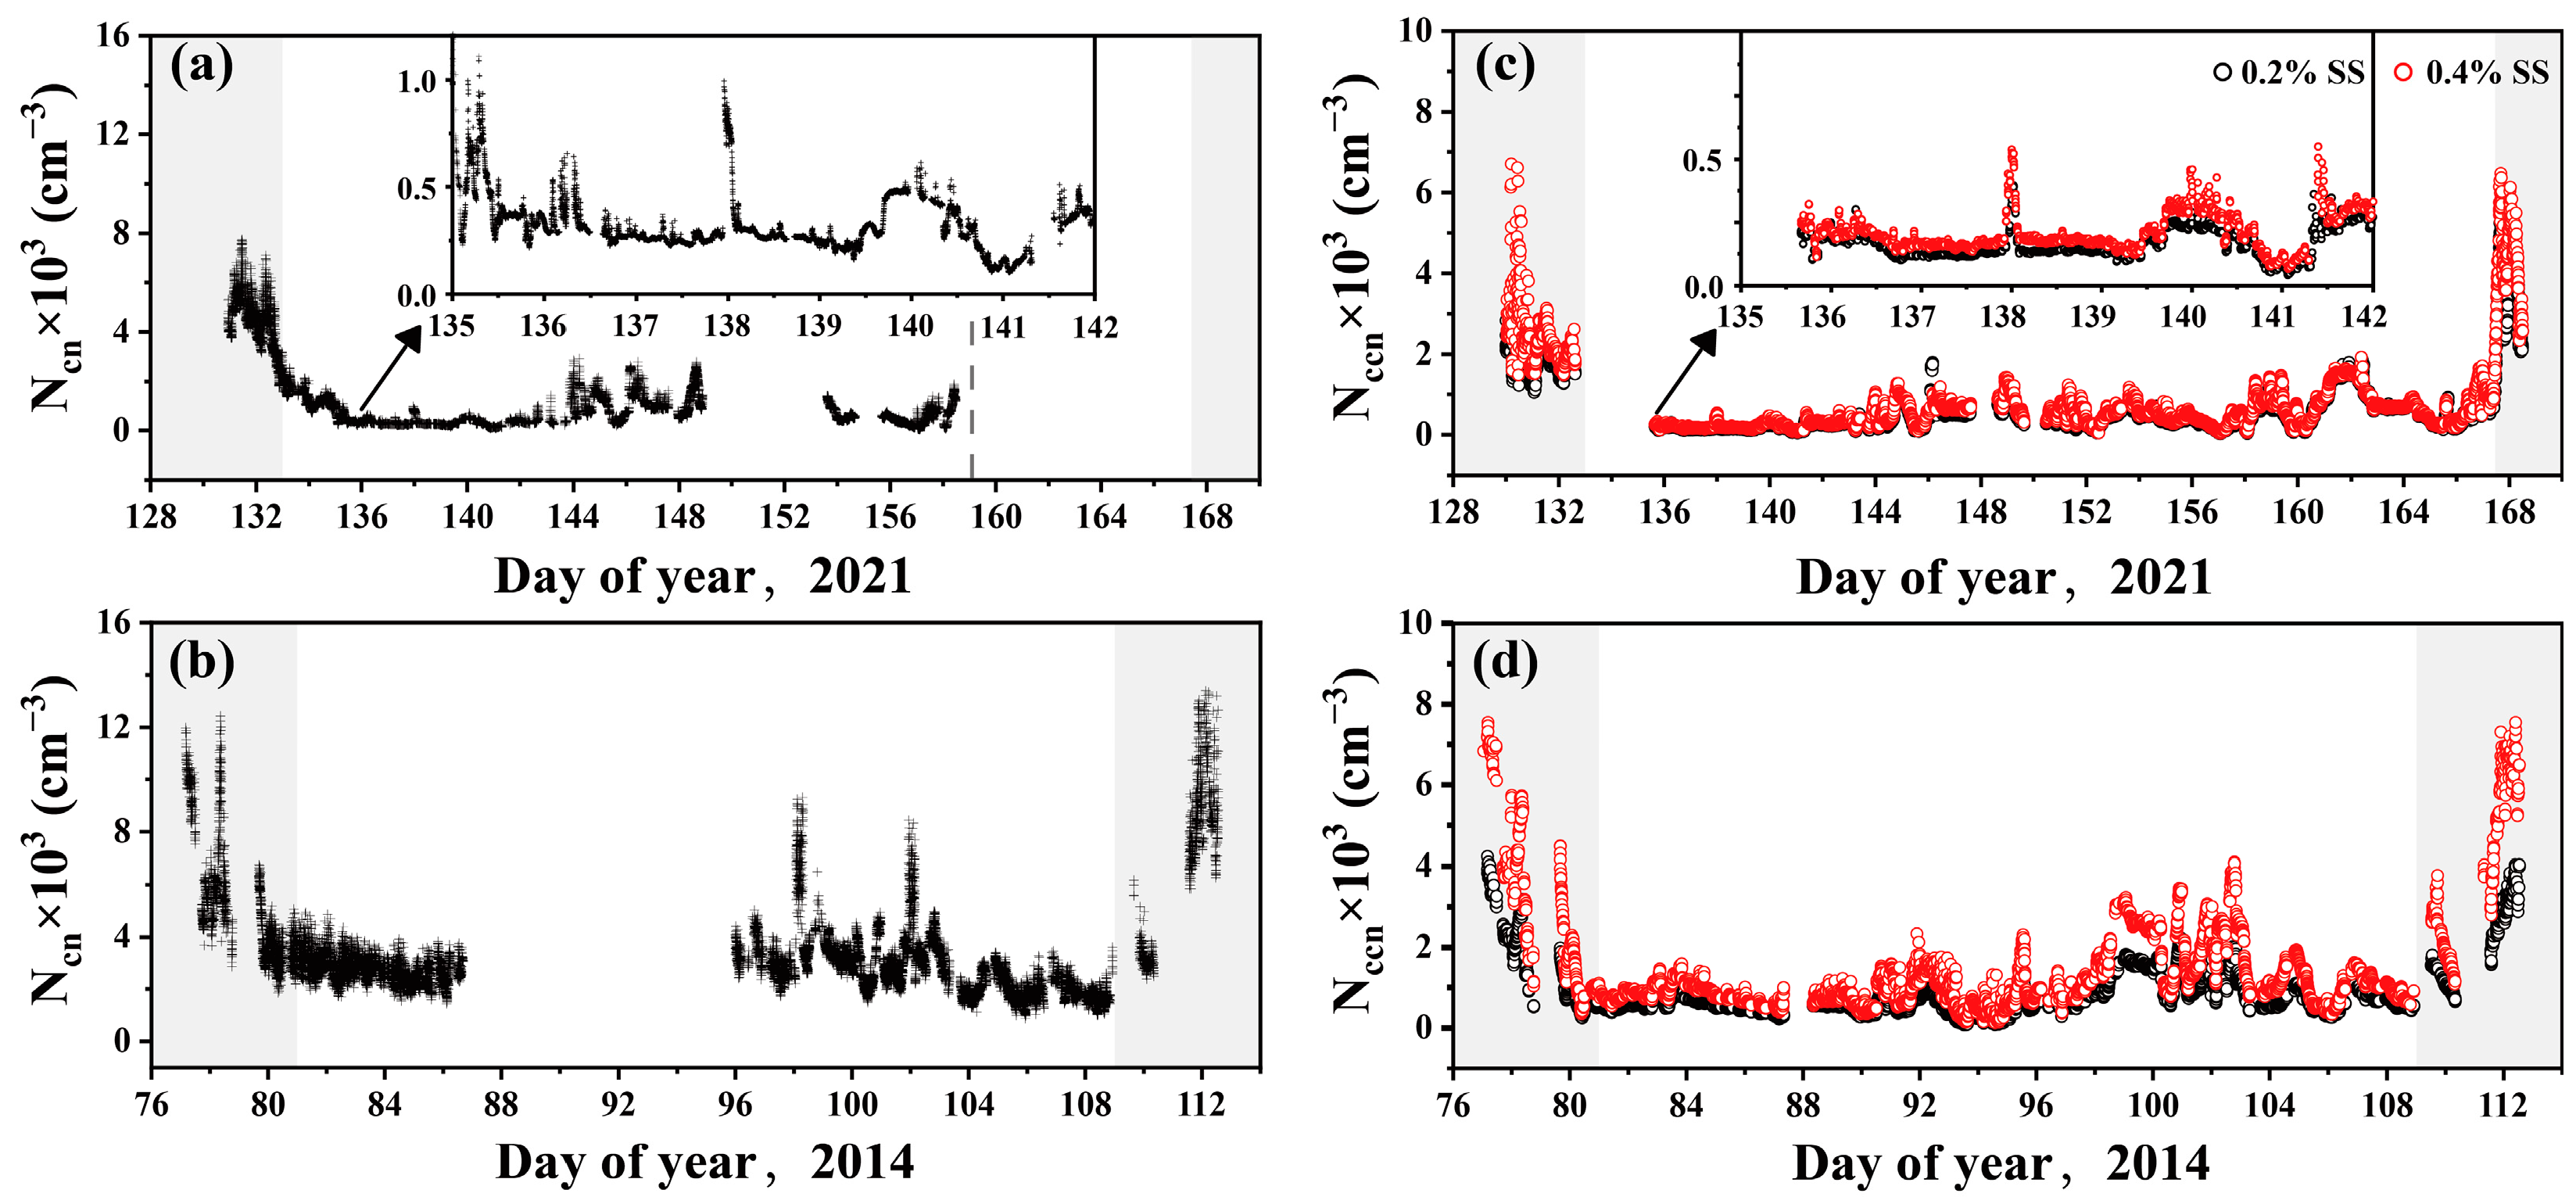
For the week-long low values in Low-Period-2021 and Low-Period-2014 at B Zone, the calculated overall decrease in Nccn at 0.4% SS on Low-Period-2021 relative to Low-Period-2014 was 66% when the seasonal correction factor of 0.8 in 2014 was used. The seasonal correction factor was also applied for Ncn and Nccn at 0.2% SS since the corresponding corrections were not well established. An 85% overall decrease in Ncn and a 60% overall decrease in Nccn at 0.2% SS can be obtained. All the seasonality-corrected decreases further supported large impacts of air pollutant emission reduction on Ncn and Nccn over the NWPO. However, the seasonal correction suffered from a certain degree of uncertainty, as those aforementioned calculations were for different periods. However, no more accurate method of seasonal correction is available so far because of the limited observational data in the remote marine atmosphere.
The enhanced contributions from the continental inputs and/or marine sources relative to the baselines in each of the two campaigns were clearly affected by meteorological conditions. To compare them, we calculated the 10th to 90th percentile values of Ncn and Nccn measured over the NWPO in the whole campaign of 2021 and 2014. The identical percentile values were compared in Figure 3a–d. The comparison results are summarized as follows:
(1) When all data measured over the NWPO were compared in 2021 and 2014, the Ncn fell below the 1:2 line at all percentiles, with the regression equation of y = 0.58x − 1.0 × 10³, R2 = 0.97. The intercept indicated that the higher percentile values of Ncn in 2021 decreased less than their 2014 counterparts, possibly linked to varying meteorological conditions and unpredictable continental and/or oceanic inputs such as volcanic eruptions [21], which slightly shortened the discrepancy of Ncn between 2021 and 2014. Specifically, the 25th, 50th, and 75th percentile values of Ncn showed reductions of 87%, 84%, and 72%, respectively, in 2021 relative to those in 2014;
(2) The comparison of Nccn between 2021 and 2014, however, revealed a highly disproportional decrease compared to Ncn (Figure 3b,d). Specifically, at 0.4% SS, the 25th, 50th, and 75th percentile values of Nccn decreased only by 64%, 50%, and 45%, and the corresponding decreases at 0.2% SS further shortened to 57%, 38%, and 25%, respectively, in 2021 relative to those in 2014. This notable disproportion in the decline of Nccn, relative to Ncn, will be further explored in the following section, focusing on the source apportionment of Nccn. Applying the mean value of seasonal correction factors over B Zone (0.8) and C Zone (0.9) in 2014, the measured Ncn and Nccn at 0.2% and 0.4% SS during Period-a-2021 relative to those in 2014 decreased by 73%, 23% and 43%, respectively;
(3) Data from the marginal seas, limited to about a week or less, were susceptible to occasional factors, potentially affecting the robustness of the comparison. For instance, Ncn values below the 50th percentile in the marginal seas initially mirrored the 1:1 line and then progressively declined below it as the percentile increased. However, different trends were observed in the corresponding Nccn, e.g., the Nccn at 0.2% SS consistently remained above the 1:1 line (Figure 3a,c). For Nccn at 0.4% SS, the comparison results between 2021 and 2014 were similar to those of Nccn at 0.2% SS for the values below the 50th percentile. However, the comparison results were similar to those of Ncn for the values above the 50th percentile.

3.2. Source Apportionment of Ncn and Nccn during 2021 and 2014 Cruises

Applying the PMF to apportion PNSDs during the 2014 and 2021 cruise campaigns over the NWPO resulted in identifying five and six distinctive and representative factors, respectively. Figure 4a,b displayed temporal contribution fractions of various factors to Nccn at 0.2% and 0.4% SS during the 2021 campaign, and the six source profiles of PNSDs were shown in Figure 4c–h. Correspondingly, Figure 5a–g present the temporal contribution fractions and source profiles for the 2014 campaign, respectively. The source profiles between the two campaigns exhibited some changes, which are discussed below.
Like the above section, we first focus on the PMF-derived results from 2021, noting similarities in the source profiles of Factors 1, 2, 3, and 6 with those reportedly resolved in the marine atmospheres over the subarctic western North Pacific in March 2015 and over the northern South China Sea in summer 2018 [5,6]. While our explanation for Factor 1 aligns with Liang et al. [6] and Kawana et al. [5], our findings differ for Factors 2, 3, and 6. Notably, Factors 4 and 5, which we identified in this study, were not recognized in these earlier studies. Again, the measured source profiles of PNSDs from the mainland of China to the NWPO are detailed in Figure S1.
Specifically, Factor 1 was characterized by the overwhelmingly dominant Aitken mode with the mode median diameter at 36 nm, accompanied by three minor modes in the range of 70–200 nm (Figure 4c). In the source profile, the Hoppel minimum at 86 nm was also clearly identified [53,54], suggesting that those larger-sized Aitken mode and accumulation mode particles might experience non-precipitating cloud modification to some extent. It is likely that the smaller Aitken mode particles originated from the free troposphere [10,11,16,31,44], where a lack of low-volatility vapors allowed them to grow to CCN-relevant sizes [7,17,31]. Consequently, only pre-existing particles modified by non-precipitation clouds are likely to be activated as Nccn due to the size effect [55]. As such, it is unsurprising that Factor 1 contributed only 6% and 12% (on average) to Nccn at 0.2% and 0.4% SS, respectively (Figure 4a,b), with the lower values obtained at lower latitudes, as shown in Figure S3. Note that Factor 1’s contributions to Nccn at 0.2% SS had no significant correlation with Na+ in PM2.5 (Figure S4a), and all the contributions presented later were on average.
Factor 2 exhibited trimodal PNSDs with the dominant mode at 49 nm and two minor modes at 115 and 205 nm, respectively. The modal pattern resembled those from self-vessel emissions, which had been exhaustively removed in this study (Figure S1a,b), low-sulfur-powered ship-engine experiments under the FSC regulation implemented in 2020 [8,56], and marine observations [5,6]. While Kawana et al. suggested that the factor-related particles might also be transported from terrestrial regions [5], our study found that Factor 2’s contributions to Nccn at 0.2% SS had a good correlation with Na+ in PM2.5 (Figure S4a), implying an appreciable sea-spray Nccn associated. In addition, a significant correlation was found between Factor 2’s contributions to Nccn at 0.4% SS and those from Factor 1 with R2 = 0.40, p < 0.01 (Figure S4b). The significant and moderately low correlation suggested that grown new particles might also act as an appreciable contributor [11,47]. Relative to the free troposphere, the marine atmospheric boundary layer reportedly enriched more organic vapors and favored the growth of new particles mixed down from aloft [7,57]. Moreover, Factor 2 contributed to 10% and 14% Nccn at 0.2% and 0.4% SS, respectively (Figure 4a,b).
Factor 3 exhibited bimodal PNSDs with the dominant peak at 70 nm and a substantially small broad peak at 120–200 nm, contributing 23% and 14% to Nccn at 0.2% and 0.4% SS, respectively. This factor was identified as a combination of two marine emissions, i.e., (1) some diesel-powered ship engines based on our previous cruise measurements for self-vessel emissions (Figure S1) and cruise data along the ~2000 km coastline in China with busy marine traffic [11,29,33] and other marine traffic studies [30,58]; (2) sea-spray aerosols [59,60]. While ship emissions overwhelming contributed to Ncn of Factor 3, it is interesting to note that the emissions of diesel-powered ship engines generally acted as a minor contributor to Nccn at various SS [29]. Sea-spray aerosols might be the major contributor of Factor 3 to Nccn by considering self-vessel wave-broken effects for forward deck sampling, leading to the contribution fraction to Nccn at 0.2% SS ranking at the second largest among the six factors, which was substantially larger than those associated with Factor 1 and 2. In fact, a good correlation was obtained between Factor 3’s contributions to Nccn at 0.2% SS and Na+ in PM2.5 (Figure S4a). The particles associated with Factor 3 in this study were unlikely derived from terrestrial aerosols, as indicated by the significant negative correlations of the PNCs of Factor 3 with those of Factors 5 and 6 (Figure S4b) and the calculated air mass back-trajectories (Figure S5). Factors 5 and 6 were apportioned as aged terrestrial aerosols, which will be elaborated on later in this study.
Factors 4 and 5, characterized by the dominant accumulation mode, were apportioned as terrestrial aerosols [38]. Despite the occasional rapid growth of newly formed particles to large sizes in marine atmospheres [61], our extensive 400-day cruise measurements over the marginal seas of China and the NWPO indicate that the likelihood of such growth to accumulation mode size is less than 2%. Unfortunately, no studies in the literature reported the important statistical number. Notably, Factors 4–6 together contribute to 63% and 60% of Nccn at 0.2% and 0.4% SS, with Factor 5 having the largest share. The Nccn at 0.2% SS derived from Factor 5 exhibited significant correlation with the concentrations of nss-SO42− in PM2.5 with R2 = 0.94 and p < 0.05 (Figure S6d). Furthermore, the clear Hoppel minimum identified at 86 nm in the source profile of Factor 5 suggested an association with non-precipitation cloud-modified terrestrial aerosols, supported by the calculated air mass back trajectories (Figure S6). No Hoppel minimum, however, can be identified in the source profile of Factor 4, implying a connection with terrestrial combustion aerosols not modified by non-precipitating clouds [19,33,38,62]. In addition, Factor 6, with a broad dominant mode over 200 nm, can often be identified in heavy air pollution events in China associated with humid and poor dispersion conditions [62]. There is a notable correlation between the Ncn derived from Factor 5 and 6 (R2 = 0.98, p < 0.05), which also suggests that they may share similar sources, at least to some extent. However, it is possible that biomass-burning aerosols and dust aerosols are also components of Factor 6, as evidenced by their similar source profiles identified in previous studies [31,63]. Liang et al. argued that the Factor 6-related particles experienced a long residence time in marine atmospheres and, thereby, were well-aged [6]. Kawana et al. argued that the Factor 6-related particles might be derived from marine emissions because of lower Ncn loadings [5].
In the 2014 campaign, Factor 1 was characterized by the dominant nucleation mode with the median mode diameter at 16 nm and a minor mode at 240 nm, contributing 17% and 8% to Nccn at 0.2% and 0.4% SS, respectively. The nucleation mode particles were likely transported from the free troposphere [10,16,31,44] while the Nccn was attributed to a mixture of sources in the clean marine atmosphere. The Hoppel minimum occurred at 74 nm, suggesting that non-precipitating cloud modification also occurred in these cases. In the literature, fresh nucleation mode particles were frequently reported in cloud outflow [44,54].
Factor 2 also exhibited bimodal PNSDs characterized by the dominant mode at 22 nm and a small broad peak spanning from 140 to 540 nm, with a Hoppel minimum identified at 114 nm. However, the contributions of Factor 2 to Nccn decreased slightly, accounting for only 12% and 6% at SS levels of 0.2% and 0.4%, respectively. Although non-precipitating cloud modification might enhance the hygroscopicity of aerosol particles [42,43], it can also lead to a reduction in Nccn as aerosol particles are scavenged by cloud droplets. As presented later, a large amount of Nccn over the NWPO might not be activated into cloud droplets because of possible competitive aerosol activation [42,43]. In addition, the precipitation might remove CCN directly through wet deposition.
Comparing the two factor profiles from 2014 with Factor 1 in 2021, the absence of a dominant nucleation mode in 2021 implied a significant reduction in new particle formation in marine atmospheres, likely a result of the implementation of the FSC regulation and the dramatic reductions in SO2 emissions from upwind continents. However, the change apparently exerted a minor influence on Nccn at SS ≤ 0.4%, possibly because most of the secondary particles that grew were not large enough to be activated as CCN [33,55].
The profile of Factor 3 in 2014 exhibited a multiple mode pattern in the range from 12 to 280 nm with a Hoppel minimum obtained around 70 nm, and two major modes were distributed at a size smaller than 50 nm. Contributing 11% and 15% to Nccn at 0.2% and 0.4% SS, respectively, Factor 3 was linked to diverse sources, including emissions from heavy-oil-powered and diesel-powered marine traffic operating under different conditions (Figure S1a,b), as well as sea-spray aerosols [29,30,58,59,60]. Again, the emissions from various marine traffic likely dominated the contribution to Ncn, overshadowing the contribution from sea-spray aerosols. Nevertheless, sea-spray aerosols might yield an appreciable contribution to Nccn compared to marine traffic emissions [64,65].
Analyzing the resolved results of 2014 and 2021, we can approximate the impact of the FCS regulation on Nccn as follows:
(1)
The differences in Nccn contribution from Factor 3 in 2014 and the combined contributions of Factors 2 and 3 in 2021 during the low Nccn weeks (Low-Period-2021 and Low-Period-2014) were 6 cm−3 and 59 cm−3 (on average) at 0.2% and 0.4% SS, respectively. This negligible difference between the two years at 0.2% SS implied that the contributions to Nccn from sea-spray aerosols plus marine traffic during the comparison periods might be roughly the same at that SS; the D-value of (59–6) cm−3 between 0.2% and 0.4% SS suggested that a reduction in Nccn by approximately 53 cm−3 at 0.4% SS is due to the FCS regulation over the NWPO during the low Nccn weeks. Moreover, it can be assumed that the contributions of sea-spray aerosols plus marine traffic to Nccn were less affected by the seasonal change in 1–2 months. Seasonal correction was thereby unnecessary for the estimation;
(2)
In a broader analysis including all data from the NWPO, the differences were −62 cm−3 and −14 cm−3 at 0.2% and 0.4% SS, respectively. The difference of −62 cm−3 Nccn could be attributed to various short-period factors, e.g., increased sea-spray aerosol contributions in 2021 with self-vessel wave-broken effects enhanced for the forward deck sampling and other unidentified causes; however, the influences from the various short-period factors can be largely canceled out in estimating the D-value of (−14 − (−62)) cm−3 at 0.2% and 0.4% SS. The D-value suggested that the FCS regulation led to a decrease in Nccn by 48 cm−3;
(3)
Integrating insights from (1) and (2), it can be inferred that the FCS regulation, implemented since 2020, likely resulted in a decrease of Nccn by ~50 cm−3 at 0.4% SS over the NWPO. However, its impact at 0.2% SS seems to be minimal.
Factor 4, characterized by the dominant mode at 168 nm with a Hoppel minimum at 70 nm, displayed a weaker Hoppel effect compared to Factors 2 and 5. This factor was the primary contributor to Nccn, accounting for 50% (432 cm−3) and 61% (850 cm−3) of Nccn at SS levels of 0.2% and 0.4%, respectively. Consequently, Factor 4 was identified as aged anthropogenic aerosols transported from upwind continents, while any other known CCN sources in the remote marine atmospheres cannot generate such high Nccn [5,10,16,31,42,43,44]. The aged anthropogenic aerosols likely acted as effective sinks for scavenging <30 nm particles, which explained the absence of nucleation mode particles in Factor 4. The profile of Factor 5 displayed a broad peak at 50–300 nm and a minor mode at 22 nm, contributing equally 10% to Nccn at both 0.2% and 0.4% SS levels. Building on Wang et al.’s [31] proposition, Factor 5 combined the effects of biomass-burning aerosols and Asian dust, which exhibit a broad peak extending to 300 nm, along with the influence of the clean background.
Combining the results of Factor 4 in 2014 with Factor 4 and 5 in 2021, the influence of air pollutant mitigation in upwind continents on Nccn can be roughly estimated as follows: (1) The differences in Nccn contribution from Factor 4 in 2014 and the combined contributions of Factor 4 and 5 in 2021 during the low Nccn weeks (Low-Period-2014 and Low-Period-2021) were 194 cm−3 and 403 cm−3 at 0.2% and 0.4% SS, respectively; (2) when considering all data measured over the NWPO, similar analysis yielded differences of 142 cm−3 and 451 cm−3 at 0.2% and 0.4% SS, respectively. The difference in the estimated values between (1) and (2) might be due to the effects of meteorological conditions in (2).
Consequently, it appears that the mitigation of air pollutant emissions in upwind continents had likely reduced Nccn by about 200 cm−3 at 0.2% SS and around 400 cm−3 at 0.4% SS in the marine background atmosphere over the NWPO. However, it is important to note that the values might vary due to the long-range transport of air pollutants to the NWPO, which is influenced by seasonal changes. When the seasonal correction factor of 0.8 in 2014 was used, the mitigation effect on Nccn was about 92 cm−3 at 0.2% SS and around 400 cm−3 at 0.4% SS in the marine background atmosphere over the NWPO.

3.3. A 10–20% Misprediction of Nccn by the PMF and Uncertainty

The PMF effectively apportioned major Ncn sources throughout both campaigns, but it accurately apportioned Nccn only for most of the periods (Figure 6a–d and Figure 7a–d). For example, it poorly predicted Nccn to exceed the observational value with a margin of 10% for approximately 19% of the period in 2021 and 14% of the period in 2014. For the 2021 campaign, regression analysis of predicted Ncn against the observational values (with a forced zero intercept) yielded a slope of 1.04 and R2 values of 0.99 (Figure 6c). However, the PMF significantly underpredicted Nccn during most of the time on DOY 141–142 and some periods with high Nccn values on DOY 162 and 167 (Figure 6b,d). On DOY 141–142, it is likely that terrestrial aerosols had a higher CCN activation efficiency than the average for this campaign, as indicated by the observed Nccn at 0.2% SS over the observed Ncn varied around 0.64 ± 0.10 compared to the PMF-resolved Nccn at 0.2% SS over the PMF-resolved Nccn were 0.25 ± 0.09, and 0.34 ± 0.13 in Factor 4 and 5, respectively. A similar underprediction of Nccn might have occurred on DOY 162, and on DOY 167, the contribution from sea-spray aerosols to Factor 3 might have been larger than the campaign average, leading to the underpredictions. Wang et al. [66] also reported the underestimation issue in applying the PMF to apportion secondary organic aerosol in PM2.5 and proposed a novel approach to solve it. Conversely, the PMF substantially overpredicted Nccn at 0.2% SS for about half of the time on DOY 148–154, with the ratios of Nccn at 0.2% SS over Ncn showing high levels of 0.64 ± 0.17. This overestimation suggested that the real contribution from non-terrestrial aerosols might have been smaller than the average used in the campaign, considering the unlikely overestimation of CCN activation efficiency of terrestrial aerosols. Wang et al. [66] did not find the overestimation issue in PMF apportionment.
However, for approximately 1/3 of the time on DOY 98–100 in 2014, the PMF substantially underpredicted Nccn, likely because the corresponding terrestrial aerosols had substantially larger CCN activation efficiency than the campaign average. This higher efficiency is suggested by the ratios of the observed Nccn at 0.2% SS over the observed Ncn varied around 0.45 ± 0.07, compared to the ratios of the PMF-resolved Nccn at 0.2% SS over the PMF-resolved Nccn in Factor 4 were 0.26 ± 0.05. A similar underprediction of Nccn occurred for about three hours on DOY 102. Conversely, during the early hours of DOY 98 and DOY 102, the PMF substantially overpredicted Nccn (Figure 7b,d), where the observed Nccn at 0.2% SS over the observed Ncn varied around 0.30 ± 0.11. The reason for this overprediction is not immediately clear.

3.4. Indirect Climate Effects via Satellite-Based Cloud Parameters

Satellite-based cloud parameters during the 2014 and 2021 cruise campaigns from the marginal seas of China to the NWPO were further examined to assess possible indirect climate impacts of decreased Nccn therein (Table S1 and Figures S7–S9). In 2014, the CF, LWP, and CER showed significant seasonal increases over A, B, and C zones when comparing observations during DOY 77–112 with those during DOY 129–168. However, the CDNC decreased from 141–161 cm−3 to 81–108 cm−3, likely influenced more by meteorological conditions, such as moisture levels and the ascent velocity of the air mass, etc., rather than Nccn. This is inferred from the fact that the observed and estimated Nccn at 0.2% and 0.4% SS were substantially higher, by 5–10 times than the corresponding CDNC values [67,68,69]. Comprehensive investigations on competitive aerosol activation and vertical profiles of Nccn are urgently needed in the future.
In contrast, 2021 saw no distinct seasonal increases in CF over the A, B, and C zones. Although LWP and CER still increased seasonally, the magnitude was less compared to 2014. Additionally, a 20–40% seasonal decrease in CDNC was observed over these zones, with values ranging from 73 cm−3 to 108 cm−3 over the three zones, still lower than the observed lower background values of Nccn observed therein, i.e., 0.17 ± 0.06 × 103 cm−3 at 0.2% SS and 0.22 ± 0.08 × 103 cm−3 at 0.4% SS. Thus, it is not surprising that there were no consistent changes in CDNC (or CER) during the DOY 129–168 in 2014 and 2021 over the three zones. Notably, the bottom 5th percentile Nccn at 0.2% and 0.4% SS in 2021 were only 80 and 111 cm−3, respectively, and approached the calculated CDNC. Moreover, the CDNC consistently decreased over the three zones during the DOY 77–112 in 2021 compared to 2014. During the period, accompanied by an increase in CER. The differences implied that the decreased Nccn over the NWPO might, together with meteorological factors, co-limit the formation of cloud droplets on certain occasions. This also needs an urgent comprehensive investigation.

4. Conclusions and Implications

This study observed Nccn, PNDS, and Nccn at various SS levels during the cruise from China’s marginal seas to the NWPO in DOY 129–168 of 2021 and compared with those observations during the similar cruise route in DOY 77–112 of 2014. The observations showed a pronounced downward trend in both Ncn and Nccn, amounting to an overall decrease of approximately 80% from the marginal seas of China to the NWPO in 2021 and 2014, with reducing anthropogenic inputs from the continental sources. Both in 2021 and 2014, the Ncn and Nccn narrowly varied at the lower level for a week and across the 1000–1500 km cruise track and represented clean marine background values, i.e., Ncn, Nccn at 0.2% and 0.4% SS fluctuated around 0.33 ± 0.13 × 103 cm−3, 0.17 ± 0.06 × 103 cm−3, and 0.22 ± 0.08 × 103 cm−3, respectively, in 2021, and the corresponding lower values in 2014 were 2.75 ± 0.51 × 103 cm−3, 0.54 ± 0.14 × 103 cm−3, and 0.82 ± 0.21 × 103 cm−3, respectively. The decrease in the lower values of Ncn and Nccn in 2021 relative to 2014 likely reflected a combination of the mitigation of air pollution in upwind continents, FSC regulation, seasonal change, etc. However, the enhanced continental inputs increased the three variables to some extent during the remaining periods over the NWPO.
The adjusted PMF model yielded effective source apportionment results, which indicated that upwind continental mitigation likely reduced Nccn by approximately 200 cm−3 and 400 cm−3 at 0.2% and 0.4% SS, respectively, in the marine background atmosphere over the NWPO. The reduction effect was substantially larger than that from FSC regulation, i.e., a decrease in Nccn at 0.4% SS by about 50 cm−3 and nearly negligible at 0.2% SS over the NWPO. Additionally, the reduction likely led to a PMF-resolved factor, characterized by a dominant nucleation mode, which disappeared in 2021 in comparison with that resolved in 2014. However, the PMF-resolved results also suffered from uncertainty on mispredicting Nccn in 10–20% of cases. The PMF-based apportionment can clearly identify the statistical deviation of the prediction from the observation in appreciable percentages, which were overlooked before. The mechanisms determining the underestimation and the overestimation are still under investigation. However, the mechanisms in these moments are particularly important because the statistical averages are invalid. For example, does unique aerosol aging occur in reshaping their activation properties?
Finally, the comparison between Nccn measured during the cruises and satellite-based cloud parameters over the corresponding oceanic zones suggested that the lower background Nccn under upwind mitigation and FSC regulation approached the CDNC. The reduced Nccn might have led to cloud droplet formation being co-limited by Nccn and meteorological factors, which needs great attention.
More data are definitely required to accurately assess the mitigation effect on Nccn in the remote marine atmosphere, even if the cruise measurements can be performed at the exact same period, considering possible seasonal delay or advance from year to year. However, it is critical to gain those low and narrowly varying data over longer periods and larger oceanic zones.

Supplementary Materials

The following supporting information can be downloaded at: https://www.mdpi.com/article/10.3390/atmos15080972/s1, Text S1: Method to calculate the CDNC from web-based data; Text S2: Explanations for subfigures in Figure S1; Text S3: Explanations for subfigures in Figure S2; Figure S1: Various PNSDs in ambient conditions and combustion plumes in the last two decades; Figure S2: Seasonal correction factors over the B oceanic zone calculated by the Period-b average AOD over the Period-a average from 2004 to 2021 (a); DOY’s AOD over the B oceanic zone during Periods a and b in 2014 and 2021 (b) (seasonal correction factors in 2014 and 2021 were highlighted in orange in (a)); Figure S3: Spatiotemporal variations of PMF-resolved Nccn contributed from Factor 1 and its fractional contribution to total Nccn at 0.2% and 0.4% SS in 2021 ((a) time series of PMF-resolved Nccn; (b) fractional contribution to total Nccn; (c,d) geographic distribution of PMF-resolved Nccn); Figure S4: Correlation between Nccn at 0.2% SS derived from different factors and the concentrations of Na+ in PM2.5 (a); correlations between the PMF-resolved fractional contributions from different source factors to Nccn at 0.4% SS in 2021 ((b) Factor 2 vs. Factor 1; (c) Factor 5 and Factor 6 vs. Factor 3); Figure S5: Same as Figure S2 except for Factor 3 (a–d) and 24 h backward trajectories at 500 m above mean sea level during the periods with high Nccn values contributed from Factor 3 in 2021 (e); Figure S6: Same as Figure S2 except for Factor 5 (a–c); correlation between Nccn at 0.2% SS derived from Factor 5 and the concentrations of nss-SO42− in PM2.5 (d); 24 h backward trajectories at 500 m and 1000 m above mean sea level during the periods with high Nccn values contributed from Factor 5 in 2021(e,f); Figure S7: Spatial variation of satellite CF over the NWPO and marginal seas of China on DOY 77–112 and DOY 129–168 of 2014 and those of 2021 ((a) DOY 77–112 of 2014; (b) DOY 129–168 of 2014; (c) DOY 77–112 of 2021; (d) DOY 129–168 of 2021); Figure S8: Same as Figure S7 except for satellite CER; Figure S9: Same as Figure S7 except for satellite-based CDNC; Table S1: Satellite-based cloud parameters during the two cruise campaigns in 2014 and 2021 from marginal seas of China to the NWPO (AOD, CF, LWP, and CER downloaded from https://ladsweb.modaps.eosdis.nasa.gov; CDNC were calculated using the method in Text S1).

Author Contributions

Methodology, Y.Z., Y.G., H.G. and X.Y.; Formal analysis, Y.Z., Y.G., H.G. and X.Y.; Data curation, N.M. and J.H.; Writing—original draft, L.S.; Writing—review & editing, L.S., W.C. and X.Y. All authors have read and agreed to the published version of the manuscript.

Funding

This work was supported by the Fundamental Research Funds for the Central Universities (202072001), Hainan Provincial Natural Science Foundation of China (grant no. 422MS098), and Hainan Provincial Joint Project of Sanya Yazhou Bay Science and Technology City (2021JJLH0050).

Institutional Review Board Statement

Not applicable.

Informed Consent Statement

Not applicable.

Data Availability Statement

The data can now be accessed at https://data.mendeley.com accessed 12 July 2024 and should be cited as follows: Sun, Lei; Cui, Wenxin; Ma, Nan; Hong, Juan; Zhu, Yujiao; Gao, Yang; Gao, Huiwang; Yao, Xiaohong (2024), “Dataset of 2014’s and 2021’s NWPO cruise campaigns”, Mendeley Data, V1, doi: 10.17632/7k7bb374h6.1.

Conflicts of Interest

The authors declare no conflicts of interest.

References

  1. Asadnabizadeh, M. Critical findings of the sixth assessment report (AR6) of working Group I of the intergovernmental panel on climate change (IPCC) for global climate change policymaking a summary for policymakers (SPM) analysis. Int. J. Clim. Chang. Strateg. Manag. 2023, 15, 652–670. [Google Scholar] [CrossRef]
  2. Bellouin, N.; Quaas, J.; Gryspeerdt, E.; Kinne, S.; Stier, P.; Watson-Parris, D.; Boucher, O.; Carslaw, K.S.; Christensen, M.; Daniau, A.L.; et al. Bounding global aerosol radiative forcing of climate change. Rev. Geophys. 2020, 58, e2019RG000660. [Google Scholar] [CrossRef] [PubMed]
  3. Twomey, S. Aerosols, clouds and radiation. Atmos. Environ. Part A Gen. Top. 1991, 25, 2435–2442. [Google Scholar] [CrossRef]
  4. Ito, A.; Miyazaki, Y.; Taketani, F.; Iwamoto, Y.; Kanaya, Y. Marine aerosol feedback on biogeochemical cycles and the climate in the Anthropocene: Lessons learned from the Pacific Ocean. Environ. Sci. Atmos. 2023, 3, 782–798. [Google Scholar] [CrossRef]
  5. Kawana, K.; Miyazaki, Y.; Omori, Y.; Tanimoto, H.; Kagami, S.; Suzuki, K.; Yamashita, Y.; Nishioka, J.; Deng, Y.; Yai, H.; et al. Number-size distribution and CCN activity of atmospheric aerosols in the Western North Pacific during spring pre-bloom period: Influences of terrestrial and marine sources. J. Geophys. Res. Atmos. 2022, 127, e2022JD036690. [Google Scholar] [CrossRef]
  6. Liang, B.; Cai, M.; Sun, Q.; Zhou, S.; Zhao, J. Source apportionment of marine atmospheric aerosols in northern South China Sea during summertime 2018. Environ. Pollut. 2021, 289, 117948. [Google Scholar] [CrossRef]
  7. Sanchez, K.J.; Chen, C.-L.; Russell, L.M.; Betha, R.; Liu, J.; Price, D.J.; Massoli, P.; Ziemba, L.D.; Crosbie, E.C.; Moore, R.H.; et al. Substantial seasonal contribution of observed biogenic sulfate particles to cloud condensation nuclei. Sci. Rep. 2018, 8, 3225. [Google Scholar] [CrossRef]
  8. Santos, L.F.E.D.; Salo, K.; Kong, X.; Noda, J.; Kristensen, T.B.; Ohigashi, T.; Thomson, E.S. Changes in CCN activity of ship exhaust particles induced by fuel sulfur content reduction and wet scrubbing. Environ. Sci. Atmos. 2023, 3, 182–195. [Google Scholar] [CrossRef]
  9. Simpkins, G. Aerosol-cloud interactions. Nat. Clim. Chang. 2018, 8, 457. [Google Scholar] [CrossRef]
  10. Song, C.; Becagli, S.; Beddows, D.C.S.; Brean, J.; Browse, J.; Dai, Q.; Dall’Osto, M.; Ferracci, V.; Harrison, R.M.; Harris, N.; et al. Understanding sources and drivers of size-resolved aerosol in the high Arctic islands of Svalbard using a receptor model coupled with machine learning. Environ. Sci. Technol. 2022, 56, 11189–11198. [Google Scholar] [CrossRef]
  11. Zhu, Y.; Li, K.; Shen, Y.; Gao, Y.; Liu, X.; Yu, Y.; Gao, H.; Yao, X. New particle formation in the marine atmosphere during seven cruise campaigns. Atmos. Chem. Phys. 2019, 19, 89–113. [Google Scholar] [CrossRef]
  12. Abbatt, J.P.D.; Leaitch, W.R.; Aliabadi, A.A.; Bertram, A.K.; Blanchet, J.-P.; Boivin-Rioux, A.; Bozem, H.; Burkart, J.; Chang, R.Y.W.; Charette, J.; et al. Overview paper: New insights into aerosol and climate in the Arctic. Atmos. Chem. Phys. 2019, 19, 2527–2560. [Google Scholar] [CrossRef]
  13. Miller, R.M.; Rauber, R.M.; Di Girolamo, L.; Rilloraza, M.; Fu, D.; McFarquhar, G.M.; Nesbitt, S.W.; Ziemba, L.D.; Woods, S.; Thornhill, K.L. Influence of natural and anthropogenic aerosols on cloud base droplet sizedistributions in clouds over the South China Sea and West Pacific. Atmos. Chem. Phys. 2023, 23, 8959–8977. [Google Scholar] [CrossRef]
  14. Behrenfeld, M.J.; Moore, R.H.; Hostetler, C.A.; Graff, J.; Gaube, P.; Russell, L.M.; Chen, G.; Doney, S.C.; Giovannoni, S.; Liu, H.; et al. The North Atlantic Aerosol and Marine Ecosystem Study (NAAMES): Science motive and mission overview. Front. Mar. Sci. 2019, 6, 122. [Google Scholar] [CrossRef]
  15. Dadashazar, H.; Painemal, D.; Alipanah, M.; Brunke, M.; Chellappan, S.; Corral, A.F.; Crosbie, E.; Kirschler, S.; Liu, H.; Moore, R.H.; et al. Cloud drop number concentrations over the western North Atlantic Ocean: Seasonal cycle, aerosol interrelationships, and other influential factors. Atmos. Chem. Phys. 2021, 21, 10499–10526. [Google Scholar] [CrossRef] [PubMed]
  16. Williamson, C.J.; Kupc, A.; Axisa, D.; Bilsback, K.R.; Bui, T.; Campuzano-Jost, P.; Dollner, M.; Froyd, K.D.; Hodshire, A.L.; Jimenez, J.L.; et al. A large source of cloud condensation nuclei from new particle formation in the tropics. Nature 2019, 574, 399–403. [Google Scholar] [CrossRef] [PubMed]
  17. Chang, R.Y.W.; Abbatt, J.P.D.; Boyer, M.C.; Chaubey, J.P.; Collins, D.B. Characterizing the hygroscopicity of growing particles in the Canadian Arctic summer. Atmos. Chem. Phys. 2022, 22, 8059–8071. [Google Scholar] [CrossRef]
  18. Kurokawa, J.; Ohara, T. Long-term historical trends in air pollutant emissions in Asia: Regional Emission inventory in ASia (REAS) version 3. Atmos. Chem. Phys. 2020, 20, 12761–12793. [Google Scholar] [CrossRef]
  19. Massling, A.; Leinert, S.; Wiedensohler, A.; Covert, D. Hygroscopic growth of sub-micrometer and one-micrometer aerosol particles measured during ACE-Asia. Atmos. Chem. Phys. 2007, 7, 3249–3259. [Google Scholar] [CrossRef]
  20. Nagao, I.; Matsumoto, K.; Tanaka, H. Characteristics of dimethylsulfide, ozone, aerosols, and cloud condensation nuclei in air masses over the northwestern Pacific Ocean. J. Geophys. Res. Atmos. 1999, 104, 11675–11693. [Google Scholar] [CrossRef]
  21. Uematsu, M.; Toratani, M.; Kajino, M.; Narita, Y.; Senga, Y.; Kimoto, T. Enhancement of primary productivity in the western North Pacific caused by the eruption of the Miyake-jima Volcano. Geophys. Res. Lett. 2004, 31, L06106. [Google Scholar] [CrossRef]
  22. Wang, Y.; Wang, M.; Zhang, R.; Ghan, S.J.; Lin, Y.; Hu, J.; Pan, B.; Levy, M.; Jiang, J.H.; Molina, M.J. Assessing the effects of anthropogenic aerosols on Pacific storm track using a multiscale global climate model. Proc. Natl. Acad. Sci. USA 2014, 111, 6894–6899. [Google Scholar] [CrossRef]
  23. Wang, Y.; Zhu, Y.; Wang, M.; Rosenfeld, D.; Gao, Y.; Yao, X.; Sheng, L.; Efraim, A.; Wang, J. Validation of satellite-retrieved CCN based on a cruise campaign over the polluted Northwestern Pacific ocean. Atmos. Res. 2021, 260, 105722. [Google Scholar] [CrossRef]
  24. Zhu, Y.; Shen, Y.; Li, K.; Meng, H.; Sun, Y.; Yao, X.; Gao, H.; Xue, L.; Wang, W. Investigation of particle number concentrations and new particle formation with largely reduced air pollutant emissions at a coastal semi-urban site in northern China. J. Geophys. Res. Atmos. 2021, 126, e2021JD035419. [Google Scholar] [CrossRef]
  25. Li, S.; Wang, S.; Wu, Q.; Zhang, Y.; Ouyang, D.; Zheng, H.; Han, L.; Qiu, X.; Wen, Y.; Liu, M.; et al. Emission trends of air pollutants and CO2 in China from 2005 to 2021. Earth Syst. Sci. Data 2023, 15, 2279–2294. [Google Scholar] [CrossRef]
  26. Zhao, Y.; Xi, M.; Zhang, Q.; Dong, Z.; Ma, M.; Zhou, K.; Xu, W.; Xing, J.; Zheng, B.; Wen, Z.; et al. Decline in bulk deposition of air pollutants in China lags behind reductions in emissions. Nat. Geosci. 2022, 15, 190–195. [Google Scholar] [CrossRef]
  27. Shang, D.; Tang, L.; Fang, X.; Wang, L.; Yang, S.; Wu, Z.; Chen, S.; Li, X.; Zeng, L.; Guo, S.; et al. Variations in source contributions of particle number concentration under long-term emission control in winter of urban Beijing. Environ. Pollut. 2022, 304, 119072. [Google Scholar] [CrossRef] [PubMed]
  28. MarineTraffic: Global Ship Tracking Intelligence. Available online: https://www.marinetraffic.com (accessed on 5 September 2023).
  29. Gao, Y.; Zhang, D.; Wang, J.; Gao, H.; Yao, X. Variations in Ncn and Nccn over marginal seas in China related to marine traffic emissions, new particle formation and aerosol aging. Atmos. Chem. Phys. 2020, 20, 9665–9677. [Google Scholar] [CrossRef]
  30. Kuittinen, N.; Jalkanen, J.-P.; Alanen, J.; Ntziachristos, L.; Hannuniemi, H.; Johansson, L.; Karjalainen, P.; Saukko, E.; Isotalo, M.; Aakko-Saksa, P.; et al. Shipping remains a globally significant source of anthropogenic PN emissions even after 2020 sulfur regulation. Environ. Sci. Technol. 2021, 55, 129–138. [Google Scholar] [CrossRef]
  31. Wang, J.; Shen, Y.; Li, K.; Gao, Y.; Gao, H.; Yao, X. Nucleation-mode particle pool and large increases in Ncn and Nccn observed over the northwestern Pacific Ocean in the spring of 2014. Atmos. Chem. Phys. 2019, 19, 8845–8861. [Google Scholar] [CrossRef]
  32. Jeong, C.-H.; Evans, G.J. Inter-comparison of a fast mobility particle sizer and a scanning mobility particle sizer incorporating an ultrafine water-based condensation particle counter. Aerosol Sci. Technol. 2009, 43, 364–373. [Google Scholar] [CrossRef]
  33. Gong, J.; Zhu, Y.; Chen, D.; Gao, H.; Shen, Y.; Gao, Y.; Yao, X. The occurrence of lower-than-expected bulk Nccn values over the marginal seas of China- Implications for competitive activation of marine aerosols. Sci. Total Environ. 2023, 858, 159938. [Google Scholar] [CrossRef] [PubMed]
  34. Chen, D.; Shen, Y.; Wang, J.; Gao, Y.; Gao, H.; Yao, X. Mapping gaseous dimethylamine, trimethylamine, ammonia, and their particulate counterparts in marine atmospheres of China’s marginal seas—Part 1: Differentiating marine emission from continental transport. Atmos. Chem. Phys. 2021, 21, 16413–16425. [Google Scholar] [CrossRef]
  35. Li, J.; Jian, B.; Huang, J.; Hu, Y.; Zhao, C.; Kawamoto, K.; Liao, S.; Wu, M. Long-term variation of cloud droplet number concentrations from space-based Lidar. Remote Sens. Environ. 2018, 213, 144–161. [Google Scholar] [CrossRef]
  36. Xiong, C.; Li, J.; Liu, Z.; Zhang, Z. The dominant role of aerosol-cloud interactions in aerosol-boundary layer feedback: Case studies in three megacities in China. Front. Environ. Sci. 2022, 10, 1002412. [Google Scholar] [CrossRef]
  37. Grosvenor, D.P.; Sourdeval, O.; Zuidema, P.; Ackerman, A.; Alexandrov, M.D.; Bennartz, R.; Boers, R.; Cairns, B.; Chiu, J.C.; Christensen, M.; et al. Remote sensing of droplet number concentration in warm clouds: A review of the current state of knowledge and perspectives. Rev. Geophys. 2018, 56, 409–453. [Google Scholar] [CrossRef] [PubMed]
  38. Vu, T.V.; Delgado-Saborit, J.M.; Harrison, R.M. Review: Particle number size distributions from seven major sources and implications for source apportionment studies. Atmos. Environ. 2015, 122, 114–132. [Google Scholar] [CrossRef]
  39. Ogulei, D.; Hopke, P.; Chalupa, D.; Utell, M. Modeling source contributions to submicron particle number concentrations measured in Rochester, New York. Aerosol Sci. Technol. 2007, 41, 179–201. [Google Scholar] [CrossRef]
  40. Cai, J.; Chu, B.; Yao, L.; Yan, C.; Heikkinen, L.M.; Zheng, F.; Li, C.; Fan, X.; Zhang, S.; Yang, D.; et al. Size-segregated particle number and mass concentrations from different emission sources in urban Beijing. Atmos. Chem. Phys. 2020, 20, 12721–12740. [Google Scholar] [CrossRef]
  41. Du, W.; Zhao, J.; Wang, Y.; Zhang, Y.; Wang, Q.; Xu, W.; Chen, C.; Han, T.; Zhang, F.; Li, Z.; et al. Simultaneous measurements of particle number size distributions at ground level and 260m on a meteorological tower in urban Beijing, China. Atmos. Chem. Phys. 2017, 17, 6797–6811. [Google Scholar] [CrossRef]
  42. Mochida, M.; Nishita-Hara, C.; Furutani, H.; Miyazaki, Y.; Jung, J.; Kawamura, K.; Uematsu, M. Hygroscopicity and cloud condensation nucleus activity of marine aerosol particles over the western North Pacific. J. Geophys. Res. Atmos. 2011, 116, D06204. [Google Scholar] [CrossRef]
  43. Mochida, M.; Nishita-Hara, C.; Kitamori, Y.; Aggarwal, S.G.; Kawamura, K.; Miura, K.; Takami, A. Size-segregated measurements of cloud condensation nucleus activity and hygroscopic growth for aerosols at Cape Hedo, Japan, in spring 2008. J. Geophys. Res. Atmos. 2010, 115, D21207. [Google Scholar] [CrossRef]
  44. Quinn, P.K.; Bates, T.S. The case against climate regulation via oceanic phytoplankton sulphur emissions. Nature 2011, 480, 51–56. [Google Scholar] [CrossRef] [PubMed]
  45. Sanchez, K.J.J.; Painemal, D.; Brown, M.D.D.; Crosbie, E.C.C.; Gallo, F.; Hair, J.W.W.; Hostetler, C.A.A.; Jordan, C.E.E.; Robinson, C.E.E.; Scarino, A.J.; et al. Multi-campaign ship and aircraft observations of marine cloud condensation nuclei and droplet concentrations. Sci. Data 2023, 10, 471. [Google Scholar] [CrossRef] [PubMed]
  46. Takegawa, N.; Moteki, N.; Oshima, N.; Koike, M.; Kita, K.; Shimizu, A.; Sugimoto, N.; Kondo, Y. Variability of aerosol particle number concentrations observed over the western Pacific in the spring of 2009. J. Geophys. Res. Atmos. 2014, 119, 13474–13488. [Google Scholar] [CrossRef]
  47. Ueda, S.; Miura, K.; Kawata, R.; Furutani, H.; Uematsu, M.; Omori, Y.; Tanimoto, H. Number-size distribution of aerosol particles and new particle formation events in tropical and subtropical Pacific Oceans. Atmos. Environ. 2016, 142, 324–339. [Google Scholar] [CrossRef]
  48. Buzorius, G.; McNaughton, C.S.; Clarke, A.D.; Covert, D.S.; Blomquist, B.; Nielsen, K.; Brechtel, F.J. Secondary aerosol formation in continental outflow conditions during ACE-Asia. J. Geophys. Res. Atmos. 2004, 109, D24203. [Google Scholar] [CrossRef]
  49. Ahn, S.H.; Yoon, Y.J.; Choi, T.J.; Lee, J.Y.; Kim, Y.P.; Lee, B.Y.; Ritter, C.; Aas, W.; Krejci, R.; Strom, J.; et al. Relationship between cloud condensation nuclei (CCN) concentration and aerosol optical depth in the Arctic region. Atmos. Environ. 2021, 267, 118748. [Google Scholar] [CrossRef]
  50. Andreae, M.O. Correlation between cloud condensation nuclei concentration and aerosol optical thickness in remote and polluted regions. Atmos. Chem. Phys. 2009, 9, 543–556. [Google Scholar] [CrossRef]
  51. Liu, J.; Li, Z. Estimation of cloud condensation nuclei concentration from aerosol optical quantities: Influential factors and uncertainties. Atmos. Chem. Phys. 2014, 14, 471–483. [Google Scholar] [CrossRef]
  52. Painemal, D.; Chang, F.-L.; Ferrare, R.; Burton, S.; Li, Z.; Smith, W.L., Jr.; Minnis, P.; Feng, Y.; Clayton, M. Reducing uncertainties in satellite estimates of aerosol-cloud interactions over the subtropical ocean by integrating vertically resolved aerosol observations. Atmos. Chem. Phys. 2020, 20, 7167–7177. [Google Scholar] [CrossRef]
  53. Hoppel, W.A.; Fitzgerald, J.W.; Frick, G.M.; Larson, R.E.; Mack, E.J. Aerosol size distributions and optical properties found in the marine boundary layer over the Atlantic Ocean. J. Geophys. Res. Atmos. 1990, 95, 3659–3686. [Google Scholar] [CrossRef]
  54. Hoppel, W.A.; Frick, G.M. Submicron aerosol size distributions measured over the tropical and South Pacific. Atmos. Environment. Part A Gen. Top. 1990, 24, 645–659. [Google Scholar] [CrossRef]
  55. Dusek, U.; Frank, G.P.; Hildebrandt, L.; Curtius, J.; Schneider, J.; Walter, S.; Chand, D.; Drewnick, F.; Hings, S.; Jung, D.; et al. Size matters more than chemistry for cloud-nucleating ability of aerosol particles. Science 2006, 312, 1375–1378. [Google Scholar] [CrossRef]
  56. Alanen, J.; Isotalo, M.; Kuittinen, N.; Simonen, P.; Martikainen, S.; Kuuluvainen, H.; Honkanen, M.; Lehtoranta, K.; Nyyssonen, S.; Vesala, H.; et al. Physical characteristics of particle emissions from a medium speed ship engine fueled with natural gas and low-sulfur liquid fuels. Environ. Sci. Technol. 2020, 54, 5376–5384. [Google Scholar] [CrossRef] [PubMed]
  57. Burkart, J.; Hodshire, A.L.; Mungall, E.L.; Pierce, J.R.; Collins, D.B.; Ladino, L.A.; Lee, A.K.Y.; Irish, V.; Wentzell, J.J.B.; Liggio, J.; et al. Organic condensation and particle growth to CCN sizes in the summertime marine Arctic is driven by materials more semivolatile than at continental sites. Geophys. Res. Lett. 2017, 44, 10725–10734. [Google Scholar] [CrossRef]
  58. Yu, C.; Pasternak, D.; Lee, J.; Yang, M.; Bell, T.; Bower, K.; Wu, H.; Liu, D.; Reed, C.; Bauguitte, S.; et al. Characterizing the particle composition and cloud condensation nuclei from shipping emission in Western Europe. Environ. Sci. Technol. 2020, 54, 15604–15612. [Google Scholar] [CrossRef]
  59. Gong, S.L. A parameterization of sea-salt aerosol source function for sub- and super-micron particles. Glob. Biogeochem. Cycles 2003, 17, 1097. [Google Scholar] [CrossRef]
  60. Russell, L.M.; Moore, R.H.; Burrows, S.M.; Quinn, P.K. Ocean flux of salt, sulfate, and organic components to atmospheric aerosol. Earth Sci. Rev. 2023, 239, 104364. [Google Scholar] [CrossRef]
  61. Kecorius, S.; Hoffmann, E.H.; Tilgner, A.; Barrientos-Velasco, C.; van Pinxteren, M.; Zeppenfeld, S.; Vogl, T.; Madueno, L.; Lovric, M.; Wiedensohler, A.; et al. Rapid growth of Aitken-mode particles during Arctic summer by fog chemical processing and its implication. Pnas Nexus 2023, 2, pgad124. [Google Scholar] [CrossRef]
  62. Shen, Y.; Meng, H.; Yao, X.; Peng, Z.; Sun, Y.; Zhang, J.; Gao, Y.; Feng, L.; Liu, X.; Gao, H. Does ambient secondary conversion or the prolonged fast conversion in combustion plumes cause severe PM2.5 air pollution in China? Atmosphere 2022, 13, 673. [Google Scholar] [CrossRef]
  63. Royer, H.M.; Poehlker, M.L.; Krueger, O.; Blades, E.; Sealy, P.; Lata, N.N.; Cheng, Z.; China, S.; Ault, A.P.; Quinn, P.K.; et al. African smoke particles act as cloud condensation nuclei in the wintertime tropical North Atlantic boundary layer over Barbados. Atmos. Chem. Phys. 2023, 23, 981–998. [Google Scholar] [CrossRef]
  64. Quinn, P.K.; Coffman, D.J.; Johnson, J.E.; Upchurch, L.M.; Bates, T.S. Small fraction of marine cloud condensation nuclei made up of sea spray aerosol. Nat. Geosci. 2017, 10, 674–679. [Google Scholar] [CrossRef]
  65. Xu, W.; Ovadnevaite, J.; Fossum, K.N.; Lin, C.; Huang, R.-J.; Ceburnis, D.; O’Dowd, C. Sea spray as an obscured source for marine cloud nuclei. Nat. Geosci. 2022, 15, 282–286. [Google Scholar] [CrossRef]
  66. Wang, Q.; He, X.; Huang, X.H.H.; Griffith, S.M.; Feng, Y.; Zhang, T.; Zhang, Q.; Wu, D.; Yu, J.Z. Impact of secondary organic aerosol tracers on tracer-based source apportionment of organic carbon and PM2.5: A case study in the Pearl River Delta, China. Acs Earth Space Chem. 2017, 1, 562–571. [Google Scholar] [CrossRef]
  67. Jia, H.; Ma, X.; Yu, F.; Liu, Y.; Yin, Y. Distinct impacts of increased aerosols on cloud droplet number concentration of stratus/stratocumulus and cumulus. Geophys. Res. Lett. 2019, 46, 13517–13525. [Google Scholar] [CrossRef]
  68. Iwamoto, Y.; Watanabe, A.; Kataoka, R.; Uematsu, M.; Miura, K. Aerosol-cloud interaction at the summit of Mt. Fuji, Japan: Factors influencing cloud droplet number concentrations. Appl. Sci. 2021, 11, 8439. [Google Scholar] [CrossRef]
  69. Pruppacher, H.R.; Klett, J.D. Microphysics of Clouds and Precipitation; Springer Nature: Dordrecht, The Netherlands, 1980. [Google Scholar] [CrossRef]
Figure 1. Cruise tracks of the campaign in 2021 (a) and in 2014 (b). The green line represents the low period for each cruise. While the blue line represent other period cruise route, the red dots represent the start of the day (00:00 UTC+8). The dashed box marks the area for calculating the seasonal correction factor.
Atmosphere 15 00972 g001
Figure 2. Time series of minute-averaged Ncn and bulk Nccn values at 0.2% and 0.4% SS during the spring campaigns in DOY 77–112 of 2014 and DOY 129–168 of 2021 ((a) Ncn in 2021; (c) Nccn in 2021; (b) Ncn in 2014; (d) Nccn in 2014; the marginal sea cruise is with gray shading; lower values observed in DOY 135–142 of 2021 are zoomed in and superimposed in (a,c)).
Atmosphere 15 00972 g002
Figure 3. The Ncn and Nccn in the 2021 and 2014 cruises at the 10th to 90th percentile values were calculated and compared separately during the NWPO and the marginal seas of China ((a) Ncn in 2021 vs. 2014 in marginal seas; (b) Ncn in 2021 vs. 2014 in NWPO; (c) Nccn in 2021 vs. 2014 in marginal seas; (d) Nccn in 2021 vs. 2014 in NWPO). The black and red dots represent Nccn at 0.2% SS and at 0.4% SS in (c) and (d), respectively.
Atmosphere 15 00972 g003
Figure 4. Spatiotemporal variations in PMF-resolved Nccn from six factors at 0.2% and 0.4% SS and corresponding source profiles in PNSDs in 2021 ((a,b) PMF-resolved Nccn at 0.2% SS and 0.4%; (ch) PNSDs of Factor 1 to 6).
Atmosphere 15 00972 g004
Figure 5. Spatiotemporal variations in PMF-resolved Nccn from five factors at 0.2% SS and 0.4% SS and corresponding source profiles in PNSDs in 2014 ((a,b) PMF-resolved Nccn at 0.2% SS and 0.4% SS; (cg) PNSDs of Factor 1 to 5).
Atmosphere 15 00972 g005
Figure 6. Comparison of PMF-resolved Ncn and Nccn with original observations in 2021 ((a,b) spatiotemporal variations in observed and PMF-predicted Ncn and Nccn; (c,d) the correlations between observed and PMF-predicted Ncn and Nccn). A red zone indicates an overprediction of the model while a gray zone indicates an underprediction of the model.
Atmosphere 15 00972 g006
Figure 7. Comparison of PMF-resolved Ncn and Nccn with original observations in 2014 ((a,b) spatiotemporal variations in observed and PMF-predicted Ncn and Nccn; (c,d) the correlations between observed and PMF-predicted Ncn and Nccn). A red zone indicates an overprediction of the model while a gray zone indicates an underprediction of the model.
Atmosphere 15 00972 g007
Disclaimer/Publisher’s Note: The statements, opinions and data contained in all publications are solely those of the individual author(s) and contributor(s) and not of MDPI and/or the editor(s). MDPI and/or the editor(s) disclaim responsibility for any injury to people or property resulting from any ideas, methods, instructions or products referred to in the content.

