Article

Assessing the Potential Impacts of Climate Change on Drought in Uzbekistan: Findings from RCP and SSP Scenarios

by
Natella Rakhmatova
1,
Bakhriddin E. Nishonov
1,2,
Bakhtiyar M. Kholmatjanov
1,2,
Valeriya Rakhmatova
3,
Kristina N. Toderich
4,
Gulchekhra M. Khasankhanova
5,
Lyudmila Shardakova
1,
Temur Khujanazarov
6,
Akmal N. Ungalov
7 and
Dmitry A. Belikov
8,*
1
Hydrometeorological Research Institute, Agency of Hydrometeorological Service of the Republic of Uzbekistan, Tashkent 100052, Uzbekistan
2
Faculty of Hydrometeorology, National University of Uzbekistan, Tashkent 100174, Uzbekistan
3
Graduate School of Engineering, Kyoto University, Gokasho, Uji 611-0011, Japan
4
Graduate School of Bioresources, Mie University, Mie 514-0102, Japan
5
Design and Research UZGIP Institute, Tashkent 100100, Uzbekistan
6
Disaster Prevention Research Institute, Kyoto University, Gokasho, Uji 611-0011, Japan
7
Department of Strategic Planning and Methodology, Ministry of Higher Education, Science and Innovation of the Republic of Uzbekistan, Tashkent 100174, Uzbekistan
8
Center for Environmental Remote Sensing, Chiba University, Chiba 263-8522, Japan
*
Author to whom correspondence should be addressed.
Atmosphere 2024, 15(7), 866; https://doi.org/10.3390/atmos15070866
Submission received: 4 June 2024 / Revised: 2 July 2024 / Accepted: 11 July 2024 / Published: 22 July 2024
(This article belongs to the Section Climatology)

Abstract

:
Future climate change and its impact on drought is critical for Uzbekistan, located in Central Asia, the world’s largest arid zone. This study examines the evolving intensity of climate change and drought events using multi-model ensembles (MMEs) derived from the Coupled Model Intercomparison Project Phase 5 and 6 (CMIP5 and CMIP6) simulated under the Representative Concentration Pathway and Shared Socioeconomic Pathway (RCP and SSP) scenarios. The projections show different rates of increase in temperature and precipitation under the RCPs and SSPs. Projected temperature increases are expected to reach up to 2–2.5 °C under SSP1-2.6, SSP2-4.5, and SSP3-7.0, by mid-century. By 2080–2099, an increase is projected of 2–3 °C in monthly mean temperatures throughout the year (SSP1-2.6), and a more pronounced increase in summer up to 3–4 °C (SSP2-4.5) and 4–6 °C (SSP3-7.0), with a marked contrast in conditions between the mountainous and desert regions of Uzbekistan. Regional changes in precipitation over the study periods show relatively little variability, except for FD, where notable trends are found. Under SSP1-2.6 and SSP2-4.5, the increase in precipitation is relatively modest, whereas the changes in SSP3-7.0 are more substantial, with some regions experiencing variations of up to 10–20 mm per period. The Standardized Precipitation Evapotranspiration Index (SPEI), calculated based on the projected temperature and precipitation, provides an estimate of future drought trends. Our results show increasing aridity under all scenarios by mid-century, with longer-term projections indicating stabilization around different SPEI values by 2100: RCP2.6 and SSP1-1.9 stabilize around −1.0; RCP4.5, RCP6.0, SSP2-4.5, and SSP3-7.0 stabilize around −1.5; while RCP8.5 and SSP5-8.5 scenarios project values of −2 or less by 2100. Notable differences in the SPEI index are found between lowland and foothill regions. In view of Uzbekistan’s heavy reliance on agriculture and irrigation, which are the sectors that are expected to be mostly affected by climate change, our study provides a scientific basis for informed policy decision-making. This includes various aspects such as planning and management water resources, as well as the broader socioeconomic development of the country.

1. Introduction

The profound and multifaceted challenges posed by global warming and climate change have increasingly captured the attention of the scientific community [1,2,3]. The Intergovernmental Panel on Climate Change (IPCC)’s Sixth Assessment Report paints a stark picture, documenting a remarkable increase in global surface temperature. According to the report, from 1850–1900 to 2001–2020, the global surface temperature increased by 0.99 °C, accelerating to 1.09 °C when comparing 1850–1900 to 2011–2020 [4]. This increase, as described by various climate models [5], is expected to amplify the hydrological cycle and cause an uneven global distribution of precipitation. Evaporation rates are expected to increase with temperature, potentially outpacing precipitation increases and escalating drought risks, especially in water-scarce regions. Since the mid-20th century, the frequency and severity of droughts have increased in many regions of Africa, East Asia, and South Asia, affecting agriculture and wild ecosystems [6]. Understanding future dry–wet climate trends is critical to addressing the challenges posed by global warming.
Scenarios describing future human-induced climate change trends are a key focus of climate research. The Coupled Model Intercomparison Project (CMIP), operational since 1995, coordinates international climate model experiments to improve the understanding of historical and future climate dynamics [7]. CMIP5 (initiated in 2008) [8] and CMIP6 (initiated in 2016) [9,10] have conducted extensive simulations using updated models and scenarios to project future climate change. These efforts contribute significantly to the IPCC assessments by providing insights into temperature patterns, precipitation trends, sea level variations, and climate mechanisms that are essential for the development of mitigation and adaptation strategies [7,9,10,11,12,13]. Despite the inherent uncertainties in model simulations, the multi-model ensemble mean (MME) is quite robust. Bias correction methods adjust model outputs, resulting in more accurate climate predictions and enabling policy makers to make informed decisions [14,15].
Central Asia (CA) has become a region of significant concern in the face of global warming, primarily because of its low precipitation and consequent constraints on water availability [16]. Therefore, understanding the changes in natural water resources induced by climate change is of paramount importance. Research shows a remarkable trend in global dryland temperatures, with a significant increase since the late 1940s, exceeding both global and Northern Hemisphere averages [17]. CA exhibits a worrisome divergence in water dynamics, with potential evapotranspiration increasing by 5.2 mm per decade, far outpacing the moderate increase in precipitation of 4.0 mm per decade [18,19]. This relentless trend of warming and drying, documented between 1901 and 2002, presents a growing threat to water security in the region, particularly for western Uzbekistan, central Kazakhstan, Turkmenistan, central Mongolia, and southern Xinjiang in China, where the impacts are most pronounced [20]. Projections based on CMIP5/6 scenarios indicate a continued upward trend in temperature, precipitation, and evapotranspiration throughout the 21st century [19,21,22,23,24,25]. Nevertheless, the expected increase in evapotranspiration that exceeds the concomitant increase in precipitation by 2030 will lead to an escalation of drought conditions [25,26]. This underscores the critical need for vigilant monitoring of evolving climate dynamics in CA to mitigate potential impacts on water resources.
Previous research has provided estimates of the impact of climate change on drought intensity on a global [27] or regional scale [1,23,28]. However, there is an urgent need for more detailed assessments focusing on sub-regions within countries. The fragile arid and semi-arid ecosystem of Uzbekistan faces an existential threat from climate change. Recently, the region has experienced a severe ecological crisis including the drastic reduction of the Aral Sea [29], increased land desertification [30,31] and an increase in extreme events, including droughts [32], sand and dust storms [33]. These ecological crises have severely disrupted local industrial and agricultural production, with profound implications for the livelihoods of the population.
This study examines the evolving characteristics of future drought events in Uzbekistan and highlights their spatiotemporal patterns under different climate scenarios. Using the data from the CMIP5 and CMIP6 MMEs, we assess projected temperature and precipitation trends in the different regions of Uzbekistan under the Representative Concentration Pathway (RCP) and Shared Socioeconomic Pathway (SSP) scenarios. To comprehensively capture the evolving drought picture, we use the Standardized Precipitation Evapotranspiration Index (SPEI), which incorporates variations in temperature and precipitation [34,35,36]. Our analysis reveals spatial and temporal shifts in drought intensity, frequency, and duration for two critical time periods: 2021–2060 and 2061–2100, commonly referred to as the “near future” and the “far future”, respectively. The remaining sections of this paper are organized as follows: Section 2 provides a description of the datasets, models, and methods used. Section 3 presents the comprehensive assessment of drought characteristics in Uzbekistan under different climate scenarios using CMIP5 and CMIP6 data. Section 4 discusses these findings in comparison with existing research. Finally, Section 5 synthesizes the main key research findings and insightful conclusions for future drought resilience strategies in Uzbekistan.

2. Materials and Methods
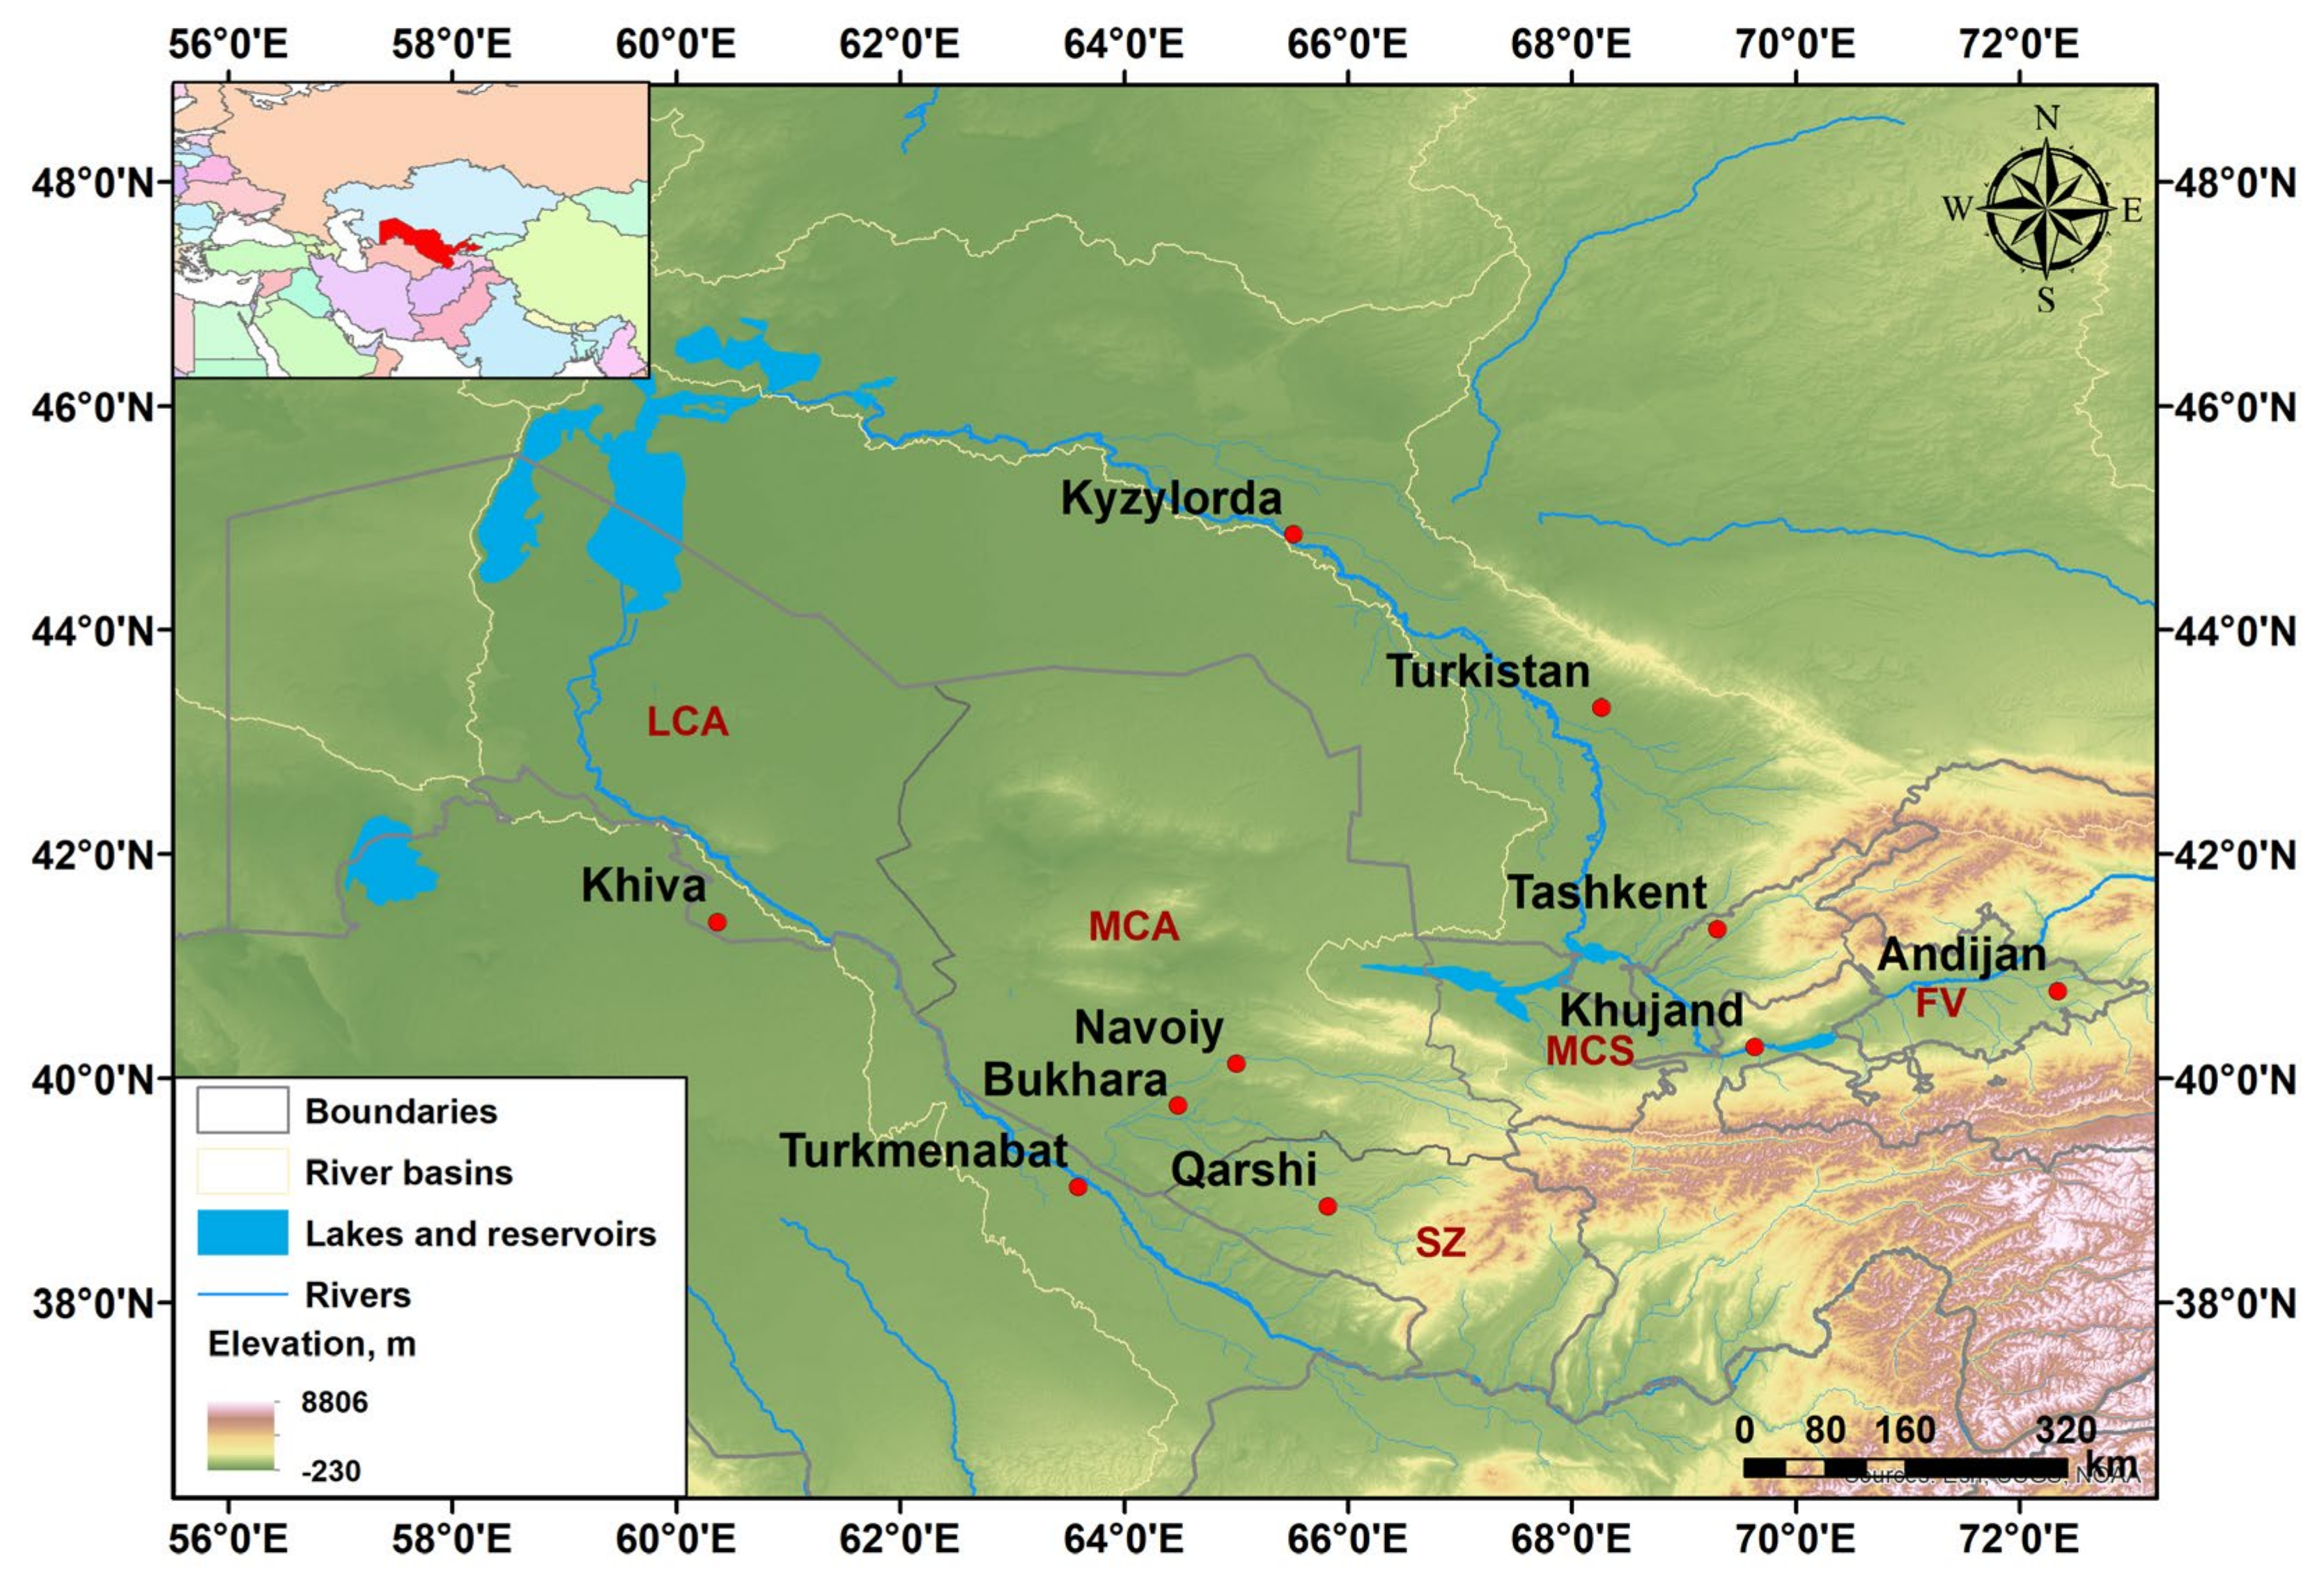
2.1. Study Domain

Uzbekistan, located in CA (Figure 1), has extensive areas of sandy and rocky desert landscapes. The most prominent of these deserts are the Kyzyl Kum Desert, the Turan Depression, and the Ustyurt Plateau. The country is crossed by the Amu Darya and Syr Darya rivers, which are important sources of water for irrigation and agriculture development. The Tien Shan and Pamir Mountain ranges also cross the country, with the highest point being Khazret Sultan, which rises to 4643 m above sea level [16,37]. Uzbekistan has a continental climate with marked seasonal temperature variations. This climate is influenced by continental air masses driven by cold northerly winds in winter and warm southerly winds in the summer months. The average annual temperature is 14.5 °C, with January temperatures around −3 °C and July mean temperatures exceeding +29 °C. The country’s location within the subtropical high-pressure belt also contributes to the formation of a dry climate, characterized by low rainfall and high evaporation rates. The average annual rainfall is about 200 mm, while the average annual evaporation is about 2500 mm.
The Republic of Uzbekistan is administratively divided into 12 provinces, which are strategically grouped into five regions based on geographical homogeneity in terms of climatic conditions and water resources. This grouping is particularly aligned with the major river basins, and the regions share similarities in vulnerability levels, especially in key sectors such as water management and agriculture [38]. As shown in Figure 1, the five planning zones delineated within the major river basins of Uzbekistan are the Amu Darya basin, which includes the Southern Zone (SZ), the Middle Course of the Amu Darya (MCA), and the Lower Course of the Amu Darya (LCA); and the Syr Darya basin, which includes the Fergana Valley (FV) and the Middle Course of the Syr Darya (MCS).
Uzbekistan faces significant challenges from climate change, making it one of the most vulnerable countries in Eurasia. The country is experiencing a warming trend above the global average, leading to accelerated glacier melting, reduced water resources, and increased extreme weather events like sandstorms and droughts [39,40]. These impacts harm the national economy and well-being of the local population.

2.2. The Climate Research Unit Observation Data

The Climate Research Unit (CRU) observations are a series of long-term climate datasets compiled and analyzed by the Climate Research Unit at the University of East Anglia in the United Kingdom [41,42]. The CRU TS v. 4.01 dataset, released in 2017, is constructed from meteorological stations contributing interpolated data values distributed over a 0.5° longitude/latitude grid. This dataset serves as a valuable resource for providing comprehensive meteorological information for various analyses and studies, facilitating insights into climate patterns and trends on a global scale. These datasets provide information on temperature, precipitation, atmospheric circulation, and other climate variables collected from a variety of sources, including weather stations, satellites, and reanalysis models. The more recent CRU dataset has been used extensively in Asian dryland research [43,44,45,46]. However, it is important to note that the pre-1960 CRU dataset may not be suitable for applications requiring high data accuracy, primarily due to the limited inclusion of ground station data. Therefore, precipitation and temperature data prior to 1960 are considered to be relatively less robust and reliable.

2.3. The ERA5 Reanalysis

ERA5 is the fifth generation ECMWF (European Centre for Medium-Range Weather Forecasts) atmospheric reanalysis of the global climate. This dataset provides a consistent and standardized compilation of a wide range of meteorological variables, including temperature, precipitation, and wind. It has a high temporal and spatial resolution of 1 h and f 0.1° [47]. Constructed through a fusion of observational data and numerical weather forecast models, ERA5 spans from 1940 to near-real time, ensuring a comprehensive and contemporary perspective. Stringent quality control procedures are an integral part of ERA5, ensuring accuracy and consistency in its many applications in meteorology, climatology, and atmospheric science [48,49,50]. This dataset is used extensively in academic research and policy analysis, serving as a key tool to examine the variability and trends of meteorological variables and to understand the multiple impacts of climate change. In regions such as Central Asia, which are marked by a lack of dense measurement networks, ERA5 reanalysis data are proving to be a credible substitute for direct observations [38].

2.4. RCP Scenarios

RCPs are prominent trajectories characterizing greenhouse gas (GHG) concentrations used by IPCC for advanced climate modeling and empirical research [51]. These trajectories delineate distinctive climate projections that depend on the amount of GHGs emitted in the coming years. The nomenclature of the main RCPs, namely RCP2.6, RCP4.5, RCP6, and RCP8.5, reflects the potential range of radiative forcing values projected for the year 2100, measured in watts per square meter (W/m2). Each indicated pathway is delineated by a potential range of radiative forcing values by the end of the century, specifically 2.6, 4.5, 6, and 8.5 W/m2. These numerical representations encapsulate the projected impact on the Earth’s energy balance resulting from the concentration of GHGs in the atmosphere. As a key metric, these values play a critical role in assessing potential climate outcomes associated with different emission levels and mitigation strategies.

2.5. SSP Scenarios

SSPs delineate global pathways that project different climate change mitigation and adaptation challenges. A conceptual framework underpinning the SSPs includes five alternative narratives that provide qualitative representations of the key characteristics of these pathways in terms of national population, urbanization, and gross domestic product (GDP) per capita [9,13]. Broadly speaking, SSPs articulate potential developments in future societies. SSP1 [52] and SSP5 [53] represent relatively optimistic trajectories for human development, characterized by substantial investments in education and health, rapid economic growth, and the presence of robust institutions. However, SSP5 envisions an energy-intensive, fossil-based economic structure, while SSP1 illustrates a gradual shift toward sustainable practices. In contrast, SSP3 [54] and SSP4 [55] project more pessimistic development trends, characterized by limited investment in education and health, burgeoning populations, and escalating inequalities. SSP3 emphasizes regional security, while SSP4 depicts scenarios dominated by extensive inequalities within and between countries, culminating in societies highly vulnerable to the impacts of climate change. SSP2 [56] outlines a central pathway in which prevailing trends continue along historical trajectories without significant deviation. This pathway represents a moderate and balanced narrative within the spectrum of socioeconomic development scenarios.
Using the SSP framework, the IPCC Sixth Assessment Report assessed expected temperature outcomes based on a set of five scenarios [57]. These scenarios are named by combining the respective SSP (SSP1-SSP5) with the expected level of radiative forcing projected for the year 2100 (ranging from 1.9 to 8.5 W/m2). Consequently, the nomenclature of the main SSPs results in the following scenario names: (1) SSP1-1.9: Significantly low GHG emissions, characterized by the achievement of carbon dioxide (CO2) emissions reduced to net zero around the year 2050. (2) SSP1-2.6: Indicating low GHG emissions, with a focus on achieving net zero CO2 emissions around the year 2075. (3) SSP2-4.5: shows intermediate GHG emissions, with a CO2 emission projected to continue at current levels through 2050, followed by a decline, but not to net zero by 2100. (4) SSP3-7.0: shows high GHG emissions, accompanied by a scenario in which CO2 emissions are projected to double by 2100. (5): SSP5-8.5: Reflects very high GHG emissions, with a scenario projecting a tripling of CO2 emissions by 2075.

2.6. CMIP5/CMIP6 Model Dataset

The study uses output data from two different generations of climate models, CMIP5 and CMIP6. The output data from the CMIP5 models are available at https://aims2.llnl.gov/search/cmip5/ (accessed on 10 July 2024), with a selected set including scenario experiments for RCP2.6/4.5/8.5 across 30 climate models (see Table A1, Appendix A). Meanwhile, CMIP6 model output data are available at https://aims2.llnl.gov/search/cmip6/ (accessed on 10 July 2024). Of the 58 available CMIP6 models, 27 were carefully selected based on specific criteria related to the availability and quality of the required parameters, as shown in Table A2, Appendix A. In particular, the selection process considers only the use of concentration-based experiments where concentrations, as opposed to GHG emissions, are prescribed. In addition, a single ensemble member is selected from each model in an effort to balance the weights across models, regardless of the existence of multiple versions with different initial conditions and different representations of the physical process. This approach ensures a balanced and consistent integration of the selected models for the calculation of multi-model ensembles. The number of models used for each RCP/SSP scenario may vary.

2.7. The SPEI Drought Index

SPEI has been proposed as an improved drought index, with a specific focus on investigating the effects of global warming on drought severity [34]. The SPEI is distinguished by its capability to consider the impact of reference evapotranspiration on the severity of drought and its ability to discriminate between different droughts and how they affect different systems. [35]. Here, we calculate SPEI over a 12-month period (SPEI12), which provides a perspective on the accumulation and depletion of water within this specific period. The SPEI12 is often used to examine interannual variability in dry and wet characteristics and is critical for identifying patterns in climatic conditions. The classification system that describes the degree of drought and wetness is shown in Table 1 [34]. This categorization assists in interpreting the severity of drought events and assessing moisture conditions based on the calculated SPEI values, providing a comprehensive framework for understanding the climatic dynamics under study.
In our paper, the calculation of SPEI is implemented based on the R package SPEI (http://cran.r-project.org/web/packages/SPEI, accessed on 6 April 2021). Among several options available in the package, the logarithmic probability density function distribution recommended by [35], the unbiased PWM (Probability Weighted Moment), and the Hargreaves method [58] were used to calculate the monthly potential evapotranspiration, which was calculated in a modified form presented in [59].

2.8. Definition of Specific Periods

The baseline periods refer to the historical simulations for 1986–2005 and 1995–2014 for the CMIP5 and CMIP6 cases, respectively. The projected periods under different emission scenarios are 2020–2039, 2040–2059, 2060–2079, and 2080–2099.

3. Results

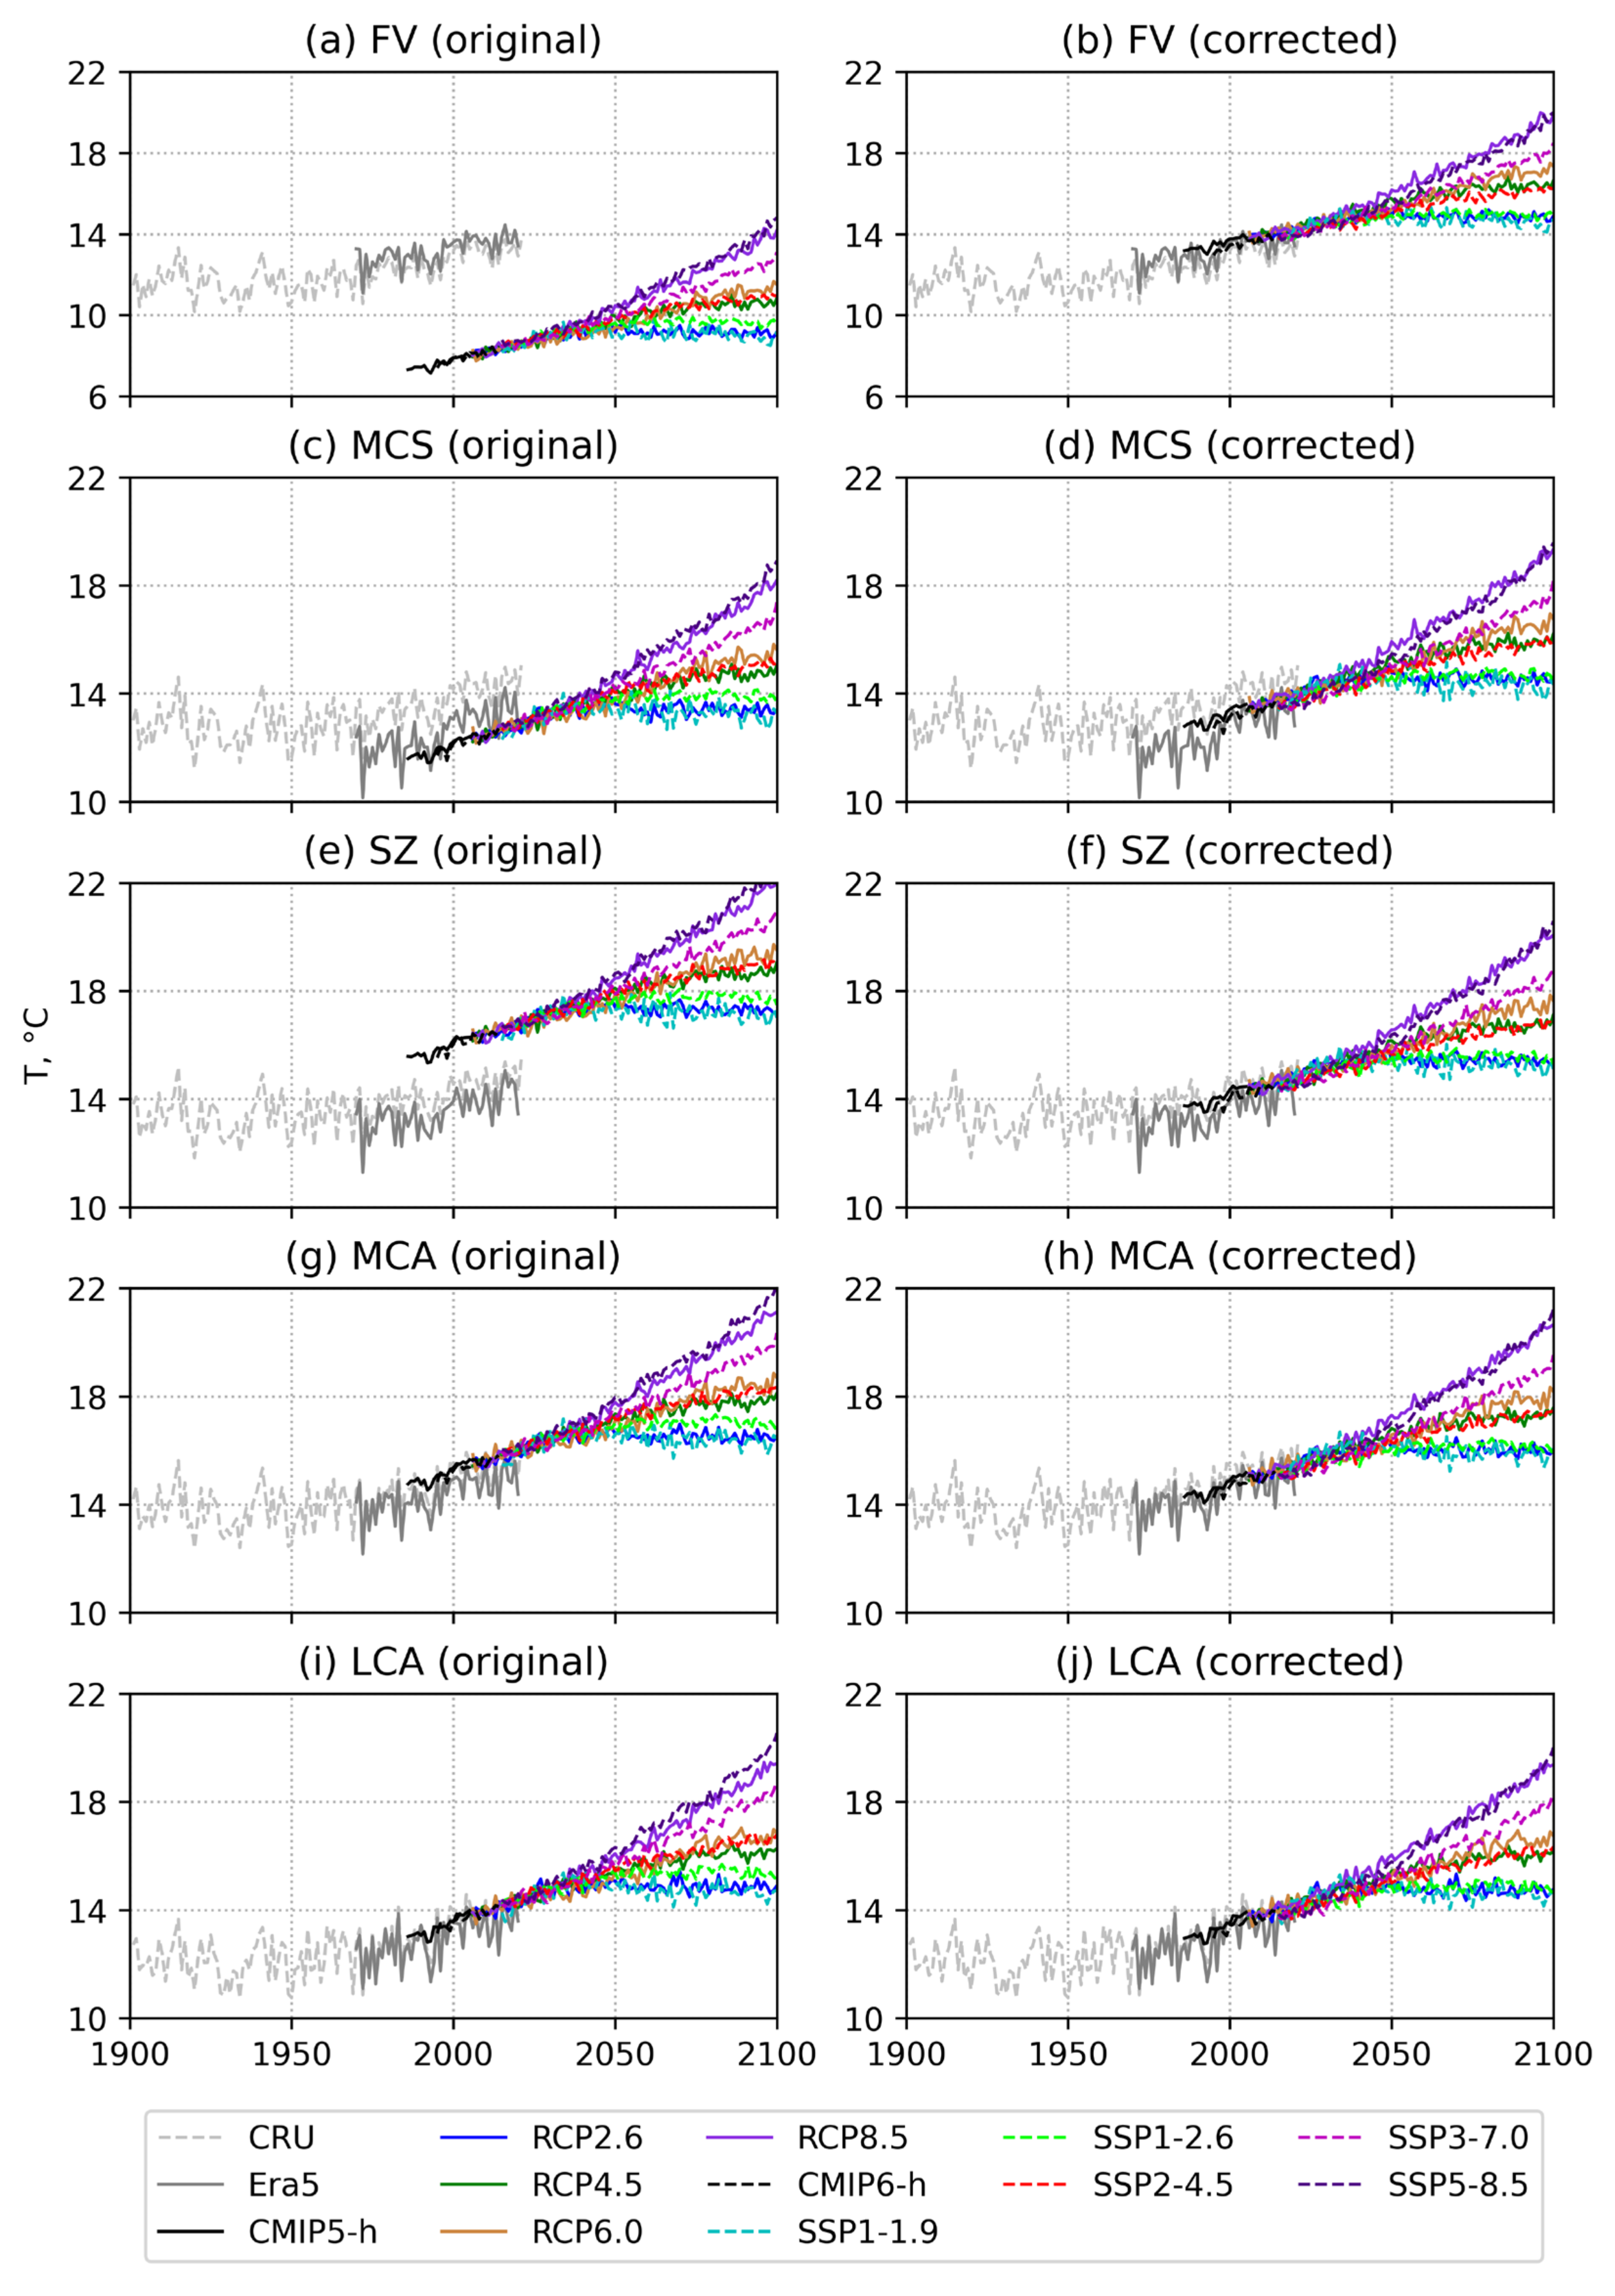
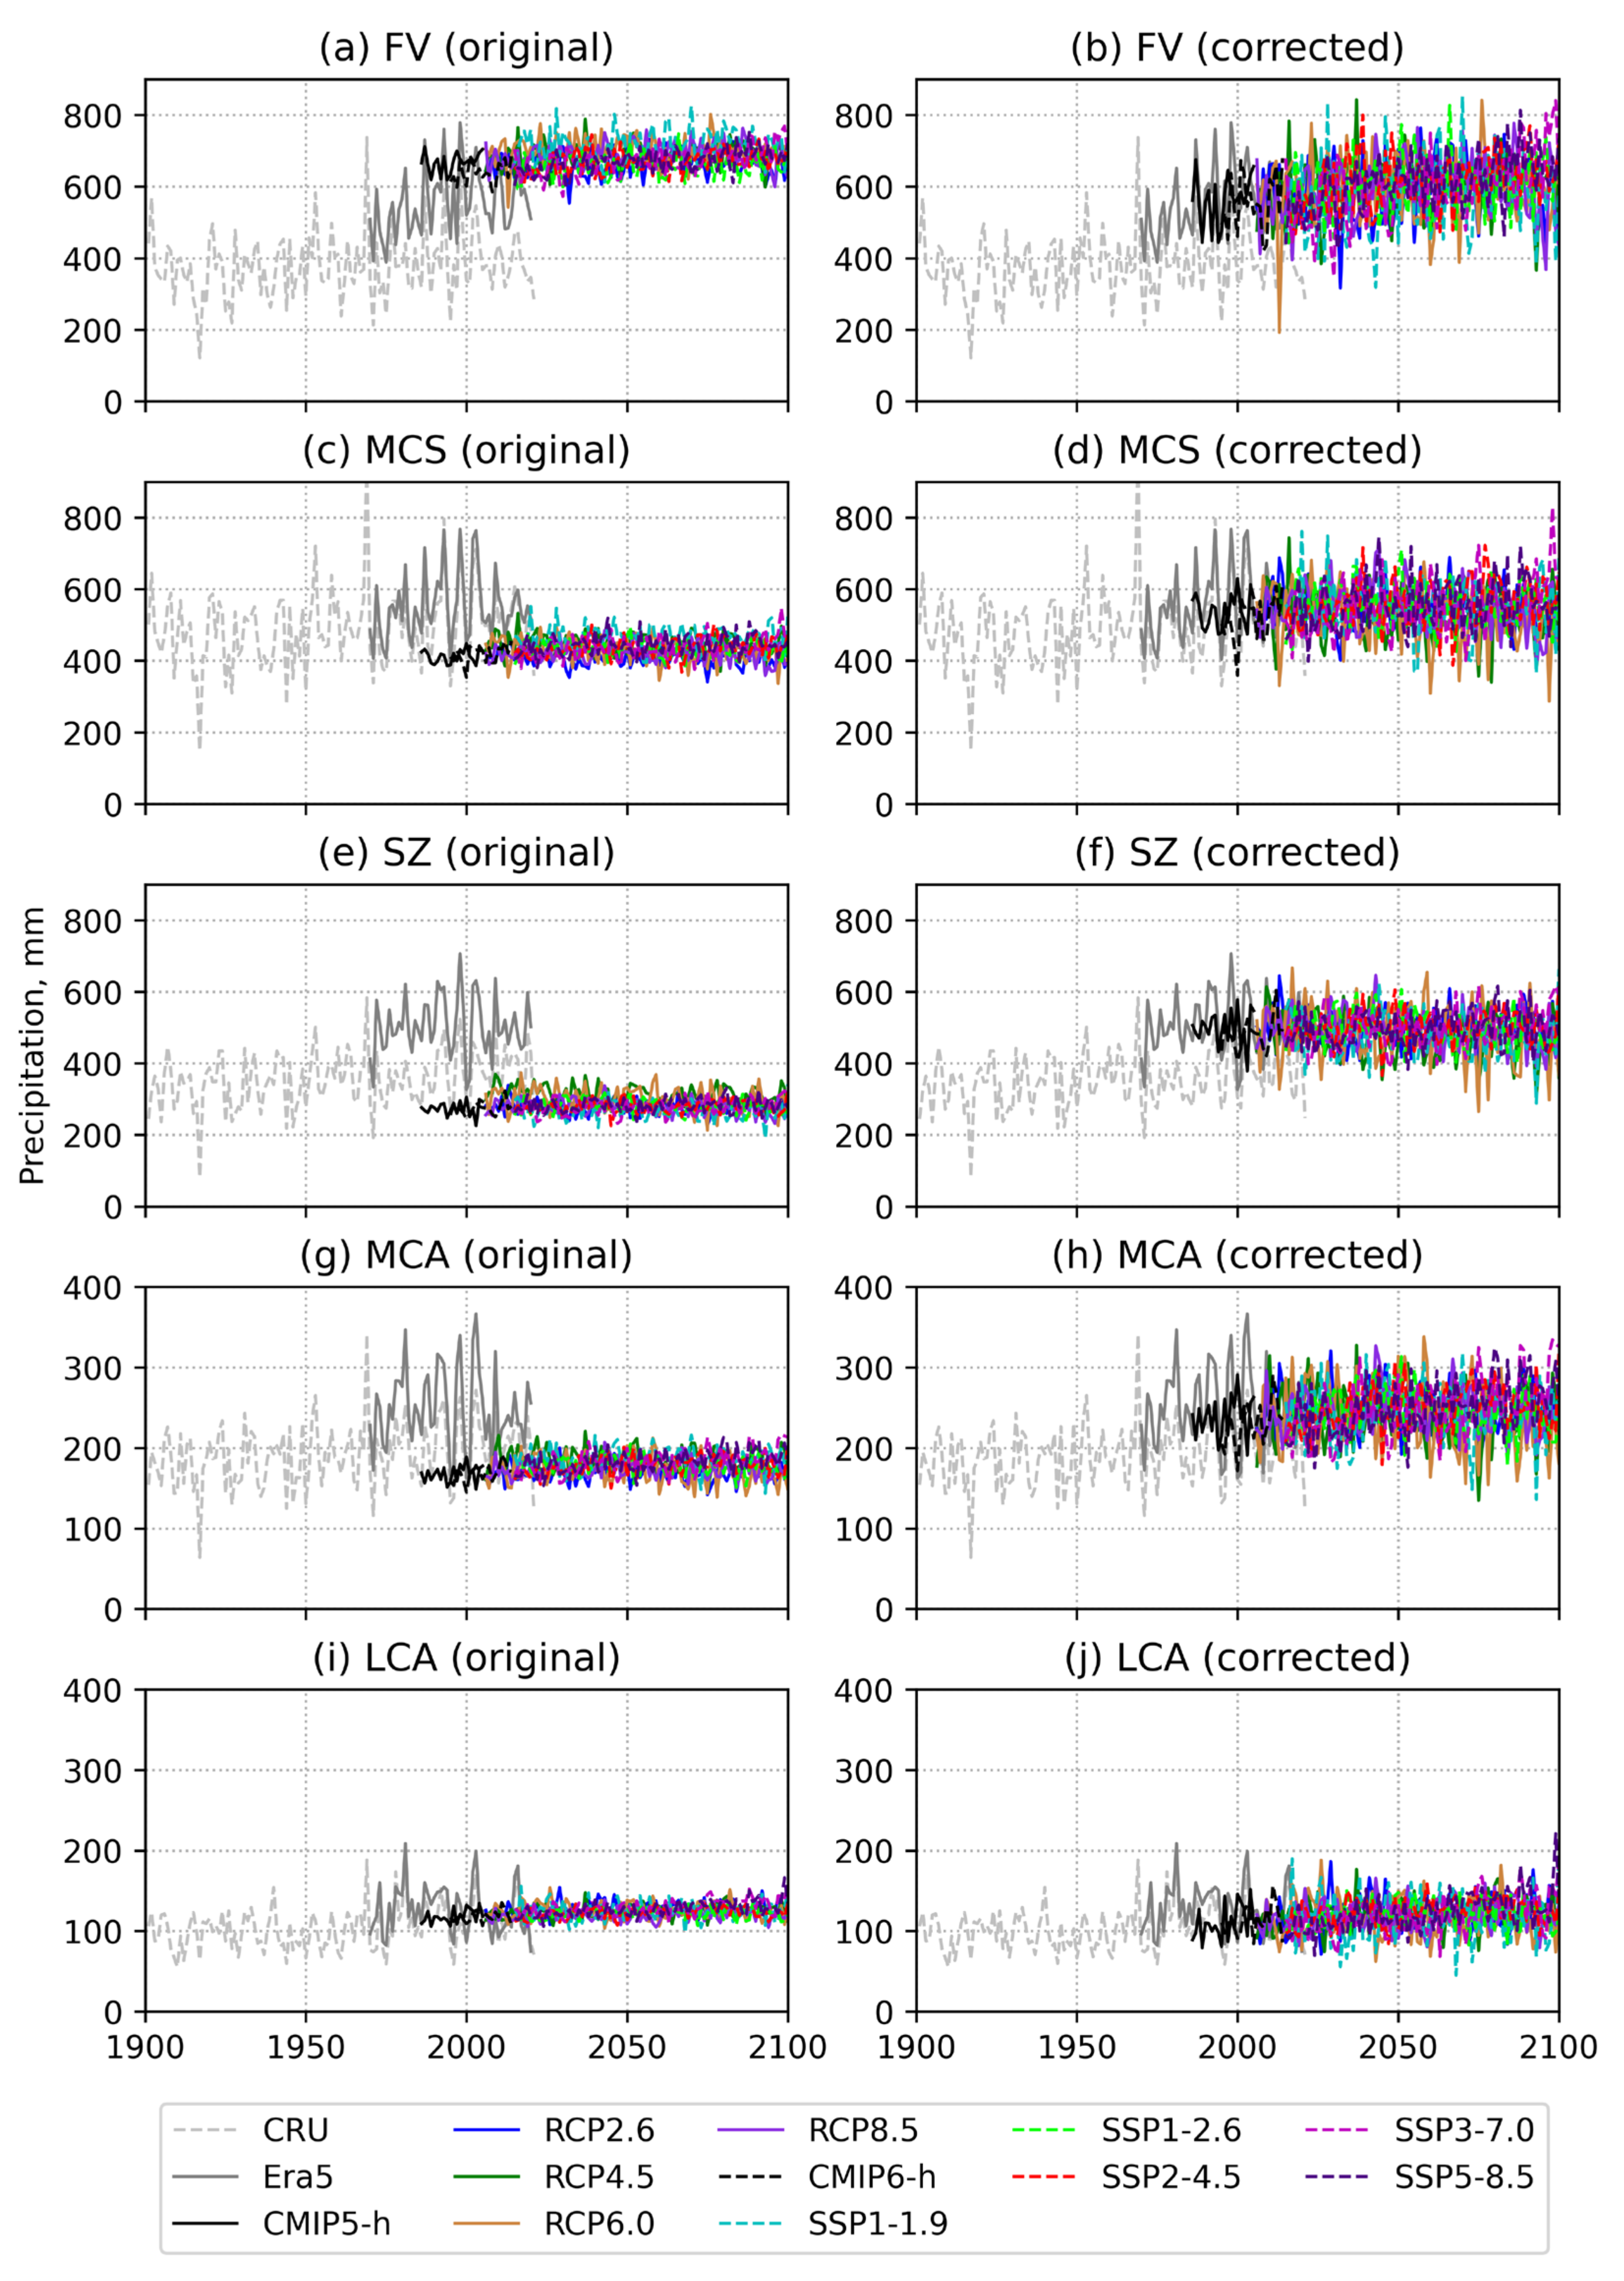
3.1. Climate Model Bias Correction

In the context of climate modeling, a bias correction in CMIP5/6 refers to a statistical adjustment applied to correct systematic errors or biases in the output of climate models [8,11,60,61]. These biases can arise from various sources, such as limitations in model physics, numerical approximations, or inaccuracies in the representation of processes affecting the climate system. The goal of bias correction is to improve the reliability and accuracy of climate model simulations by making them more consistent with observed climate data. This process aims to reduce discrepancies and ensure greater consistency between modeled results and actual climate observations. This correction typically involves comparing the model’s historical simulations with corresponding observations for the same time and location. Any discrepancies or biases between the model’s output and the observed data are quantified and then adjusted through statistical methods. Bias correction can be applied to various climate variables, including temperature and precipitation [8,11,60,61]. By implementing bias correction using ERA5 and CRU, we aim to produce model simulations that provide a more realistic representation of historical climate conditions (Figure 2 and Figure 3). We found that the original model values overestimate (underestimate) precipitation in the FV (MCS, SZ, and MCA) regions, and overestimate (underestimate) temperature in the SZ and MCA (FV and MCS) regions. This phenomenon highlights the influence of orography, with the model showing minimal error in the flattest region (i.e., LCA). The divergent temperature and model errors observed in these specific regions emphasize the need to consider them individually. It is important to note that while averages for the entire territory of Uzbekistan may be significantly erroneous due to aggregation effects, a region-specific approach allows for a more accurate representation of climatic conditions.

3.2. Time Series Analysis of Historical and Climate Projection Datasets

Since the 1970s, the pronounced warming trend in the Northern Hemisphere, including the CA regions, has been striking [62]. In particular, the increasing warming, with an average rate of 0.39 °C per decade from 1979 to 2011 in CA, exceeds the average rate of temperature change observed in global land areas [63] and several other regions [64]. In addition, the rate of warming in CA during the first two decades of the 21st century exceeds that of previous decades (see Figure 2). This increased rate in CA during the early 21st century is consistent with the averaged rates observed for Russia and China and exceeds that of Europe [29,63,64,65].
In response to this rapid warming, precipitation across the vast arid expanse of CA is undergoing a significant increase, characterized by greater magnitudes of variability [66]. A sustained increase in precipitation has been observed since the late 1970s, possibly related to persistent shifts in the mid-latitude westerly circulation (see Figure 3). Of note is the extensive interannual variability in precipitation patterns within CA, marked by distinct cycles of 5–6 years and 2–3 years. This recurrent pattern plays an important role as the dominant interannual climate signal, influencing both atmospheric circulation and precipitation over the mid-latitude Asian region. In particular, the 2–3-year cycle emerges as a key driver influencing atmospheric dynamics, evident in various climate variables in the troposphere and within the mid-latitude westerly circulation and Asian summer monsoon boundary regions. Further extensive study of this dominant cycle is essential to fully understand its mechanisms and implications for the broader climate system in mid-latitude Asia.

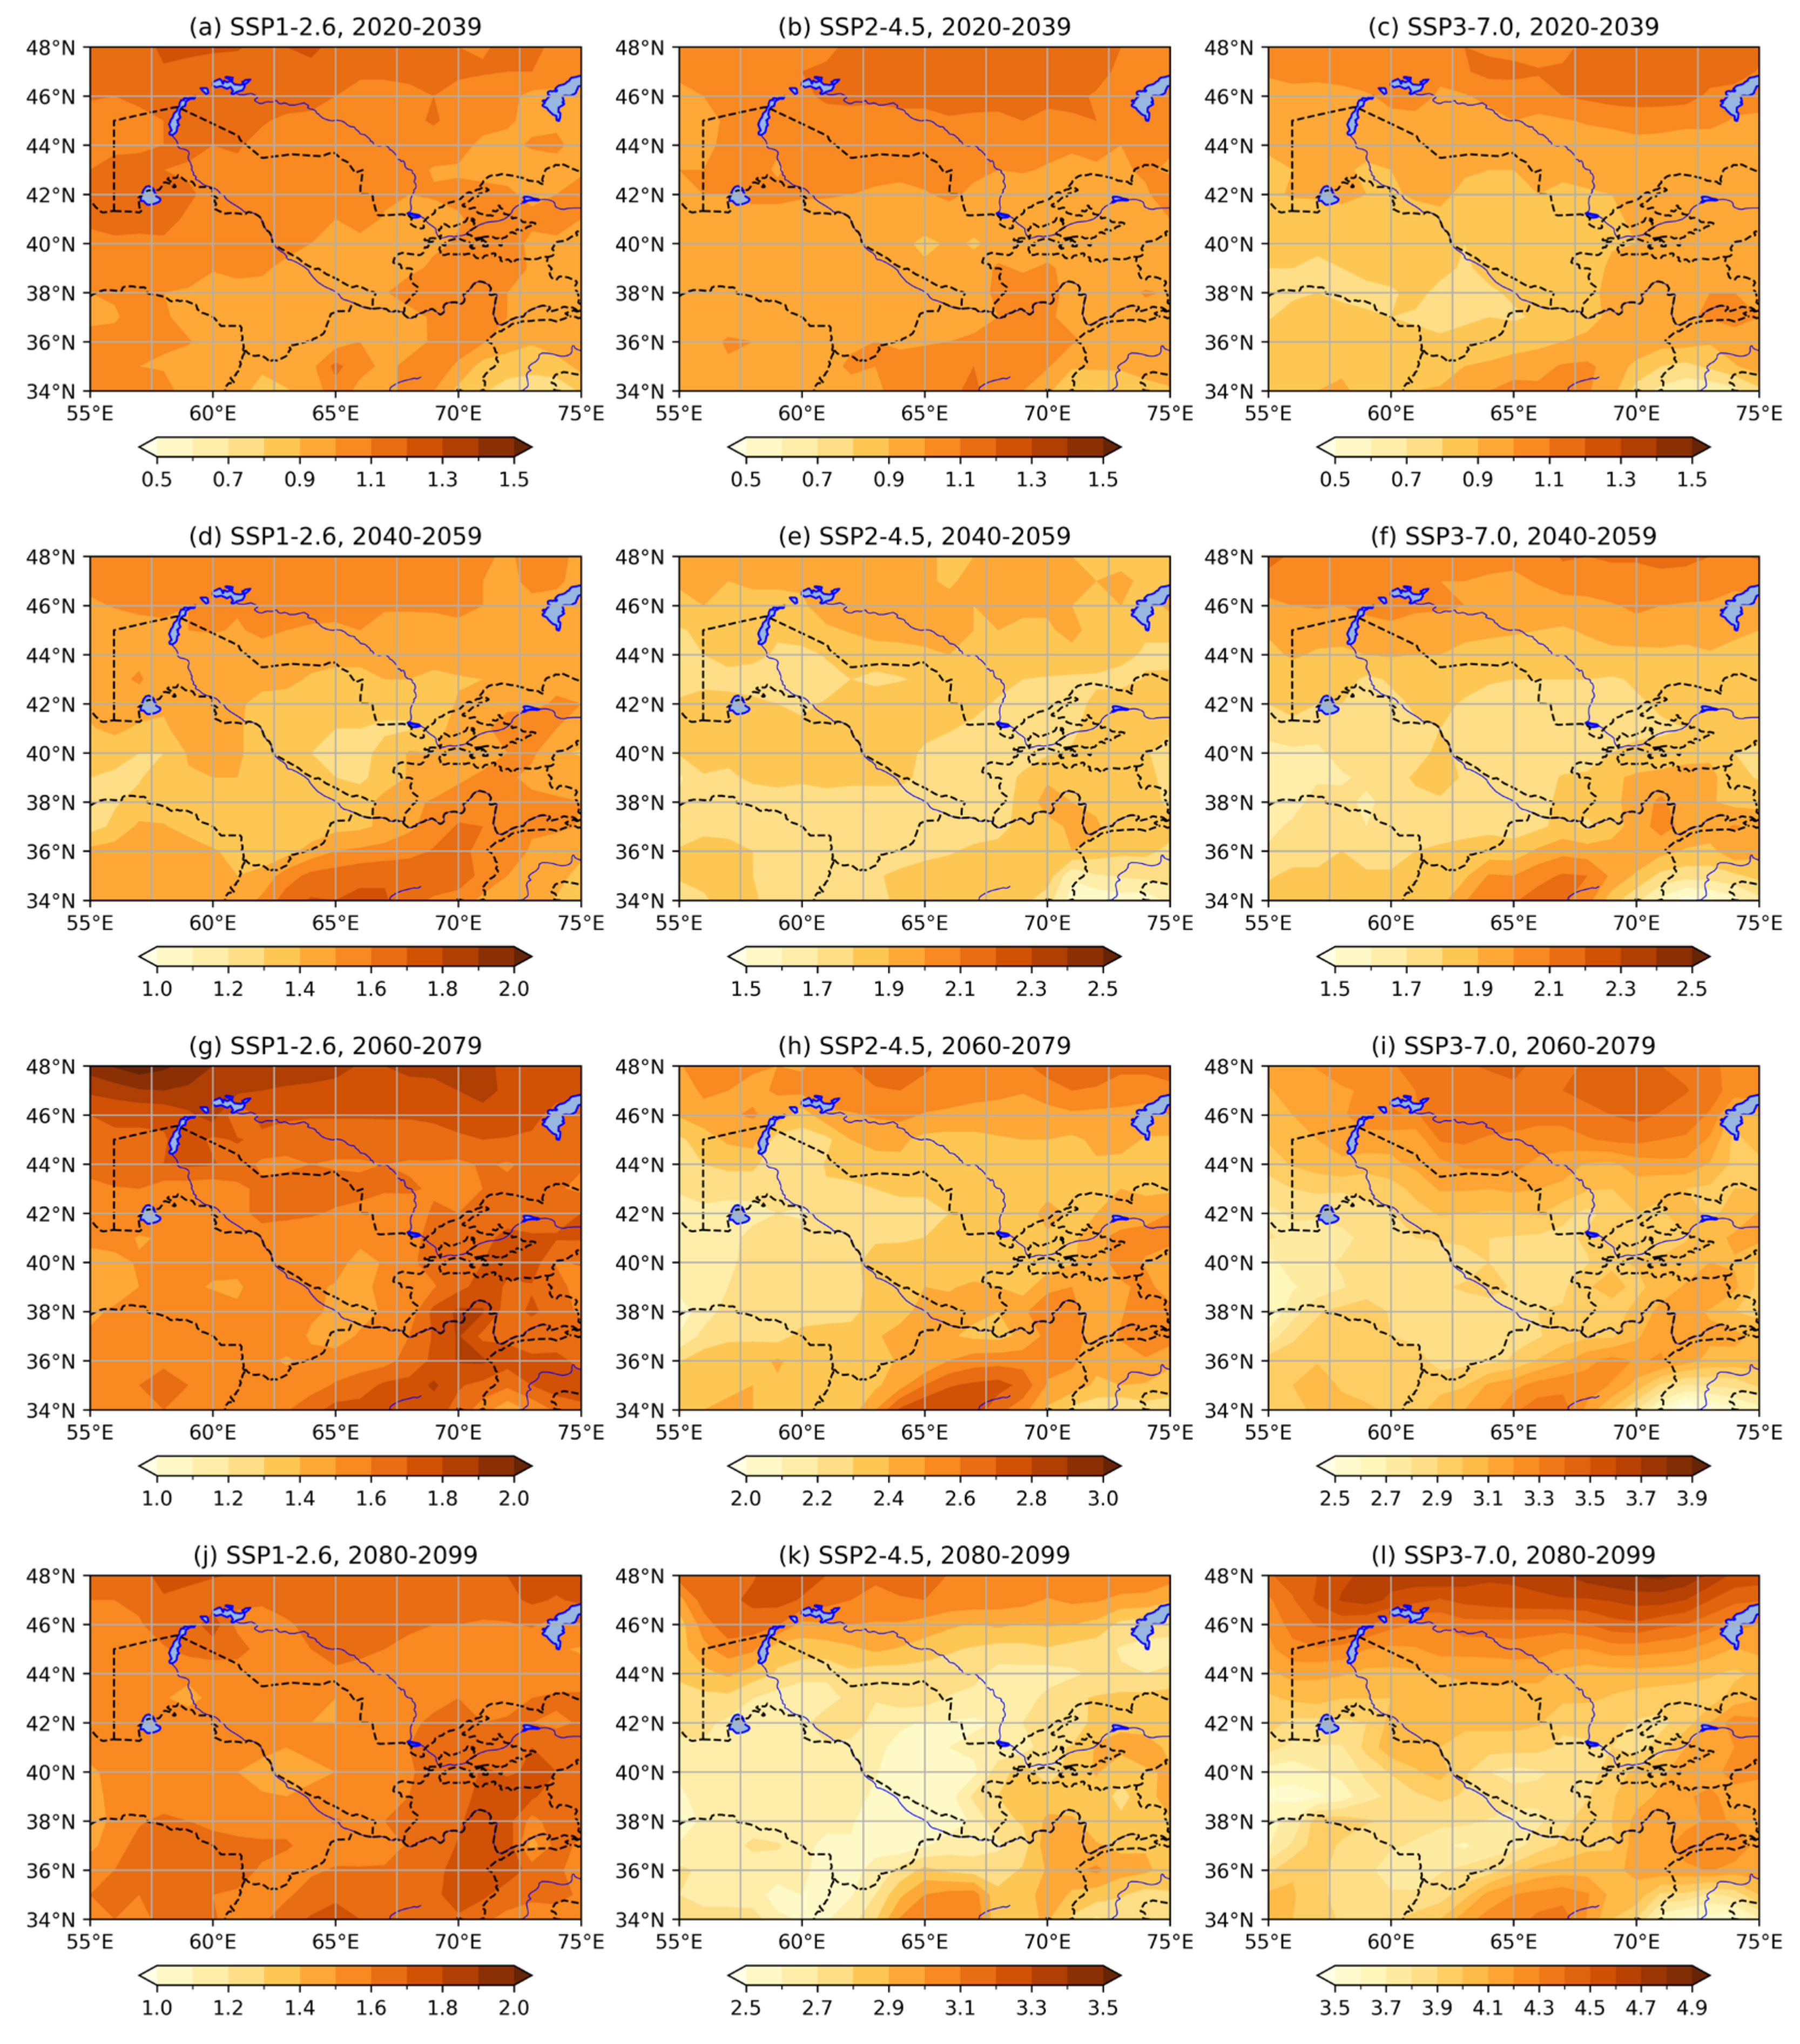
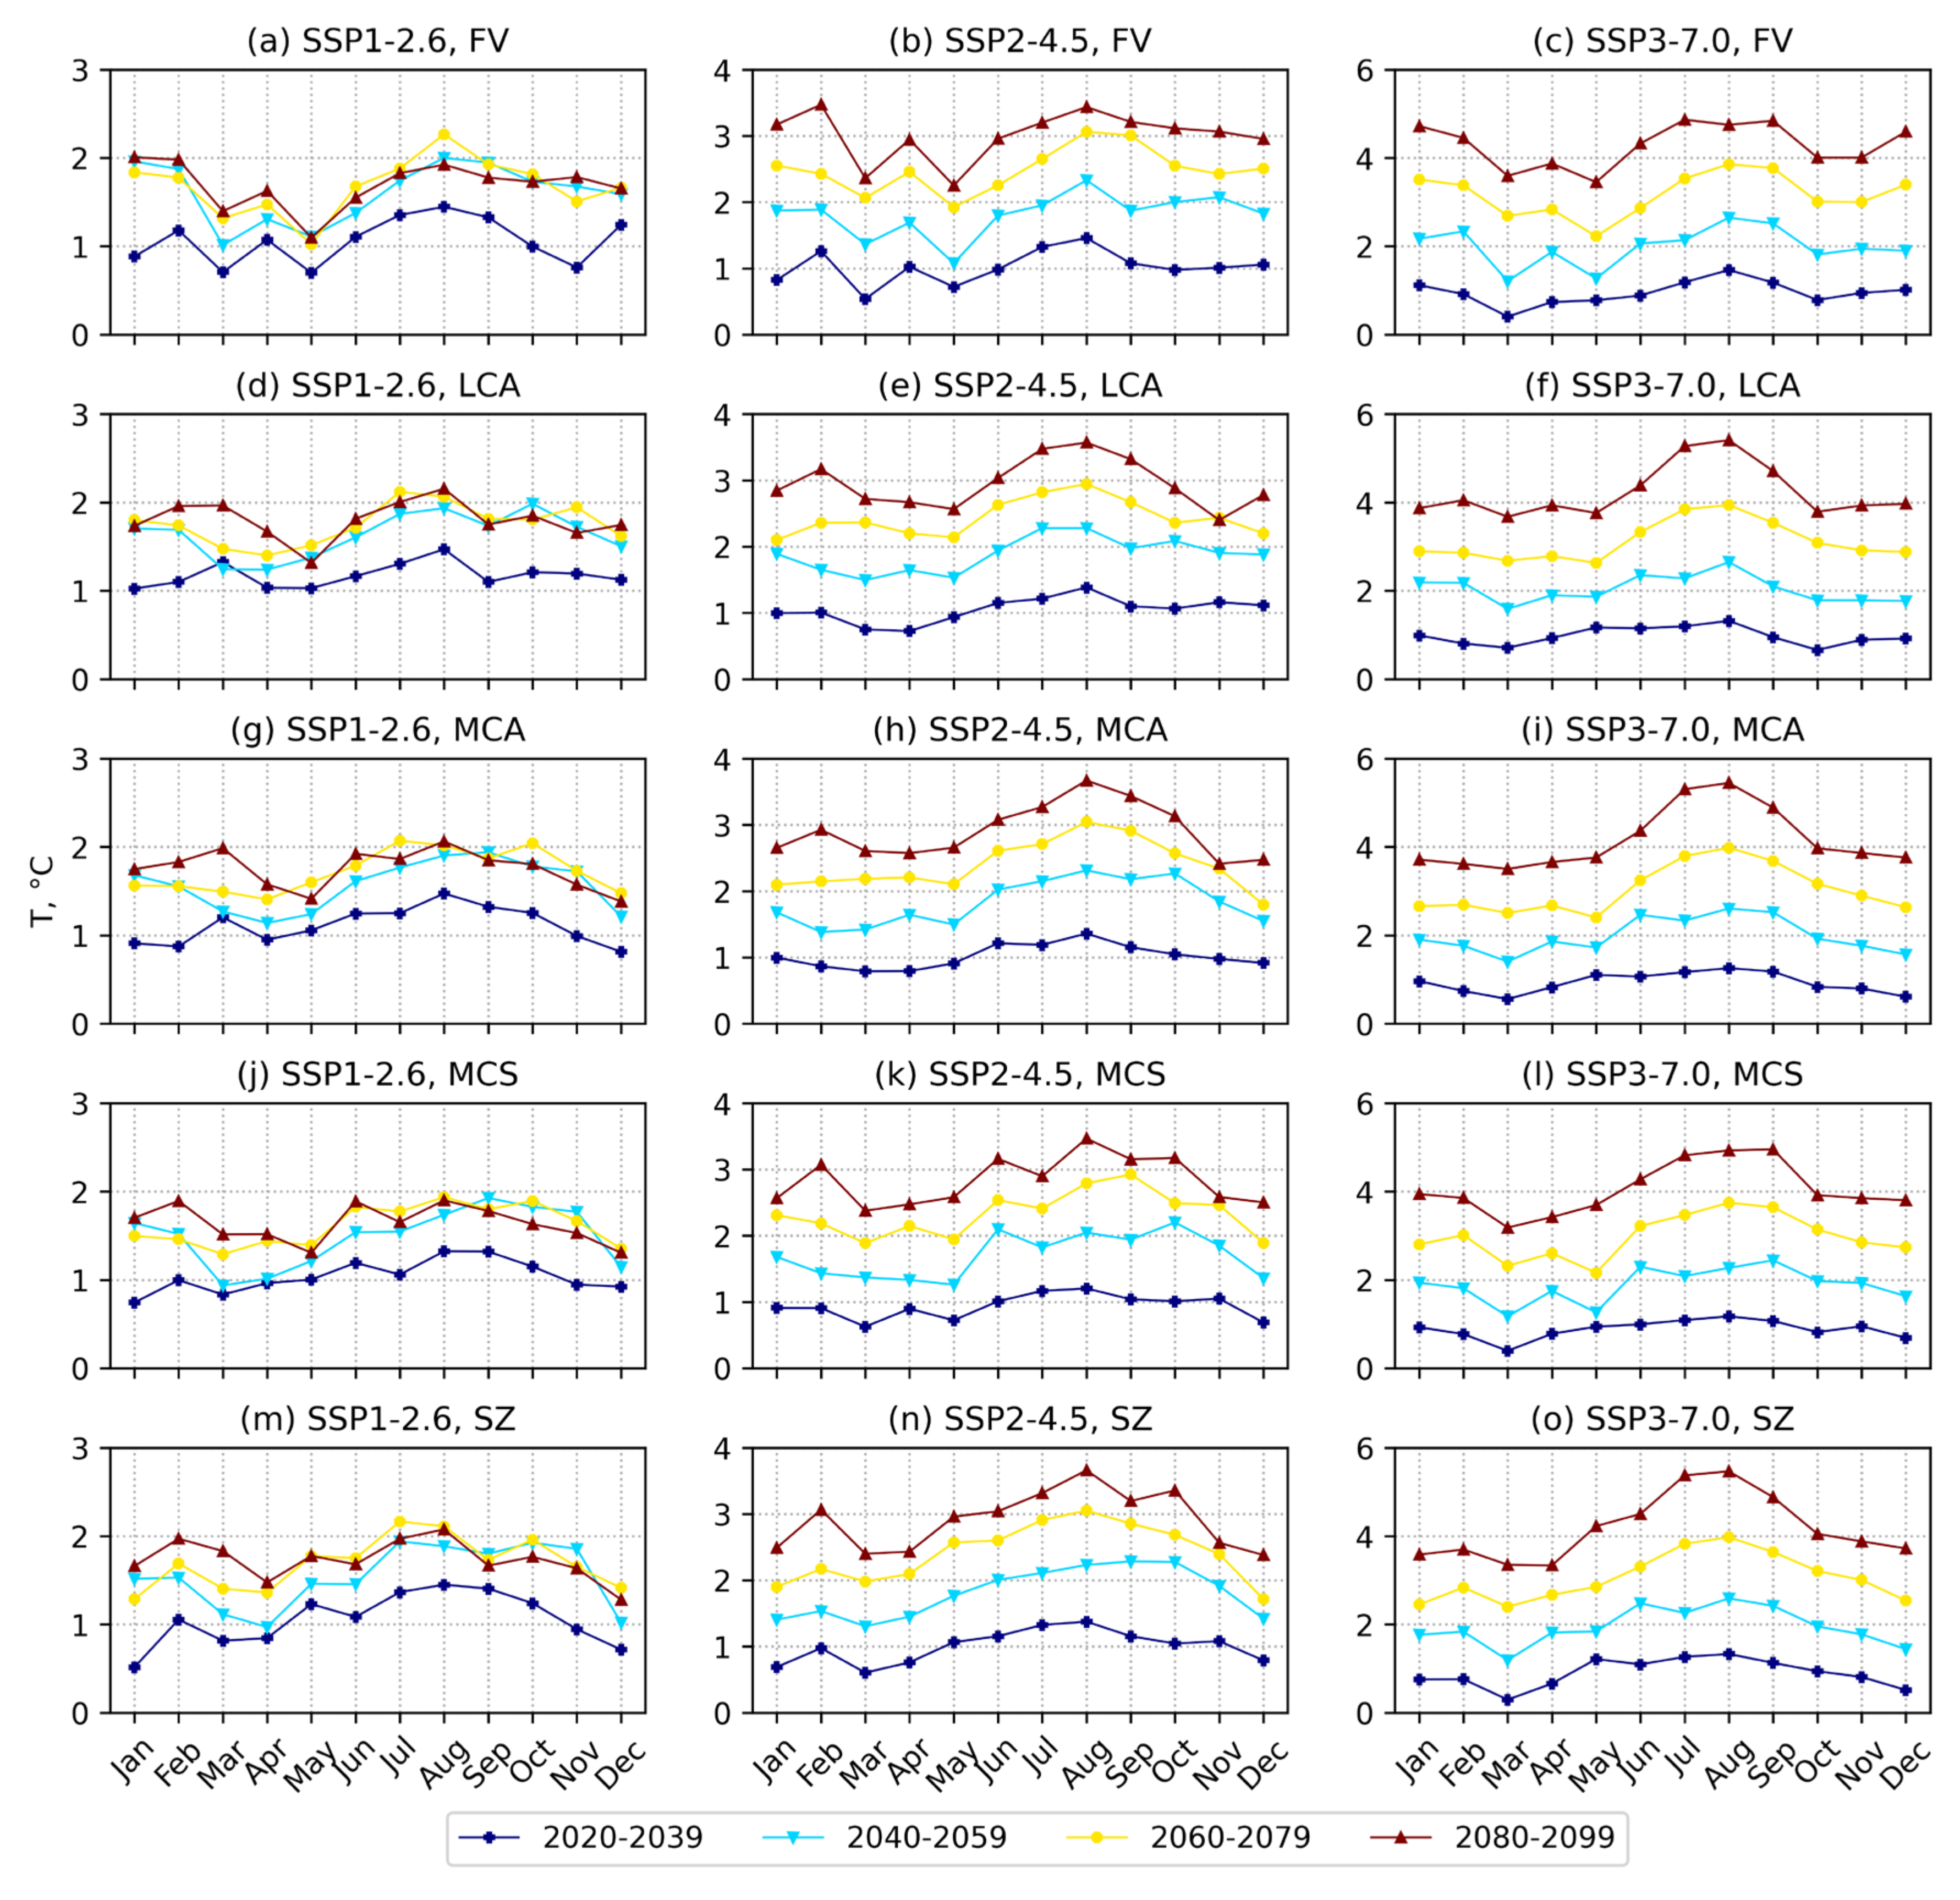
3.3. Spatial Variations of Projected Temperature and Precipitation

The RCPs were completed in time to be used in the IPCC Fifth Assessment Report [51] and replaced by the SSP scenarios, which are widely applied in the scientific community and are expected to be used in the future. Therefore, we will continue our analysis of temperature and precipitation based on SSPs only. It is unclear which SSP is more likely or unlikely, as it depends on policy choices, technological advances, and other factors that influence future developments. However, SSP1-1.9 and SSP5-8.5 are the most divergent scenarios in terms of the future trajectory of human activities and GHG emissions. SSP1 is considered a scenario of low population growth and rapid economic development, with strong policies to reduce GHG emissions, and is considered the most optimistic scenario for achieving the goals of the Paris Agreement. On the other hand, SSP5 is a scenario of high population growth and low economic development, with weak policy actions to reduce GHG emissions, and it is seen as the least optimistic scenario for achieving the goals of the Paris Agreement. Therefore, RCPSSP1-1.9 and SSP5-8.5 are not considered here as they are less likely.
Compared to the historical reference period (1995–2014), both precipitation and temperature in the SSP scenarios show a predominant increasing trend in the short, medium, and long term, which is particularly noticeable over time and in scenarios with higher emissions (see Figure 4 and Figure 5). In particular, the increase in precipitation is found mainly in mountainous areas. With respect to temperature, there is a consistent pattern of more pronounced increases across all scenarios in the LCA and SZ regions. Based on the assessments of all scenarios, the temperature in LCA is projected to increase by an average of 1 °C in the period 2020–2039. In the subsequent period of 2040–2059, the SSP2.6 and SSP4.5 scenarios project an average temperature increase of 1.5 °C, while SSP7.0 projects a temperature increases of nearly 2 °C. Despite the SSP scenario, the projections indicate a worsening situation by 2100. Of particular concern is the escalating temperatures outside of Uzbekistan in mountainous regions that are critical to the formation of river basins, which may negatively affect the state of perennial snow and glaciers in the region.

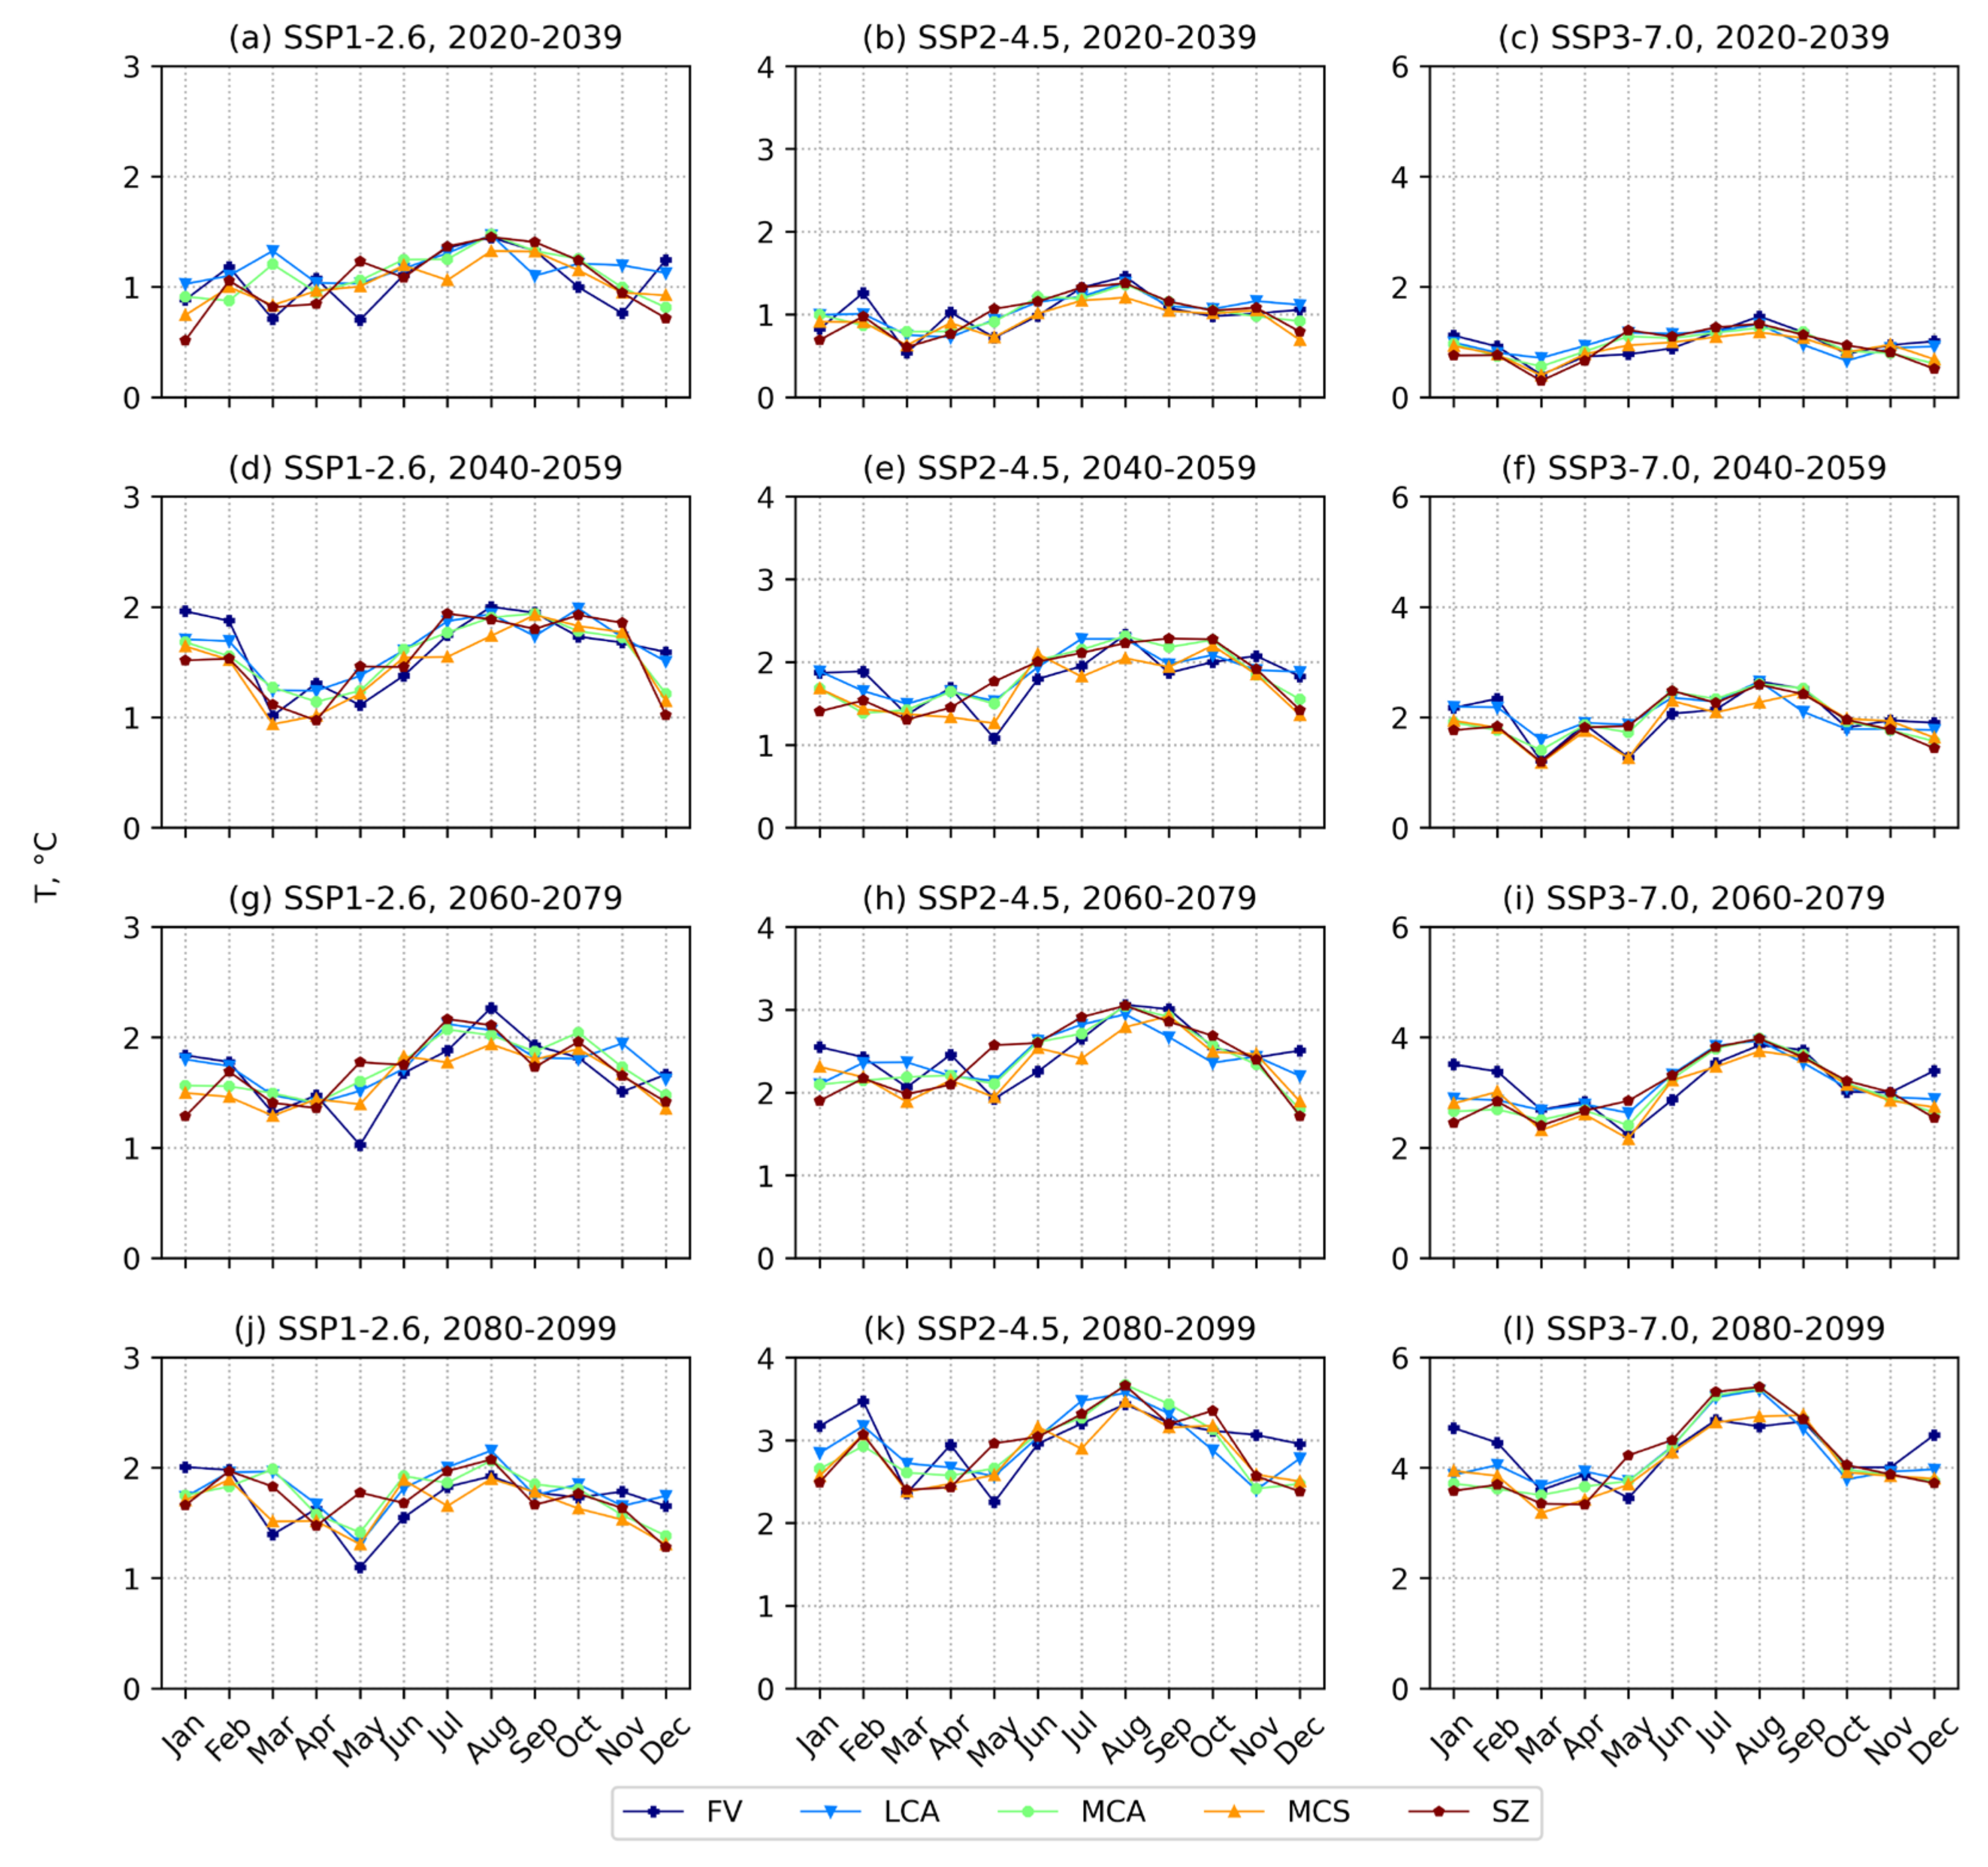
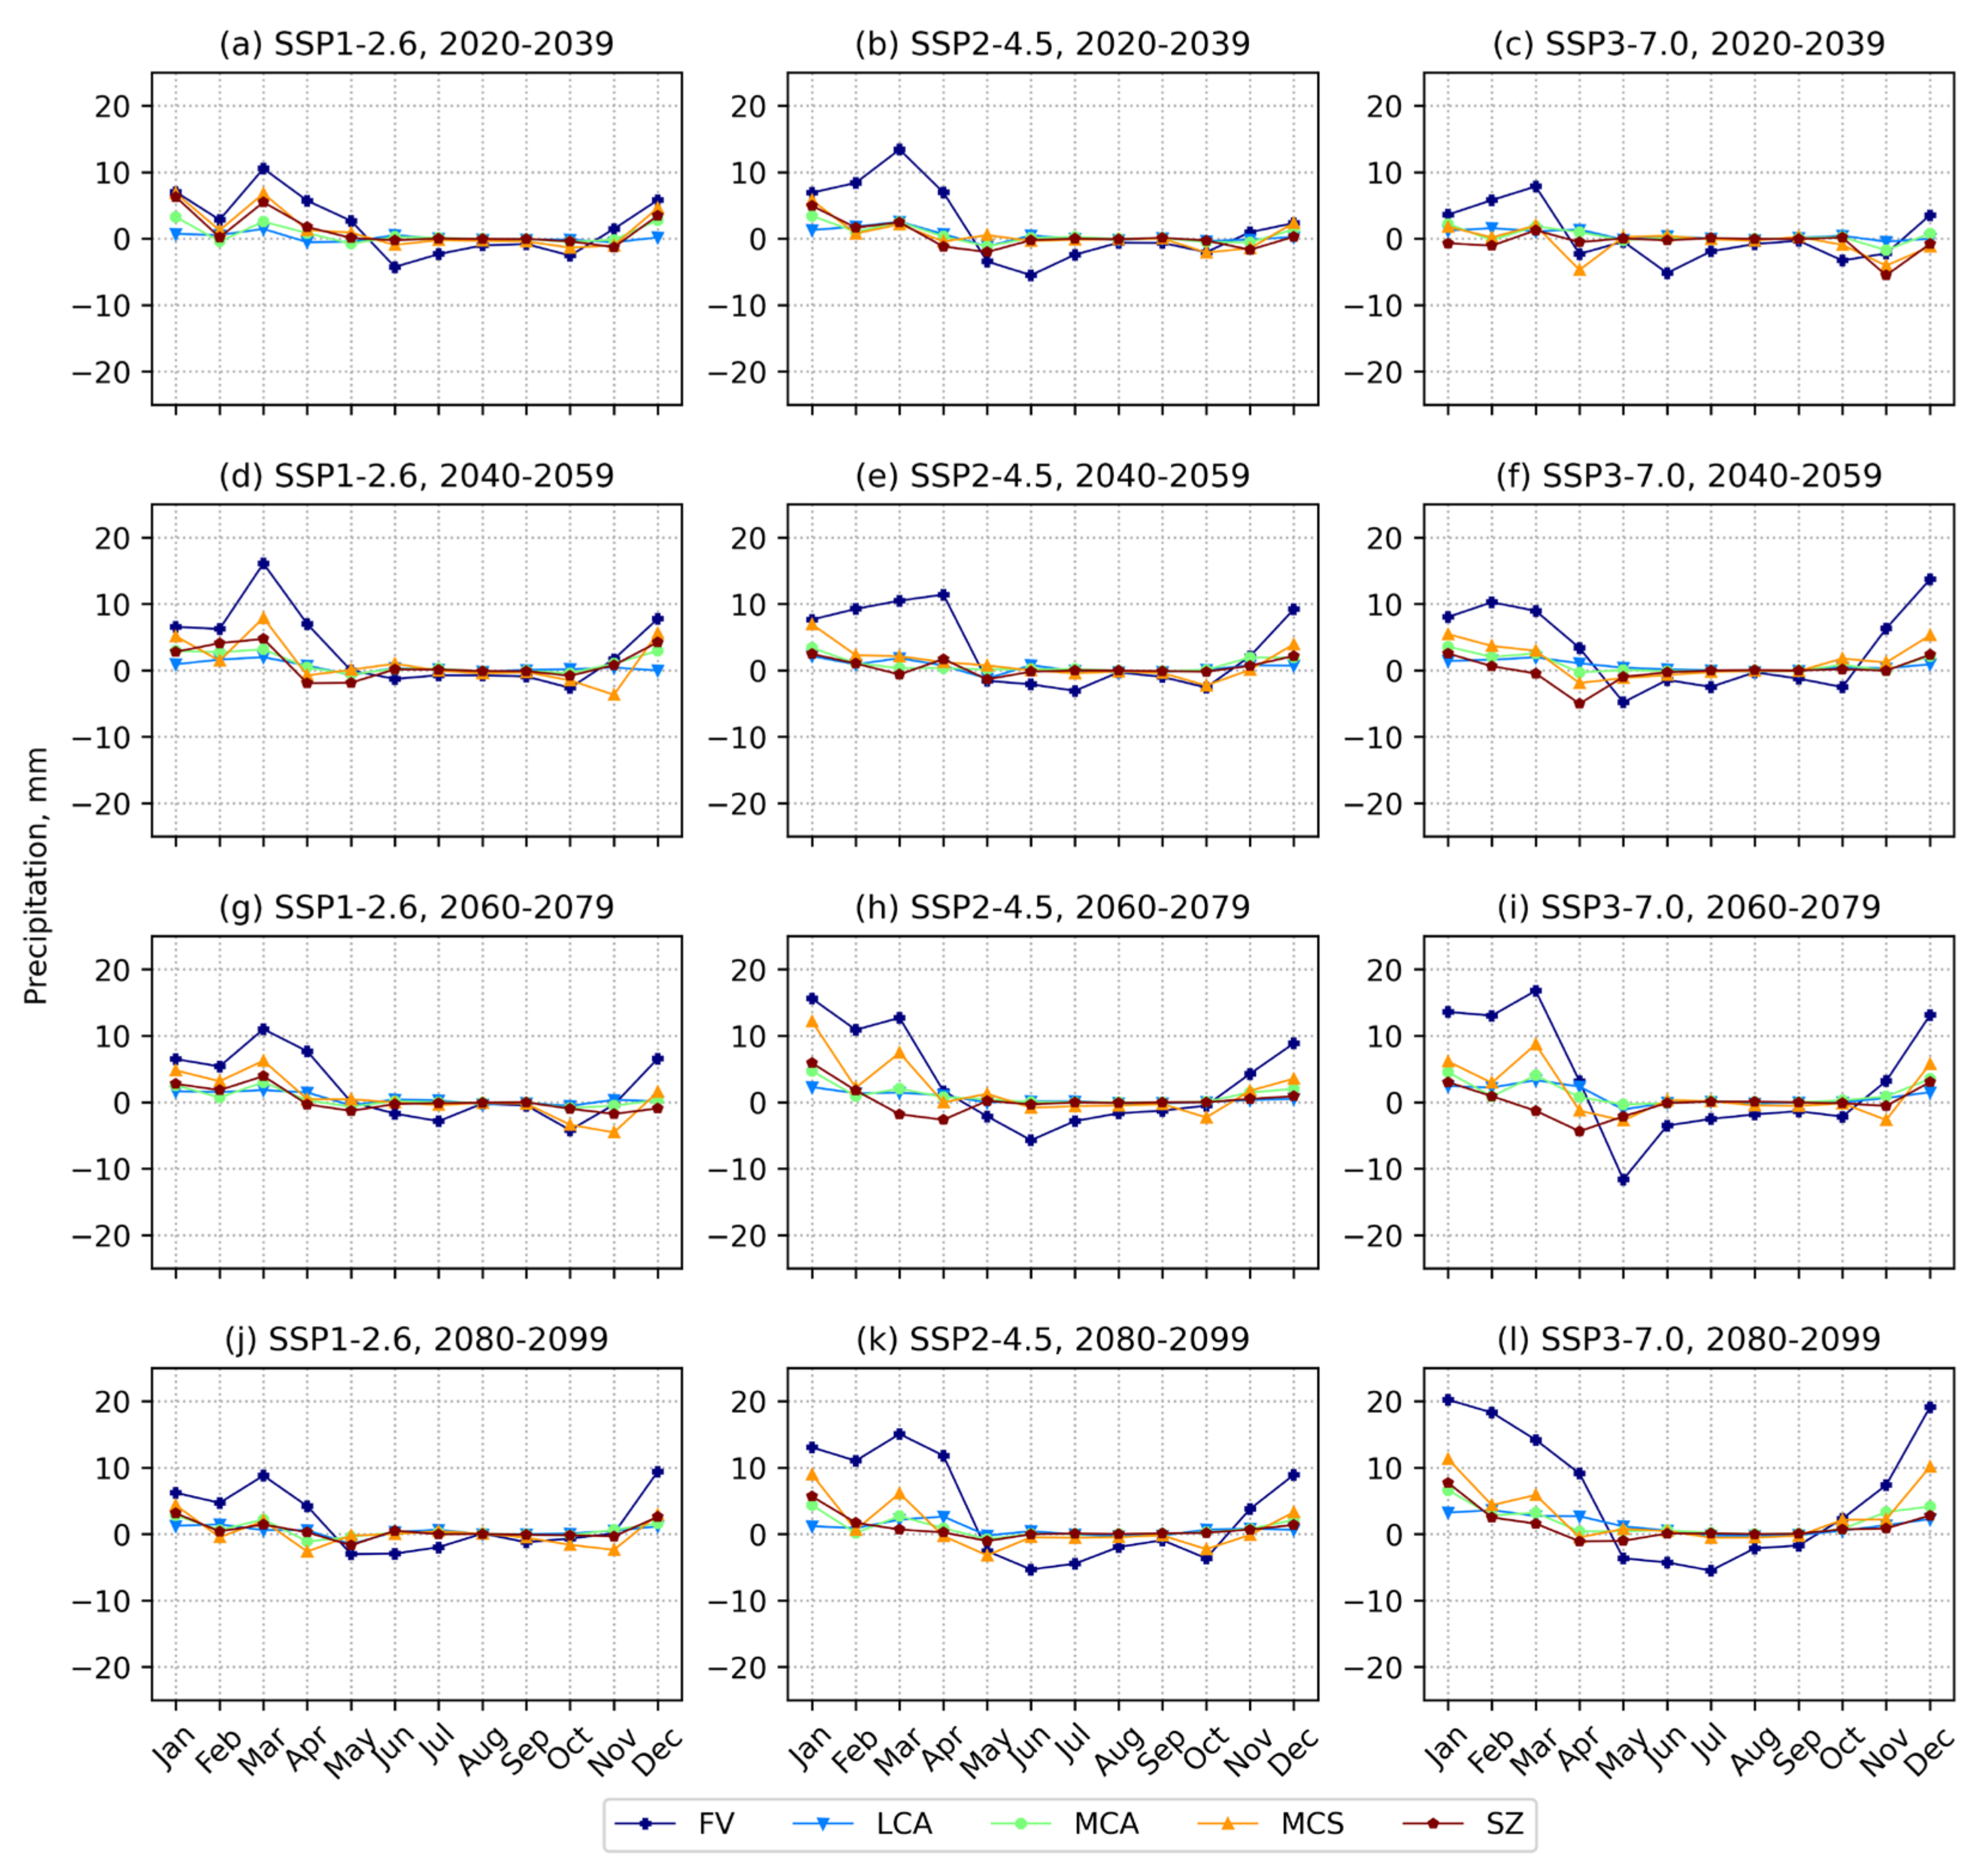
3.4. Seasonal Anomaly According to Climate Projection Simulations

Projections for Uzbekistan under different SSP scenarios show a consistent trend of increasing temperatures over all future periods (2020–2099), with more severe impacts under higher emission scenarios (Figure 6). By mid-century (2040–2059), temperature increases of up to 2–2.5 °C during summer months are expected under SSP1-2.6, SSP2-4.5, and SSP3-7.0, with stronger effects in winter and spring for SSP1-2.6 and notable temperature increases in summer for SSP2-4.5 and SSP3-7.0. In addition, there are regional differences, with mountainous areas showing a more significant temperature increase in winter and spring, while LCA, MCA, and SZ show a more significant temperature increase in summer. By 2080–2099, the scenarios show different temperature changes. SSP1-2.6 shows a steady increase of 2–3 °C in monthly mean temperatures throughout the year. SSP2-4.5 shows more pronounced increases, especially in summer (June–August), reaching up to 3–4 °C. SSP3-7.0, the high emissions scenario, predicts the most drastic warming of 4–6 °C in certain months, especially in summer.
Across all future periods (2020–2099), there is a general trend of increasing precipitation, particularly notable during the winter months (Figure 7). Under SSP1-2.6 and SSP2-4.5, the increase in precipitation is relatively modest, while SSP3-7.0 indicates more substantial changes, with some regions experiencing variations up to 10–20 mm. The figures reveal that mountainous regions are likely to experience more pronounced increases in precipitation compared to the lowland areas. Seasonal variations are evident, with the spring and autumn months showing smaller increases or even decreases in some scenarios.
The rates of temperature increase show different patterns over the periods (Figure 8). SSP1-2.6 reveals a notable acceleration in the first half of the century, particularly in summer, followed by a more gradual increase from 2040. As the century progresses, the winter and spring seasons experience more pronounced warming. In contrast, SSP2-4.5 shows a steady and uniform temperature increase over the specified periods, indicating a sustained upward trend throughout the century. SSP3-7.0 shows a more pronounced temperature increase, particularly during the summer months.
Regional changes in precipitation over the study periods identify relatively low variability, except for FD, where notable trends are projected (Figure 9). In SSP1-2.6, there is an increase in precipitation that occurs mainly in the winter and spring months, with a maximum in March. In SSP2-4.5, there is a significant increase in precipitation at the beginning of the year, from January to April. Conversely, SSP3-7.0 shows a distinct pattern with an increase in winter precipitation from December to February, followed by a decrease in March and April.

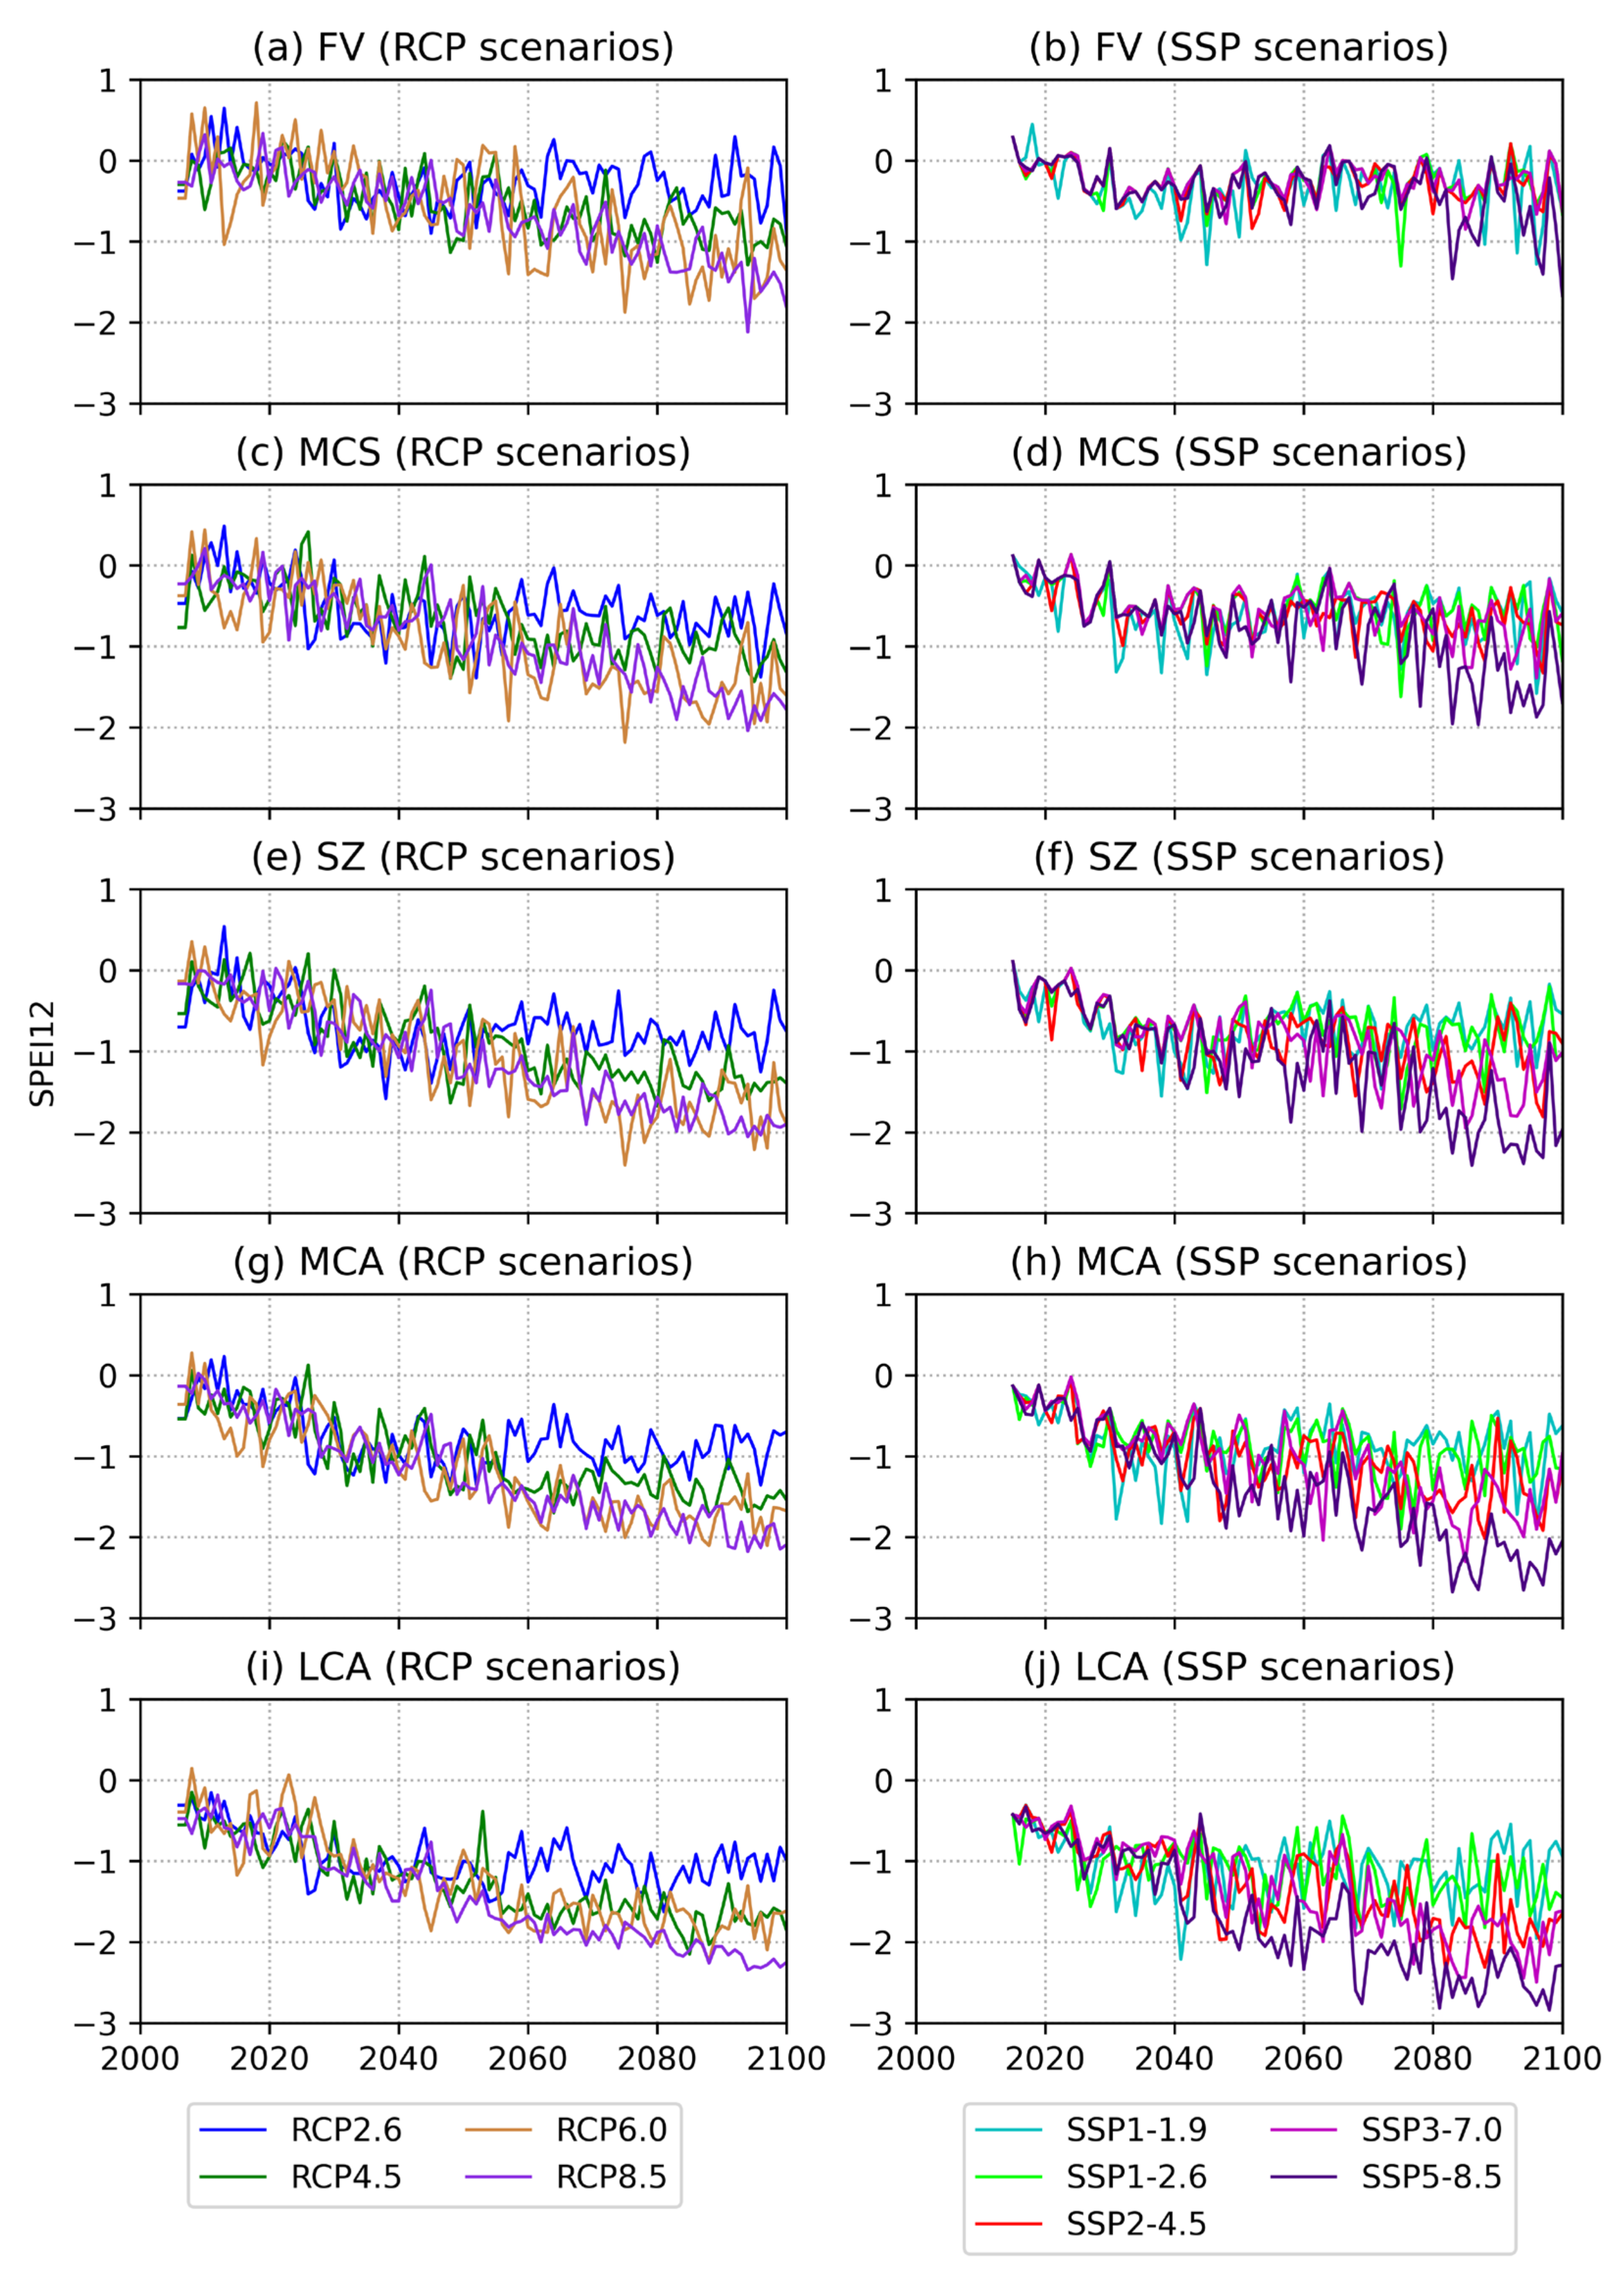
3.5. Projected Variations of the SPEI Index

The SPEI index serves as a valuable component in the assessment of impending drought trends [35]. The SPEI provides a thorough assessment, considering variations in temperature, precipitation, and potential evapotranspiration to identify essential characteristics of drought events, including their onset, end, duration, and intensity, among other parameters. The identification of drought events depends on three primary criteria: (1) a consistent SPEI value persistently below 0; (2) the occurrence of the lowest SPEI value within the designated time frame falling below −1; and (3) the cumulative duration reaching or exceeding three months [35,36].
In the short term, all scenarios indicate an increase in drought by 2060. In the long term (2060–2100), however, different trends emerge. Specifically, the RCP2.6 and SSP1-1.9 scenarios stabilize around −1.0; the RCP4.5, RCP6.0, SSP2-4.5, and SSP3-7.0 scenarios stabilize around −1.5; while the RCP8.5 and SSP5-8.5 scenarios reach values of −2 and even lower by 2100. Although the annual mean temperature and precipitation values are largely similar under the RCP and SSP scenarios, notable differences in the SPEI index occur between the western and eastern regions, as shown in Figure 10. This divergence can be attributed to the finer modeling of the temperature contrast due to the higher resolution of the model grids and a more accurate representation of the near-surface layer microphysics. Consequently, the foothills show a stabilization of about −0.5 for all SSP scenarios except the most extreme one (SSP5- 8.5). In addition, the FD region could potentially return to conditions like those of 2015–2020, mainly due to a significant increase in precipitation.

4. Discussion

Understanding the variability and intensity of droughts over long periods of time is critical for water resource management, agricultural planning, and mitigating the effects of climate change. SPEI is a widely used metric that combines precipitation and potential evapotranspiration to assess drought conditions. This index is particularly valuable because it captures the effects of temperature on drought severity, providing a comprehensive measure of moisture availability [36,67,68,69]. The SPEI has been successfully applied to a wide range of climatic conditions and time periods, demonstrating its robustness and reliability [69,70,71]. This extensive application in different scenarios ensures that the method is well validated and suitable for the specific requirements of this study, providing confidence in its results and conclusions.
The need for bias correction in GCM outputs is critical due to their inherent systematic biases and coarse spatial resolutions [8,11,60,61], which make them unsuitable for various applications without adjustments [72,73,74,75,76]. Methodological choices in bias correction can significantly influence the representation of temperature and precipitation, especially for extreme events, leading to variability in impact assessments related to hydrology and ecosystem dynamics. Mixed conclusions in studies assessing the importance of bias correction highlight the complexity of this process. For example, some studies suggest that the choice of bias correction methods does not significantly affect projection ranges [76]. In contrast, others warn that reliance on a single set of bias-corrected GCMs may lead to overconfidence in projections [74]. These discrepancies are often due to differences in the geographic focus of the studies, the meteorological or hydrological variables examined, and the specific GCMs and scenarios used. In this study, a region-specific approach to bias correction improves the accuracy and fidelity of climate state representations by adapting correction methods to the unique geographic and environmental factors that influence local climate data. However, some uncertainty may remain despite recent advances in GCM bias correction methods, which support the credibility of climate projections by effectively mitigating systematic biases and enhancing the reliability of future climate predictions. Therefore, continued improvements in bias correction techniques are crucial for refining climate models and ensuring thorough and robust assessments of climate impacts.
The collective results of several large-scale studies consistently confirm the presence of a robust warming trend, which is particularly evident over CA, and has significantly intensified in recent years [17,18,19,21,22,23,24,25]. Our seasonal analysis highlights winter, spring, and summer as experiencing the most pronounced shifts in temperature and precipitation. Notably, previous studies are consistent with our results, consistently identifying winter as the season experiencing the most rapid warming in the region [21,22,23,24,25]. The apparent emphasis on colder seasons, which experience enhanced warming trends in semi-arid areas, is noteworthy. Discrepancies in trend magnitudes may be due to differences in regional coverage, time periods, and data sources used. These methodological differences potentially affect findings not only within CA studies, but also in broader global studies.
While complex irrigation systems and water diversion between river basins may potentially mitigate future drought effects, this research primarily examines long-term climate change patterns in Uzbekistan and analyzes regional drought characteristics. Evaluating drought in this context is complex and requires a comprehensive regional approach rather than a narrow national focus. However, the primary objective of this article is to address broader climate change trends that are unique to Uzbekistan, rather than to provide a regional drought assessment.
Considering these discernible climate trends, it is imperative to recognize the expected significant impacts on Uzbekistan’s dryland water cycle. Foreseeable consequences include increased drought problems and an increase in the frequency of dust storms. These changes are expected to exacerbate the degradation of the region’s forest and grassland ecosystems, putting further pressure on local agricultural production. Given the interconnectedness of these challenges, it is critical to foster international cooperation and collaboration among the countries of the region. Addressing these myriad challenges will require the implementation of comprehensive climate change adaptation and disaster risk reduction strategies. Such proactive measures are essential to ensure the resilience and sustainability of Uzbekistan’s ecosystems and agriculture in the face of a dynamically changing climate. By adopting adaptation strategies and cooperating at the regional and international levels, Uzbekistan can work towards mitigating the adverse impacts of climate change and promoting a more sustainable future for its environment and agricultural sectors.

5. Conclusions

This study examined the impacts of climate change on Uzbekistan MMEs derived from CMIP5 and CMIP6 simulated under the RCP and SSP scenarios. The long-term climate datasets from the CRU and the ERA5 reanalysis tracking historical climate patterns and trends were used in the bias correction method applied to the MME outputs to improve their reliability and accuracy. The corrected models showed that the original values often over- or underestimated key climate variables, highlighting the importance of region-specific adjustments.
The scenarios ranged from optimistic trajectories with strong mitigation efforts (RCP-2.6, SSP1-1.9) to pessimistic trajectories with high emissions (RCP-8.5, SSP5-8.5). These projections consistently indicated increasing temperatures and precipitation across Uzbekistan, with more severe impacts under higher emission scenarios. The study highlighted regional differences, with the LCA and SZ regions experiencing more pronounced temperature increases.
By mid-century (2040–2059), temperature increases of up to 2–2.5 °C during the summer months are expected under SSP1-2.6, SSP2-4.5, and SSP3-7.0, with stronger effects during winter and spring for SSP1-2.6 and notable temperature increases in summer for SSP2-4.5 and SSP3-7.0. In addition, there are regional differences, with mountainous areas showing stronger temperature increases in winter and spring, while LCA, MCA and SZ show increases in summer. By 2080–2099, the scenarios show different temperature changes. SSP1-2.6 shows a steady increase of 2–3 °C in monthly mean temperatures throughout the year. SSP2-4.5 shows more pronounced increases, especially in summer (June–August), reaching up to 3–4 °C. SSP3-7.0, the high emissions scenario, predicts the most drastic warming of 4–6 °C in certain months, especially in summer.
Under SSP1-2.6 and SSP2-4.5, the increase in precipitation is relatively modest, while SSP3-7.0 indicates more substantial changes, with some regions experiencing variations of up to 10–20 mm. The figures show that mountainous regions are likely to experience more pronounced increases in precipitation than lowland areas. Seasonal variations are evident, with spring and fall months showing smaller increases or even decreases in some scenarios. Regional changes in precipitation over the study periods show relatively little variability, except for FD, where notable trends are found. In SSP1-2.6, there is an increase in precipitation that occurs mainly in the winter and spring months, with a maximum in March. In SSP2-4.5, there is a significant increase in precipitation at the beginning of the year, from January to April. Conversely, SSP3-7.0 shows a distinct pattern with an increase in winter precipitation from December to February, followed by a decrease in March and April.
Finally, the SPEI index proves indispensable for predicting future drought trends, providing a nuanced assessment of drought characteristics based on temperature, precipitation, and moisture factors. Our results show increasing aridity under all scenarios through 2060, with longer-term projections indicating stabilization around various SPEI values through 2100: RCP2.6 and SSP1-1.9 stabilize around −1.0; RCP4.5, RCP6.0, SSP2-4.5, and SSP3-7.0 stabilize around −1.5; while RCP8.5 and SSP5-8.5 scenarios project values of −2 or less by 2100. While annual mean temperature and precipitation values show little variation across RCP and SSP scenarios, notable differences in the SPEI index are between western and eastern regions. For example, the foothill regions show stabilization around −0.5 in all SSP scenarios except SSP5-8.5. In addition, the FD region could potentially return to conditions like 2015–2020, primarily due to a significant increase in precipitation.
This work underscores the critical need for climate adaptation strategies, particularly in the agricultural and water resource management sectors, to mitigate the impacts of rising temperatures and increased frequency of extreme heat events.

Author Contributions

Conceptualization, N.R.; Formal analysis, N.R.; Methodology, B.E.N.; Project administration, B.E.N., B.M.K. and D.A.B.; Resources, K.N.T., G.M.K., T.K. and A.N.U.; Software, V.R.; Supervision, B.E.N., K.N.T., G.M.K. and A.N.U.; Validation, N.R. and L.S.; Visualization, N.R., V.R. and D.A.B.; Writing—original draft, N.R., L.S. and B.E.N.; Writing—review and editing, N.R., L.S., V.R. and D.A.B. All authors have read and agreed to the published version of the manuscript.

Funding

This research was funded by Science and Technology Research Partnership for Sustainable Development (SATREPS) in collaboration between Japan Science and Technology Agency (JST, JPMJSA2001), Japan International Cooperation Agency (JICA) and Innovative Development Agency under Ministry of Higher Education, Science and Innovation of the Republic of Uzbekistan (project AL-5721122055 and IL-5721122065).

Institutional Review Board Statement

Not applicable.

Informed Consent Statement

Not applicable.

Data Availability Statement

The sources of the used data are mentioned in Section 2. Other generated data and tools are available upon request by any user. All data processing codes were developed using Python and can be made available upon request to the corresponding authors. To request the data from this study, please contact N.R. ([email protected]) or D.B.A. ([email protected]).

Acknowledgments

We thank the CRU, ERA5, and CMIP5/6 teams for producing the datasets used in this research.

Conflicts of Interest

The authors declare no conflicts of interest.

Appendix A

Table A1. A list of CMIP5 models selected for analysis and compilation of the ensemble.
#ModelName of the Development Center or InstituteGrid Resolution. The Number of Grid Cells by Latitude and Longitude
1BCC-CSM1-1BCC, CMA64 × 128
2BCC-CSM1-1-mBCC, CMA160 × 320
3BNU-ESMBNU64 × 128
4CanESM2CCCMA64 × 128
5CCSM4NCAR192 × 288
6CESM1-CAM5NCAR192 × 288
7CESM1-WACCMNCAR96 × 144
8CNRM-CM5CNRM128 × 256
9CSIRO-Mk3-6-0CSIRO96 × 192
10EC-EARTHEC-Earth-Consortium160 × 320
11FGOALS-g2CAS60 × 128
12FIO-ESMFIO-QLNM64 × 128
13GFDL-CM3NOAA-GFDL90 × 144
14GFDL-ESM2GNOAA-GFDL90 × 144
15GFDL-ESM2MNOAA-GFDL90 × 144
16GISS-E2-HNASA-GISS90 × 144
17GISS-E2-RNASA-GISS90 × 144
18HadGEM2-AOMOHC145 × 192
19HadGEM2-ESMOHC145 × 192
20INM-CM4INM180 × 120
21IPSL-CM5A-LRIPSL96 × 96
22IPSL-CM5A-MRIPSL143 × 144
23MIROC5JAMSTEC, AORI, NIES128 × 256
24MIROC5-ESMJAMSTEC, AORI, NIES64 × 128
25MIROC5-ESM-CHEMJAMSTEC, AORI, NIES64 × 128
26MPI-ESM-LRMPI-M96 × 192
27MPI-ESM-MRMPI-M96 × 192
28MRI-CGCM3MRI160 × 320
29NorESM1-MNCC96 × 144
30NorESM1-MENCC96 × 144
Table A2. A list of CMIP6 models selected for analysis and compilation of the ensemble.
#ModelName of the Development Center or InstituteGrid Resolution. The Number of Grid Cells by Latitude, Longitude, and Altitude (Top Level of the Vertical Grid)
1AWI-CM-1-1-MRAWI384 × 192 × 95 (80 km)
2BCC-CSM2-MRBCC320 × 160 × 46 (1.46 hPa)
3CAMS-CSM1-0CAMS320 × 160 × 31 (10 mb)
4CanESM5CCCMA128 × 64 × 49 (1 hPa)
5CESM2NCAR288 × 192 × 32 (2.25 mb)
6CESM2-WACCMNCAR288 × 192 × 70 (4.5×10⁻⁶ mb)
7CIESMTHU288 × 192 × 30 (2.255 hPa)
8CMCC-CM2-SR5CMCC288 × 192 × 30 (2 hPa)
9EC-Earth3EC-Earth-Consortium512 × 256 × 91 (0.01 hPa)
10EC-Earth3-VegEC-Earth-Consortium512 × 256 × 91 (0.01 hPa)
11FGOALS-f3-LCAS360 × 180 × 32 (2.16 hPa)
12FGOALS-g3CAS80 × 80 × 26 (2.19 hPa)
13FIO-ESM-2-0FIO-QLNM192 × 288 × 26 (2 hPa)
14GFDL-CM4NOAA-GFDL360 × 180 × 33 (1 hPa)
15GFDL-ESM4NOAA-GFDL360 × 180 × 49 (1 Pa)
16INM-CM4-8INM180 × 120 × 21 (0.01 σ)
17INM-CM5-0INM180 × 120 × 73 (0.0002 σ)
18IPSL-CM6A-LRIPSL144 × 143 × 79 (80 km)
19KACE-1-0-GNIMS-KMA92 × 144 × 85 (85 km)
20KIOST-ESMKIOST192 × 96 × 32 (2 hPa)
21MIROC6MIROC256 × 128 × 81 (0.004 hPa)
22MPI-ESM1-2-HRMPI-M, DWD, DKRZ384 × 192 × 95 (0.01 hPa)
23MPI-ESM1-2-LRMPI-M, AWI192 × 96 × 47 (0.01 hPa)
24MRI-ESM2-0MRI192 × 96 × 80 (0.01 hPa)
25NESM3NUIST192 × 96 × 47 (1 Pa)
26NorESM2-LMNCC144 × 96 × 32 (3 mb)
27NorESM2-MMNCC288 × 192 × 32 (3 mb)
The following designations are used here:
  • AORI (Atmosphere and Ocean Research Institute, Japan);
  • AWI (Alfred Wegener Institute, Germany);
  • BCC (Beijing Climate Center, China);
  • BNU (Beijing Normal University, China);
  • CAMS (Chinese Academy of Meteorological Sciences, China)
  • CAS (Chinese Academy of Sciences, China);
  • CCCMA (Canadian Centre for Climate Modelling and Analysis, Canada);
  • CMCC (Centro Euro-Mediterraneo per I Cambiamenti Climatici);
  • CMA (China Meteorological Administration, China);
  • CSIRO (Commonwealth Scientific and Industrial Research Organization, Australia);
  • DWD (German Meteorological Service, Germany);
  • DKRZ (German Climate Computing Center, Germany);
  • EC-Earth-Consortium (EU);
  • FIO-QLNM (First Institute of Oceanography (FIO) and Qingdao National Laboratory for Marine Science and Technology (QNLM), China);
  • INM (Institute of Numerical Mathematics, Russia);
  • IPSL (Institut Pierre-Simon Laplace, France);
  • JAMSTEC (Japan Agency for Marine-Earth Science and Technology);
  • KIOST (Korean Institute of Ocean Science and Technology, Korea);
  • MOHC (Met Office Hadley Center, UK);
  • MPI-M (Max Planck Institute for Meteorology, Germany);
  • MRI (Meteorological Research Institute, Japan);
  • NASA-GISS (NASA Goddard Institute for Space Studies, USA);
  • NCAR (National Center for Atmospheric Research, USA);
  • NCC (Norwegian Climate Centre, Norway);
  • NERC (Natural Environmental Research Council);
  • NIES (National Institute for Environmental Studies);
  • NIMS-KMA (National Institute of Meteorological Sciences/Korea Met. Administration, Korea);
  • NOAA-GFDL (National Oceanic and Atmospheric Administration, Geophysical Fluid Dynamics Laboratory, USA);
  • NUIST (Nanjing University of Information Science and Technology, China);
  • THU (Tsinghua University–Department of Earth System Science, China).

References

  1. Cao, L.; Xu, C.; Suo, N.; Song, L.; Lei, X. Future Dry-Wet Climatic Characteristics and Drought Trends over Arid Central Asia. Front. Earth Sci. Chin. 2023, 11, 1102633. [Google Scholar] [CrossRef]
  2. Rakovec, O.; Samaniego, L.; Hari, V.; Markonis, Y.; Moravec, V.; Thober, S.; Hanel, M.; Kumar, R. The 2018–2020 Multi-year Drought Sets a New Benchmark in Europe. Earths Future 2022, 10, e2021EF002394. [Google Scholar] [CrossRef]
  3. Wu, G.; Chen, J.; Shi, X.; Kim, J.-S.; Xia, J.; Zhang, L. Impacts of Global Climate Warming on Meteorological and Hydrological Droughts and Their Propagations. Earths Future 2022, 10, e2021EF002542. [Google Scholar] [CrossRef]
  4. Pörtner, H.O.; Roberts, D.C.; Poloczanska, E.S.; Mintenbeck, K.; Tignor, M.; Alegría, A.; Craig, M.; Langsdorf, S.; Löschke, S.; Möller, V.; et al. IPCC, 2022: Summary for Policymakers. In Climate Change 2022: Impacts, Adaptation, and Vulnerability: Contribution of Working Group II to the Sixth Assessment Report of the Intergovernmental Panel on Climate Change; Pörtner, H.O., Roberts, D.C., Poloczanska, E.S., Mintenbeck, K., Craig, M., Langsdorf, S., Löschke, S., Möller, V., Okem, A., Rama, B., Eds.; Cambridge University Pres: Cambridge, UK; New York, NY, USA, 2022; pp. 3–33. ISBN 9789291691593. [Google Scholar]
  5. Pendergrass, A.G.; Knutti, R. The Uneven Nature of Daily Precipitation and Its Change. Geophys. Res. Lett. 2018, 45, 11980–11988. [Google Scholar] [CrossRef]
  6. Wang, T.; Tu, X.; Singh, V.P.; Chen, X.; Lin, K. Global Data Assessment and Analysis of Drought Characteristics Based on CMIP6. J. Hydrol. 2021, 596, 126091. [Google Scholar] [CrossRef]
  7. Eyring, V.; Bony, S.; Meehl, G.A.; Senior, C.A.; Stevens, B.; Stouffer, R.J.; Taylor, K.E. Overview of the Coupled Model Intercomparison Project Phase 6 (CMIP6) Experimental Design and Organization. Geosci. Model Dev. 2016, 9, 1937–1958. [Google Scholar] [CrossRef]
  8. Taylor, K.E.; Stouffer, R.J.; Meehl, G.A. An Overview of CMIP5 and the Experiment Design. Bull. Am. Meteorol. Soc. 2012, 93, 485–498. [Google Scholar] [CrossRef]
  9. O’Neill, B.C.; Kriegler, E.; Ebi, K.L.; Kemp-Benedict, E.; Riahi, K.; Rothman, D.S.; van Ruijven, B.J.; van Vuuren, D.P.; Birkmann, J.; Kok, K.; et al. The Roads Ahead: Narratives for Shared Socioeconomic Pathways Describing World Futures in the 21st Century. Glob. Environ. Change 2017, 42, 169–180. [Google Scholar] [CrossRef]
  10. O’Neill, B.C.; Tebaldi, C.; van Vuuren, D.; Eyring, V.; Friedlingstein, P.; Hurtt, G.; Knutti, R.; Kriegler, E.; Lamarque, J.-F.; Lowe, J.; et al. The Scenario Model Intercomparison Project (ScenarioMIP) for CMIP6. Geosci. Model Dev. Discuss. 2016, 9, 3461–3482. [Google Scholar] [CrossRef]
  11. Tebaldi, C.; Debeire, K.; Eyring, V.; Fischer, E.; Fyfe, J.; Friedlingstein, P.; Knutti, R.; Lowe, J.; O’Neill, B.; Sanderson, B.; et al. Climate Model Projections from the Scenario Model Intercomparison Project (ScenarioMIP) of CMIP6. Earth Syst. Dyn. 2021, 12, 253–293. [Google Scholar] [CrossRef]
  12. Liu, F.; Xu, C.; Long, Y.; Yin, G.; Wang, H. Assessment of CMIP6 Model Performance for Air Temperature in the Arid Region of Northwest China and Subregions. Atmosphere 2022, 13, 454. [Google Scholar] [CrossRef]
  13. Riahi, K.; van Vuuren, D.P.; Kriegler, E.; Edmonds, J.; O’Neill, B.C.; Fujimori, S.; Bauer, N.; Calvin, K.; Dellink, R.; Fricko, O.; et al. The Shared Socioeconomic Pathways and Their Energy, Land Use, and Greenhouse Gas Emissions Implications: An Overview. Glob. Environ. Change 2017, 42, 153–168. [Google Scholar] [CrossRef]
  14. Hu, X.-M.; Ma, J.-R.; Ying, J.; Cai, M.; Kong, Y.-Q. Inferring Future Warming in the Arctic from the Observed Global Warming Trend and CMIP6 Simulations. Adv. Clim. Change Res. 2021, 12, 499–507. [Google Scholar] [CrossRef]
  15. Jaiswal, R.; Mall, R.K.; Singh, N.; Lakshmi Kumar, T.V.; Niyogi, D. Evaluation of Bias Correction Methods for Regional Climate Models: Downscaled Rainfall Analysis over Diverse Agroclimatic Zones of India. Earth Space Sci. 2022, 9, e2021EA001981. [Google Scholar] [CrossRef]
  16. Lioubimtseva, E.; Henebry, G.M. Climate and Environmental Change in Arid Central Asia: Impacts, Vulnerability, and Adaptations. J. Arid Environ. 2009, 73, 963–977. [Google Scholar] [CrossRef]
  17. Zhang, M.; Chen, Y.; Shen, Y.; Li, B. Tracking Climate Change in Central Asia through Temperature and Precipitation Extremes. J. Geogr. Sci. 2019, 29, 3–28. [Google Scholar] [CrossRef]
  18. Li, Y.; Chen, Y.; Li, Z. Dry/Wet Pattern Changes in Global Dryland Areas over the Past Six Decades. Glob. Planet. Change 2019, 178, 184–192. [Google Scholar] [CrossRef]
  19. Miao, L.; Li, S.; Zhang, F.; Chen, T.; Shan, Y.; Zhang, Y. Future Drought in the Dry Lands of Asia under the 1.5 and 2.0 °C Warming Scenarios. Earths Future 2020, 8, e2019EF001337. [Google Scholar] [CrossRef]
  20. Wang, J.; Chen, F.; Jin, L.; Bai, H. Characteristics of the Dry/Wet Trend over Arid Central Asia over the Past 100 Years. Clim. Res. 2010, 41, 51–59. [Google Scholar] [CrossRef]
  21. Li, H.; Li, Z.; Chen, Y.; Liu, Y.; Hu, Y.; Sun, F.; Kayumba, P.M. Projected Meteorological Drought over Asian Drylands under Different CMIP6 Scenarios. Remote Sens. 2021, 13, 4409. [Google Scholar] [CrossRef]
  22. Luo, M.; Liu, T.; Meng, F.; Duan, Y.; Bao, A.; Frankl, A.; De Maeyer, P. Spatiotemporal Characteristics of Future Changes in Precipitation and Temperature in Central Asia. Int. J. Climatol. 2019, 39, 1571–1588. [Google Scholar] [CrossRef]
  23. Yao, L.; Zhou, H.; Yan, Y.; Li, L.; Su, Y. Projection of Hydrothermal Condition in Central Asia under Four SSP-RCP Scenarios. J. Arid Land 2022, 14, 521–536. [Google Scholar] [CrossRef]
  24. Ta, Z.; Li, K.; Yu, Y.; Yang, M. Projections of Future Drought by CMIP5 Multimodel Ensembles in Central Asia. Atmosphere 2022, 13, 232. [Google Scholar] [CrossRef]
  25. Hua, L.; Zhao, T.; Zhong, L. Future Changes in Drought over Central Asia under CMIP6 Forcing Scenarios. J. Hydrol. Reg. Stud. 2022, 43, 101191. [Google Scholar] [CrossRef]
  26. Dai, A. Characteristics and Trends in Various Forms of the Palmer Drought Severity Index during 1900–2008. J. Geophys. Res. 2011, 116, D12115. [Google Scholar] [CrossRef]
  27. Li, H.; Li, Z.; Chen, Y.; Xiang, Y.; Liu, Y.; Kayumba, P.M.; Li, X. Drylands Face Potential Threat of Robust Drought in the CMIP6 SSPs Scenarios. Environ. Res. Lett. 2021, 16, 114004. [Google Scholar] [CrossRef]
  28. Jiang, J.; Zhou, T.; Chen, X.; Zhang, L. Future Changes in Precipitation over Central Asia Based on CMIP6 Projections. Environ. Res. Lett. 2020, 15, 054009. [Google Scholar] [CrossRef]
  29. Hu, Z.; Zhang, C.; Hu, Q.; Tian, H. Temperature Changes in Central Asia from 1979 to 2011 Based on Multiple Datasets. J. Clim. 2014, 27, 1143–1167. [Google Scholar] [CrossRef]
  30. Zhang, Q.; Han, L.; Jia, J.; Song, L.; Wang, J. Management of Drought Risk under Global Warming. Theor. Appl. Climatol. 2016, 125, 187–196. [Google Scholar] [CrossRef]
  31. Hu, Q.; Han, Z. Northward Expansion of Desert Climate in Central Asia in Recent Decades. Geophys. Res. Lett. 2022, 49, e2022GL098895. [Google Scholar] [CrossRef]
  32. Sheffield, J.; Wood, E.F.; Roderick, M.L. Little Change in Global Drought over the Past 60 Years. Nature 2012, 491, 435–438. [Google Scholar] [CrossRef]
  33. Orlovsky, N.S.; Orlovsky, L.; Indoitu, R. Severe Dust Storms in Central Asia. Arid Ecosyst. 2013, 3, 227–234. [Google Scholar] [CrossRef]
  34. Vicente-Serrano, S.M.; Beguería, S.; López-Moreno, J.I. A Multiscalar Drought Index Sensitive to Global Warming: The Standardized Precipitation Evapotranspiration Index. J. Clim. 2010, 23, 1696–1718. [Google Scholar] [CrossRef]
  35. Beguería, S.; Vicente-Serrano, S.M.; Reig, F.; Latorre, B. Standardized Precipitation Evapotranspiration Index (SPEI) Revisited: Parameter Fitting, Evapotranspiration Models, Tools, Datasets and Drought Monitoring. Int. J. Climatol. 2014, 34, 3001–3023. [Google Scholar] [CrossRef]
  36. Guo, H.; Bao, A.; Liu, T.; Jiapaer, G.; Ndayisaba, F.; Jiang, L.; Kurban, A.; De Maeyer, P. Spatial and Temporal Characteristics of Droughts in Central Asia during 1966–2015. Sci. Total Environ. 2018, 624, 1523–1538. [Google Scholar] [CrossRef]
  37. Lioubimtseva, E.; Cole, R.; Adams, J.M.; Kapustin, G. Impacts of Climate and Land-Cover Changes in Arid Lands of Central Asia. J. Arid Environ. 2005, 62, 285–308. [Google Scholar] [CrossRef]
  38. Rakhmatova, N.; Arushanov, M.; Shardakova, L. Evaluation of the Perspective of ERA-Interim and ERA5 Reanalyses for Calculation of Drought Indicators for Uzbekistan. Atmosphere 2021, 12, 527. [Google Scholar] [CrossRef]
  39. Christensen, J.H.; Kanikicharla, K.K.; Aldrian, E.; An, S.I.; Cavalcanti, I.F.A.; de Castro, M.; Dong, W.; Goswami, P.; Hall, A.; Kanyanga, J.K.; et al. Climate Phenomena and Their Relevance for Future Regional Climate Change. In Climate Change 2013 the Physical Science Basis: Working Group I Contribution to the Fifth Assessment Report of the Intergovernmental Panel on Climate Change; Cambridge University Press: Cambridge, UK, 2013; pp. 1217–1308. [Google Scholar]
  40. Zhang, X.-X.; Claiborn, C.; Lei, J.-Q.; Vaughan, J.; Wu, S.-X.; Li, S.-Y.; Liu, L.-Y.; Wang, Z.-F.; Wang, Y.-D.; Huang, S.-Y.; et al. Aeolian Dust in Central Asia: Spatial Distribution and Temporal Variability. Atmos. Environ. 2020, 238, 117734. [Google Scholar] [CrossRef]
  41. Harris, I.; Osborn, T.J.; Jones, P.; Lister, D. Version 4 of the CRU TS Monthly High-Resolution Gridded Multivariate Climate Dataset. Sci. Data 2020, 7, 109. [Google Scholar] [CrossRef]
  42. Jones, P.D.; Moberg, A. Hemispheric and Large-Scale Surface Air Temperature Variations: An Extensive Revision and an Update to 2001. J. Clim. 2003, 16, 206–223. [Google Scholar] [CrossRef]
  43. Hu, Z.; Zhou, Q.; Chen, X.; Li, J.; Li, Q.; Chen, D.; Liu, W.; Yin, G. Evaluation of Three Global Gridded Precipitation Data Sets in Central Asia Based on Rain Gauge Observations. Int. J. Climatol. 2018, 38, 3475–3493. [Google Scholar] [CrossRef]
  44. Song, L.; Xu, C.; Long, Y.; Lei, X.; Suo, N.; Cao, L. Performance of Seven Gridded Precipitation Products over Arid Central Asia and Subregions. Remote Sens. 2022, 14, 6039. [Google Scholar] [CrossRef]
  45. Li, Z.; Chen, Y.; Li, W.; Deng, H.; Fang, G. Potential Impacts of Climate Change on Vegetation Dynamics in Central Asia. J. Geophys. Res. 2015, 120, 12345–12356. [Google Scholar] [CrossRef]
  46. Deng, H.; Chen, Y. Influences of Recent Climate Change and Human Activities on Water Storage Variations in Central Asia. J. Hydrol. 2017, 544, 46–57. [Google Scholar] [CrossRef]
  47. Hersbach, H.; Bell, B.; Berrisford, P.; Hirahara, S.; Horányi, A.; Muñoz-Sabater, J.; Nicolas, J.; Peubey, C.; Radu, R.; Schepers, D.; et al. The ERA5 Global Reanalysis. Quart. J. Roy. Meteor. Soc. 2020, 146, 1999–2049. [Google Scholar] [CrossRef]
  48. Song, J.-N.; Fu, G.; Xu, Y.; Han, Z.-Y.; Sun, Q.-Z.; Wang, H. Assessment of the Capability of CMIP6 Global Climate Models to Simulate Arctic Cyclones. Adv. Clim. Change Res. 2021, 12, 660–676. [Google Scholar] [CrossRef]
  49. Tarek, M.; Brissette, F.P.; Arsenault, R. Evaluation of the ERA5 Reanalysis as a Potential Reference Dataset for Hydrological Modelling over North America. Hydrol. Earth Syst. Sci. 2020, 24, 2527–2544. [Google Scholar] [CrossRef]
  50. Vautard, R.; Kadygrov, N.; Iles, C.; Boberg, F.; Buonomo, E.; Bülow, K.; Coppola, E.; Corre, L.; van Meijgaard, E.; Nogherotto, R.; et al. Evaluation of the Large EURO-CORDEX Regional Climate Model Ensemble. J. Geophys. Res. 2021, 126, e2019JD032344. [Google Scholar] [CrossRef]
  51. Pachauri, R.K.; Allen, M.R.; Barros, V.R.; Broome, J.; Cramer, W.; Christ, R.; Church, J.A.; Clarke, L.; Dahe, Q.; Dasgupta, P.; et al. Climate Change 2014: Synthesis Report. Contribution of Working Groups I, II and III to the Fifth Assessment Report of the Intergovernmental Panel on Climate Change; Pachauri, R.K., Meyer, L., Eds.; IPCC: Geneva, Switzerland, 2014; p. 151. ISBN 9789291691432. [Google Scholar]
  52. van Vuuren, D.P.; Stehfest, E.; Gernaat, D.E.H.J.; Doelman, J.C.; van den Berg, M.; Harmsen, M.; de Boer, H.S.; Bouwman, L.F.; Daioglou, V.; Edelenbosch, O.Y.; et al. Energy, Land-Use and Greenhouse Gas Emissions Trajectories under a Green Growth Paradigm. Glob. Environ. Change 2017, 42, 237–250. [Google Scholar] [CrossRef]
  53. Kriegler, E.; Bauer, N.; Popp, A.; Humpenöder, F.; Leimbach, M.; Strefler, J.; Baumstark, L.; Bodirsky, B.L.; Hilaire, J.; Klein, D.; et al. Fossil-Fueled Development (SSP5): An Energy and Resource Intensive Scenario for the 21st Century. Glob. Environ. Change 2017, 42, 297–315. [Google Scholar] [CrossRef]
  54. Fujimori, S.; Hasegawa, T.; Masui, T.; Takahashi, K.; Herran, D.S.; Dai, H.; Hijioka, Y.; Kainuma, M. SSP3: AIM Implementation of Shared Socioeconomic Pathways. Glob. Environ. Change 2017, 42, 268–283. [Google Scholar] [CrossRef]
  55. Calvin, K.; Bond-Lamberty, B.; Clarke, L.; Edmonds, J.; Eom, J.; Hartin, C.; Kim, S.; Kyle, P.; Link, R.; Moss, R.; et al. The SSP4: A World of Deepening Inequality. Glob. Environ. Change 2017, 42, 284–296. [Google Scholar] [CrossRef]
  56. Fricko, O.; Havlik, P.; Rogelj, J.; Klimont, Z.; Gusti, M.; Johnson, N.; Kolp, P.; Strubegger, M.; Valin, H.; Amann, M.; et al. The Marker Quantification of the Shared Socioeconomic Pathway 2: A Middle-of-the-Road Scenario for the 21st Century. Glob. Environ. Change 2017, 42, 251–267. [Google Scholar] [CrossRef]
  57. Masson-Delmotte, V.; Zhai, P.; Pirani, A.; Connors, S.L.; Péan, C.; Berger, S.; Caud, N.; Chen, Y.; Goldfarb, L.; Gomis, M.I.; et al. Climate Change 2021: The Physical Science Basis. Contribution of Working Group I to the Sixth Assessment Report of the Intergovernmental Panel on Climate Change. 2021. Available online: https://www.ipcc.ch/report/ar6/wg1/downloads/report/IPCC_AR6_WGI_summaryvolume.pdf (accessed on 2 July 2024).
  58. Hargreaves, G.H. Defining and Using Reference Evapotranspiration. J. Irrig. Drain. Eng. 1994, 120, 1132–1139. [Google Scholar] [CrossRef]
  59. Droogers, P.; Allen, R.G. Estimating Reference Evapotranspiration Under Inaccurate Data Conditions. Irrig. Drain. Syst. 2002, 16, 33–45. [Google Scholar] [CrossRef]
  60. Gleckler, P.J.; Taylor, K.E. Performance Metrics for Climate Models. Res. Atmos. 2008, 113, D06104. [Google Scholar] [CrossRef]
  61. Deser, C.; Phillips, A.; Bourdette, V.; Teng, H. Uncertainty in Climate Change Projections: The Role of Internal Variability. Clim. Dyn. 2012, 38, 527–546. [Google Scholar] [CrossRef]
  62. Chen, F.; Wang, J.; Jin, L.; Zhang, Q.; Li, J.; Chen, J. Rapid Warming in Mid-Latitude Central Asia for the Past 100 Years. Front. Earth Sci. Chin. 2009, 3, 42–50. [Google Scholar] [CrossRef]
  63. Brohan, P.; Kennedy, J.J.; Harris, I. Uncertainty Estimates in Regional and Global Observed Temperature Changes: A New Data Set from 1850. Atmospheres 2006, 111, D12106. [Google Scholar] [CrossRef]
  64. Simmons, A.J.; Jones, P.D.; da Costa Bechtold, V.; Beljaars, A.C.M.; Kållberg, P.W.; Saarinen, S.; Uppala, S.M.; Viterbo, P.; Wedi, N. Comparison of Trends and Low-frequency Variability in CRU, ERA-40, and NCEP/NCAR Analyses of Surface Air Temperature. J. Geophys. Res. Atmos. 2004, 109, D24115. [Google Scholar] [CrossRef]
  65. Kholmatjanov, B.M.; Petrov, Y.V.; Khujanazarov, T.; Sulaymonova, N.N.; Abdikulov, F.I.; Tanaka, K. Analysis of Temperature Change in Uzbekistan and the Regional Atmospheric Circulation of Middle Asia during 1961–2016. Climate 2020, 8, 101. [Google Scholar] [CrossRef]
  66. Chen, F.; Huang, W.; Jin, L.; Chen, J.; Wang, J. Spatiotemporal Precipitation Variations in the Arid Central Asia in the Context of Global Warming. Sci. China Earth Sci. 2011, 54, 1812–1821. [Google Scholar] [CrossRef]
  67. Sadeghi, F.; Ghavidel, Y.; Farajzadeh, M. Long-Term Analysis of the Spatiotemporal Standardized Precipitation Evapotranspiration Index for West Asia. Arab. J. Geosci. 2022, 15, 1183. [Google Scholar] [CrossRef]
  68. Hosseini, A.; Ghavidel, Y.; Mohammad Khorshiddoust, A.; Farajzadeh, M. Spatio-Temporal Analysis of Dry and Wet Periods in Iran by Using Global Precipitation Climatology Center-Drought Index (GPCC-DI). Theor. Appl. Climatol. 2021, 143, 1035–1045. [Google Scholar] [CrossRef]
  69. Serkendiz, H.; Tatli, H.; Kılıç, A.; Çetin, M.; Sungur, A. Analysis of Drought Intensity, Frequency and Trends Using the Spei in Turkey. Theor. Appl. Climatol. 2024, 155, 2997–3012. [Google Scholar] [CrossRef]
  70. Hosseini, A.; Ghavidel, Y.; Farajzadeh, M. Characterization of Drought Dynamics in Iran by Using S-TRACK Method. Theor. Appl. Climatol. 2021, 145, 661–671. [Google Scholar] [CrossRef]
  71. Stefanidis, S.; Rossiou, D.; Proutsos, N. Drought Severity and Trends in a Mediterranean Oak Forest. Hydrology 2023, 10, 167. [Google Scholar] [CrossRef]
  72. Lafferty, D.C.; Sriver, R.L. Downscaling and Bias-Correction Contribute Considerable Uncertainty to Local Climate Projections in CMIP6. Npj Clim. Atmos. Sci. 2023, 6, 158. [Google Scholar] [CrossRef]
  73. Lu, K.; Arshad, M.; Ma, X.; Ullah, I.; Wang, J.; Shao, W. Evaluating Observed and Future Spatiotemporal Changes in Precipitation and Temperature across China Based on CMIP6-GCMs. Int. J. Climatol. 2022, 42, 7703–7729. [Google Scholar] [CrossRef]
  74. Wootten, A.; Terando, A.; Reich, B.J.; Boyles, R.P.; Semazzi, F. Characterizing Sources of Uncertainty from Global Climate Models and Downscaling Techniques. J. Appl. Meteorol. Climatol. 2017, 56, 3245–3262. [Google Scholar] [CrossRef]
  75. Chegwidden, O.S.; Nijssen, B.; Rupp, D.E.; Arnold, J.R.; Clark, M.P.; Hamman, J.J.; Kao, S.-C.; Mao, Y.; Mizukami, N.; Mote, P.W.; et al. How Do Modeling Decisions Affect the Spread among Hydrologic Climate Change Projections? Exploring a Large Ensemble of Simulations across a Diversity of Hydroclimates. Earths Future 2019, 7, 623–637. [Google Scholar] [CrossRef]
  76. Xu, Z.; Han, Y.; Tam, C.-Y.; Yang, Z.-L.; Fu, C. Bias-Corrected CMIP6 Global Dataset for Dynamical Downscaling of the Historical and Future Climate (1979–2100). Sci. Data 2021, 8, 293. [Google Scholar] [CrossRef] [PubMed]
Figure 1. The study areas. The 5 regions are defined as the Southern Zone (SZ), Middle Course of Amu Darya (MCA), Lower Course of Amu Darya (LCA), Fergana Valley (FV), and Middle Course of Syr Darya (MCS).
Atmosphere 15 00866 g001
Figure 2. Annual mean temperature (°C) time series for Uzbekistan derived from the CRU observations for 1901–2021, the ERA5 reanalysis for 1970–2020, and the CMIP5 and CMIP6 historical (for 1986–2005 and 1995–2014, respectively) and climate projection (for 2006–2100 and 2015–2100, respectively) simulations. The left and right panels show the original and bias-corrected model results, respectively.
Atmosphere 15 00866 g002
Figure 3. Time series of annual precipitation (mm) for Uzbekistan derived from the CRU observations for 1901–2021, the ERA5 reanalysis for 1970–2020, and the CMIP5 and CMIP6 historical (for 1986–2005 and 1995–2014, respectively) and climate projection (for 2006–2100 and 2015–2100, respectively) simulations. The left and right panels show the original and bias-corrected model results, respectively.
Atmosphere 15 00866 g003
Figure 4. Spatial variations of annual temperature (°C) for the territory of Uzbekistan under the scenarios SSP1-2.6 (left column), SSP2-4.5 (middle column), and SSP3–7.0 (right column) for the climate periods 2020–2039 (ac), 2040–2059 (df), 2060–2079 (gi), 2080–2099 (jl) relative to the base climate period of 1995–2014 obtained using bias-corrected MMEs.
Atmosphere 15 00866 g004
Figure 5. Spatial variations of annual precipitation amounts (mm) for the territory of Uzbekistan under the scenarios SSP1-2.6 (left column), SSP2-4.5 (middle column), and SSP3–7.0 (right column) for the climate periods 2020–2039 (ac), 2040–2059 (df), 2060–2079 (gi), 2080–2099 (jl) relative to the base climate period of 1995–2014 obtained using bias-corrected MMEs.
Atmosphere 15 00866 g005
Figure 6. Climatological seasonal anomaly of temperature (°C) for the periods of 2020–2039, 2040–2059, 2060–2079, and 2080–2099 in comparison to the historical reference period 1995–2014 derived from the SSP1-2.6, SSP2-4.5, and SSP3-7.0 climate projections derived from CMIP6. Note the different scale of the y-axis.
Atmosphere 15 00866 g006
Figure 7. Climatological seasonal anomaly of precipitation (mm) for the periods of 2020–2039, 2040–2059, 2060–2079, and 2080–2099 in comparison to the historical reference period 1995–2014 derived from the SSP1-2.6, SSP2-4.5, and SSP3-7.0 climate projections derived from CMIP6.
Atmosphere 15 00866 g007
Figure 8. Climatological seasonal anomaly of temperature (°C) for the periods of 2020–2039, 2040–2059, 2060–2079, and 2080–2099 in comparison to the historical reference period 1995–2014 derived from the SSP1-2.6, SSP2-4.5, and SSP3-7.0 climate projections. Note the different scale of the y-axis.
Atmosphere 15 00866 g008
Figure 9. Climatological seasonal anomaly of precipitation (mm) for the periods 2020–2039, 2040–2059, 2060–2079, and 2080–2099 in comparison to the historical reference period 1995–2014 derived from the SSP1-2.6, SSP2-4.5, and SSP3-7.0 climate projections.
Atmosphere 15 00866 g009
Figure 10. Time series of the SPEI12 index for Uzbekistan derived from the CMIP5 and CMIP6 historical (for 1986–2005 and 1995–2014, respectively) and climate projection (for 2006–2100 and 2015–2100, respectively) simulations.
Atmosphere 15 00866 g010
Table 1. The SPEI drought index categories [34].
The SPEI Value Grade
≤2Extreme humidity
1.5–2.0High humidity
1.0–1.5Moderate humidity
0.5–1.0Minor humidity
0.5–−0.5Near normal
−0.5–−1.0Mild drought
−1.0–−1.5Moderate drought
−1.5–−2.0Severe drought
≤−2Extreme drought
Disclaimer/Publisher’s Note: The statements, opinions and data contained in all publications are solely those of the individual author(s) and contributor(s) and not of MDPI and/or the editor(s). MDPI and/or the editor(s) disclaim responsibility for any injury to people or property resulting from any ideas, methods, instructions or products referred to in the content.

