Article

Energy Dependence of Solar Energetic Protons and Their Origin in Solar Cycles 23 and 24

1
Institute of Astronomy and National Astronomical Observatory (IANAO), Bulgarian Academy of Sciences, 1784 Sofia, Bulgaria
2
National Research Institute of Astronomy and Geophysics (NRIAG), Helwan, Cairo 11421, Egypt
*
Author to whom correspondence should be addressed.
Atmosphere 2024, 15(8), 1016; https://doi.org/10.3390/atmos15081016
Submission received: 18 July 2024 / Revised: 12 August 2024 / Accepted: 18 August 2024 / Published: 21 August 2024
(This article belongs to the Section Planetary Atmospheres)

Abstract

:
The study presents the compilation of a comprehensive catalog of solar energetic protons (SEPs) in solar cycles (SCs) 23 and 24 (1996–2019) in 10 energy channels from about 20 to 100 MeV based on data from the Energetic and Relativistic Nuclei and Electron (ERNE) instrument aboard Solar and Heliospheric Observatory (SOHO). For comparison, we added previously reported SEP fluxes by a number of different sources. We identified the SEP-solar origin in terms of solar flares and coronal mass ejections and calculated the statistical correlations (Pearson and partial) as a function of the SEP energy.

1. Introduction

The changes on the visible surface of the Sun, i.e., the photosphere, as well as in the solar corona and outwards through the heliosphere are all driven by the magnetic cycle (dynamo) of our star [1]. The same magnetic polarity returns roughly every 22 years during the peak of the sunspot occurrence. The latter phenomenon has the longest observable record in solar physics, since the 1600s, and the rise and fall of the sunspot number take approximately 11 years, known as the solar cycle (SC) [2]. The majority of the solar eruptive events follow the SC trend [3].
Solar activity is a generic term describing a wealth of phenomena, from flashes of electromagnetic (EM) emission, jets and eruptions of coronal plasma to enhanced fluxes of energetic particles. Most of these events can be observed remotely, such as solar flares (SFs) [4] and coronal mass ejections (CMEs) [5].
SFs are mostly an excess of photons, usually observed as light curves in soft X-rays (SXRs) or as flashes on images of the solar disk [6]. But during an SF eruption, there are also plasma motions, particle acceleration, precipitation and magnetic field reconfiguration in the area around the sunspot group, known as active region (AR). The increase in solar emission due to SFs is detected at 1 AU after about 8 min and before any other signature of solar activity. Thus, SFs can be used as the earliest indication of potential disturbances in the heliosphere.
The other agent of solar activity is the bubble of magnetized plasma, i.e., CME, erupting from the corona into the interplanetary (IP) space, interacting with solar wind streams and/or planetary magnetospheres. They are usually observed with coronagraphs blocking the bright photosphere. Namely, the first occurrence of the CME (e.g., measuring of the white-light features) is at heights of 1.5 solar radii above the surface and 10 s of minutes after the accompanied SF. Based on the instrument coverage, the low-corona CME liftoff can be only deduced by means of back-extrapolation of the kinematic curve. Furthermore, the CME speed calculation is conducted in projection over the sky. De-projected or 3D speed reconstructions have limited applications due to the need for stereoscopic data. Namely, images from two (or more) spacecraft are fitted with a mesh structure and the best fit is used to calculate the ‘true’ CME parameters. For example, the 3D CME speed was shown to be underestimated by about 20% compared to the 2D values [7]. However, previous attempts also showed large uncertainties in the deduced CME parameters due to the observer’s subjectivity and model limitations [8].
Both SFs and CMEs are efficient particle accelerators in terms of magnetic reconnection [9] or/and due to the formation of shock waves. The presence and properties of energetic particles can be deduced via their emission (e.g., in radio, X and gamma-rays) after the interaction of the particle population with the background plasma and embedded magnetic fields. Alternatively, the particles can be directly recorded in situ by particle detectors. The latter component is known as solar energetic particles (protons, electrons and heavy ions from keV up to GeV energies) [10] and are regarded as accelerated in the solar corona or close to the Sun, transported along magnetic field lines (approximated with a Parker spiral) and finally detected in space (i.e., in situ) [11] with different satellites. The solar energetic electrons can arrive shortly after the SF start (about 10 min for the relativistic case), whereas the protons can take hour(s) to arrive, depending on their magnetic connectivity. Well-connected events (usually with origin at the western helio-longitudes) have shorter onset-to-peak duration, whereas the poorly-connected (eastern) protons show a gradually rising time profile. The solar origin of these particles is proven by the observed velocity dispersion, namely the higher energy particles arrive earlier.
The IP counterparts of CMEs, i.e., ICMEs, together with the shock waves formed in the solar wind [12] are an important origin of accelerated particles in the heliosphere, termed energetic storm particles (ESPs). Usually, the ESPs occur after the increase in the (well-connected) particle flux and coincide temporarily with the shock arrivals, which can be from 10s hours up to several days after the SF/CME.
Due to data availability, the solar energetic protons (SEPs) were the subject of intensive research. There was a long-standing debate about the identity of their (primary) accelerator, with researchers recognizing only CMEs vs. those supporting (also) the SFs as their solar driver, see [13] for a historical review. Recent direct and indirect observations support the mixed contribution of SFs and CMEs to the fluxes of energetic particles [13,14,15].
There are various particle detectors aboard satellites but we will focus here on those providing data in SCs 23 and 24 and located near Earth (e.g., at the L1 point facing the Sun). Some notable missions are listed below.
  • Geostationary Operational Environmental Satellite (GOES) (since Oct-1975): a network of satellites in geosynchronous orbit, providing fluxes of SEPs in specific energy ranges, e.g., via the Energetic Particle Sensor, https://www.swpc.noaa.gov/products/goes-proton-flux, (accessed on 19 July 2024).
  • Solar and Heliospheric Observatory (SOHO), since Dec-1995:
  • Wind (since Nov-1994): https://wind.nasa.gov/inst_info.php (accessed on 19 July 2024):
    • Wind 3D Plasma Analyzer (Wind 3DP)
    • Wind SMS Suprathermal Particle Data
    • Energetic Particles: Acceleration, Composition and Transport (EPACT) [17]
  • STEREO (since Oct-2006), https://izw1.caltech.edu/STEREO/, https://sprg.ssl.berkeley.edu/impact/ (accessed on 19 July 2024):
    • High-Energy Telescope,
    • Low-Energy Telescope,
    • Solar Electron Proton Telescope,
    • Suprathermal Ion Telescope.
    The launch of the two STEREO spacecraft ahead and behind the Earth along its orbit around the Sun leads to a different vantage point. This is why their data will not be considered for the comparative study performed here. Catalogs of STEREO SEP events have been already compiled, e.g., [18,19] and a stereoscopic perspective is required to detect the so-called wide-longitude SEPs, e.g., [20].
  • Parker Solar Probe (since Aug-2018) https://parkersolarprobe.jhuapl.edu/ (accessed on 19 July 2024) and Solar Orbiter (since Feb-2020) https://www.esa.int/Science_Exploration/Space_Science/Solar_Orbiter (accessed on 19 July 2024) are the most recent additions to the fleet of solar-dedicated missions. Due to their specific fly-by orbital motion and thus, partial temporal coverage, data from their respective particle instruments are not considered in this study.
The space detectors usually record the keV to ∼500 MeV protons. Above lies the most energetic part of the distribution [21]. These protons can be observed only indirectly after they penetrate the terrestrial magnetosphere and produce air showers in the atmosphere. As a byproduct of the reactions, e.g., neutrons are produced and detected by a network of neutron monitors, https://www.nmdb.eu/ (accessed on 19 July 2024). A list of these ground-level enhancement (GLE) events is available at https://gle.oulu.fi/ (accessed on 19 July 2024). A positive correlation between the SEPs and the cosmic ray fluxes has been shown by [22]. Thus, cosmic ray contamination cannot by excluded from the proton events at the highest energies. Nevertheless, the number of extreme proton events is small, compared to the entire SEP sample and their fluxes will be used in the present analyses as reported.
SFs, CMEs and energetic particles are the key drivers of heliospheric disturbances. The combined, short-term influence of the Sun in the heliosphere, on space and ground-based technological devices and human life is known as space weather (SW) [23,24,25]. SFs, CMEs and particles have distinct SW effects with SEPs influencing mostly the planetary atmospheres and technological devices. In particular, SEPs are known to carry a risk for radiation exposure to astronauts with a return trip to Mars estimated to accumulate close to 60% of the astronaut’s life-long radiation dose [26]. Although the magnetosphere has an efficient shielding effect, elevated radiation doses constitute a hazard also for low Earth-orbiting spacecraft, the International Space Station, and during polar route flights. Thus there is a need for an advance warning of incoming SEP events, in terms of fluxes, energies and duration. There is an active development of different empirical, physics-based and machine-learning SEP forecasting models described in a recent review by [27].
The purpose of our work is to summarize our previous analyses using 1 min resolution and to present in a consistent manner the results for all 10 SOHO/ERNE HED channels (1996–2017). Previous research on SEPs from the same instrument was conducted by [28] in SC23, [29] in SC23+24 and [30] in SC24.
The main aim of the work is to investigate the energy trends (dependence) of the SEP intensity, their solar origin and the correlations between the peak of the SEP fluxes and the SF class/CME speed/CME AW. For this, we use our results on SOHO/ERNE HED channels, as well as nine other SEP listings in specific energy bands over the range of ∼10 to >500 MeV. Furthermore, we perform these analyses separately for SC23, SC24 and both SCs.

2. Data and Methods

2.1. Proton Catalogs

The proton intensity (or sometimes termed flux) is usually given in protons/( cm 2 sr s MeV), denoted as differential proton flux unit (DPFU) or in its energy-integrated value, the proton flux units (pfu), where 1 pfu = 1 proton/( cm 2 sr s). A number of instruments are monitoring the proton fluxes in space and a number of previous works used different samples of in situ protons. Listing all these studies, however, goes beyond the scope of our work. In the present study, we focus on sources covering a time period of at least one SC and, in addition, providing access to the catalog of SEPs. Below we list the used SEP catalogs, providing the time converge in each case, whereas the number of events is given in parenthesis:
In addition to the reported SEP lists, we present here the results on the peak proton intensities from the SOHO/ERNE instrument, similar to [29]. The energy ranges of the 10 HED channels (and their average value) are given below:
  • HED01: 14–17 (15.5) MeV
  • HED02: 17–22 (19.5) MeV
  • HED03: 21–28 (24.5) MeV
  • HED04: 26–32 (29.0) MeV
  • HED05: 32–40 (36.0) MeV
  • HED06: 40–51 (45.5) MeV
  • HED07: 51–67 (59.0) MeV
  • HED08: 64–80 (72.0) MeV
  • HED09: 80–101 (90.5) MeV
  • HED10: 101–131 (116) MeV
measured in DPFU, https://export.srl.utu.fi/export_data_description.txt (accessed on 19 July 2024). The SEP analysis was completed by us for the period 1996–2017. The SEP catalog together with a description of the earlier reports can be accessed freely at https://catalogs.astro.bas.bg/ (accessed on 19 July 2024). We note that [30] did not find any SOHO/ERNE events close to the solar minimum (2018 and 2019), thus our list can be considered as a representative over the last two SCs (1996–2019).
The following identification procedure of the SOHO/ERNE SEPs is applied by us. All time-intensity profiles for the given SEP event are visually inspected over a two-day period. Two observer-defined intervals are selected: before the rise of the SEP flux and around the first prominent peak. A dedicated routine calculates the averaged value of the flux before the rise and this value is regarded as the background level. This is conducted individually for each SEP event. Next, the routine calculates the peak value in the second time interval and subtracts from it the background value. Thus, the peak SEP intensity used in this study is in fact the SEP amplitude. In this way, periods of elevated pre-event background or SEP events in close succession are taken into account. During the analyses, we aim to select as SEP events the solar signatures and not later peaks due to ESPs. In the case of slowly rising profiles, we tend to select the peak within the first 12 h as also suggested by [32]. Even if we have included any ESPs in our even list, the final correlation results are not expected to be severely affected, as shown by [36] for the proton events in SC23.
The objective here is to complement the SOHO/ERNE SEP fluxes with reports from alternative instruments measured in DPFU. In addition, we added data from several catalogs providing fluxes in pfu, but only at the lowest and highest end of the energy distribution, where the data sampling is low. We note that there is very low data coverage at the highest energies, and the reported results in this case await future independent confirmation.
Furthermore, SOHO/ERNE detectors suffer from saturation effects for high-intensity SEP events. An attempt for a flux correction has been already described in [37]. As previously noted, corrections of the SOHO/ERNE fluxes are possible only for selected energy channels, namely having a similar coverage as the alternative instruments (e.g., at about 25 and 50 MeV with Wind/EPACT data). The correction was applied on a small fraction of the event sample (well below 10%, that were above a certain intensity threshold) and it was demonstrated that the correlation coefficients when using saturated fluxes and corrected ones are not statistically different. This is why, we will not explore the corrected SOHO/ERNE fluxes in this work.

2.2. Solar Origin Identification

The criteria for solar origin identification of particle events were identified in previous studies, e.g., [33], which we will adopt here. Namely, the association procedure is based on the timing, strength and location criteria: we select the strongest eruptions (a pair of SF and CME) preceding the SEP onset in a time window of about one hour as a SEP driver.
The parameters of the SF (class, i.e., the peak of the emission in SXRs, onset and peak times and location on the solar disk) are adopted from the NOAA SF listings, ftp://ftp.swpc.noaa.gov/pub/warehouse/, https://data.nas.nasa.gov/helio/portals/solarflares/datasources.html (accessed on 19 July 2024). For the CME we used the projected speed and angular width (AW), taken from the CDAW CME catalog, https://cdaw.gsfc.nasa.gov/CME_list/ (accessed on 19 July 2024). In case of multiple eruptions (usually during solar maximum periods), we selected the strongest SF and the fastest and widest CME as the most probable SEP-origin. Since we are interested in a pairwise correlation study, we identified as the SEP origin only one SF-CME pair, where possible. Contributions from other eruptions are not accounted for and this constitutes a limitation of the association procedure. Even if these complex cases affect the SEP flux, their contributions are expected to be smaller compared to the finally selected solar driver.
The onset-to-peak particle profile is indicative of its magnetic connectivity [38], as well-connected SEPs (with solar origin located at western helio-longitudes) are known to rise fast, where poorly connected SEPs (with origin from the East) can take many hours to form a plateau-like peak. The SF-CME pair also needs to originate from the same solar quadrant. We adopted the so-proposed solar origin identification and applied it for all 19 SEP lists above in order to minimize any scatter in the correlations when an alternative solar origin is used. The latter seemed to be affecting more the correlation with the SF class and not that with the CME speed [39]. The event-matching between the SEP catalogs was relatively straightforward to perform, as a single SEP event was reported on a given day and in addition, the SEP onset time is used to identify the same proton event when reported by different sources.

2.3. Statistical Analyses

In addition to the SEP catalogs provided above, we consider the reported correlation coefficients between SEP events and SFs/CMEs in SC23 provided by [36] and by [30] in SC24. These authors used also their own solar origin identification and their results can be used to perform an independent comparison to the results based on our SOHO/ERNE list.
In order to quantify the relationship between the SEP intensities and the parameters of the solar origin, in the SEP research it is customary to calculate Pearson (or zero-order) correlations between the respective values. We will use the double logarithmic scale ( log 10 ) unless stated otherwise.
Partial correlations reflect the removal of the interdependence between some of the parameters used in the correlation analyses. We will use the first-order correlation coefficients, in a similar way as in [33]. The formula reads as r x y | z = ( r x y r y z ) / ( ( 1 r x z 2 ) ( 1 r y z 2 ) ) 0.5 , where x and y are the parameters of the pair and z is the control parameter, which influence needs to be excluded. For the current case, x is peak proton intensity ( J p ), whereas y and z switch between SF class ( I SXR ) and CME speed ( V CME ). When presenting the partial correlation coefficients between J p and I SXR and the influence of V CME is excluded, the correlation will be denoted as J p I SXR | V CME and vice versa for the J p V CME | I SXR . For the partial correlations, we also need to calculate the Pearson correlation coefficient between I SXR and V CME , leading to: 0.42 ± 0.04 (based on 396 pairs for SC23+24), 0.44 ± 0.05 (270 for SC23) and 0.35 ± 0.08 (124 for SC24) for the respective time period.
A procedure is developed for calculating the uncertainty of linear (Pearson) correlation coefficients based on the bootstrapping method [40]. From the original event sample, the procedure randomly creates 1000 lists (allowing for multiple selection of the same pair) and calculates the Pearson correlations for each artificial sample. The standard deviation based on these 1000 correlation coefficients is then calculated and its value is used as the uncertainty of the coefficient based on the original event sample. The so-calculated uncertainty provides an estimate of the scatter between the selected pair of parameters and increases for small event samples. This procedure was successfully applied to the Pearson correlation coefficients in our previous SEP research and will be used in this study as well. Since the partial coefficients include three linear coefficients, their uncertainty depends on the error estimates of all three linear components. As an upper limit, one might adopt the value of the largest uncertainty among them.

3. Results

3.1. Distributions

The yearly distribution of all SOHO/ERNE channels follows the SC behavior, see an example histogram for HED01 in Figure 1a. The yearly trends for all channels are listed in the online Supplementary Materials. A weaker SC24 compared to SC23 in terms of number of proton events is obtained for all HED channels, e.g., by 51% for HED01, ∼50% for HED02-04, ∼54% for HED05-07, and 64% for HED08-10. There is a stronger drop in numbers for the more energetic SEPs which reflects the overall lack of energetic (i.e., strong) solar and SW phenomena in the last SC, compared to a decline of less powerful (i.e., weak) phenomena.
In Figure 1b we show the peak proton intensity distribution (over the range of 10 4 to 100 DPFU) for the first SEP channel, with a sharp decrease in the numbers for the largest two intensity bins. The mean/median values of the peak intensity are 3.3/0.03 DPFU for HED01 (for the entire time period), whereas the values for the remaining channels are summarized in the Appendix A (Table A1) separately for SC23, SC24 and SC23+24. The median values show a consistent, slow decline with the increase in the SEP energy, whereas the mean values (e.g., for HED01, HED10) stand as an exception being affected by a few, but very large intensity SEP events which occurred exclusively in SC23, such as 14 July 2000, 14 July 2000, 8 November 2001, 4 November 2001, 28 October 2003, 17 January 2005, all with J p over 10 DPFU. The latter is also among the largest solar/SW events ever observed [41].
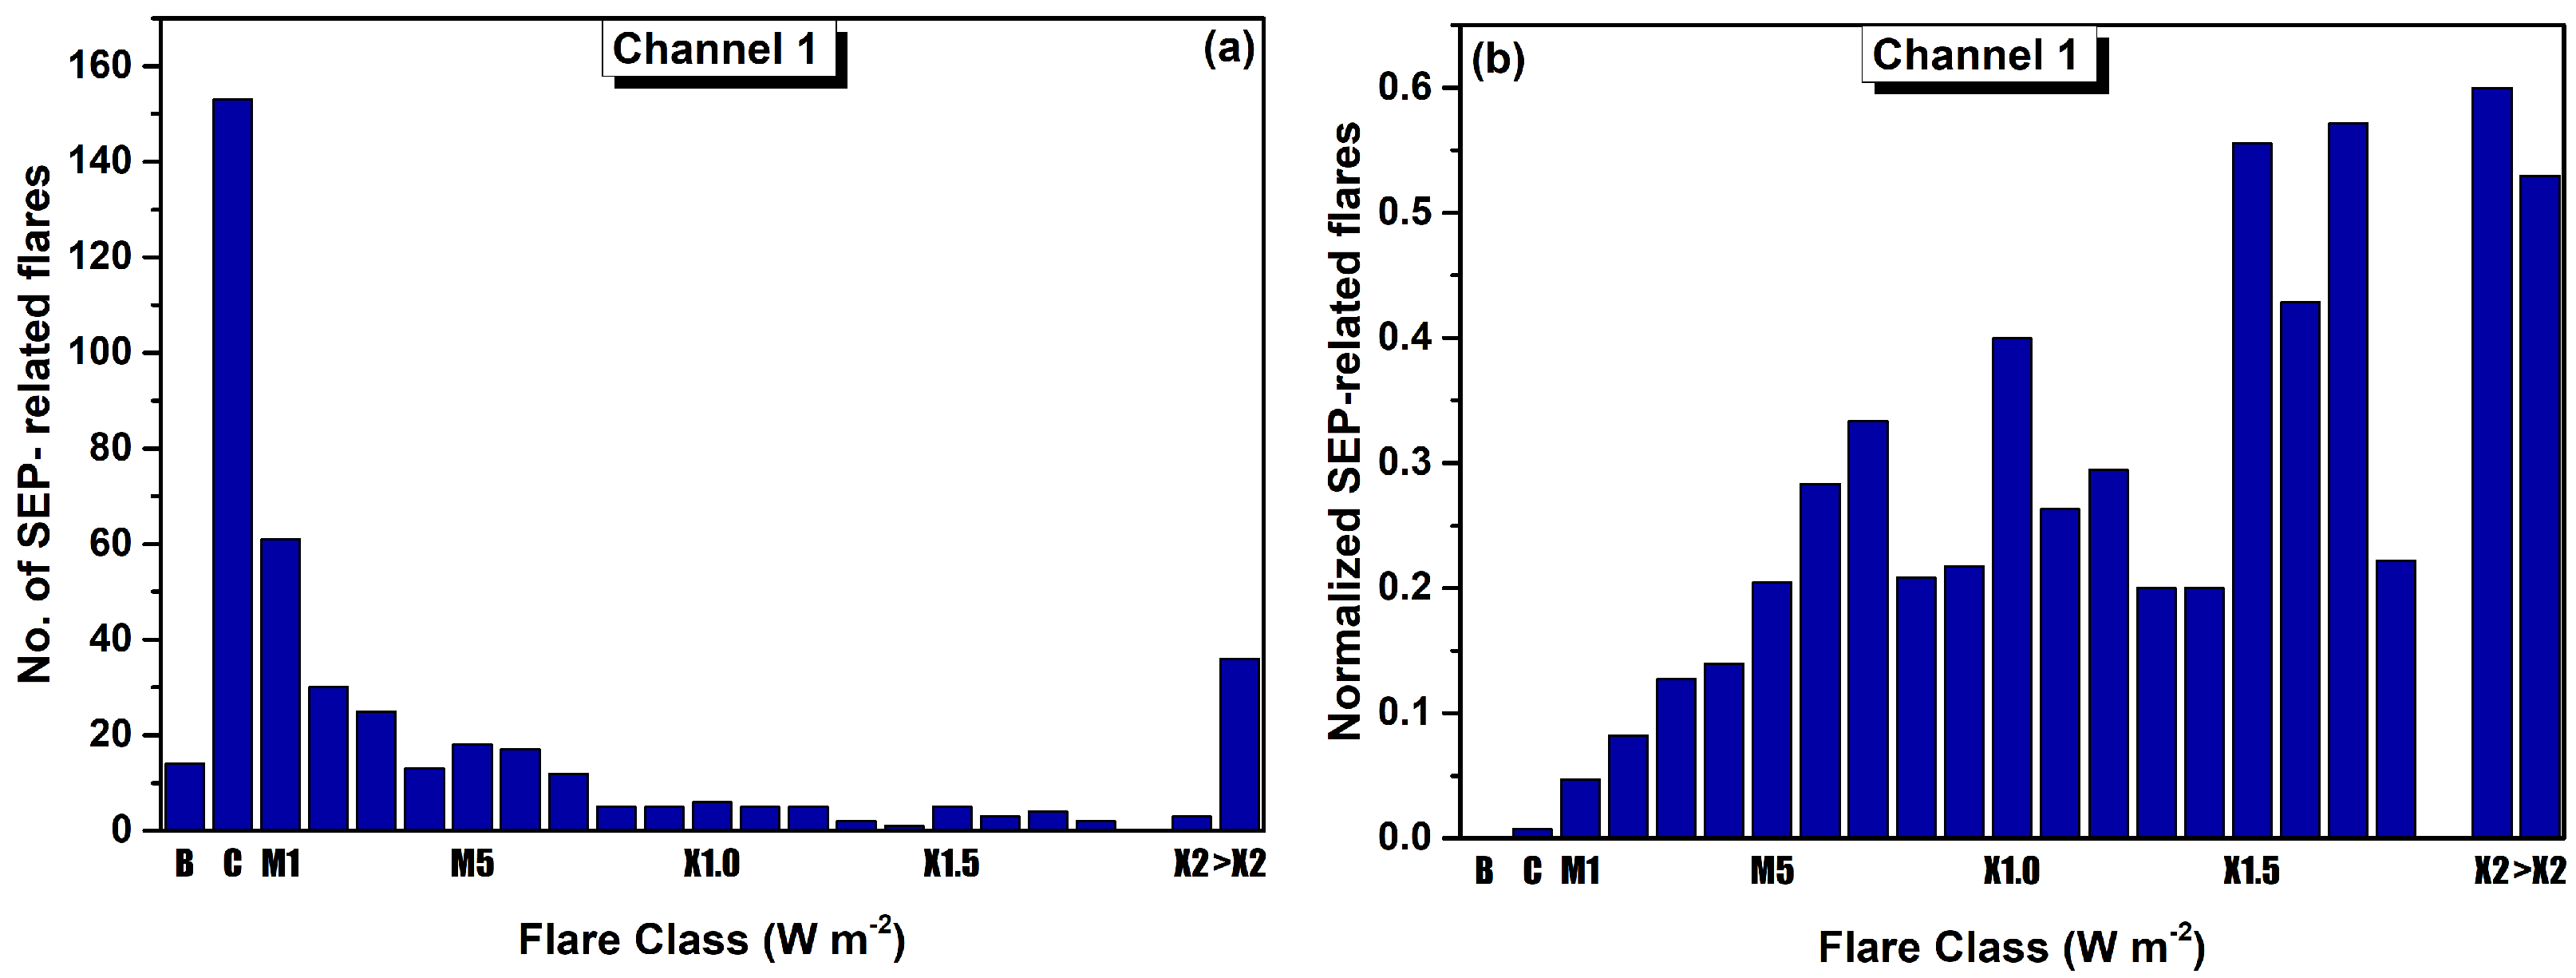
The histograms of the SEP-associated SFs and CMEs are shown in Figure 2 and Figure 3, respectively, for the total and normalized numbers. The event distributions represent cases observed in both SCs, amounting to 425 SEP-associated SFs and 511 SEP-associated CMEs (for the first energy channel of 659 SEPs). The normalization is conducted as described in [15]. Namely, each bin from Figure 2a is divided by the number of all observed SFs in the respective range of SXR class giving the bin seen in Figure 2b. For example, the total number of SEP-associated SFs of the C-class is 153, which is the majority of SEP-associated SFs. For the normalized value, this number is divided into all C-class flares observed in SC23+24 (around 21,000) leading finally to an insignificantly small normalized number in the same bin. In contrast, over the same time period, the SEP-associated SFs larger than X2 are 36; however, the entire number of observed >X2 is 69, leading to the result that 52% of all >X2 SFs are accompanied by an SEP event.
Similarly, the upper row of Figure 3 depicts the CME speed distributions in SC23+24. Although the majority of the SEP-associated CMEs have relatively low speeds, below 1000 kms 1 , Figure 3a, their normalized number is insignificant, Figure 3b. In contrast, the total number of faster than about 2400 kms 1 CMEs observed is 18 but they are nearly exclusively accompanied by SEP events, e.g., 12 cases, which explains the maximum heights for many of these bins (the histogram on the right).
The lower row shows the AW trends: the over-representation of the halo-CMEs (e.g., with AW of 360 degrees forming a halo around the solar disk) can be clearly seen in Figure 3c; however, the normalized values show that the wide CMEs (e.g., >270 degrees) are associated with SEP events nearly twice as often as in the case of narrow CMEs, Figure 3d. The energy-dependent distributions of the SFs and CMEs for all 10 energy channels can be inspected from the online Supplementary Materials.

3.2. Pearson Correlations

The quantitative evaluation of the relationship between SEP events and their solar origin is traditionally conducted by calculating Pearson correlation coefficients. We used the log 10 of the values of all SEP lists before performing the correlations. The results are listed in Table 1, for the correlation with the SXR class ( J p I SXR ) and with the projected/linear CME speed ( J p V CME ) together with the (bootstrapping) uncertainty for each case. Furthermore, we present the coefficients per energy channel in all three time periods, SC23, SC24 and SC23+24. For completeness, we calculated the log 10 -linear correlation coefficient between the SEP flux and the CME speed (Table A2). Since the differences with the values in Table 1 are not statistically significant, we can make a direct comparison between them.
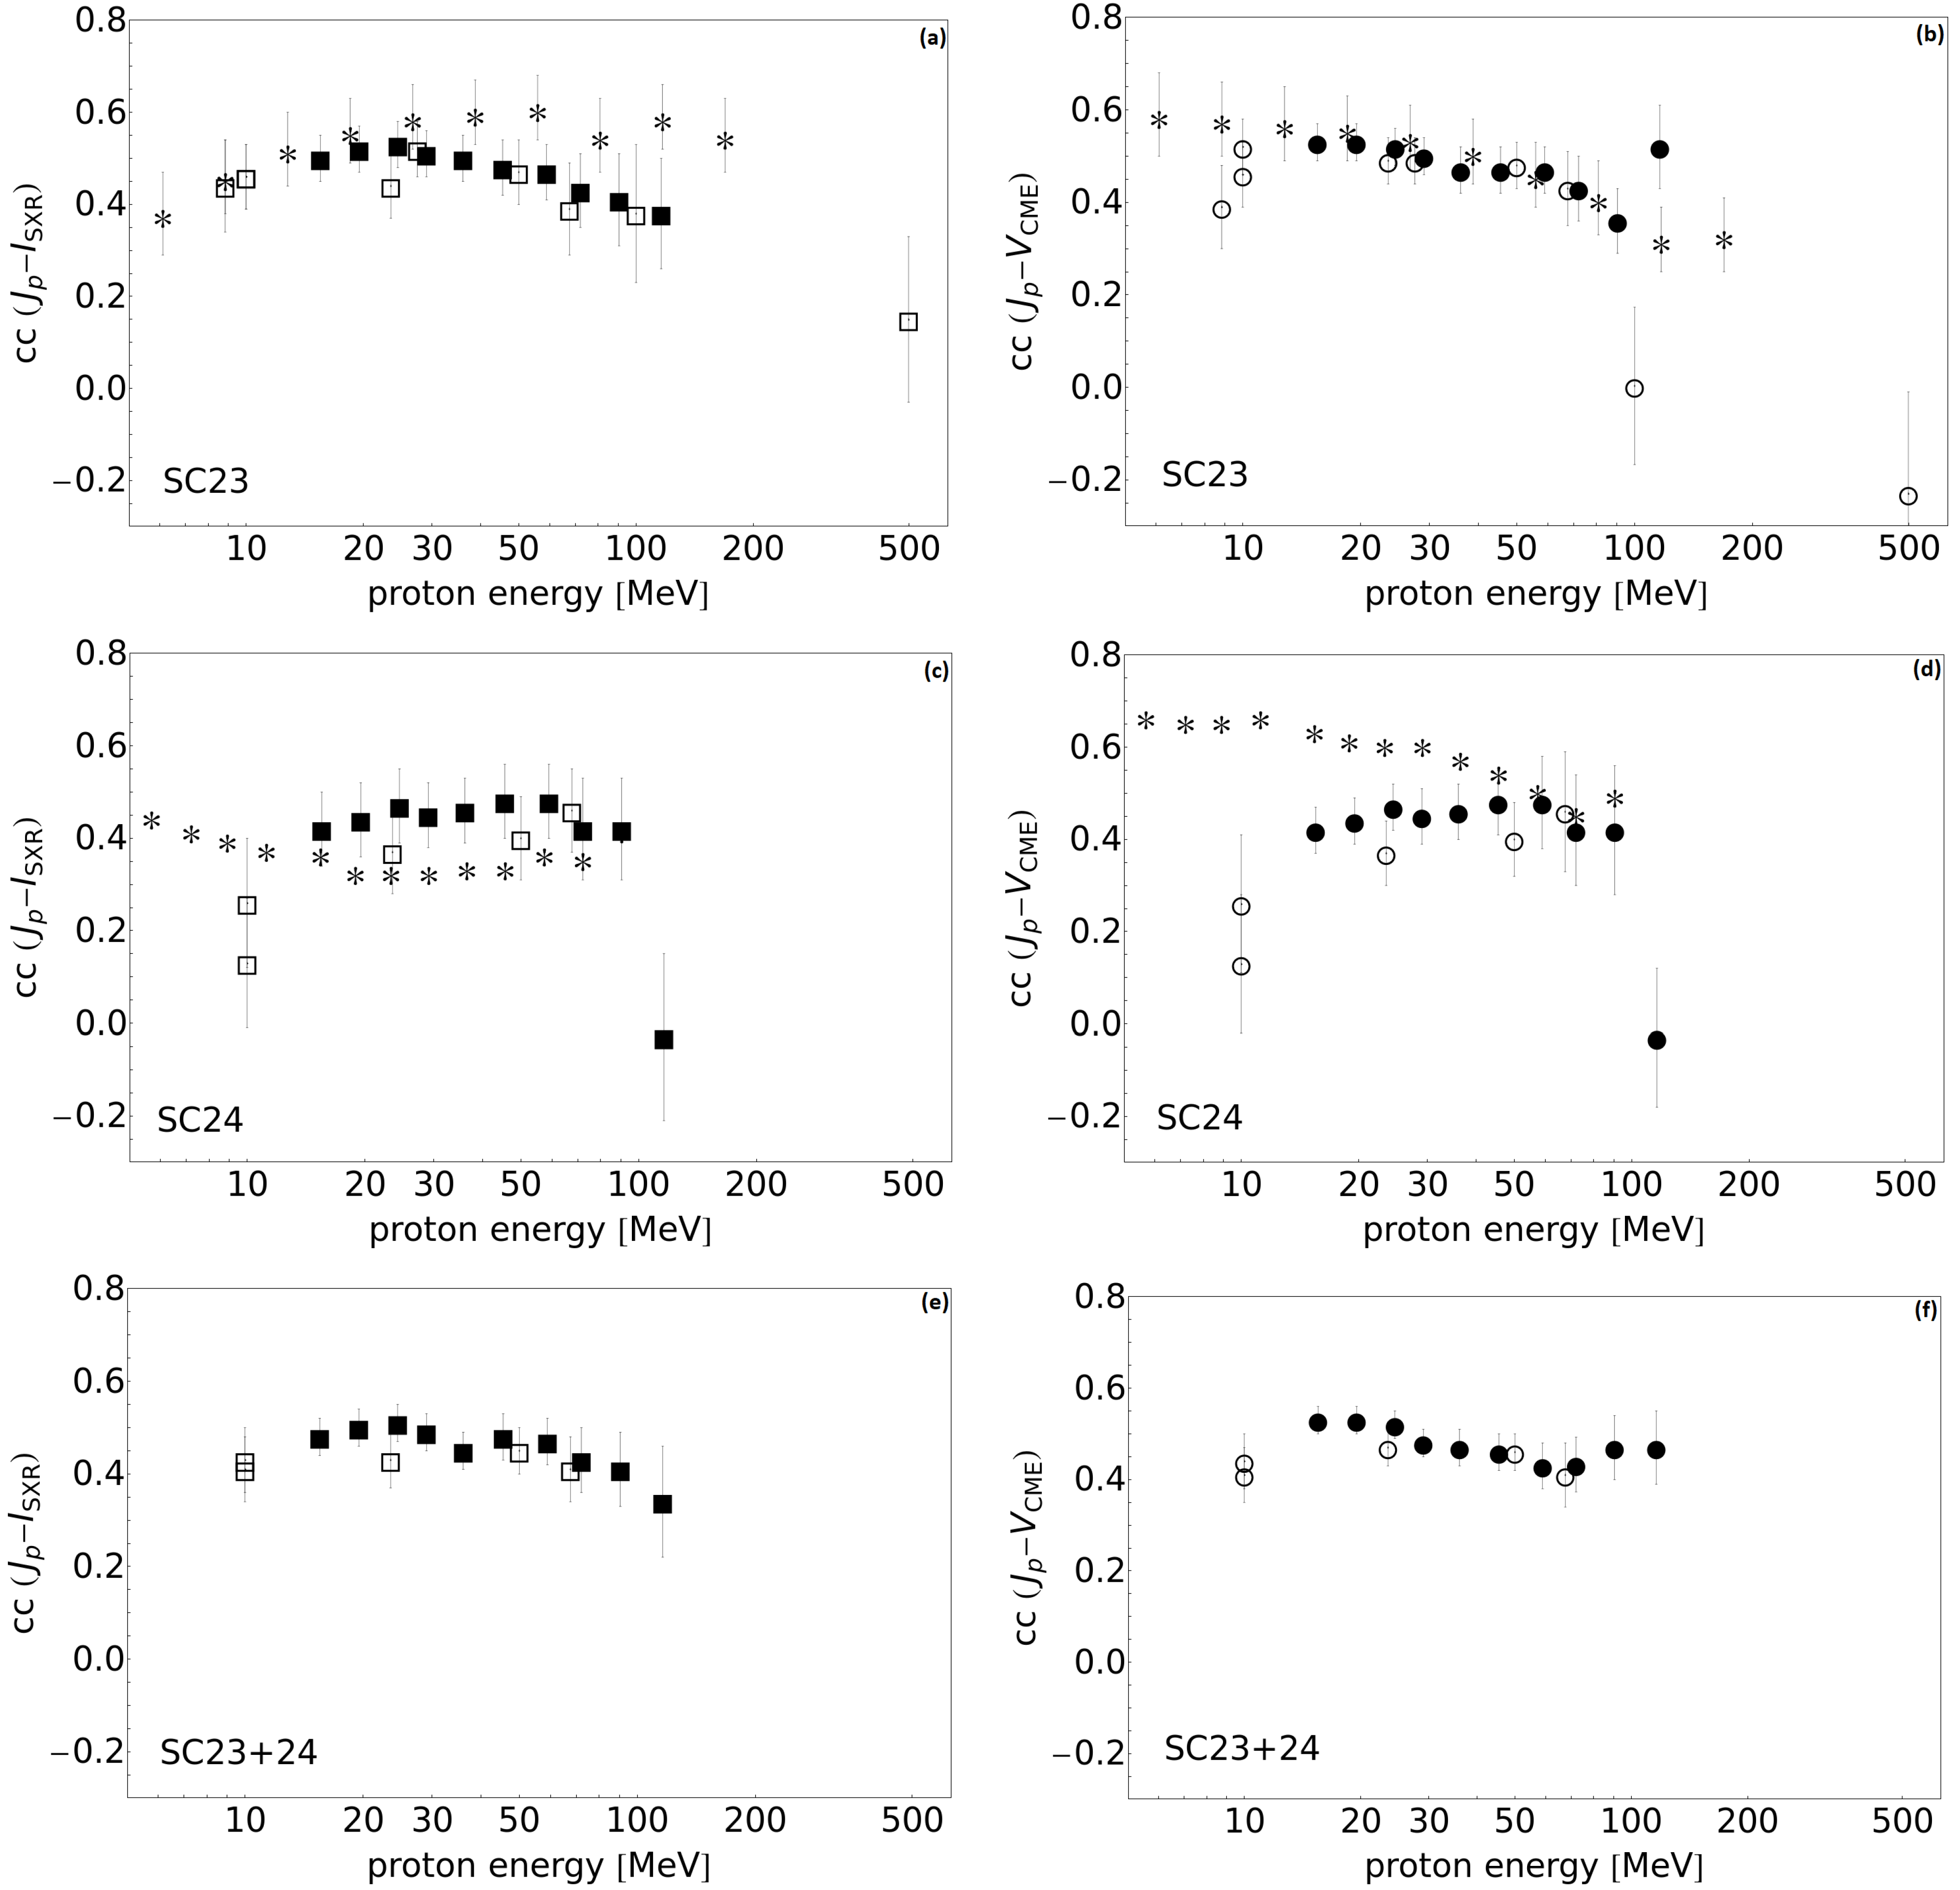
For better inspection of the trends, we plot these correlation coefficients as a function of the SEP energy in Figure 4. With filled symbols (squares for the SFs and dots for the CMEs) we show the 10 HED results, whereas with empty symbols we show the correlations from the other nine SEP lists considered by us. We point out that the values >10, >100 and >500 MeV (with empty symbols) are the integrated SEP fluxes (in pfu) and should be considered with caution when comparing these to the results of the remaining peak intensities.
Furthermore, we add a set of previously calculated correlations with a star symbol. Namely, in SC23 (top plots), we add the first ever reported by [36] energy-dependent correlations together with their uncertainties. The values for the SFs can be directly compared, however, log 10 -linear correlations were used by [36] for the CME case and according to Table A2 these values should be considered as upper limits. Nevertheless, the CME results show a consistent match with a well-defined declining trend with the increase in SEP energy. The behavior with the SF class shows a slightly rising and then a declining trend, although a rising trend ending in a plateau is reported by [36] (the stars in the plot). Considering the uncertainty of the correlations, no difference can be claimed between our and [36] results until about 100 MeV SEP energy, when the trends diverge. A distinct drop in the correlation coefficients is obtained for energies >100 and >500 MeV; however, we note that despite the large uncertainty (mostly due to the very small event size) the values are statistically smaller only for the CME speed.
In SC24 (middle plots of Figure 4), we add the correlations reported by [30] (no uncertainty was provided though), despite the fact that these are the energy counterparts of the [29]-list and constitute no original catalog. This is also the reason why the event number at the low-energy channels is much lower (68) compared to ours (217 for HED01, Table A1). Nevertheless, due to the lack of other energy-dependent SEP catalogs in SC24, we will use [30] as a first approximation. Our results show relatively flat trends for both types of relationship (between the SEP fluxed and the SFs/CMEs), consistent with the reports by [30] for the correlation with the SF class, Figure 4c. A clear discrepancy is noticed at low SEP energies for the correlation with the CME speed, Figure 4d. In general, in SC24, the values at the lowest (>10 MeV) and highest (116 MeV/ HED10) energy channels do not follow the general trends. Finally, the results for the correlations with the SF class and CME speed over SC23+24 (bottom plots) show no statistically significant dependence as a function of SEP energy.

3.3. Partial Correlations

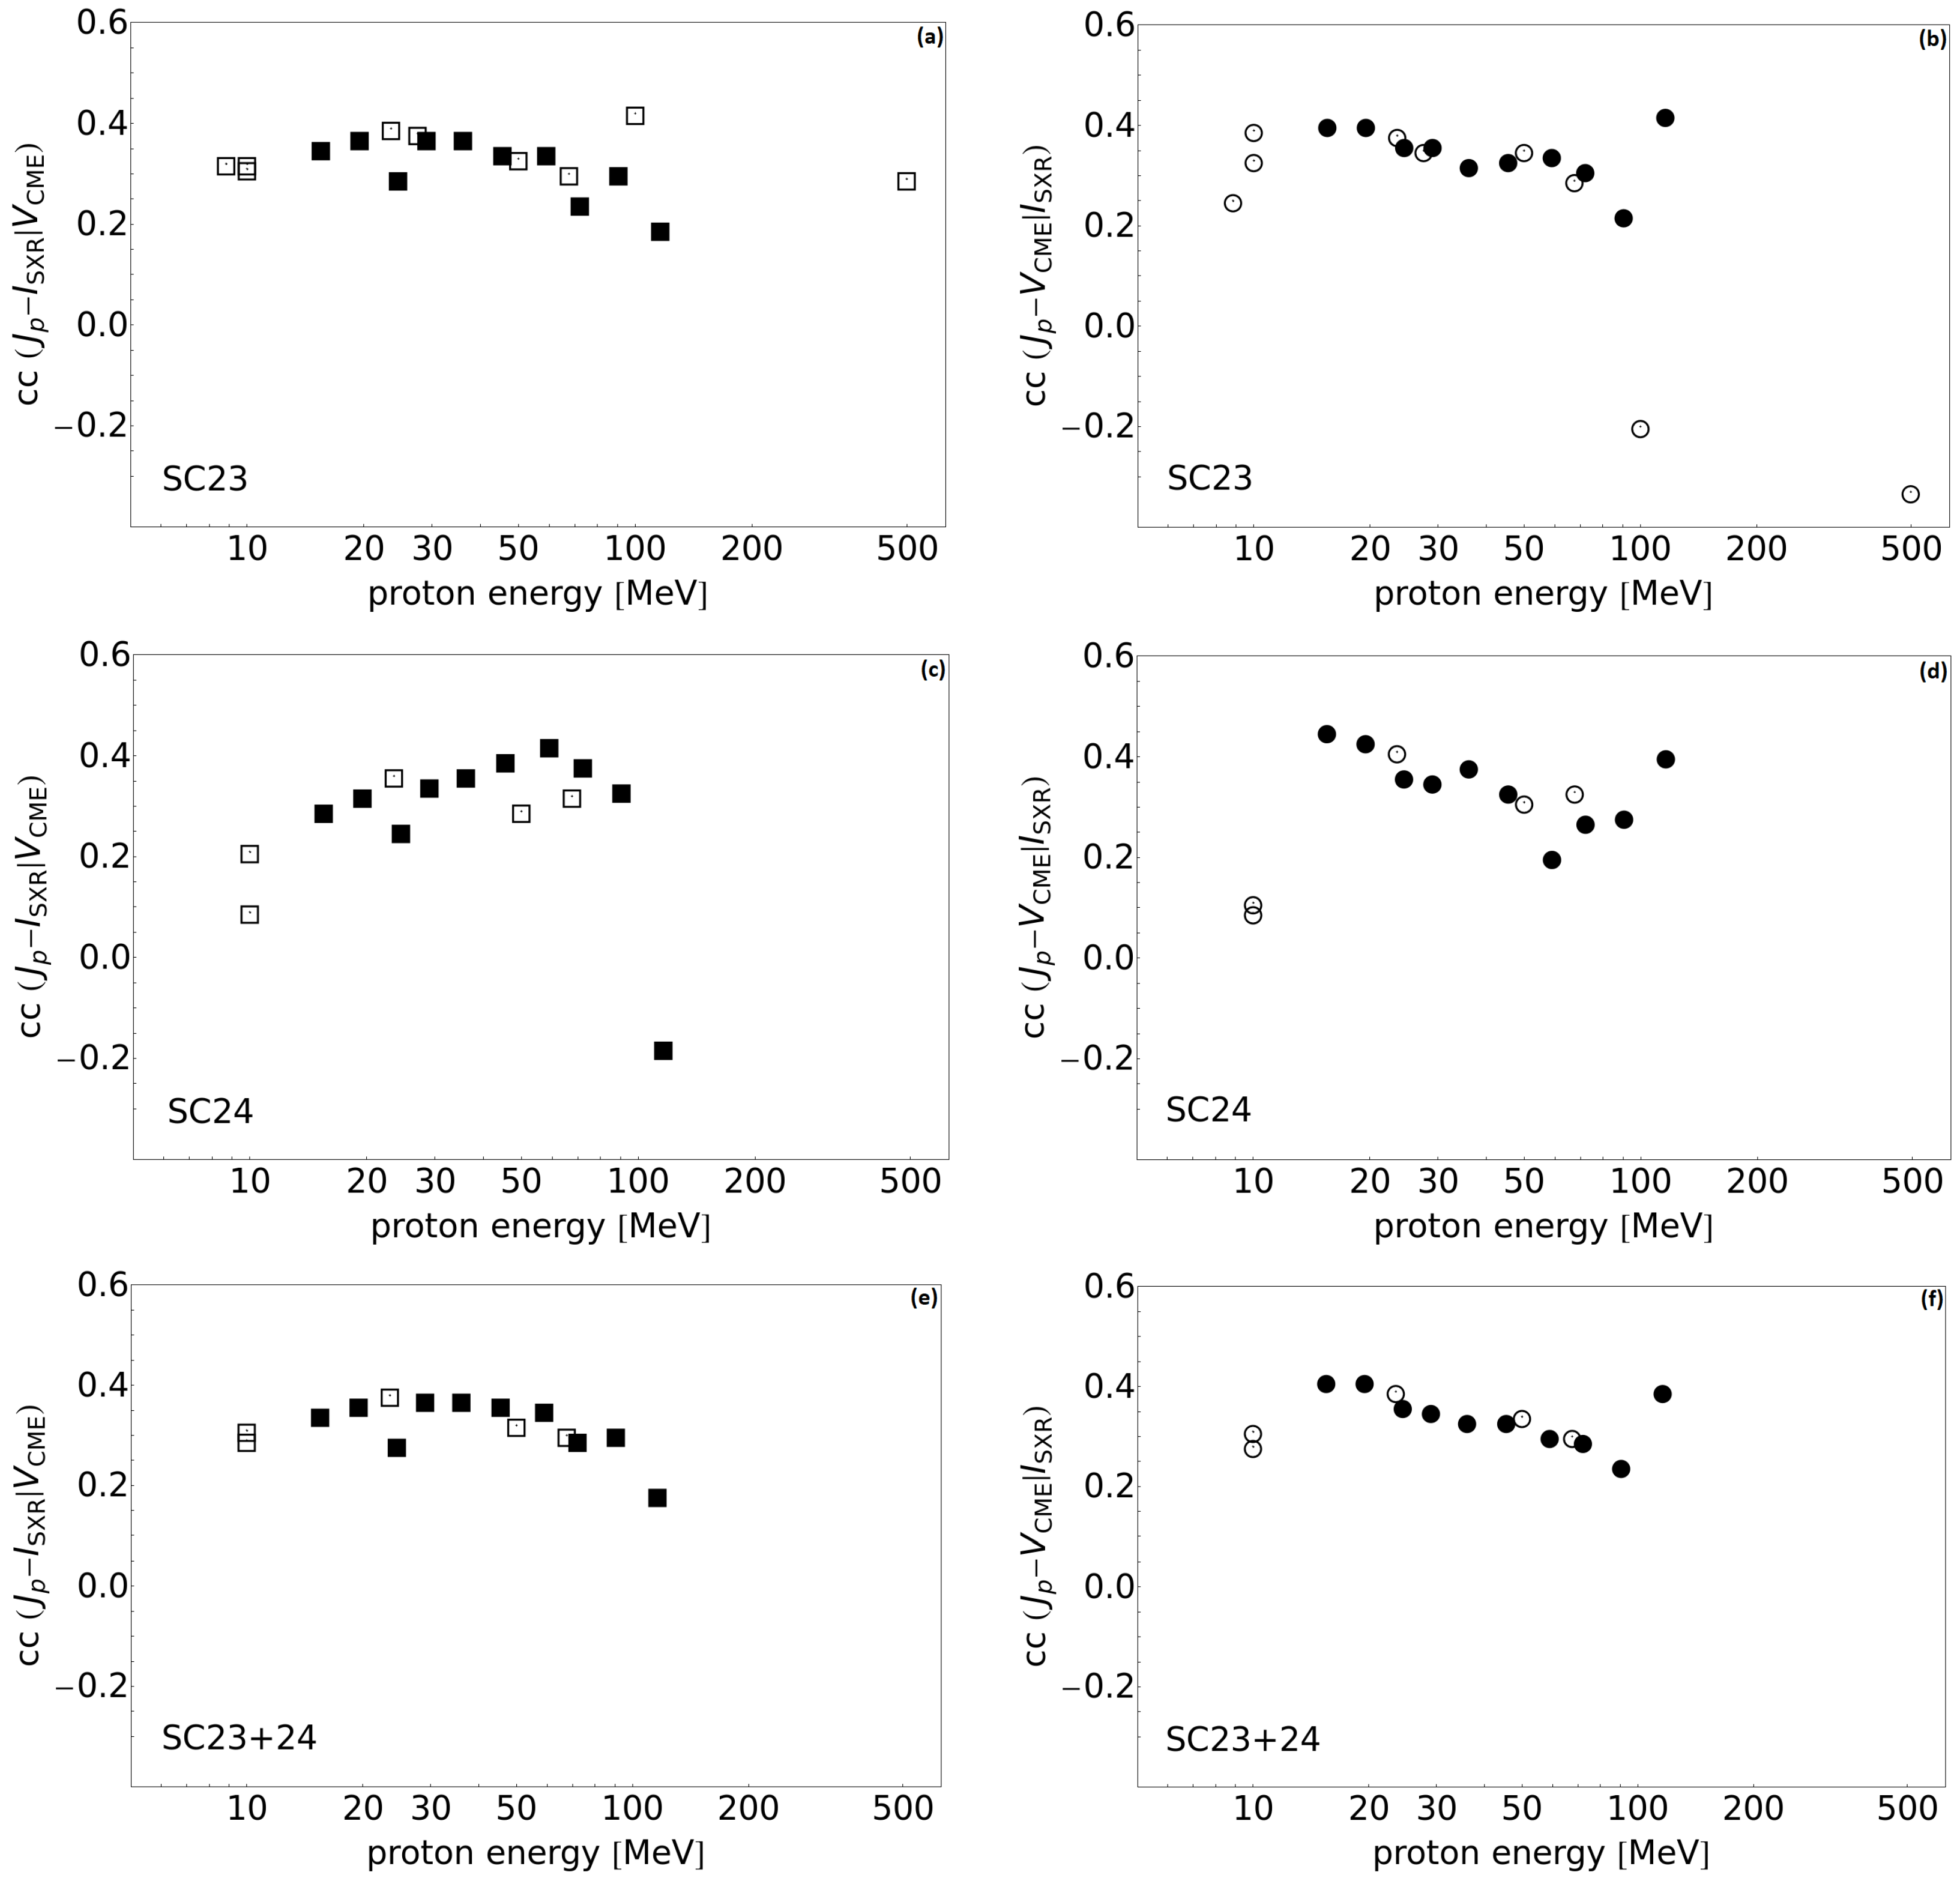
Finally, we present the correlations after excluding the interdependence between the parameters of the solar origin. Namely, in the calculation of the J p I SXR we remove the influence of V CME and vice versa. The partial correlation coefficients are summarized in Table 2.
After a comparison of the Pearson and partial correlations, we confirm that the latter have smaller values, from just a few to over 10%. No uncertainty range is provided for the partial ones, as each of these is calculated from three linear correlations, which with its own error range. If we adopt the largest error among the three to be the uncertainty of the partial correlation, as conducted in an earlier study [33], the differences with the Pearson correlations will be within the statistical significance for the majority of the cases or marginally different for selected energy channels. The results from Table 2 are visualized in Figure 5 for completeness.

4. Discussion

In order to conduct a quantitative assessment of the physical relationship between the SEP events and their solar origin, linear (Pearson) correlation coefficients are usually calculated between the parameters of the SEP events (e.g., peak proton intensity (or flux) or/and their integrated values, termed fluence), and the SFs (class, fluence) or CMEs (projected speed, AW, kinetic energy). It was proposed by [42] for the first time the calculation of uncertainty values of the correlations in terms of the bootstrapping method, which proved to be more practical than using p-values of the null hypothesis [43].
In the majority of previous statistical studies, the research focused on a single energy channel and provided a limited sampling of the association trends. For the first time, [36] explored the statistical correlations over a wide energy range (10–100 MeV) and from the same instrumentation (SEPEM catalog based on GOES data). The log 10 - log 10 correlations with SF class showed rising trends with SEP energy, whereas a decline was demonstrated for the log 10 -linear correlations with the CME speed. The results covered data in SC23. A physics-based explanation was proposed for their finding, namely the acceleration of the low-energy protons is dominated by shock waves, whereas high-energy protons are energized by SF-driven magnetic reconnection.
A continuation of the above analysis covering SC24 is still missing. An alternative catalog, based on the SOHO/ERNE instrument and accompanied by the statistical study over a limited energy coverage (55–80 MeV) was presented by [29]. The latter SEP list was used as a starting point by [30] who presented multi-energy correlation analyses. Since their analyses used a high-energy SEP catalog and not the data in each respective channel, the study by [30] cannot be considered as a complete catalog. This is the reason why, for example, a number of SEP events at the lower energies were missed. Despite these limitations, the authors reported a decline in the correlations with an increase in the SEP energy. In both reports, the correlation with the CME speed was in log 10 -linear format. We used the energy-dependent result over SC24 as a proxy while comparing it with our findings.
Our study presents the compilation of a comprehensive SEP catalog from SOHO/ERNE based on 10 HED energy channels and a statistical analysis that covers SC23, SC24 and SC23+24. Thus, for the first time, our statistical results can be directly compared to the above findings in the respective SC. Furthermore, we complemented the HED channels with the reported proton intensity from nine additional catalogs. As previously shown by [37], the SOHO/ERNE saturation effects (which affect the highest intensity proton events) cannot modify the correlation analyses beyond the statistical uncertainties. This is why we adopted the SOHO/ERNE proton data as reported.
Based on the performed analyses, we obtained flat-to-declining trends of the log 10 - log 10 correlation coefficients with the increase in the SEP energy, both with the SF class and CME speed. For completeness, for the CMEs we calculated also log 10 -linear coefficients which are larger than the log 10 - log 10 . The difference, however, is small (up to 6%) and within the uncertainty range of the correlations, thus both versions of the coefficients can be directly compared (Table 1 and Table A2).
After taking into account the uncertainties of the correlation coefficients, we obtain marginally statistically significant differences (e.g., decrease) only at the lowest and highest energy ends of the SEP distribution. The source of the differences in the correlations could be sought either in the very small event size (38 for >100 MeV and 25 for >500 MeV in SC23) or in the over-representation of SEP events with hard energy spectra at high energies (e.g., large intensities at high energies). In addition, the correlation results at energies >10 MeV and above 100s MeV are based on proton fluences and not fluxes.
For the remaining SEP energies, we obtained flat-to-declining trends in the three periods of interest. There is a partial agreement with [36] for the CME but not for the SF trends (in SC23) and vice versa with [30] (in SC24). Declining trends for both were previously shown for SEP energy >100 MeV by [34] for the classical and partial correlations with SF class and CME speed (also covering SC23 only). These authors claimed that the SF fluence is the unique parameter that can identify the positive effects of the SF (acceleration) on the SEP peak intensity. As also shown by our study, over a wide energy range (∼20–100 MeV) and based solely on statistical analyses of selected parameters (e.g., SF class and CME speed), no clear preference can be deduced on the solar driver. Thus alternative approaches are needed, among these, an improved modeling and/or novel observations closer to the Sun. A calculation of the (onset-to-peak) SOHO/ERNE fluences is under consideration and the results will be reported elsewhere.
The onset and peak times, peak intensity and solar origin association at all SOHO/ERNE HED01-10 channels are prepared by us into a catalog planned to be publicly available and supported in the future via the online platform: https://catalogs.astro.bas.bg/ (accessed on 19 July 2024).

Supplementary Materials

The following supporting information can be downloaded at: https://www.mdpi.com/article/10.3390/atmos15081016/s1. Figure S1: Yearly distribution of the SOHO/ERNE SEP events. Figure S2: Peak intensity distribution of the SOHO/ERNE SEP events. Figure S3: Peak intensity distribution of the SOHO/ERNE SEP events. Figure S4: Class distribution of the SEP-associated SF events in SC23+24. Figure S5: Class distribution of the SEP-associated SF events in SC23+24. Figure S6: Speed distribution of the SEP-associated CME events in SC23+24. Figure S7: Speed distribution of the SEP-associated CME events in SC23+24. Figure S8: AW distribution of the SEP-associated CME events in SC23+24. Figure S9: AW distribution of the SEP-associated CME events in SC23+24.

Author Contributions

Conceptualization, R.M.; methodology, R.M. and S.W.S.; software, R.M. and S.W.S.; validation, R.M.; formal analysis, all; writing—original draft preparation, R.M.; writing—review and editing, all; visualization, R.M. and S.W.S.; funding acquisition, all. All authors have read and agreed to the published version of the manuscript.

Funding

This research was supported by SCOSTEP/PRESTO project ‘On the relationship between major space weather phenomena in solar cycles 23 and 24’; by the Bulgarian-Egyptian inter-academy project ‘On space effects at near Earth environment—from remote observations and in situ forecasting to impacts on satellites’ (2022–2024), Bulgarian Academy of Sciences IC-EG/08/2022-2024 and Egyptian Academy of Scientific Research and Technology (ASRT)/NRIAG (ASRT/BAS/2022-2023/10116) and by the Bulgarian-Serbian inter-academy project ‘Active Events on The Sun. Catalogs of Proton Events and Electron Signatures in X-Ray, UV and Radio Diapason. Influence of Collisions on Optical Properties of Dense Hydrogen Plasma’ (2023–2025).

Institutional Review Board Statement

Not applicable.

Informed Consent Statement

Not applicable.

Data Availability Statement

Acknowledgments

R.M. thanks Eino Valtonen for providing the SOHO/ERNE data used in this study.

Conflicts of Interest

The authors declare no conflicts of interest. The funders had no role in the design of the study; in the collection, analyses, or interpretation of data; in the writing of the manuscript; or in the decision to publish the results.

Abbreviations

The following abbreviations are used in this manuscript:
ARactive region
AWangular width
CDAWCoordinated Data Analysis Workshop
CMEcoronal mass ejection
DPFUdifferential proton flux unit
EMelectromagnetic
EPACT Energetic Particles: Acceleration, Composition and Transport
EPHINElectron Proton Helium Instrument
ERNEEnergetic and Relativistic Nuclei and Electron
ESPenergetic storm particle
GOESGeostationary Operational Environmental Satellite
GLEground level enhancement
HEDhigh-energy detector
IMPInternational Monitoring Platform
IPinterplanetary
NOAANational Oceanic and Atmospheric Administration
SCsolar cycle
SEPsolar energetic proton
SEPEMSolar Energetic Particle Environment Modelling
SFsolar flare
SOHOSolar and Heliospheric Observatory
SXRsoft X-ray
SWspace weather

Appendix A. Properties of the Solar Origin of SEP Events

Table A1 lists the mean/median values of the SEP peak intensities, the SF class and the CME speed of the respective SEP-associated solar origin. The high-energy protons are associated with stronger SFs and faster CMEs, compared to the low-energy ones. The tendency is kept in all three periods of interest.
Table A1. Mean/median values for the SOHO/ERNE SEP intensity (in DPFU) and SF class and CME speed (in km s 1 ) of the SEP-associated solar origin for the three time periods. The event size is given in parentheses.
Channel/
MeV Range
SEP IntensitySF ClassCME Speed
SC23 SC24 SC23+24 SC23 SC24 SC23+24 SC23 SC24 SC23+24
HED01/
14–17
4.6/0.03 (442)0.58/0.032 (217)3.3/0.03 (659)M9.8/M1.7 (295)M5.0/M1.6 (130)M8.3/M1.6 (447)1030/899 (340)992/919 (171)1017/901 (511)
HED02/
17–22
0.57/0.02 (437)0.36/0.010 (217)0.5/0.02 (653)M9.8/M1.7 (294)M5.0/M1.7 (129)M8.3/M1.7 (423)1032/899 (339)994/920 (170)1019/903 (509)
HED03/
21–28
0.27/0.008 (421)0.17/0.007 (211)0.24/0.007 (632)M9.9/M1.7 (289)M5.1/M1.7 (126)M8.5/M1.7 (415)1041/906 (330)1003/923 (167)1028/916 (497)
HED04/
26–32
0.18/0.008 (365)0.11/0.005 (185)0.16/0.006 (550)X1.1/M2.2 (260)M5.4/M1.8 (116)M9.0/M1.9 (376)1086/957 (292)1023/948 (152)1064/953 (444)
HED05/
32–40
0.12/0.006 (330)0.09/0.005 (154)0.12/0.006 (484)X1.2/M2.4 (236)M6.0/M2.0 (100)X1.0/M2.2 (336)1122/1042 (268)1051/975 (132)1098/991 (400)
HED06/
40–51
0.09/0.005 (289)0.06/0.004 (137)0.09/0.004 (426)X1.3/M3.0 (211)M6.4/M2.1 (93)X1.1/M2.6 (304)1152/1081 (239)1084/997 (124)1128/1053 (363)
HED07/
51–67
0.06/0.004 (223)0.05/0.004 (100)0.06/0.004 (323)X1.5/M3.8 (174)M7.8/M2.4 (69)X1.3/M3.5 (243)1203/1136 (189)1142/1119 (92)1183/1120 (281)
HED08/
64–80
0.04/0.003 (144)0.02/0.003 (52)0.03/0.003 (196)X2.1/M6.0 (117)X1.1/M5.1 (42)X1.8/M5.6 (159)1314/1199 (129)1190/1159 (50)1279/1199 (179)
HED09/
80–101
0.02/0.002 (114)0.007/0.002 (41)0.02/0.002 (155)X2.3/M7.5 (94)X1.2/M5.3 (33)X2.1/M7.1 (127)1383/1267 (104)1279/1261 (40)1354/1261 (144)
HED10/
101–131
2.42/0.009 (55)0.006/0.002 (20)1.8/0.003 (75)X3.6/X1.4 (52)X1.9/M7.9 (17)X3.2/X1.1 (69)1566/1444 (52)1431/1418 (19)1530/1443 (71)

Appendix B. Pearson Correlation Coefficients with the Projected Value of the CME Speed

Table A2. Pearson correlations between the log 10 value of the SEP flux and the reported (linear) value for the CME speed and the magnitude of the difference between the log 10 -linear and the double log 10 values reported in Table Figure 4. The round-off error is 1%.
Channel/MeV Range log 10 J p V CME Difference (%)
SC23 SC24 SC23+24 SC23 SC24 SC23+24
SEPEM/7–10 0 . 41 ± 0.10 --2--
NOAA/>10 0 . 55 ± 0.06 0 . 17 ± 0.16 0 . 47 ± 0.06 313
CDAW/>10 0 . 49 ± 0.07 0 . 15 ± 0.18 0 . 44 ± 0.06 303
HED01/14–17 0 . 57 ± 0.04 0 . 53 ± 0.05 0 . 56 ± 0.03 403
HED02/17–22 0 . 57 ± 0.04 0 . 53 ± 0.06 0 . 56 ± 0.03 313
EPACT-l/19–28 0 . 53 ± 0.06 0 . 46 ± 0.08 0 . 51 ± 0.05 424
HED03/21–28 0 . 56 ± 0.04 0 . 53 ± 0.05 0 . 55 ± 0.03 323
Cane-list/25–30 0 . 52 ± 0.05 --3--
HED04/26–32 0 . 54 ± 0.04 0 . 48 ± 0.06 0 . 52 ± 0.04 434
HED05/32–40 0 . 51 ± 0.05 0 . 49 ± 0.07 0 . 50 ± 0.04 423
HED06/40–51 0 . 51 ± 0.05 0 . 47 ± 0.07 0 . 50 ± 0.04 434
EPACT-h/28–72 0 . 52 ± 0.06 0 . 44 ± 0.08 0 . 50 ± 0.05 434
HED07/51–64 0 . 51 ± 0.05 0 . 36 ± 0.10 0 . 47 ± 0.05 433
SEPServer/55–80 0 . 44 ± 0.08 0 . 38 ± 0.14 0 . 42 ± 0.07 101
HED08/64–80 0 . 44 ± 0.07 0 . 47 ± 0.12 0 . 44 ± 0.06 141
HED09/80–101 0 . 36 ± 0.08 0 . 40 ± 0.14 0 . 37 ± 0.07 020
HED10/101–131 0 . 50 ± 0.11 0 . 42 ± 0.16 0 . 48 ± 0.10 251
GOES/>100 0 . 05 ± 0.16 --5--
EPHIN/>500 0 . 29 ± 0.0 --6--

References

  1. Charbonneau, P. Dynamo models of the solar cycle. Living Rev. Sol. Phys. 2020, 17, 4. [Google Scholar] [CrossRef]
  2. Hathaway, D.H. The Solar Cycle. Living Rev. Sol. Phys. 2015, 12, 4. [Google Scholar] [CrossRef]
  3. Miteva, R.; Samwel, S.W.; Costa-Duarte, M.V.; Malandraki, O.E. Solar cycle dependence of Wind/EPACT protons, solar flares and coronal mass ejections. Sun Geosph. 2017, 12, 11–19. [Google Scholar]
  4. Fletcher, L.; Dennis, B.R.; Hudson, H.S.; Krucker, S.; Phillips, K.; Veronig, A.; Battaglia, M.; Bone, L.; Caspi, A.; Chen, Q.; et al. An Observational Overview of Solar Flares. Space Sci. Rev. 2011, 159, 19–106. [Google Scholar] [CrossRef]
  5. Webb, D.F.; Howard, T.A. Coronal Mass Ejections: Observations. Living Rev. Sol. Phys. 2012, 9, 3. [Google Scholar] [CrossRef]
  6. Benz, A.O. Flare Observations. Living Rev. Sol. Phys. 2017, 14, 2. [Google Scholar] [CrossRef]
  7. Jang, S.; Moon, Y.J.; Kim, R.S.; Lee, H.; Cho, K.S. Comparison between 2D and 3D Parameters of 306 Front-side Halo CMEs from 2009 to 2013. Astrophys. J. 2016, 821, 95. [Google Scholar] [CrossRef]
  8. Verbeke, C.; Mays, M.L.; Kay, C.; Riley, P.; Palmerio, E.; Dumbović, M.; Mierla, M.; Scolini, C.; Temmer, M.; Paouris, E.; et al. Quantifying errors in 3D CME parameters derived from synthetic data using white-light reconstruction techniques. Adv. Space Res. 2023, 72, 5243–5262. [Google Scholar] [CrossRef]
  9. Pontin, D.I.; Priest, E.R. Magnetic reconnection: MHD theory and modelling. Living Rev. Sol. Phys. 2022, 19, 1. [Google Scholar] [CrossRef]
  10. Lakhina, G.S.; Tsurutani, B.T. Geomagnetic storms: Historical perspective to modern view. Geosci. Lett. 2016, 3, 5. [Google Scholar] [CrossRef]
  11. Desai, M.; Giacalone, J. Large gradual solar energetic particle events. Living Rev. Sol. Phys. 2016, 13, 3. [Google Scholar] [CrossRef]
  12. Kilpua, E.; Koskinen, H.E.J.; Pulkkinen, T.I. Coronal mass ejections and their sheath regions in interplanetary space. Living Rev. Sol. Phys. 2017, 14, 5. [Google Scholar] [CrossRef] [PubMed]
  13. Klein, K.L.; Dalla, S. Acceleration and Propagation of Solar Energetic Particles. Space Sci. Rev. 2017, 212, 1107–1136. [Google Scholar] [CrossRef]
  14. Klein, K.L. Radio astronomical tools for the study of solar energetic particles I. Correlations and diagnostics of impulsive acceleration and particle propagation. Front. Astron. Space Sci. 2021, 7, 105. [Google Scholar] [CrossRef]
  15. Samwel, S.W.; Miteva, R. Catalogue of in situ observed solar energetic electrons from ACE/EPAM instrument. Mon. Not. R. Astron. Soc. 2021, 505, 5212–5227. [Google Scholar] [CrossRef]
  16. Torsti, J.; Valtonen, E.; Lumme, M.; Peltonen, P.; Eronen, T.; Louhola, M.; Riihonen, E.; Schultz, G.; Teittinen, M.; Ahola, K.; et al. Energetic Particle Experiment ERNE. Sol. Phys. 1995, 162, 505–531. [Google Scholar] [CrossRef]
  17. von Rosenvinge, T.T.; Barbier, L.M.; Karsch, J.; Liberman, R.; Madden, M.P.; Nolan, T.; Reames, D.V.; Ryan, L.; Singh, S.; Trexel, H.; et al. The Energetic Particles: Acceleration, Composition, and Transport (EPACT) investigation on the WIND spacecraft. Space Sci. Rev. 1995, 71, 155–206. [Google Scholar] [CrossRef]
  18. Richardson, I.G.; von Rosenvinge, T.T.; Cane, H.V.; Christian, E.R.; Cohen, C.M.S.; Labrador, A.W.; Leske, R.A.; Mewaldt, R.A.; Wiedenbeck, M.E.; Stone, E.C. > 25 MeV Proton Events Observed by the High Energy Telescopes on the STEREO A and B Spacecraft and/or at Earth During the First ∼ Seven Years of the STEREO Mission. Sol. Phys. 2014, 289, 3059–3107. [Google Scholar] [CrossRef]
  19. Papaioannou, A.; Malandraki, O.E.; Dresing, N.; Heber, B.; Klein, K.L.; Vainio, R.; Rodríguez-Gasén, R.; Klassen, A.; Nindos, A.; Heynderickx, D.; et al. SEPServer catalogues of solar energetic particle events at 1 AU based on STEREO recordings: 2007–2012. Astron. Astrophys. 2014, 569, A96. [Google Scholar] [CrossRef]
  20. Paassilta, M.; Papaioannou, A.; Dresing, N.; Vainio, R.; Valtonen, E.; Heber, B. Catalogue of {>}55 MeV Wide-longitude Solar Proton Events Observed by SOHO, ACE, and the STEREOs at {≈} 1 AU During 2009–2016. Sol. Phys. 2018, 293, 70. [Google Scholar] [CrossRef]
  21. Miroshnichenko, L.I.; Nymmik, R.A. Extreme fluxes in solar energetic particle events: Methodological and physical limitations. Radiat. Meas. 2014, 61, 6–15. [Google Scholar] [CrossRef]
  22. Veselinović, N.; Savić, M.; Dragić, A.; Maletić, D.; Banjanac, R.; Joković, D.; Knežević, D.; Udovičić, V. Correlation analysis of solar energetic particles and secondary cosmic ray flux. Eur. Phys. J. D 2021, 75, 173. [Google Scholar] [CrossRef]
  23. Schwenn, R. Space Weather: The Solar Perspective. Living Rev. Sol. Phys. 2006, 3, 2. [Google Scholar] [CrossRef]
  24. Pulkkinen, T. Space Weather: Terrestrial Perspective. Living Rev. Sol. Phys. 2007, 4, 1. [Google Scholar] [CrossRef]
  25. Temmer, M. Space weather: The solar perspective. Living Rev. Sol. Phys. 2021, 18, 4. [Google Scholar] [CrossRef]
  26. Semkova, J.; Koleva, R.; Benghin, V.; Dachev, T.; Matviichuk, Y.; Tomov, B.; Krastev, K.; Maltchev, S.; Dimitrov, P.; Mitrofanov, I.; et al. Charged particles radiation measurements with Liulin-MO dosimeter of FREND instrument aboard ExoMars Trace Gas Orbiter during the transit and in high elliptic Mars orbit. Icarus 2018, 303, 53–66. [Google Scholar] [CrossRef]
  27. Whitman, K.; Egeland, R.; Richardson, I.G.; Allison, C.; Quinn, P.; Barzilla, J.; Kitiashvili, I.; Sadykov, V.; Bain, H.M.; Dierckxsens, M.; et al. Review of Solar Energetic Particle Prediction Models. Adv. Space Res. 2023, 72, 5161–5242. [Google Scholar] [CrossRef]
  28. Vainio, R.; Valtonen, E.; Heber, B.; Malandraki, O.E.; Papaioannou, A.; Klein, K.L.; Afanasiev, A.; Agueda, N.; Aurass, H.; Battarbee, M.; et al. The first SEPServer event catalogue ˜68-MeV solar proton events observed at 1 AU in 1996–2010. J. Space Weather. Space Clim. 2013, 3, A12. [Google Scholar] [CrossRef]
  29. Paassilta, M.; Raukunen, O.; Vainio, R.; Valtonen, E.; Papaioannou, A.; Siipola, R.; Riihonen, E.; Dierckxsens, M.; Crosby, N.; Malandraki, O.; et al. Catalogue of 55–80 MeV solar proton events extending through solar cycles 23 and 24. J. Space Weather. Space Clim. 2017, 7, A14. [Google Scholar] [CrossRef]
  30. Biji, M.S.; Prince, P.R. A study of the characteristic properties of SEP events observed by SOHO ERNE during solar cycle 24. Adv. Space Res. 2022, 69, 2902–2920. [Google Scholar] [CrossRef]
  31. Crosby, N.; Heynderickx, D.; Jiggens, P.; Aran, A.; Sanahuja, B.; Truscott, P.; Lei, F.; Jacobs, C.; Poedts, S.; Gabriel, S.; et al. SEPEM: A tool for statistical modeling the solar energetic particle environment. Space Weather 2015, 13, 406–426. [Google Scholar] [CrossRef]
  32. Cane, H.V.; Richardson, I.G.; von Rosenvinge, T.T. A study of solar energetic particle events of 1997-2006: Their composition and associations. J. Geophys. Res. (Space Phys.) 2010, 115, A08101. [Google Scholar] [CrossRef]
  33. Miteva, R.; Samwel, S.W.; Costa-Duarte, M.V. The Wind/EPACT Proton Event Catalog (1996 - 2016). Sol. Phys. 2018, 293, 27. [Google Scholar] [CrossRef]
  34. Le, G.M.; Li, C.; Zhang, X.F. Dependence of E ≥ 100 MeV protons on the associated flares and CMEs. Res. Astron. Astrophys. 2017, 17, 073. [Google Scholar] [CrossRef]
  35. Kühl, P.; Dresing, N.; Heber, B.; Klassen, A. Solar Energetic Particle Events with Protons Above 500 MeV between 1995 and 2015 Measured with SOHO/EPHIN. Sol. Phys. 2017, 292, 10. [Google Scholar] [CrossRef]
  36. Dierckxsens, M.; Tziotziou, K.; Dalla, S.; Patsou, I.; Marsh, M.S.; Crosby, N.B.; Malandraki, O.; Tsiropoula, G. Relationship between Solar Energetic Particles and Properties of Flares and CMEs: Statistical Analysis of Solar Cycle 23 Events. Sol. Phys. 2015, 290, 841–874. [Google Scholar] [CrossRef]
  37. Miteva, R.; Samwel, S.W.; Zabunov, S.; Dechev, M. On the flux saturation of SOHO/ERNE proton events. Bulg. Astron. J. 2020, 33, 99. [Google Scholar]
  38. Paassilta, M.; Vainio, R.; Papaioannou, A.; Raukunen, O.; Barcewicz, S.; Anastasiadis, A. Magnetic connectivity and solar energetic proton event intensity profiles at deka-MeV energy. Adv. Space Res. 2023, 71, 1840–1854. [Google Scholar] [CrossRef]
  39. Miteva, R. On the solar origin of in situ observed energetic protons. Bulg. Astron. J. 2019, 31, 51. [Google Scholar]
  40. Wall, J.V.; Jenkins, C.R. Practical Statistics for Astronomers; Cambridge University Press: Cambridge, UK, 2003; Volume 3. [Google Scholar]
  41. Miteva, R. On extreme space weather events: Solar eruptions, energetic protons and geomagnetic storms. Adv. Space Res. 2020, 66, 1977–1991. [Google Scholar] [CrossRef]
  42. Trottet, G.; Samwel, S.; Klein, K.L.; Dudok de Wit, T.; Miteva, R. Statistical Evidence for Contributions of Flares and Coronal Mass Ejections to Major Solar Energetic Particle Events. Sol. Phys. 2015, 290, 819–839. [Google Scholar] [CrossRef]
  43. Papaioannou, A.; Sandberg, I.; Anastasiadis, A.; Kouloumvakos, A.; Georgoulis, M.K.; Tziotziou, K.; Tsiropoula, G.; Jiggens, P.; Hilgers, A. Solar flares, coronal mass ejections and solar energetic particle event characteristics. J. Space Weather Space Clim. 2016, 6, A42. [Google Scholar] [CrossRef]
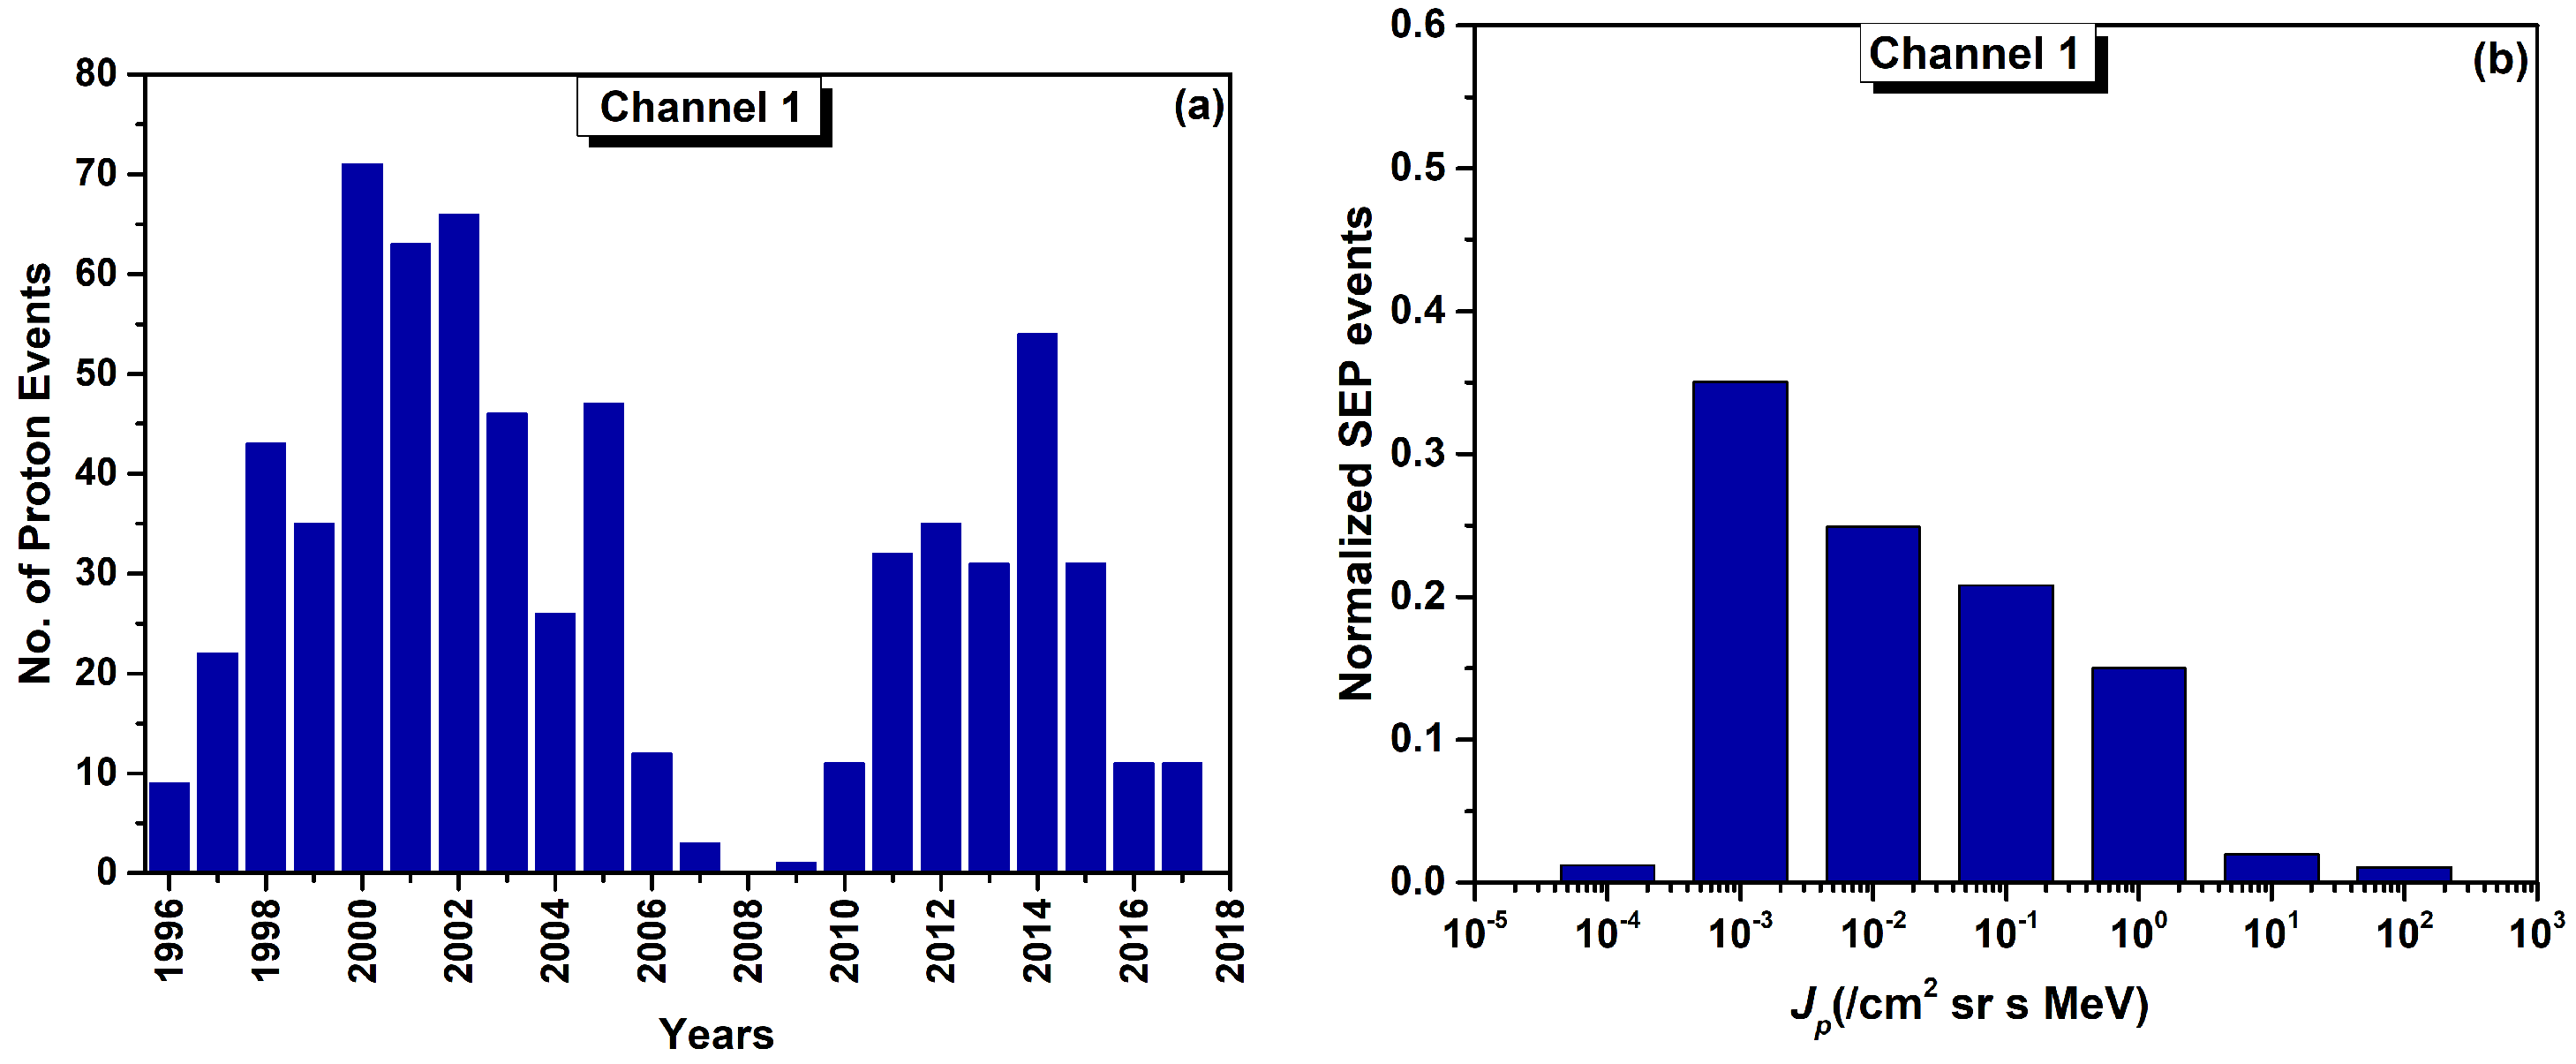
Figure 1. Yearly distribution (a) and intensity distribution (b) for the first energy channel of the SOHO/ERNE SEP events.
Atmosphere 15 01016 g001
Figure 2. Class distributions of the SFs associated with the first energy channel of the SOHO/ERNE SEP events in terms of observed (a) and normalized (b) values.
Atmosphere 15 01016 g002
Figure 3. Parameter distributions of the CMEs associated with the first energy channel of the SOHO/ERNE SEP events in terms of observed CME speed (a), normalized CME speed (b), observed AW (c) and normalized AW (d).
Atmosphere 15 01016 g003
Figure 4. Energy dependence correlations of J p I SXR (a) and J p V CME (b) for SC23, SC24 (c,d) and SC23+24 (e,f), respectively. Filled symbols are used for HED channels, empty symbols for the remaining channels in Table 1; with stars are noted the results from [36] in SC23 and from [30] in SC24.
Atmosphere 15 01016 g004
Figure 5. Energy dependence correlations of J p I SXR | V CME (a) and J p V CME | I SXR (b) for SC23, SC24 (c,d) and SC23+24 (e,f), respectively. Filled symbols are used for HED channels, empty symbols for the remaining channels in Table 1.
Atmosphere 15 01016 g005
Table 1. Pearson correlation coefficients between the SEP peak proton intensity and SXR class or CME projected speed. The number of events used for the calculation of each coefficient is given in parentheses.
Channel/MeV Range J p I SXR J p V CME
SC23 SC24 SC23+24 SC23 SC24 SC23+24
SEPEM/7–10 0 . 44 ± 0.10 (66)-- 0 . 39 ± 0.09 (67)--
NOAA/>10 0 . 46 ± 0.08 (77) 0 . 26 ± 0.14 (32) 0 . 43 ± 0.07 (109) 0 . 52 ± 0.06 (77) 0 . 18 ± 0.15 (37) 0 . 44 ± 0.06 (114)
CDAW/>10 0 . 46 ± 0.07 (90) 0 . 13 ± 0.14 (34) 0 . 41 ± 0.07 (124) 0 . 46 ± 0.07 (91) 0 . 15 ± 0.15 (39) 0 . 41 ± 0.06 (130)
HED01/14–17 0 . 50 ± 0.05 (295) 0 . 42 ± 0.08 (130) 0 . 48 ± 0.04 (425) 0 . 53 ± 0.04 (340) 0 . 53 ± 0.05 (171) 0 . 53 ± 0.03 (511)
HED02/17–22 0 . 52 ± 0.05 (294) 0 . 44 ± 0.08 (129) 0 . 50 ± 0.04 (423) 0 . 53 ± 0.04 (339) 0 . 52 ± 0.05 (170) 0 . 53 ± 0.03 (509)
EPACT-l/19–28 0 . 44 ± 0.07 (176) 0 . 37 ± 0.09 (79) 0 . 43 ± 0.06 (255) 0 . 49 ± 0.05 (196) 0 . 44 ± 0.07 (109) 0 . 47 ± 0.04 (305)
HED03/21–28 0 . 53 ± 0.05 (289) 0 . 47 ± 0.08 (126) 0 . 51 ± 0.04 (415) 0 . 52 ± 0.04 (329) 0 . 51 ± 0.05 (167) 0 . 52 ± 0.03 (496)
Cane-list/25–30 0 . 52 ± 0.06 (193)-- 0 . 49 ± 0.05 (213)--
HED04/26–32 0 . 51 ± 0.05 (260) 0 . 45 ± 0.07 (116) 0 . 49 ± 0.04 (376) 0 . 50 ± 0.04 (292) 0 . 45 ± 0.06 (152) 0 . 48 ± 0.03 (444)
HED05/32–40 0 . 50 ± 0.05 (235) 0 . 46 ± 0.07 (100) 0 . 45 ± 0.04 (335) 0 . 47 ± 0.05 (267) 0 . 47 ± 0.06 (132) 0 . 47 ± 0.04 (399)
HED06/40–51 0 . 48 ± 0.06 (210) 0 . 48 ± 0.08 (93) 0 . 48 ± 0.05 (303) 0 . 47 ± 0.05 (238) 0 . 44 ± 0.07 (124) 0 . 46 ± 0.04 (362)
EPACT-h/28–72 0 . 47 ± 0.07 (168) 0 . 40 ± 0.09 (71) 0 . 45 ± 0.05 (239) 0 . 48 ± 0.05 (186) 0 . 41 ± 0.08 (97) 0 . 46 ± 0.04 (283)
HED07/51–67 0 . 47 ± 0.06 (174) 0 . 48 ± 0.08 (68) 0 . 47 ± 0.05 (242) 0 . 47 ± 0.05 (189) 0 . 33 ± 0.10 (91) 0 . 43 ± 0.05 (280)
SEPServer/55–80 0 . 39 ± 0.10 (91) 0 . 46 ± 0.09 (45) 0 . 41 ± 0.07 (136) 0 . 43 ± 0.08 (100) 0 . 38 ± 0.13 (58) 0 . 41 ± 0.07 (158)
HED08/64–80 0 . 43 ± 0.08 (117) 0 . 42 ± 0.11 (42) 0 . 43 ± 0.07 (159) 0 . 43 ± 0.07 (129) 0 . 43 ± 0.12 (50) 0 . 43 ± 0.06 (179)
HED09/80–101 0 . 41 ± 0.10 (95) 0 . 42 ± 0.11 (33) 0 . 41 ± 0.08 (128) 0 . 36 ± 0.07 (105) 0 . 38 ± 0.14 (40) 0 . 37 ± 0.07 (145)
HED10/101–131 0 . 38 ± 0.12 (52) 0 . 03 ± 0.18 (17) 0 . 34 ± 0.12 (69) 0 . 52 ± 0.09 (52) 0 . 37 ± 0.15 (19) 0 . 47 ± 0.08 (71)
GOES/>100 0 . 38 ± 0.15 (37)-- 0 . 003 ± 0.17 (37)--
EPHIN/>500 0 . 15 ± 0.18 (24)-- 0 . 23 ± 0.22 (22)--
Table 2. Partial correlation coefficients between the SEP peak proton intensity and SXR class or CME projected speed, excluding the SF-CME interdependence.
Channel/MeV Range J p I SXR | V CME J p V CME | I SXR
SC23 SC24 SC23+24 SC23 SC24 SC23+24
SEPEM/7–100.32--0.25--
NOAA/>100.310.210.310.390.090.31
CDAW/>100.320.090.290.330.110.28
HED01/14–170.350.290.340.400.450.41
HED02/17–220.370.320.360.400.430.41
HED03/21–280.390.360.380.380.410.39
EPACT-l/19–280.290.250.280.360.360.36
Cane-list/25–300.38--0.35--
HED04/26–320.370.340.370.360.350.35
HED05/32–400.370.360.370.320.380.33
HED06/40–510.340.390.360.330.330.33
EPACT-h/28–720.330.290.320.350.310.34
HED07/51–640.340.410.350.340.200.30
HED08/64–800.300.320.300.290.330.30
SEPServer/55–800.240.380.290.310.270.29
HED09/80–1010.300.330.300.220.280.24
HED10/101–1310.19 0.18 0.180.420.400.39
GOES/>1000.42-- 0.2 --
EPHIN/>5000.29-- 0.33 --
Disclaimer/Publisher’s Note: The statements, opinions and data contained in all publications are solely those of the individual author(s) and contributor(s) and not of MDPI and/or the editor(s). MDPI and/or the editor(s) disclaim responsibility for any injury to people or property resulting from any ideas, methods, instructions or products referred to in the content.