Abstract
Extreme rainfall, also known as heavy rainfall or intense precipitation, is a weather event characterized by a significant amount of rainfall within a short period. This study analyzes the trends in extreme precipitation indices at 17 stations in four main regions in Cambodia—the Tonle Sap, coastal, Mekong Delta, and Upper Mekong regions—between 1991 and 2021. Analyzing the data with RClimDex v1.9 reveals diverse spatial and temporal variations. The statistical analysis of the extreme rainfall indices in Cambodia from 1991 to 2021 reveals significant trends. In the Tonle Sap region, consecutive dry days (CDDs) increased at most stations, except Battabang, Kampong Thmar, and Pursat, while consecutive wet days (CWDs) increased at most stations. These trends align with rising temperatures and reduced forest cover. In the coastal region, particularly at the Krong Khemarak Phummin station, most rainfall indices increased, with a slope value of 89.94 mm/year. The extreme rainfall indices max. 1-day precipitation (RX1day) and max. 5-day precipitation (RX5day) also increased, suggesting higher precipitation on days exceeding the 95th (R95p) and 99th percentiles (R99p). The Kampot station showed a significant increase in CDDs, indicating a heightened drought risk. In the Mekong Delta, the Prey Veng station recorded a decrease in the CDDs slope value by −4.892 days/year, indicating potential drought risks. The Stung Treng station, which is the only station in Upper Mekong, showed a decreasing trend in CDDs with a slope value of −1.183 days/year, indicating a risk of extreme events. These findings underscore the complex interplay between climate change, land use, and rainfall patterns in Cambodia.
1. Introduction
Extreme rainfall, also known as heavy rainfall or intense precipitation, is a weather event characterized by a significant amount of rainfall precipitation within a short period of time [1]. Extremes in precipitation are one of the main causes of natural catastrophes, including floods, landslides, and mudslides, which result in the destruction of property and human life and have an adverse effect on industrial and agricultural productivity, as well as socioeconomic development as a whole [2]. Heavy rainfall events impact the seasonal and yearly precipitation total, leading to a reduction in the stream flow, reservoir water level, soil moisture content, and groundwater table depletion, as well as affecting the pattern of the stream flow, the spatiotemporal distribution of the runoff, the groundwater reserves, and the soil moisture due to the variations in the amount and frequency of rainfall [1]. Infrastructure, transportation, and industrial operations might be jeopardized by floods, urban ponding, and environmental damage caused by heavy rains. Furthermore, affecting biodiversity and sustainable development, rainfall floods farmlands, overflows rivers, and harms ecosystems [3]. Previous research has demonstrated that a landslide is trigged by rainwater seeping into the soil pores, raising the pore water pressure and reducing the slope materials’ shear strength [4].
Many studies have investigated the relationships between topographic features, including altitude; geographic position; slope; proximity to moisture sources like lakes, seas, or oceans; and exposure, and how these characteristics affect the temporal and spatial distributions of rainfall [5]. Unfortunately, long-term climatic trends and patterns are frequently ignored in studies of extreme weather and natural disasters [6]. It can be very challenging to find timely and accurate information about precipitation in the past, present, and future, particularly in regions of the world lacking the resources necessary to establish and maintain a comprehensive network of precipitation observers [7]. On the global scale, there were notable fluctuations in monthly or seasonal precipitation. A significant decrease in the amount of precipitation that occurs during strong and heavy precipitation periods has been observed [8].
According to Duong et al. (2023), a study in Cambodia used the Bias-Corrected Spatial Disaggregation (BCSD) technique to downscale climate models from CMIP6 [6]. The downscaled data were utilized to project the precipitation pattern and extreme events that Cambodia would experience in the future. The indices of precipitation changes include consecutive dry days (CDDs), consecutive wet days (CWDs), and maximum one-day precipitation (RX1day) under two shared socioeconomic pathway (SSP) scenarios, which are SSP245 and SSP585. The projections indicated that consecutive dry days (CDDs) might increase, leading to more dry spells or droughts. Consecutive wet days (CWDs) are expected to rise under SSP245 but significantly decrease in the east under SSP585. The maximum one-day precipitation (RX1day) is likely to increase across most of Cambodia, especially under SSP585, suggesting more frequent flooding due to excessive rainfall.
The extreme daily rainfall indices in Indochina [(the number of heavy precipitation days (R10), the number of very heavy precipitation days (R20), the number of days above 25 mm (R25), RX1day, CDDs, CWDs, daily maximum rainfall, max. 5-day precipitation (RX5day), annual total wet day precipitation (PRCPTOT), simple daily intensity index (SDII), very wet days (R95p), and extremely wet days (R99p)] were examined in a study. Different extreme characteristics were calculated based on frequency, intensity, and the wet and dry conditions to approximate the indices. The Mann–Kendall test was used to determine if a trend was significant or insignificant, and the linear trends were computed using the least squares fit method. The study revealed different extreme rainfall patterns in the eastern and western Indochina Peninsula. The east experiences positive trends in heavy rainfall days, with some major changes. The northeastern monsoon affects the region annually. The west experiences negative trends in CDDs, with significant trends associated with decreased PRCPTOT, R10, R95p, and R99p [9].
The results of excessive precipitation have been experienced in many different countries [10]. Cambodia is one of the most vulnerable countries affected by extreme rainfall [11]. The majority of hazards in Cambodia are related to droughts and floods. Nearly every year, severe floods that cause significant damage occur in Cambodia. The low-lying areas are always subject to seasonal flooding, which primarily happens between September and October and includes both flash and river flooding. The highest floods recorded in Cambodia took place in 2000, 2011, and 2013 [12]. Extreme precipitation intensity is predicted to diminish in certain areas, while it is predicted to become extraordinarily intense in others [10]. However, the relationship between the rainfall distribution and the local-scale heterogeneity of the land, as well as the diurnal, seasonal, and intra-seasonal fluctuations, has not been investigated due to the paucity of multi-year hourly rainfall data at various locations in Cambodia [13].
The consequences of global warming on intense precipitation fluctuate depending on the location. For example, it is known that in the past, extreme precipitation occurrences have grown in some tropical regions while decreasing in some subtropical regions [14]. Increased landslides and floods could result from more intense precipitation, which would have disastrous consequences for human society. According to data supplied by the Food and Agriculture Organization of the United Nations (FAO), floods rank among the world’s deadliest natural disasters in terms of the number of fatalities that they have caused since the turn of the 20th century [14]. Most of the previous investigations mainly assessed changes in mean precipitation and rainfall, which are strongly impacted by climate change. Before the effects develop, adaptation and mitigation strategies are needed to deal with the implications of climate change [15]. Studies suggest that additional factors with a negative effect like growing populations, fast development, changes in land use, and shifting precipitation regimes have contributed to a rise in the intensity of droughts throughout time. These elements, in addition to the effects of climate change, have caused a great deal of demand in many nations, leading to major concerns about the security of food and water [16]. For this reason, CDDs are crucial in calculating the quantity of non-consecutive dry days and identifying the periods of prolonged dryness that often precede or follow heavy rainfall events. This information is crucial for predicting droughts, managing water resources, and preparing for the impact of sudden, intense rainfall.
In Cambodia, there is an annual average rainfall of 1400 mm to 4000 mm, which is divided into conditions between the wet and dry seasons [6]. This research work aimed to (1) study the behavior of extreme rainfall phenomena in Cambodia, (2) analyze the temporal and spatial distribution of 11 precipitation indices by utilizing the daily data time series from 17 rainfall stations over Cambodia, (3) examine the yearly spatial trend of CDDs in both wet and dry seasons.
2. Materials and Methods
2.1. Descriptions of the Study Area
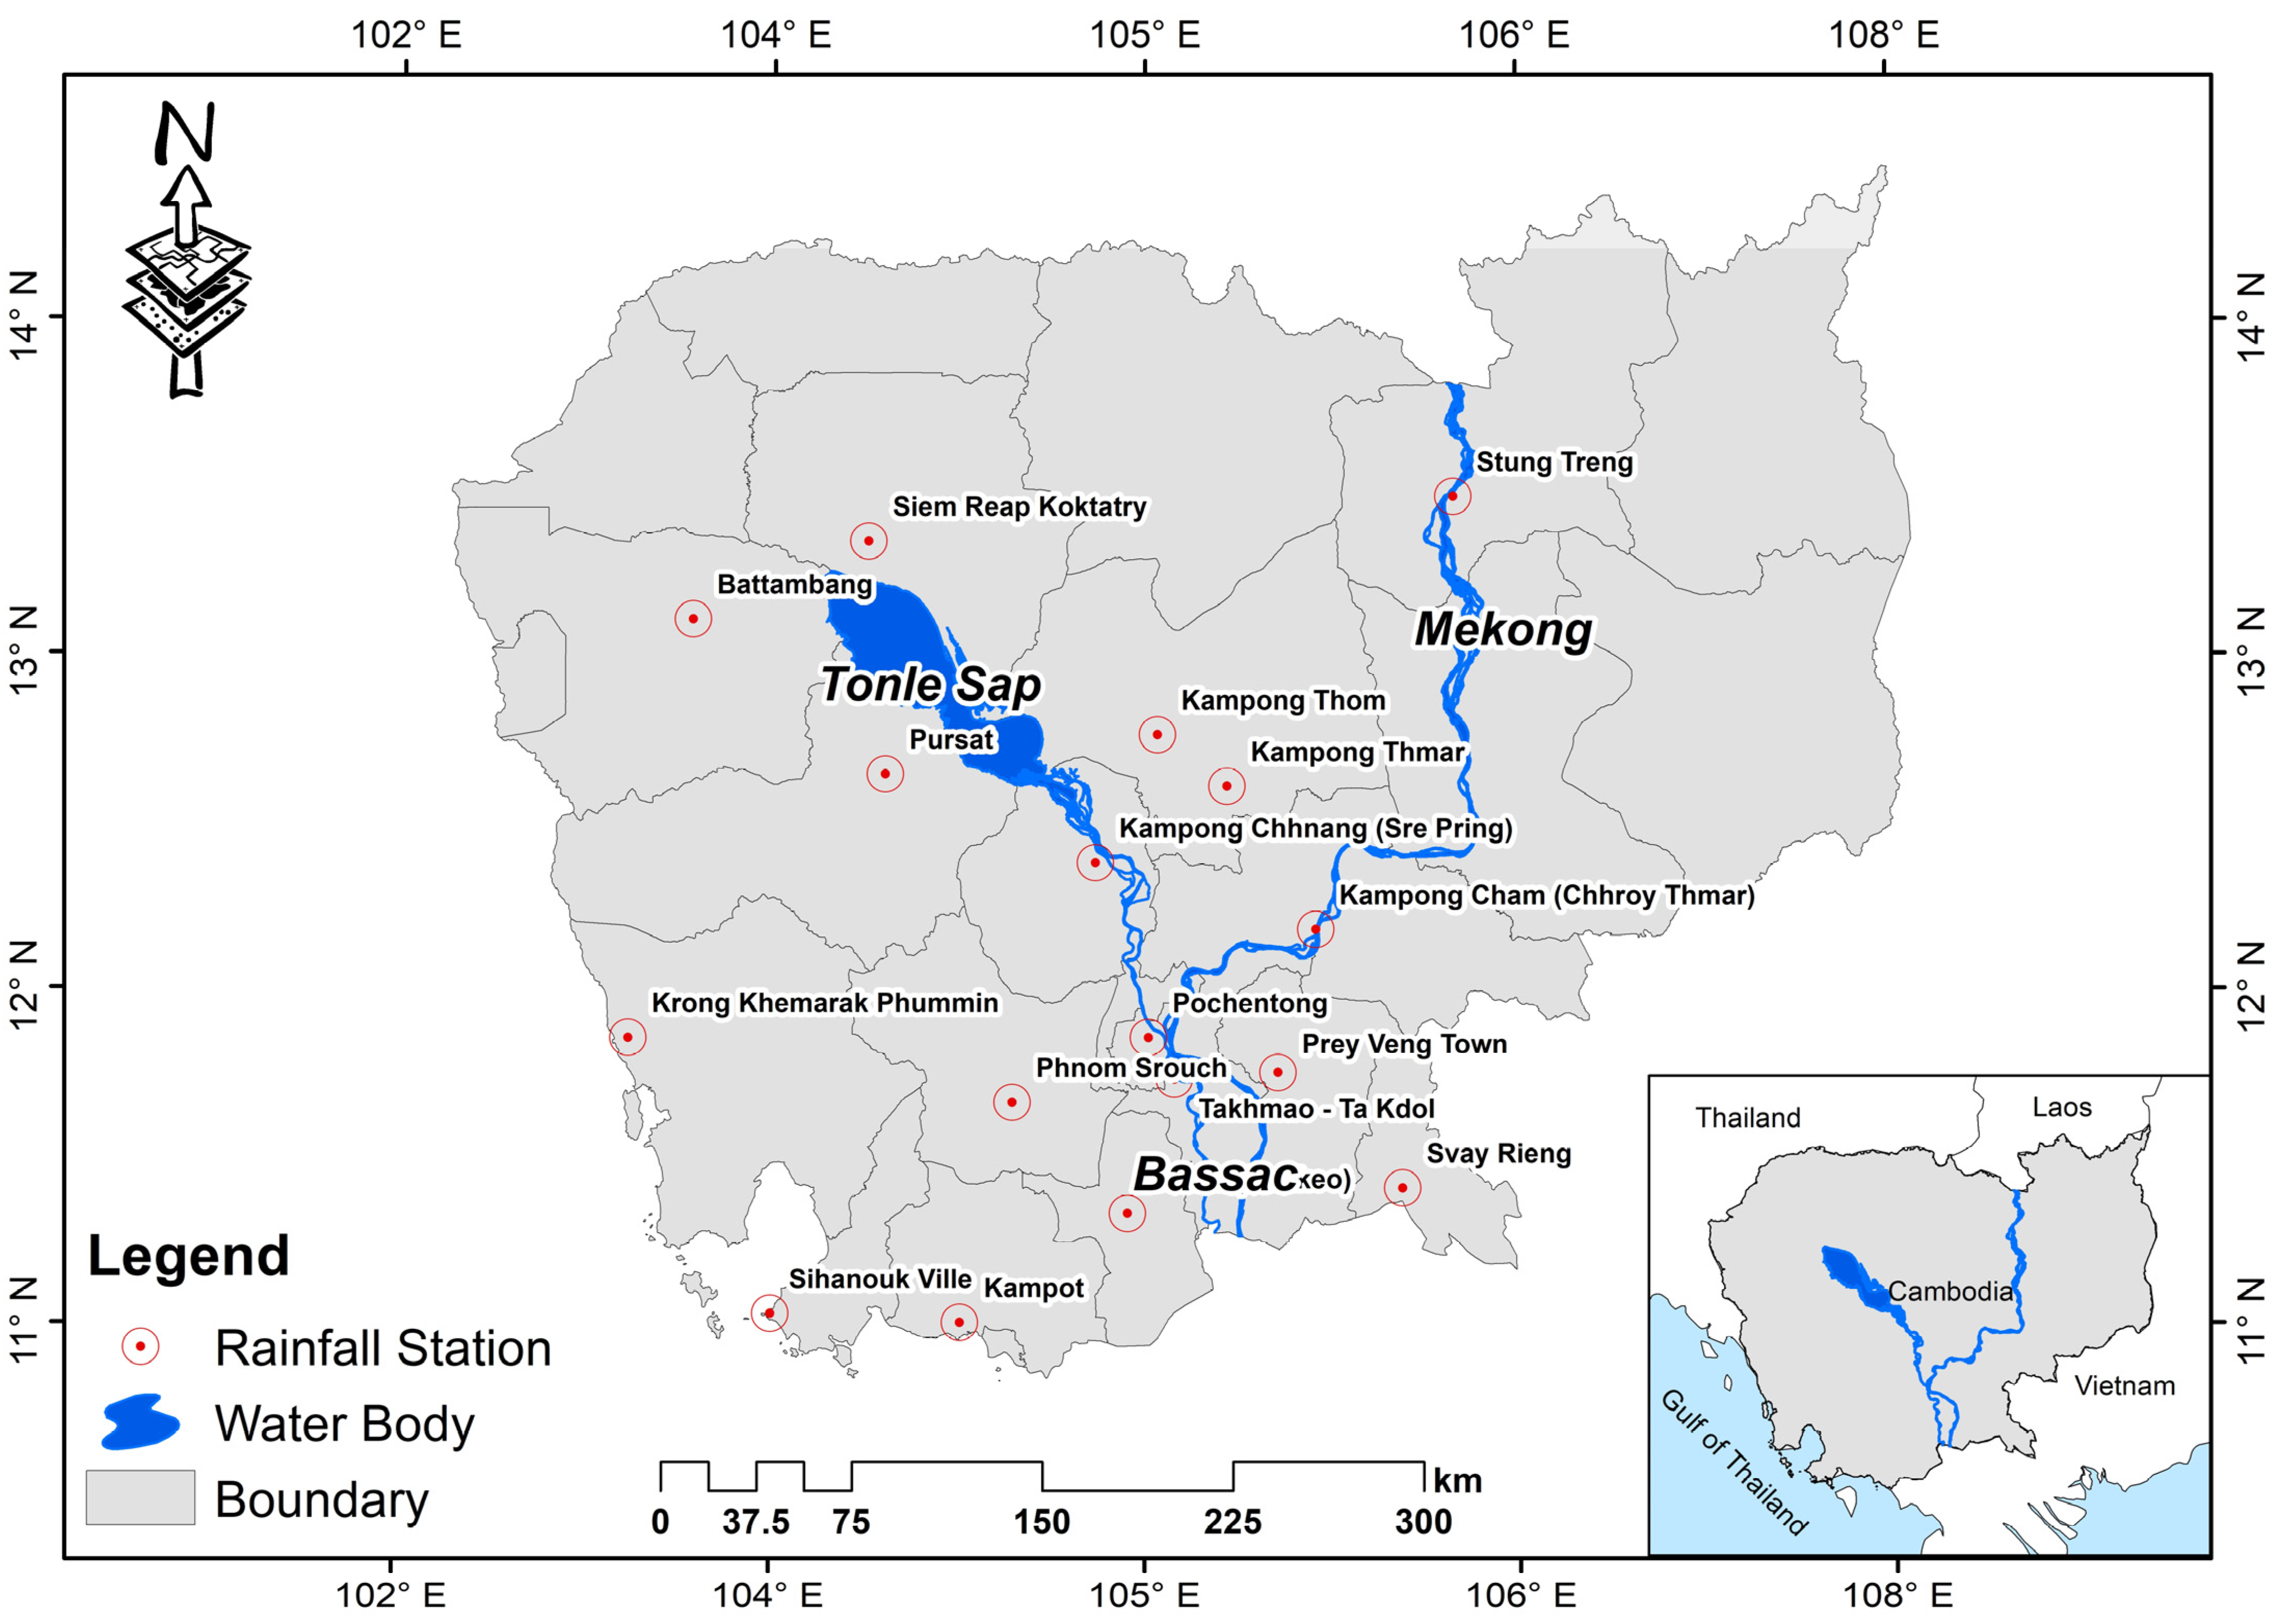
The Kingdom of Cambodia, a country in Southeast Asia (Figure 1), is located on the southern tip of the Indochina Peninsula. Specifically, it is located in the tropical region lying between latitudes 10° N and 15° N and longitudes 102° E and 108° E. Approximately 181,035 km2 (69,898 sq mi) in total, it is bordered by Vietnam, Laos, Thailand, and the Gulf of Thailand. The tropical Indomalaya area and the Indochina Time Zone (ICT) include the entire country. With tropical monsoons, Cambodia’s climate shows distinctive wet and dry seasons, a wet season (from May to October) and a dry season (from November to April). It is observed that September and October are the wettest months with between 70% and 80% of the yearly precipitation, while January and February are the driest months with between 10% and 20% of the total rainfall [17]. One of the world’s largest tropical rivers is the Mekong. When the Mekong River floods, the water backs up into the Tonle Sap River, changing the direction of the river’s flow [18]. The Tonle Sap and Bassac Rivers meet the Mekong to form the Chaktomuk confluence, which is home to Phnom Penh, the capital of Cambodia [19]. Southeast Asia’s largest inland lake, Tonle Sap Lake, is home to rare habitats and species that have adapted to seasonal variations. A floodplain encircles the lake’s permanently flooded region, and, from May to October, the upper Mekong River experiences monsoon rains [20].
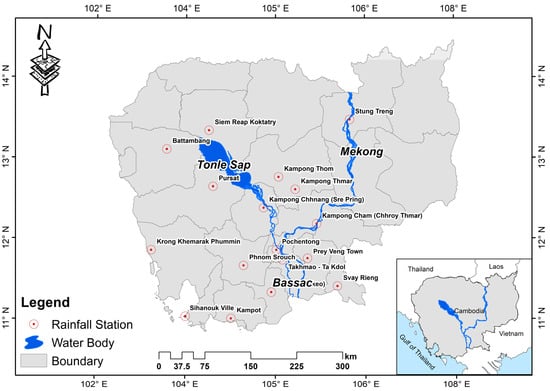
Figure 1.
The location of the stations in the study area (Cambodia).
According to long-term climate averages, Cambodia’s annual rainfall regime consists of a lengthier wet season that begins with the commencement of the Southeast Asian monsoon and typically lasts from May to October, followed by a six-month dry season that runs from November to April. The wet season is somewhat bimodal, with August typically serving as the center of a dry spell. Cambodia’s elevation varies from about 15 m to 1813 m, with higher elevations in the northeast and southwest regions, while the central and southeastern areas are lower, featuring Tonle Sap Lake and the Mekong River basin [13]. This is known as the Kuon Rodow Prang, which translates as “child dry season” from Cambodian. Normally, the wet season sees more than 80% of the precipitation [21]. The previous 20 years have seen a severe impact on farmers’ livelihoods due to an increase in the unpredictability, intensity, and frequency of rainstorms, according to historical records that show notable changes in the rainfall patterns since the 1920s [22].
The average annual rainfall in the central lowland region is approximately 1400 mm, while higher altitude or coastal regions may receive as much as 4000 mm of precipitation with an average maximum temperature of 38.1 °C in April and an average minimum temperature of 17.1 °C in January. The yearly average temperature is 28.1 °C [23]. In Cambodia, an increase in the mean annual temperature of 1.35 °C to 2.5 °C is anticipated by the year 2100. It is also anticipated that the average yearly rainfall will rise from 3% to 35%, with the rainy season seeing the most increase [24].
In this analysis, data from the daily rainfall records between 1991 and 2021 for 17 rainfall stations were used to calculate various indices. These indices helped evaluate spatial and temporal trends. Because temperature data were not available in the country, this analysis focused exclusively on precipitation extremes.
2.2. Rainfall Indices Analysis
The extreme rainfall indices from 17 rainfall stations in Cambodia (Table 1) are calculated from daily precipitation using RClimDex and Microsoft Excel. The rainfall data from all stations were collected by the Ministry of Water Resources and Meteorology (MOWRAM) with varying availability. This study covered the period from 1991 to 2021, totaling 31 years, across 13 rainfall stations. However, the data from 4 stations were incomplete due to missing records and delayed gauge installations. The overall dataset was deemed significant for analysis, except for these 4 stations that had fewer than 30 years of data. Specifically, at the Prey Veng Town station, data were missing for 1995, 1996, and 1997, resulting in a 28-year observation period for analysis. The Stung Treng station had 30 years of data, excluding 1995, and the data for the Sihanouk Ville station were delayed and also spanned 30 years. Lastly, the Krong Khemarak Phumin station only had 25 years of data available since recording began in 1997. To address these gaps, the missing data were treated as absent in the analysis.

Table 1.
List of rainfall stations used in this study.
RClimDex has been developed and maintained by Xuebin Zhang and Feng Yang at the Climate Research Branch of the Meteorological Service of Canada [25] and aims to provide a user-friendly interface for the computation of climatic extreme indices. It computes all 27 core indices recommended by the CCl/CLIVAR Expert Team for Climate Change Detection Monitoring and Indices (ETCCDMI), and the 27 core indices contain almost all of the indices generated by RClimDex. The R version of RClimDex was utilized in its development. With it, R or a later version should function. Table 2 shows the specific details of the 11 rainfall indices that were computed using RClimDex at annual and, when applicable, monthly time stages [26]. This investigation focused on the precipitation of the rainfall days, which includes RX1day, RX5day, R10, R20, Rnn, CDDs, CWDs, R95, R99, PRCPTOT, and SDII. The threshold (nn) was user-defined and was applied across various regions within the study area to identify extreme data points. For simplicity and consistency with the existing literature [27,28,29], the 95% quantile was selected as the threshold for this study.
Table 2.
List of extreme precipitation indices, as used in this study [25].
Geographical Information Systems (GISs) have become essential tools for spatial data representation and management. A GIS can categorize objects based on a single indicator and offer spatial interpolation functions like spline, kriging, and inverse distance weighting (IDW) [30,31]. In this study, a GIS was used to display the spatial interpolation of the trend of the indices of extreme rainfall events, with symbols indicating the direction and the increasing and decreasing trends at each station. IDW is a deterministic estimating technique that uses a linear combination of values at neighboring measured sites to determine the values at unmeasured points. IDW is simple, easy to implement, and effective in interpolating rainfall data, making it suitable for generating general overviews of the rainfall trends in Cambodia [31,32].
In addition, the trends of the rainfall indicators were computed using the ordinary least squares (OLS) method. The OLS employed a linear model to determine the slope magnitude. The trends with a linear p-value of less than 0.10 were considered statistically significant in this study. The slope trend was detected as significant to identify the trend in a time series. The results at each station were normalized over the time periods, and then the average value of the trends for all stations in each region was analyzed, revealing that rainfall varied across the regions.
This study also included a detailed investigation of CDDs in seasonal rainfall in each station in addition to an analysis of annual rainfall. This made it possible to comprehend the tremendous precipitation that Cambodia has experienced over the study period in greater detail. The indicators measuring CDDs were computed and assessed using Microsoft Excel for each station during both the wet and dry seasons. In an extreme rainfall analysis, CDDs serve as an index to evaluate extreme precipitation events and to understand the distribution and frequency of drought periods, which can lead to drought conditions and affect water resources, agriculture, and ecosystems.
3. Results
In this analysis, the results are discussed according to their spatial and temporal attributes. A number of stations are classified into regions according to their geographical characteristics. In line with this, the results section is divided and discussed in three subsections, namely (i) a spatial analysis of the extreme rainfall indices, (ii) a temporal analysis of the extreme rainfall indices, and (iii) a seasonal rainfall analysis.
3.1. Spatial Analysis of Extreme Rainfall Indices
Cambodia is spatially categorized into four regions: coastal, Mekong Delta, Tonle Sap, and Upper Mekong. The coastal (southwest) region includes three stations—Kampot, Krong Khemarak Phummin, and Sihanoukville; the Mekong Delta (southeast) region includes seven stations—Takeo, Takhmao, Phnom Srouch, Svay Rieng, Prey Veng, Pochentong, and Kampong Cham; the Tonle Sap (northwest) region includes six stations—Siem Reap, Battambang, Pursat, Kampong Thom, Kampong Chhnang, and Kampong Thmar; and the Upper Mekong (northeast) region includes one station—Stung Treng.
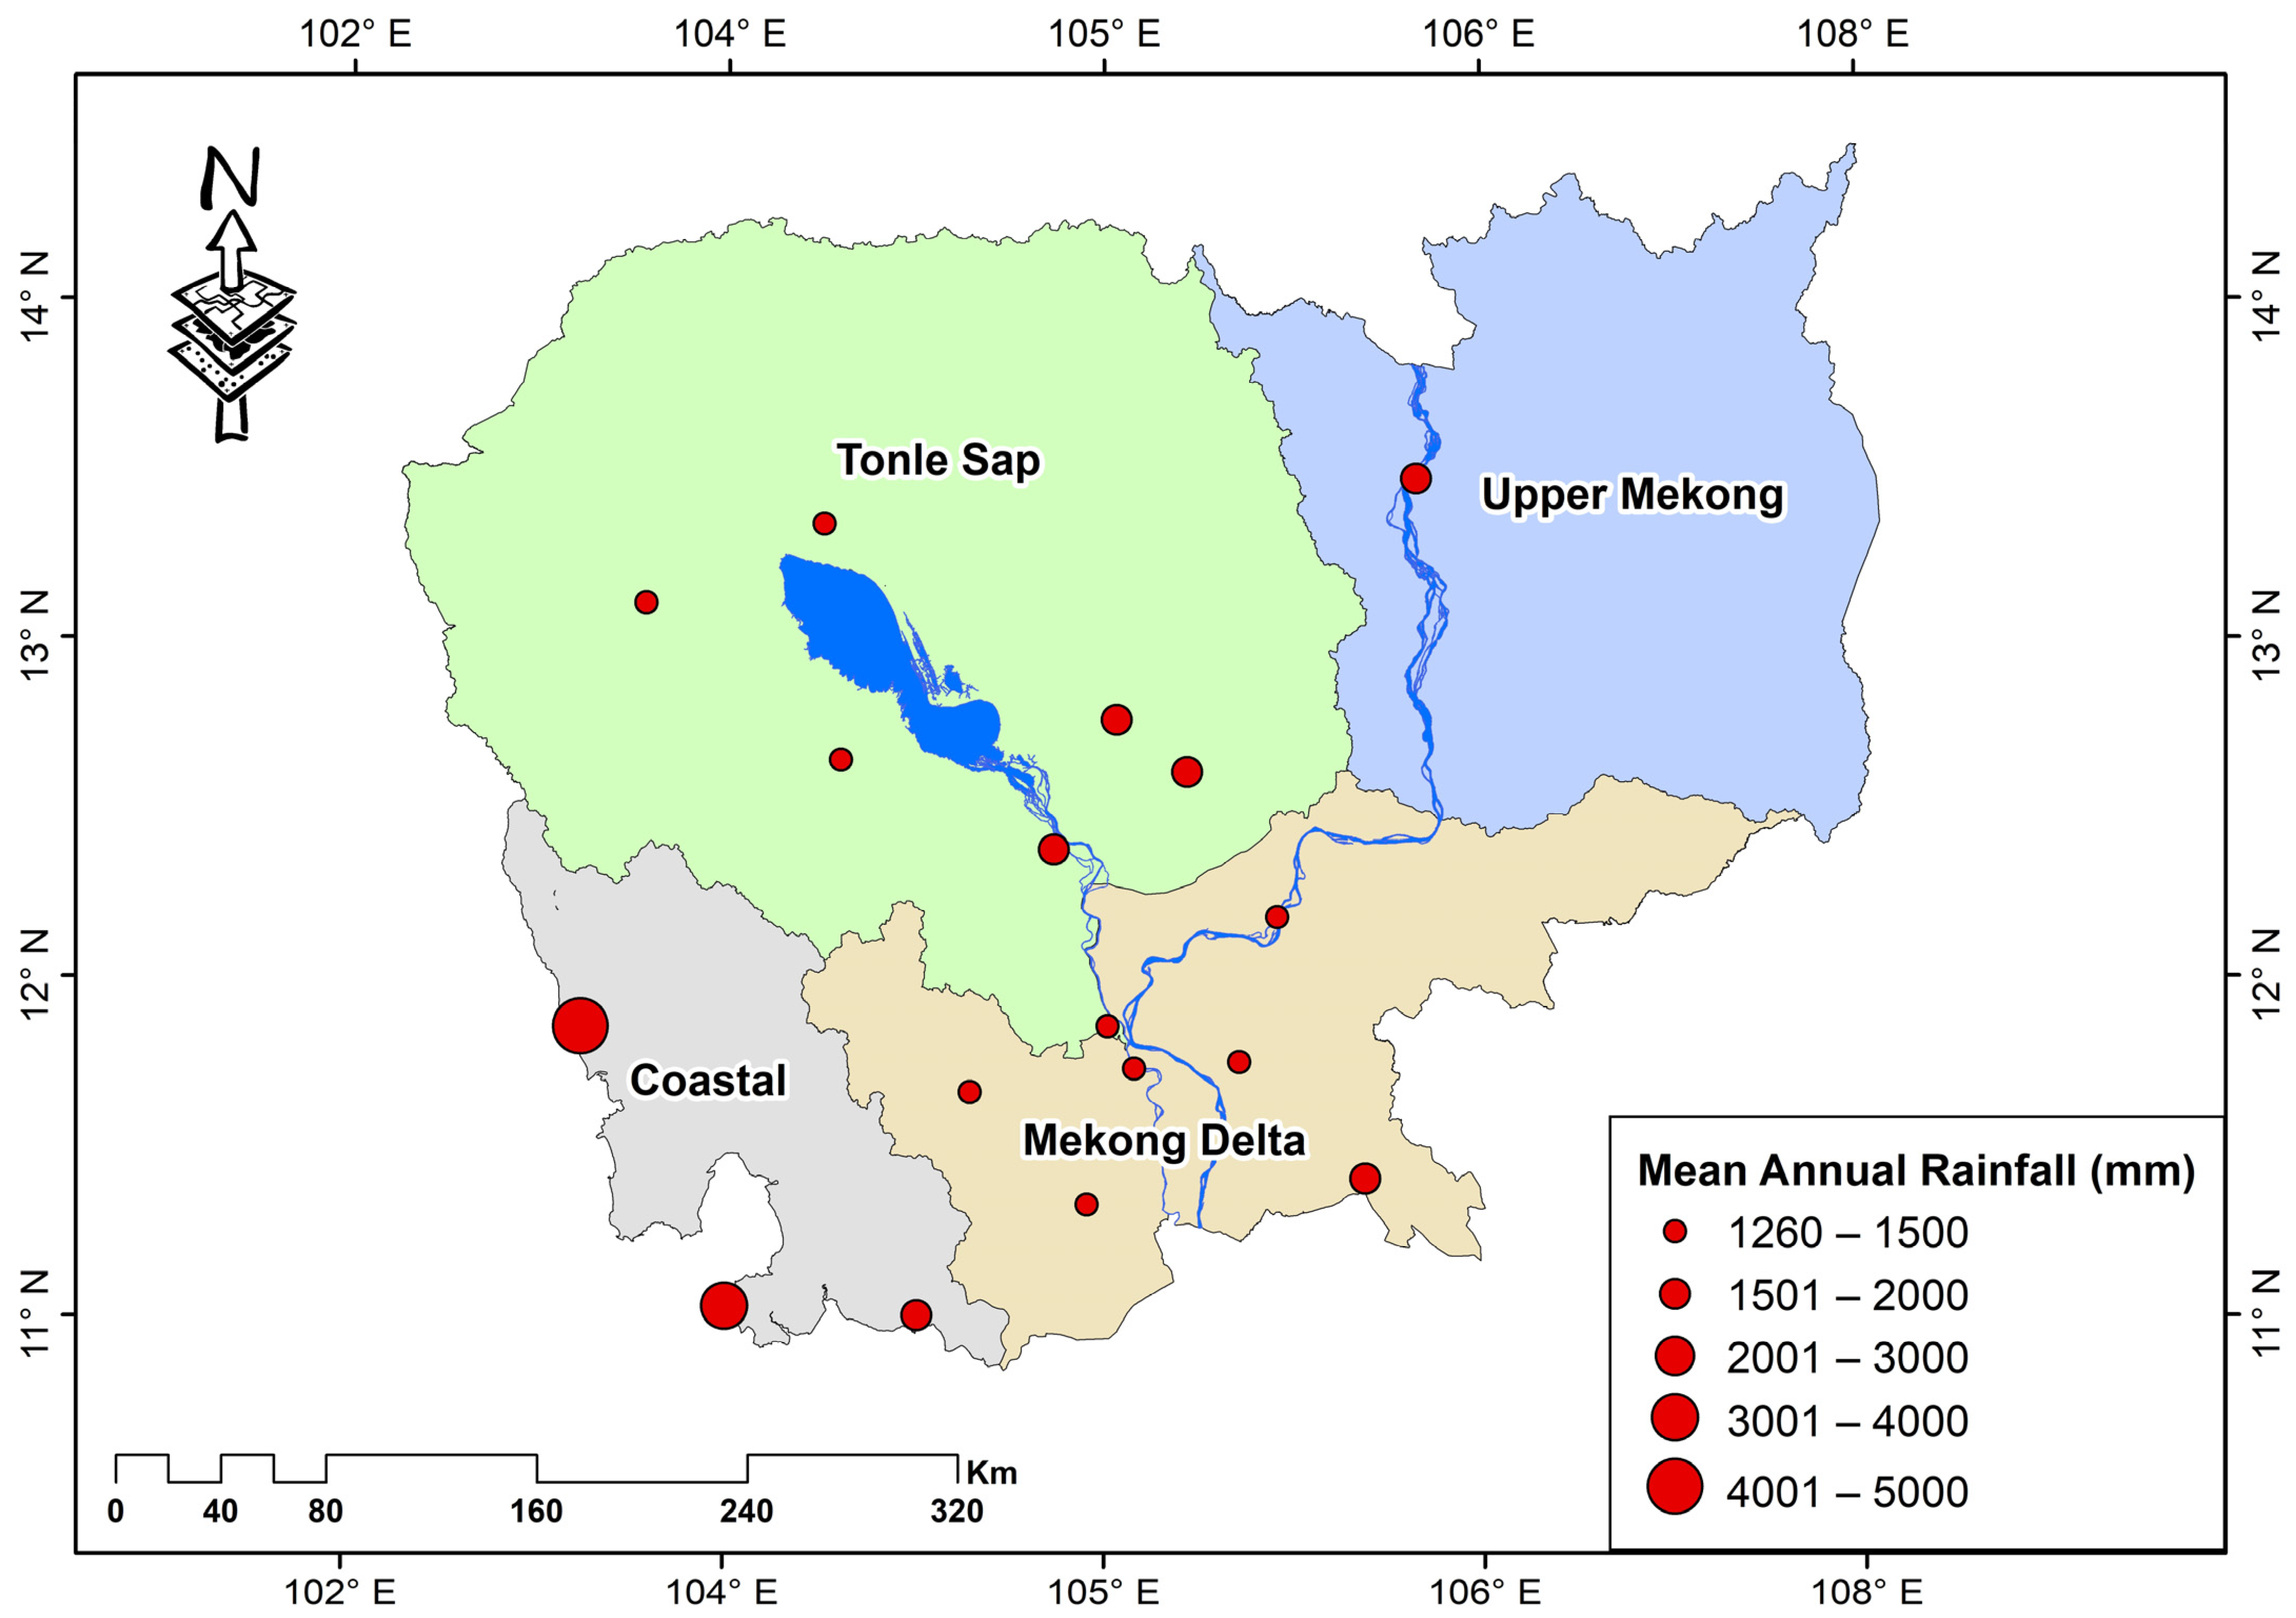
As shown in Figure 2, the mean annual rainfall at each station across Cambodia reveals that the Krong Khemarak Phummin station, located in Koh Kong Province within the coastal region, experiences the highest average annual rainfall at 4180 mm/year. In contrast, the Takhmao rainfall station in the Mekong Delta reports the lowest average annual rainfall at 1260 mm/year. The coastal region has the highest average annual rainfall at all three rainfall stations: Krong Khemarak Phummin (4180 mm/year), Sihanouk Ville (3032 mm/year), and Kampot (1887 mm/year). On the other hand, in the Tonle Sap region, the Battambang station has the lowest mean annual rainfall recorded at 1270 mm/year, while the Kampong Thmar station has the highest mean annual rainfall at 1598 mm/year.
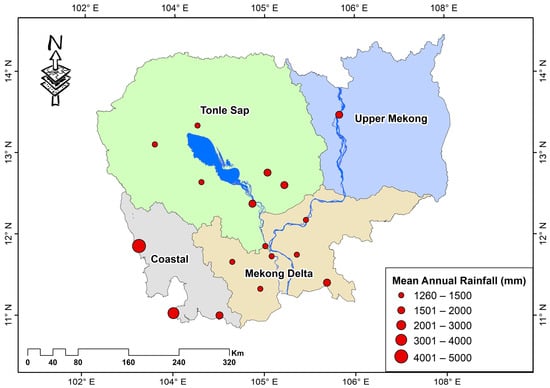
Figure 2.
Mean annual rainfall data at each station in Cambodia (1991–2021).
The Extreme Rainfall Detection Monitoring and Indices (ETCCDMI) team provides information regarding the extreme rainfall indicators associated with rainfall types, frequency, intensity, and extremes [25]. The time series slope of trends analyses of 11 extreme precipitation indices estimated over 1991–2021 at 17 rainfall stations in Cambodia were analyzed. The results of the trend analysis and their estimated slopes for the trend line of the precipitation-related indices are presented for all stations throughout Cambodia (Table 3). Eleven rainfall indices were divided into three groups: the first group was CDDs, CWDs, RX1day, and RX5day; for the second group of indices, R10, R20, Rnn, and PRCPTOT; and for the third group of indices, R95p, R99p, and SDII. These parameters were classified into three groups according to the nature of the parameters to facilitate the discussion.
Table 3.
The trends of extreme rainfall indices at different stations of Cambodia.
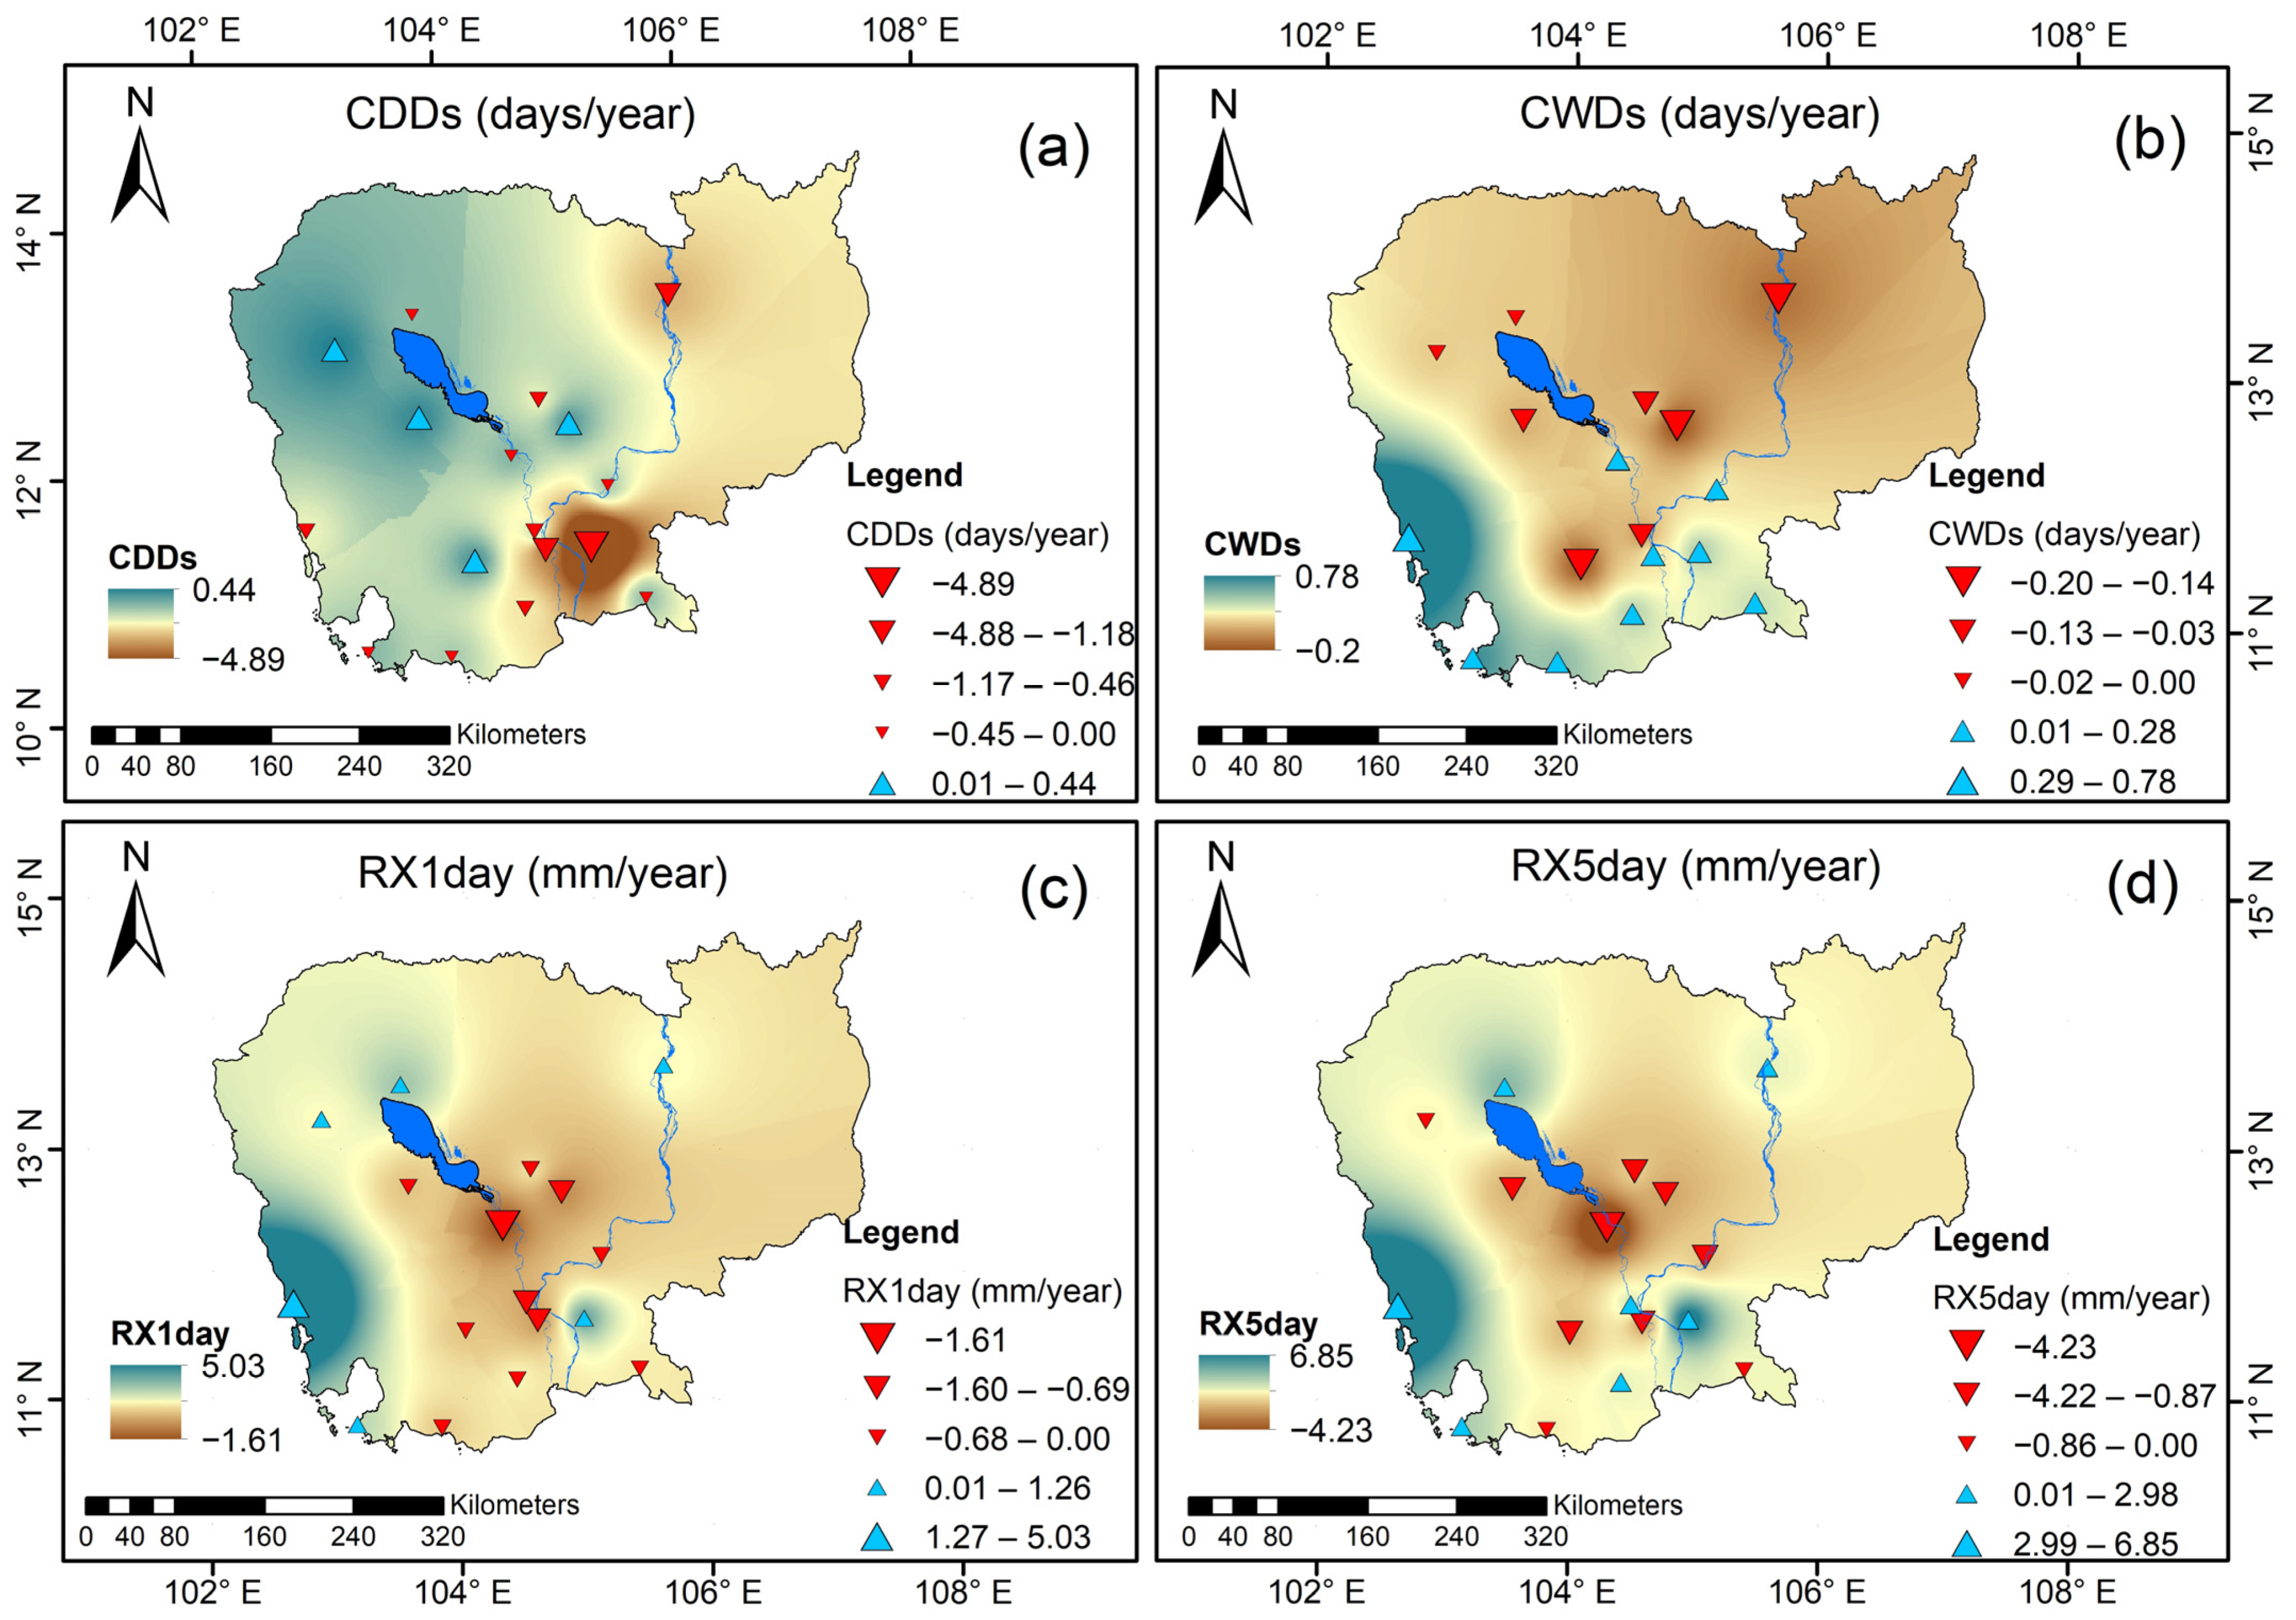
The spatial interpolation of the rainfall indices was analyzed from the data collected by these stations between 1991 and 2021. The red triangles represent negative values and the blue triangles represent positive values (Figure 3). The CDDs increased notably in the western area of the Tonle Sap, particularly the Battambang station, Pursat station, and Phnom Srouch station (Figure 3a), while the other regions showed a decreasing trend of CDDs, especially in the Prey Veng station.
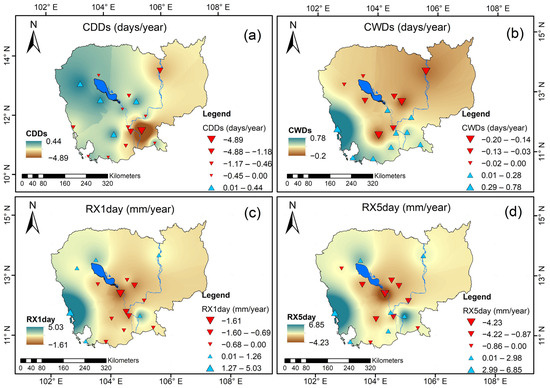
Figure 3.
The spatial interpolation of the trends of the extreme rainfall indices in Cambodia: (a) CDDs, (b) CWDs, (c) RX1day, and (d) RX5day. The filled red downward and filled blue inverted triangles indicate decreasing and increasing trends, respectively.
As seen in Figure 3b, the spatial trend of the CWDs observed in the southwest of the Gulf of Thailand and southeast of Cambodia is increasing, while the lowest values were recorded in the Tonle Sap region and northeast of Cambodia.
The values of RX1day and RX5day also exhibited a similar trend, with the greatest increase observed in the Krong Khemarak Phummin station of 5.032 and 6.854 days/year, respectively (Figure 3c,d).
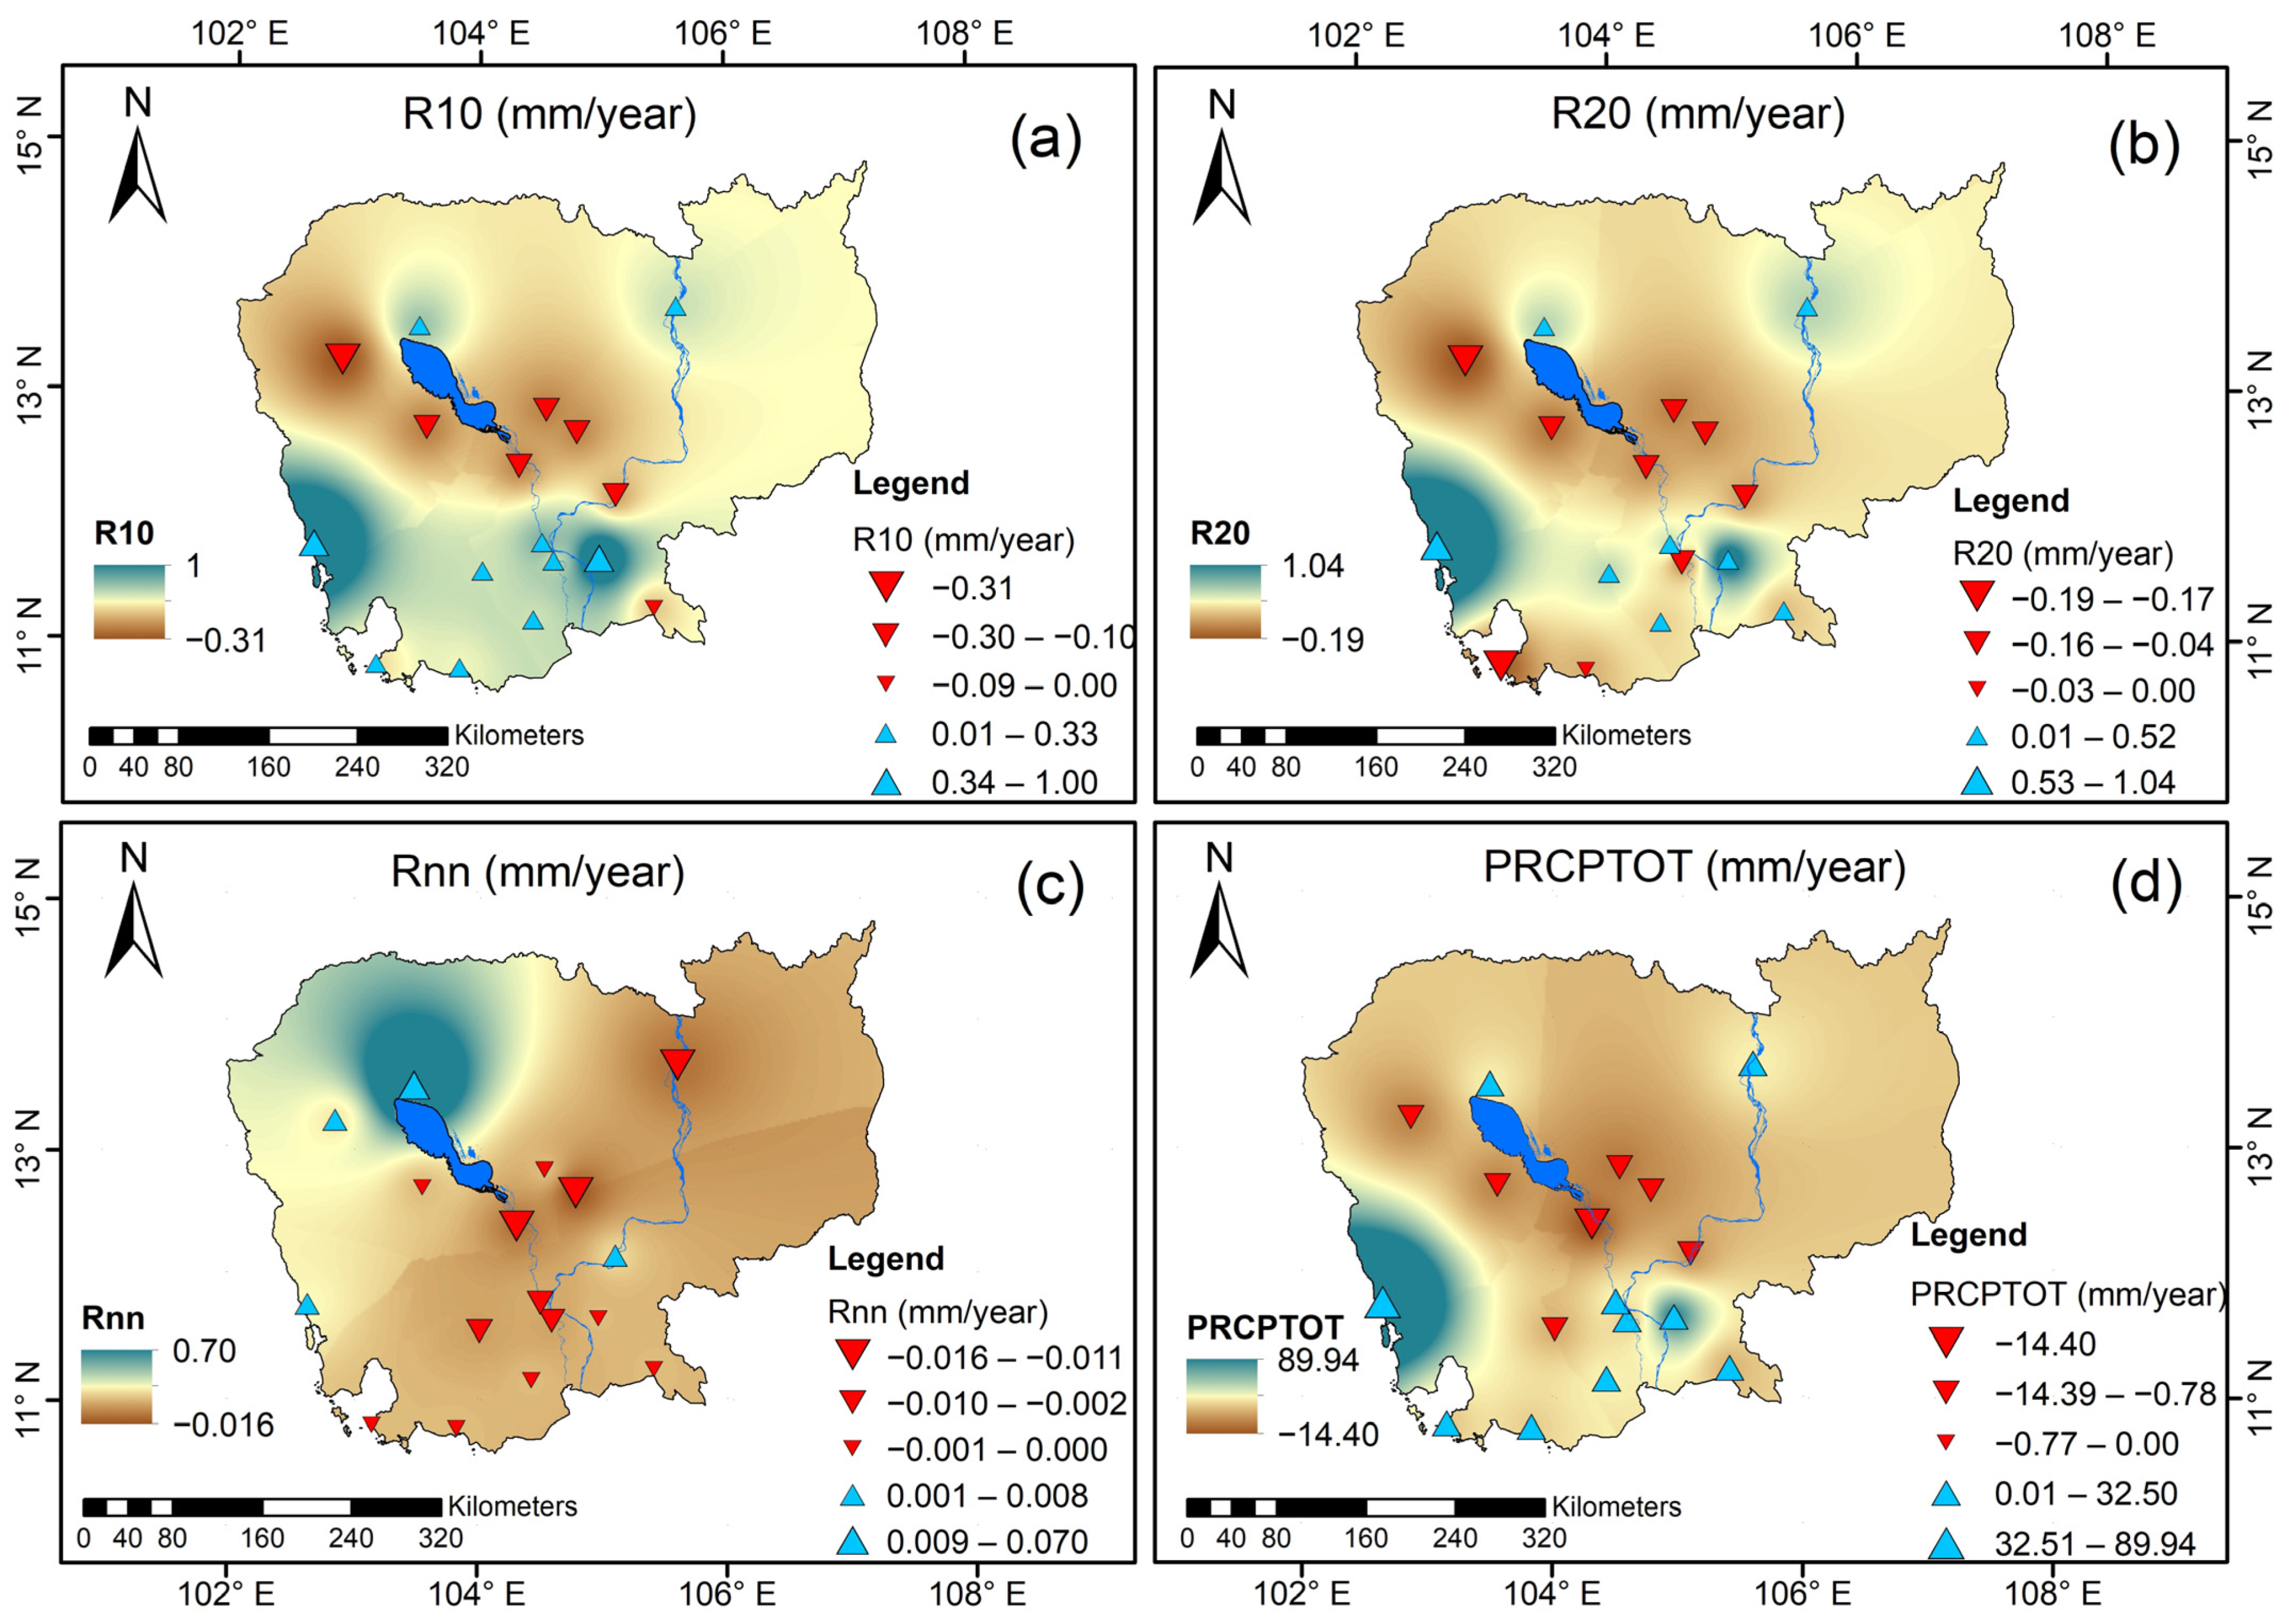
The R10 value exhibited an increasing trend in the Krong Khemarak Phummin station and southeast of Cambodia (Figure 4a), while the R20 value followed, with the highest values still increasing in the Krong Khemarak Phummin station along the Gulf of Thailand and negative values occurring at all stations for R20 (Figure 4b).

Figure 4.
The spatial interpolation of the trends of the extreme rainfall indices in Cambodia: (a) R10, (b) R20, (c) Rnn, and (d) PRCPTOT. The filled red downward and filled blue inverted triangles indicate decreasing and increasing trends, respectively.
Whereas Rnn was the highest value in the Siem Reap station, with 0.07 mm/year (Figure 4c), it was recorded at 0.007 mm/year, showing a negative trend.
As can be seen in Figure 4d, 15 stations exhibited a negative trend in PRCPTOT, while the PRCPTOT values displayed an increasing trend in the Krong Khemarak Phummin station with 89.94 mm/year and the Prey Veng station with 32.50 mm/year.
The third group was R95p, R99p, and SDII. It can be seen from Figure 5a,b that the spatial interpolation of R95p and R99p shows an increasing trend in the Khemarak Phummin station, notably 46.884 and 24.785 mm/year, respectively.
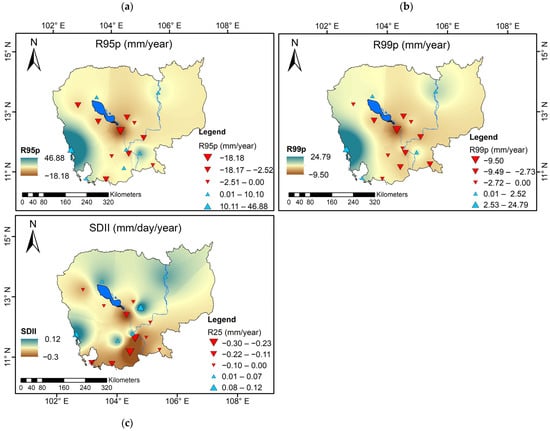
Figure 5.
The spatial interpolation of the trends of the extreme rainfall indices in Cambodia: (a) R95p, (b) R99p, and (c) SDII. The filled red downward and filled blue inverted triangles indicate decreasing and increasing trends, respectively.
Most of the stations show a decreasing trend in SDII, while the value of SDII notably increased in the Krong Khemarak Phummin and Kampong Thmar stations (Figure 5c).
3.2. Temporal Analysis of Extreme Rainfall Indices
In this study, all graph values are presented as normalized values for the four regions. This normalization was performed to ensure that the data were on a comparable scale, facilitating meaningful comparisons across different datasets.
3.2.1. Tonle Sap Region
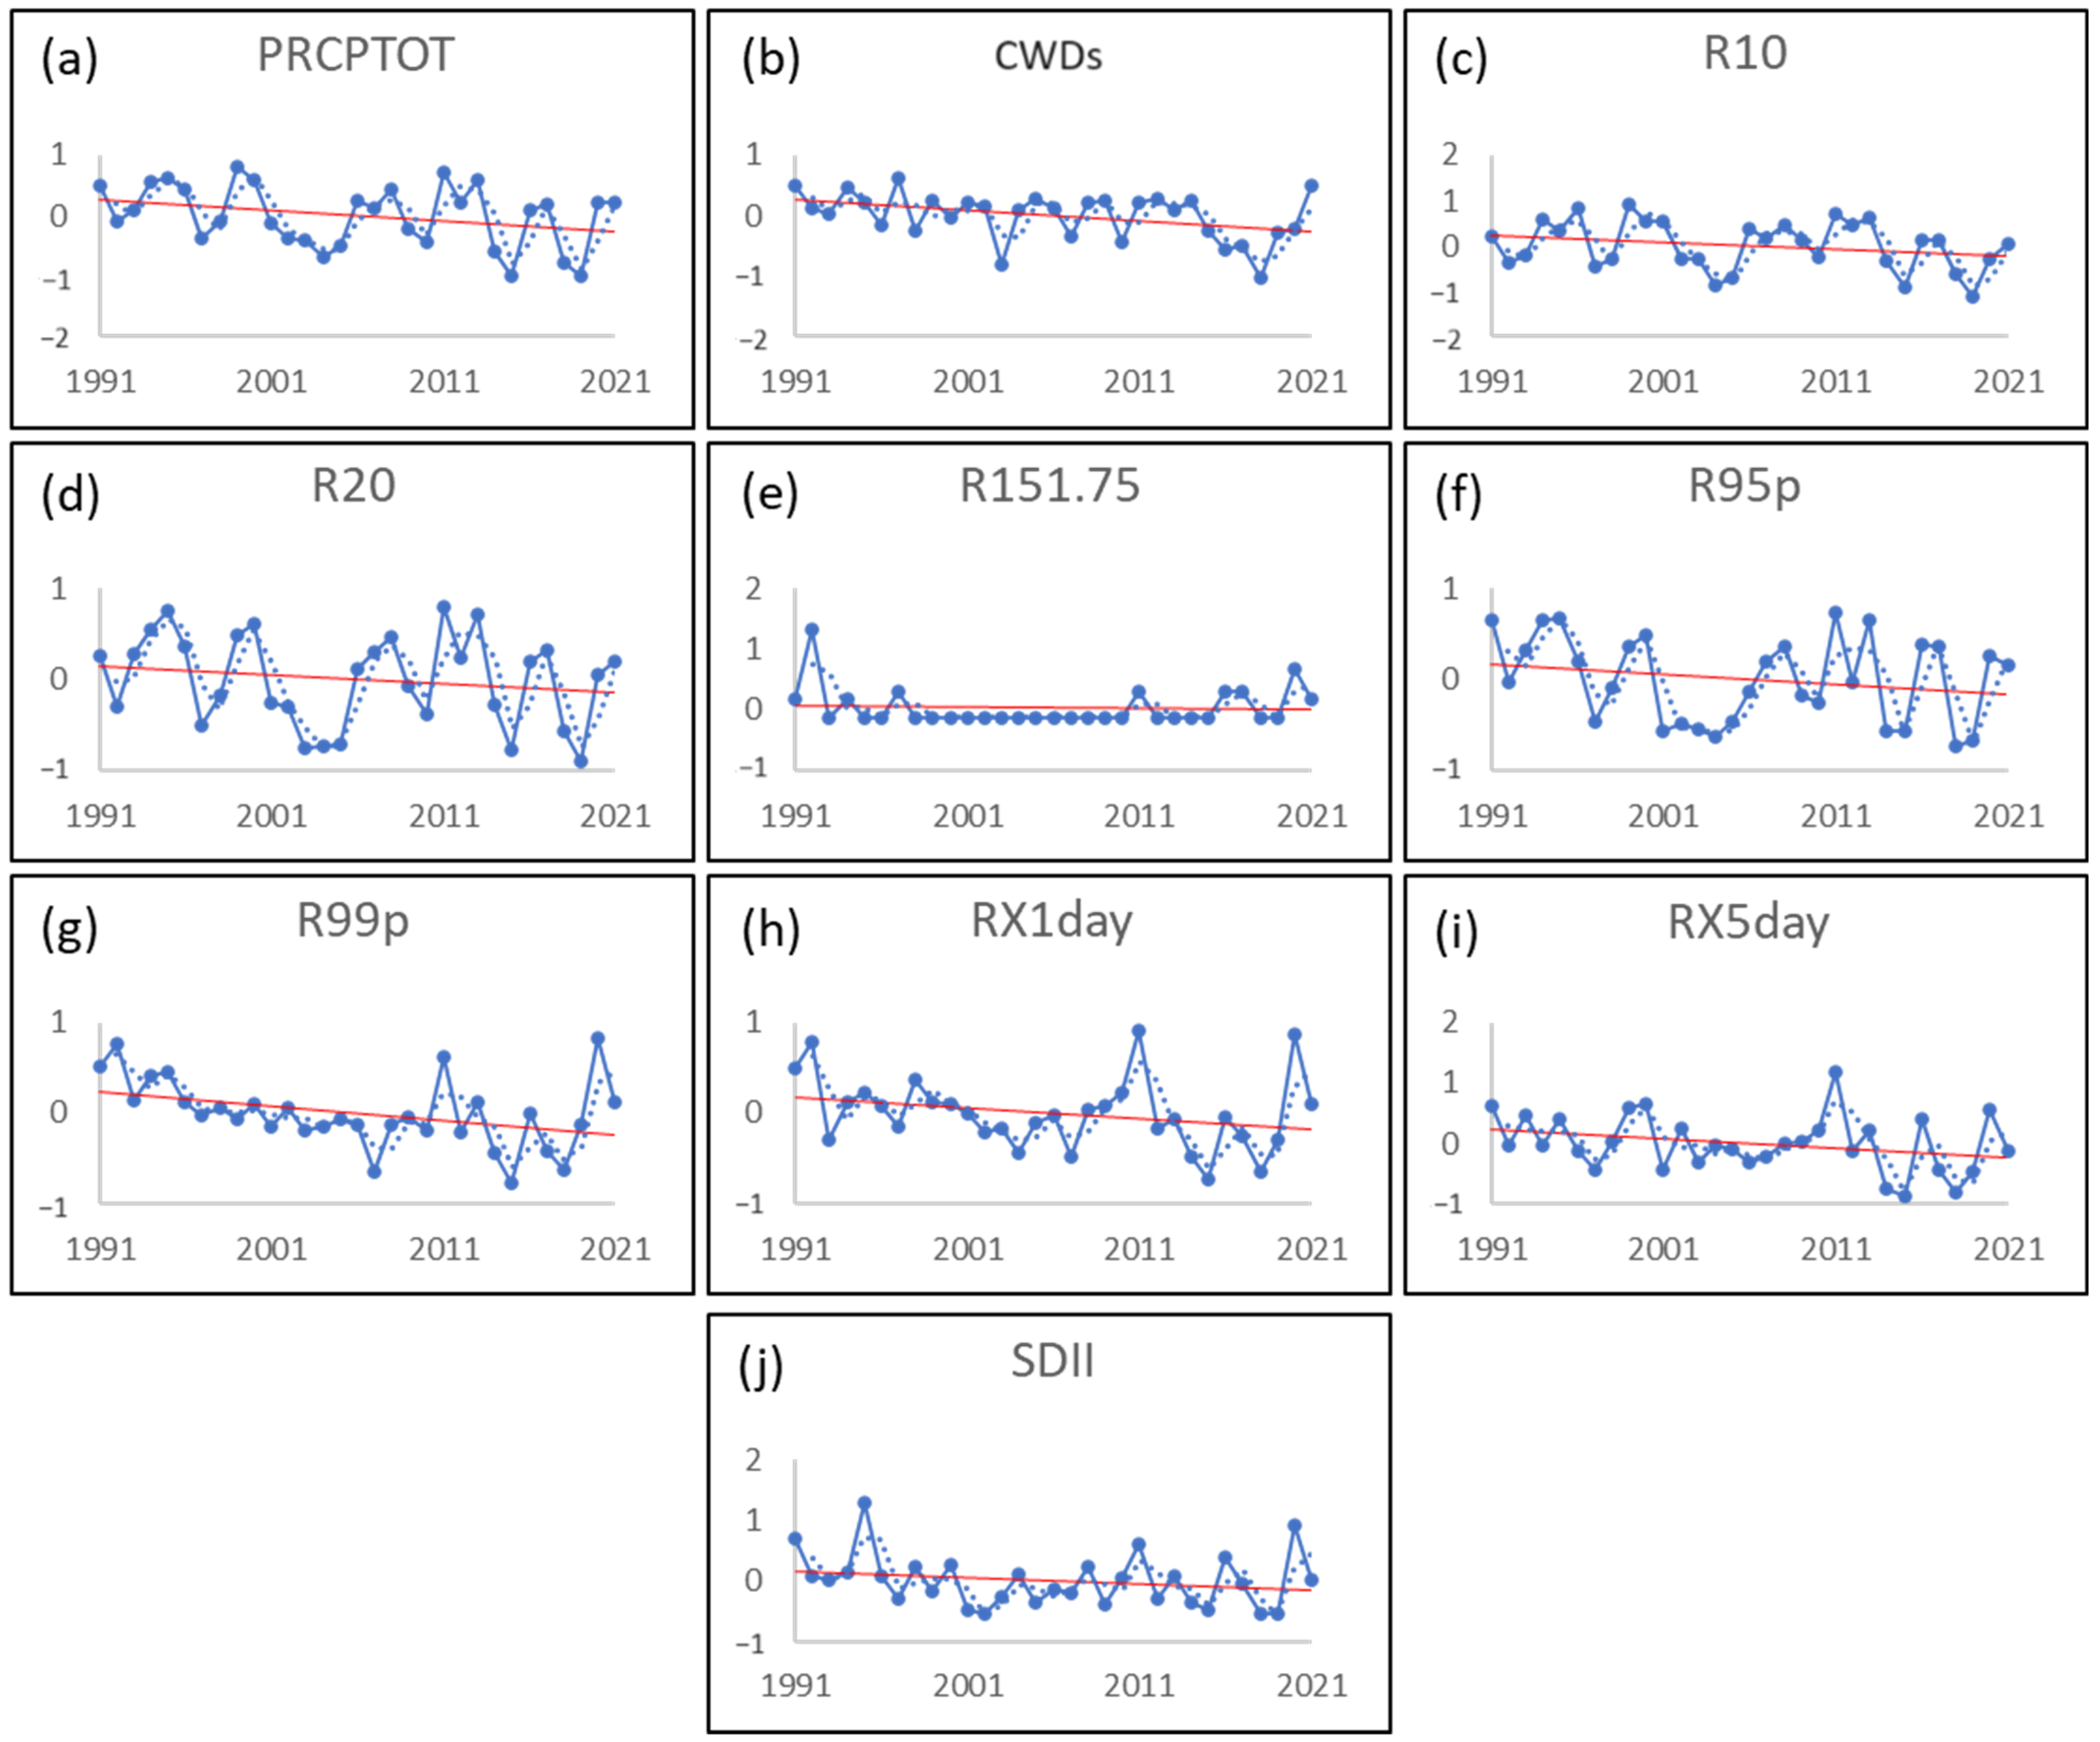
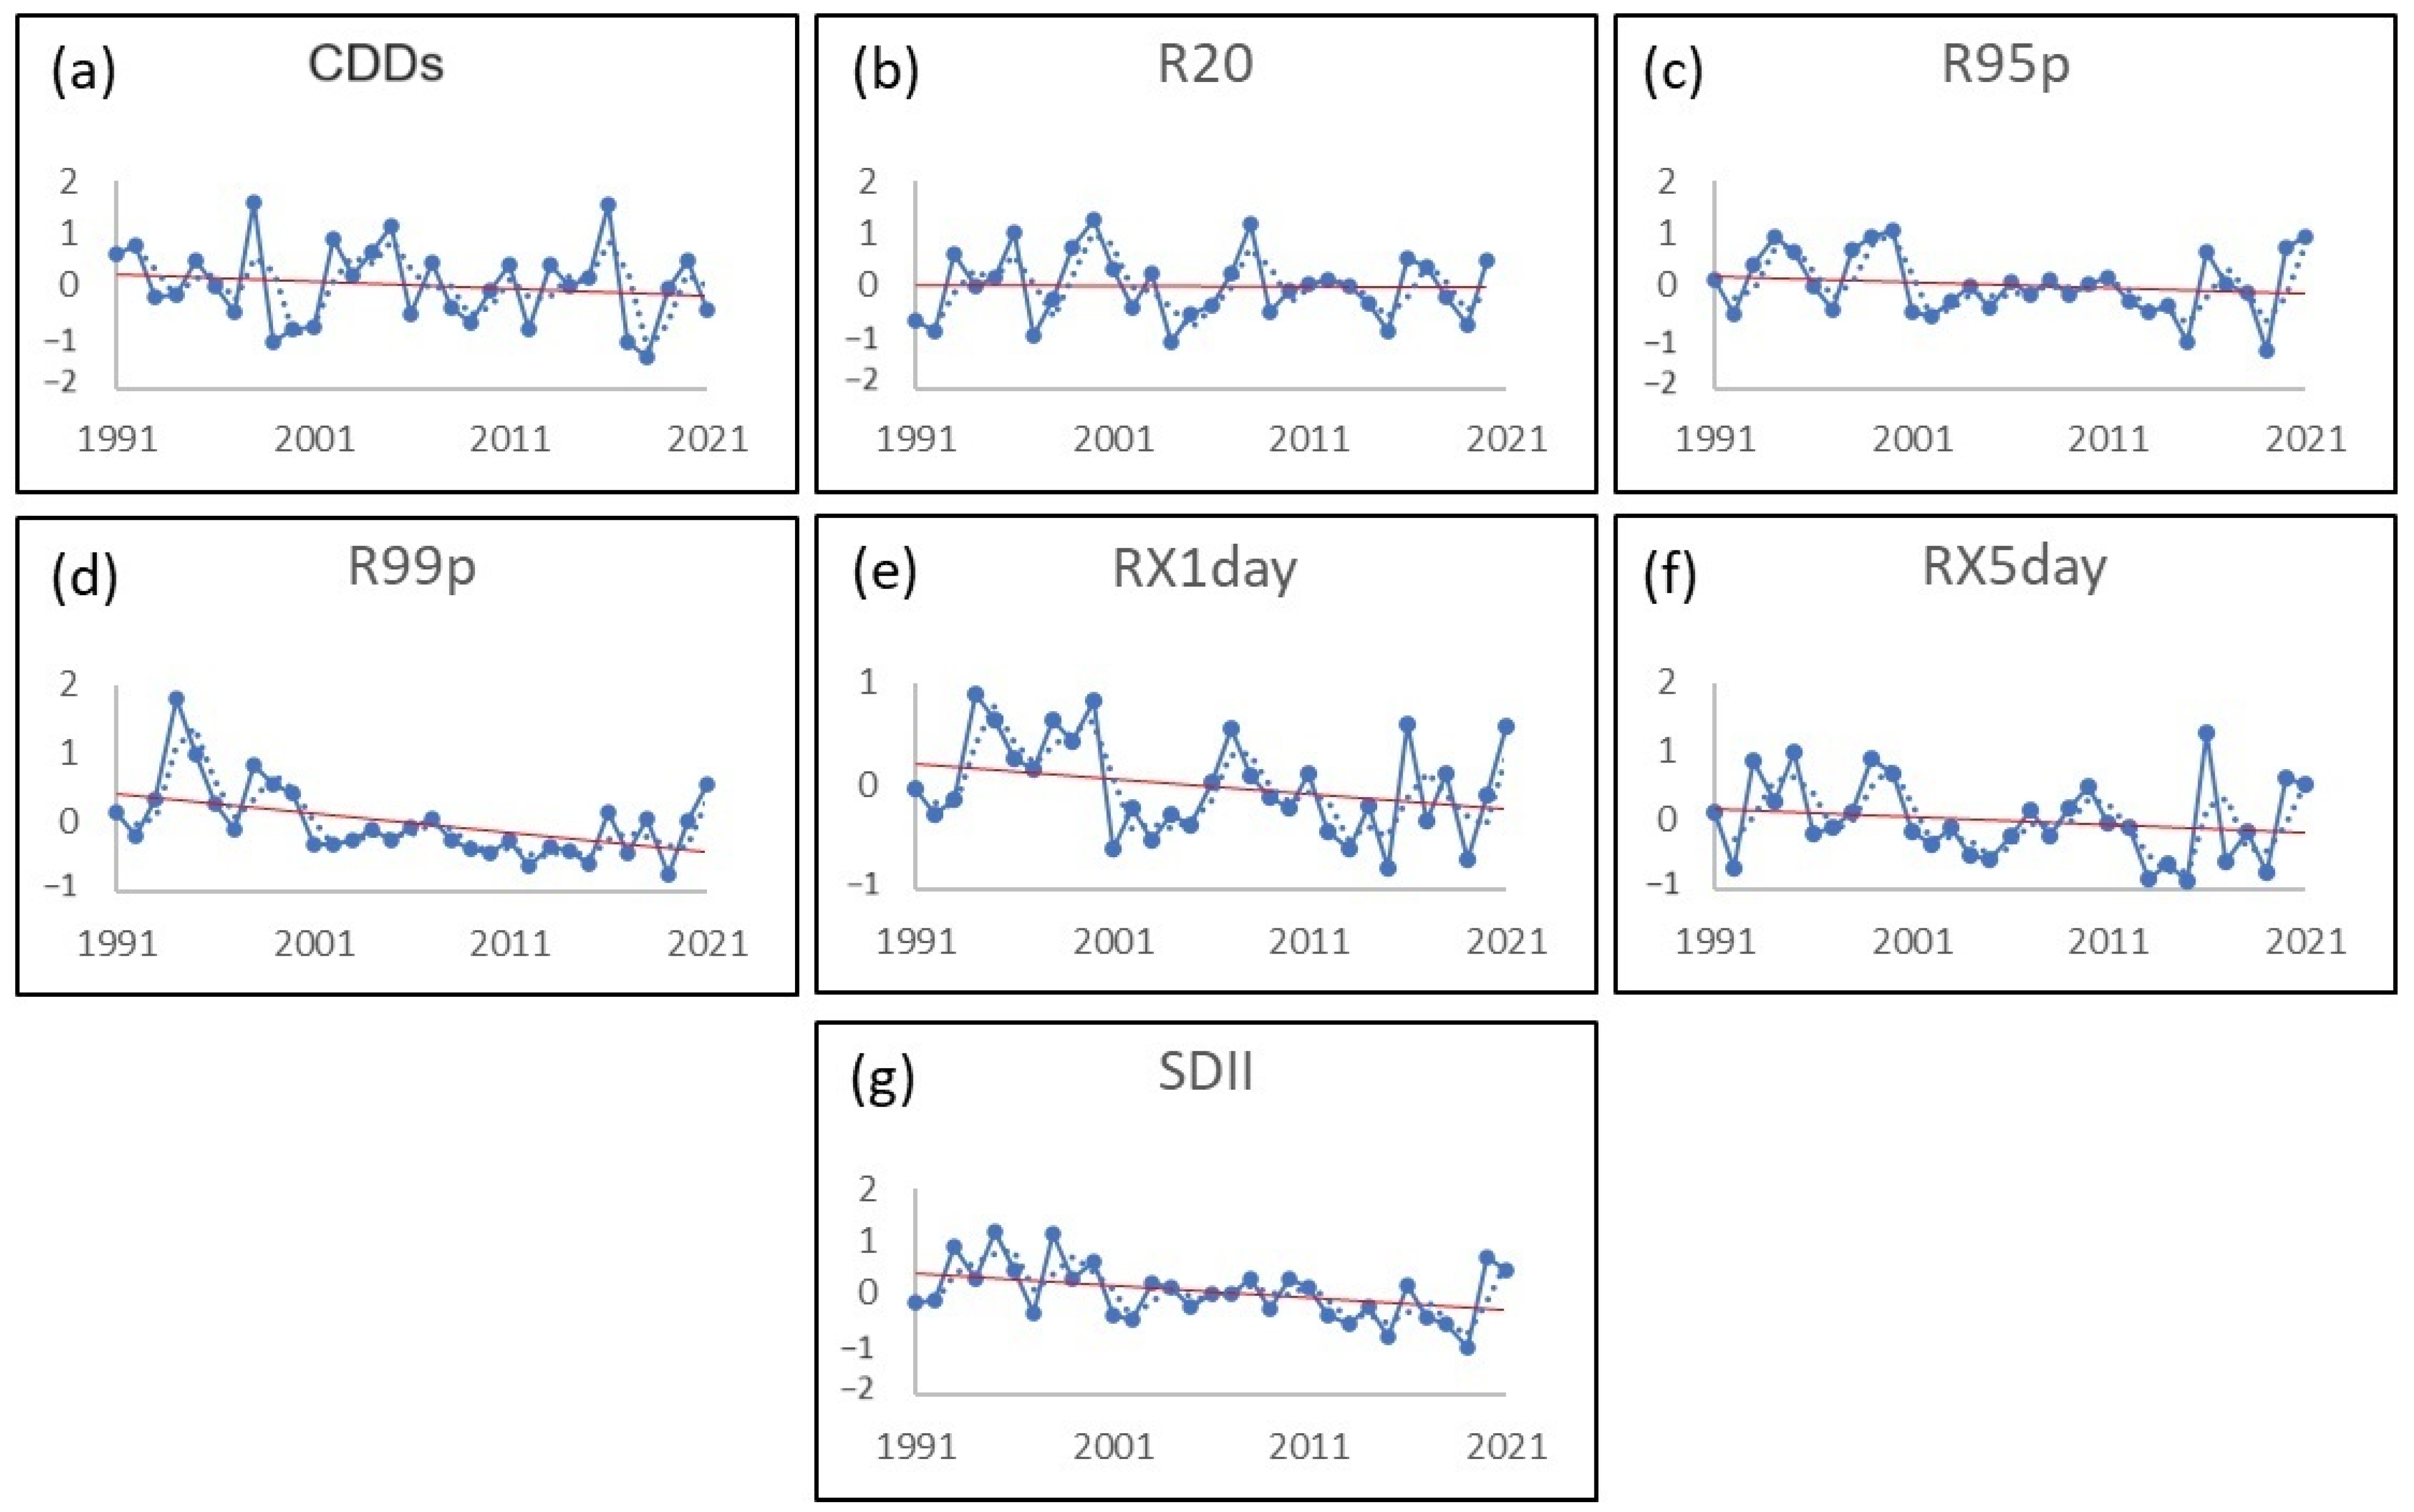
The annual time series of 11 extreme rainfall indices, derived from the rainfall data of all stations in specific Tonle Sap regions, are presented in Figure 6 and Figure 7. Figure 6 shows that the linear trend of CDDs exhibits a slight increase in the normalized value, indicating that the trend is not significant in this region. Figure 7 reveals a downward trend across all indicators in the Tonle Sap region. R10 and R20 display negative rates of −0.015 and −0.01, respectively, while CWDs have decreased by −0.016. The R95p indicator fluctuated over time, with an overall decrease of −0.018. Other indicators, such as R99p, RX1day, RX5day, PRCPTOT, and SDII, also show similar negative trends with annual rates around −0.01. Additionally, R151.75 exhibited a particularly low rate of change.
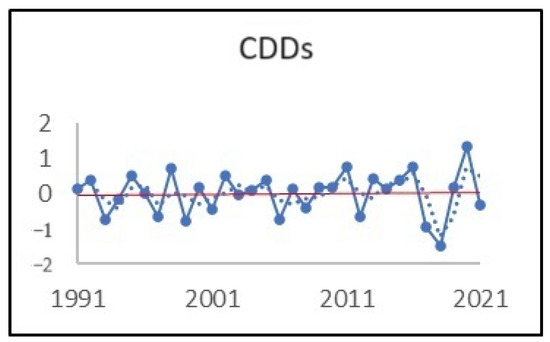
Figure 6.
The temporal variation of the increasing trend for the Tonle Sap region of the CDDs extreme rainfall index. The solid red line is the linear trend, the solid blue line is the annual variations, and the dotted blue line is the ten-year smoothing average.
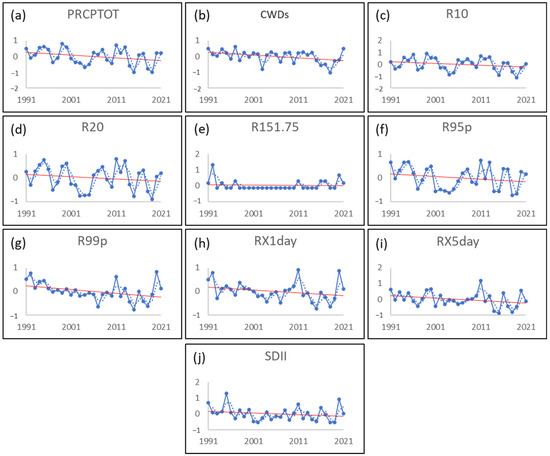
Figure 7.
The temporal variation of the decreasing trends for the Tonle Sap region of extreme rainfall indices: (a) PRCPTOT, (b) CWDs, (c) R10, (d) R20, (e) R151.75, (f) R95p, (g) R99p, (h) RX1day, (i) RX5day, and (j) SDII. The solid red line is the linear trend, the solid blue line is the annual variations, and the dotted blue line is the ten-year smoothing average.
3.2.2. Coastal Region
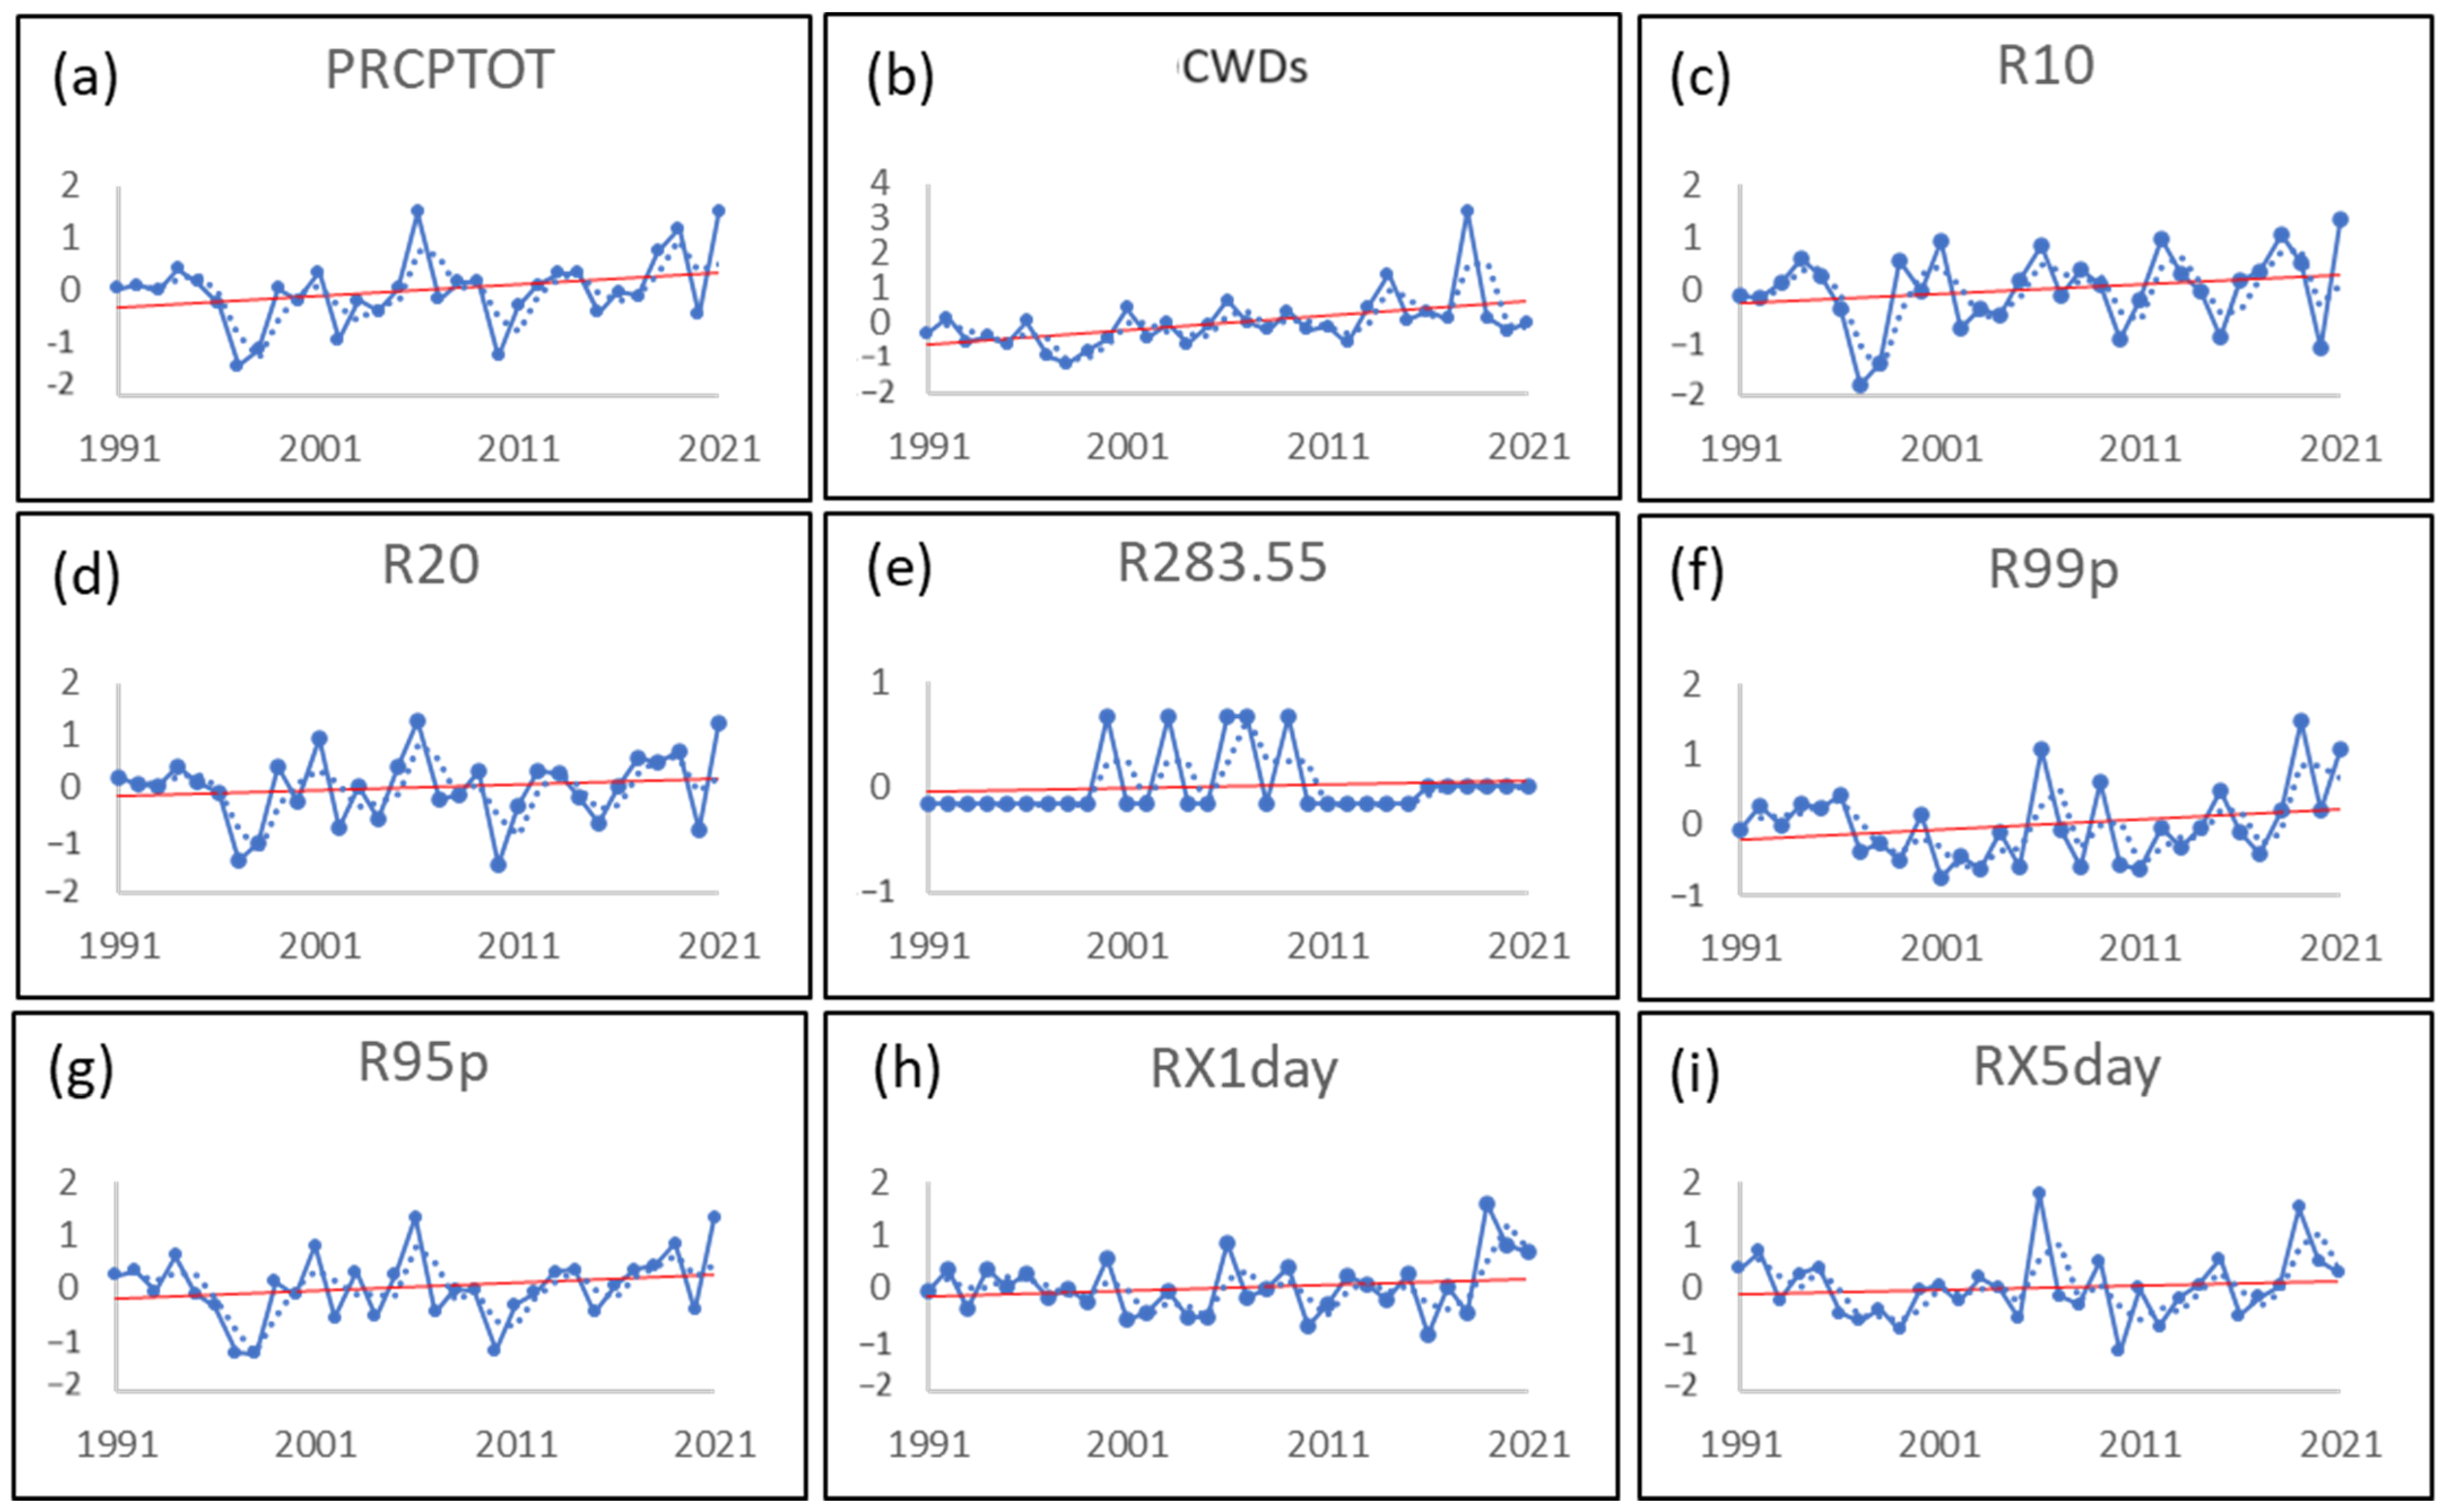
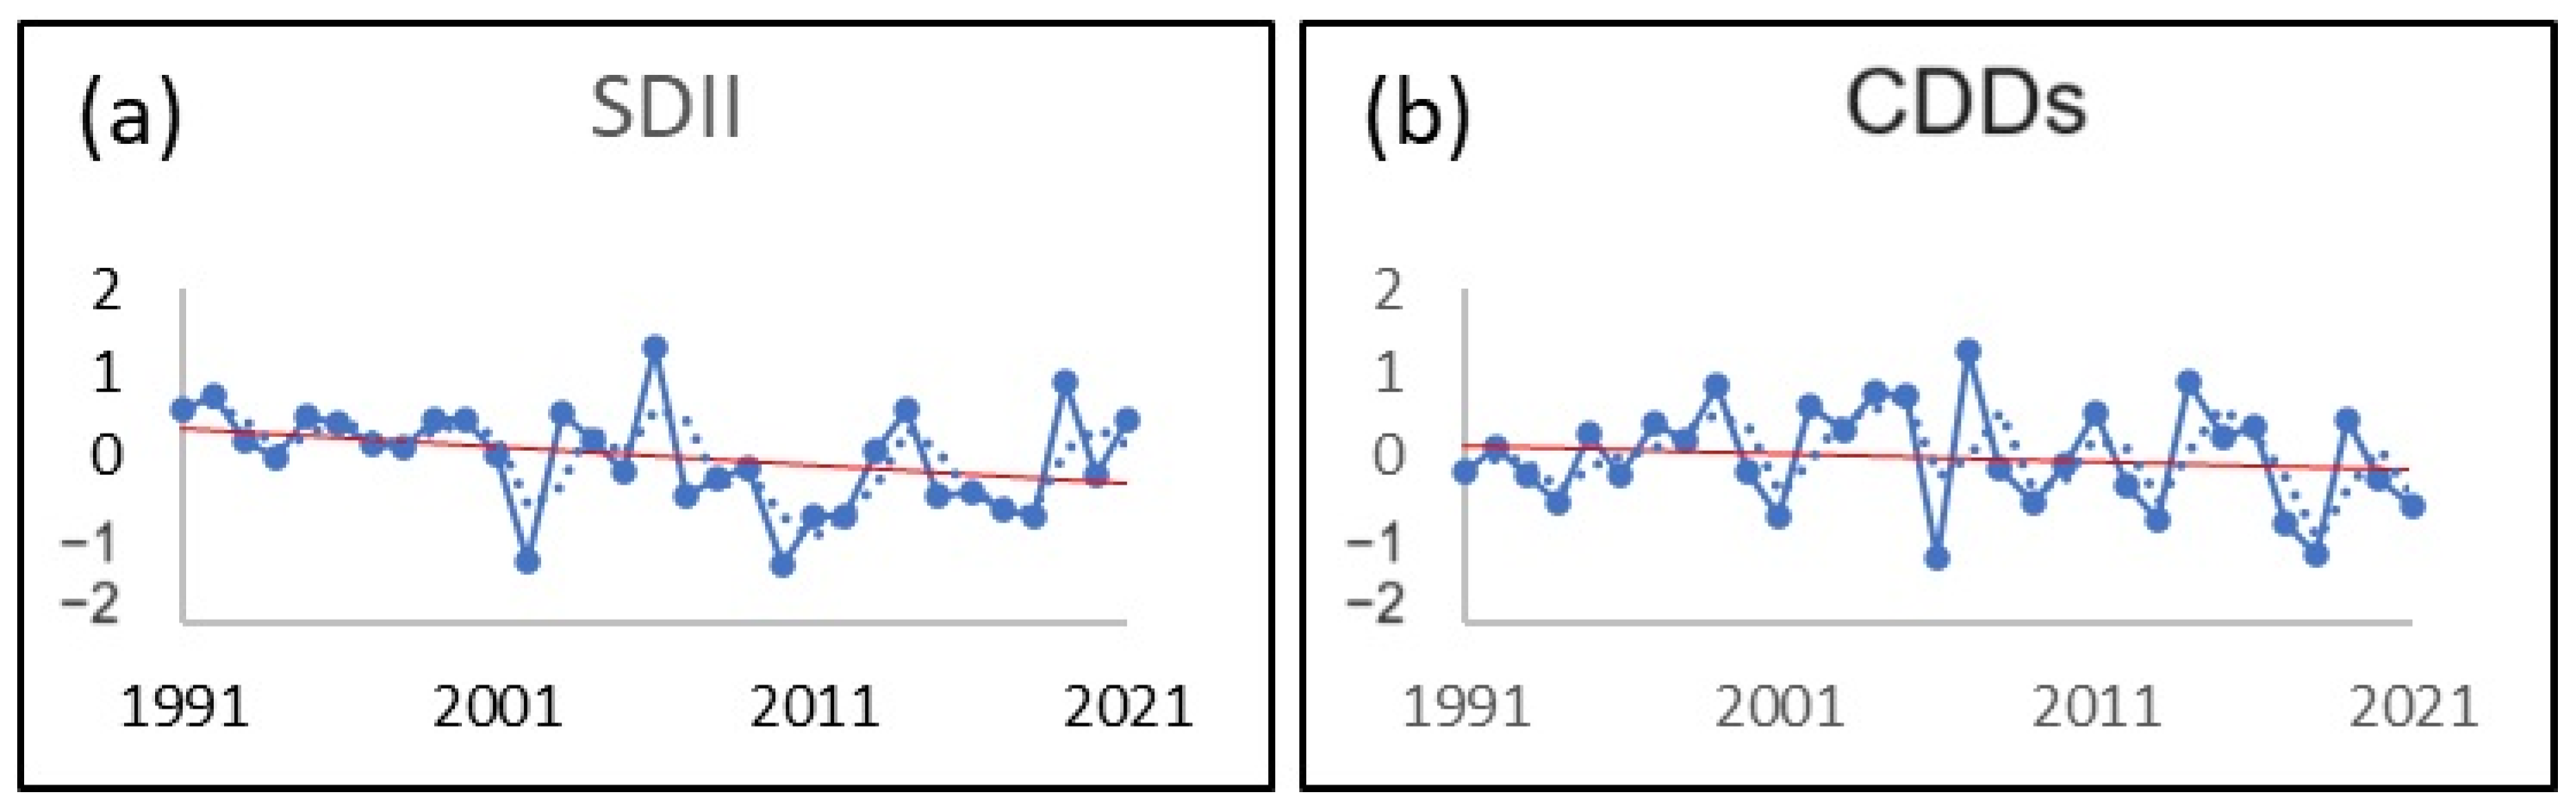
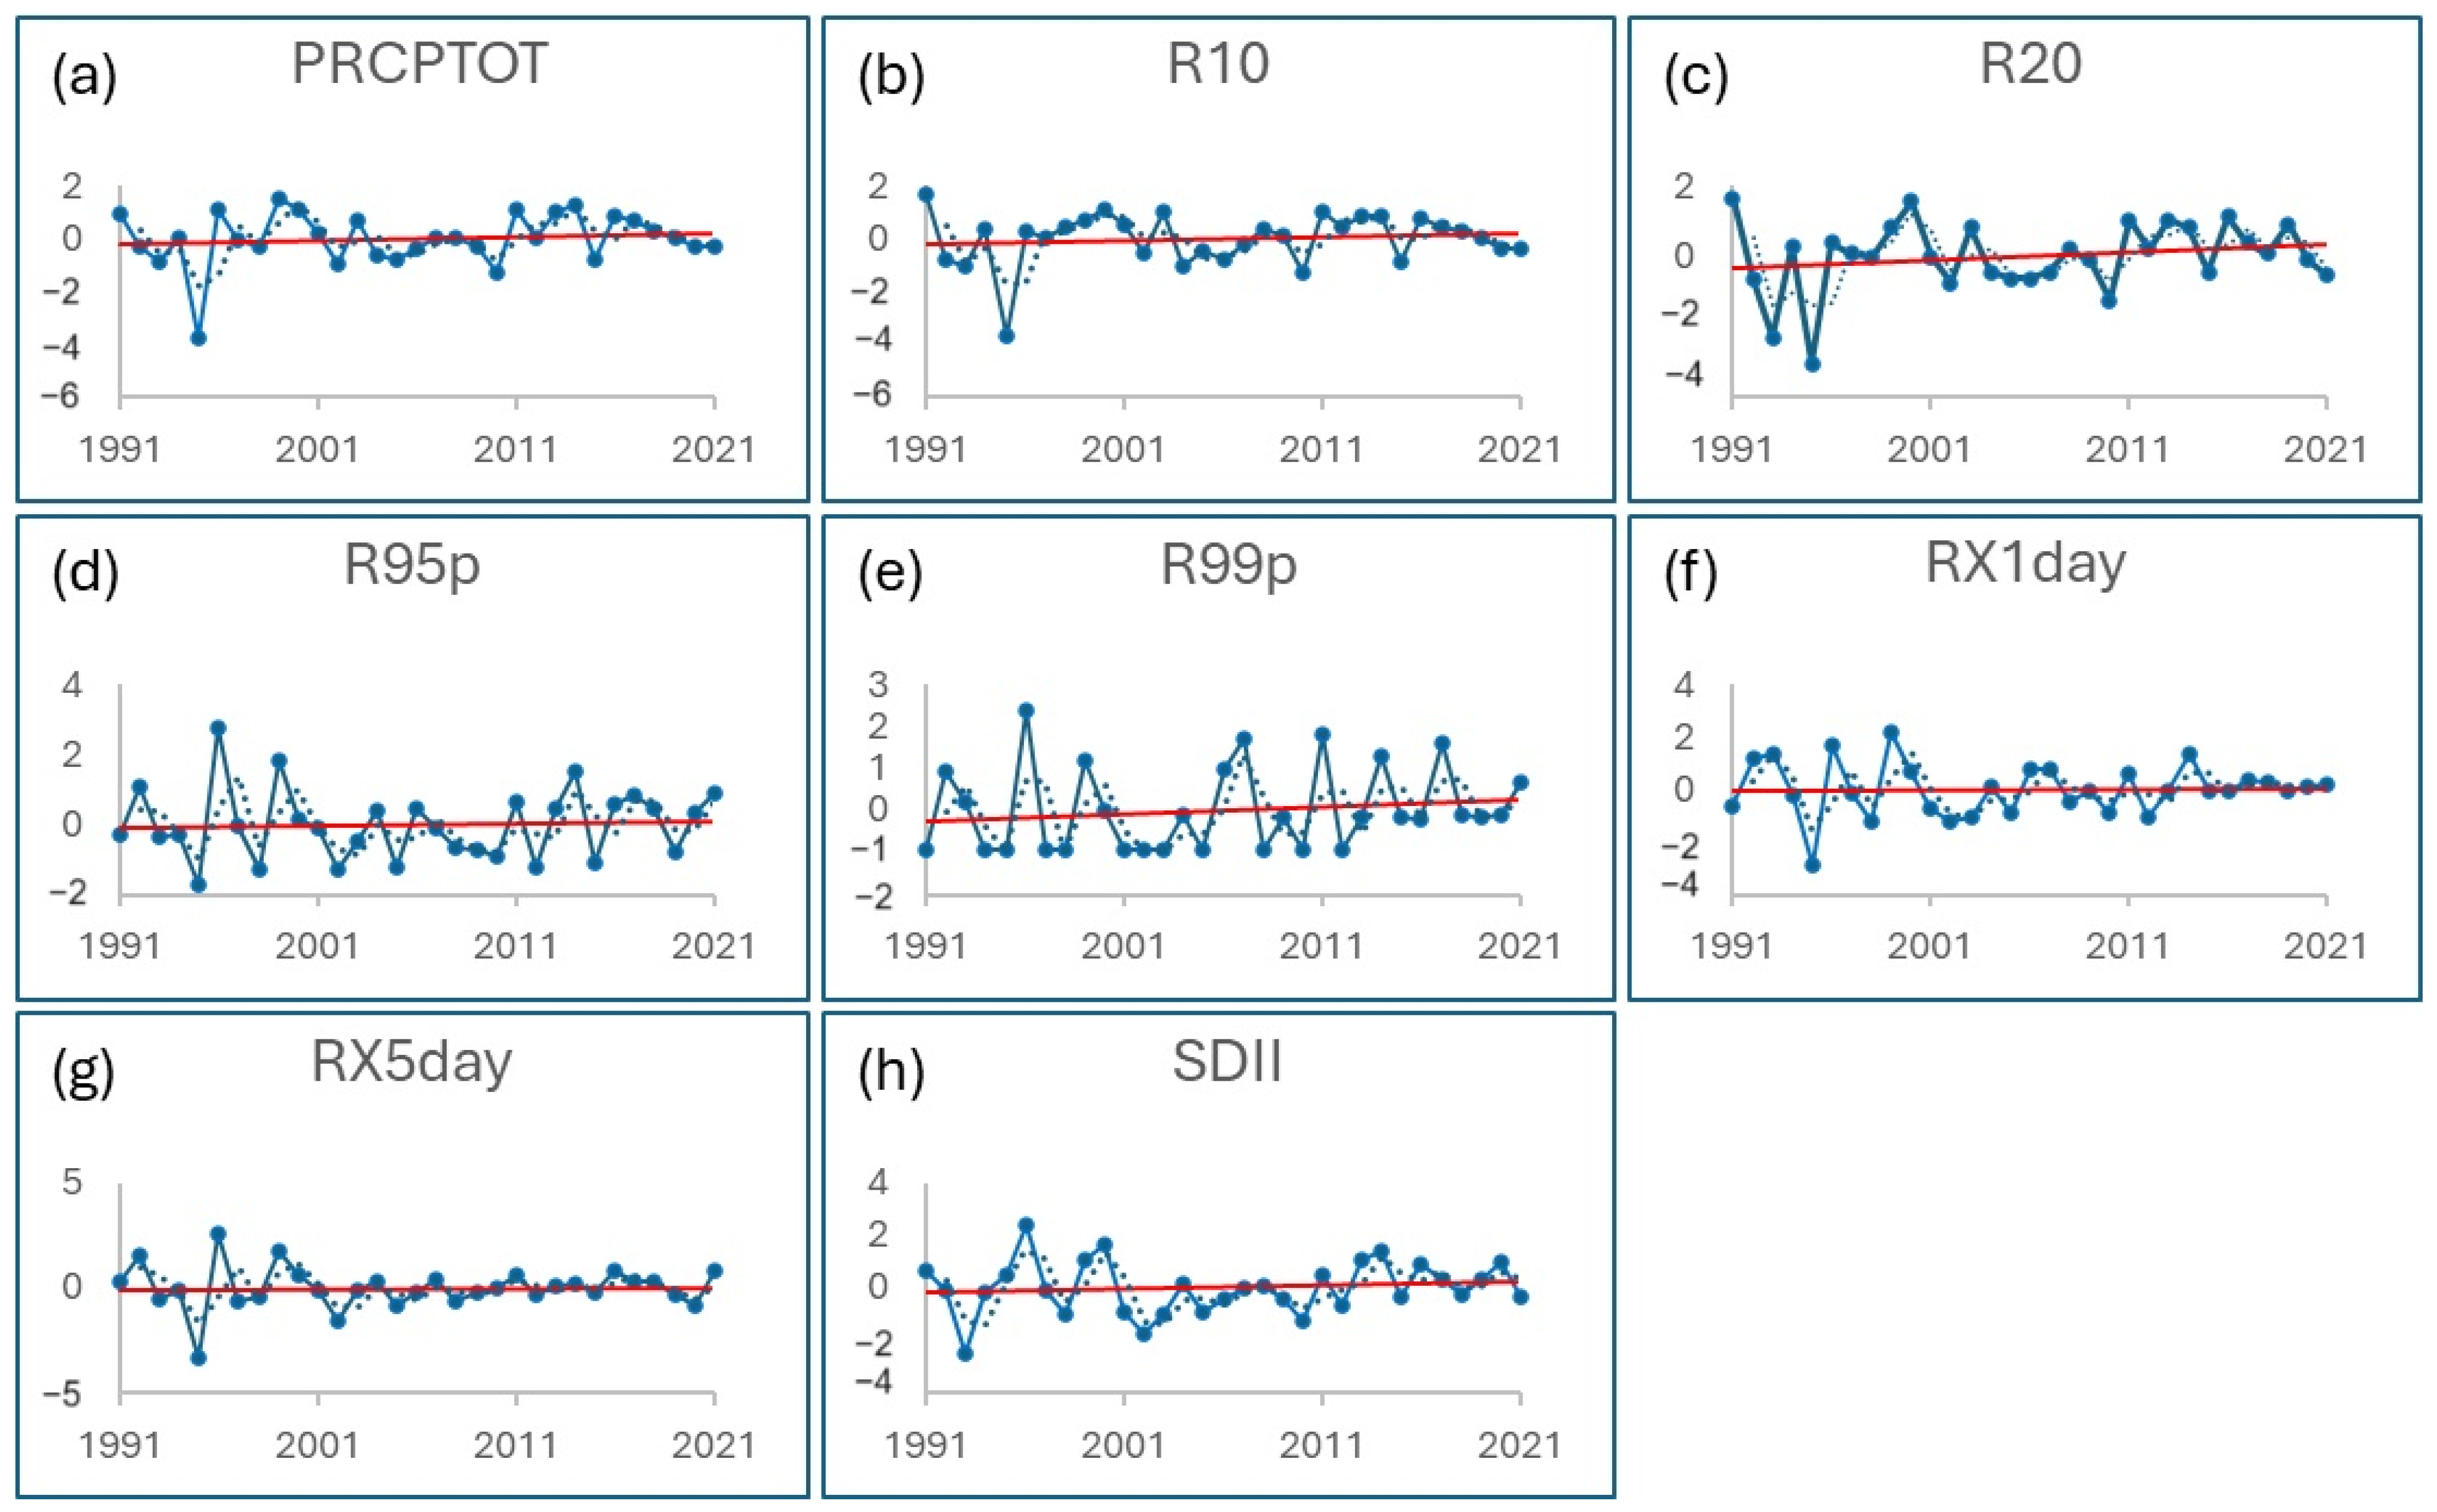
The rainfall indices in the coastal region of Cambodia showed an upward trend from 1991 to 2021 (Figure 8 and Figure 9). Most indices revealed positive trends, except for the CDDs and SDII indices in the southwest of Cambodia (Figure 9a,b), which exhibited a negative trend. An increasing trend was observed for PRCPTOT, with a rate of change of 0.022 (Figure 8a), and the CWDs trend also increased, with a change rate of 0.0405 (Figure 8b). As seen in Figure 8c,d, the regional values of R10 and R20 were similar, with positive trend rates of 0.0183 and 0.0108, respectively. Regarding the rainfall indices in the coastal region, both R99p and R95p showed an increasing trend, with rates of change of 0.0142 and 0.0149, respectively. The trends of RX1day and RX5day also showed positive values, at 0.0111 and 0.0151, respectively. In Figure 9, the rainfall indices in the coastal region of Cambodia showed a decreasing trend over 31 years. The trend of SDII decreased with a change rate of −0.0216, and CDDs showed a negative trend with a rate of change of −0.0101 in the southwest of Cambodia.
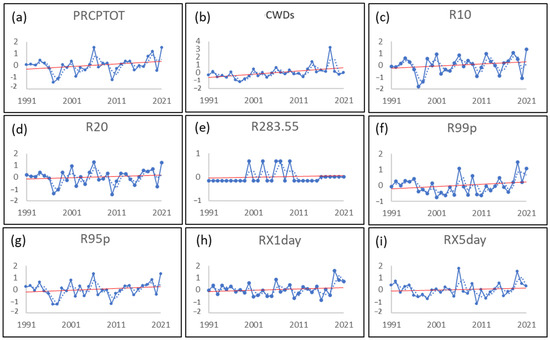
Figure 8.
The temporal variation of the increasing trends for the coastal region of extreme rainfall indices: (a) PRCPTOT, (b) CWDs, (c) R10, (d) R20, (e) R283.55, (f) R99p, (g) R95p, (h) RX1day, and (i) RX5day. The solid red line is the linear trend, the solid blue line is the annual variations, and the dotted blue line is the ten-year smoothing average.
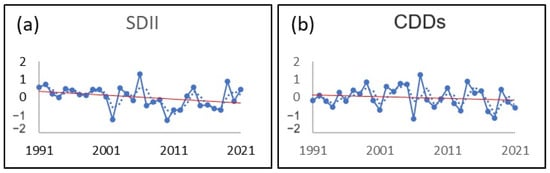
Figure 9.
The temporal variation of the decreasing trends for the coastal region of extreme rainfall indices: (a) SDII, and (b) CDDs. The solid red line is the linear trend, the solid blue line is the annual variations, and the dotted blue line is the ten-year smoothing average.
3.2.3. Mekong Delta
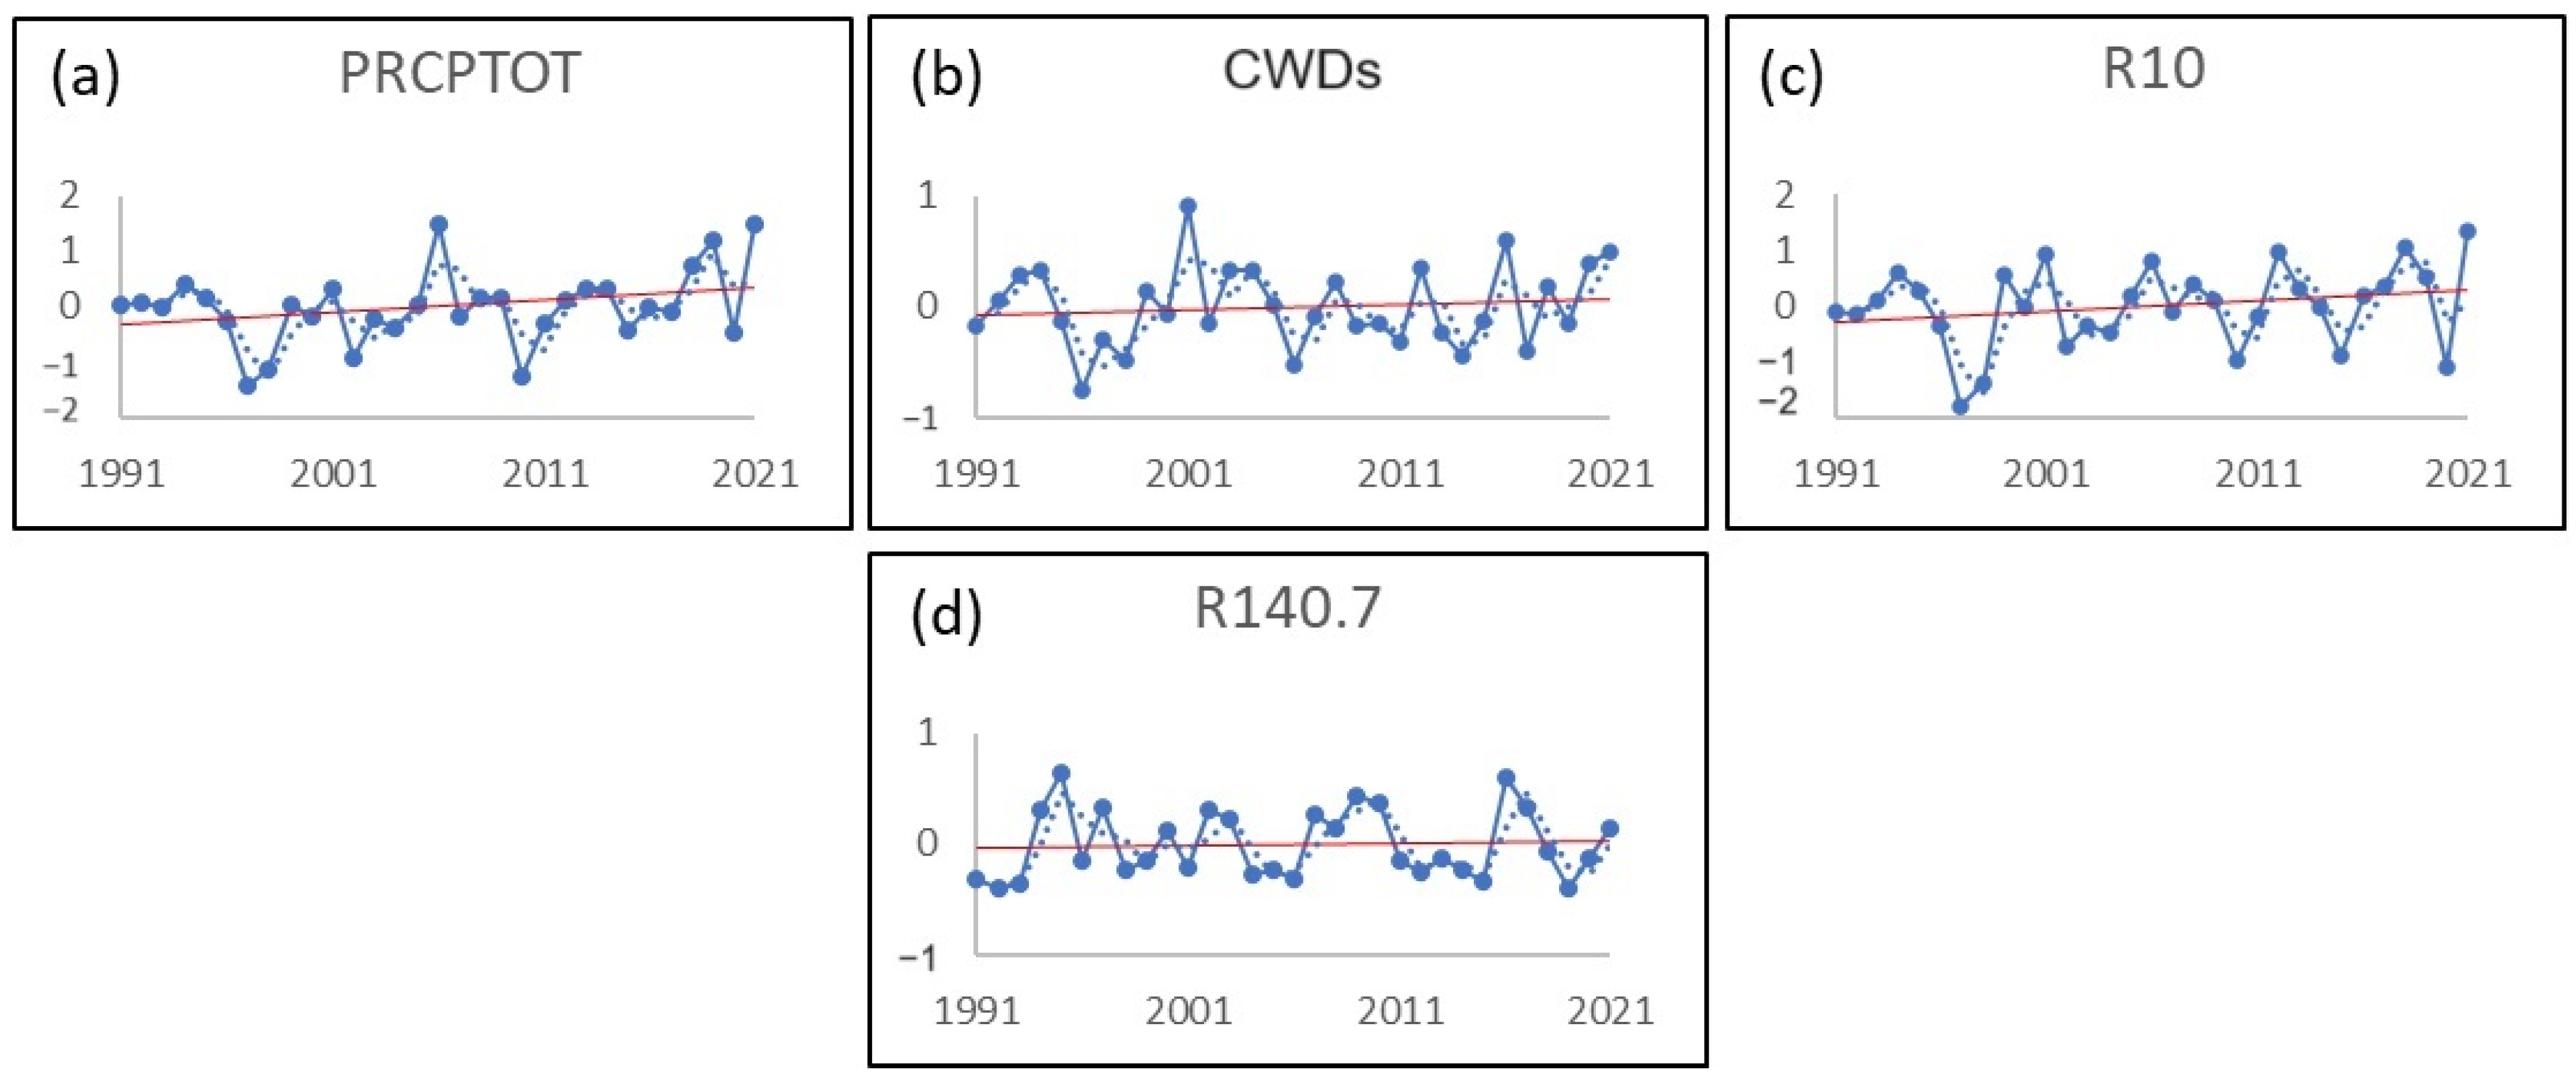
The linear regressive approach was used to assess the regional average of the annual series trends in 11 extreme precipitation indices in the Mekong Delta. The factors influencing changes in extreme precipitation events result in a region being more vulnerable to changes in precipitation, which makes it more difficult to manage water resources, prevent flooding, and maintain sustainable agriculture. As shown in Figure 10, the linear trend of PRCPTOT indicates the low change of an increasing trend with a rate of 0.0055, while the trends of CWDs increased with a change rate of 0.0048. The regional values of R10 showed the highest rate of positive trends in the Mekong Delta at 0.018. Figure 11 illustrates the decreasing trends in the Mekong Delta. CDDs decreased at a rate of −0.0141, while R20 showed a negative trend of −0.001. R95p and R99p displayed downward trends of −0.01 and −0.02, respectively. Additionally, the heavy rainfall indicators RX1day and RX5day both exhibited a decreasing trend of −0.01.
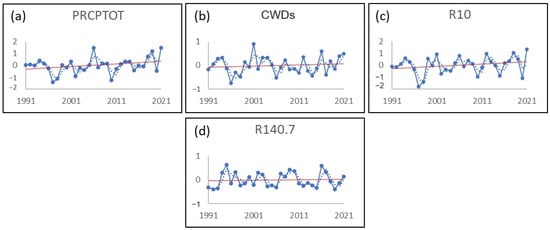
Figure 10.
The temporal variation of increasing trends for the Mekong Delta of extreme rainfall indices: (a) PRCPTOT, (b) CWDs, (c) R10, and (d) R140.7. The solid red line is the linear trend, the solid blue line is the annual variations, and the dotted blue line is the ten-year smoothing average.
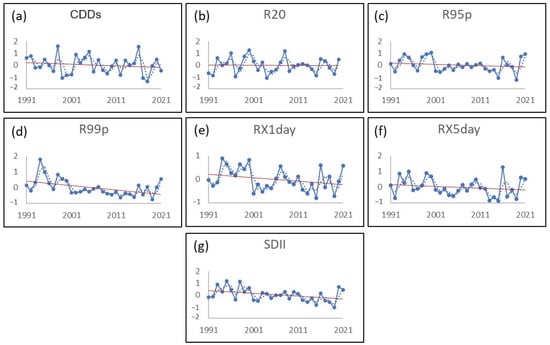
Figure 11.
The temporal variation of decreasing trends for the Mekong Delta of extreme rainfall indices: (a) CDDs, (b) R20, (c) R95p, (d) R99p, (e) RX1day, (f) RX5day, and (g) SDII. The solid red line is the linear trend, the solid blue line is the annual variations, and the dotted blue line is the ten-year smoothing average.
3.2.4. Upper Mekong
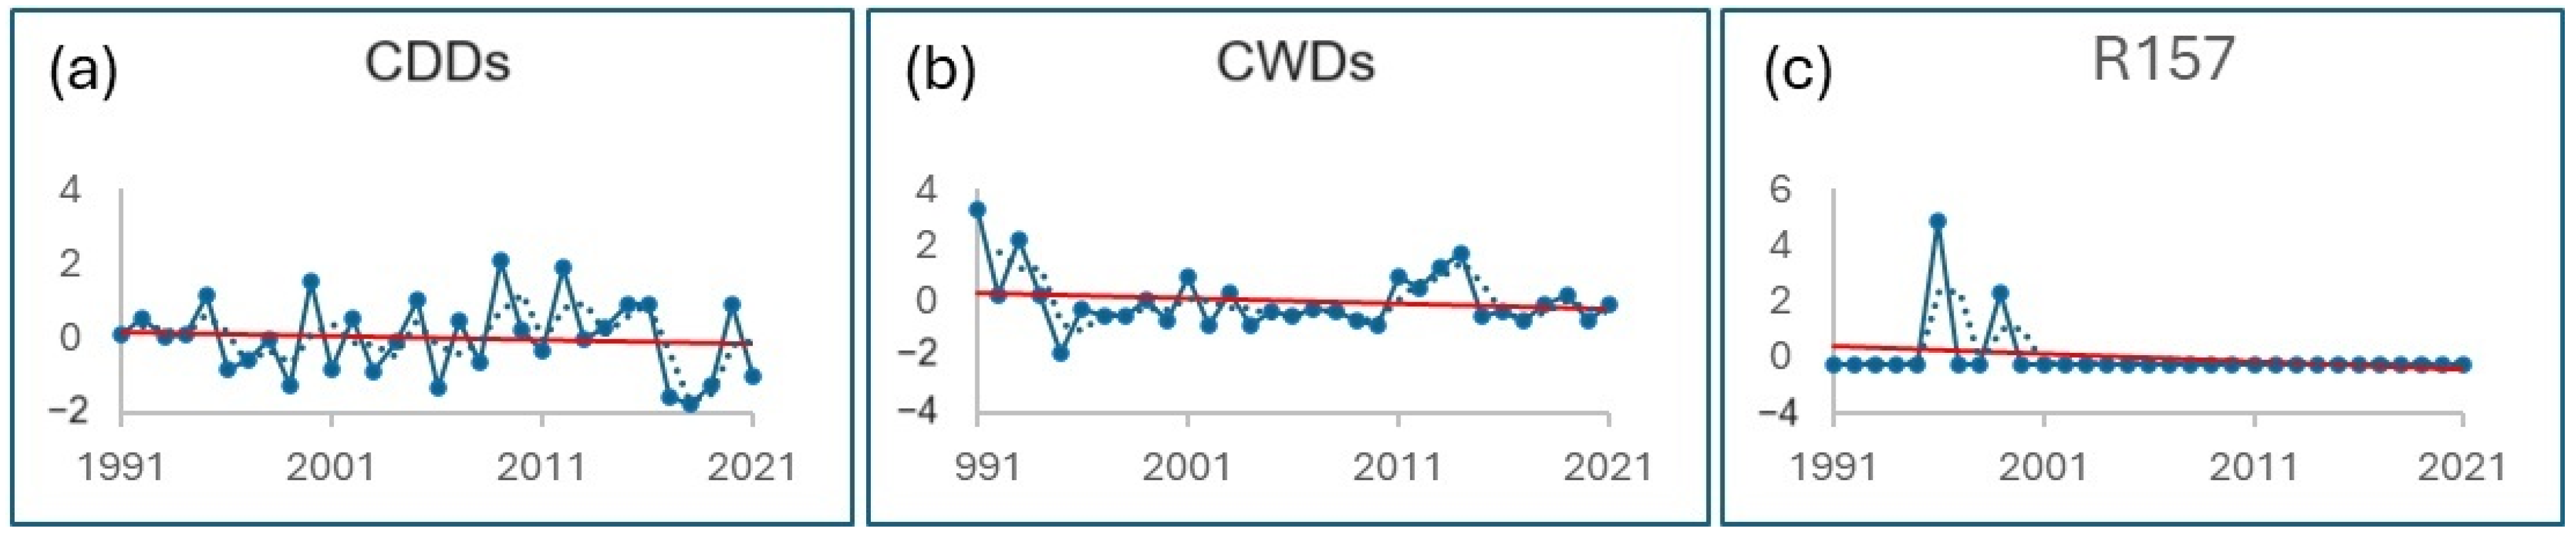
Figure 12 and Figure 13 depict the temporal variations in the Upper Mekong. Most extreme rainfall indices showed an upward trend. Specifically, Figure 12 illustrates an increase in PRCPTOT by 0.016, as well as increases in R10 and R20 by 0.0127 and 0.228, respectively. R99p had a slope of 0.017. Additionally, R95p, RX1day, RX5day, and SDII exhibited minimal changes. Figure 13 highlights the decreasing trends in the Upper Mekong, with CDDs and CWDs showing negative trends of −0.01 and −0.02, respectively, and R157 displaying a negative slope of −0.02.
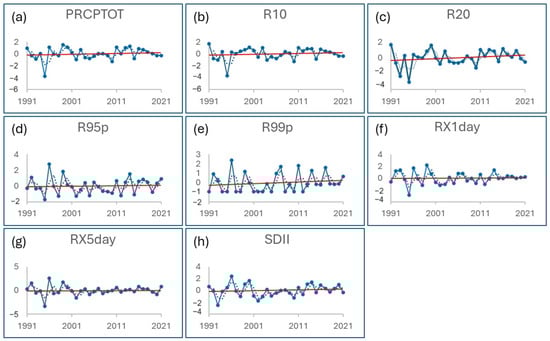
Figure 12.
The temporal variation of the increasing trends for the Upper Mekong of extreme rainfall indices: (a) PRCPTOT, (b) R10, (c) R20, (d) R95p, (e) R99p, (f) RX1day, (g) RX5day, and (h) SDII. The solid red line is the linear trend, the solid blue line is the annual variations, and the dotted blue line is the ten-year smoothing average.
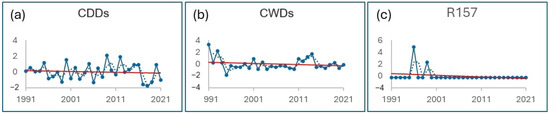
Figure 13.
The temporal variation of the decreasing trends for the Upper Mekong of extreme rainfall indices: (a) CDDs, (b) CWDs, and (c) R157. The solid red line is the linear trend, the solid blue line is the annual variations, and the dotted blue line is the ten-year smoothing average.
3.3. Seasonal Rainfall Analysis
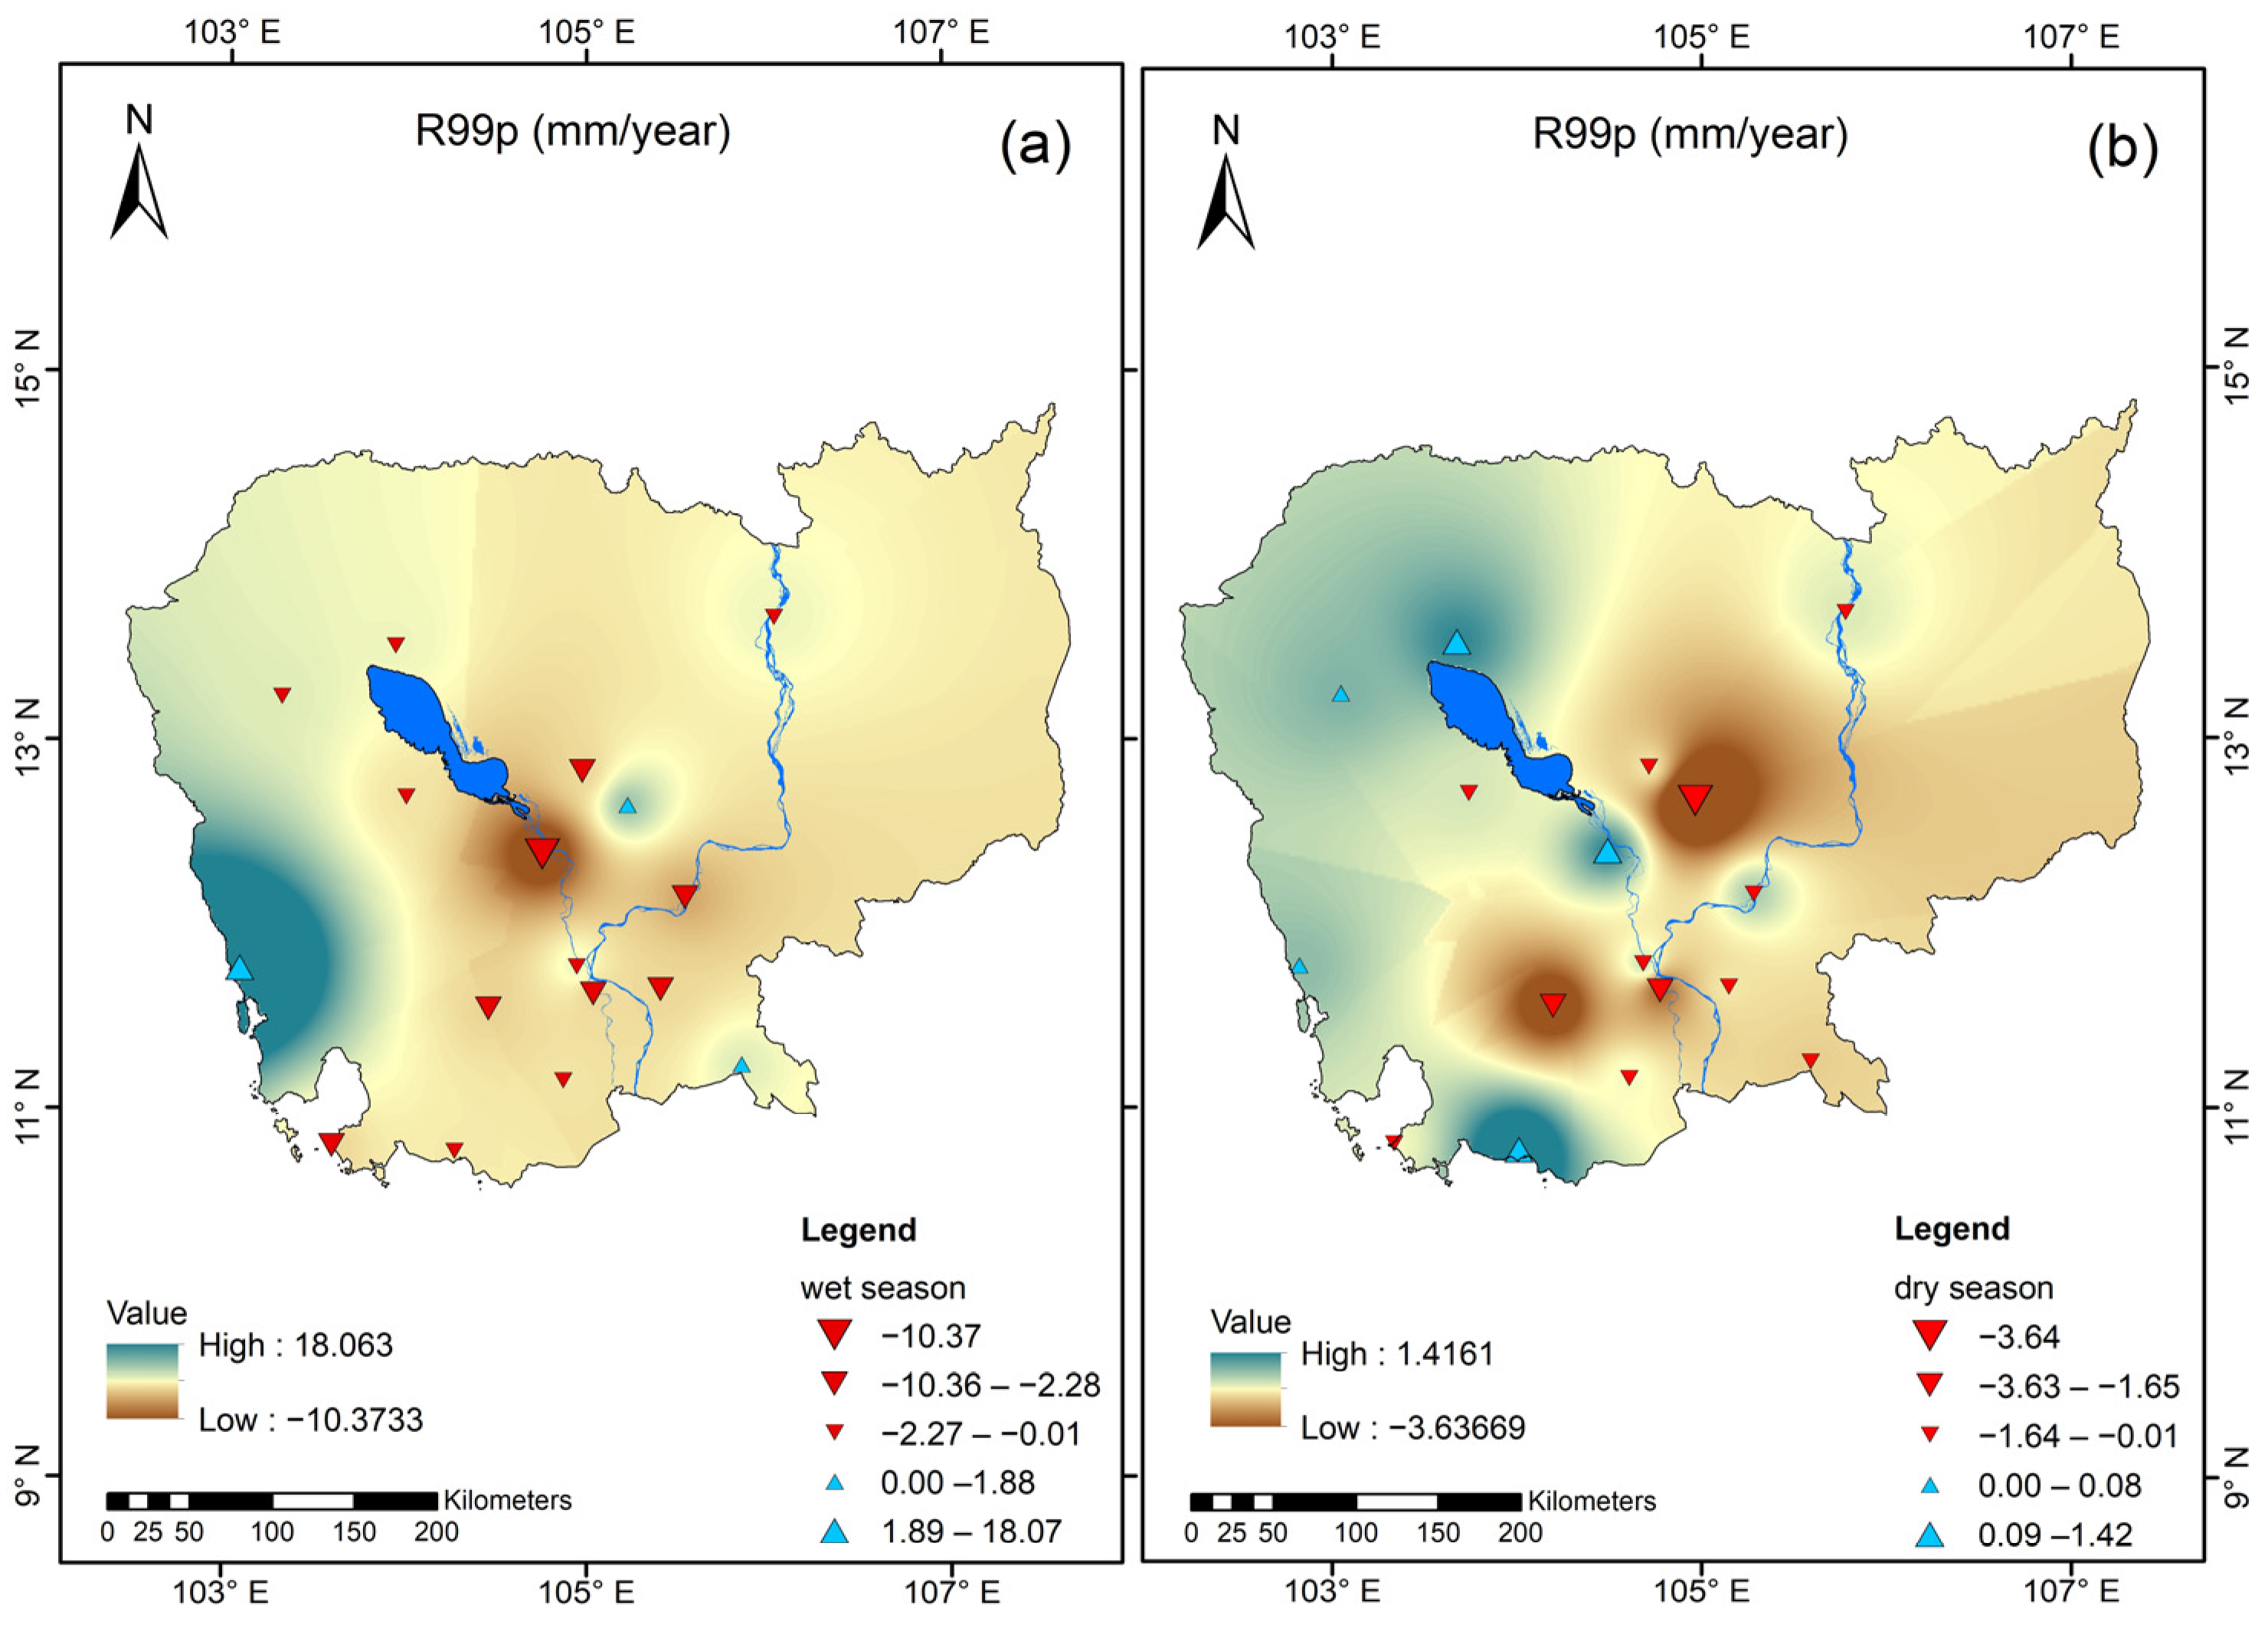
3.3.1. Extreme Rainfall Indices R95p and R99p
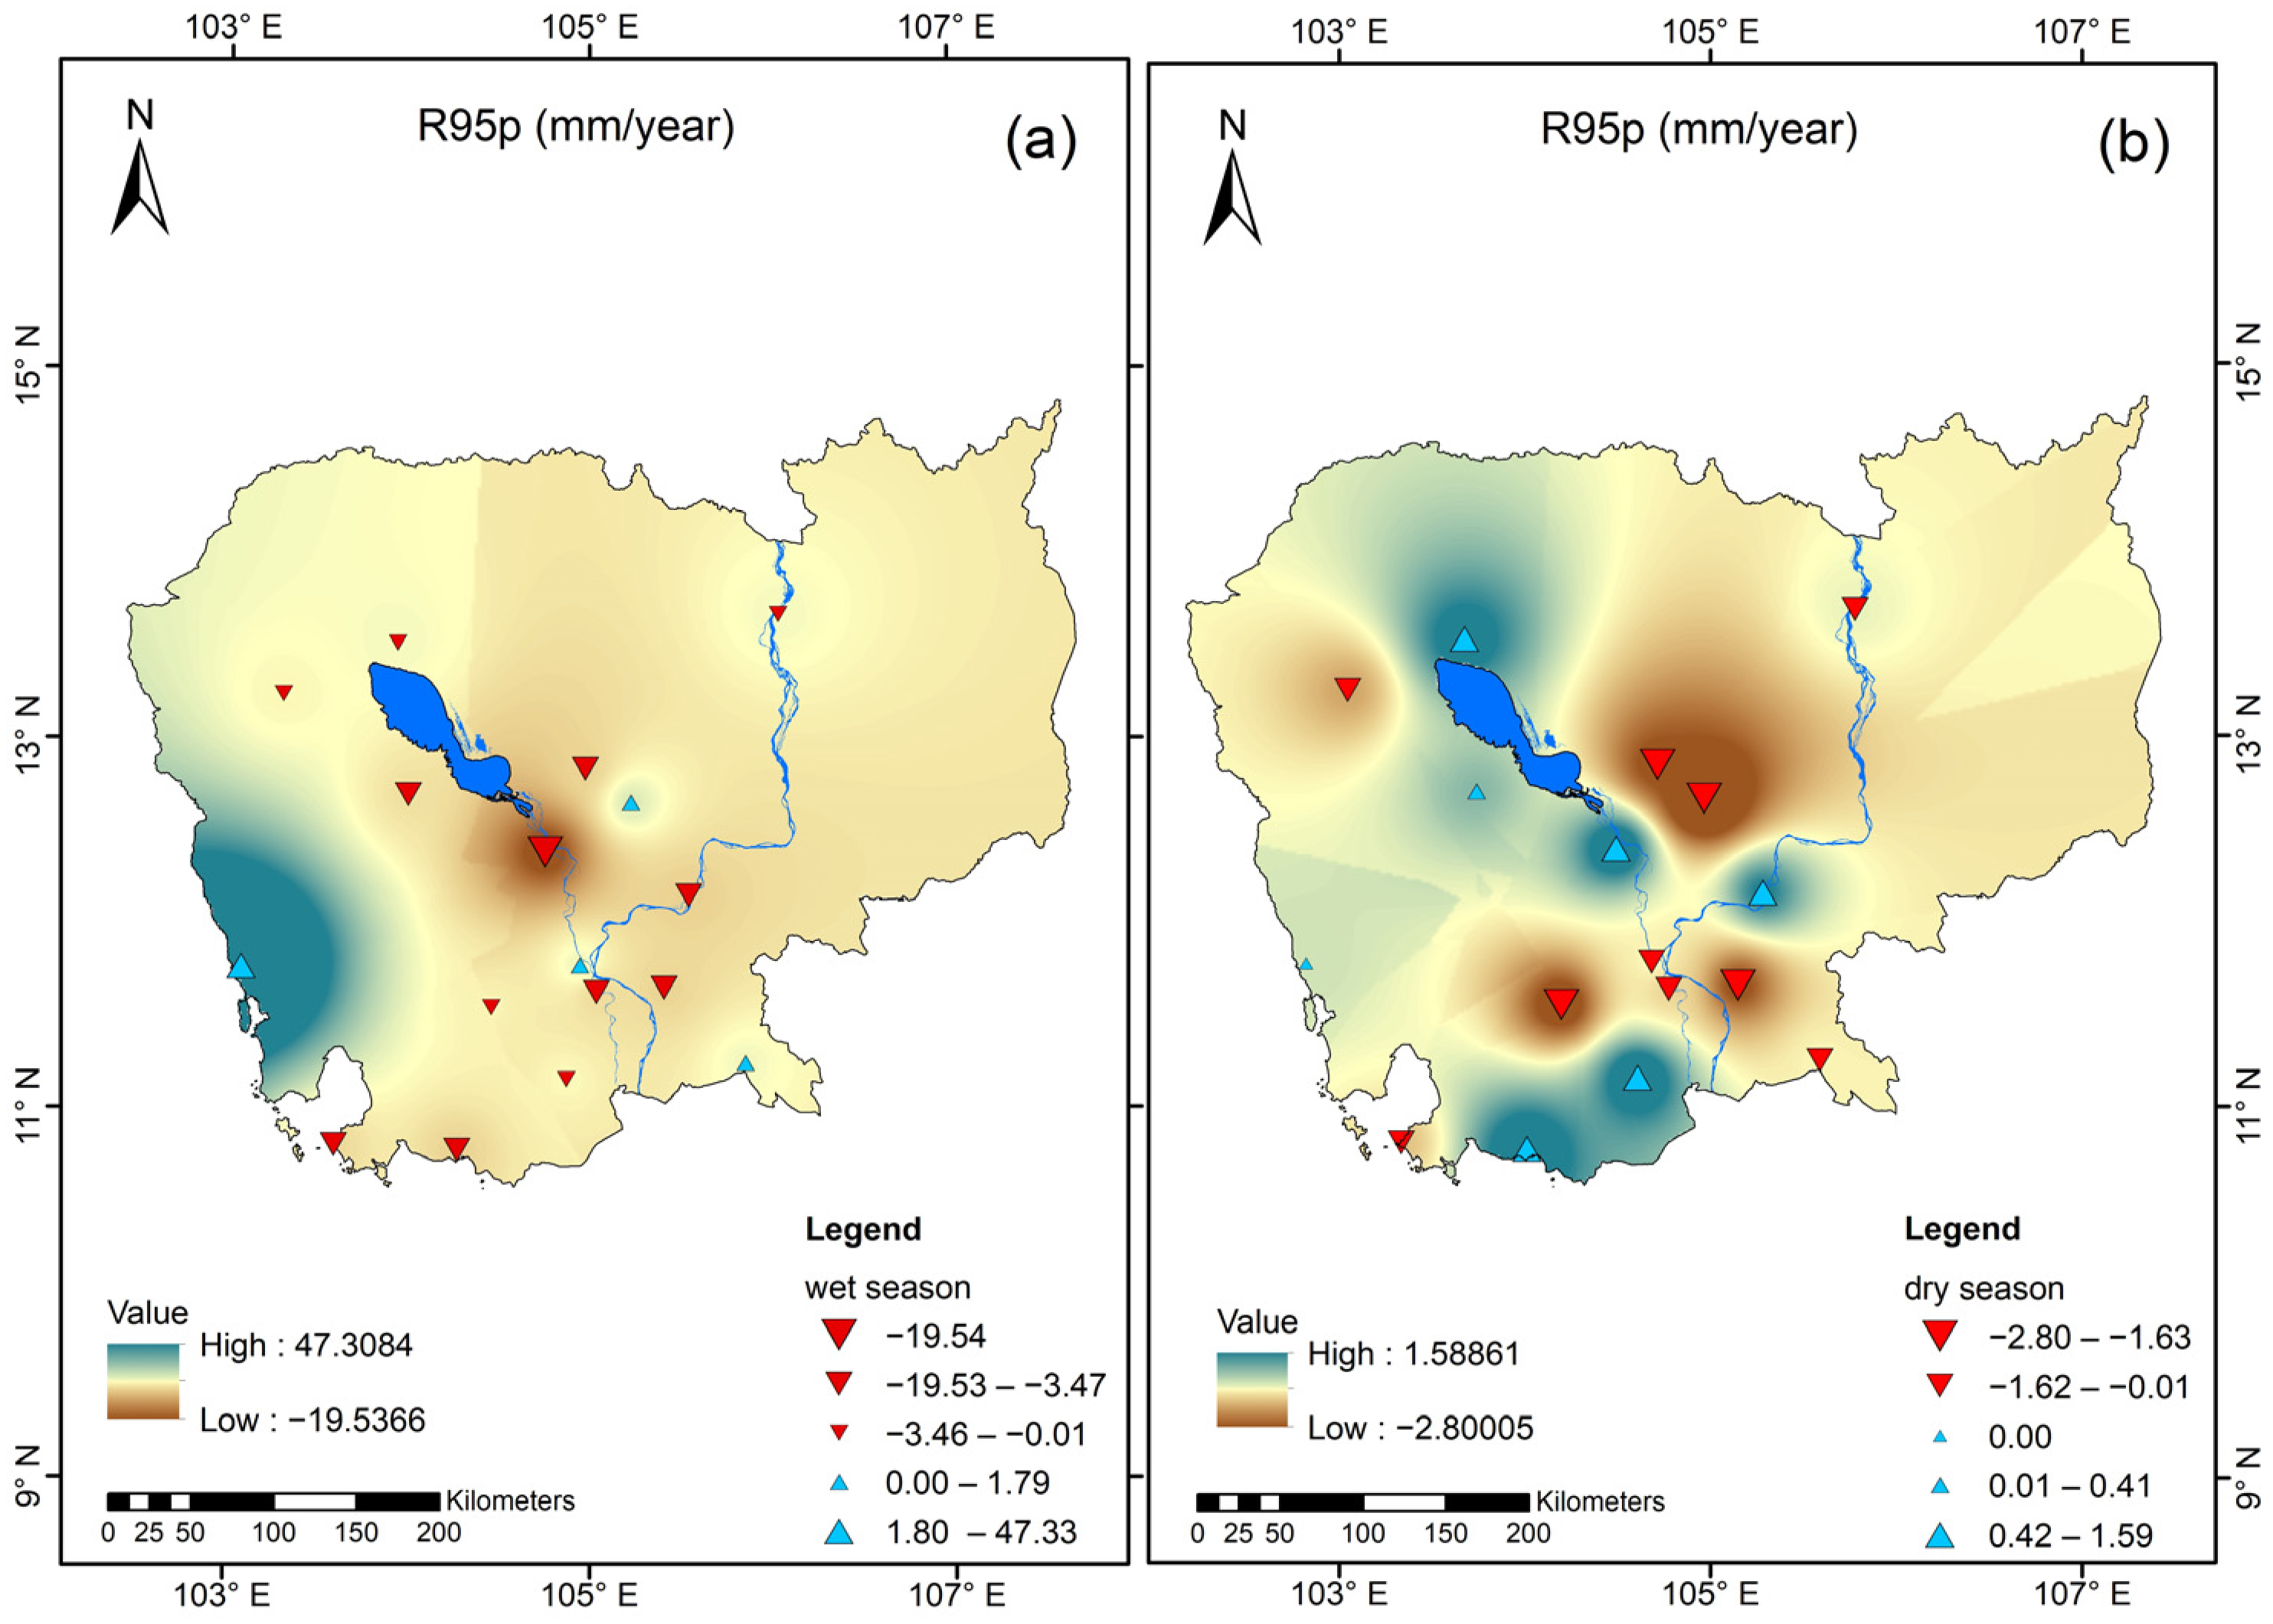
The wet and extreme conditions of precipitation are depicted by the trend values of the R95p and R99p parameters. Figure 14 and Figure 15 display the trends of the indices R95p and R99p. It showed that the majority of stations have a negative trend for both R95p and R99p, while certain stations illustrate positive trends in the dry season.
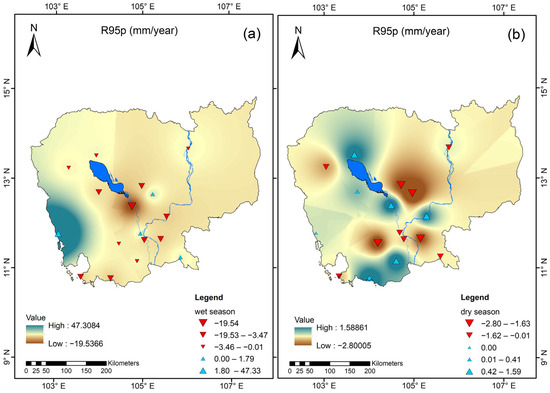
Figure 14.
Seasonal extreme rainfall index R95p: (a) wet season; and (b) dry season. The downward red triangle is the negative trend and the upward blue triangle is the positive trend.
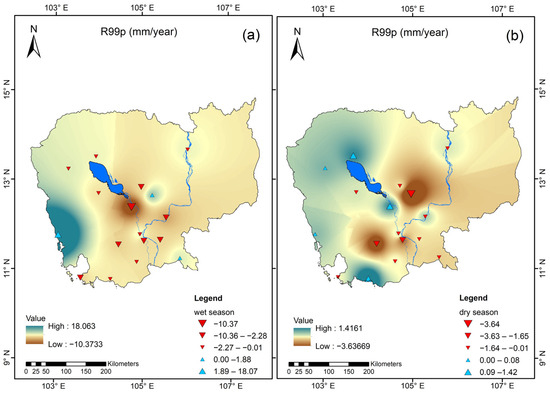
Figure 15.
Seasonal extreme rainfall index R99p: (a) wet season; and (b) dry season. The downward red triangle is the negative trend and the upward blue triangle is the positive trend.
3.3.2. Dryness Analysis by Consecutive Dry Day Index
Tonle Sap Region
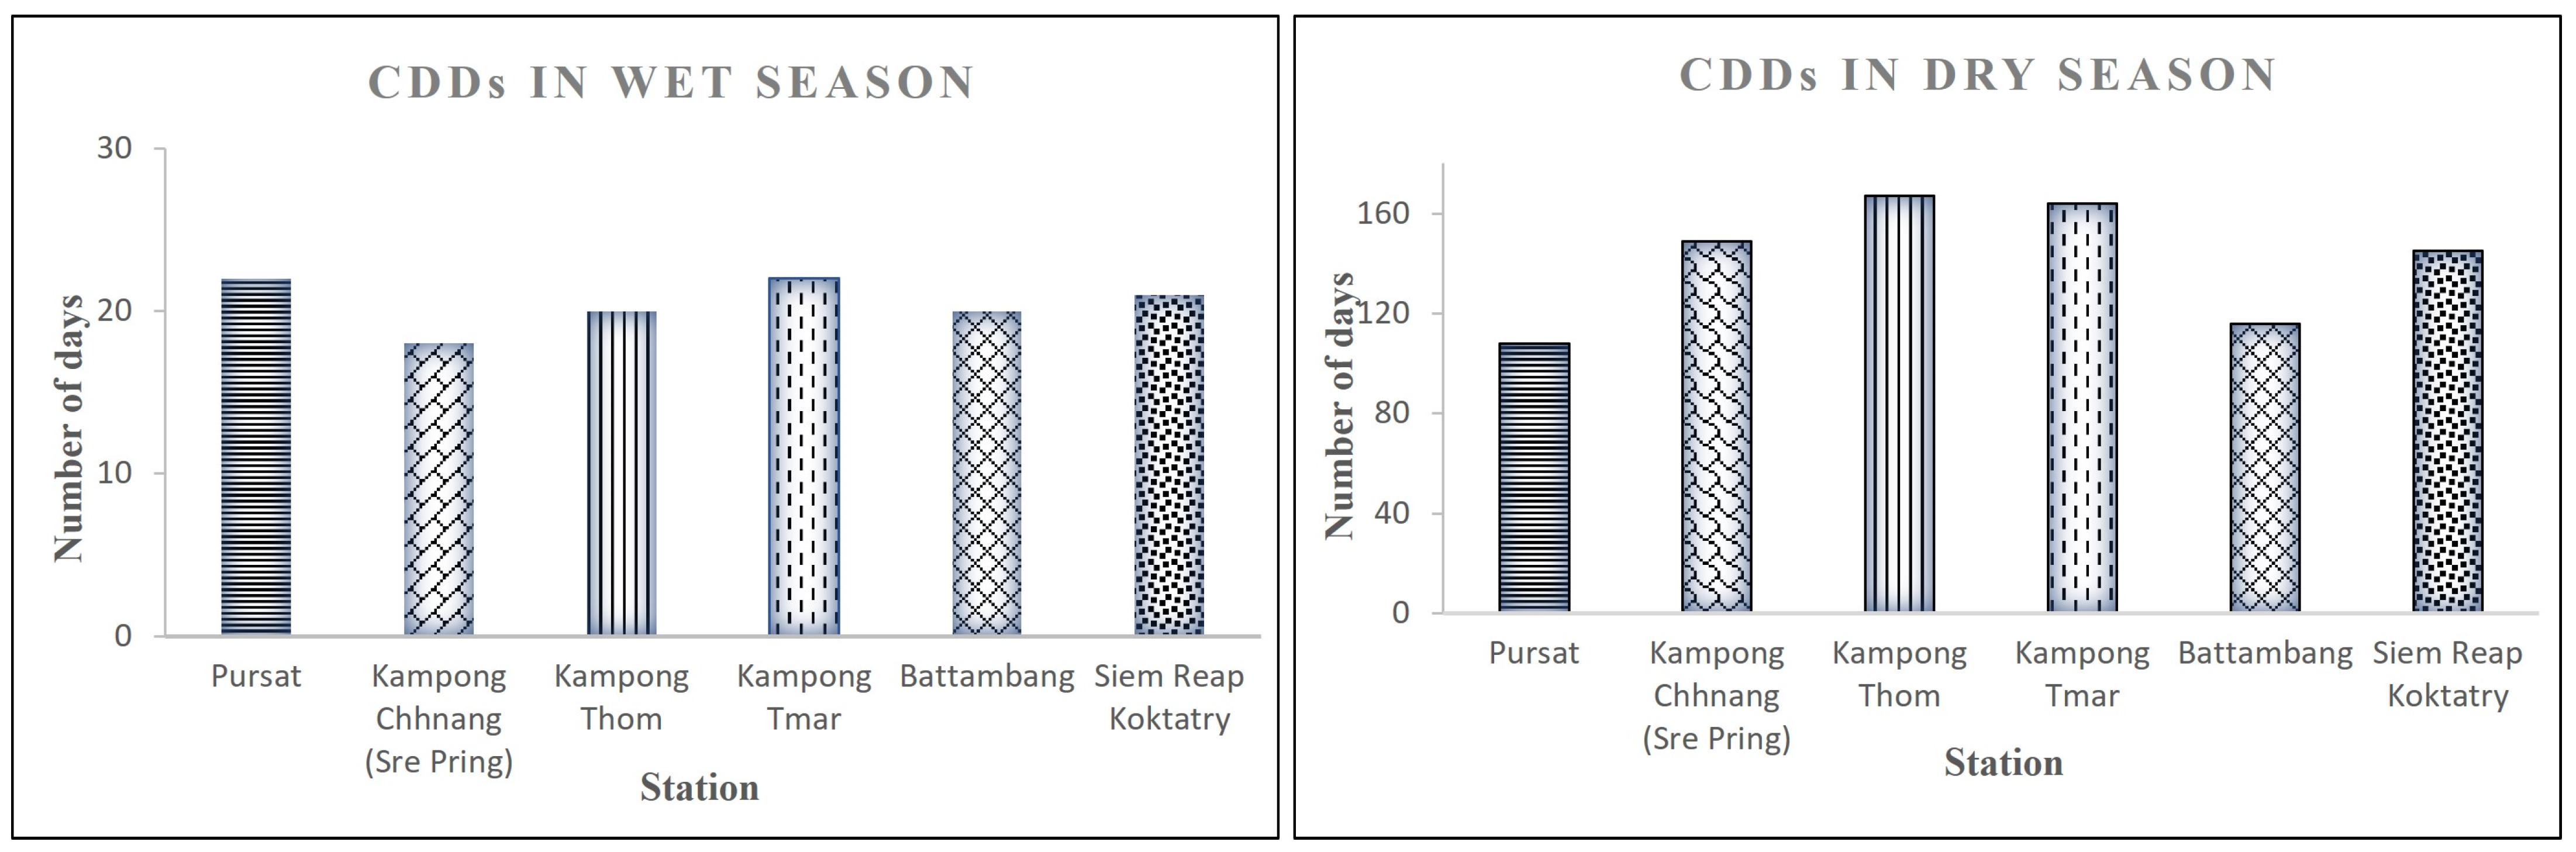
Figure 16 illustrates the annual spatial characteristics of the maximum CDDs value at each station in the Tonle Sap region during both the wet and dry seasons. In the wet season, the CDDs value peaked at 22 days per year, primarily at the Pursat station, while the lowest value dropped to 18 days per year at the Kampong Chhnang station. During the dry season, the maximum CDDs value reached around 167 days per year, mainly concentrated in the Kampong Thom station. However, the minimum CDDs value in the dry season was recorded at 108 days per year at the Pursat station. The fluctuations in CDDs duration provide valuable insights into the likelihood of seasonal droughts, as higher CDDs may indicate increased dryness and a greater risk of drought.

Figure 16.
Number of consecutive dry days (CDDs) in both seasons: wet and dry seasons in Tonle Sap region.
Coastal Region
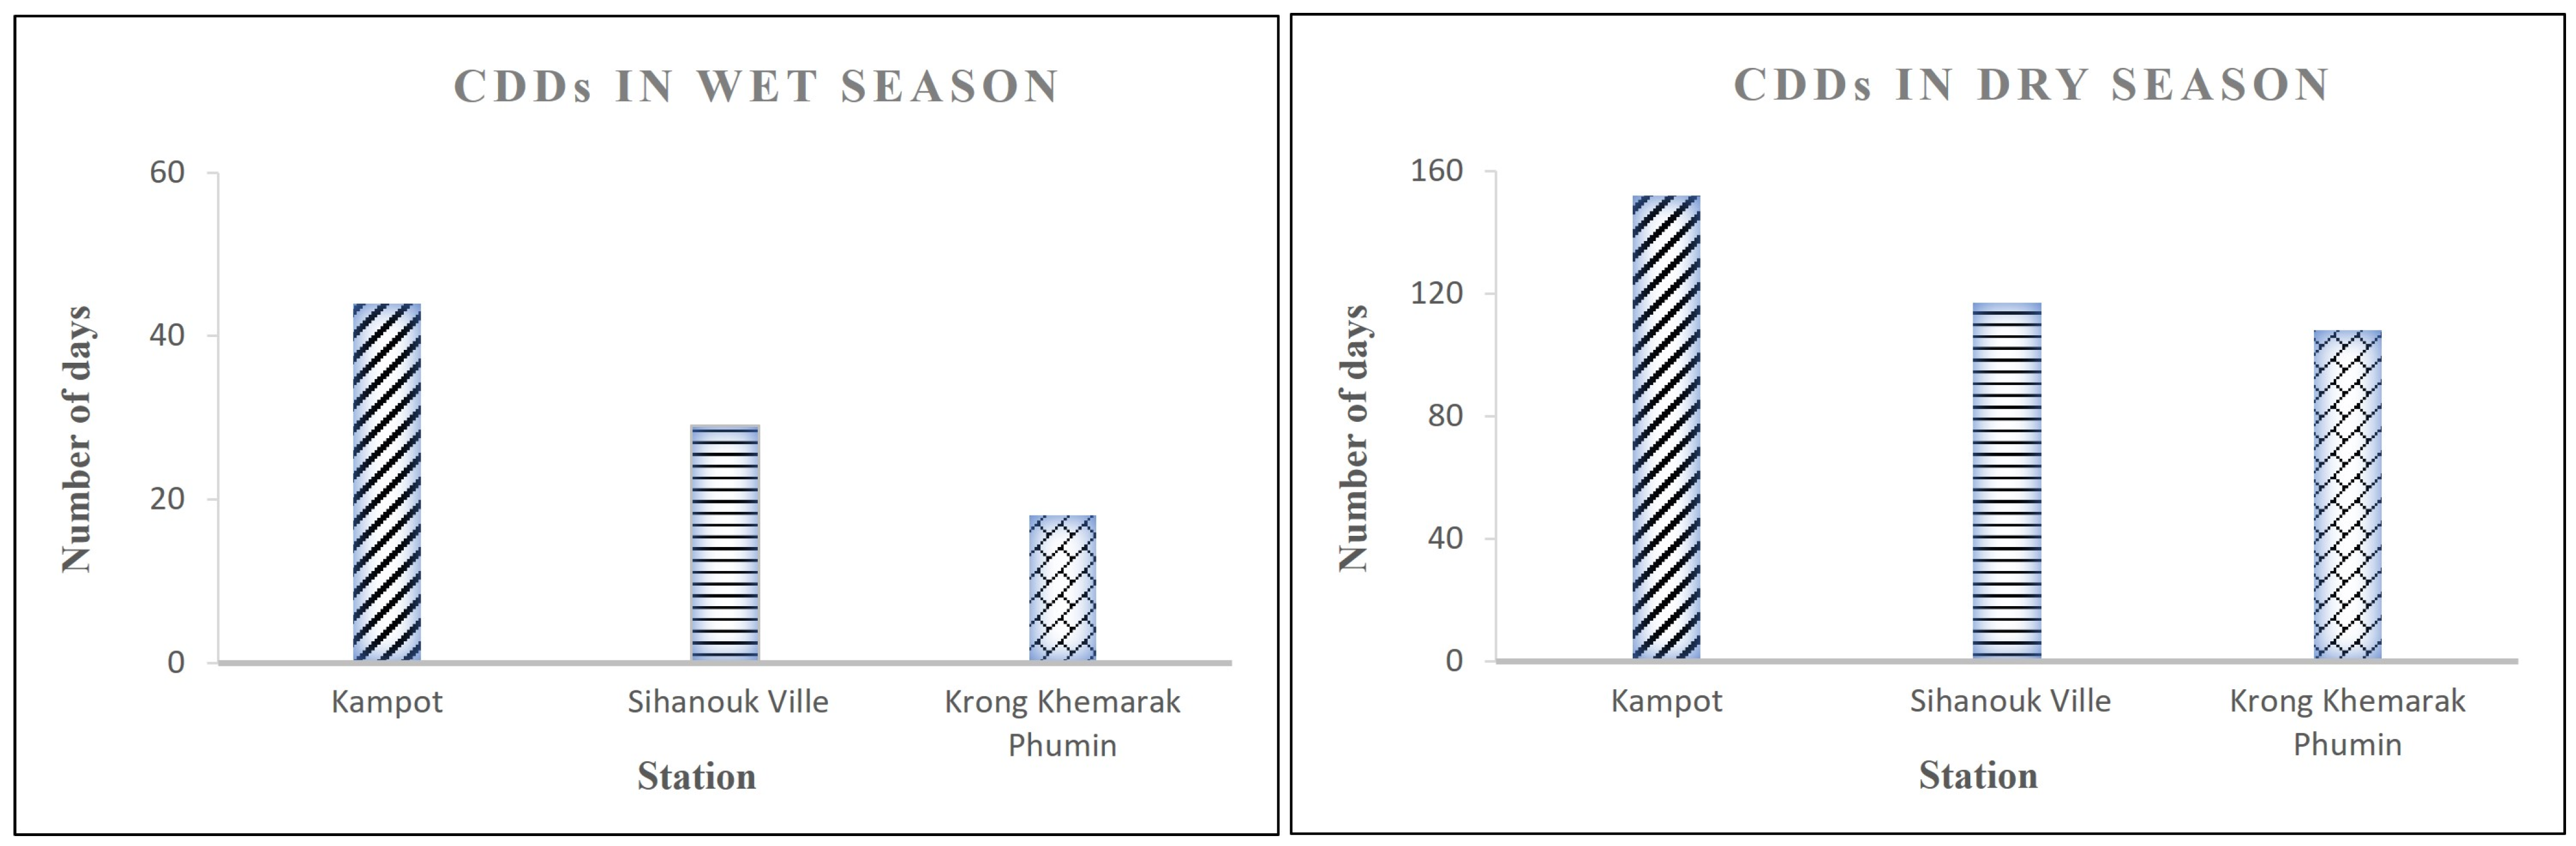
As seen in Figure 17, during the wet season, the Kampot station experiences an increase of around 44 days per year of CDDs, indicating more frequent precipitation events in this coastal area of the Gulf of Thailand. Conversely, in Krong Khemarak Phoumin, the lowest precipitation during the wet season decreased by over 18 days/year. In this region, there was a significant rise in CDDs during the dry season, reaching a peak rate of 152 days per year at the Kampot station, contrasting with a decrease observed at the Krong Khemarak Phoumin station, which counted 108 days per year. These fluctuations in precipitation and the occurrence of CDDs throughout the study period provide an important understanding into seasonal wet and dry trends.
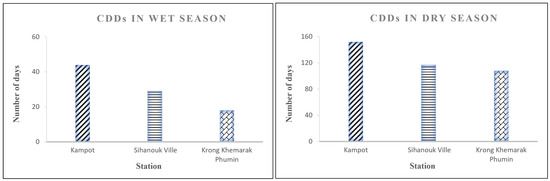
Figure 17.
Number of consecutive dry days (CDDs) in both seasons: wet and dry seasons in the coastal region.
Mekong Delta
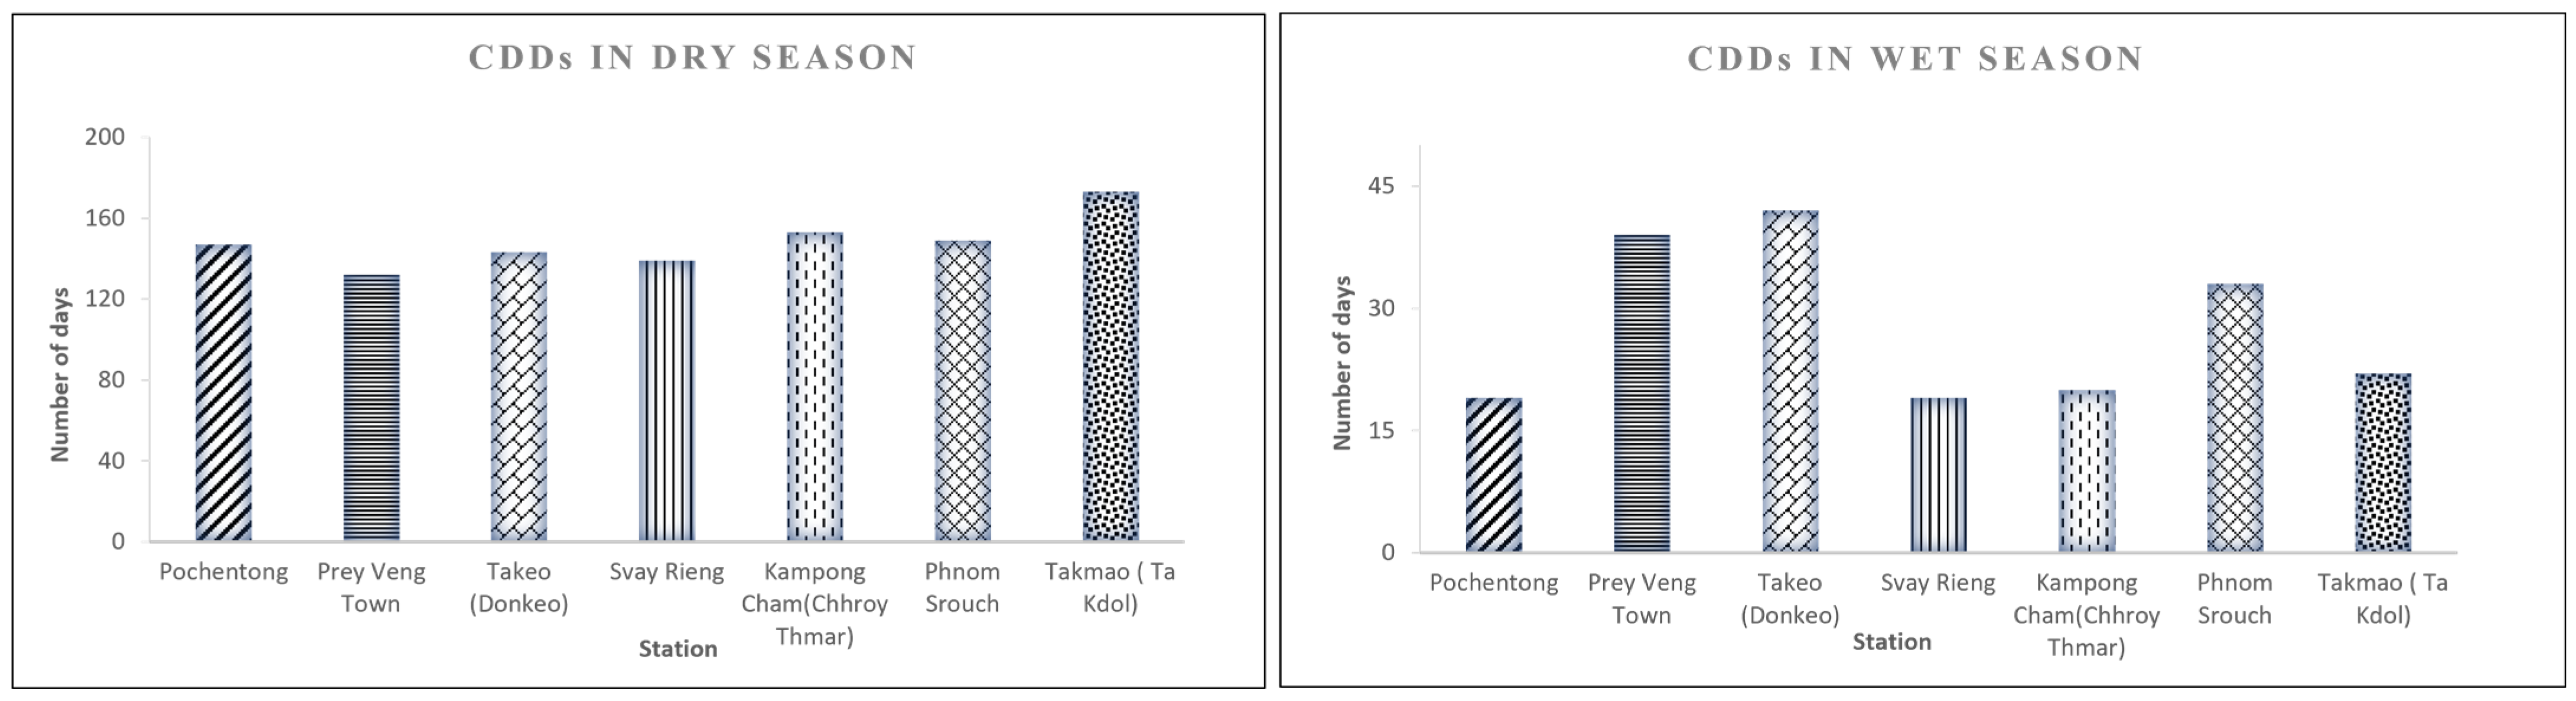
Figure 18 depicts the number of CDDs for both wet and dry seasons in the Mekong Delta region from 1991 to 2021. During the wet season, the maximum CDDs value reached 42 days per year at the Takeo station. In the dry season, the maximum CDDs value was recorded at 173 days per year at the Takmao station.

Figure 18.
Number of consecutive dry days (CDDs) in both seasons: wet and dry seasons in Mekong Delta.
Upper Mekong
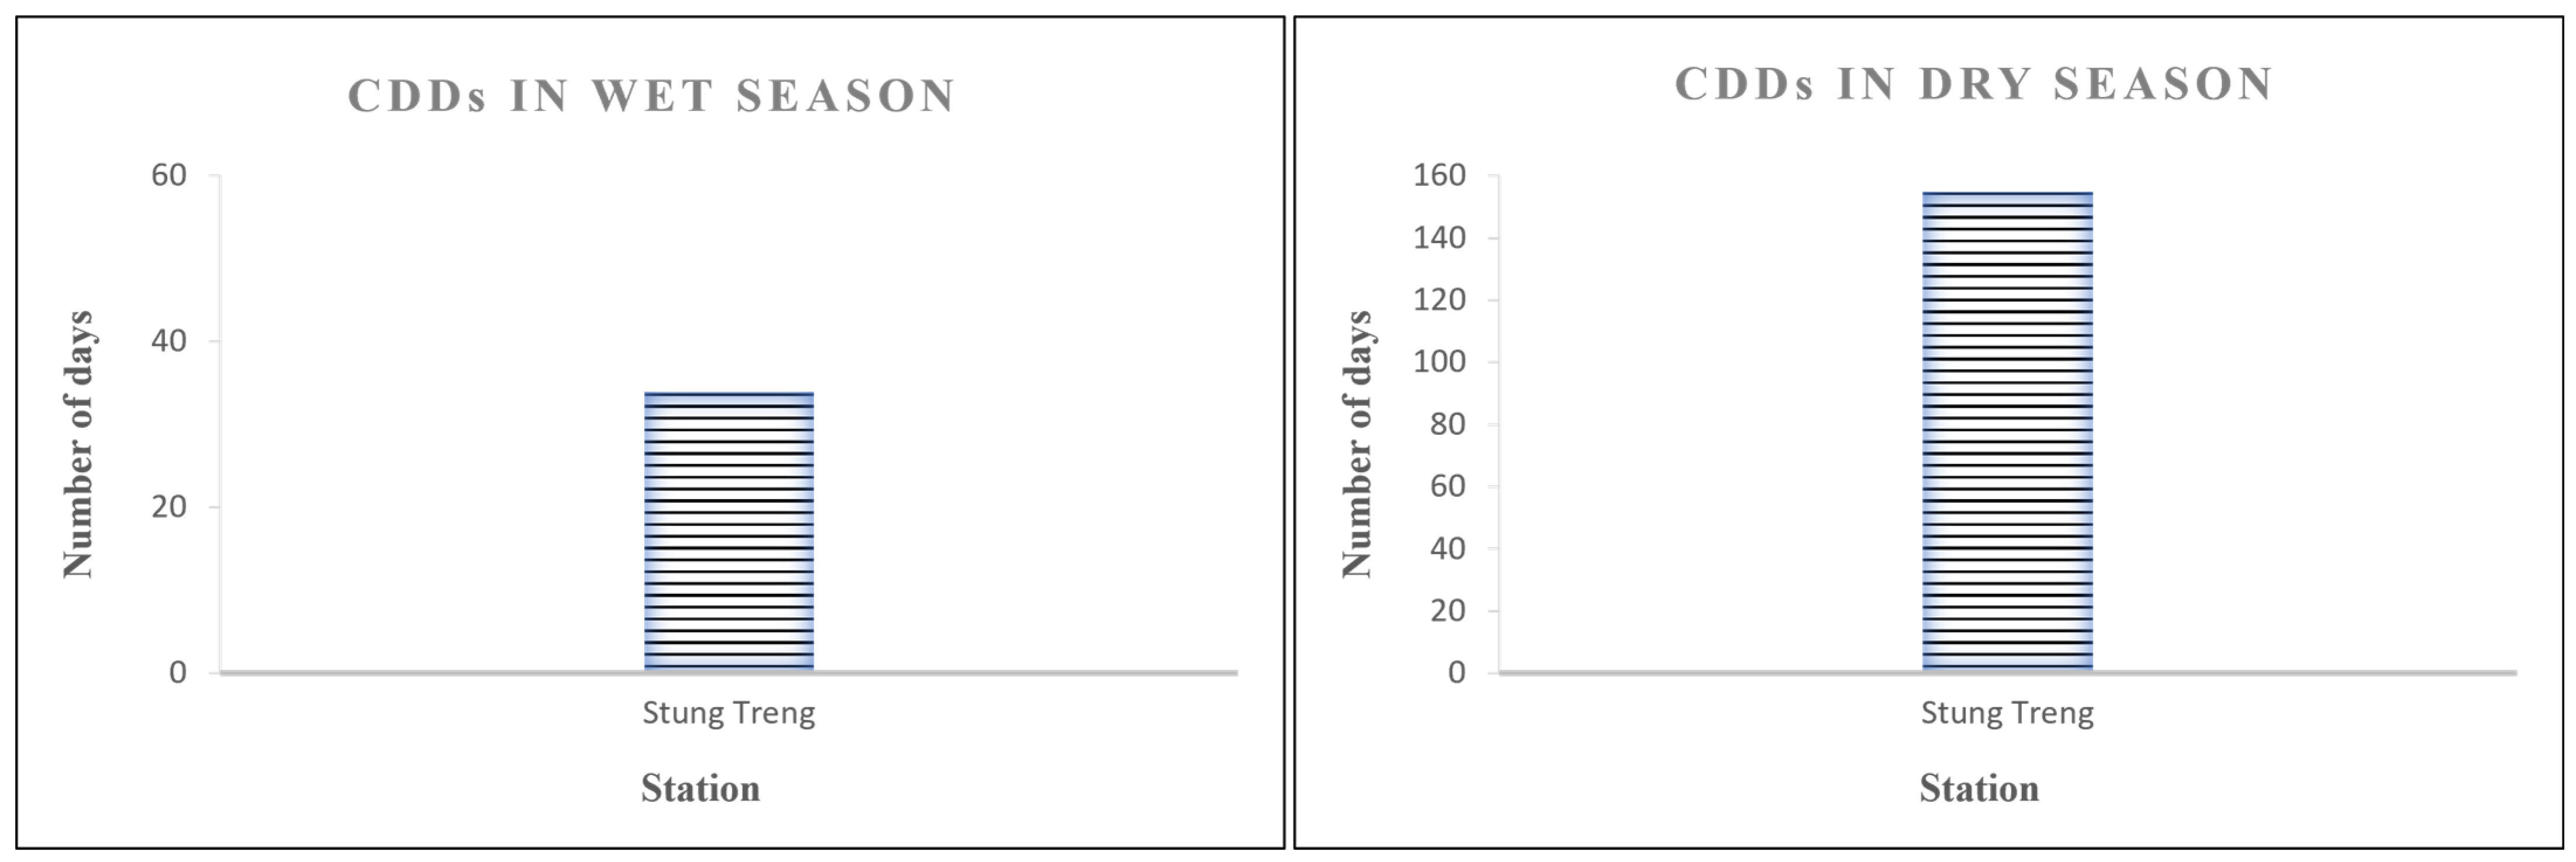
The results of CDDs during both the wet and dry seasons at the Stung Treng station in the Upper Mekong region are shown in Figure 19. In the wet season, the maximum CDDs value reached 34 days per year. In contrast, during the dry season, the CDDs value was recorded at 155 days per year.
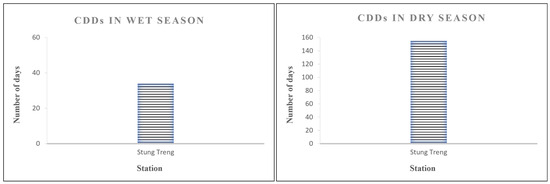
Figure 19.
Number of consecutive dry days (CDDs) in both seasons: wet and dry seasons in Upper Mekong.
4. Discussion
The results show that CDDs increase in the Tonle Sap region for three subsections, namely, the spatial analysis, temporal analysis, and seasonal rainfall analysis. The findings are consistent with the work of [6,9], which show the result of CDDs increases in the central part of Cambodia. Doung et al. (2023) state that warmer air can hold on to more water vapor for extended periods, leading to dry spells. However, when all that water vapor condenses into raindrops, the intensity of the rainfall increases, and a flood follows [6]. Oeurng et al. (2019) estimated potential changes in land use caused by precipitation changes [33]. In the Tonle Sap region, land use has altered significantly, most notably in terms of less forest cover [34]. In addition, the data provided above make it clear that there are significant direct effects of climate change and land use and land cover changes in extreme rainfall events. Increasing extreme rainfall events particularly makes managing and utilizing water resources more difficult. Water managers have significant problems when faced with drought in one year and flooding in the next [35], especially the likelihood that precipitation will occur as rain rather than snow, which increases with rising temperatures [36,37].
CWDs experienced the highest increase in the coastal and Mekong Delta regions (Figure 3, Figure 8 and Figure 10). Both regions are affected by the southwest monsoon [24]. The summer monsoon, which brings the highest rainfall to the southeast and northwest, results in the wet season, from May through November [38]. The El Niño Southern Oscillation affects the region’s monsoon patterns, causing interannual fluctuations in climate. In Southeast Asia, El Nino occurrences typically provide warmer and drier winter temperatures than average, while La Niña episodes usually bring lower temperatures [39]. However, the El Niño Southern Oscillation phenomena and precipitation variability are connected; over the 20th century, significant El Niño years have been associated with moderate-to-severe droughts [15]. Consequently, the impact of this change on flooding in the coastal and Mekong Delta regions is a significant concern, since it has the potential to cause damage to multiple industries throughout the region. In terms of extreme environmental, social, and economic change, the Mekong Delta is considered to be the most affected region in Southeast Asia [40].
For the spatial analysis, the extreme indices, such as CWDs, RX1day, RX5day, R95p, and R99p, show an increasing trend in both the coastal region (southwest) and the Mekong Delta region (southeast) of Cambodia, consistent with the work of [6,9], which show that both these indices increase. In particular, the Krong Khemarak Phummin station exhibits an increasing trend in all indices except CDDs, which experienced a decreasing trend. Moreover, a temporal analysis of these indices demonstrates increasing trends in the coastal region. Notably, the increasing trends may be caused by tropical storms. Tropical storms are one major cause of strong wind and flooding damage to the coastal region. Storms in these regions occurred from 1992 to 2020, possibly due to the increase in annual rainfall (NOAA). Therefore, climate change has been selected as a major cause of extreme rainfall in Cambodia. There is likely to be an environmental impact, which may cause flood risks and droughts.
Furthermore, in the temporal analysis of the Mekong Delta, only CWDs still experienced an increasing trend consistent with the spatial analysis. However, RX1day, RX5day, R95p, and R99p show decreasing trends, resulting in fewer extreme rainfall events. Rainfall pattern variations are possibly caused by population growth. Economic development may have led to rapid land cover changes, mainly deforestation in the Mekong basin which is mainly relevant for the hydropower impact assessment, which concludes that dry season water levels would rise and wet season water levels would be lower than at present [41].
In the Upper Mekong region, the Stung Treng station indicated a decrease in the values of both CDDs and CWDs for the spatial and temporal analyses. The RX1day, RX5day, R95p, and R99p values slightly increased.
Additionally, in the Tonle Sap region, the normalized value of the contribution of total precipitation from very wet days (R95p/PRCPTOT) slightly decreased, while, for extremely wet days (R99p/PRCPTOT), it increased by 0.05. An increase in the normalized value of R99p/PRCPTOT signifies a rising contribution of extreme rainfall events to the total precipitation, which can have various environmental, economic, and social impacts. Notably, R95p/PRCPTOT in the coastal region decreased by −2, indicating a reduction in the relative contribution of extreme precipitation to total annual rainfall, which has implications for climate analysis and water management. In contrast, the Mekong Delta region showed an increasing trend for both R95p/PRCPTOT and R99p/PRCPTOT, with values of 0.17 and 0.18, respectively. In the Upper Mekong region, R95p/PRCPTOT decreased by −0.8 and R99p/PRCPTOT decreased by −0.2.
Further analysis revealed that the amount of rainfall in the 95th percentile and 99th percentile in the wet season generally decreased, while it increased in the dry season. This signified that extreme rainfall took place more frequently in the dry season and less frequently in the wet season. The result represents a valuable insight for the occurrence of and preparedness for extreme events.
For the seasonal analysis, the increase in consecutive dry days (CDDs) supports the findings of the annual rainfall event indices, indicating a shift in rainfall patterns that may heighten the risk of drought conditions. In the Tonle Sap region, both the Pursat and Kampong Thmar stations recorded 22 CDDs per year during the wet season. In the Mekong Delta, the Takeo and Prey Veng stations showed an increase in CDDs during both seasons, suggesting a potential risk of extreme rainfall events. In the coastal region, the Kampot station, with the lowest mean annual rainfall (see Figure 2), recorded the longest increase, with 44 CDDs per year during the wet season and a peak of 152 CDDs per year in the dry season, indicating a high risk of drought events. At the Stung Treng station in Upper Mekong, CDDs reach 34 days per year in the wet season and 155 days per year in the dry season, suggesting that this station might also face extreme events.
In the Upper Mekong and Tonle Sap regions, the limited rainfall stations in each region may lead to significant uncertainty. For more accurate spatial, temporal, and seasonal analyses, it is crucial to have longer periods of observed data. Additionally, increasing the number of stations measuring the mean annual rainfall will enhance the reliability and comprehensiveness of the analysis. Satellite rainfall estimates (SREs) would be crucial in this case since they would fill in the data gaps when observed data are not available [17]. With more extensive data collection, researchers can better understand rainfall patterns and make more informed decisions regarding water resource management and other related environmental and agricultural planning. This approach will ultimately contribute to more effective development strategies for coping with the challenges posed by hazardous rainfall events.
5. Conclusions
The statistical analysis of extreme rainfall indices, including CDDs, CWDs, RX1day, RX5day, R95p, R99p, SDII, R10, R20, Rnn, and PRCPTOT, and the trend analysis in Cambodia, covering the period from 1991 to 2021, highlight several key findings.
In the Tonle Sap region, significant increases in CDDs were observed in the spatial analysis, except at the Battabang, Kampong Thmar, and Pursat stations. Moreover, most stations show an increase in CWDs, except for the Kampong Chhnang station. This aligns with previous studies indicating that central Cambodia is experiencing more dry spells, likely due to rising temperatures and reduced forest cover, contributing to drought events. Changes in land use, particularly deforestation, have significantly altered the landscape in the Tonle Sap region, exacerbating the effects of climate change. The combination of higher temperatures and land cover changes has led to more extreme rainfall events, complicating water resource management.
In the coastal region, particularly at the Krong Khemarak Phummin station, most rainfall indices have increased, except for CDDs. The spatial analysis reveals a slope value increase of 89.94 mm/year. Additionally, the RX1day and RX5day precipitations at the station show slope values of 5.03 mm/year and 6.85 mm/year, respectively. The values of R95p and R99p have also notably increased, comprising approximately 52.12% and 27% of the PRCPTOT values. These results suggest that, at the Krong Khemarak Phummin station, there is an increase in the total amount of precipitation occurring on days with rainfall exceeding the 95th and 99th percentiles. This region is frequently affected by tropical storms, leading to higher rainfall and flooding. However, the Kampot station, with the lowest annual rainfall in the coastal region, shows a significant increase in CDDs, indicating a heightened drought risk.
In the Mekong Delta, at the Prey Veng station, the CDDs index shows a decreased slope value of −4.892 days per year. Additionally, during the wet season, the CDDs at this station recorded 39 days per year. This region should be considered due to the development activities in the sub-basin. Influenced by the southwest monsoon and interannual climate fluctuations like the El Niño Southern Oscillation, this region is potentially at risk of drought due to rapid land cover changes and hydro-power development.
At the Stung Treng station in Upper Mekong, the CDDs reach 34 days per year in the wet season and 155 days per year in the dry season. The spatial analysis shows a decreasing trend in CDDs, with a slope value of −1.183 days per year, indicating a risk of extreme events.
Author Contributions
Conceptualization, S.R. and L.L.; methodology, S.B.; and data analysis, S.P., P.N. and L.B. All authors have read and agreed to the published version of the manuscript.
Funding
Financial support for this work was received from the National Natural Science Foundation of China (grant number 52150410408).
Institutional Review Board Statement
Not applicable.
Informed Consent Statement
Not applicable.
Data Availability Statement
The rainfall data obtained from the Ministry of Water Resources and Meteorology (MOWRAM) are for self-use only, and hence the data will not be shared.
Acknowledgments
This research was supported by the Coastal and Wetland Environmental Research Laboratory, Institute of Technology of Cambodia, through their generous provision of facilities.
Conflicts of Interest
The authors declare no conflicts of interest.
References
- Mohan Kumar, S.; Geethalakshmi, V.; Ramanathan, S.; Senthil, A.; Senthilraja, K.; Bhuvaneswari, K.; Gowtham, R.; Kannan, B.; Priyanka, S. Rainfall Spatial-Temporal Variability and Trends in the Thamirabharani River Basin, India: Implications for Agricultural Planning and Water Management. Sustainability 2022, 14, 14948. [Google Scholar] [CrossRef]
- Liu, Y.; Yuan, X.; Guo, L.; Huang, Y.; Zhang, X. Driving Force Analysis of the Temporal and Spatial Distribution of Flash Floods in Sichuan Province. Sustainability 2017, 9, 1527. [Google Scholar] [CrossRef]
- Xu, J.; Xu, L.; Wang, Y.; Ping, F.; Yin, L. Influence of Atmospheric Non-Uniform Saturation on Extreme Hourly Precipitation Cloud Microphysical Processes in a Heavy Rainfall Case in Zhengzhou. Sustainability 2023, 15, 15047. [Google Scholar] [CrossRef]
- Xie, C.; Huang, Y.; Li, L.; Li, T.; Xu, C. Detailed Inventory and Spatial Distribution Analysis of Rainfall-Induced Landslides in Jiexi County, Guangdong Province, China in August 2018. Sustainability 2023, 15, 13930. [Google Scholar] [CrossRef]
- Al-Ahmadi, K.; Al-Ahmadi, S. Rainfall-Altitude Relationship in Saudi Arabia. Adv. Meteorol. 2013, 2013, 363029. [Google Scholar] [CrossRef]
- Duong, S.; Song, L.; Chhin, R. Precipitation Projection in Cambodia Using Statistically Downscaled CMIP6 Models. Climate 2023, 11, 245. [Google Scholar] [CrossRef]
- Katsanos, D.; Retalis, A.; Tymvios, F.; Michaelides, S. Analysis of precipitation extremes based on satellite (CHIRPS) and in situ dataset over Cyprus. Nat. Hazards 2016, 83, 53–63. [Google Scholar] [CrossRef]
- Kunkel, K.E.; Karl, T.R.; Easterling, D.R.; Redmond, K.; Young, J.; Yin, X.; Hennon, P. Probable maximum precipitation and climate change. Geophysical Research Letters 2013, 40, 1402–1408. [Google Scholar] [CrossRef]
- Yazid, M.; Humphries, U. Regional observed trends in daily rainfall indices of extremes over the Indochina Peninsula from 1960 to 2007. Climate 2015, 3, 168–192. [Google Scholar] [CrossRef]
- Tandon, N.F.; Zhang, X.; Sobel, A.H. Understanding the Dynamics of Future Changes in Extreme Precipitation Intensity. Geophys. Res. Lett. 2018, 45, 2870–2878. [Google Scholar] [CrossRef]
- Thav, S.; Bunchhoeun, T.; Soryee, S.; Sokkheng, K.; Rano, K.; Sereyratana, B.; Sokchea, E.; Phy, O.; Sreyleak, A. Farmers’ perceptions on the impact of climate change: Case study of the agricultural sector of Cambodia. APN Sci. Bull. 2023, 13, 199–207. [Google Scholar] [CrossRef]
- Subyani, A. Topographic and seasonal influences on precipitation variability in southwest Saudi Arabia. J. King Abdulaziz Univ. Sci. 1999, 11, 89–102. [Google Scholar] [CrossRef]
- Tsujimoto, K.; Ohta, T.; Aida, K.; Tamakawa, K.; Im, M.S. Diurnal pattern of rainfall in Cambodia: Its regional characteristics and local circulation. Prog. Earth Planet. Sci. 2018, 5, 39. [Google Scholar] [CrossRef]
- Liu, L.; Bai, P.; Liu, C.; Tian, W.; Liang, K. Changes in extreme precipitation in the Mekong Basin. Adv. Meteorol. 2020, 2020, 8874869. [Google Scholar] [CrossRef]
- Lyon, B. The strength of El Niño and the spatial extent of tropical drought. Geophys. Res. Lett. 2004, 31, L21204. [Google Scholar] [CrossRef]
- Abhishek, A.; Das, N.N.; Ines, A.V.; Andreadis, K.M.; Jayasinghe, S.; Granger, S.; Ellenburg, W.L.; Dutta, R.; Quyen, N.H.; Markert, A.M.; et al. Evaluating the impacts of drought on rice productivity over Cambodia in the Lower Mekong Basin. J. Hydrol. 2021, 599, 126291. [Google Scholar] [CrossRef]
- Miyazawa, Y.; Tateishi, M.; Komatsu, H.; Ma, V.; Kajisa, T.; Sokh, H.; Mizoue, N.; Kumagai, T. Tropical tree water use under seasonal waterlogging and drought in central Cambodia. J. Hydrol. 2014, 515, 81–89. [Google Scholar] [CrossRef]
- Olson, K.R.; Morton, L.W. Tonle Sap Lake and River and confluence with the Mekong River in Cambodia. J. Soil Water Conserv. 2018, 73, 60A–66A. [Google Scholar] [CrossRef]
- Haberstroh, C.J.; Arias, M.E.; Yin, Z.; Sok, T.; Wang, M.C. Plastic transport in a complex confluence of the Mekong River in Cambodia. Environ. Res. Lett. 2021, 16, 095009. [Google Scholar] [CrossRef]
- Phoeurn, C.; Ly, S. Assessment of Satellite Rainfall Estimates as a Pre-Analysis for Water Environment Analytical Tools: A Case Study for Tonle Sap Lake in Cambodia. Eng. J. 2018, 22, 229–241. [Google Scholar] [CrossRef]
- Chhinh, N.; Millington, A. Drought Monitoring for Rice Production in Cambodia. Climate 2015, 3, 792–811. [Google Scholar] [CrossRef]
- Parsons, L.; Nielsen, J.Ø. The Subjective Climate Migrant: Climate Perceptions, Their Determinants, and Relationship to Migration in Cambodia. Ann. Am. Assoc. Geogr. 2020, 111, 971–988. [Google Scholar] [CrossRef]
- Sun, C.; Xiao, Z.-N.; Nguyen, M. Projection on precipitation frequency of different intensities and precipitation amount in the Lancang-Mekong River basin in the 21st century. Adv. Clim. Chang. Res. 2021, 12, 162–171. [Google Scholar] [CrossRef]
- Botkosal, W.; Kong, C.; Chanthou, C. The State of Climate Change in Cambodia. In Proceedings of the 5th AUN/SEED-Net Regional Conference on Global Environment, Bandung, Indonesia, 21–22 November 2012; pp. 1–14. [Google Scholar]
- Zhang, X.; Yang, F. RClimDex (1.0) user manual. Clim. Res. Branch Environ. Can. 2004, 22, 13–14. [Google Scholar]
- Sohrabi, M.; Marofi, S.; Ababaei, B. Investigation of temperature and precipitation indices by using RClimDex and R software in Semnan province. In Proceedings of the International Conference on Water Resources, Langkawi, Malaysia, 26–27 May 2009; pp. 16–18. [Google Scholar]
- Davison, A.C.; Gholamrezaee, M.M. Geostatistics of extremes. Proc. R. Soc. A Math. Phys. Eng. Sci. 2012, 468, 581–608. [Google Scholar] [CrossRef]
- Beguería, S.; Angulo-Martínez, M.; Vicente Serrano, S.M.; El Kenawy, A.M.; López-Moreno, J.I. Assessing trends in extreme precipitation events intensity and magnitude using non-stationary peaks-over-threshold analysis: A case study in northeast Spain from 1930 to 2006. Int. J. Clim. 2010, 31, 2102–2114. [Google Scholar] [CrossRef]
- Anagnostopoulou, C.; Tolika, K. Extreme precipitation in Europe: Statistical threshold selection based on climatological criteria. Theor. Appl. Clim. 2012, 107, 479–489. [Google Scholar] [CrossRef]
- Reveiu, A.; Dârdala, M. Techniques for Statistical Data Visualization in GIS. Inform. Econ. 2011, 15, 72. [Google Scholar]
- Krivoruchko, K.; Gotay, C. Using spatial statistics in GIS. In Proceedings of the International Congress on Modelling and Simulation, Townsville, Australia, 14–17 July 2003; pp. 713–736. [Google Scholar]
- Goodchild, M.F.; Longley, P.A.; Maguire, D.J.; Rhind, D.W. Geographic Information Systems and Science; John Wiley & Sons: Hoboken, NJ, USA, 2005; Volume 17, p. 517. [Google Scholar]
- Oeurng, C.; Cochrane, T.A.; Chung, S.; Kondolf, M.G.; Piman, T.; Arias, M.E. Assessing climate change impacts on river flows in the Tonle Sap Lake Basin, Cambodia. Water 2019, 11, 618. [Google Scholar] [CrossRef]
- Wang, Z.; Ficklin, D.L.; Zhang, Y.; Zhang, M. Impact of climate change on streamflow in the arid Shiyang River Basin of northwest China. Hydrol. Process. 2012, 26, 2733–2744. [Google Scholar] [CrossRef]
- Trenberth, K.E. The impact of climate change and variability on heavy precipitation, floods, and droughts. Encycl. Hydrol. Sci. 2005, 17, 1–11. [Google Scholar]
- Knowles, N.; Dettinger, M.D.; Cayan, D.R. Trends in snowfall versus rainfall in the western United States. J. Clim. 2006, 19, 4545–4559. [Google Scholar] [CrossRef]
- Mote, P.W. Trends in snow water equivalent in the Pacific Northwest and their climatic causes. Geophys. Res. Lett. 2003, 30, 1601. [Google Scholar] [CrossRef]
- Chen, C.; Noble, I.; Hellman, J.; Coffee, J.; Murillo, M.; Chawla, N. University of Notre Dame Global Adaptation Initiative—Country Index Technical Report; Notre Dame Global Adaptation Initiative: Notre Dame, IN, USA, 2024. [Google Scholar]
- Bank, T.W. Climate Risk Profile: Cambodia; World Bank Group: Washington, DC, USA; Asian Development Bank: Mandaluyong, Philippines, 2021. [Google Scholar]
- Stewart, M.A.; Coclanis, P.A. Environmental Change and Agricultural Sustainability in the Mekong Delta; Springer Science & Business Media: Berlin/Heidelberg, Germany, 2011; Volume 45. [Google Scholar]
- Kummu, M.; Sarkkula, J. Impact of the Mekong River flow alteration on the Tonle Sap flood pulse. AMBIO A J. Hum. Environ. 2008, 37, 185–192. [Google Scholar] [CrossRef]


Disclaimer/Publisher’s Note: The statements, opinions and data contained in all publications are solely those of the individual author(s) and contributor(s) and not of MDPI and/or the editor(s). MDPI and/or the editor(s) disclaim responsibility for any injury to people or property resulting from any ideas, methods, instructions or products referred to in the content. |
© 2024 by the authors. Licensee MDPI, Basel, Switzerland. This article is an open access article distributed under the terms and conditions of the Creative Commons Attribution (CC BY) license (https://creativecommons.org/licenses/by/4.0/).