Abstract
Advances in reconstructing the East Asian monsoon have provided important insights into the natural climate variability in Asia during the pre-instrumental period. However, there are still unresolved paleoclimate issues that necessitate the use of geological proxy data to further our understanding of past climate changes. This study focused on core B13, located in the muddy area of the North Yellow Sea (NYS), to investigate the evolutionary history over the past 1500 years and reconstruct the records of the East Asian summer monsoon (EASM) and Yellow Sea warm current (YSWC). The mean grain size of sediment ranged from 4.2 Φ to 5.6 Φ, with the sorting coefficient ranging from 1.9 to 2.2, indicating poor sorting. The C–M pattern showed a limited range of values, with the M values being between 33 and 83 μm and the C values being between 165 and 287 μm, suggesting uniform-suspension transport. The L* index ranged from 40.41 to 44.12, while the a* and b* indexes ranged from 0.55 to 1.78 and 2.86 to 5.94, respectively. A stable and relatively strong sedimentary environment is indicated through a comprehensive analysis of the C–M plot, triangular plot, the relationship between the mean grain size and sorting, and the changes in grain-size and color parameters. The sedimentary evolution in the muddy area of the NYS over the past 1500 years can be categorized into three distinct stages. In this study, proxies for the EASM and YSWC were extracted using the VPCA method from the sediment grain size and diffuse spectral reflectance (DSR) data, respectively. The reliability of these proxies has been confirmed through comparison with other validated proxies. The results indicated that the strength of the EASM and YSWC also exhibited three stages, corresponding to the Dark Ages Cold Period (DACP), Medieval Warm Period (MWP), and Little Ice Age (LIA), respectively. On a centennial scale, the correlation between the EASM and YSWC was predominantly negative. This research validates the reliability of the VPCA method for paleoclimate reconstruction, contributes important climate records in a special muddy area, and provides a new perspective on how to eliminate temporal errors in verifying the correlation between the two climate systems.
1. Introduction
Marine sediment serves as a crucial repository of information regarding watersheds, paleoclimate, and sea level fluctuations [1,2,3]. However, as terrestrial input materials undergo biological and chemical alterations and encounter interference from other substances on their journey from source to deposition, the sedimentary records become more intricate. To accurately decipher paleoenvironmental and paleoclimatic data from these records, a comprehensive comprehension of regional sedimentary evolution is imperative. Emphasis should be placed on examining fine components due to their heightened sensitivity to environmental shifts, superior resolution, and richer information content [3,4,5].
The NYS is a semi-enclosed environment linking the Bohai Sea (BS) and the South Yellow Sea, characterized by complex dynamic conditions [5,6]. In addition to receiving sediment from the Yellow River and various small- to medium-sized rivers along the coast, the NYS is influenced by coastal currents, YSWC, and cold water masses [7,8,9]. The intricate environmental conditions make the muddy area of the NYS a valuable source of information on environmental changes. Previous studies have utilized shallow stratigraphic profiling methods to understand the spatial characteristics of the area, identifying the Yellow River as the primary sediment source [7,9,10,11]. Nonetheless, the current understanding of the muddy area remains incomplete, and further research on the sedimentary evolution processes is warranted.
The East Asian monsoon, which is active in the eastern part of the Eurasian continent, plays a crucial role in the Asian monsoon system and significantly impacts China’s marginal seas [5,12,13]. The EASM, closely associated with regional precipitation, has a profound influence on agricultural production and environmental changes, making it a key factor in studying the interaction between climate and human activities. Previous studies have utilized various archival carriers, such as stalagmites, loess-paleosol sequences, peat, and lake sediment, to uncover changes in the EASM at different timescales [14,15,16,17,18]. With the growing interest in ocean research, marine sediment has become increasingly important due to its high sedimentation rate and ability to provide diverse types of information [19,20,21,22,23]. Serving as a repository of multiple types of data, marine sediment has emerged as a critical medium for extracting monsoon records. However, monsoon records obtained from sediment in different regions may vary due to the extraction methods and noise. Extracting monsoon records from a large number of sediment cores for comparative analysis appears to be an effective approach to address this issue.
The YSWC, characterized by high temperature and salinity, is an important warm current originating from the outer sea and exerting a significant influence on changes in seawater exchange as well as the marine environment and resources of the East China Seas [24,25,26]. Thus, elucidating the path, intensity, and changes of the YSWC on interannual to centennial timescales holds great practical significance. Nevertheless, research on the YSWC is currently limited, particularly in terms of its geological history and even more so in reconstructing its century-long evolution.
In this study, characteristics of sediment from Core B13 were analyzed to investigate the sedimentary process of the NYS. Proxies of the EASM and YSWC were extracted, and records were reconstructed over the past 1500 years. Based on the findings, the relationship between the EASM and YSWC was examined.
2. Materials and Methods
2.1. Cores B13 and B60
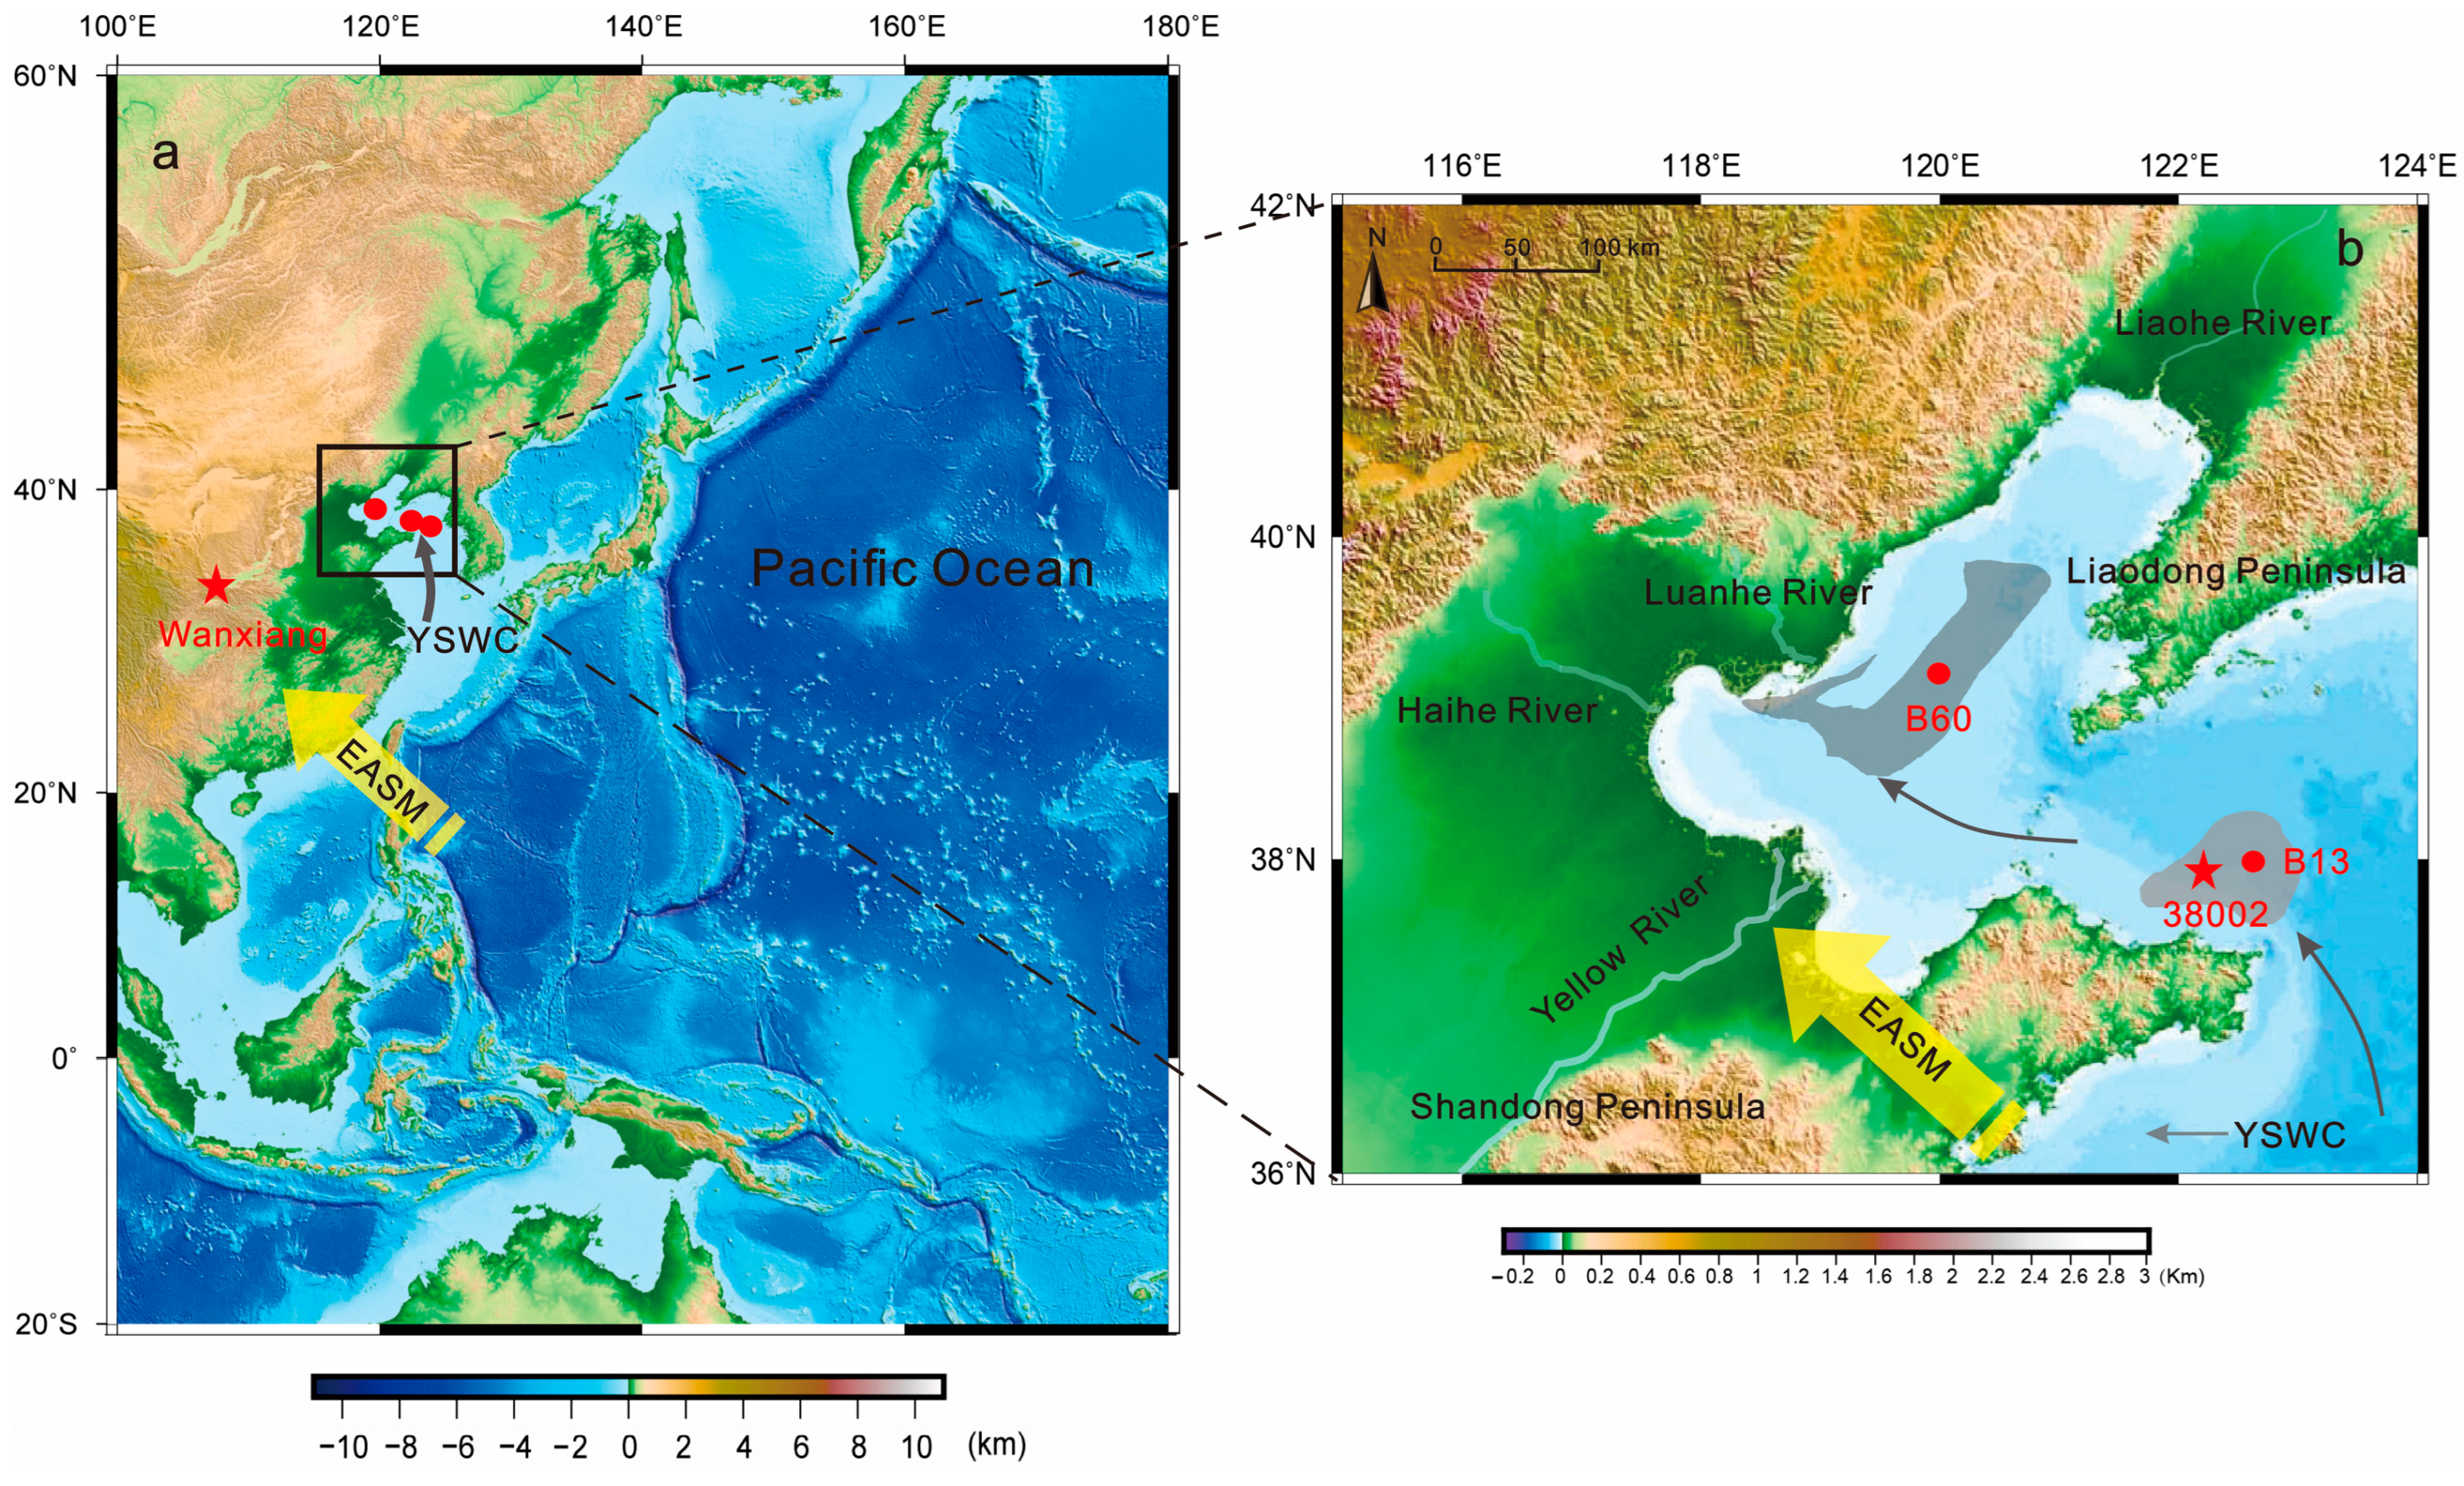
During the research cruise of the R/V DONG FANG HONG ER HAO, organized in August and September 2015, sediment Cores B13 (123.06° E, 37.90° N, 126 cm in length, water depth ~60 m) and B60 (119.89° E, 39.05° N, 110 cm in length, water depth 22 m) (Figure 1) were collected.
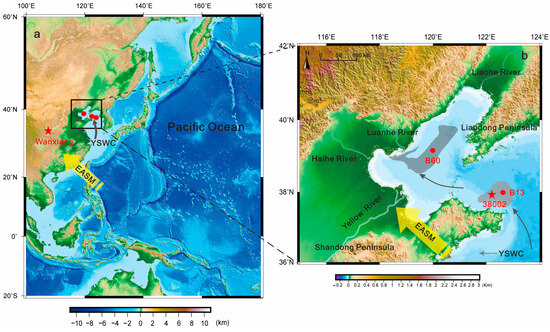
Figure 1.
Schematic map showing the cores’ locations and oceanographic settings. The locations of Cores B13 and B60 are indicated by the red dots, and the locations of Core 38,002 [27] and Wanxiang Cave [28] are indicated by the red stars.
Cores B13 and B60, situated in the muddy area of the NYS and BS, respectively, were sampled at 1 cm intervals for subsequent laboratory analyses. The chronology of Core B60 was established by Lyu et al. [29] using 210Pb for the upper 18 cm and eight AMS 14C results. In the case of Core B13, the age framework was determined based on a Bayesian age model due to the unavailability of sufficient foraminifera or shell samples for AMS14C dating, as described by Lyu et al. [30] through a comparison of the L* index. The dating results of Core B60 and the age control points of Core B13 are presented in Figure S1 and Table S1. The sediment characteristics of Core B60, particularly in terms of grain size and diffuse spectral reflectance (DSR), were discussed by Lyu et al. [29].
2.2. Laboratory Analyses
A total of 236 grain-size samples from Cores B13 and B60 underwent pretreatment with a 10–20 mL H2O2 solution (30%) and a 10 mL HCl solution (10%) to eliminate organic matter and carbonates, respectively. Then, deionized water was used to wash the samples. Before entering the Malvern Mastersizer 2000 laser grain-size analyzer (Malvern Instruments Ltd., Worcestershire, UK) for testing, the samples were dispersed through ultrasonic treatment. Finally, fifty classes ranging from 0.3 to 2000 μm were determined.
The CIELAB color space is visualized as a three-dimensional sphere, where the axis represents the lightness parameter L*, which ranges from 0 to 100. The chromaticity coordinates a * and b* denote the color direction: +a* corresponds to the red direction, −a* to the green direction, +b* to the yellow direction, and −b* to the blue direction. This color space serves as a valuable tool for describing sediment color and can provide rich stratigraphic information [31,32]. A Minolta CM-2002 spectrophotometer (wavelength range: 400–700 nm) (Konica Minolta, Inc., Tokyo, Japan) was used for the DSR measurements with a resolution of 1 cm. The grain-size and DSR measurements were carried out at the Key Laboratory of Marine Geology and Metallogeny, First Institute of Oceanography, Ministry of Natural Resources.
XRF measurements were conducted at a 1 cm resolution on original samples from Core B60. The measurements were carried out at the State Key Laboratory of Marine Geology, Tongji University, using a Niton XL2 analyzer produced by the ThermoFisher Scientific company (Waltham, MA, USA). Several elements, which are commonly used to reflect the evolution of the sedimentary environment and changes in sedimentation, including Fe, Mn, Ca, Ti, Sr, Rb, K, Zr, V, Zn, and Cr, were chosen for analyses.
2.3. Statistical Methods
Varimax-rotated principal component analysis (VPCA) refers to a method of dimensionality reduction that transforms multiple indicators into a few unrelated composite indicators. This method uses a smaller number of indicators to replace and comprehensively reflect the original, larger amount of information. These composite indicators are the main components of the original multiple indicators. In this study, the software used to carry out VPCA was SPSS 21.
Typically, grain-size classes with a content greater than 0 were chosen from a set of fifty classes ranging from 0.3 to 2000 μm, as well as 31 columns of DSR data spanning wavelengths from 400 to 700 for VPCA. The selection of VPCA components is usually based on the variance proportion that can be explained, depending on the specific requirements.
3. Results and Analyses
3.1. Grain-Size Analyses of Core B13
The mean grain size (Mz, Φ values), sorting (δ, nondimensional parameters), skewness (Sk), and kurtosis (Ku) are common parameters used to characterize sediment grain sizes. According to Mcmanus [33], these four parameters were calculated, with Mz measured in Φ units, while Sk and Ku are nondimensional parameters.
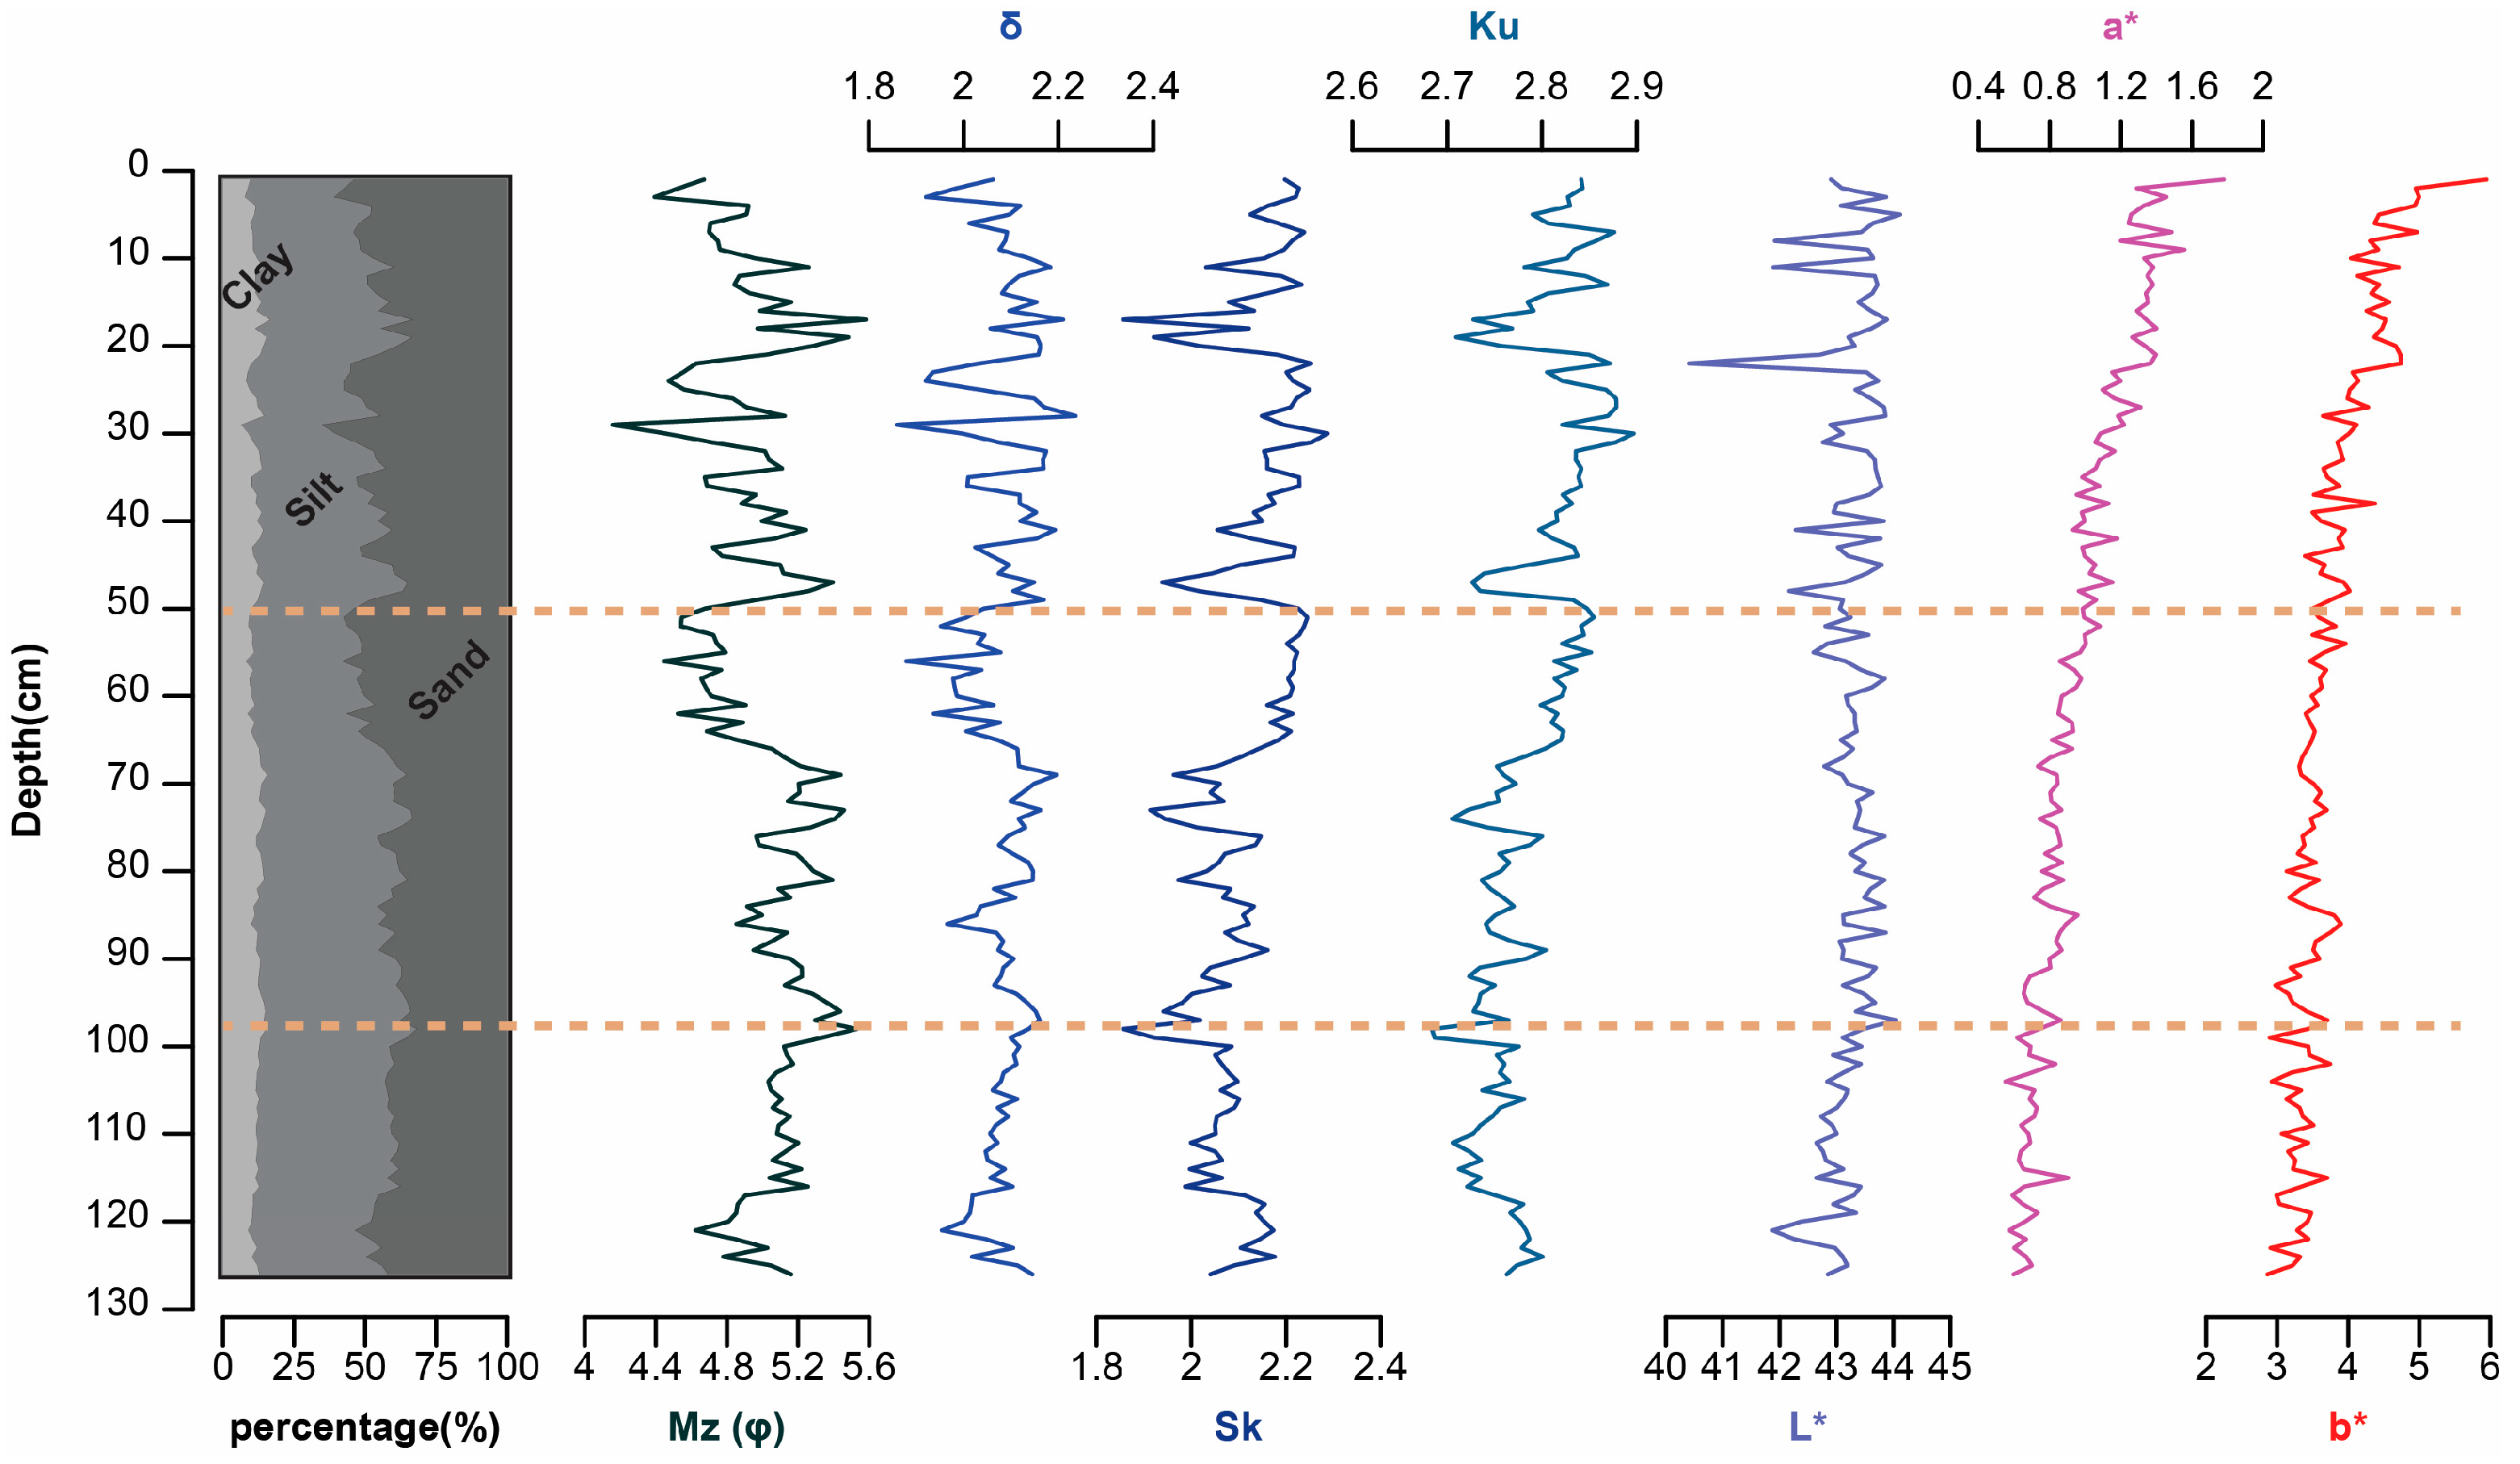
In Core B13, the clay content was predominantly <15%, while the silt and sand contents exceeded 30%. The silt and sand contents were approximately equal, with sand and silt being the predominant components above and below a 70 cm depth, respectively. The mean grain size reflected the changes in the predominant component, showing a distinct shift at 70 cm (Figure 2). A significant correlation between the mean grain size and sorting was observed, indicating that smaller mean grain sizes corresponded to better sorting. This relationship was confirmed in Figure 3b, showing a positive correlation between the two parameters. The mean grain size ranged from 4.2 Φ to 5.6 Φ, with the sorting coefficient (δ) indicating poor sorting, ranging from 1.9 to 2.2. Skewness and kurtosis showed minor fluctuations, ranging from 1.9 to 2.3 and 2.7 to 2.9, respectively (Figure 2), suggesting extreme positive skewness and normal kurtosis.
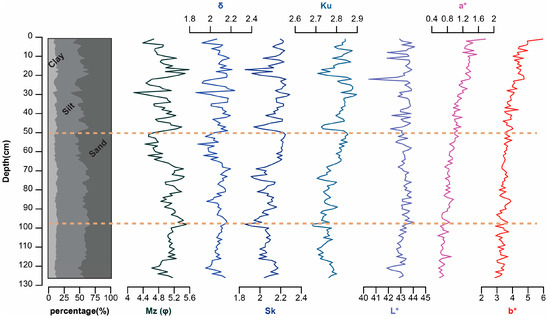
Figure 2.
Profiles of Core B13 with grain size and color changes.
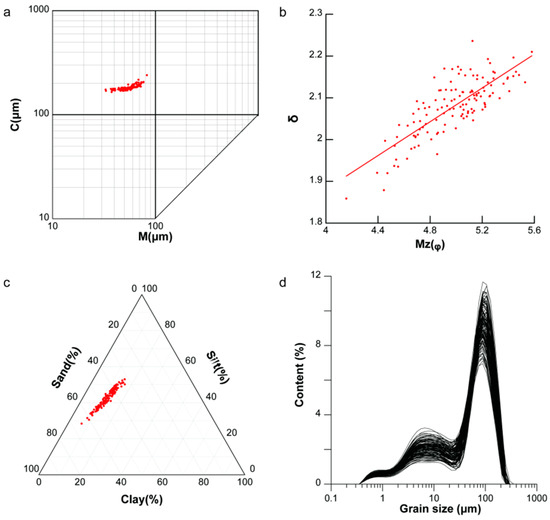
Figure 3.
Characteristics of grain size in sediment from Core B13. (a) C–M plot; (b) relationship between mean grain size and sorting, the trend line is indicated by red line; (c) triangular plot for the components of clay, silt, and sand; and (d) partial grain-size frequency distribution curves.
Analyzing the sediment grain-size structure in muddy areas is valuable for determining the transport modes and hydrodynamic intensity. The C–M pattern, consisting of C (the one percentile) and M (the median diameter), was utilized to assess the initial and average hydrodynamic energies [34,35]. The C–M pattern (Figure 3a) indicated a narrow range of values, with the M values being between 33 and 83 μm and the C values being between 165 and 287 μm, suggesting uniform-suspension transport and a stable, relatively strong sedimentary environment. Concentrated points in the ternary diagram further supported the stability of the sedimentary environment (Figure 3c). The grain-size curves (Figure 3d) exhibited three distinct distribution patterns, with peaks around 0.7 μm in very fine clay, approximately 8 μm in fine silt, and 100 μm in the medium sand components. Overall, the sedimentary environment in the muddy area of the NYS has remained relatively stable over the past 1500 years, making it suitable for extracting paleoclimatic proxies.
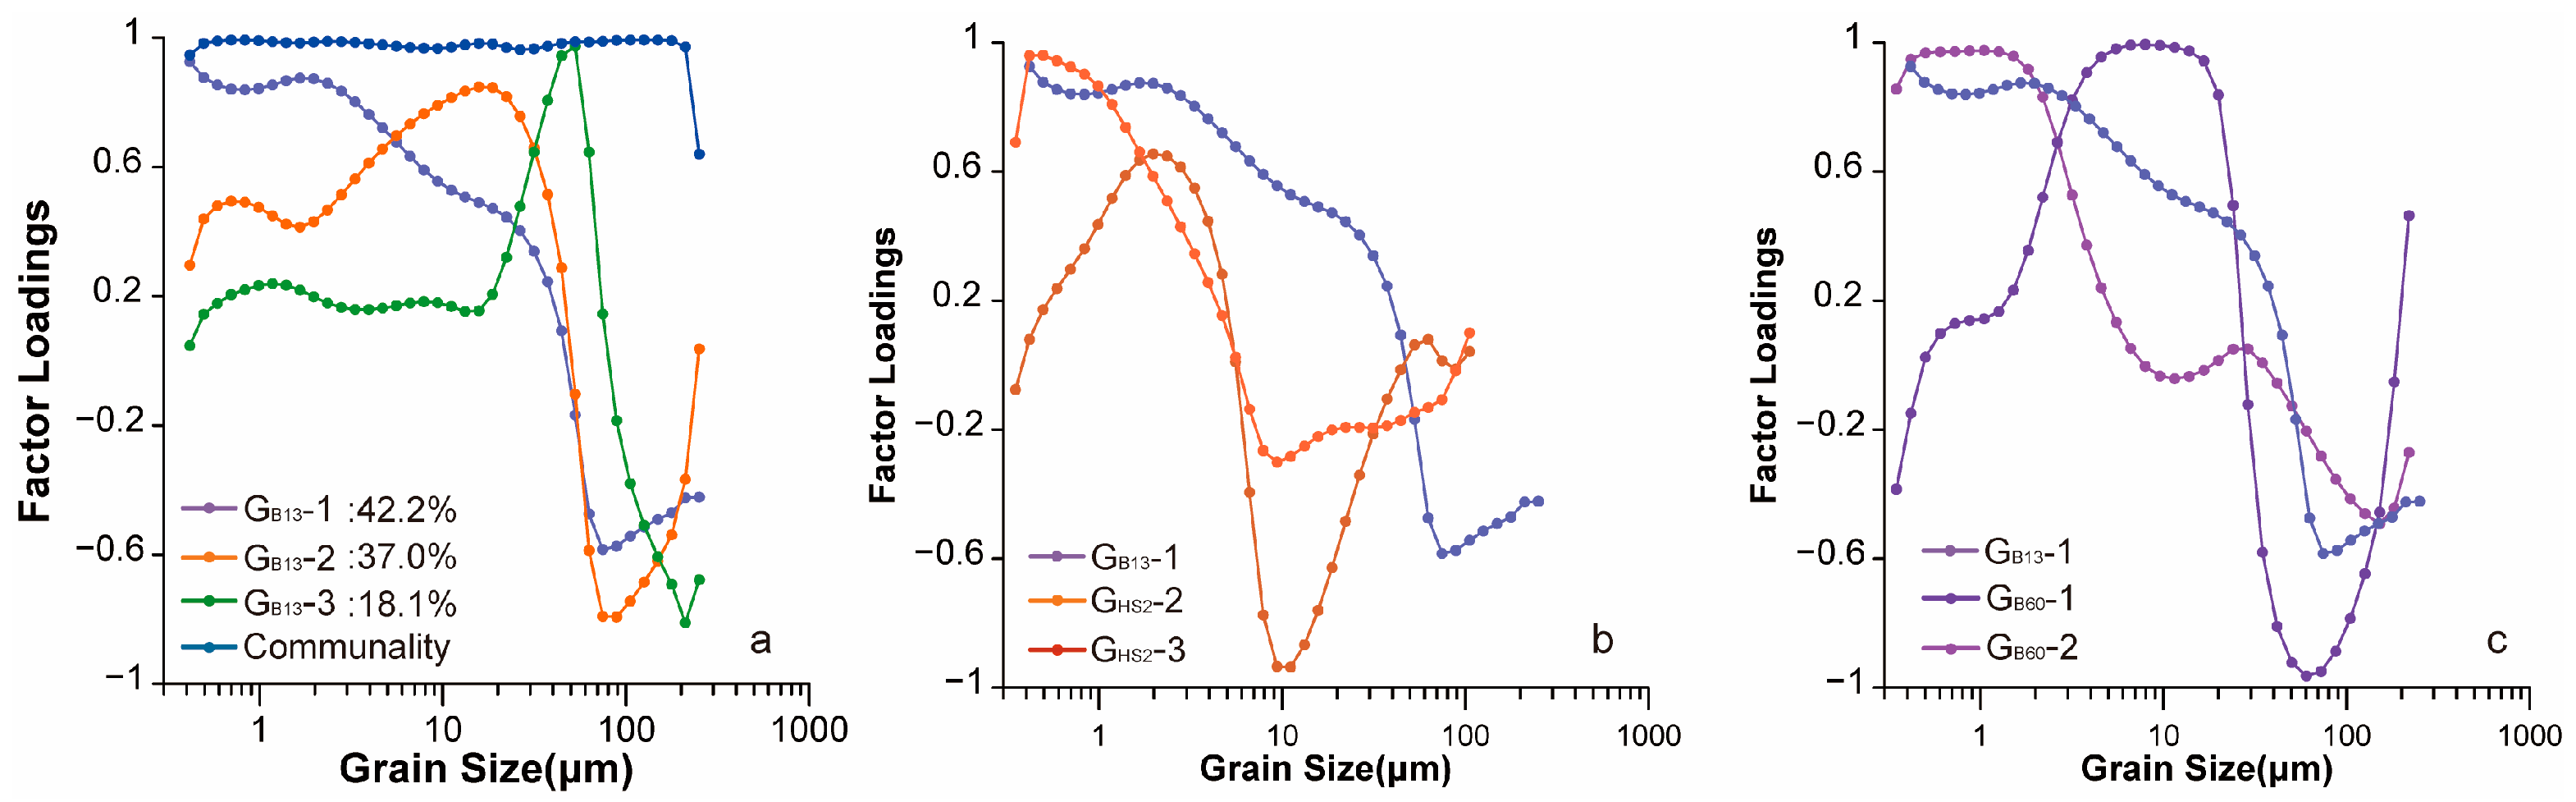
To further analyze the changes in sediment grain size, a VPCA method was employed to categorize the sediment sources, hydrodynamic components, or potential paleoclimate records [36,37]. Given that a content below 0.3 μm and above 250 μm can be disregarded, 38 grain-size classes, ranging from 0.3 to 250 μm, were defined for the VPCA. Three VPCA components, namely GB13-1, GB13-2, and GB13-3, were identified and collectively explained 97% of the total variance (Figure 4a).
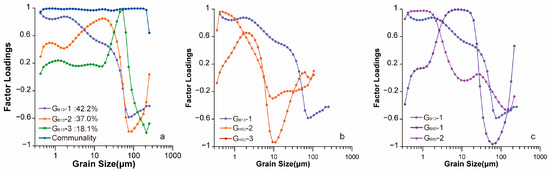
Figure 4.
VPCA results from different sediments of the cores. (a) Core B13; (b) Core HS2 [37]; and (c) Core B60 [29].
3.2. Changes in Sediment Color
Sediment color, a widely used proxy for sediment characteristics, is often utilized to extract information on paleoenvironmental changes. Among the parameters of continental shelf sediments, the sediment brightness (L*) can serve as a proxy to assess the carbonate content, which is linked to environmental productivity. The red-green (a*) and blue-yellow (b*) parameters are commonly employed to indicate terrigenous input [31,32,38]. In Core B13, the L* index ranged from 40.41 to 44.12, while the a* and b* indexes ranged from 0.55 to 1.78 and 2.86 to 5.94, respectively. As depicted in Figure 2, the variation in the L* index with depth can be divided into two distinct stages at a 70 cm depth. Significant fluctuations were observed in the lower part compared to the section below 70 cm in core B13. Conversely, the curves of the a* and b* indexes did not show a distinct boundary at 70 cm, displaying a gradual increasing trend (Figure 2).
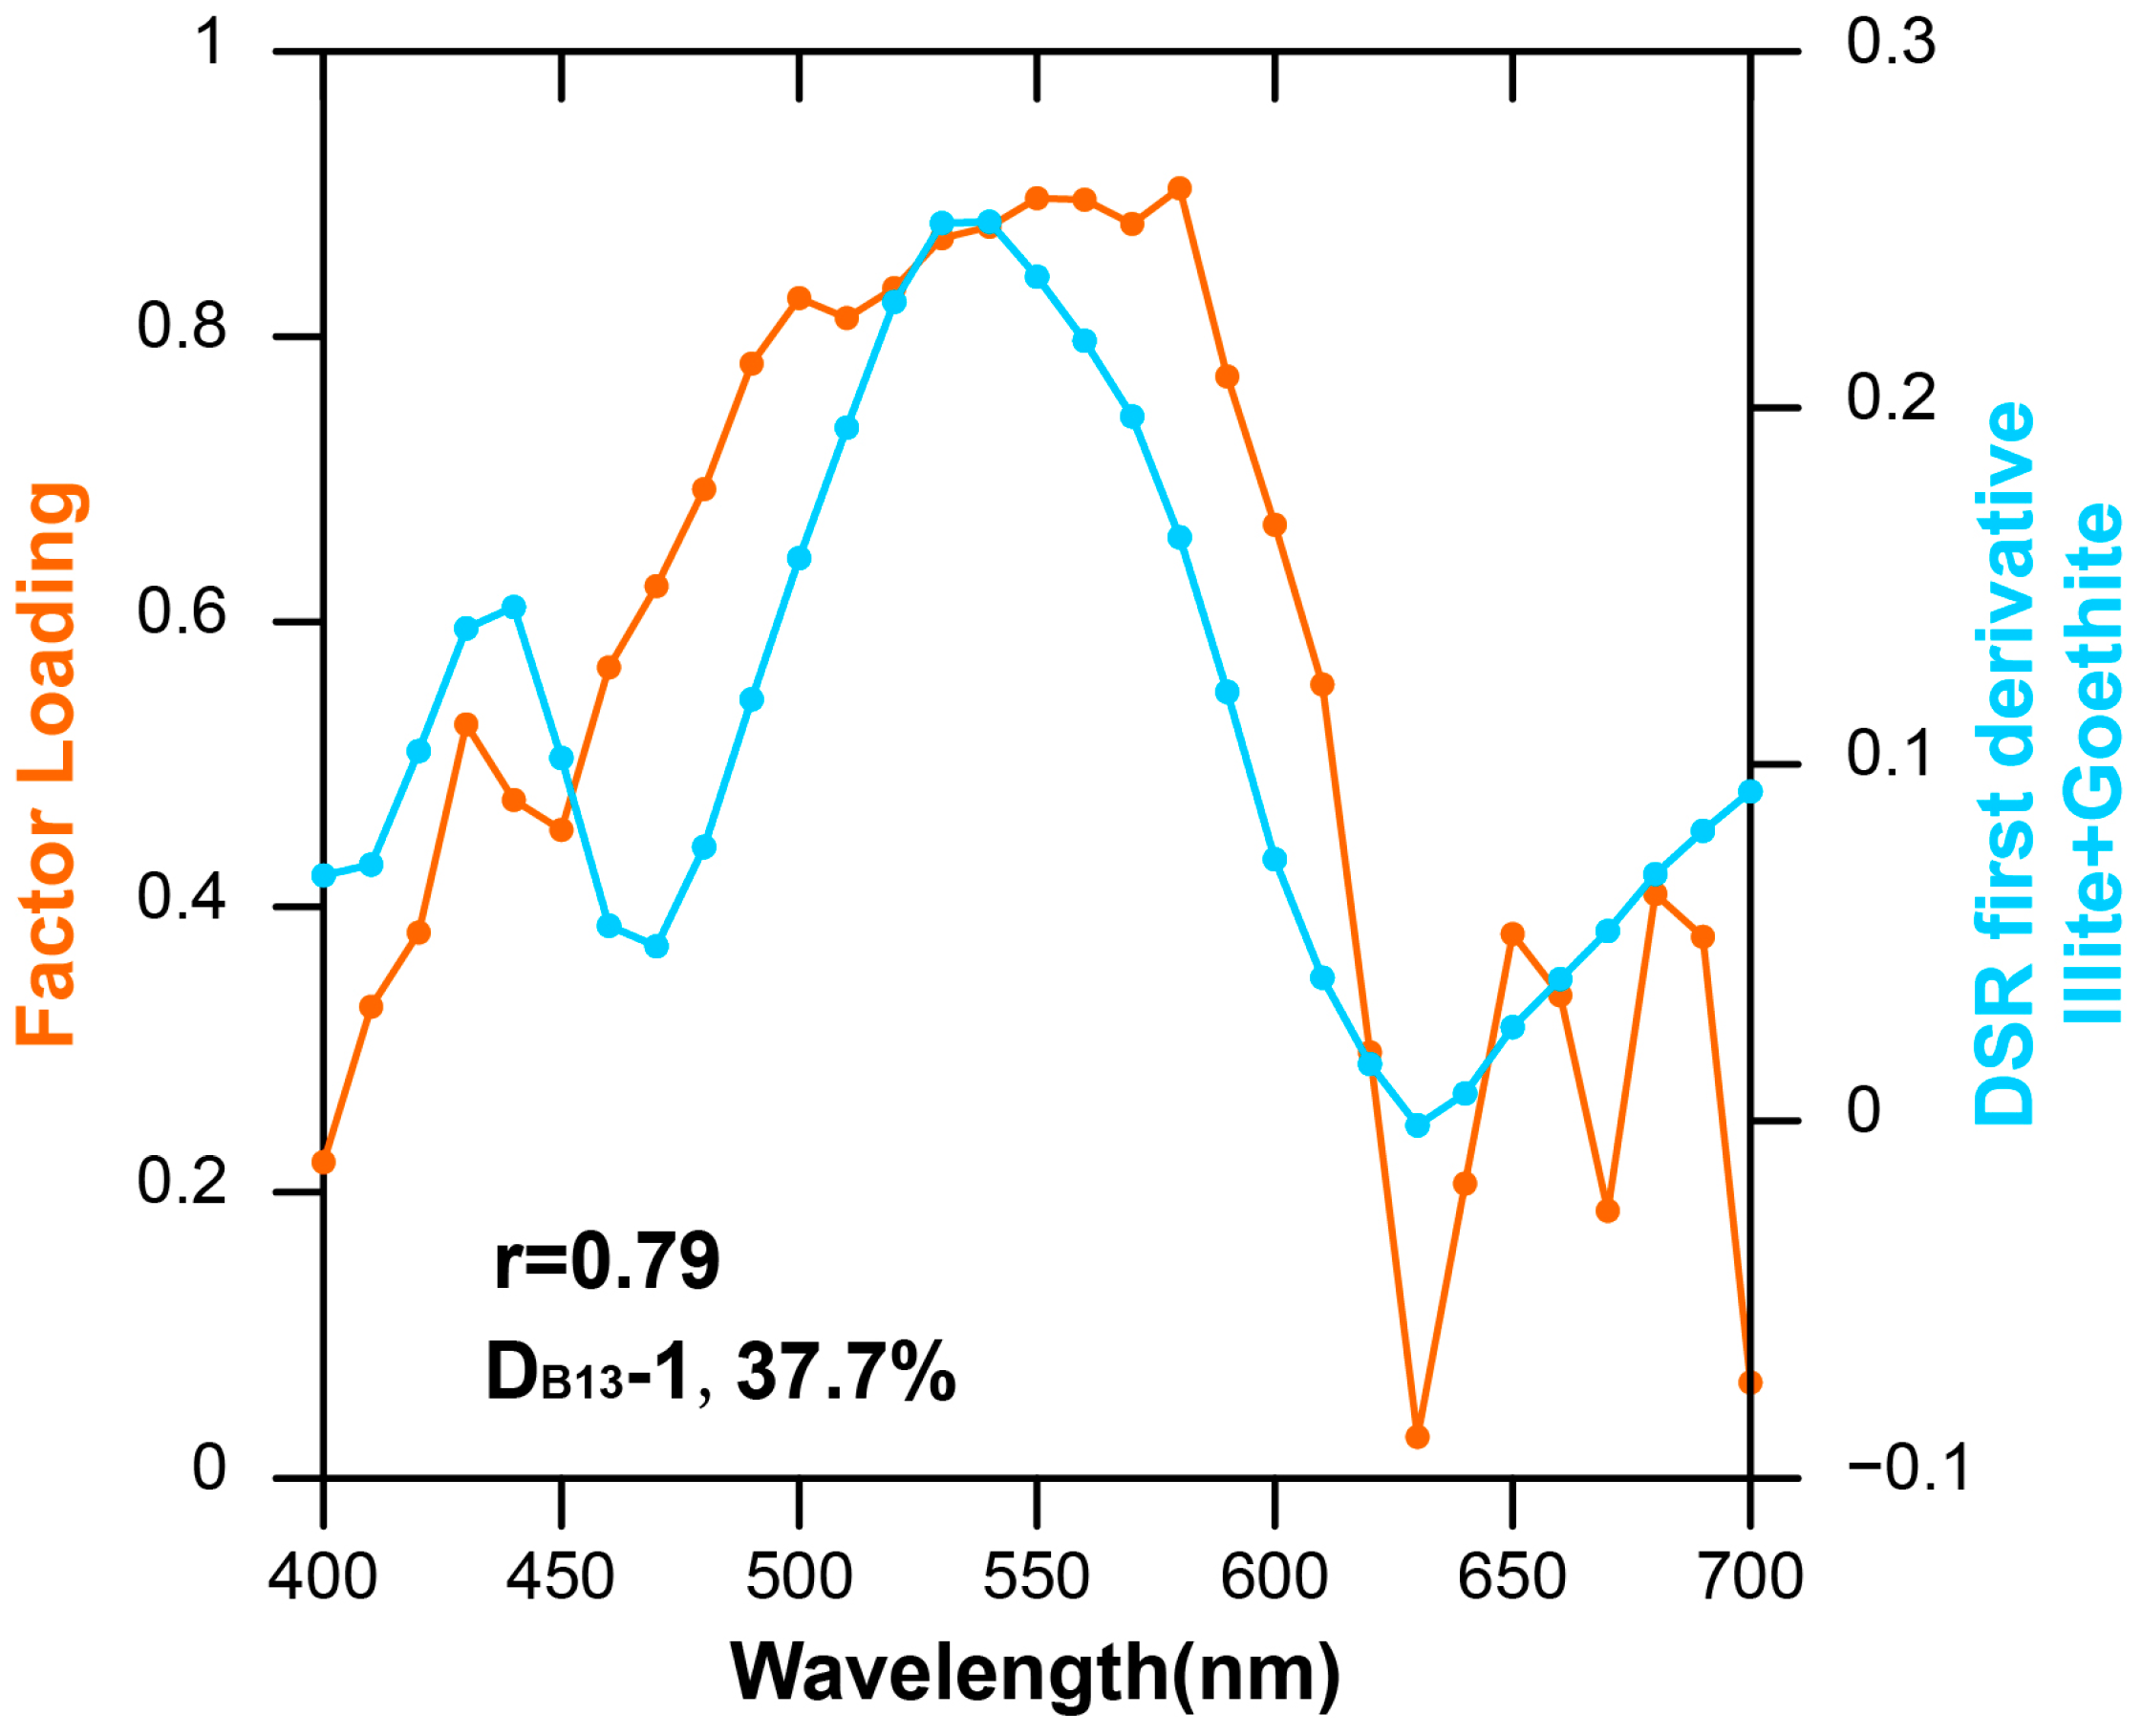
To further analyze the contributions of mineral assemblages in the sediment of Core B13, the DSR data were also analyzed using the VPCA method. A single dominant component, namely DB13-1, explained over 10% of the total variance, collectively accounting for 37.7% (Figure 5). For mineral identification using DSR data, linear correlation coefficients were calculated, and the center-weighted first derivative spectra of the known minerals and mineral mixtures were measured at Kent State University [39,40]. As shown in Figure 5, DB13-1 exhibited a correlation with Illite+Goethite (r = 0.79).

Figure 5.
Varimax-rotated factor loadings of DSR in Core B13 and first derivates of mineral standards (Illitite + Goethite) plotted as a function of wavelength.
3.3. Changes in Sediment Elements
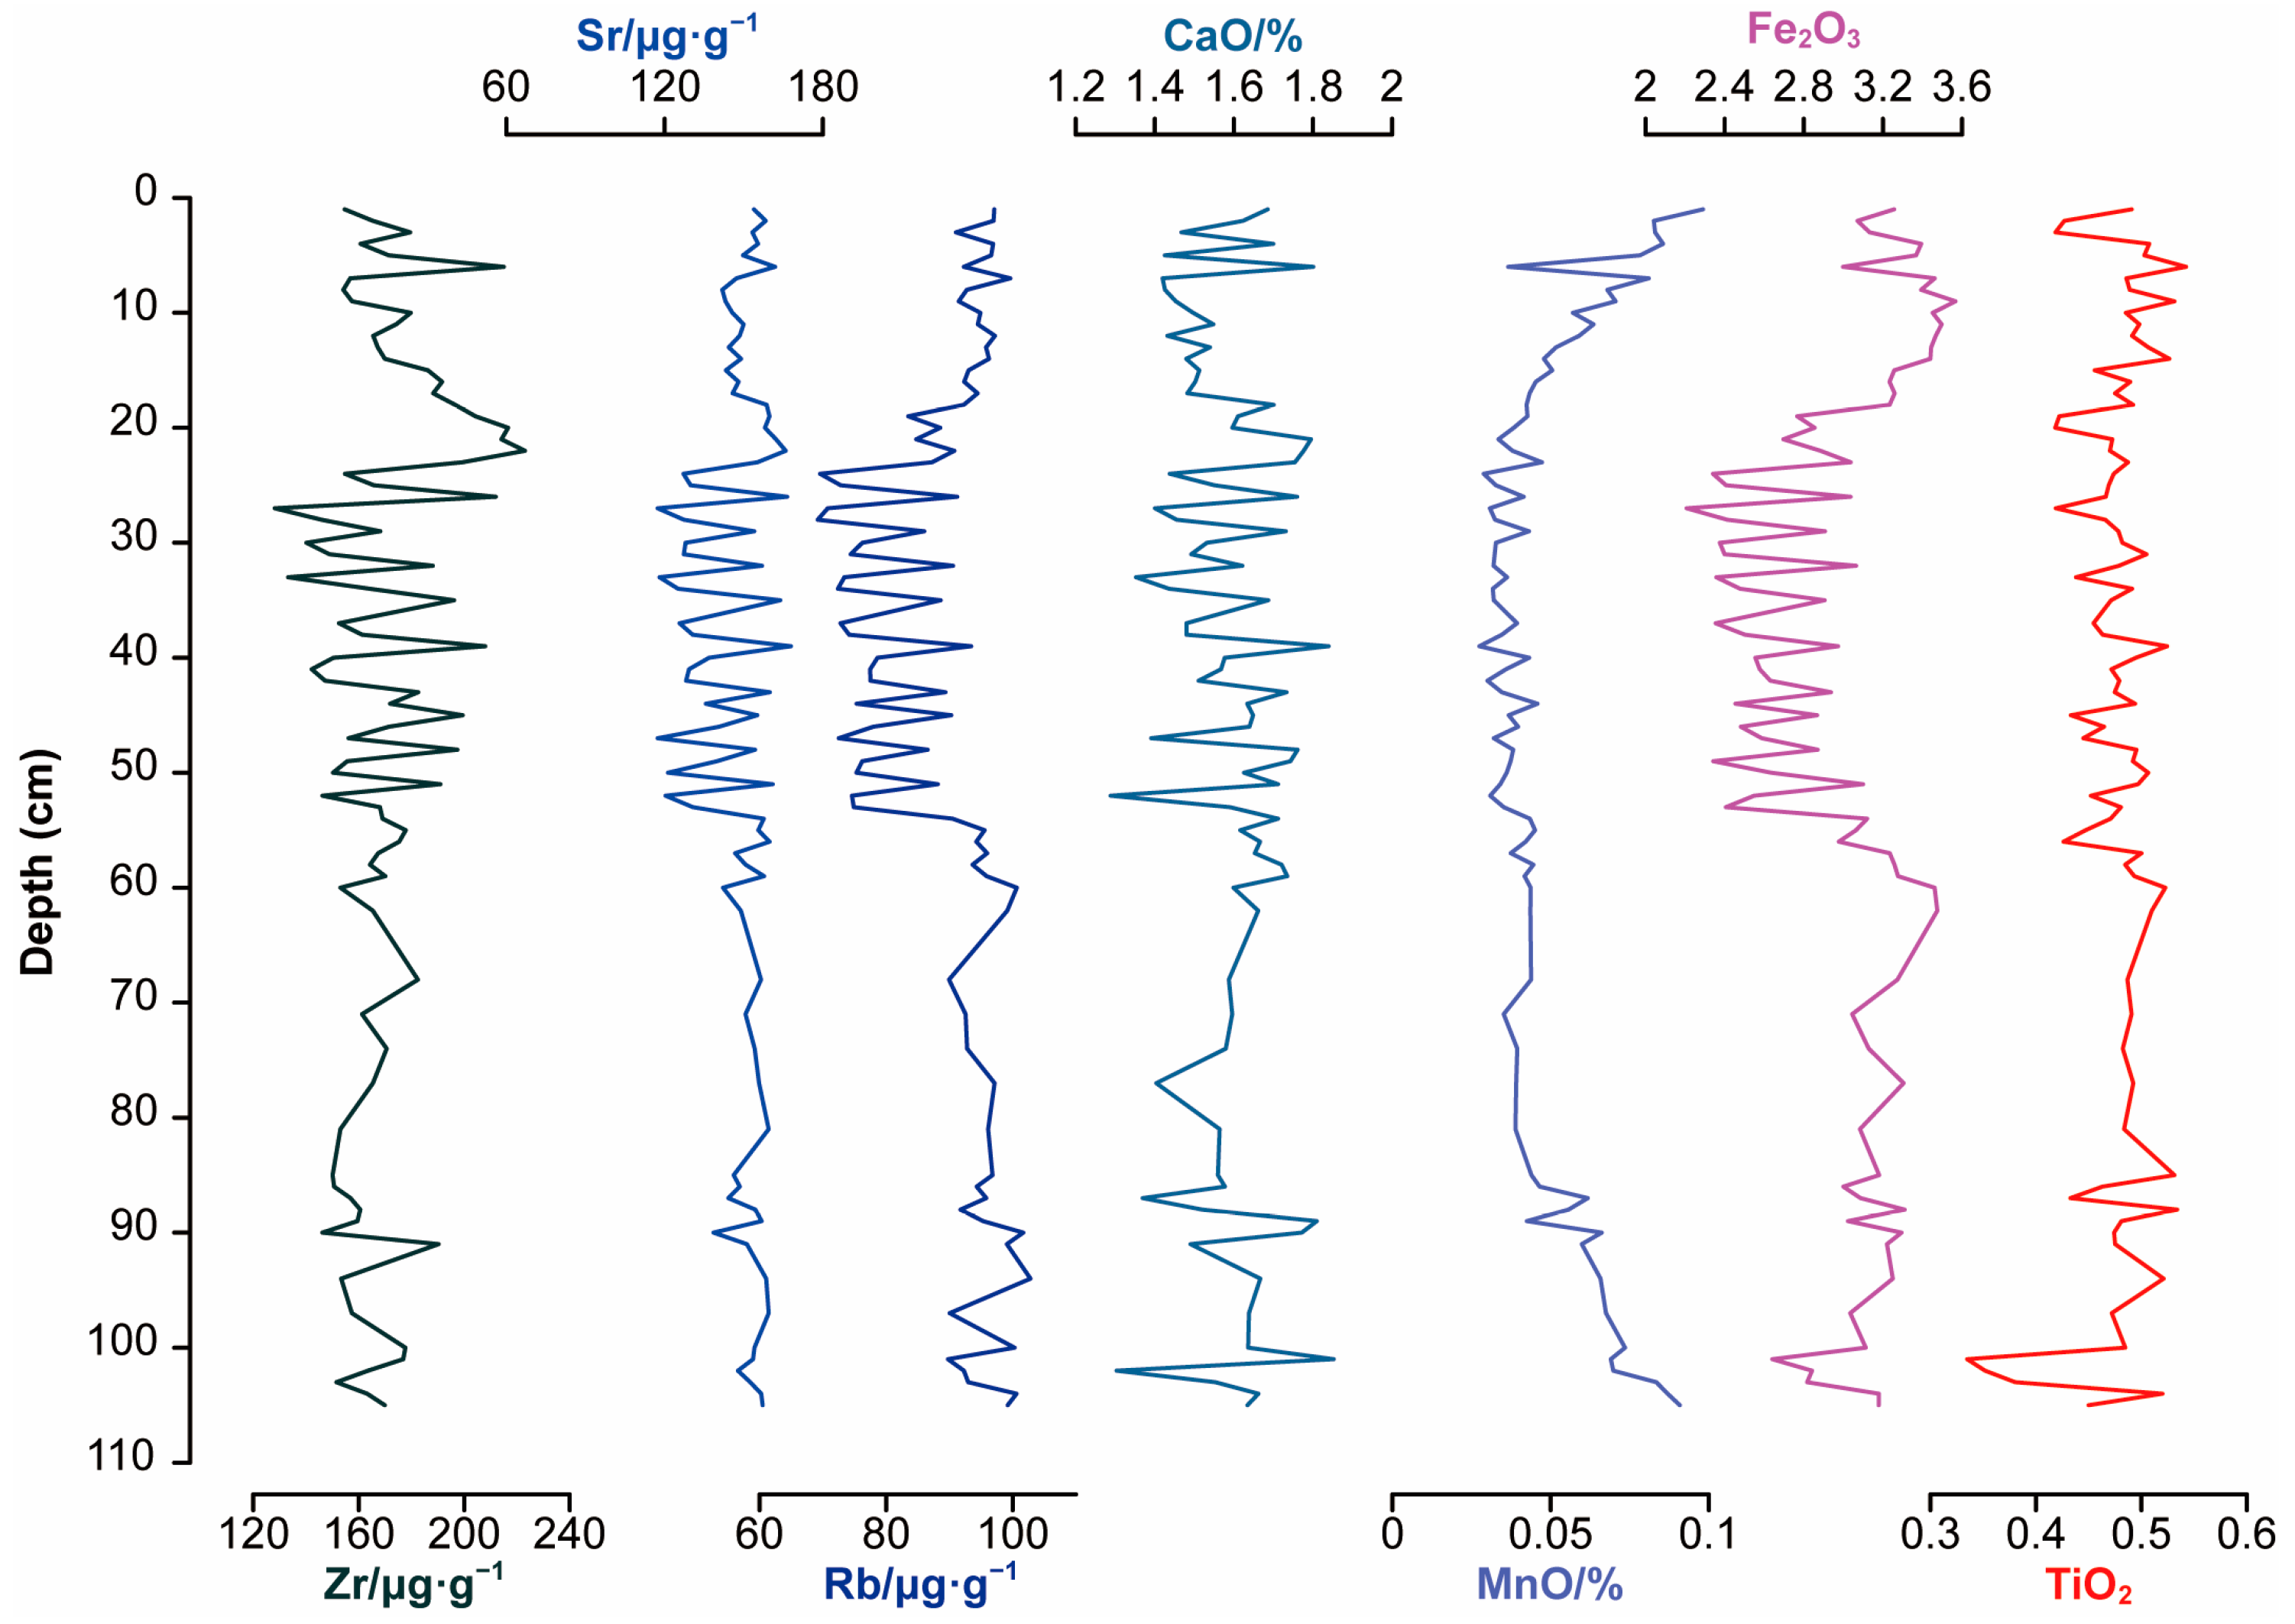
The elemental composition of the sediment serves as a straightforward proxy for paleoenvironmental and paleoclimate studies. The sensitivity of elements often varies with the sedimentary environment [36,41]. The elemental composition of sediment in Core B60 was analyzed to extract information about the paleoclimate. The results of the element analysis in Core B60 are presented in Figure 6.
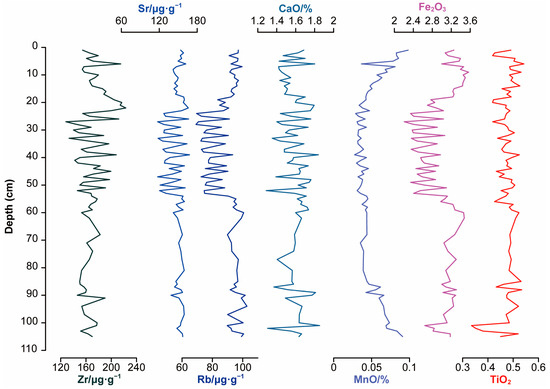
Figure 6.
Vertical profiles of the selected elements in the Core B60.
4. Discussion
4.1. Sedimentary Environment Evolution
Over the past 1500 years, the muddy area of the NYS has been situated in a relatively stable underwater sedimentary environment [5,6]. By examining the sediment characteristics of Core B13, such as the grain size and DSR, in conjunction with the age model established earlier, the sedimentary environment in the muddy area over the past 1500 years was categorized into three stages (Figure 2):
- (1)
- 440–800 CE (126–97 cm). During this period, stable grain-size parameters and components suggested a stable hydrodynamic environment. The high mean grain-size values and lower sand content suggested a state of weak hydrodynamics. The slight increase in L* suggested warmer currents with higher temperatures and salinity influencing the area. Fluctuations in the a* and b* values were associated with changes in the terrestrial input components.
- (2)
- 800–1300 CE (97–50 cm). Significant fluctuations in sedimentary conditions, with varying grain-size parameters and an L* index, suggest relatively high hydrodynamic activity. Changes in the L* index were reflected in the environmental productivity due to warm currents. The slow increases in the a* and b* values suggest a rise in terrestrial input, while the increasing mean grain size indicates enhanced transportation.
- (3)
- 1300–1990 CE (50–0 cm). In this stage, the severe fluctuations in grain-size parameters indicated a fluctuation in hydrodynamics. Fluctuations in the L* index reflected shifts in the warm current, with pronounced changes in the terrestrial input components, shown by varying a* and b* values.
4.2. Variability of the EASM and YSWC
A reliable climate proxy is crucial for paleoenvironment research. The muddy area, acting as a significant sink for sediment, offers a valuable opportunity to investigate information on paleoenvironmental changes [20,22,36,37]. Previous studies have indicated that the muddy area in the NYS formed during the high sea level period in the Holocene, with sediment primarily sourced from the Yellow River. Material carried by the Yellow River into the BS gradually accumulated in the western part of the NYS under the influence of the YSWC and tides [7,9,10,11]. Therefore, sediment cores located in the muddy area of the NYS can provide information on the YSWC and EASM. Despite limited research on extracting monsoon information from this area, Core B13 holds particular significance.
The VPCA results on sediment grain size from Core B13 appear to offer insights into the monsoon patterns. As shown in Figure 4a, three components extracted from Core B13 exhibited different loadings, ranging from fine to coarse particles. GB13-1 suggested weaker hydrodynamics during summer, while GB13-3 indicated an influence of stronger hydrodynamics. GB13-2 was identified as representing the impact of tropical cyclones [30]. Finer sediments on the continental shelf located at the edge of the East Asian Monsoon region are typically indicative of the EASM. For example, EASM proxies from Core B60 in the BS and Core HS2 in the South Yellow Sea, identified through VPCA, were within component ranges of 10–40 μm and 0–6 μm, respectively [29,37]. Comparisons of the VPCA results of this study with the aforementioned proxies revealed similar structures (Figure 4b,c). Given that GB60-12 (a combination of GB60-1 and GB60-2, according to the variance percentages) and GHS2-23 (a combination of GHS2-2 and GHS2-3, according to the variance percentages) were used as proxies for the EASM [29,37], it is suggested that GB13-1 could also serve as a proxy for the EASM.
The sediment carried by the Yellow River is the primary source in the muddy area of the NYS, as confirmed by numerous studies [7,9,10,11]. Its transportation capacity is largely influenced by the precipitation controlled by the EASM within the basin; a more robust EASM typically results in increased sediment supply and larger values of grain size in the BS and NYS [31,42,43,44]. The analysis in this study indicates that lower values of GB13-1, with dominant coarser components and negative loadings, signify a stronger EASM, while higher values suggest the opposite (Figure 4). Therefore, GB13-1 extracted from Core B13 can effectively serve as a proxy for EASM changes.
Similarly, the VPCA results from the DSR data are valuable for reflecting paleoenvironmental changes. As mentioned above, DB13-1 is correlated with Illite + Goethite. Illite is a predominant clay mineral in the sediment from China’s marginal seas, while goethite is commonly formed through the weathering of iron-rich minerals and is widespread in China’s marginal seas [29,45,46,47,48]. Therefore, the mineral combination represented by DB13-1 reflects influences from the marginal seas. Considering the unique location and the influence of the YSWC, the DB13-1 from the muddy area of the NYS can be used to indicate variations in the YSWC.
To further validate the hypothesis, we compared our records with previously published proxies (Figure 7). Sea surface temperature (SST) serves as an effective indicator of ocean current intensity. SST records from Core 38,002 in the western part of the NYS have been established as a proxy for the YSWC [27]. Therefore, the reliability of DB13-1 has been confirmed through its consistency with SST records from Core 38,002 (Figure 7a). Similarly, the consistency between GB13-1 and other proxies of the EASM (Figure 7b–d), such as the precipitation index record for north central China [49], stalagmite δ18O series of Wanxiang Cave [28], and GB60-12 from Core B60 [29], also confirmed its reliability as a proxy of the EASM. Additionally, the Rb/Sr ratio from sediment cores has also been validated as a proxy for the EASM [50], and the consistency between GB13-1 and Rb/Sr from Core B60 further enhances its reliability (Figure 7e).
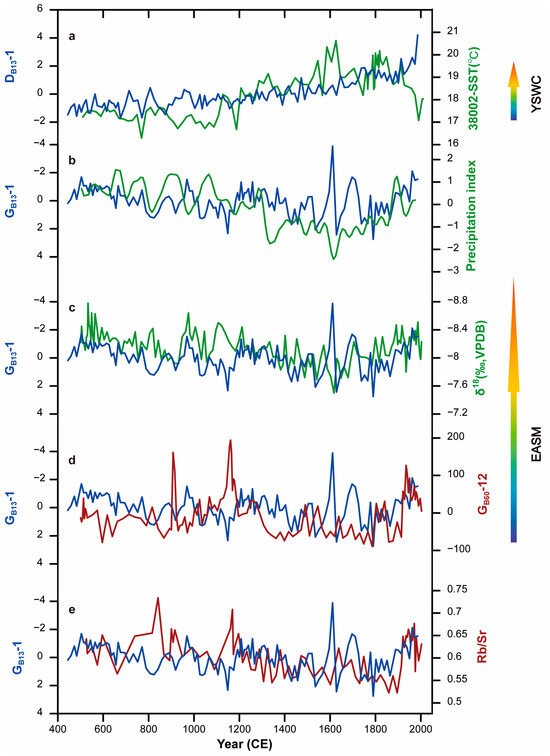
Figure 7.
Comparison between various proxies of YSWC and EASM over the past 1500 years. (a) The curves of DB13-1 in this study and the sea surface temperature of Core 38,002 in the NYS [27] (b) The curves of GB13-1 in this study and the precipitation index record for north central China [49]. (c) The stalagmite δ18O series of Wanxiang Cave [28]. (d) The curve of GB60-12 (a combination of GB60-1 and GB60-2, according to the variance percentages) in Core B60 [29] indicates the intensity of EASM. (e) The ratio of Rb/Sr in Core B60.
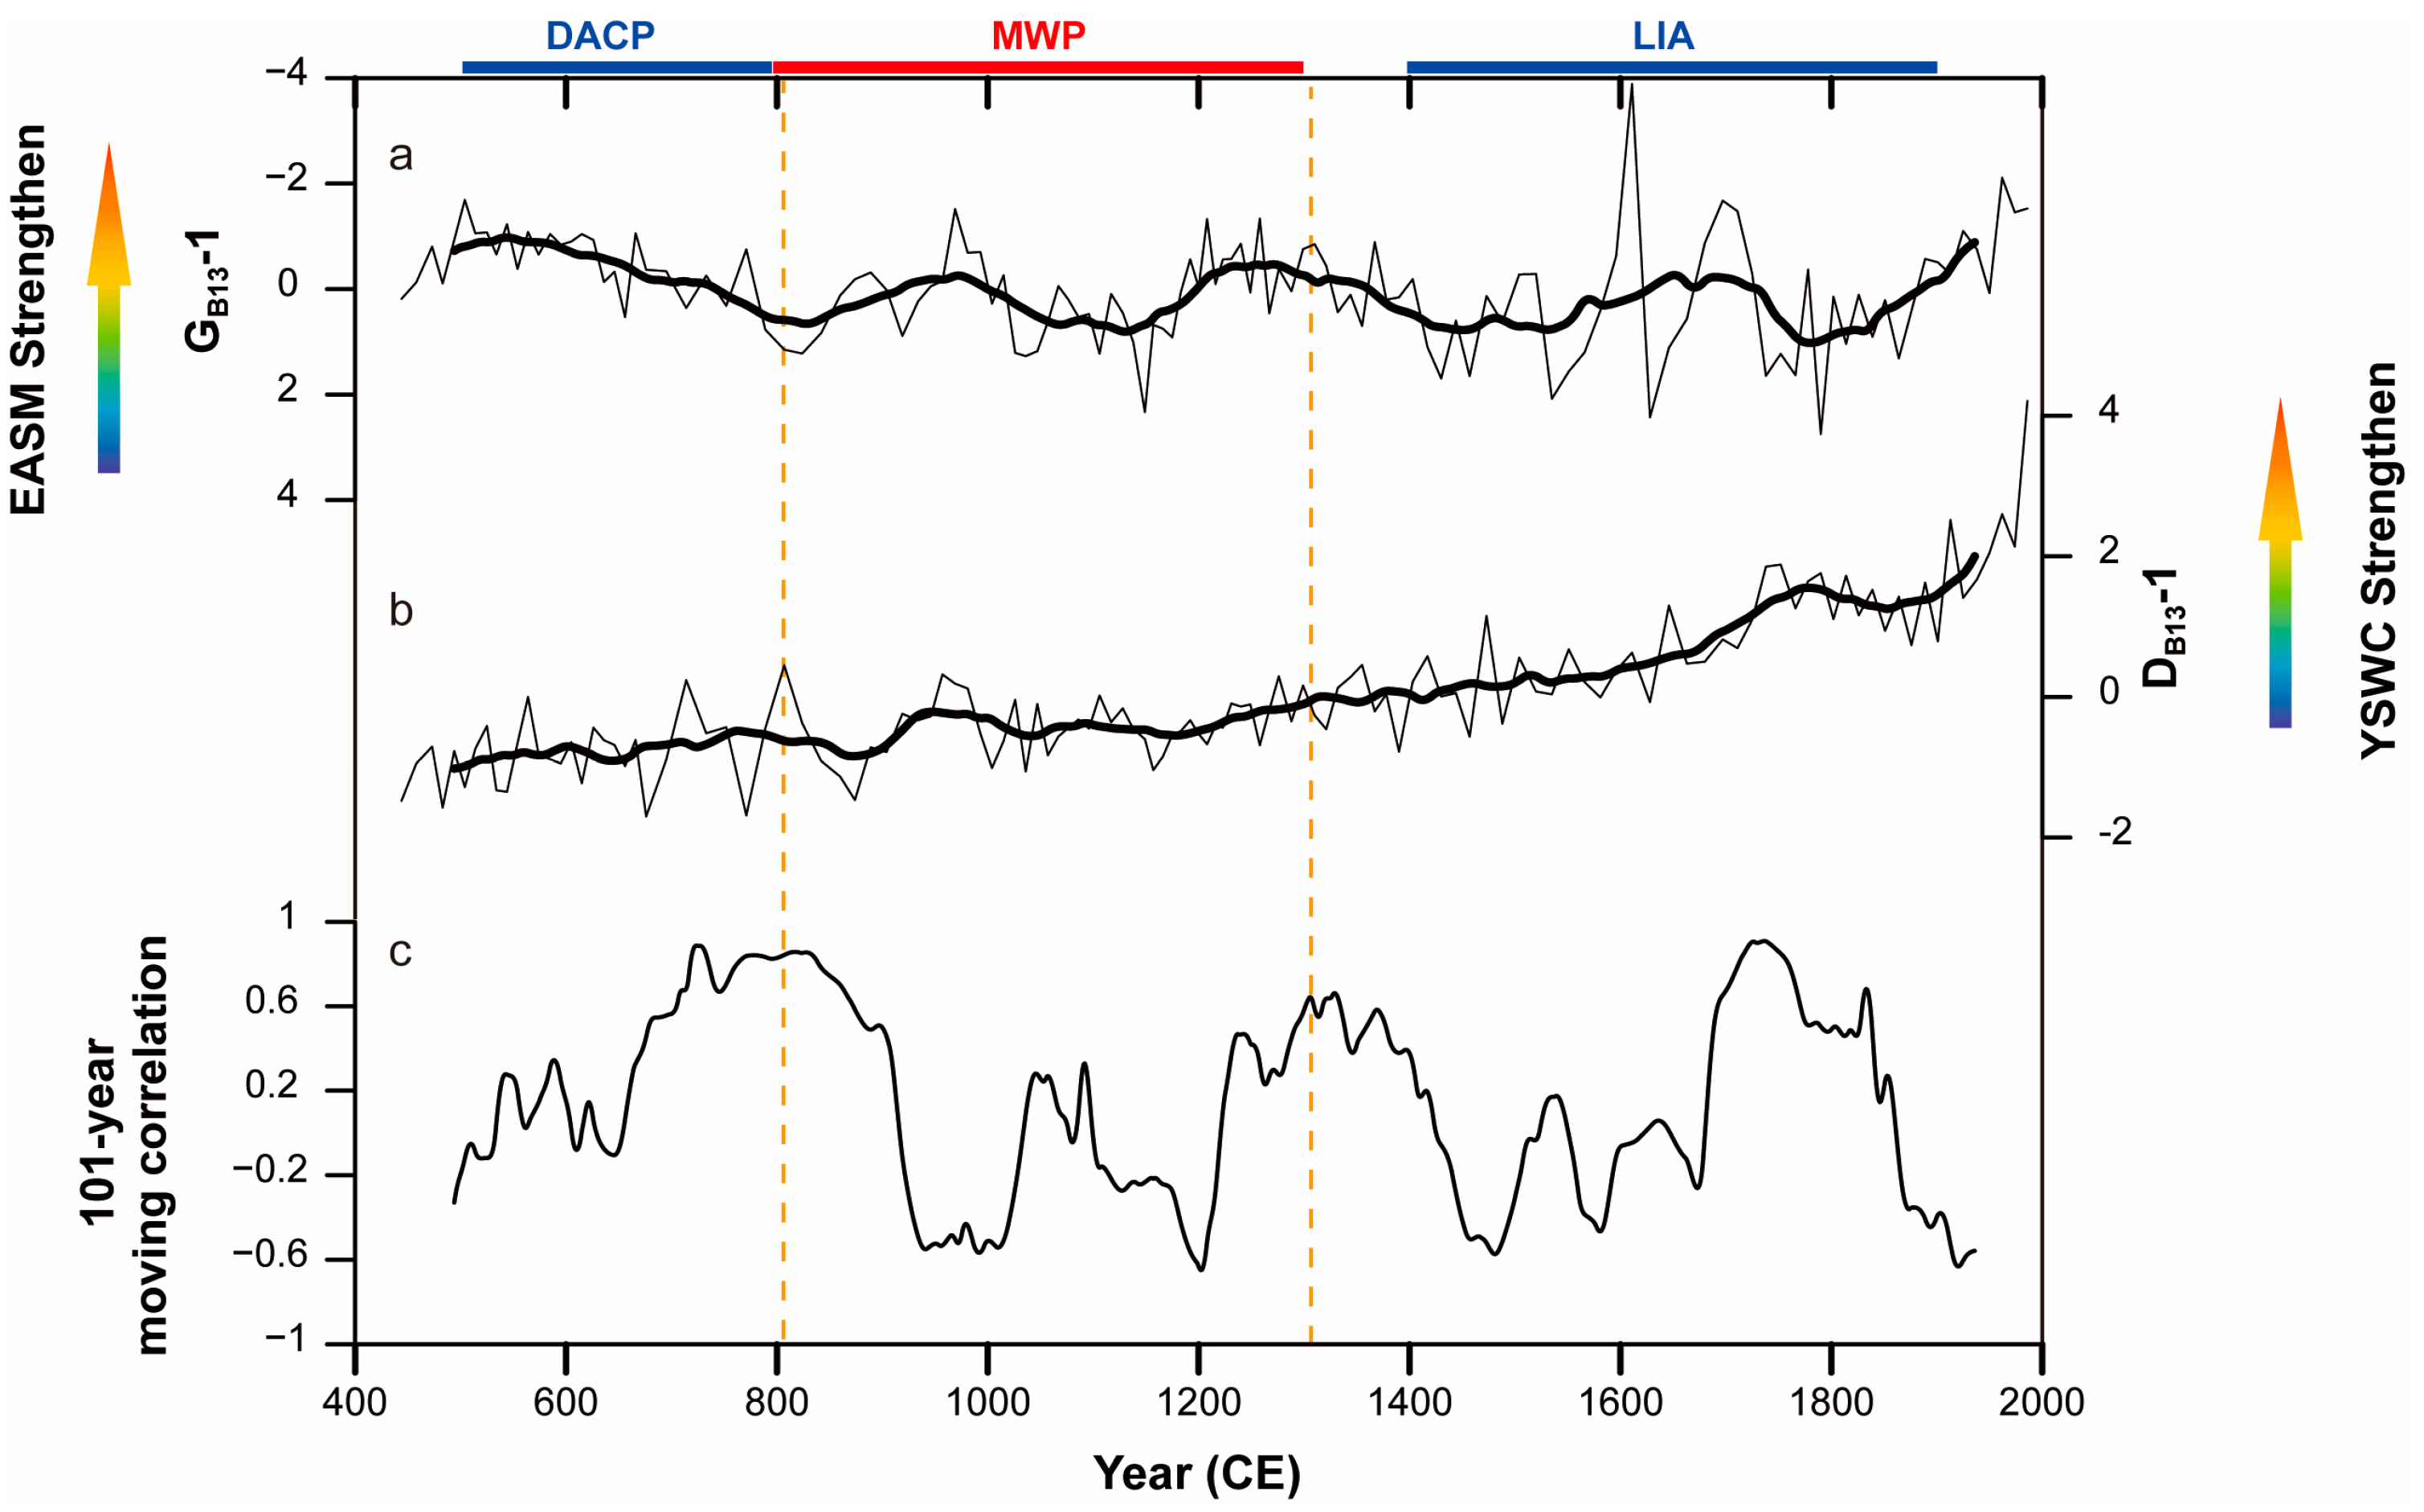
By analyzing data from Core B13, the variabilities of the EASM and YSWC over the past 1500 years have been reconstructed (Figure 8). Based on the trends and fluctuations, as well as changes in sedimentary environments, the strength of the EASM and YSWC during this time can be divided into three stages: (1) prior to 800 CE, corresponding to the DACP [51], where there was a slight weakening of the EASM and an enhancement with significant fluctuations in the YSWC; (2) during 800–1300 CE, associated with the MWP [52], characterized by gradual fluctuations in the EASM and relative stability in the YSWC; (3) after 1300 CE, slightly longer than the LIA [52], marked by an enhancement with significant fluctuations in both the EASM and YSWC.
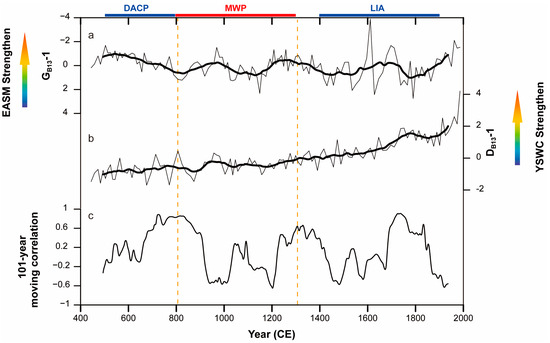
Figure 8.
Variations in the EASM (a) and YSWC (b) and the 101-year moving correlation between them (c). The black lines in (a) and (b) represent the 101-year moving average.
4.3. The Relationships between the EASM and YSWC
Moreover, the EASM and YSWC proxies extracted from the Core B13 sediments offer an opportunity to explore the relationship between them. In paleoclimate research, the moving correlation method is an effective analytical tool [37,53]. On a centennial timescale, the 101-year moving correlation window between the EASM and YSWC proxies was examined (Figure 8c). The analysis revealed that periods of negative correlation were significantly longer than those of positive correlation. Negative correlation stages were observed during 700–900 CE, 1250–1400 CE, and 1700–1900 CE, with positive correlation periods occurring during 900–1050 CE and 1450–1700 CE. Thus, it can be inferred that the negative correlation between the EASM and YSWC has been predominant over the past 1500 years.
5. Conclusions
By analyzing the characteristics of sediment grain size and color, the evolutionary history of the muddy area in the NYS over the past 1500 years has been restored. Proxies of the EASM and YSWC were extracted and used to reconstruct records since 1500 years ago. Furthermore, the relationship between the EASM and YSWC was investigated.
The sedimentary environment in the muddy area of the NYS remained relatively stable over the past 1500 years, showing three distinct stages. These stages included a period of stable and weak hydrodynamic conditions with fluctuations in the terrestrial input components between 440–800 CE, a period of relatively high hydrodynamic activity with enhanced transportation during 800–1300 CE, and pronounced changes in the terrestrial input components with significant fluctuations in hydrodynamic conditions from 1330–1990 CE.
The variations in the EASM and YSWC over the past 1500 years were reconstructed, revealing a predominantly positive correlation between them on a centennial timescale. The intensities of the EASM and YSWC during this period can be categorized into three stages, corresponding to the DACP, MWP, and LIA, respectively: (1) prior to 800 CE, there was a slight weakening of the EASM and an increase with notable fluctuations in the YSWC; (2) during 800–1300 CE, there were gradual fluctuations in the EASM and relatively stable conditions in the YSWC; (3) after 1300 CE, there was a significant increase with significant fluctuations in both the EASM and YSWC.
Supplementary Materials
The following supporting information can be downloaded at: https://www.mdpi.com/article/10.3390/atmos15080869/s1, Figure S1. Activity profiles for 210Pb (a) and age model (b) for core B60. Modified from Lyu et al. (2020) [29]; Table S1: Age-depth model of core B13. Extracted from Lyu et al. (2024) [30].
Author Contributions
Conceptualization, X.X.; methodology, W.L. and X.X.; formal analysis, W.L., G.C., T.F. and Y.W.; original draft preparation, W.L. and X.X.; review and editing, W.L., Q.S. and Z.C. All authors have read and agreed to the published version of the manuscript.
Funding
This research was supported by the Shandong Provincial Natural Science Foundation (ZR2023QD154) and the National Natural Science Foundation of China (42276226). We also thank the support of the “Observation and Research Station of Seawater Intrusion and Soil Salinization, Laizhou Bay, Ministry of Natural Resources” and the Fuyao Project, implemented by the Guangxi Zhuang Autonomous Region.
Data Availability Statement
The data that support the findings of this study are available by contacting the corresponding author.
Acknowledgments
The authors thank the captain and crew of the 2015 public cruise of R/V DONG FANG HONG ER HAO, organized by the National Natural Science Foundation of China.
Conflicts of Interest
The authors declare no conflicts of interest.
References
- Gai, C.; Liu, Q.; Roberts, A.P.; Chou, Y.; Zhao, X.; Jiang, Z.; Liu, J. East Asian monsoon evolution since the late Miocene from the South China Sea. Earth Planet. Sci. Lett. 2020, 530, 115960. [Google Scholar] [CrossRef]
- Li, W.; Li, X.; Mei, X.; Zhang, F.; Xu, J.; Liu, C.; Wei, C.; Liu, Q. A review of current and emerging approaches for Quaternary marine sediment dating. Sci. Total Environ. 2021, 780, 146522. [Google Scholar] [CrossRef]
- Cong, J.; Hu, G.; Jonell, T.N.; Zhang, Y.; Li, Y.; Bi, S. Source-to-sink and evolutionary processes of the East China Sea inner-shelf mud belt and its response to environmental changes since the Holocene: New evidence from the distal mud belt. Holocene 2021, 31, 1071–1088. [Google Scholar] [CrossRef]
- Gao, J.H.; Shi, Y.; Sheng, H.; Kettner, A.J.; Yang, Y.; Jia, J.J.; Wang, Y.P.; Li, J.; Chen, Y.; Zou, X.; et al. Rapid response of the Changjiang (Yangtze) River and East China Sea source-to-sink conveying system to human induced catchment perturbations. Mar. Geol. 2019, 414, 1–17. [Google Scholar] [CrossRef]
- Shi, Y.; Xu, X.; Yang, G.; Du, J.; Lv, J.; Zhang, S.; Liu, S.; Liu, T.; Zhang, Z.; Gao, S.; et al. High-Resolution Records of Millennial-Scale East Asian Winter Monsoon in the Shelf Sea of Eastern China. Geophys. Res. Lett. 2023, 50, e2022GL102302. [Google Scholar] [CrossRef]
- Yuan, P.; Wang, H.; Wu, X.; Bi, N. Grain-Size Distribution of Surface Sediments in the Bohai Sea and the Northern Yellow Sea: Sediment Supply and Hydrodynamics. J. Ocean Univ. China 2020, 19, 589–600. [Google Scholar] [CrossRef]
- Chen, X.; Li, T.; Zhang, X.; Li, R. A Holocene Yalu River-derived fine-grained deposit in the southeast coastal area of the Liaodong Peninsula. Chin. J. Oceanol. Limnol. 2013, 31, 636–647. [Google Scholar] [CrossRef]
- Qiu, J.; Liu, J.; Saito, Y.; Yang, Z.; Yue, B.; Wang, H.; Kong, X. Sedimentary evolution of the Holocene subaqueous clinoform off the southern Shandong Peninsula in the Western South Yellow Sea. J. Ocean Univ. China 2014, 13, 747–760. [Google Scholar] [CrossRef]
- Yang, Z.S.; Liu, J.P. A unique Yellow River-derived distal subaqueous delta in the Yellow Sea. Mar. Geol. 2007, 240, 169–176. [Google Scholar] [CrossRef]
- Bi, N.; Yang, Z.; Wang, H.; Fan, D.; Sun, X.; Lei, K. Seasonal variation of suspended-sediment transport through the southern Bohai Strait. Estuar. Coast. Shelf Sci. 2011, 93, 239–247. [Google Scholar] [CrossRef]
- Liu, J.P.; Milliman, J.D.; Gao, S.; Cheng, P. Holocene development of the Yellow River’s subaqueous delta, North Yellow Sea. Mar. Geol. 2004, 209, 45–67. [Google Scholar] [CrossRef]
- Sagawa, T.; Kuwae, M.; Tsuruoka, K.; Nakamura, Y.; Ikehara, M.; Murayama, M. Solar forcing of centennial-scale east Asian winter monsoon variability in the mid- to late Holocene. Earth Planet. Sci. Lett. 2014, 395, 124–135. [Google Scholar] [CrossRef]
- Wang, L.; Li, G.; Wang, L.; Zhang, W.; Zhang, Y.; Liu, Y.; Wang, X.; Wang, H. In-phase and out-of-phase behavior of the East Asian summer and winter monsoons recorded in the South Yellow Sea sediment over the past 9.5 ka. Quat. Res. 2021, 99, 96–113. [Google Scholar] [CrossRef]
- Cheng, H.; Zhang, H.; Zhao, J.; Li, H.; Ning, Y.; Kathayat, G. Chinese stalagmite paleoclimate researches: A review and perspective. Sci. China Earth Sci. 2019, 62, 1489–1513. [Google Scholar] [CrossRef]
- Gebregiorgis, D.; Clemens, S.; Hathorne, E.; Giosan, L.; Thirumalai, K.; Frank, M. A Brief Commentary on the Interpretation of Chinese Speleothem δ18O Records as Summer Monsoon Intensity Tracers. Quaternary 2020, 3, 7. [Google Scholar] [CrossRef]
- Li, Y.; Morrill, C. A Holocene East Asian winter monsoon record at the southern edge of the Gobi Desert and its comparison with a transient simulation. Clim. Dyn. 2015, 45, 1219–1234. [Google Scholar] [CrossRef]
- Yancheva, G.; Nowaczyk, N.R.; Mingram, J.; Dulski, P.; Schettler, G.; Negendank, J.F.W.; Liu, J.; Sigman, D.M.; Peterson, L.C.; Haug, G.H. Influence of the intertropical convergence zone on the East Asian monsoon. Nature 2007, 445, 74–77. [Google Scholar] [CrossRef] [PubMed]
- Beck, J.W.; Zhou, W.; Li, C.; Wu, Z.; White, L.; Xian, F.; Kong, X.; An, Z. A 550,000-year record of East Asian monsoon rainfall from 10Be in loess. Science 2018, 360, 877–881. [Google Scholar] [CrossRef] [PubMed]
- Hu, B.; Yang, Z.; Zhao, M.; Saito, Y.; Fan, D.; Wang, L. Grain size records reveal variability of the East Asian Winter Monsoon since the Middle Holocene in the Central Yellow Sea mud area, China. Sci. China Earth Sci. 2012, 55, 1656–1668. [Google Scholar] [CrossRef]
- Liu, G.; Han, X.; Chen, Y.; Li, J.; Song, L.; Zhou, X.; Hu, B.; Yi, L. Early-Holocene Paleo-Tropical Cyclone Activity Inferred from a Sedimentary Sequence in South Yellow Sea, East Asia. J. Earth Sci. 2022, 33, 789–801. [Google Scholar] [CrossRef]
- Yang, J.; Li, G.; Liu, Y.; Dada, O.A.; Zhao, M.; Ma, Y.; Wen, L. Evolution of Sedimentary Mode Since Pleistocene in the Central South Yellow Sea, China, Based on Seismic Stratigraphy Analysis; Elsevier Ltd.: Amsterdam, The Netherlands, 2018; Volume 482, pp. 157–170. [Google Scholar]
- Zhang, M.; Liu, X.; Xu, F.; Li, A.; Gu, Y.; Chang, X.; Zhuang, G.; Zhang, K.; Bi, N.; Wang, H. Organic Carbon Deposition on the Inner Shelf of the East China Sea Constrained by Sea Level and Climatic Changes Since the Last Deglaciation. J. Ocean Univ. China 2023, 22, 1300–1312. [Google Scholar] [CrossRef]
- Shan, X.; Shi, X.; Clift, P.D.; Qiao, S.; Jin, L.; Liu, J.; Fang, X.; Xu, T.; Li, S.; Kandasamy, S.; et al. Carbon isotope and rare earth element composition of Late Quaternary sediment gravity flow deposits on the mid shelf of East China Sea: Implications for provenance and origin of hybrid event beds. Sedimentology 2019, 66, 1861–1895. [Google Scholar] [CrossRef]
- Li, D.W.; Yu, M.; Jia, Y.; Steinke, S.; Li, L.; Xiang, R.; Zhao, M. Gradually Cooling of the Yellow Sea Warm Current Driven by Tropical Pacific Subsurface Water Temperature Changes Over the Past 5 kyr. Geophys. Res. Lett. 2021, 48, e2021GL093534. [Google Scholar] [CrossRef]
- Mei, X.; Li, R.; Zhang, X.; Liu, Q.; Liu, J.; Wang, Z.; Lan, X.; Liu, J.; Sun, R. Evolution of the Yellow Sea Warm Current and the Yellow Sea Cold Water Mass since the Middle Pleistocene. Palaeogeogr. Palaeoclimatol. Palaeoecol. 2016, 442, 48–60. [Google Scholar] [CrossRef]
- He, Y.; Zhou, X.; Liu, Y.; Yang, W.; Kong, D.; Sun, L.; Liu, Z. Weakened Yellow Sea Warm Current over the last 2–3 centuries. Quat. Int. 2014, 349, 252–256. [Google Scholar] [CrossRef]
- Zhang, Y.; Zhou, X.; He, Y.; Jiang, Y.; Liu, Y.; Xie, Z.; Sun, L.; Liu, Z. Persistent intensification of the Kuroshio Current during late Holocene cool intervals. Earth Planet. Sci. Lett. 2019, 506, 15–22. [Google Scholar] [CrossRef]
- Zhang, P.; Cheng, H.; Edwards, R.L.; Chen, F.; Wang, Y.; Yang, X.; Liu, J.; Tan, M.; Wang, X.; Liu, J.; et al. A test of climate, sun, and culture relationships from an 1810-year Chinese cave record. Science 2008, 322, 940–942. [Google Scholar] [CrossRef]
- Lyu, W.; Yang, J.; Fu, T.; Chen, Y.; Hu, Z.; Tang, Y.Z.; Lan, J.; Chen, G.; Su, Q.; Xu, X.; et al. Asian monsoon and oceanic circulation paced sedimentary evolution over the past 1500 years in the central mud area of the Bohai Sea, China. Geol. J. 2020, 55, 5606–5618. [Google Scholar] [CrossRef]
- Lyu, W.; Fu, T.; Cui, Z.; Wang, Y.; Liu, W.; Xu, X.; Yu, H. TC activity affected the northern sea of the Shandong Peninsula over the past 1500 years and its driving mechanism. Mar. Geol. 2024, 474, 107311. [Google Scholar] [CrossRef]
- Yi, L.; Chen, S.; Ortiz, J.D.; Chen, G.; Peng, J.; Liu, F.; Chen, Y.; Deng, C. 1500-year cycle dominated Holocene dynamics of the Yellow River delta, China. Holocene 2016, 26, 222–234. [Google Scholar] [CrossRef]
- Li, Y.; Chen, Y.; Jiang, X.; Yi, L. Color Reflectance of Coastal Sediments in the South Bohai Sea and its Implication to Orbital Forcing of East Asian Summer Monsoon. Front. Earth Sci. 2021, 9, 760216. [Google Scholar] [CrossRef]
- McManus, J. Grain size determination and interpretation. Tech. Sedimentol. 1988, 63–85. [Google Scholar]
- Passega, R. Grain size representation by CM patterns as a geologic tool. J. Sediment. Res. 1964, 34, 930–947. [Google Scholar] [CrossRef]
- Passega, R. Texture as characteristic of clastic deposition. AAPG Bull. 1957, 41, 1952–1984. [Google Scholar]
- Lyu, W.; Fu, T.; Chen, G.; Su, Q.; Liu, W.; Wang, Y.; Cui, Z.; Yu, H.; Xu, X. Sedimentary evolution of the East China Sea with implications for the relationship between the East Asian winter and summer monsoon over the past 6.3 ka. J. Asian Earth Sci. 2024, 270, 106217. [Google Scholar] [CrossRef]
- Lyu, W.; Fu, T.; Hu, Z.; Tang, Y.Z.; Chen, G.; Xu, X.; Chen, Y.; Chen, S. Sedimentary Dynamics of the Central South Yellow Sea Revealing the Relation Between East Asian Summer and Winter Monsoon Over the Past 6000 years. Front. Earth Sci. 2021, 9, 689508. [Google Scholar] [CrossRef]
- Zhao, N.; Xu, X.; Yu, H.; Yao, J.; Su, Q.; Peng, S. The color reflectance of marine-terrigenous deposits in LZ908 borehole in south coastal plain of the Laizhou Bay. Acta Oceanol. Sin. 2011, 30, 53–59. [Google Scholar] [CrossRef]
- Ortiz, J.D.; Polyak, L.; Grebmeier, J.M.; Darby, D.; Eberl, D.D.; Naidu, S.; Nof, D. Provenance of Holocene sediment on the Chukchi-Alaskan margin based on combined diffuse spectral reflectance and quantitative X-Ray Diffraction analysis. Glob. Planet. Chang. 2009, 68, 73–84. [Google Scholar] [CrossRef]
- Ortiz, J.D.; O’Connell, S.B.; DelViscio, J.; Dean, W.; Carriquiry, J.D.; Marchitto, T.; Zheng, Y.; Van Geen, A. Enhanced marine productivity off western North America during warm climate intervals of the past 52 ky. Geology 2004, 32, 521–524. [Google Scholar] [CrossRef]
- Xu, F.; Hu, B.; Dou, Y.; Liu, X.; Wan, S.; Xu, Z.; Tian, X.; Liu, Z.; Yin, X.; Li, A. Sediment provenance and paleoenvironmental changes in the northwestern shelf mud area of the South China Sea since the mid-Holocene. Cont. Shelf Res. 2017, 144, 21–30. [Google Scholar] [CrossRef]
- Liu, S.M.; Hong, G.H.; Zhang, J.; Ye, X.W.; Jiang, X.L. Nutrient budgets for large Chinese estuaries. Biogeosciences 2009, 6, 2245–2263. [Google Scholar] [CrossRef]
- Yang, Z.; Ji, Y.; Bi, N.; Lei, K.; Wang, H. Sediment transport off the Huanghe (Yellow River) delta and in the adjacent Bohai Sea in winter and seasonal comparison. Estuar. Coast. Shelf Sci. 2011, 93, 173–181. [Google Scholar] [CrossRef]
- Yi, L.; Yu, H.; Ortiz, J.D.; Xu, X.; Chen, S.; Ge, J.; Hao, Q.; Yao, J.; Shi, X.; Peng, S. Late Quaternary linkage of sedimentary records to three astronomical rhythms and the Asian monsoon, inferred from a coastal borehole in the south Bohai Sea, China. Palaeogeogr. Palaeoclimatol. Palaeoecol. 2012, 329–330, 101–117. [Google Scholar] [CrossRef]
- Eisma, D.; Ji, Z.; Chen, S.; Chen, M.; Gaast, S. Clay mineral composition of recent sediments along the China coast, in the Yellow Sea and the East China Sea. Nioz Rapp. 1995, 7, 703–710. [Google Scholar]
- Fang, J.; Liu, Z.; Zhao, Y. High-resolution clay mineral assemblages in the inner shelf mud wedge of the East China Sea during the Holocene: Implications for the East Asian Monsoon evolution. Sci. China Earth Sci. 2018, 61, 1316–1329. [Google Scholar] [CrossRef]
- Klein, C.; Hurlbut, C.S.; Dana, J.D. Manual of Mineralogy; Wiley: New York, NY, USA, 1993; Volume 527. [Google Scholar]
- Liu, X.; Li, A.; Dong, J.; Lu, J.; Huang, J.; Wan, S. Provenance discrimination of sediments in the Zhejiang-Fujian mud belt, East China Sea: Implications for the development of the mud depocenter. J. Asian Earth Sci. 2018, 151, 1–15. [Google Scholar] [CrossRef]
- Tan, L.; Cai, Y.; An, Z.; Zhang, H.; Qin, S. Climate patterns in North central China during the last 1800 yr and its possible driving force. Clim. Past 2011, 7, 1029–1048. [Google Scholar]
- Xu, J.; Shi, X.; Liu, S.; Liu, J.; Shan, X.; Dong, Z. High-resolution sedimentary record of East Asian Monsoon during late Holocene: Evidence from the Inner Shelf Mud Area of East China Sea. Adv. Mar. Sci. 2018, 36, 216–228. [Google Scholar]
- Lamb, H.H. The early medieval warm epoch and its sequel. Palaeogeogr. Palaeoclimatol. Palaeoecol. 1965, 1, 13–37. [Google Scholar] [CrossRef]
- Mann, M.E.; Zhang, Z.; Rutherford, S.; Bradley, R.S.; Hughes, M.K.; Shindell, D.; Ammann, C.; Faluvegi, G.; Ni, F. Global signatures and dynamical origins of the Little Ice Age and Medieval Climate Anomaly. Science 2009, 326, 1256–1260. [Google Scholar] [CrossRef]
- Kang, S.; Wang, X.; Roberts, H.M.; Duller, G.A.T.; Cheng, P.; Lu, Y.; An, Z. Late Holocene anti-phase change in the East Asian summer and winter monsoons. Quat. Sci. Rev. 2018, 188, 28–36. [Google Scholar] [CrossRef]


Disclaimer/Publisher’s Note: The statements, opinions and data contained in all publications are solely those of the individual author(s) and contributor(s) and not of MDPI and/or the editor(s). MDPI and/or the editor(s) disclaim responsibility for any injury to people or property resulting from any ideas, methods, instructions or products referred to in the content. |
© 2024 by the authors. Licensee MDPI, Basel, Switzerland. This article is an open access article distributed under the terms and conditions of the Creative Commons Attribution (CC BY) license (https://creativecommons.org/licenses/by/4.0/).