Abstract
Wire icing events pose a significant threat to the southern power grid’s transmission lines in China. Fifteen such events were identified from 2018 to 2020 on the Guilin-Haiyang Mountain transmission line. Hourly measurements of ice thickness and concurrent meteorological data were analyzed using the Makkonen model’s freezing rate formula to categorize the events into distinct growth patterns: dry and wet. The relationship between wire icing and meteorological factors across different micro-topography (windward slope, leeward slope, and pass) was further explored. Several key conclusions can be drawn. First, the altitude is positively correlated to the icing thickness, but relatively independent of the icing rate; however, such independence between the icing rate and altitude cannot be interpreted by the negative correlation of altitude with temperature and the positive relationship between wind speed and liquid water content. Second, a pronounced connection of the icing rate with meteorological factors is not shown until the wet and dry patterns are separated. Notably, the correlations differ between these two patterns, with icing rate being negatively correlated with temperature for the wet growth process, but positively correlated with wind speed and liquid water content for the dry growth process. Third, both wet and dry growth processes exist across the icing events. A shift from wet to dry growth was evident with increasing altitude. At the mountain’s base, wet growth predominates, with the icing rate determined by the temperature close to the freezing point, whereas the higher temperature and lower liquid water flux account for the shorter wire icing duration, lower icing rate, and thus the thinner icing thickness at the leeward slope compared to the windward slope at a similar altitude. This study sheds light on the variations in icing rates under different micro-topographies and the underlying physical mechanisms governing icing growth patterns and provides a much-needed understanding of these distinct growth processes on the development of a more sophisticated predictive model for conductor icing.
1. Introduction
Electricity serves as a pivotal force that underpins the rapid and robust growth of a nation’s economy. However, wire icing events pose a significant threat to the power grids during winter, as freezing rain, fog, or wet snow adhered to the power lines would lead to a cascade of failures including tower collapse, conductor breakage, insulator flashover, and communication disruptions [1]. In China, wire icing is recognized as one of the most destructive meteorological hazards to the southern power grid’s transmission lines [2,3]. Compared to flat plain areas, mountainous regions are more susceptible to wire icing disasters due to high altitudes, low temperatures, and abundant water vapor [4,5]. Furthermore, complex micro-topography in these mountainous areas, such as windward and leeward slopes and mountain passes profoundly influence the spatial distribution of meteorological elements, such as ground temperature, wind speed, and liquid water content. These factors, in turn, affect the rate and extent of wire icing formation [6,7,8]. Therefore, conducting synchronized meteorological observations of wire icing thickness and icing rate on conductors within complex mountainous terrain holds significant scientific merit. Meanwhile, investigating the physical mechanisms by which meteorological elements influence the thickness and growth rate of wire icing can contribute to the development of refined forecast models to enhance the predictive capabilities of wire icing events in mountainous regions [9,10].
Extensive research on wire icing in mountainous terrain has established a relationship between icing severity and altitude, showing that wire icing thickness or rate increases either exponentially [11,12,13] or linearly [14] with altitude; however, such trends are limited to a specific altitudinal range for mountain areas [15]. For example, in German mountains, wire icing events are most frequent between 500 m and 1500 m above sea level, with significantly lower occurrences below 500 m or exceeding 1500 m [16]. Micro-topography also plays a significant role in the distribution of wire icing: areas experiencing the highest icing thickness are typically hilltops and windward slopes, while the fastest icing rates are predominantly observed in passes, followed by windward slopes [17]. A more granular statistical analysis of the spatial distribution of wire icing has been provided by a decade-long observational study in China, identifying a descending order in terms of the susceptibility to wire icing followed by passes, upper windward slopes, the hillsides of windward slopes, upper leeward slopes, the hillsides of leeward slopes, and lastly, leeward foothills [18].
Statistical analyses of observed icing thickness and growth rate offer valuable insights but fail to elucidate the underlying physical mechanisms. For instance, despite the exponential or linear increase in icing thickness with altitude [13,14], as well as the relationship between icing rate and temperature, wind speed, and liquid water content [19], the interplay between altitude and these critical meteorological elements remains poorly understood, further complicated by the intricate micro-topography of mountainous terrain. Besides, an additional layer of complexity arises from the varying growth processes of wire icing. Freezing rain promotes wet growth, while freezing fog fosters dry growth, leading to distinct growth rates and sensitivities to different meteorological factors [20,21]. Unfortunately, during real-world icing events, quantifying the relative contributions of freezing rain and freezing fog remains significantly challenging. This highlights the urgent need for a quantitative method capable of differentiating and quantifying these wet and dry growth processes.
This work attempts to address those challenges by differentiating wire icing growth processes into wet and dry categories by the application of the Makkonen model to calculate freezing rate, and analyzing the relationships between icing growth and meteorological factors across various micro-topographic features (windward slopes, leeward slopes, passes, hillsides, and foothills) based on hourly measurements of power line ice thickness and concurrent meteorological data collected from 2-year (2008~2020) measurements at the towers along the Guilin-Haiyang Mountain transmission line in China. Ultimately, this research seeks to elucidate the physical mechanisms governing icing growth over these distinct micro-topographical regions.
2. Study Area, Data and Methodology
2.1. Study Area and Data Sources
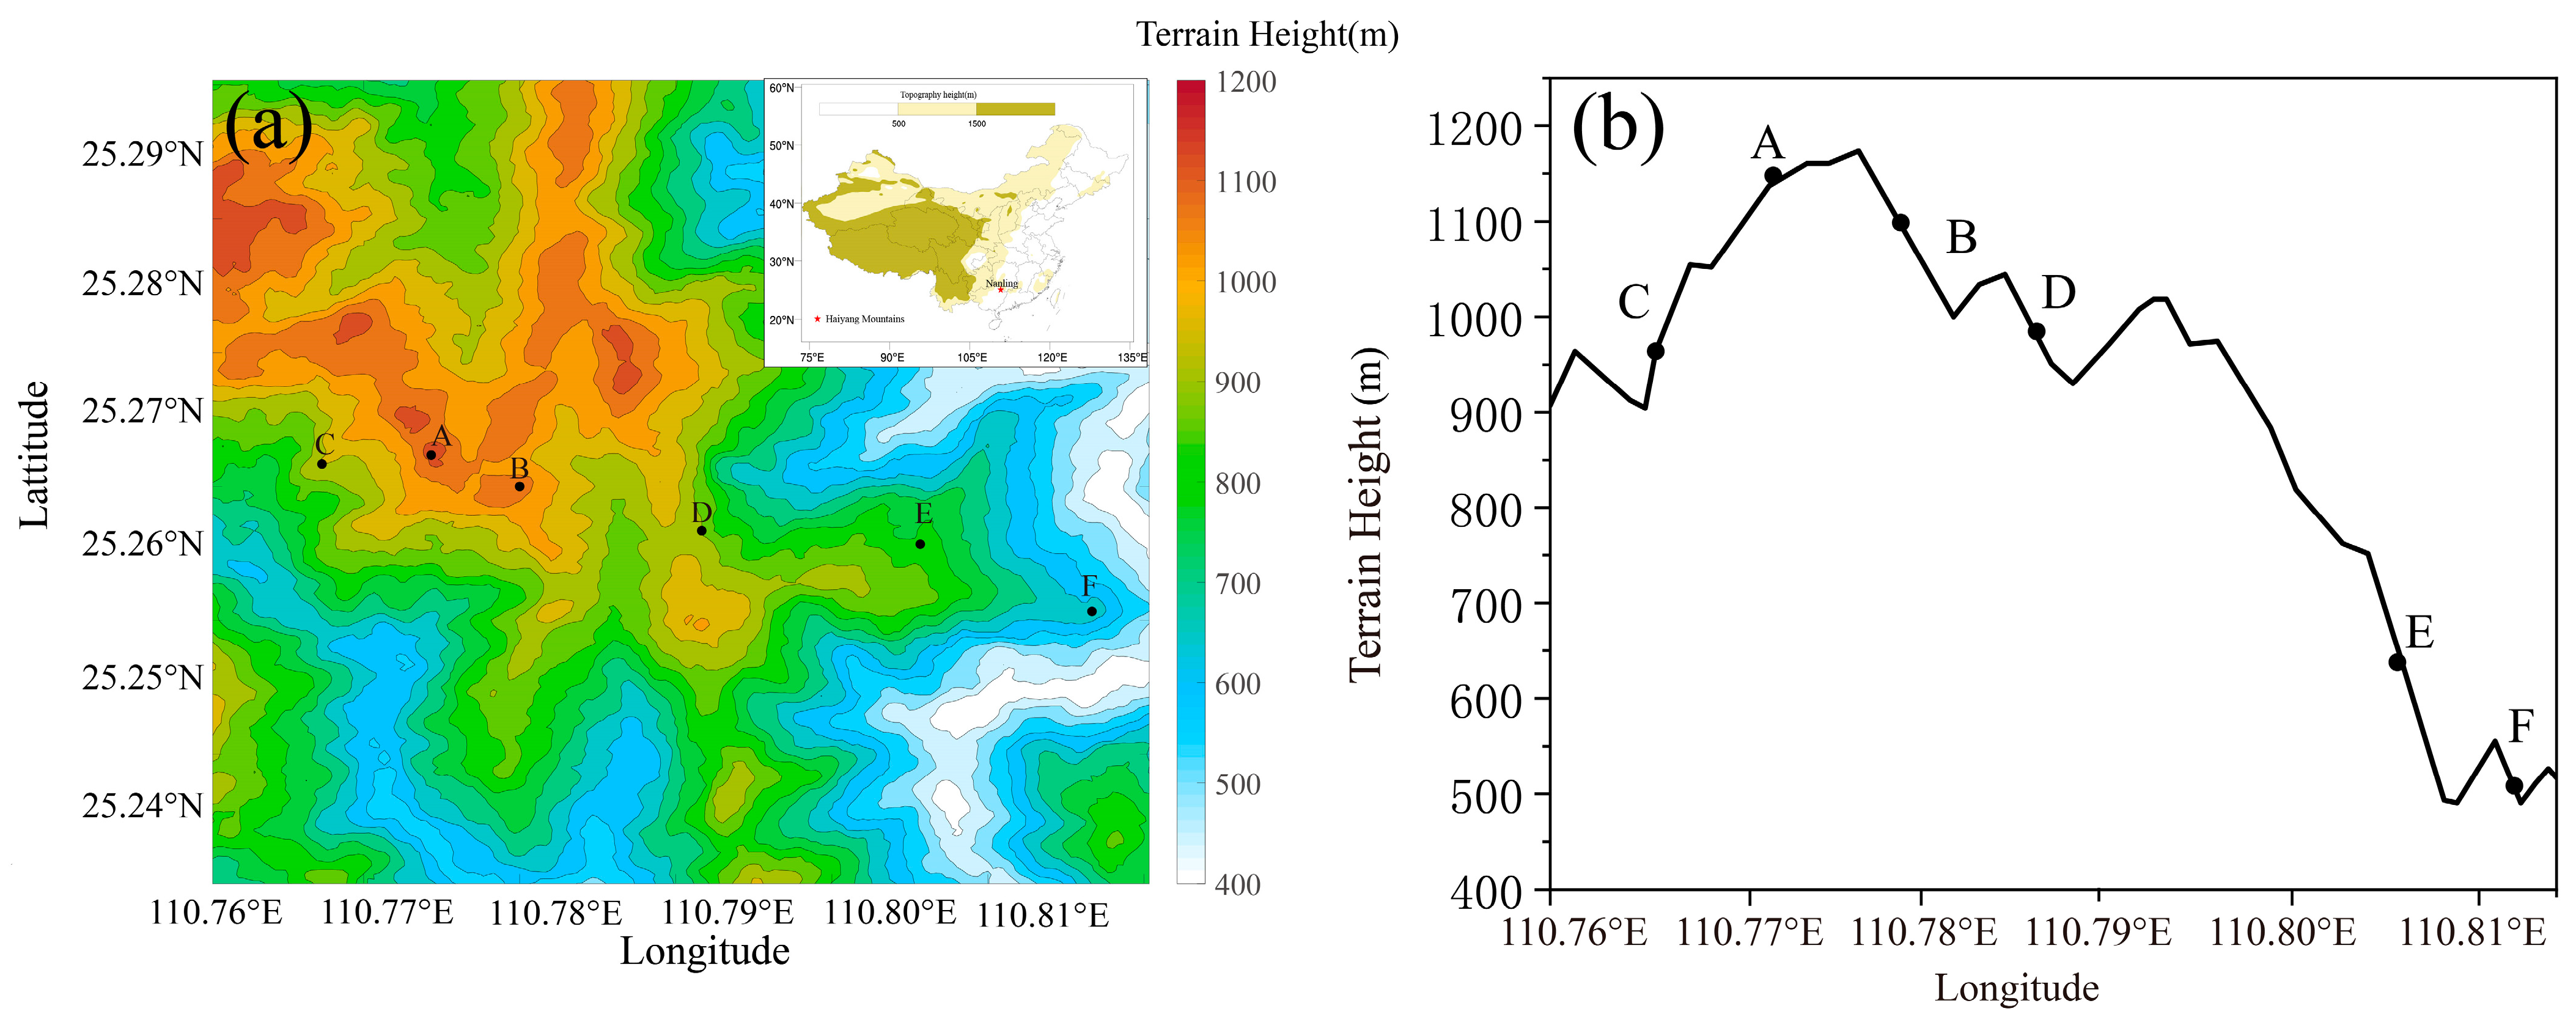
The study area is situated within the Guilin-Haiyang Mountains (Figure 1a, ☆) of the Guangxi Province, China, and located in the southwestern part of the Nanling Mountain Range that runs east to west, with the elevation ranging from 400 m to 1200 m. The study area is characterized by a subtropical climate, notable for its moderate temperature and abundant rainfall (~1900 mm per year). During the winter season, the incursion of cold air masses from the north is impeded by the Nanling Mountains; such a topographical barrier frequently results in the formation of a quasi-stationary front, known as the Nanling front, that is responsible for the prevalence of freezing rain events occurring in its northern part and the study area. In the Guilin-Haiyang mountainous area, six observation towers are deployed across a 5.4 km × 5.4 km mountainous region, with their specific locations detailed in Figure 1a. In Figure 1b, Tower A and B are at the leeward slope near the hilltop and the windward slope, respectively. Tower A is 1147 m above sea level, which is slightly higher than that of Tower B (1120 m); Tower C sits on the upper leeward slope at 988 m; Tower D is 971 m located at the pass on the windward slope hillside, and the highest elevations of the mountains on both sides of the pass are 1120 m and 1020 m, respectively; Towers E and F are located at the bottom of the windward slope with altitudes of 695 m and 467 m, respectively. The transmission line traverses the intersection zone of a northerly cold air channel and a southerly warm, humid air channel. This confluence facilitates the formation of freezing rain during southward cold air intrusions.

Figure 1.
The location of monitoring towers (a) and their altitude distribution (b) across the study area. The letters of A–F denote different towers.
Wire icing thickness data were obtained from the southern power grid’s transmission line icing monitoring system, estimated by the pulling force method, with a relative error within 5% [22]. All data underwent quality control procedures. Hourly meteorological measurements of the temperature, relative humidity, wind speed, precipitation, and dew point temperature were collected from the six observation towers. The observation period spanned from 1 January 2018 to 31 December 2020.
2.2. Methodology
2.2.1. Makkonen Icing Growth Modeling
This study employs a wire icing growth rate model that incorporates both the collision rate and freezing rate of supercooled droplets impinging on the conductor surface [19], given by
where M and t are for the mass of icing and time, respectively, with the dM/dt denoting the growth rate of ice accretion on the conductor. The wind speed is denoted by v, and w represents the liquid water content. S signifies the effective cross-sectional area of the ice accretion. a1, a2 and a3 are for the collision rate, capture rate and freezing rate, respectively.
The collision rate a1 is defined as
where the empirical coefficients A, B, and C are respectively given by [23]:
with K and being two dimensionless parameters estimated by
where ρw is the density of water set as 1000 kg·m−3; MVD denotes the median volume diameter of cloud droplets; μ is the air absolute viscosity set as 1.7984 × 10⁻⁵ kg·m−1·s−1; D is the diameter of the wire. Re is the Reynolds number, defined as
where ρa represents the density of air.
The Reynolds number is only used to determine the flow state of the droplets. Since μ is fixed and the variation of ρa is small, the Reynolds number depends mainly on the relative velocity of the particles (wind speed) and the particle size of the droplets associated with the liquid water content. Thus, the Reynolds number is roughly similar to the liquid-water flux defined in this paper.
When wire icing occurs, the capture rate a2 is constant at 1 and the freezing rate a3 is estimated by
where F is the water flux density on the ice surface estimated by F = a1a2wv, λ is the liquid fraction of the accretion, h denotes the convective heat exchange coefficient, σ and a are the Stephen Boltzmann constant and radiation constant, with the value of 5.6696 × 10⁻⁸ W·m−2·k−4 and 8.1 × 10⁷ K3, respectively. ε is for the molar molecular ratio of the water vapor set as 0.62, and r is the coefficient of the local recovery of wire surface, set as 0.79. P represents the air pressure. ts, ta, td are the temperature of the ice surface, air, and liquid droplet collision, respectively; ea and es stand for the water vapor pressure and saturated water vapor pressure, respectively. Le and Lf denote the latent heat of evaporation and freezing at 0 °C, respectively. Cp are Cw for the specific heat of air and water, respectively.
As the Makkonen icing growth model suggested, wet and dry growth is determined by a3. The a3 < 1 condition denotes the wet growth process, where the supercooled droplets are only partially frozen on the conductor [24]; however, when a3 = 1, the supercooled droplets are completely frozen and attached to the conductor [25], known as the dry growth process. The wet and dry growth roughly corresponds to the icing growth in glaze and rime, with differences in the icing growth rates due to the distinction in their ice densities [24,25,26]. However, despite the theoretical values in a3 for dry growth process, it usually exceeds 1 in practical estimation due to the complexity of Equation (9) as well as the observational bias. To address this practical challenge, this study adopts a threshold of a3 ≥ 1 to classify dry growth processes, following earlier research [26,27]. Applying this criterion to data from the six towers yielded 724 samples with a3 ≥ 1. Among these, 697 samples fell within a narrow range of 1.00 to 1.05, and the remaining 27 samples had a3 values below 1.1. Similarly, the wet growth classification (a3 < 1) identified 522 data samples, with 19 samples falling within the 0.50 to 0.99 range and 503 samples primarily concentrating between 0.2 and 0.3. Although such a classification approach may not achieve perfect theoretical alignment, it roughly offers a pragmatic method for quantifying wet and dry growth processes by using the freezing rate derived from the Makkonen model in real-world wire icing scenarios. Therefore, this study simplifies the analysis by setting a3 = 1 for all cases where the calculated value exceeds 1.
2.2.2. Methods for Extrapolating Liquid Water Content at Different Altitudes
As the direct measurement of liquid water content (LWC) is not feasible, this study employed the estimation method proposed by Drage et al. (2012) to estimate the liquid water content (LWC) given by,
where e and P are the water vapor pressure and air pressure, respectively. ρd stands for the density of dry air. = 0.62. The subscripts 1 and 2 represent the two different monitoring points. The formula assumes two distinct measurement points: point 1 located below the cloud base in the unsaturated zone and point 2 located above the cloud base in the supersaturated zone. The Guanyang meteorological station (28 km from the mountain foot) serves as point 1. The liquid water content (LWC) is then calculated independently for each point at its respective altitude.
3. Results
3.1. General Description of Wire Icing Events
A total of 15 wire icing events were monitored in the study area between January 2018 and March 2020. These events were distributed across three years: eight in 2018 (occurring on 4–6, 7–9, 25–27, 27–30 January; 8–10, 11–13, 28–29, and 30–31 December), five in 2019 (1–2, 8–9, 16–17 January; 10–11 and 17 February), and two in 2020 (16–17 and 25–27 January). All 15 events shared a similar background that cold air originating from the north interacted with warm and humid air from the south near the Nanling Mountains within the study area, leading to the formation of a quasi-stationary frontal system, which fostered conditions conducive to freezing weather across southern China. To investigate the potential influence of topography on wind patterns during wire icing events, the average wind direction at each monitoring tower (A, B, C, D, E, and F) was analyzed. Towers B, D, E, and F primarily experienced northeasterly winds (12 occurrences); easterly and northerly winds were observed twice and once, respectively, during these events. Conversely, Tower C predominantly experienced southwesterly winds (13 occurrences), with occasional southerly and northeasterly winds observed once each. Notably, Tower A exhibited more complex wind patterns, with dominating southwesterly winds (8 occurrences), followed by northeasterly winds (5 occurrences), and both southerly and easterly winds occurred once each. These wind statistics support the conclusions drawn from Figure 1 regarding the topographical positioning of the monitoring towers. Towers B, D, E, and F situated on the windward slopes are characterized by frequent northeasterly winds. Conversely, Tower C is located on the leeward slope with prevailing southwesterly winds. Finally, the varied wind directions observed at Tower A are consistent with its placement near the hilltop.
3.2. Wire Icing Thickness and Growth Rate as a Function of Altitude under Different Micro Topographies
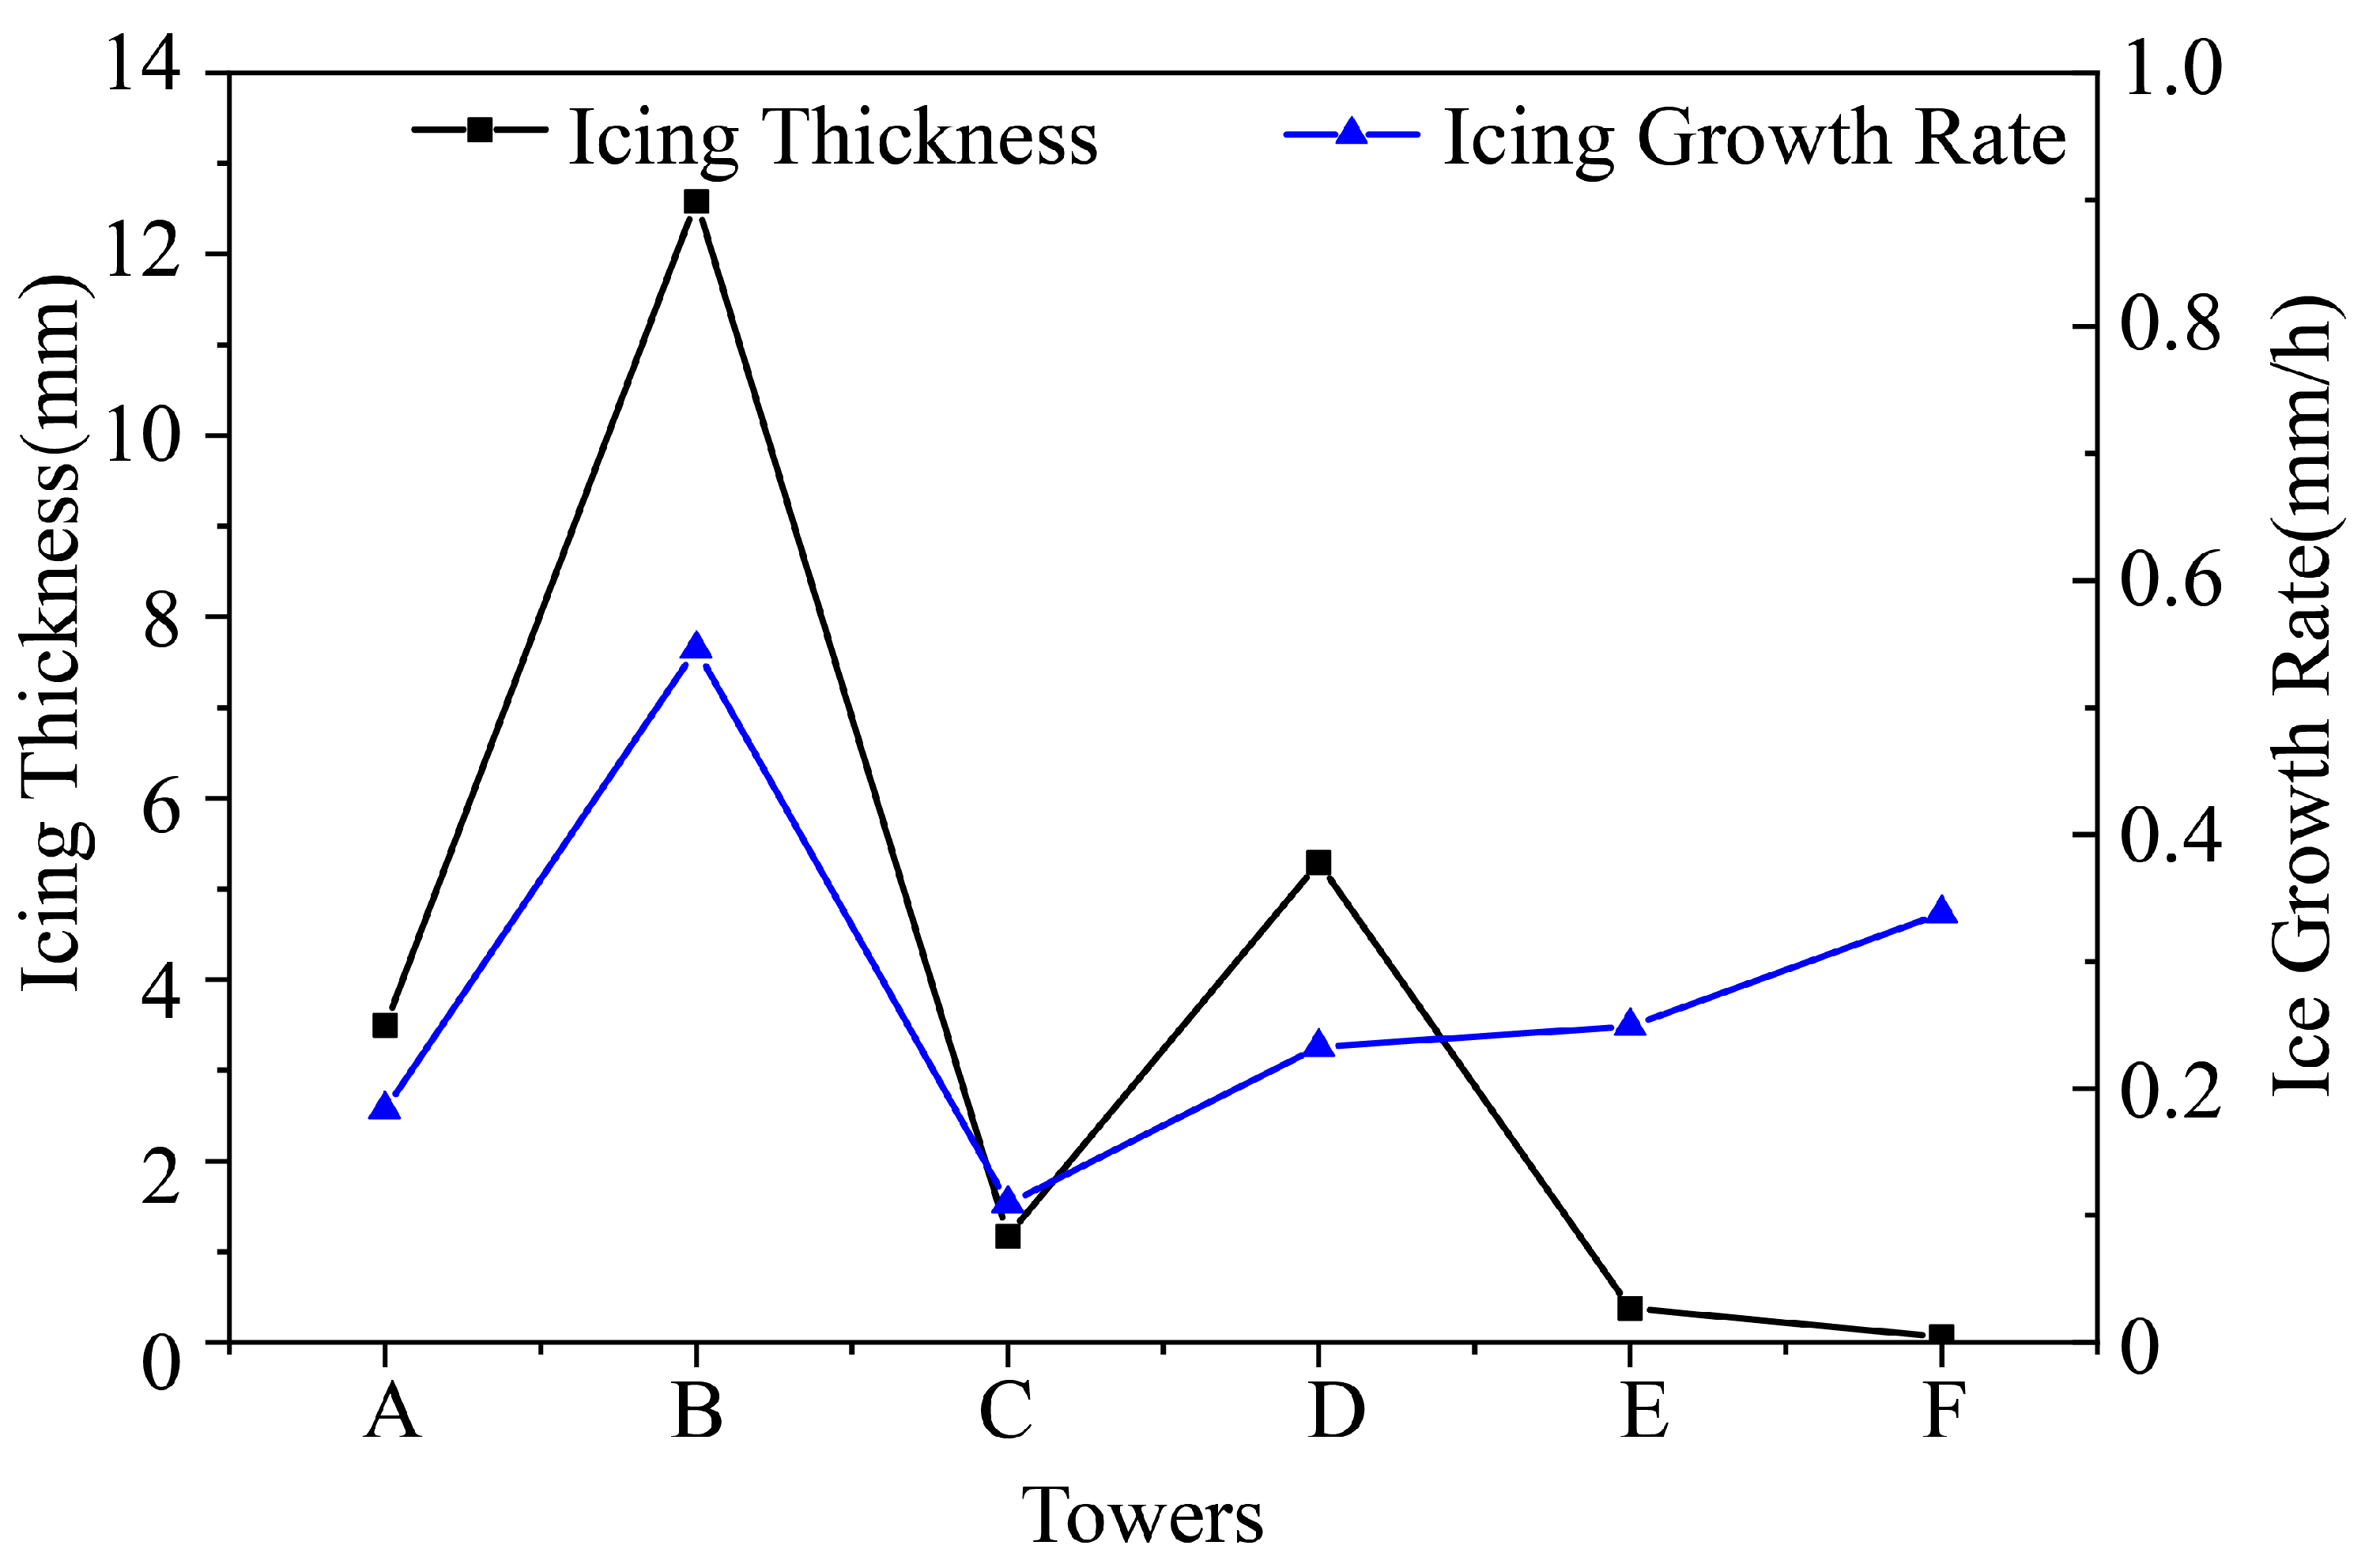
Figure 2 depicts the variations in average wire icing thickness and growth rate across the 15 icing events categorized by micro-topography. A general increasing trend in the icing thickness with altitude is observed when compared to tower elevations in Figure 1b, but such a relationship is not strictly linear; however, the icing rate is relatively independent of altitude. A somewhat interesting observation is the significant disparity in icing severity between various towers. For instance, despite their proximity in both coordinate location and elevation at Tower A and B (hilltop vs. windward slope), Tower B exhibits over threefold greater average icing thickness (12.58 mm) and growth rate (0.55 mm·h−1) compared to those at Tower A (3.495 mm and 0.18 mm·h−1, respectively). Similarly, Towers C and D showcase the influence of micro-topography even with comparable altitude. Tower C, situated on the leeward slope hillside, has a significantly lower average icing thickness (1.2 mm) and growth rate (0.11 mm·h−1) compared to those at Tower D (5.4 mm and 0.24 mm·h−1, respectively) located on the windward slope hillside pass. Notably, Tower D exhibits a thickness of four times greater and a rate of over two times higher compared to Tower C. On the contrary, Towers E and F, positioned both at lower elevations, display an average icing thickness below 0.5 mm, without obvious differences when icing events occur. It is noteworthy that the observed icing thickness and growth rate at Tower D (pass) fails to surpass those at Tower B (windward slope), which contradicts previous findings of the most severe icing occurring at passes [14,19]. Further investigations are given in Section 4 to elucidate the underlying mechanisms responsible for this phenomenon.

Figure 2.
Average icing thickness and growth rate over 15 icing events for various towers.
In summary, the icing thickness generally shows an increasing trend with altitude; however, the icing rate is relatively independent of altitude. The impact of various microtopographies on the icing rate is significant, with windward slopes demonstrating 2~4 times higher icing thickness and growth rate compared to those at the leeward slopes at similar altitudes.
3.3. Relationship between Meteorological Elements and Altitude under Different Microtopographies during Icing Events
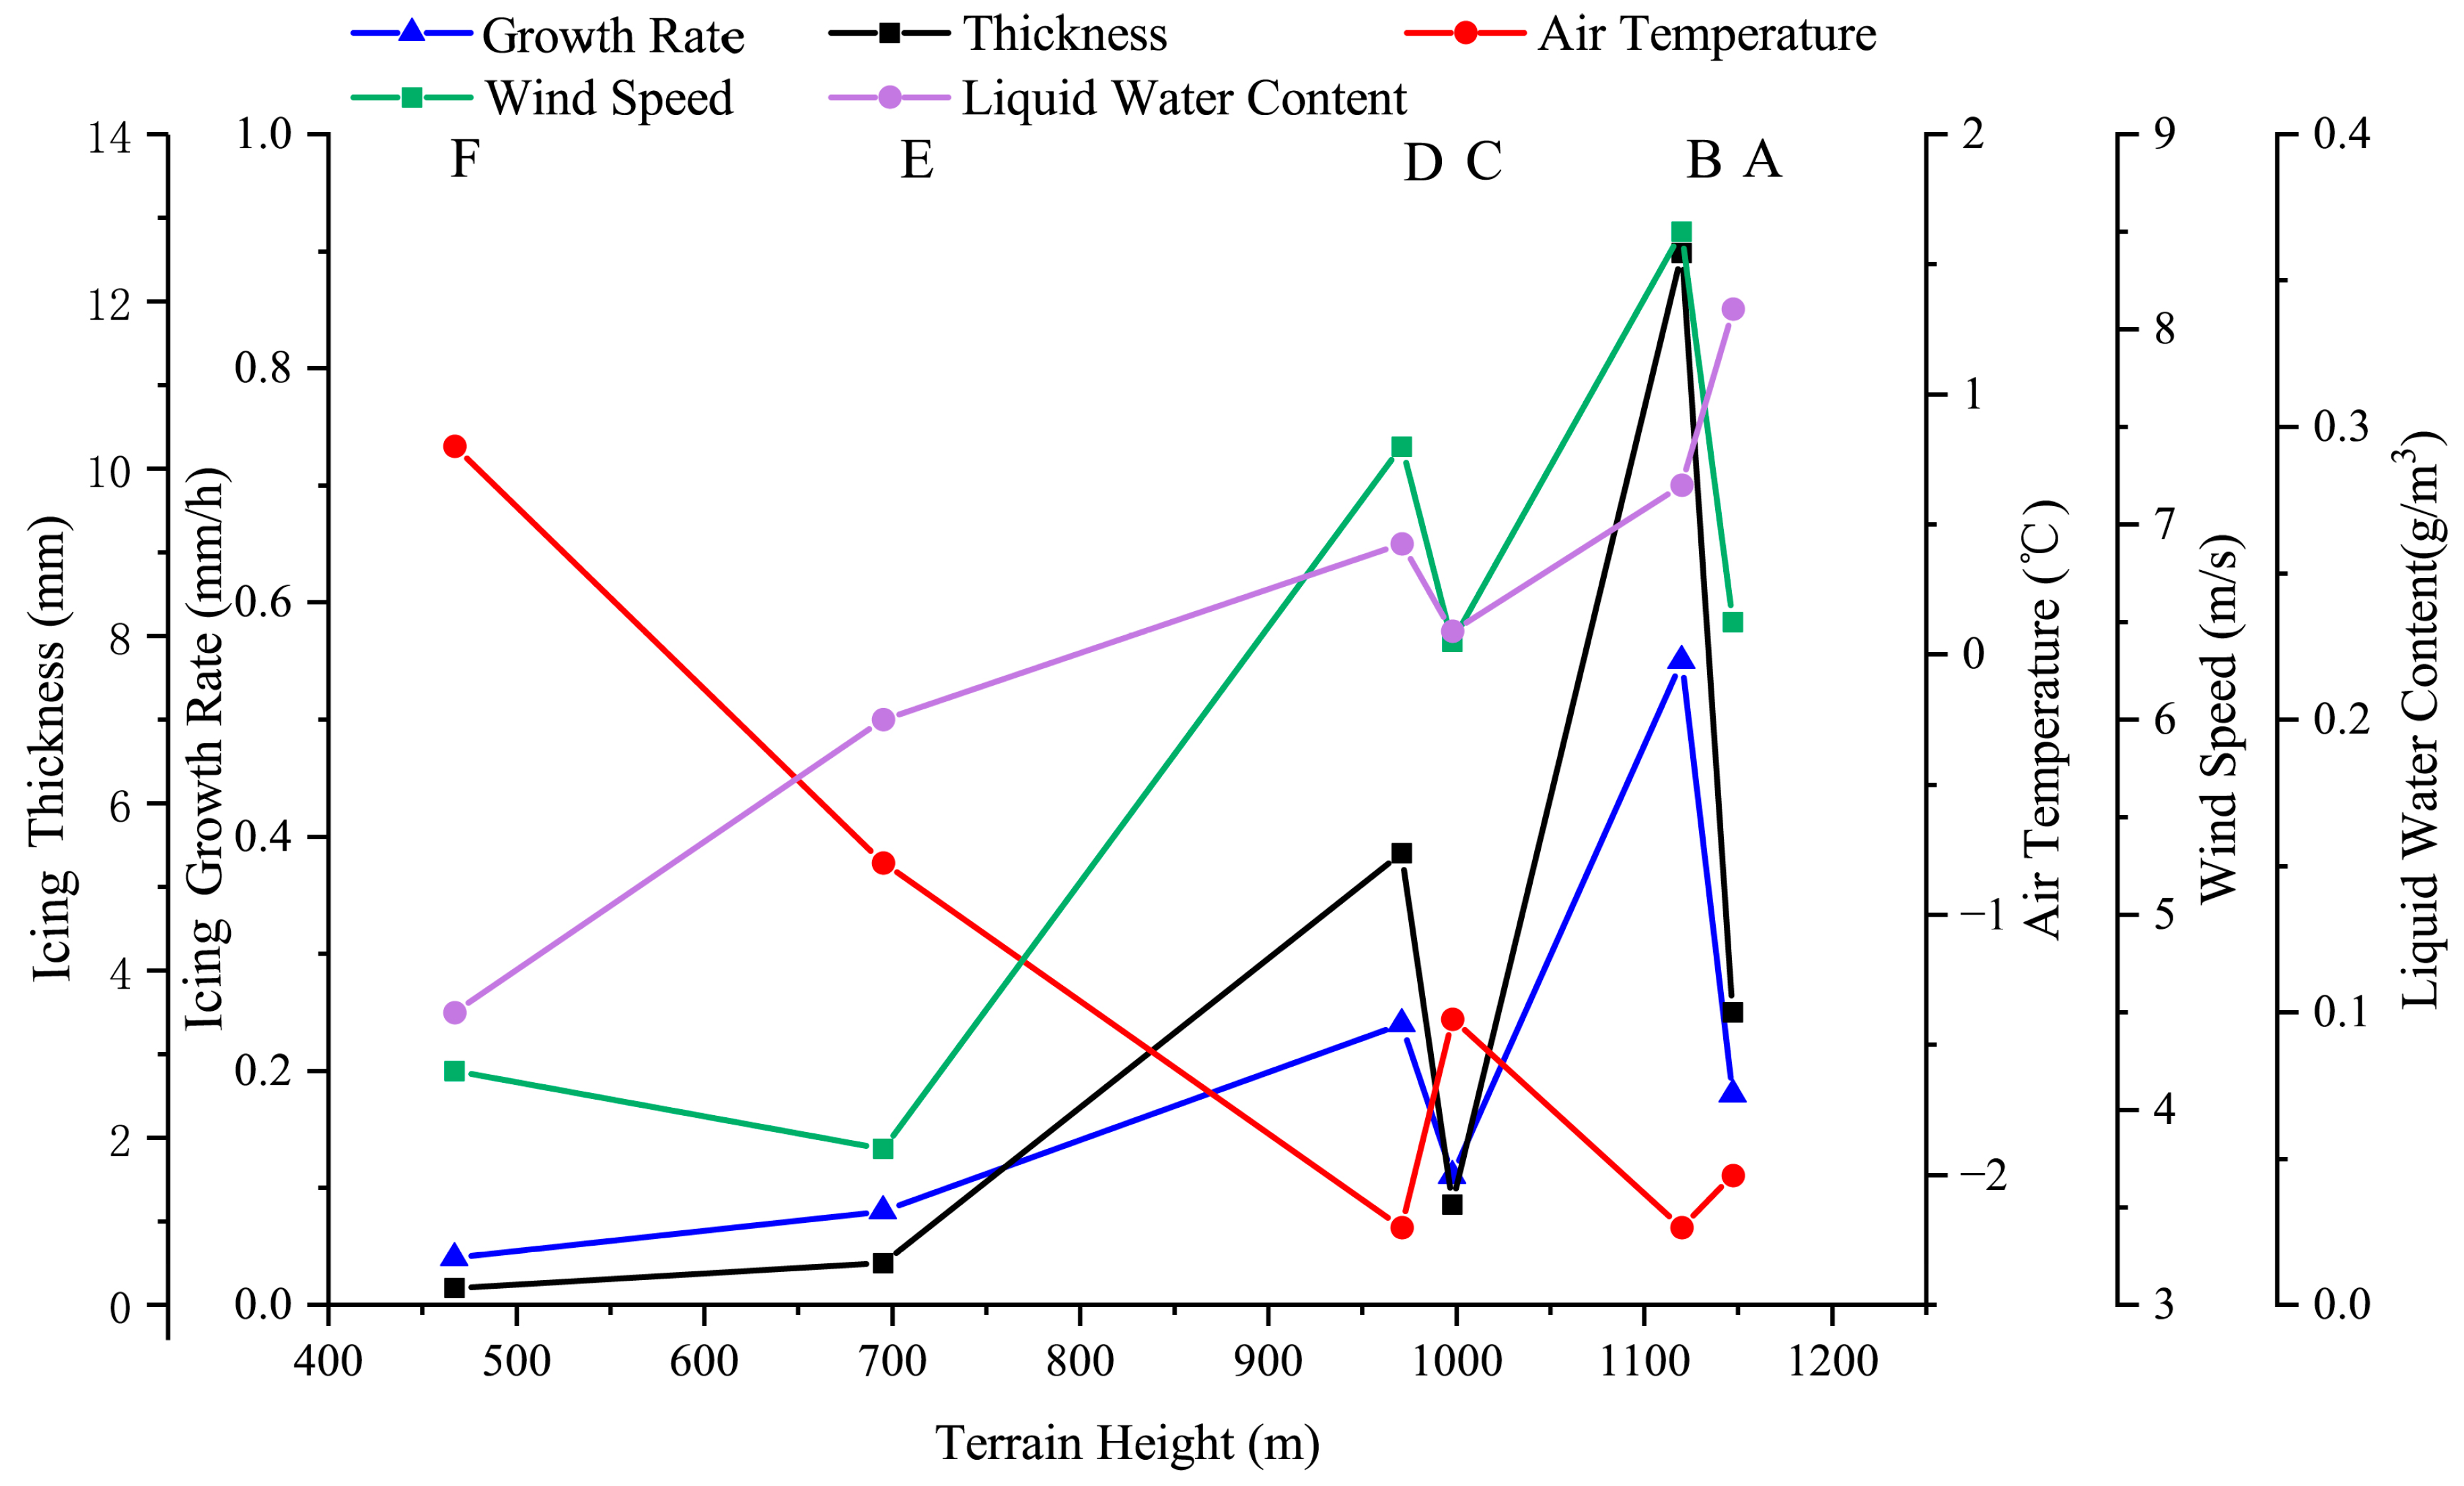
Air temperature, wind speed, and liquid water content are well-recognized as the primary meteorological factors influencing wire icing growth. To investigate their impacts, the distribution of the average on these three factors across the 15 icing events observed over three years was analyzed (Figure 3), and then a detailed examination of the relationship between these factors with altitude at the six monitoring towers was conducted, with a particular focus on the impact of micro-topography on their relationship. Figure 3 illustrates that temperature generally decreases with altitude, whereas wind speed and liquid water content roughly increase with altitude, with notable exceptions at Towers A and C. The unique turning points in the trend lines at Towers A (at the leeward slope near hilltop), and C (at the leeward slope) deviated from the general patterns, suggesting the potential role that micro-topography may play in modulating the relationship between these meteorological elements and altitude, particularly at leeward slopes. For observation towers at the windward slope, the decreasing temperature and the increasing wind speed and liquid water content with altitude are theoretically conducive to ice formation and growth, implying a potential rise in icing rate and thickness with altitude, which generally agrees with the observations reported in this study. However, it appears that icing thickness and growth rate are more sensitive to meteorological factor variations at higher altitudes compared to lower ones. For instance, Towers E and F, at lower altitudes, exhibit minimal differences in their icing thickness and rate despite clear distinctions in the three meteorological factors. In contrast, at higher altitude towers, such as B and D, the differences in icing thickness and growth rate are pronounced, even with minor variations in temperature, wind speed, and liquid water content. These findings indicate that the relationship between the three meteorological factors and icing thickness and growth rate is complex and influenced by microtopography over the mountain area. Further research is necessary to fully understand the underlying physical mechanisms that govern the non-linear relationship between meteorological factors and icing thickness and growth rate.

Figure 3.
Variation of meteorological elements, icing growth rate, and thickness with altitude at different monitoring towers.
3.4. Correlation Analysis between Meteorological Factors and Icing Rate
To quantify the influence of meteorological factors on icing rates under varying terrains, a correlation analysis was conducted between air temperature, wind speed, liquid water content (LWC), and icing rate data collected from multiple monitoring towers. Pearson’s correlation coefficient with a confidence interval test was employed to minimize the influence of the sample sizes among towers. Several points are noteworthy. First, a statistically significant negative correlation between air temperature and icing rate exists at Towers A and D (significant test level of α = 0.001), and Towers E and F (α = 0.01), respectively. However, Towers B and C failed to pass the significant test (α = 0.01). Second, wind speed generally exhibits a positive correlation, with the icing rate for Towers A, B, and D demonstrating a significant association (α = 0.01), while the correlation at Towers C, E, and F are less statistically significant (α = 0.01). Third, none of the towers passed the significant test (α = 0.01) in the relationship between LWC and icing growth rate. These findings suggest the complexity of the influence of multiple meteorological factors on the icing growth rate, leading to difficulties in isolating the impact of individual factors. The reasons for this have yet to be thoroughly investigated.
3.5. Influence of Meteorological Elements on Wire Icing Growth Rate during Dry and Wet Growth Process
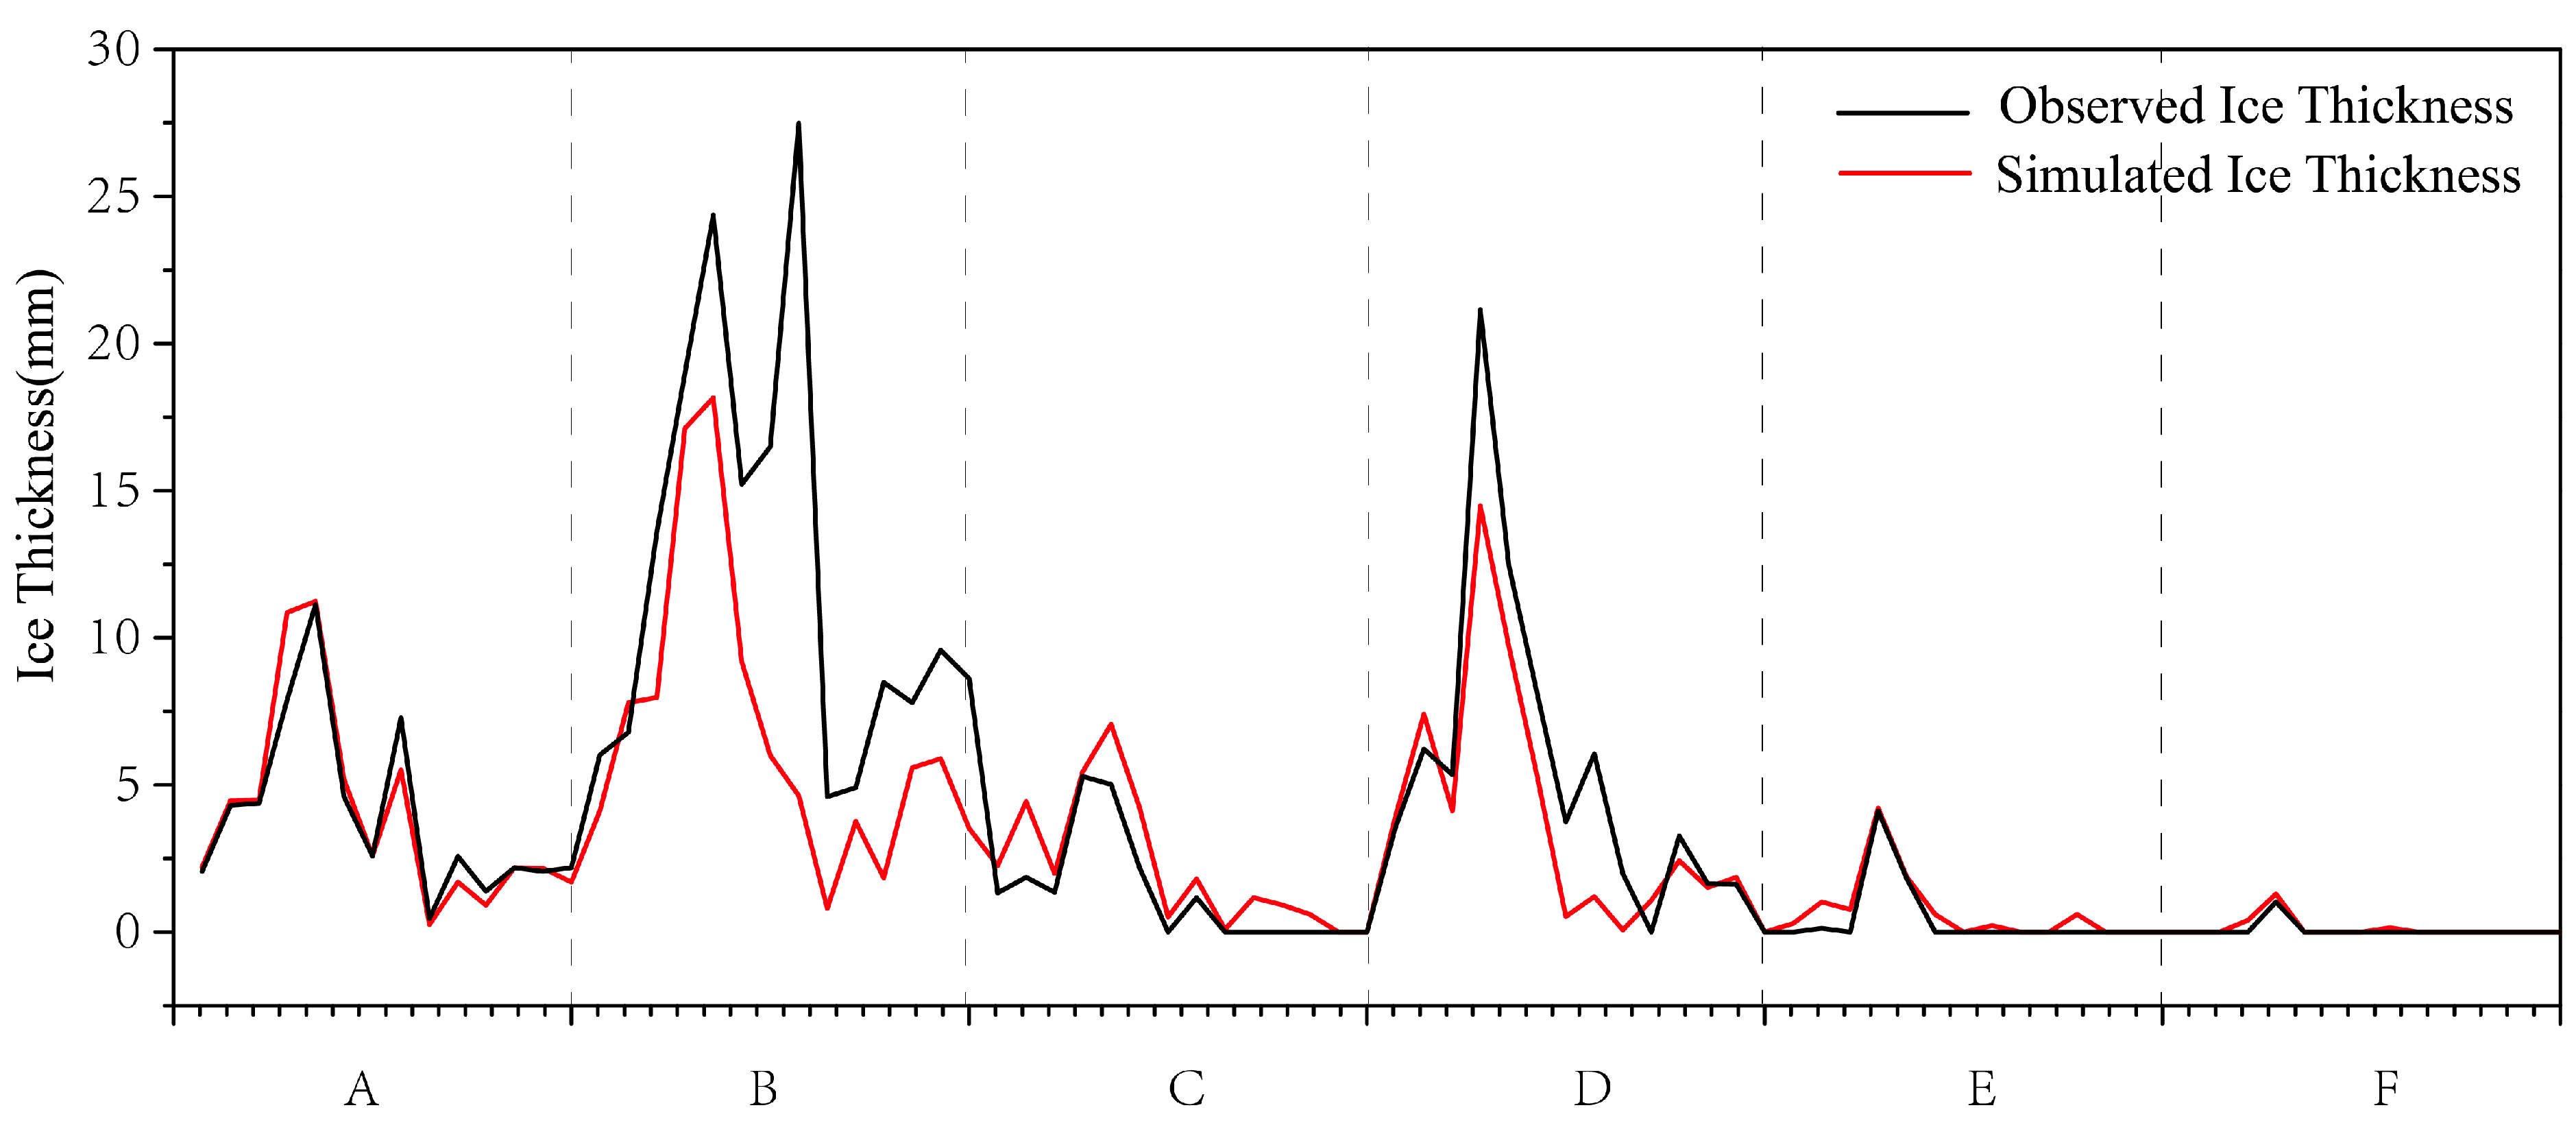
Some research has claimed the various forming mechanisms in dry and wet processes for wire icing [19,25]. The Makkonen model was employed to distinguish dry and wet processes and simulate icing thickness at each monitoring tower during 15 observed icing events. The accuracy of the Makkonen model in simulating ice thickness was first examined to guarantee the reliability of the results. The meteorological factors, including temperature, wind speed, precipitation, and liquid water content, served as inputs in the Makkonen model to simulate the icing thickness. The results show a high degree of agreement between the simulated and observed maximum icing thicknesses over each icing event (Figure 4) for all towers, with an overall statistically significant correlation coefficient of 0.837 (α = 0.001, and a root-mean-square error (RMSE) of 3 mm, indicating a high level of accuracy. When considering the tower separately, Towers A, D, E and F exhibit exceptional agreement between simulations and observations, while Towers C and B display slightly larger errors, with Tower C (Tower B) tending to overestimate (underestimate) the actual icing thickness. Despite these minor discrepancies, these findings suggest the effectiveness of the Makkonen model in simulating icing thickness over the study region.
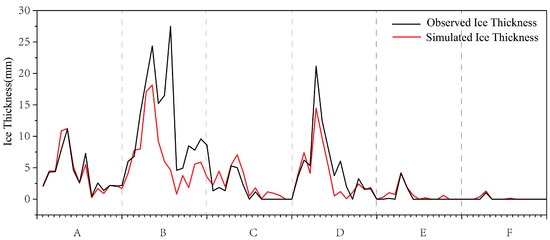
Figure 4.
The observed and simulated maximum ice thickness by the Makkonen model on the wire at each monitoring tower during 15 ice cover events.
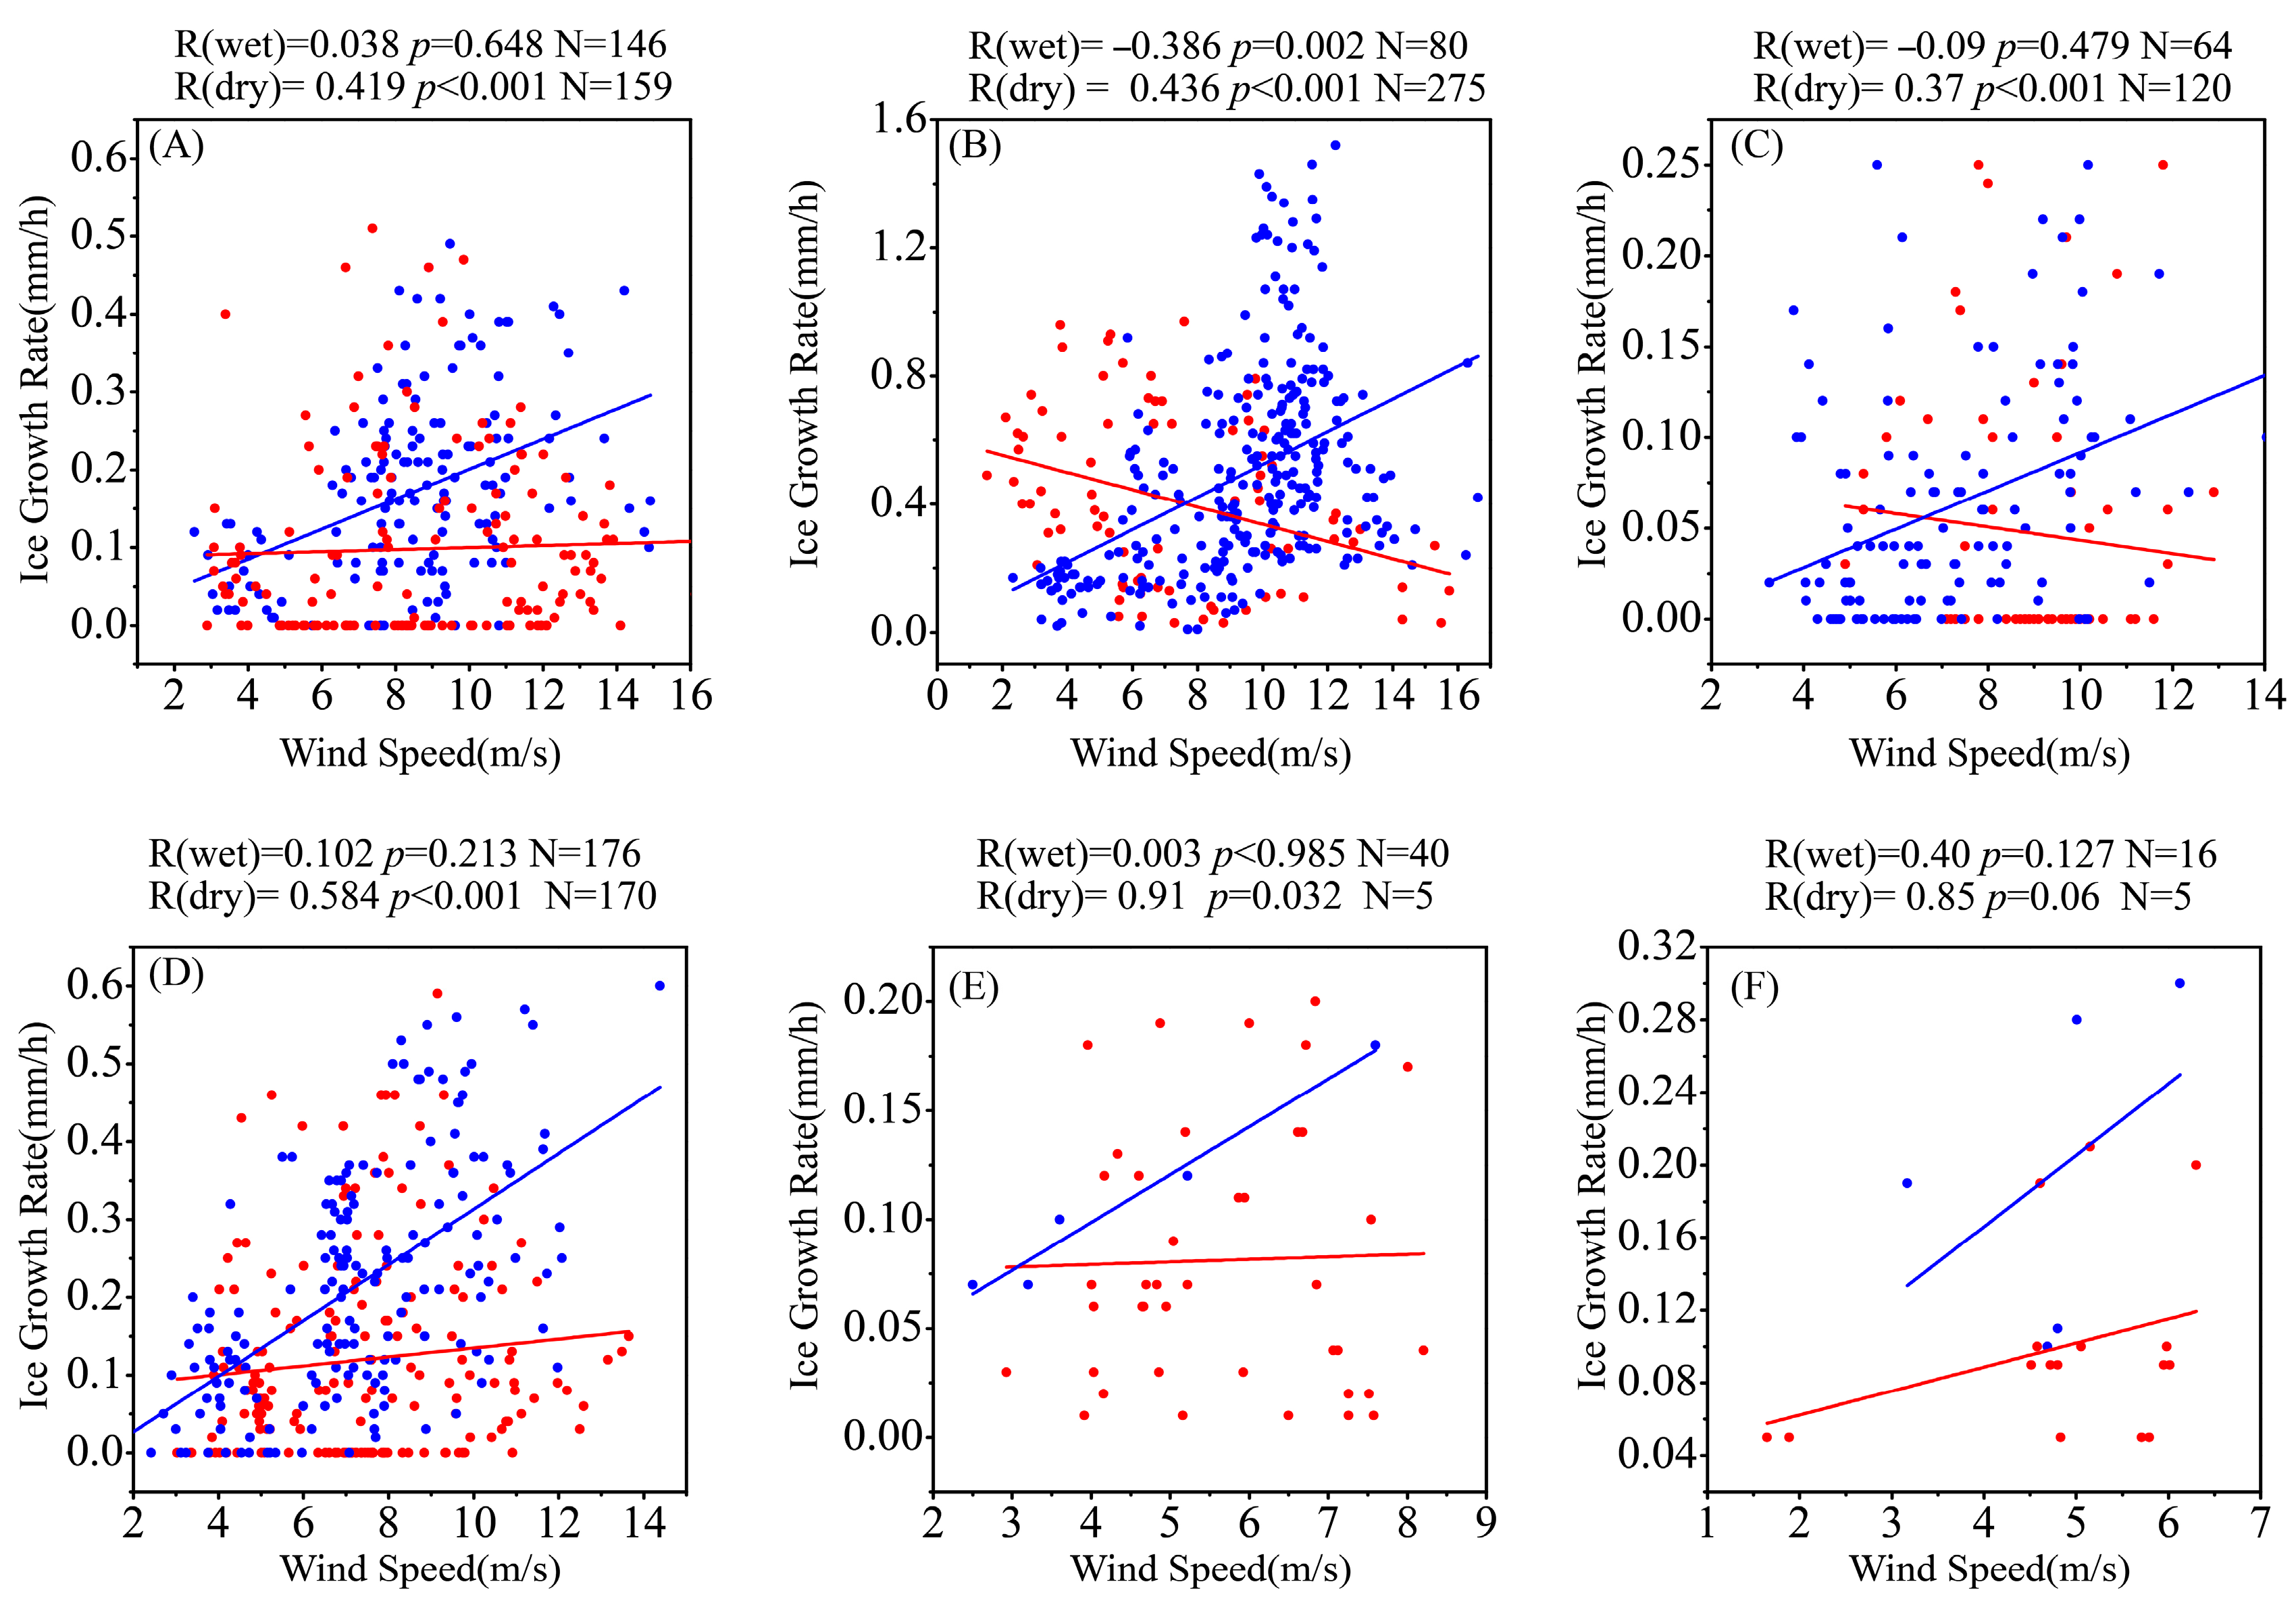
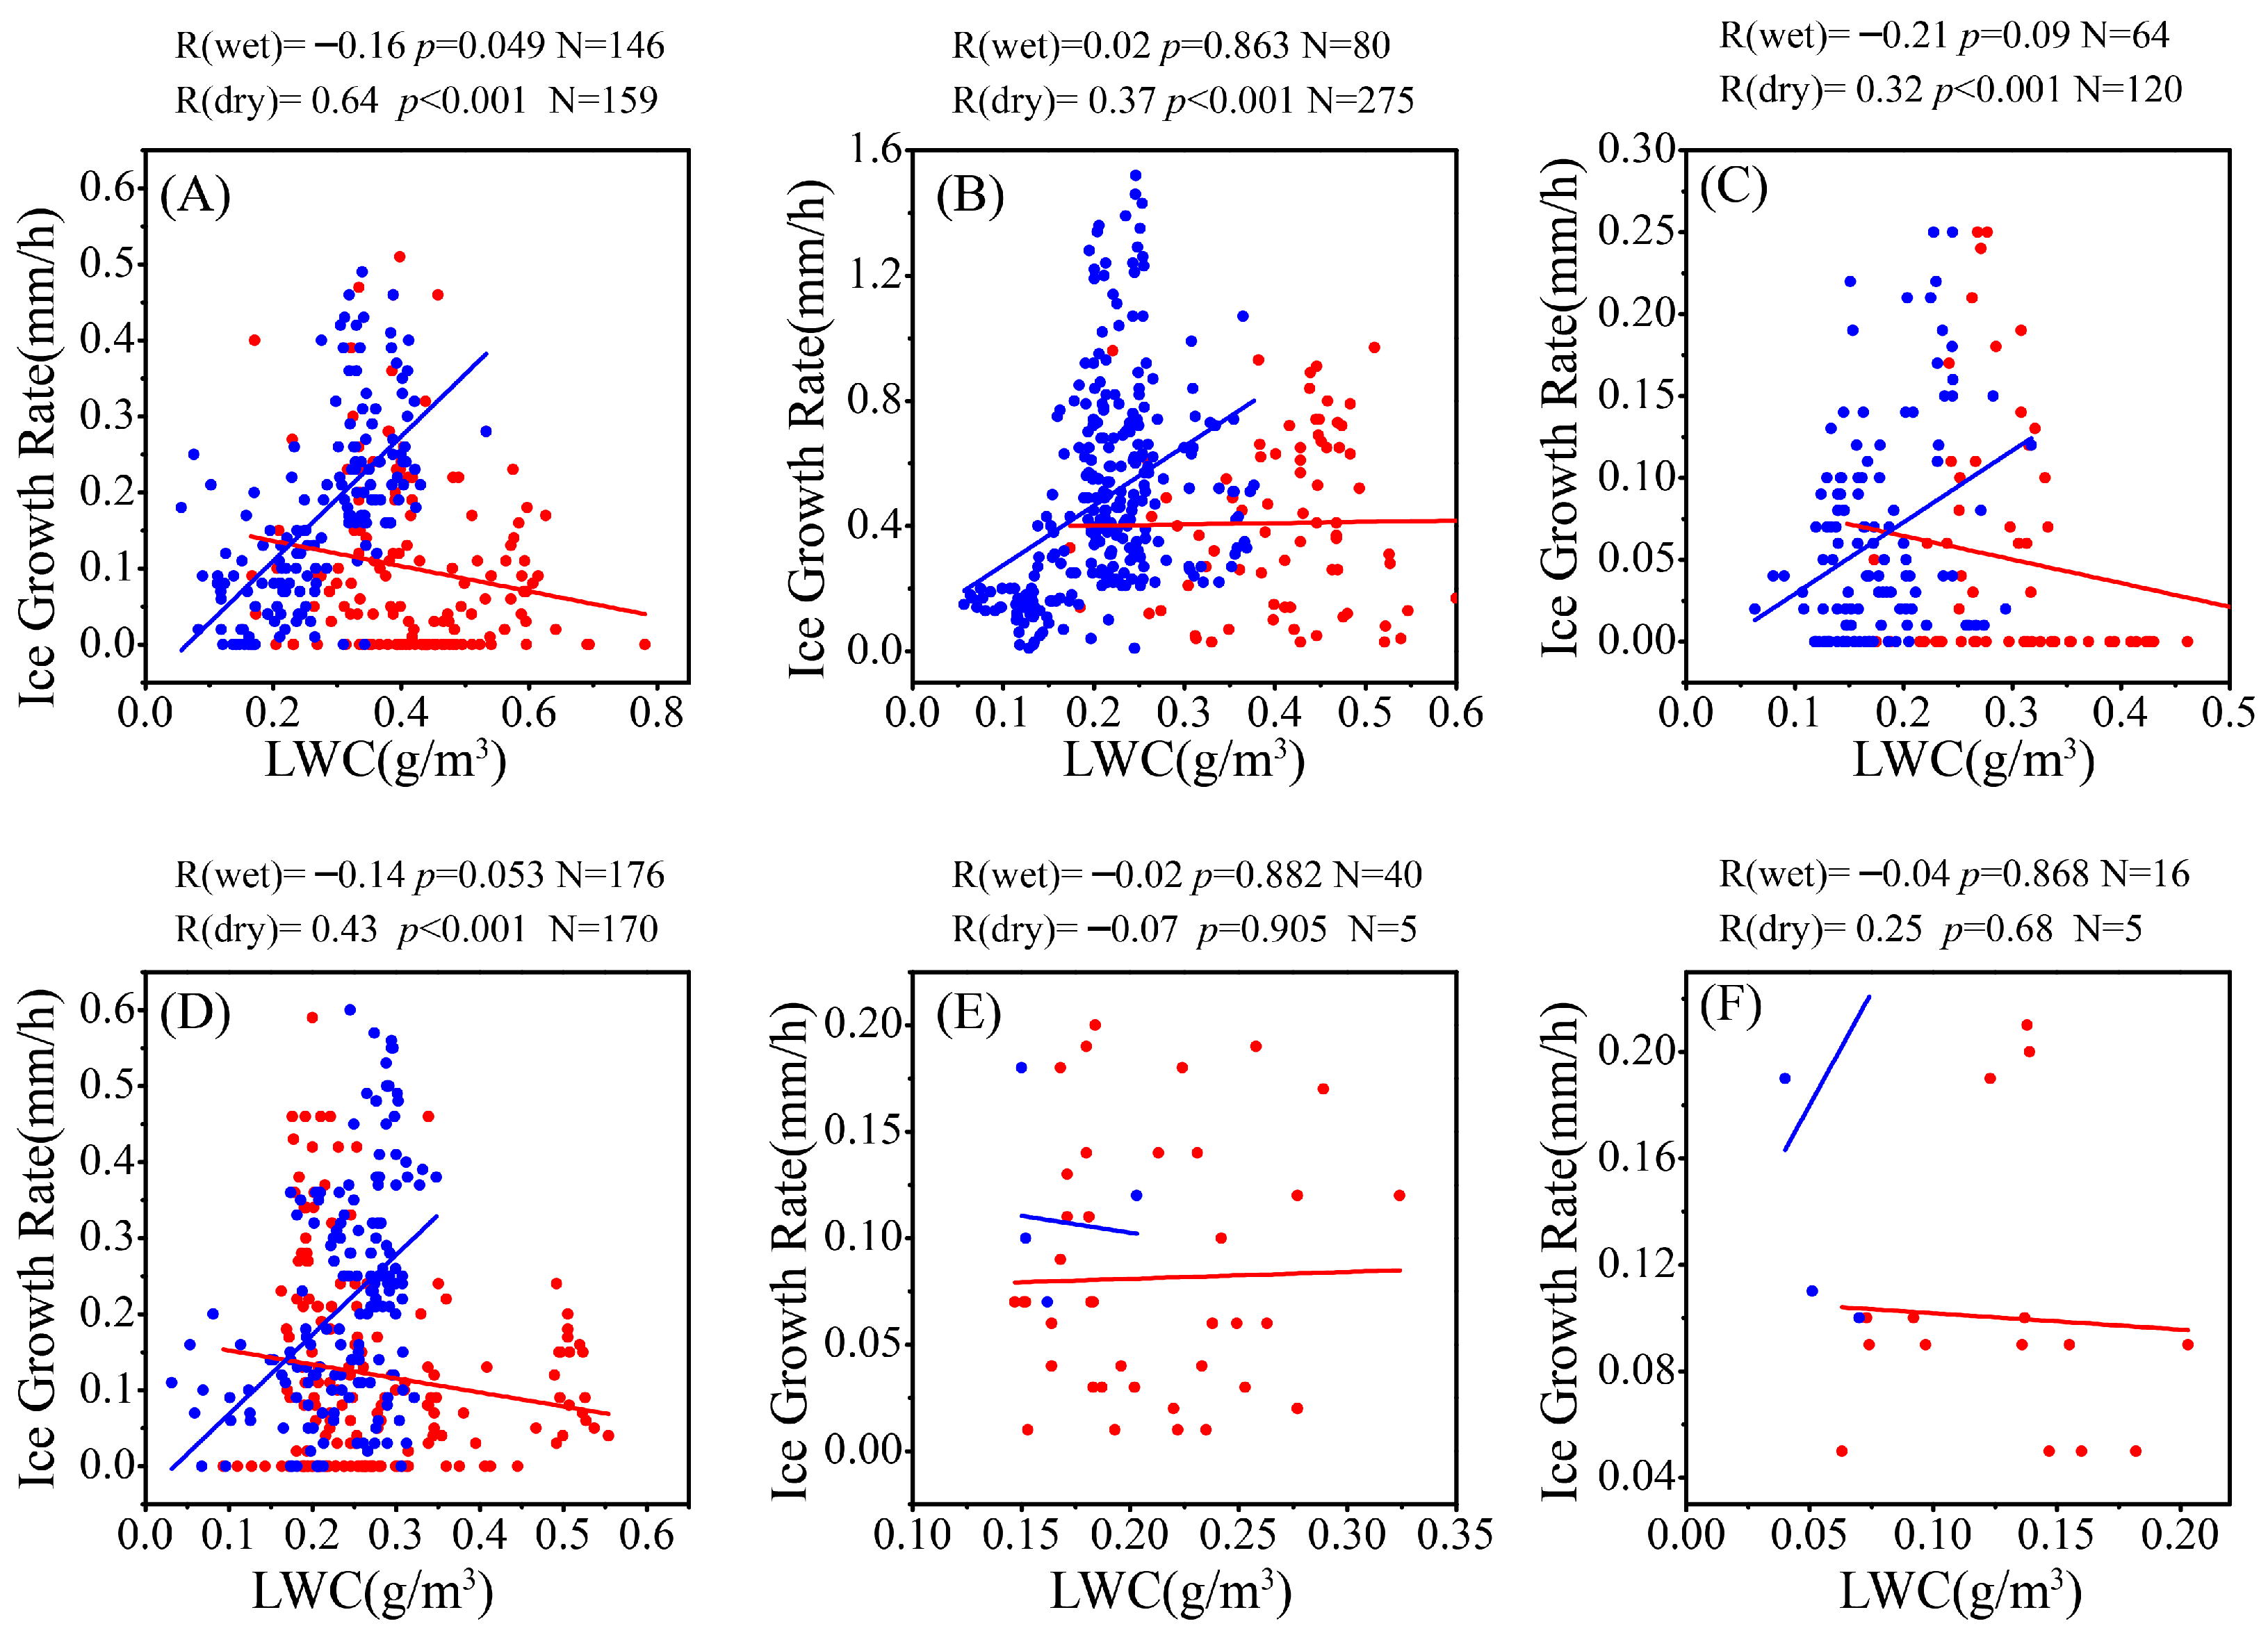
The good performance of the Makkonen model in simulating icing thickness allows us to use it to distinguish the wet and dry growth during ice accumulation. The criteria for separation are given in Section 2.2.1. Several findings can be reached. First, the correlation between the icing rate and temperature (Figure 5A–F) during the wet growth process exhibits a robust negative correlation with the correlation coefficients for the six monitoring towers ranging from −0.4 to −0.77, statistically significant at the significant level of α = 0.001. This suggests that temperature plays a pivotal role in influencing the icing rate during wet growth conditions. In contrast, during the dry growth phase, except for tower D, the correlation coefficients fail to pass the significant test, indicating a less profound impact of temperature on the icing rate under dry growth conditions. Second, examining the relationship between the icing rate and wind speed for each tower (Figure 6A–F) shows that the correlation is not pronounced during wet growth, implying the non-determinative role of wind speed in influencing icing rate under wet growth scenarios. However, during the dry growth process, a highly significant and positive correlation emerges, with the correlation coefficients for the six monitoring towers ranging from 0.37 to 0.91 (α = 0.01). This finding underscores the substantial influence of wind speed on the icing rate during dry growth conditions. Third, the influence of liquid water content (LWC) on icing growth rate exhibits contrasting behaviors during wet and dry growth periods as well (Figure 7A–F). During wet growth, no statistically significant correlation (α = 0.01) is observed between LWC and icing rate at six monitoring towers. Conversely, during dry growth, a significant positive correlation (α = 0.01) emerges between LWC and icing rate at towers A, B, C, and D (Figure 7A–D). Towers E and F, with potentially fewer samples, lack a statistically significant correlation (Figure 7E,F). These findings suggest that LWC primarily contributes to the icing growth rate during dry growth periods instead of the wet processes.
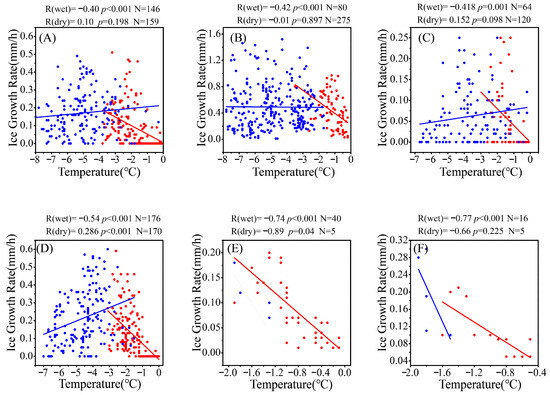
Figure 5.
Relationship between icing growth rate and temperature at each monitoring tower under dry and wet growth conditions. The red and blue dots indicate the wet and dry growth respectively. R, p, and N stand for the correlation coefficient, probability, and data samples, respectively. (A–F) represent monitoring towers, respectively.
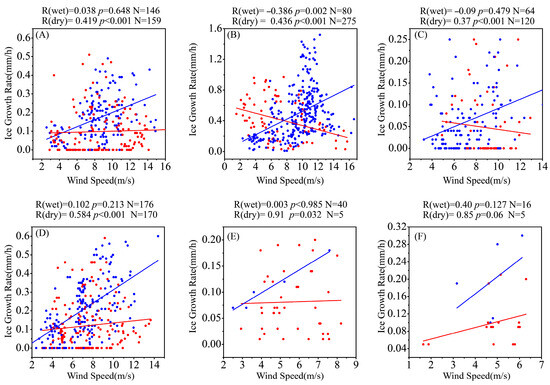
Figure 6.
Relationship between icing growth rate and wind speed at each monitoring tower under dry and wet growth conditions. The red and blue dots indicate the wet and dry growth respectively. R, p, and N stand for the correlation coefficient, probability, and data samples, respectively. (A–F) represent monitoring towers, respectively.

Figure 7.
Relationship between icing growth rate and liquid water content at each monitoring tower under dry and wet growth conditions. The red and blue dots indicate the wet and dry growth respectively. R, p, and N stand for the correlation coefficient, probability, and data samples, respectively. (A–F) represent monitoring towers, respectively.
Overall, the relationship between the icing rate and meteorological factors varies considerably between the wet and dry growth stages. Notably, during wet growth, the icing growth rate is solely dependent on the air temperature (Figure 5A–F) rather than the wind speed (Figure 6A–F) or LWC (Figure 7A–F). In contrast, during dry growth, wind speed (Figure 6A–F) and LWC (Figure 7A–F) serve as the major contributors to the icing rate, while the influence of temperature (Figure 5A–F) is less significant. The wet and dry growth processes are generally aligned with the icing types of glaze and rime, respectively [24,25,26]. The climatological statistics, as reported in [28], delineate the hourly-averaged meteorological element thresholds for 80% cumulative frequency of glaze and rime. For glaze, the identified thresholds are a temperature range of −2 to 0 °C, a wind speed range of 0 to 5 m/s, and a LWC between 0.05 to 0.6 g/m3. In contrast, for rime, the respective thresholds fall in a temperature range of −9 to −1 °C, a wind speed range of 0 to 3 m/s, and a LWC range of 0.01 to 0.3 g/m3. Comparing these thresholds for glaze and rime, the differences in wind speed and liquid water content (LWC) are relatively marginal, the distinction mainly lies in the temperature threshold, with approximate 6°C narrower in the threshold for glaze (wet growth) than that of rime (dry growth). This suggests that the temperature is considerably more responsive to its changes in the context of the wet growth condition. Furthermore, glaze, characterized by the freezing supercooled raindrops falling on the conductor at high altitudes and attached to it, exhibits a diminished sensitivity to ambient wind speeds and LWC. However, rime (dry growth), formed by the surrounding supercooled fog droplets frozen on a conductor, is more likely influenced by variations in wind speed and LWC, thereby affecting the rate of ice accumulation.
4. Further Analysis
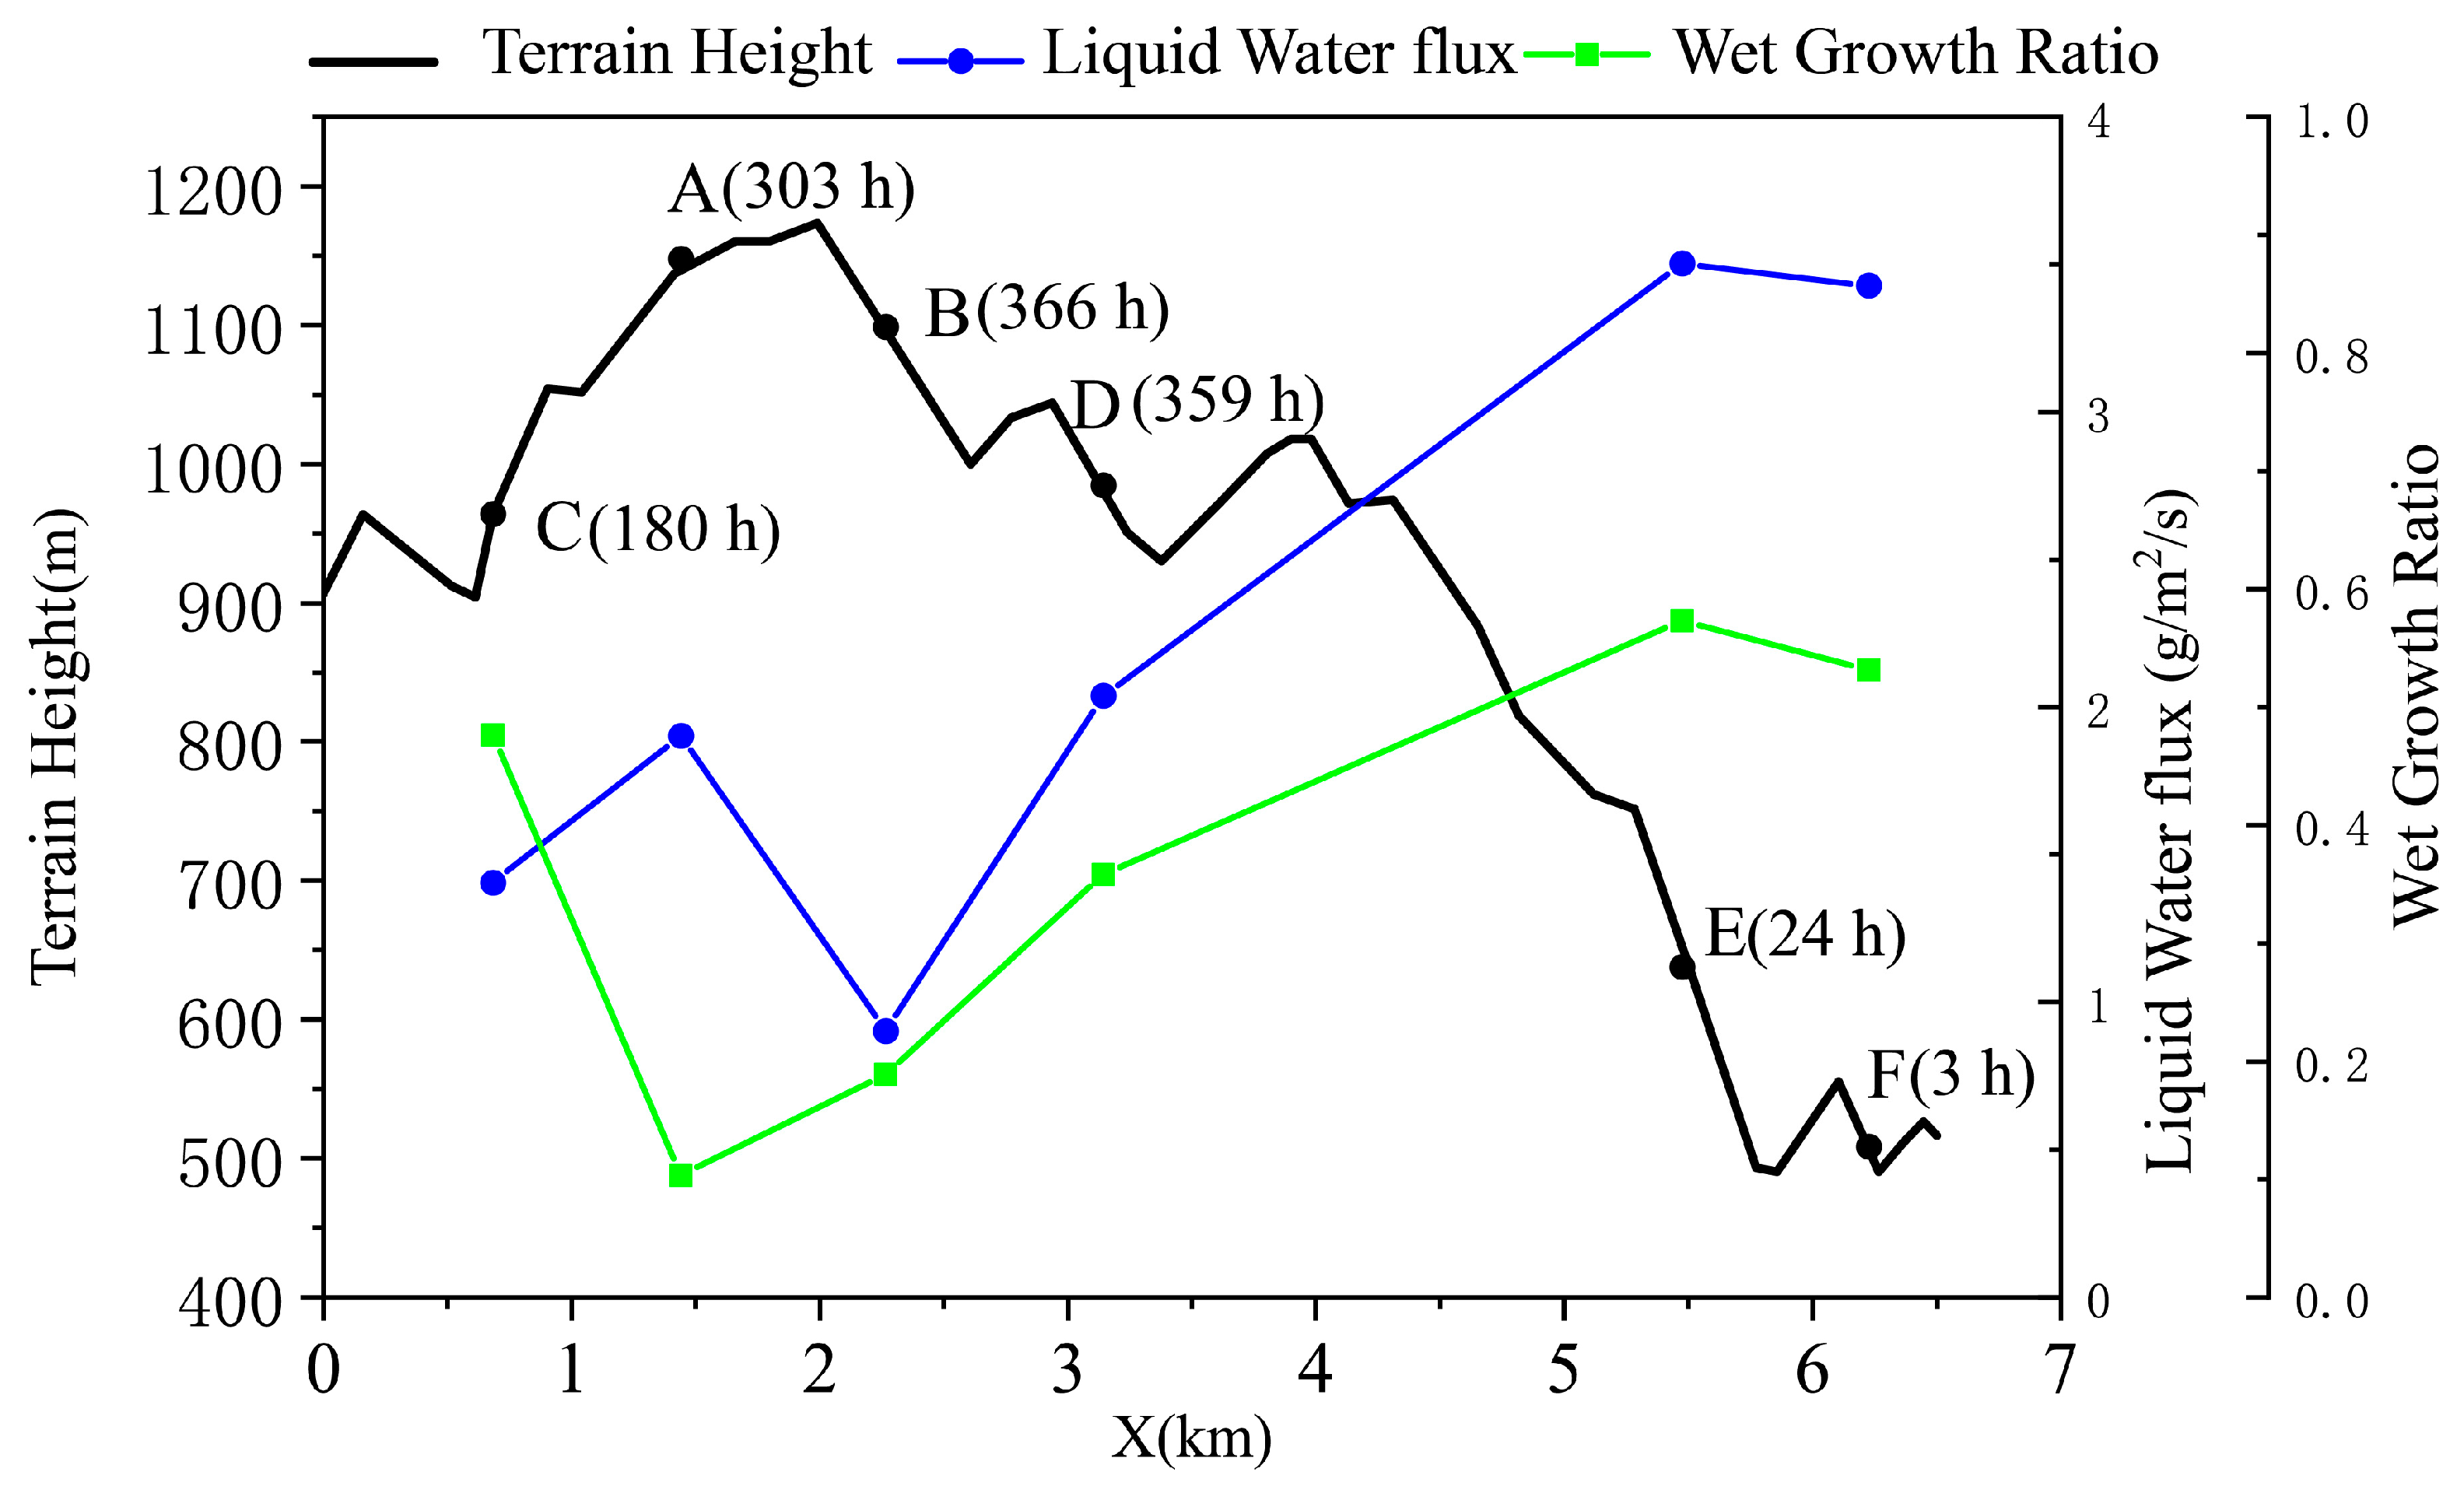
In order to clarify the underlying physical mechanisms of how meteorological factors affect icing growth rate across different micro-topographies during icing events, a detailed analysis was performed to quantify the duration of icing maintenance and the proportion of wet growth relative to the total growth period, calculated as the ratio of wet growth hours to the sum of wet and dry growth hours (wet growth hours/(wet + dry growth hours)). Notably, the icing growth pattern at each tower presents a composite of wet and dry growth processes (Figure 8). Windward slopes exhibit a gradual transition from predominantly wet growth at lower altitudes (Towers E, F, and D) to predominantly dry growth at higher elevations (Tower B). Conversely, leeward slopes (Towers A and C) display a dominance of dry growth, with a lower proportion of wet stage hours observed at high altitudes. Additionally, regardless of the location of towers relative to the mountains, wet growth prevailed below 900 m (Towers E and F), while dry growth dominated beyond 900m (Towers A, B, C, and D). Besides, the maintenance duration generally increases with altitude excluding Tower A near the hilltop.
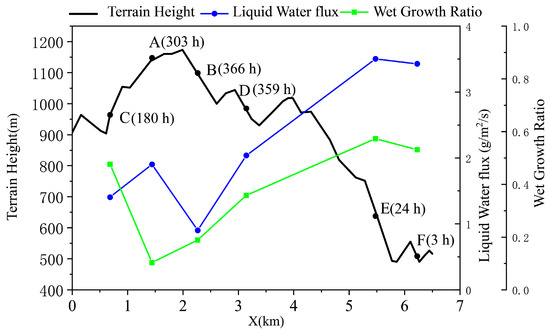
Figure 8.
Changes of ice cover duration (marked in parentheses), proportion of wet growth duration over the total icing cover period (green line), and liquid water flux (blue line) at each tower.
To reveal the potential impact of micro-topographies on the icing growth rate, three comparison pairs of the towers were selected due to the similar altitude but contrasting locations they sit. One such pair consisted of Towers A and B, situated near a hilltop on the leeward and windward slopes, respectively. As shown in Figure 8, both towers mainly experience dry growth conditions with wet growth durations below 20%. As discussed earlier, the icing rate during dry growth is strongly positively correlated with wind speed and liquid water content; the wind speed at A is 2 m·s−1 lower than B, but the liquid water content is 0.6 g/m3 higher than that B, making direct comparison of their individual icing rates challenging. To address this issue, an integrated factor, liquid-water flux (wind speed × liquid-water content), was employed. Therefore, a lower liquid-water flux (2.21 g·m−2·s−1) at Tower A compared to Tower B (2.38 g·m−2·s−1) accounts for a lower icing rate at Tower A compared to Tower B. Another pair consists of Towers C and D situated on the leeward and windward slope, respectively: both were dominated by the dry growth process. Tower C exhibits a lower liquid water flux, corresponding to a reduced icing rate when compared to Tower D. The last pair, Towers E and F, was predominantly affected by the wet growth process (Figure 8), with the proportion reaching beyond 85%. The earlier discussion reveals the strong independence of growth rate solely on temperature; therefore, a lower temperature at Tower E is responsible for the higher value in both icing thickness and icing growth rate compare to Tower F.
Apart from the fact that the icing rate on the leeward slopes is lower than that on the windward slopes, a shorter duration of icing maintenance on the leeward slopes is observed as well (Figure 8). The higher temperature on the leeward slope likely plays a contributing role on it. Specifically, the temperature of Towers A and C on the leeward slopes is approximately 0.2~0.8 °C higher than that of Towers B and D on the windward slopes, which possibly leads to a reduced duration of icing maintenance at Towers A (303 h) and C (180 h) compared to Towers B (366 h) and D (359 h) on the windward slopes. The shorter maintenance period, coupled with a relatively lower rate of ice accretion causes thinner ice thickness on the leeward slopes. Due to a similar reason, Tower E has a longer icing duration than Tower F; however, since the temperature of Tower E and F is much higher than the other towers (Figure 3) at high altitudes, leading to much shorter durations compared to others.
5. Concluding Remarks
This study investigated the influence of meteorological factors on wire icing processes across varying micro-topographies. The hourly measurements of wire icing thickness and meteorological factors collected from six towers over the Guilin-Haiyang Mountains from 2018 to 2020 were used. The Makkonen model was employed to categorize 15 identified wire icing events into two distinct growth patterns: wet and dry. A detailed correlation analysis was conducted to explore the relationships between icing rate and various meteorological factors, and the physical mechanisms governing icing growth under different micro-topographical conditions were elucidated. The following conclusions can be reached. First, a generally positive correlation was observed between the altitude and icing thickness, but the icing growth rate was independent of altitude when considering the overall icing process. Although altitude negatively correlated with temperature and positively with wind speed and liquid water content, the icing rate was not directly associated with altitude across different micro-topographies, such as windward slopes, leeward slopes, and passes. Second, further distinguishing wet and dry growth patterns revealed a critical dependency in the relationship between icing rates and meteorological factors. Notably, the correlations observed differed significantly between the two growth patterns (Figure 5, Figure 6 and Figure 7), with the icing growth rate being negatively correlated to air temperature during wet growth, but positively correlated to wind speed and liquid water content during dry growth. Third, both wet and dry growth patterns were found at all the towers, with the proportion of wet growth duration decreasing with altitude. The higher temperature and lower liquid water flux accounted for a lower icing rate and thinner icing thickness at the leeward slope compared to the windward slope at a similar altitude. These results offer a comprehensive understanding of the physical mechanisms behind the microtopography-dependent variations in icing rates, particularly explaining the consistently lower icing thickness and rate on leeward slopes compared to windward slopes. The independence of the icing rate with altitude provides significant insight into the development of more accurate icing prediction models as well.
Despite the effort to reveal the complex interplay between meteorological factors and the topographical features of the terrain, which together influence the process of ice accretion, it is noteworthy that the maximum height of the Guilin-Haiyang Mountain observation site is less than 1.2 km. More measurements are needed before the generalized laws suitable for various mountainous with different altitudes can be drawn. In addition, although the icing thicknesses simulated by the Makkonen model at each tower generally agree with the measurements, discrepancies between the simulation and observation persist. This suggests that the localization of the icing growth model requires further refinement through an extensive series of observational experiments. Additionally, the process of determining wet and dry growth phases from the Makkonen model’s outputs is quite intricate. A more simplified streamlined parameterization method should be developed in the future.
Author Contributions
Conceptualization, F.Z. and Y.H.; methodology, H.Z.; software, Z.L.; validation, H.L., H.G. and Z.L.; formal analysis, H.Z. and H.P.; data curation, H.G.; writing—original draft preparation, F.Z.; writing—review and editing, Y.H. and W.L.; visualization, Z.L.; supervision, Y.H.; funding acquisition, Y.H. and W.L. All authors have read and agreed to the published version of the manuscript.
Funding
This research was funded by the National Natural Science Foundation of China, grant number [41575104], Natural Science Foundation of Zhejiang, grant number [LQ23D050001], and Key Science and Technology Project of China Southern Power Grid Company Limited, grant number [YNKJXM20210174].
Institutional Review Board Statement
Not applicable.
Informed Consent Statement
Not applicable.
Data Availability Statement
The data presented in this study are available on request from the corresponding author. The data are not publicly available due to privacy.
Conflicts of Interest
The authors declare no conflicts of interest. Mr Fangrong Zhou, Mr Hao Pan and Mr Hao Geng are the employees of Joint Laboratory of power remote sensing technology (Electric Power Research Institute, Yunnan Power Grid Company Limited). Mr Haipeng Zhang and Mr Hao Li are employed in the Electric Power Research Institute, China Southern Power Grid Company Limited. The paper reflects the views of the scientists and not the company.
References
- Farzaneh, M. (Ed.) Atmospheric Icing of Power Networks; Springer Science & Business Media: Dordrecht, The Netherlands, 2008. [Google Scholar]
- Xu, S.K.; Zhao, J. Review of ice storm cases impacted seriously on power systems and de-icing technology. South. Power Syst. Technol. 2008, 2, 6. [Google Scholar]
- Hu, Y.; Hu, J.X.; Liu, T. Analysis and countermeasures for large area icing accident on power grid in northern China. Electr. Equip. 2008, 9, 1–4. [Google Scholar]
- Huang, B.; Xu, S.S.; Su, W.Y. Summary of research on icing of transmission lines. Insul. Surge Arresters 2012, 1, 27–32. [Google Scholar]
- Yang, H.; Yang, Y.; Shen, P.; Guo, T. Spatial correlation analysis of icing and geographical environment factors in Guizhou. Bull. Sci. Technol. 2018, 34, 49–52. (In Chinese) [Google Scholar]
- Wang, S.L.; Zhang, X. Impact of micro-terrain and micro-meteorology on transmission lines and countermeasures. Yunnan Electr. 2005, 6, 36–37. (In Chinese) [Google Scholar]
- Lu, J.Z.; Zeng, M.; Tian, L.; Luo, X.L.; Zeng, X.J. Microtopography based icing grades judging method for transmission lines. J. Electr. Power Sci. Technol. 2013, 28, 24–30. [Google Scholar]
- Liu, X.J.; Niu, S.J. Analysis of the causes for two high-voltage wire icing cases. J. Meteorol. Sci. 2016, 36, 230–235. [Google Scholar]
- Zhao, M.Y.; Xu, H.M. Inversion layer feature and its maintenance mechanism during ice weather over southern China in January of 2008. J. Meteorol. Sci. 2010, 30, 814–821. [Google Scholar]
- Huang, W.Y.; Dong, W.; Shen, X.Y.; Guo, C.Y.; Li, X.F.; Liang, P. Isentropic vortex and thermodynamic analysis of a cold wave cooling process. J. Meteorol. Sci. 2020, 40, 769–781. [Google Scholar]
- Ryerson, C.C. Atmospheric icing rates with elevation on northern New England mountains, USA. Arct. Alp. Res. 1990, 22, 90–97. [Google Scholar] [CrossRef]
- Jiang, X.L.; Du, Z.; Wang, H.Y.; Zhang, Z.J. Icing features of wire in Chongqing region. High Volt. Eng. 2011, 37, 3065–3069. (In Chinese) [Google Scholar]
- Drage, M.A.; Thiis, T.K. Large-scale measurements and numerical simulations of in-cloud icing around a mountain ridge. J. Wind Eng. Ind. Aerodyn. 2012, 104, 523–531. [Google Scholar] [CrossRef]
- Elizbarashvili, E.S.; Varazanashvili, O.S.; Tsereteli, N.S.; Elizbarashvili, M.E.; Kaishauri, M.N. Icing of wires in mountain areas of Georgia. Russ. Meteorol. Hydrol. 2012, 37, 567–569. [Google Scholar] [CrossRef]
- Lin, Z.G. Orographic Precipitation Climatology; China Science Publishing & Media Ltd.: Beijing, China, 1995. [Google Scholar]
- Wichura, B. The Spatial Distribution of Icing in Germany; German Meteorological Service, Regional Climate Office Potsdam: Potsdam, Germany, 2013. [Google Scholar]
- Zhang, X. Mechanism and countermeasures for ice-coated transmission line in micro-terrain and microclimate region. Power Syst. Technol. 2007, 31, 87–89. [Google Scholar]
- Luo, X.L. Study on Icing Grades Classification and dc De-Icing Scheme for Power Grid. Master’s Thesis, Changsha University of Science & Technology, Changsha, China, 2012. [Google Scholar]
- Makkonen, L. Estimating intensity of atmospheric ice accretion on stationary structures. J. Appl. Meteorol. Climatol. 1981, 20, 595–600. [Google Scholar] [CrossRef]
- Makkonen, L. Modeling of ice accretion on wires. J. Appl. Meteorol. Climatol. 1984, 23, 929–939. [Google Scholar] [CrossRef]
- Makkonen, L. Models for the growth of rime, glaze, icicles and wet snow on structures. Philos. Trans. R. Soc. Lond. Ser. A Math. Phys. Eng. Sci. 2000, 358, 2913–2939. [Google Scholar] [CrossRef]
- Jiang, S.; Ren, X.; Wu, J.R.; Huang, L. Research on algorithmic error analysis and model improvement technology of icing monitoring system in southern power grid. Power Syst. Big Data 2019, 22, 9–14. [Google Scholar]
- Finstad, K.J.; Lozowski, E.P.; Gates, E.M. A computational investigation of water droplet trajectories. J. Atmos. Ocean. Technol. 1958, 5, 160–170. [Google Scholar] [CrossRef]
- Han, X.; Jiang, X. Analysis of critical condition for dry and wet growth icing on insulators. Electr. Power Syst. Res. 2021, 192, 107006. [Google Scholar] [CrossRef]
- Sokolov, P.; Virk, M.S. Droplet distribution spectrum effects on dry ice growth on cylinders. Cold Reg. Sci. Technol. 2019, 160, 80–88. [Google Scholar] [CrossRef]
- Jiang, X.L. Transmission Line Icing Mechanism and the Three Gorges Region Icing Rule and Influence Factor Research. Ph.D. Thesis, Chongqing University, Chongqing, China, 1997. [Google Scholar]
- Zhang, J.; He, Q. Study on the influencing factors of the frozen coefficient under icing on the transmission lines. J. North China Electr. Power Univ. 2016, 43, 50–55. [Google Scholar]
- Yao, D.G.; Han, Y.X.; Liu, S.F. Analysis of the Causes of Transmission Line Ice-Covering Disaster and Forecasting and Early Warning Technology; China Meteorological Press: Beijing, China, 2022. [Google Scholar]

Disclaimer/Publisher’s Note: The statements, opinions and data contained in all publications are solely those of the individual author(s) and contributor(s) and not of MDPI and/or the editor(s). MDPI and/or the editor(s) disclaim responsibility for any injury to people or property resulting from any ideas, methods, instructions or products referred to in the content. |
© 2024 by the authors. Licensee MDPI, Basel, Switzerland. This article is an open access article distributed under the terms and conditions of the Creative Commons Attribution (CC BY) license (https://creativecommons.org/licenses/by/4.0/).