Abstract
(1) Background: The aim of this work was to characterize climatic evolution and change based on multicriteria classification through the dynamics of bioclimatic indices in viticulture across Italy and its regional administrative boundaries, focusing on latitudes and elevations. (2) Methods: This study analyzes climate change influences on Italian viticulture with reference to historical information (1991–2021) and future scenarios (until 2080) primarily based on the SSP2-4.5 and SSP5-8.5 scenarios, taking into account 13 GCMs. (3) Results: The bioclimatic indices have all shown a significant trend in the historical period, with an increase in temperature and a decrease in precipitation, reflecting their effects on the entire Italian territory with respect to the HI, up to 44° N for the CI, and up to 46° N for the DI, regardless of altitude. The future scenarios highlighted a shift towards the warmer classes of the two temperature-based indices (HI and CI) for both SSPs, especially for altitudes up to 900 m a.s.l. The DI-based classification based on the DI remained relatively stable in Italy over time, although DI values will become increasingly negative in the near future. (4) Conclusions: The climate in Italy is warming, especially in the south and in the coastal regions. By 2080, more areas will be “very hot” with “warm nights”. Drought will also increase and have a negative impact on viticulture. These findings spotlight the need for adaptive strategies in viticulture to hold satisfactory productivity under changing climatic conditions.
1. Introduction
Climate plays a fundamental role in shaping ecosystems and influencing human activities. Understanding climate variability and its possible future changes is fundamental to assess the potential impacts on different sectors such as agriculture, forestry, and water management. Viticulture is an important sector in the Italian agricultural landscape and contributes significantly to the country’s economy and cultural heritage [1,2]. However, Italian wine-growing regions are increasingly facing the challenges of climate change, which directly affects the physiology of the vine [3,4], the composition of the grapes [5], and ultimately the quality of the wine [6].
In this context, the classification of climatic zones based on bioclimatic indices provides valuable information on the spatial distribution of climatic conditions and their changes over time [7,8,9,10], describing in particular the suitability characteristics of an area for future quality viticulture.
Italy, known for its rich cultural heritage and diverse landscapes, can look back on a winegrowing tradition that goes back thousands of years. The country’s viticultural heritage is closely intertwined with its climate, which varies greatly from region to region due to the complexity of the territory, with a rich palette of climatic models ranging from the Alpine climate in the north to the Mediterranean climate in the south [11]. Italian wine regions are therefore characterized by different regional features that contribute to the diversity and quality of the wines. In the north, regions such as Piedmont and Trentino-Alto Adige have a cooler climate and hilly landscapes with significant diurnal temperature fluctuations, which promote the complexity of the grapes. In the central region, Tuscany is known for its rolling hills, Mediterranean climate, and iconic vineyards that produce renowned wines such as Chianti and Brunello di Montalcino. Further south, Sicily and Puglia experience a more Mediterranean climate with hot, dry summers and mild winters, where varieties such as Nero d’Avola and Primitivo produce powerful, fruity wines with a distinct terroir [12,13,14,15].
Currently, several bioclimatic indices are used to study and analyze the suitability of a region for viticulture, focusing on important climatic variables such as temperature, precipitation, evapotranspiration, and solar radiation [16]. In particular, Tonietto and Carbonneau [17] introduced a Multicriteria Climate Classification (MCC) that uses three bioclimatic indices simultaneously to assess the viticultural potential of a region. These indices are the Huglin index (HI) [18], the cool night index (CI) [19], and the dryness index (DI) [20]. The first two indices are based on temperature and are linked to the needs of the vines, the quality of the grapes (including sugar, color, and aroma), and the typicity of the wines. The DI, on the other hand, provides a water balance that takes into account precipitation and evapotranspiration and thus indicates the presence or absence of drought. So far, the bioclimatic characterization of Italy as a whole has been based on historical data on production and climate, but spatialization of bioclimatic data and future projections have been lacking [2]. Other studies focused on areas of local interest [21], on a regional scale [22], or on specific parts of the Italian territory in the broader context of the Mediterranean basin [23] or continental Europe [24].
The imminent risk of reaching a temperature increase of 1.5 °C in the near future, as reported by the Intergovernmental Panel on Climate Change [25], highlights the far-reaching and worsening impacts of climate change based on climate-based emissions scenarios. The background Shared Socioeconomic Pathways (SSPs) formulate five future climate projections: SSP1-1.9 (very low greenhouse gas emissions), SSP1-2.6 (low greenhouse gas emissions), SSP2-4.5 (intermediate greenhouse gas emissions), SSP3-7.0 (high greenhouse gas emissions), and SSP5-8.5 (very high greenhouse gas emissions). Specifically, the IPCC reports that the 1.5 °C target will be reached or exceeded between 2021 and 2040, and in the case of a high-emissions scenario, this threshold could be reached earlier, i.e., today. Even worse would be very high greenhouse gas emissions under a carbon-intensive pathway (SSP5-8.5), in which global warming could rise to 3.3–5.7 °C by the end of the century.
The influence of climate change on viticulture at a global level is a topic that arouses interest and concern, mainly due to the repercussions and consequences for the wine world [6,10,26]. The effects of this temperature rise could, for example, lead to a loss of 29% of biodiversity, which could be catastrophic in the case of Italian wine regions as they are historically tertiary centers of vine domestication [27]. This biodiversity represents a real reservoir of genes useful to face the new challenges of climate change. These challenges range from the selection of genotypes that are predominantly resistant to water and heat stress to those that exhibit late maturation to mitigate the excessive shortening of phenological phases and the advance of ripening [28].
Predicting future precipitation patterns, especially in the Mediterranean regions known as climate change hotspots, is a greater challenge than predicting temperature [29]. The precipitation diplomacy observed at the end of the 20th century [30] is expected to continue due to future warming in the high-emissions scenario, especially in summer over land areas, with the exception of the northern Mediterranean in winter [31]. In any case, there will be an increase in extreme drought events alternating with abundant rainfall, which will lead to water scarcity or, conversely, floods in spring, resulting in an increase in parasite and disease infestations and influencing the quality of the wine [32]. However, especially in areas subject to desertification [33], such as most of southern Italy, the precipitation rate does not always compensate for the increasing negative effects of temperature on the evapotranspiration demand of the vine [34], leading to an increasingly negative soil–water balance [35], which directly influences the calculation of the DI and its temporal and spatial variation.
In this study, we investigate the dynamics of bioclimatic indices in viticulture, focusing on key indices such as the HI, CI, and DI across Italy. These indices provide valuable information on the suitability of wine regions and the ripening potential of grape varieties. Furthermore, we evaluate the expected impact of climate change on viticulture in Italy by analyzing the SSPs, in particular SSP2-4.5 and SSP5-8.5, up to the year 2080.
2. Materials and Methods
2.1. Study Area, Climate Historical Data, Future Scenarios, and Bioclimatic Indices
This study was conducted on all the national territory of Italy. The Italian territory is classified into 6 climatic zones (Figure 1) on the basis of the Heating Degree Days index (HDD) [36], defined as the accumulation of all the positive differences between the daily mean outside temperature (Te) and an internal set point temperature equal to 20 °C during the whole heating period. The formula is:
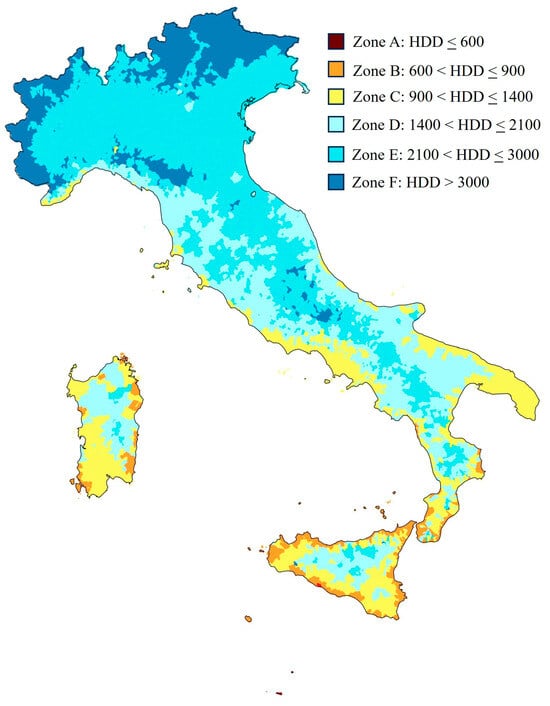
Figure 1.
Map of Italy representing climate zones based on HDD.
The only territories classified as zone A, not appreciable for size in the figure, are the islands of Lampedusa and Linosa, with a latitude around 35° N, further south than Tunis and Hammamet in Tunisia. Zone B can be found in almost all coastal zones of Sicily, Sardinia, and south Calabria, representing approximately 2% of Italian territory. The coastal zones of Apulia, Campania, and a substantial percentage of southwest Sardinia and Sicily are classified as zone C, representing around 12.5%. Zone D covers around 20% of Italy and is located in the pre-Apennine elevations. Most of Italy is classified as Zone E (around 53%), representing all the Apennines and the Po Valley. The coldest, zone F, is relegated to the Alps, the Gran Sasso and Maiella mountains in Abruzzo, and the northern part of the Apennines that divides Tuscany from Emilia Romagna, representing more than 12% of Italy.
Data were retrieved for a 5 km × 5 km point grid covering all the national Italian territory, for a total of 12,931 points. The historical (1991–2021) and future scenarios (2021–2080) series of monthly Tmax, Tmin, and precipitation were retrieved from https://www.worldclim.org with a resolution of 2.5 min. The site provides data downscaled according to CMIP6 using WorldClim v2.1 as the baseline climate [37]. Historical Potential EvapoTranspiration (Penman–Monteith) (PET-PM) was retrieved from https://surfobs.climate.copernicus.eu/dataaccess/access_eobs_indices.php, (accessed on 6 June 2024) (E-OBSv25.0e), while PET-PM for future scenarios was calculated by CROPWAT 8.0 [38] on the basis of retrieved temperatures. For future scenarios, two Shared Socioeconomic Pathways were considered, SSP2-4.5 and SSP5-8.5, and an ensemble of climatic data were provided based on all the 13 available General Circulation Models (GCMs) at worldclim.org: ACCESS-CM2, BCC-CSM2-MR, CMCC-ESM2, EC-Earth3-Veg, FIO-ESM-2-0, GISS-E2-1-G, HadGEM3-GC31, INM-CM5-0, IPSL-CM6A-LR, MIROC6, MPI-ESM1-2-HR, MRI-ESM2-0, and UKESM1-0-LL. Future scenarios data were averaged with an interval of time windows of 20 years: 2021–2040, 2041–2060, and 2061–2080. Tmin, Tmax, precipitation, and PET-PM were utilized to calculate the Huglin index (HI), the cool night index (CI), and the dryness index (DI) (Table 1).

Table 1.
Bioclimatic indices considered and class partitioning.
2.2. Historical Trends of Bioclimatic Indices in Italy
Historical trends for the HI, CI, and DI were analyzed with the Mann–Kendall test and the trend significance calculated with Sen’s slope after having subdivided the whole Italian area by latitude (<40.00°; 40.01°–42.00°; 42.01°–44.00°; 44.01°–46.00°; >46.00°) and elevation (<300 m; 301–600 m; 601–900 m; >900 m a.s.l.).
2.3. Geostatistical Interpolation Techniques
Regression-kriging (RK) [39] was performed for spatial interpolation of the bioclimatic indices. This interpolation is a non-static geostatistical method which utilizes linear or multiple regression analysis of auxiliary information spatially correlated, in this case the elevation of each point, to reduce interpolation errors in the case of spatialization of the bioclimatic indices. The elevation was considered by means of a Digital Elevation Model (DEM) raster, downloaded from https://www.worldclim.org at a resolution of 30 s. Leave-one-out cross validation (LOOCV) [40] (Stone 1974) was performed for each grid point for the validation of the predicted bioclimatic indices in both the historical and future scenarios. The reliability/accuracy of the kriging model was verified with the normalized root-mean-square error (NRMSE) between the calculated and interpolated bioclimatic indices and with the R2 of the model (Table S1). The interpolation procedure by means of kriging and the cartographic rendering were conducted with SAGA GIS software (System for Automated Geoscientific Analyses) version 2.3.2 and QGIS version 3.16.11, respectively. A flowchart of the analytical process is reported in Figure 2.
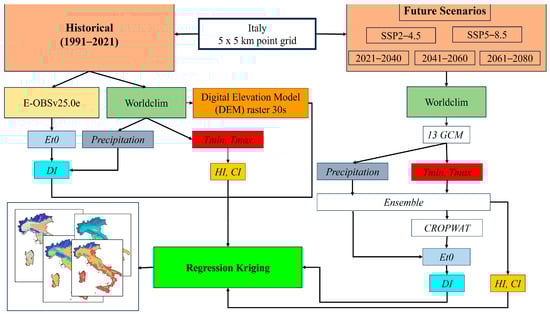
Figure 2.
Flowchart of data download procedures and related processing.
3. Results
3.1. Historical Data
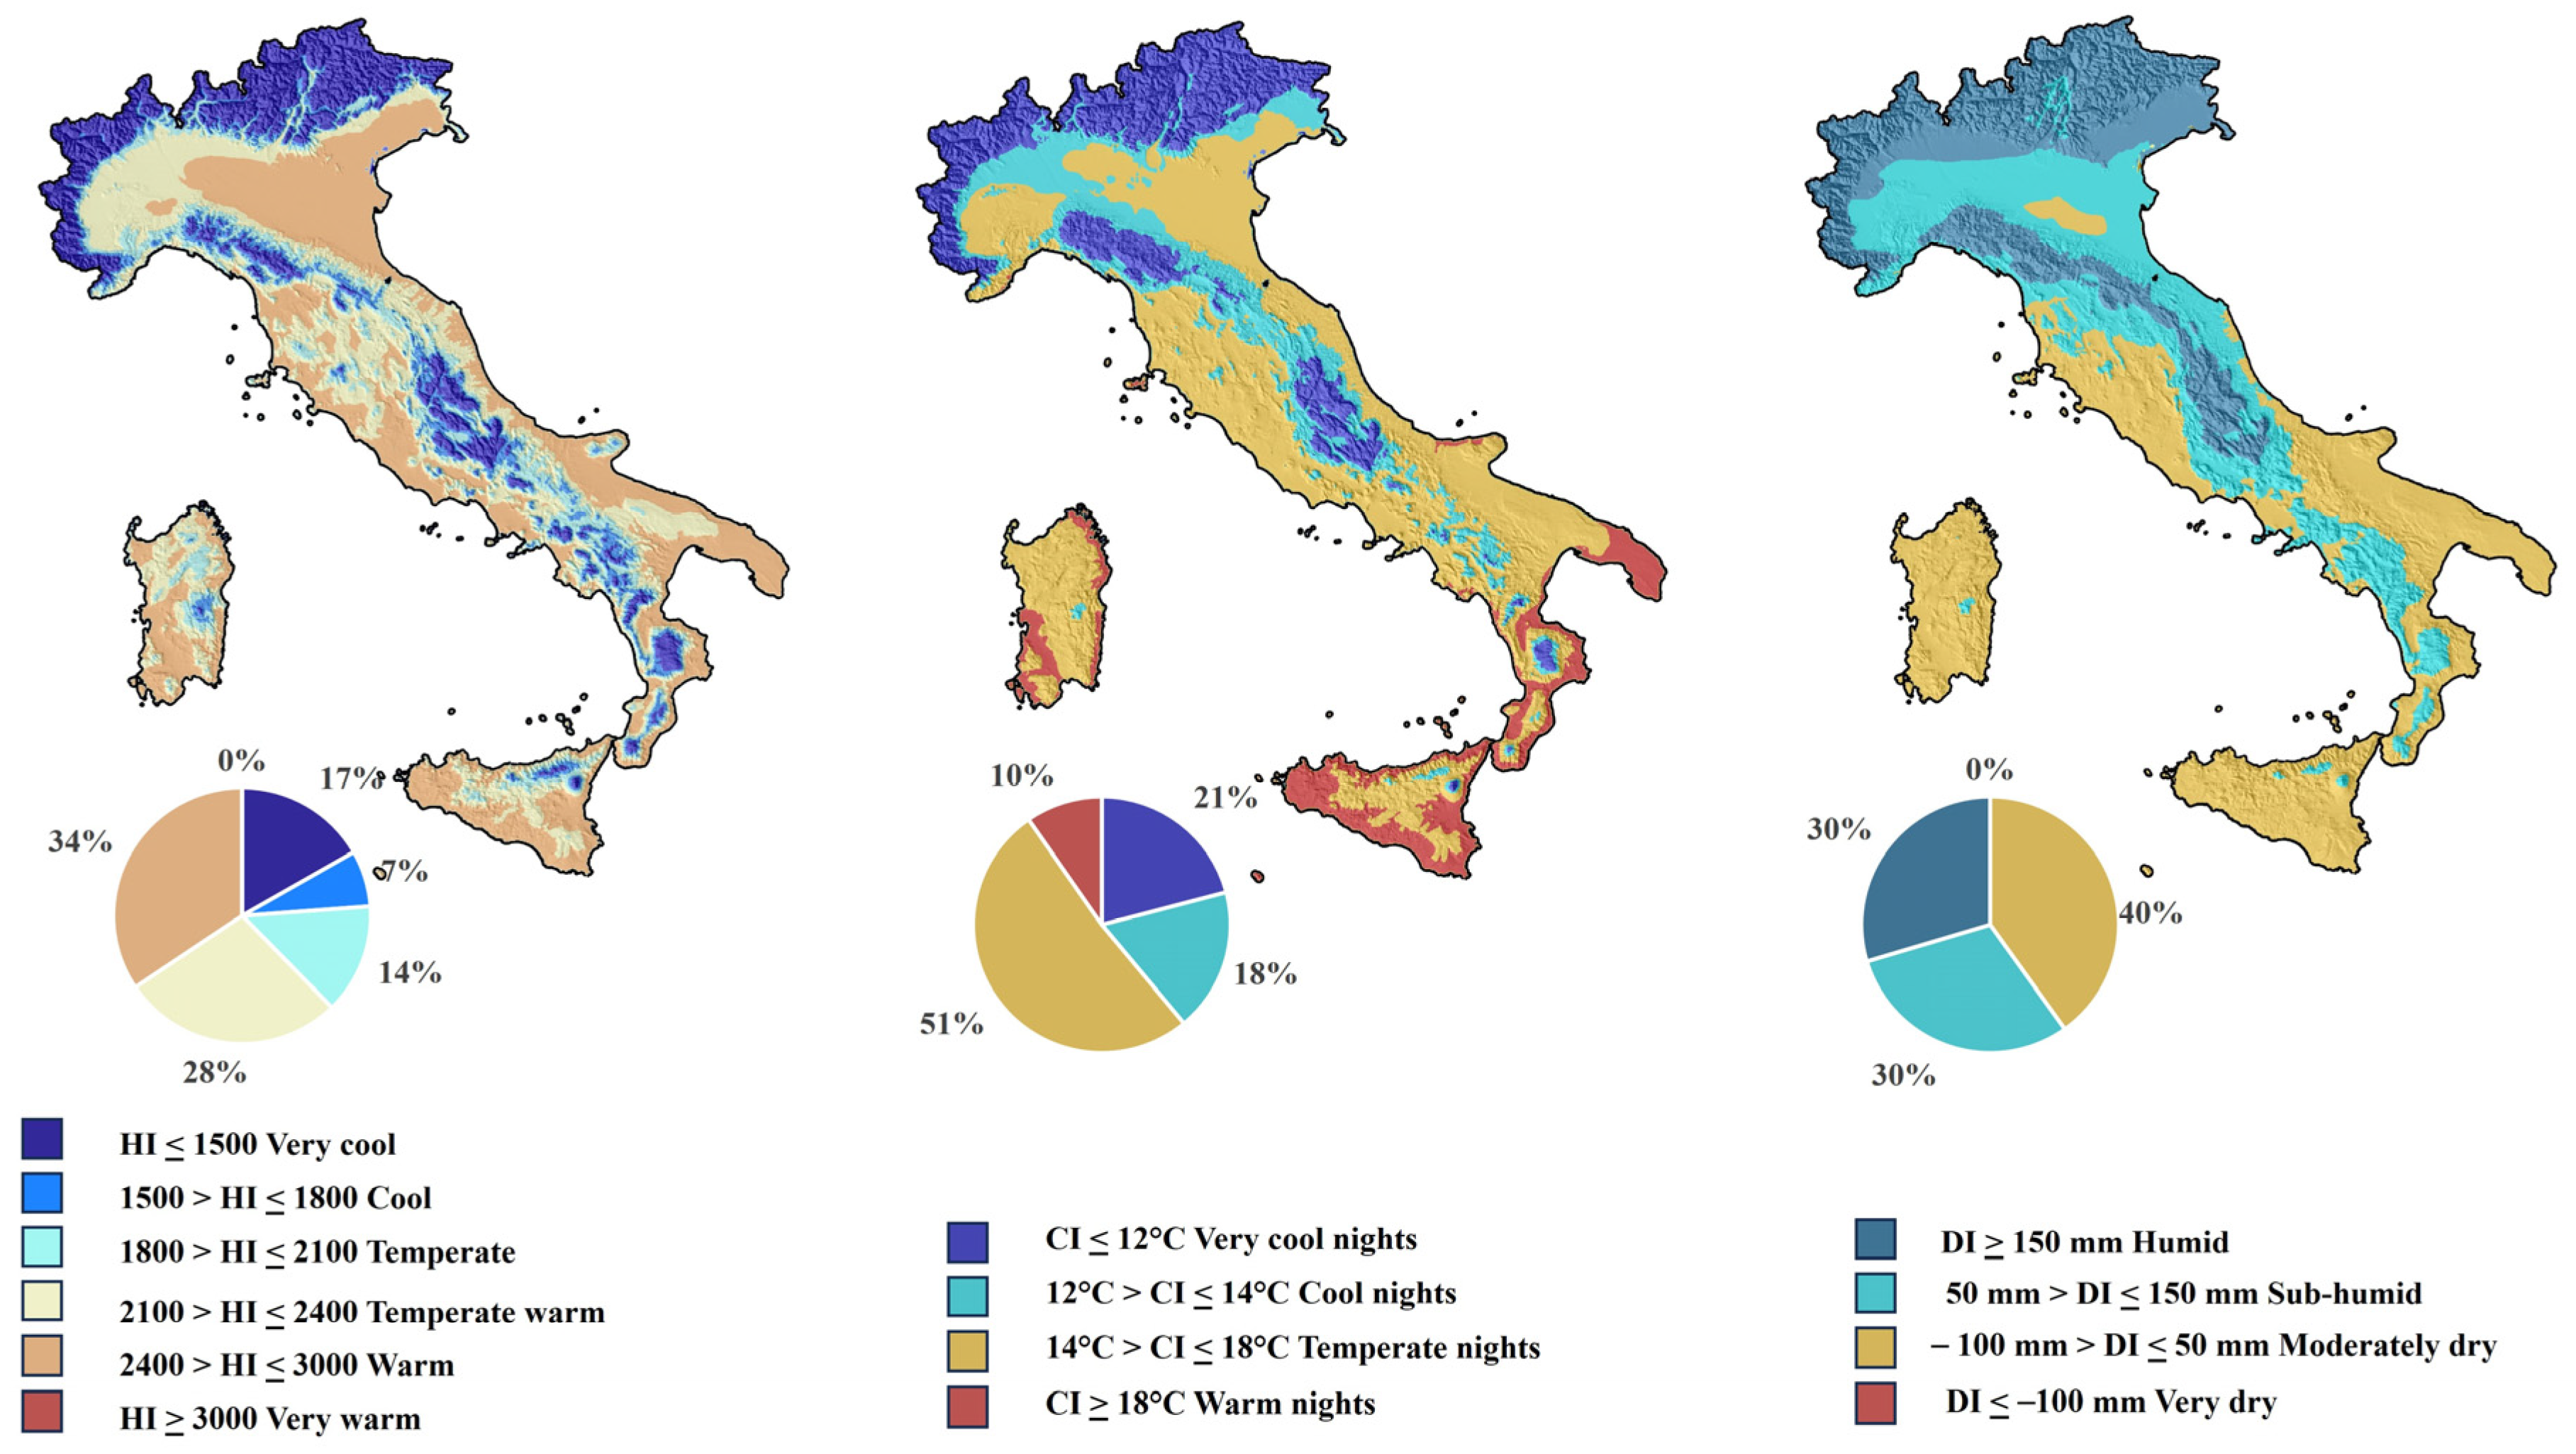
Figure 3 shows the Multicriteria Climate Classification (MCC) based on three indices: the Huglin index (HI), the cool night index (CI), and the dryness index (DI) for the Italian territory using historical data from 1991–2021. Figure 4, Figure 5 and Figure 6 show the average MCC of the three indices for the Italian territory based on elevation and latitude, while Table S2 presents the MCC on a regional basis. The results regarding the spatial distribution of the HI (Figure 3) classified Italy predominantly as “temperate warm” (28%) and “warm” (34%). The regions most frequently classified on average as “temperate warm” were Marche, Piedmont, and Umbria, with 45% or more of the regional territory. The areas classified as “warm” were mainly located along the Italian coasts and in large parts of Apulia, Calabria, Sicily, and Sardinia in the south and in Emilia Romagna, Friuli Venezia Giulia, and Veneto in the north, with percentages around 50% of the territory and even of 70% in Apulia (Table S2). In terms of latitude and elevation, all the areas up to 300 m a.s.l. and up to 46° N were classified as “warm”, while this class was not recorded further north than 46° N. The “temperate warm” class mainly covered the foothill regions of the Alps and the Apennines, including the major islands such as Sardinia and Sicily, with 300–600 m a.s.l. elevations below 44° N and 0–300 m a.s.l. beyond 46° N (Figure 3).
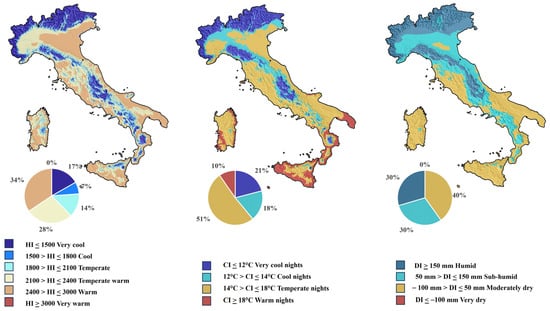
Figure 3.
Spatial distributions of Huglin index (HI), cool night index (CI), and dryness index (DI) in Italy during the historical period (1991–2021).
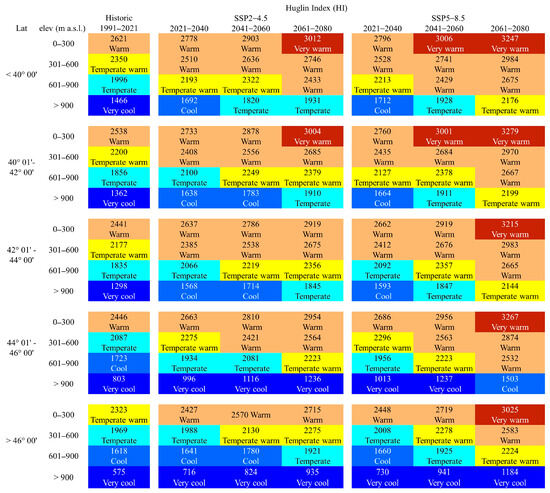
Figure 4.
Huglin index classification of Italy during the historical period 1991–2021 and future scenarios SSP2-4.5 and SSP5-8.5 in 2021–2040, 2041–2060, and 2061–2080 by latitude and elevation.
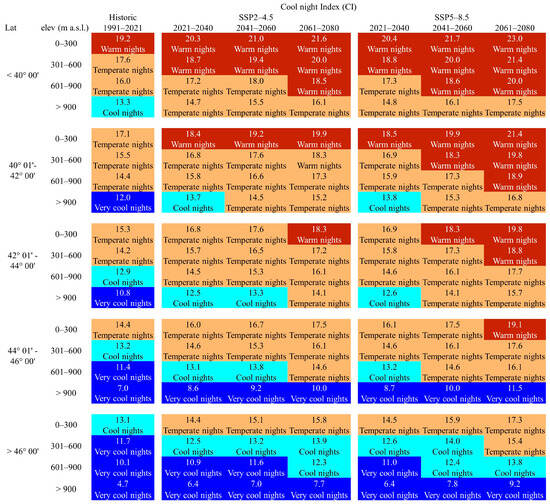
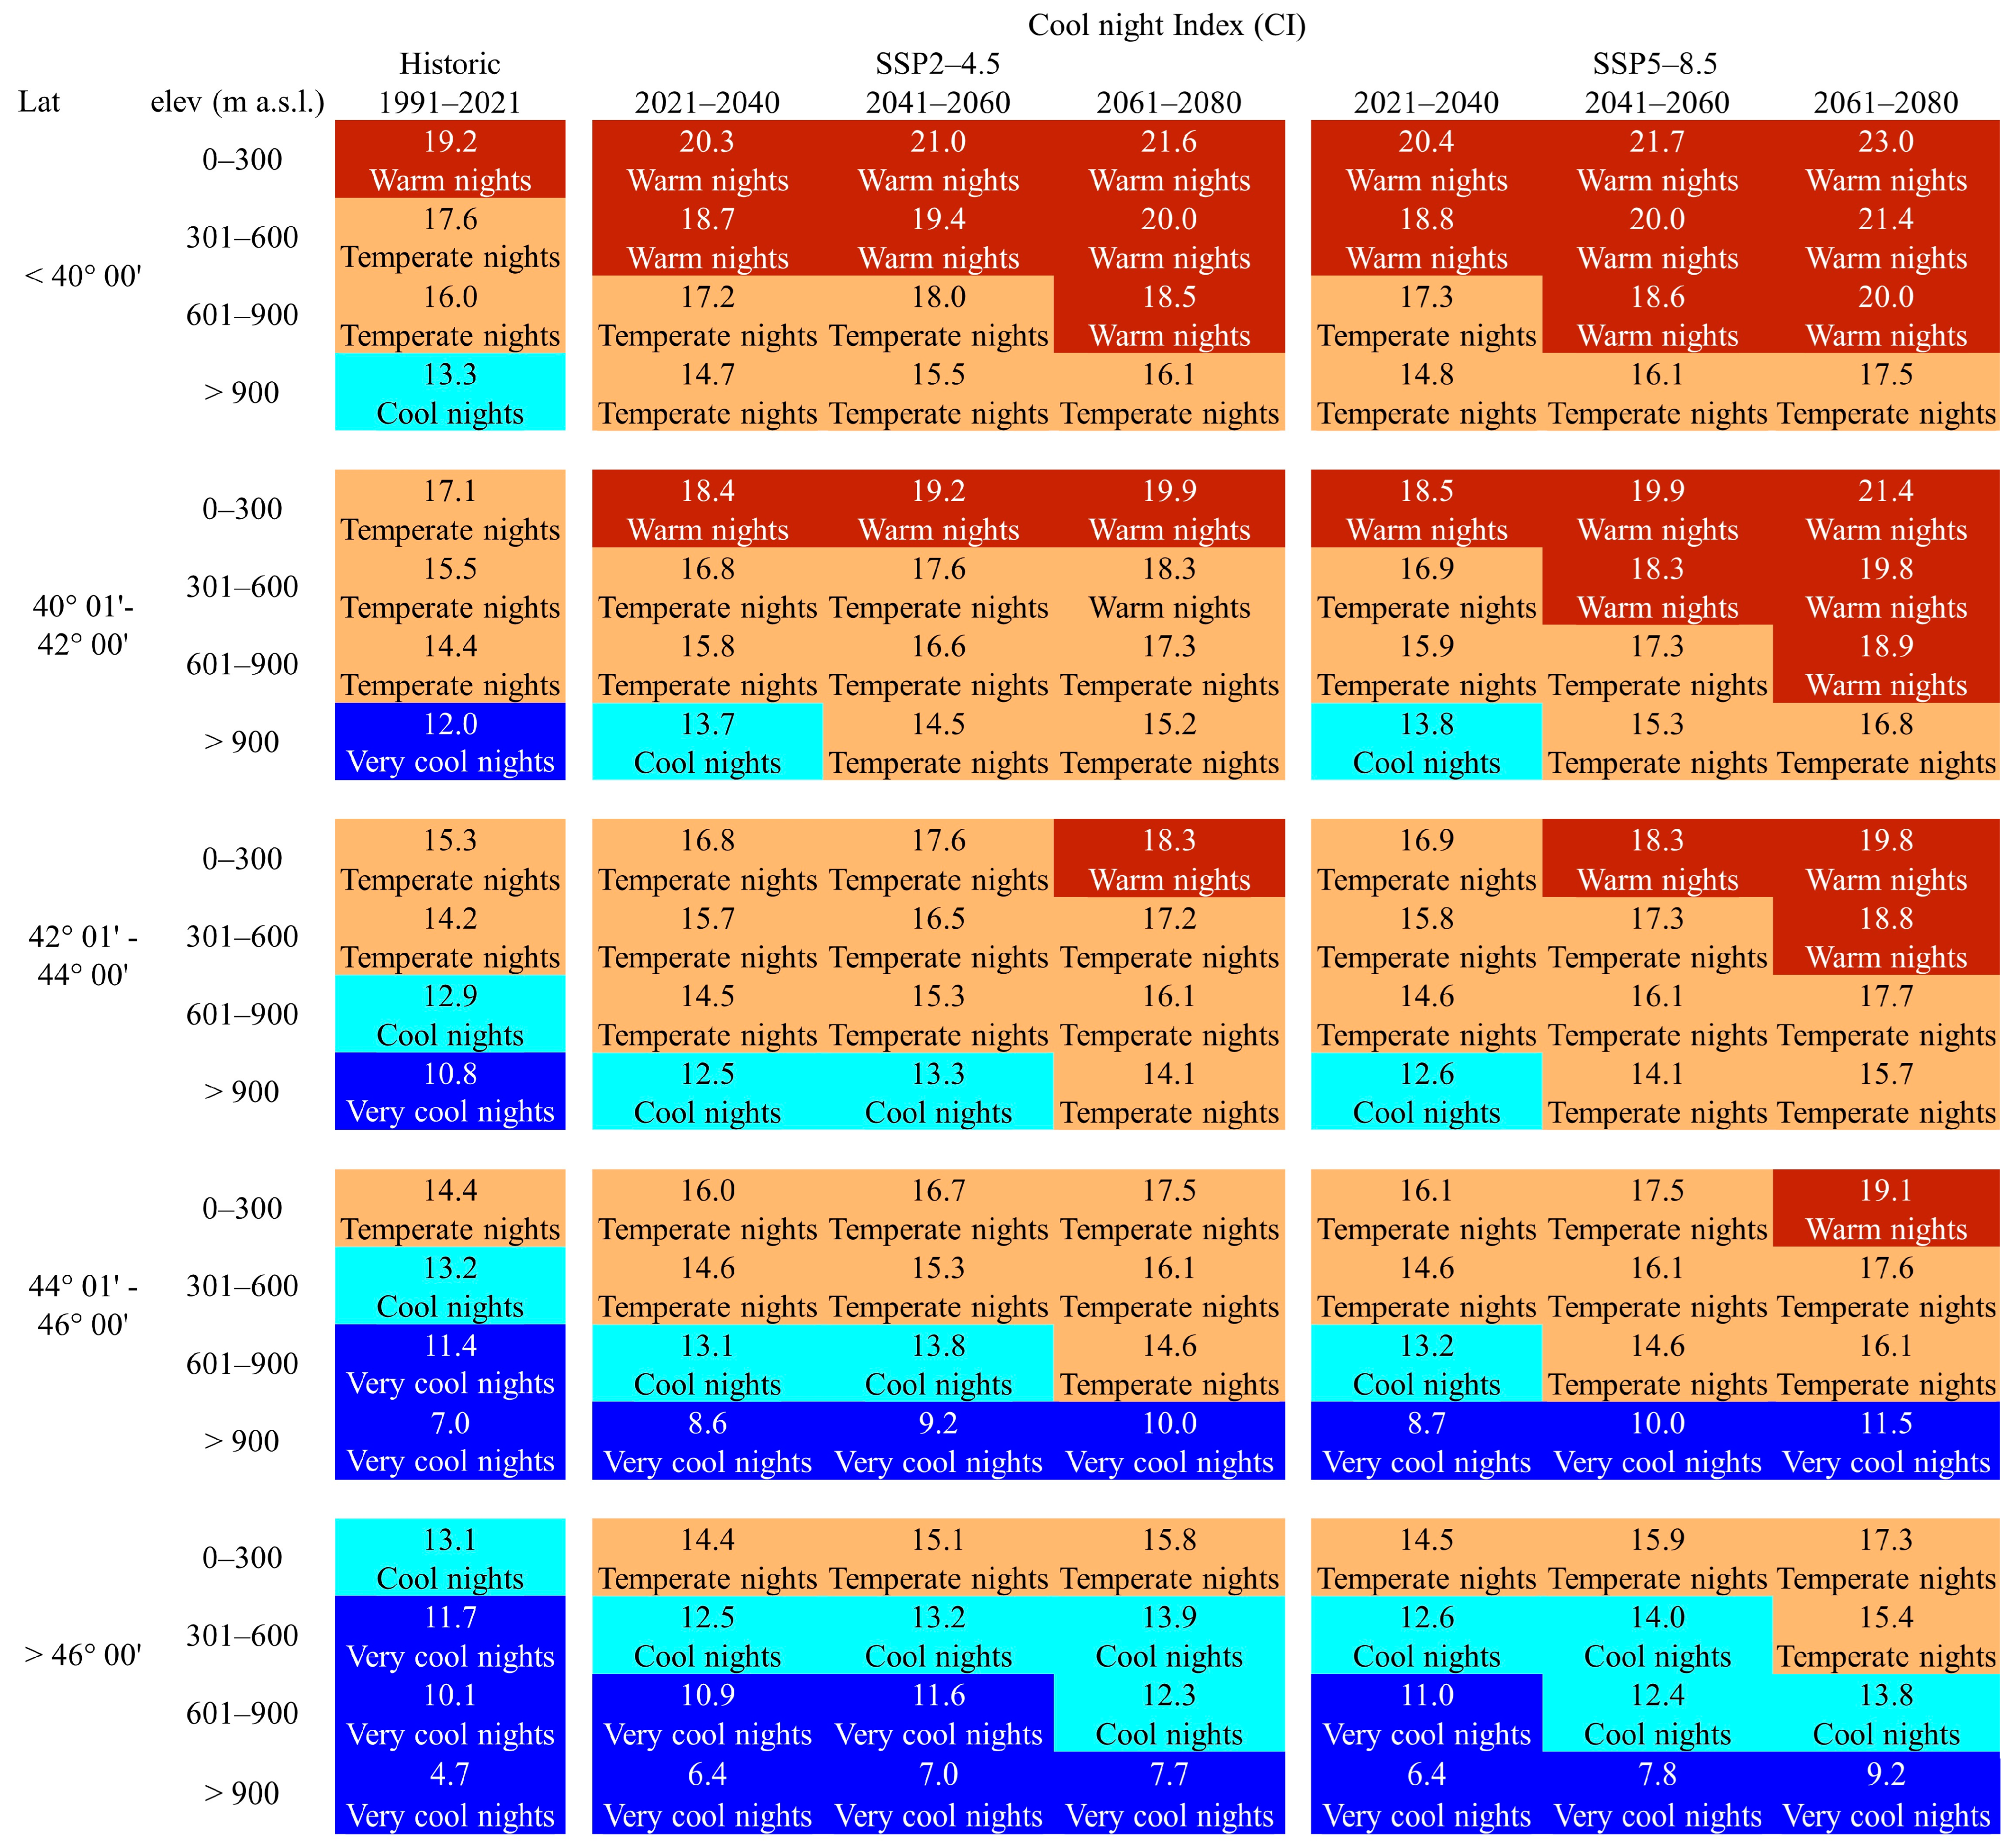
Figure 5.
Cool night index classification of Italy during the historical period 1991–2021 and future scenarios SSP2-4.5 and SSP5-8.5 in 2021–2040, 2041–2060, and 2061–2080 by latitude and elevation.
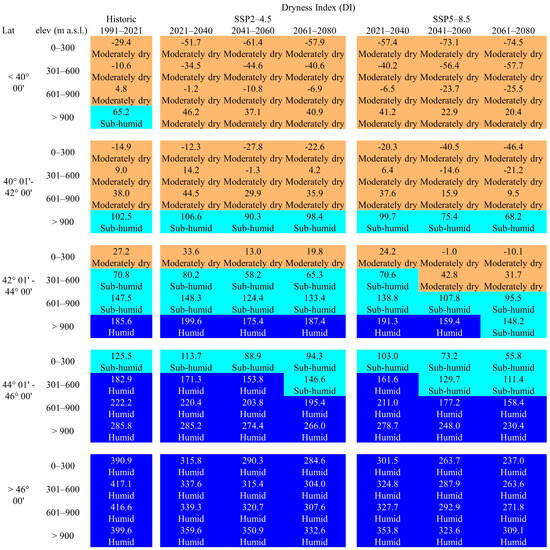
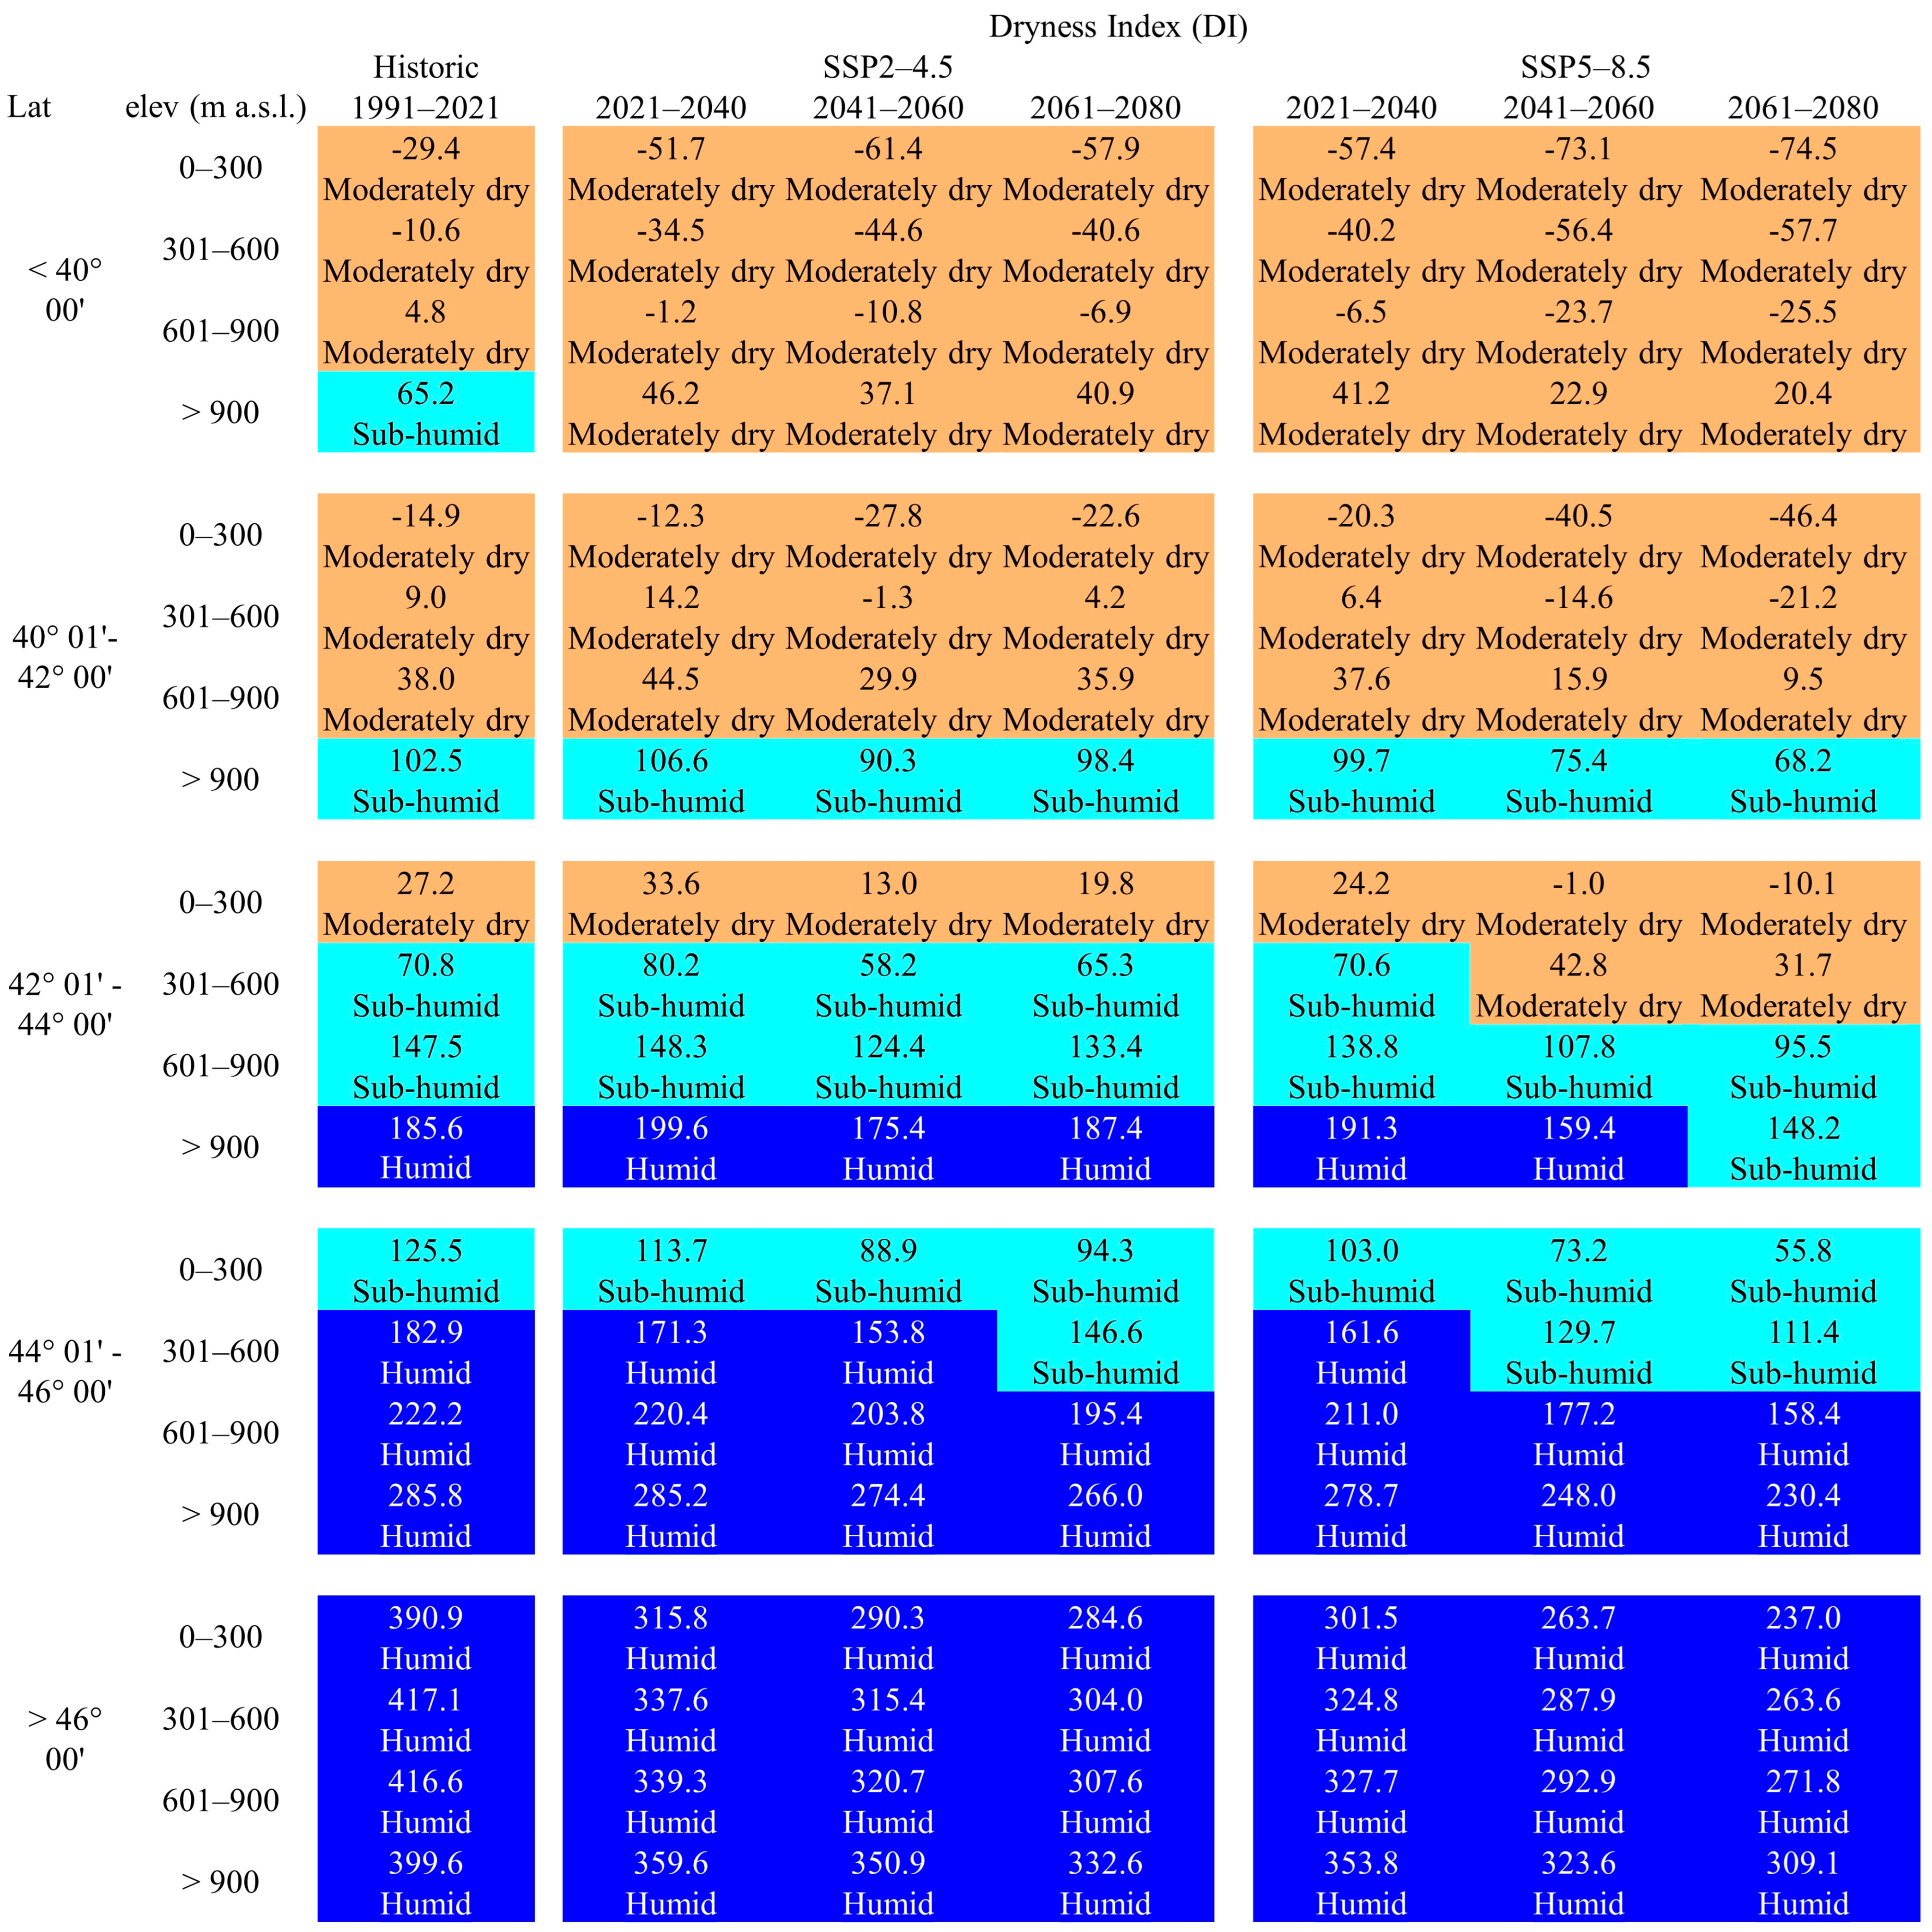
Figure 6.
Dryness index classification of Italy during the historical period 1991–2021 and future scenarios SSP2-4.5 and SSP5-8.5 in 2021–2040, 2041–2060, and 2061–2080 by latitude and elevation.
As for the CI (Figure 3), the predominant class for the Italian territory was the “temperate nights” class (51%), with Basilicata, Campania, Lazio, Puglia, Sardinia, and Tuscany the most representative, with at least 60% of the regional area (Table S2). A further 10% of Italy, mostly concentrated in the south, was classified as “warm nights”. South of 40° N, the areas with elevation up to 300 m a.s.l. were classified as “warm nights” (Figure 5) and were mainly found in southern Apulia (25% of the regional territory), Calabria (43%), Sicily (56%), and Sardinia (23%). Beyond 40° N, no altitudinal or longitudinal band was found to be “warm nights”, while the class “temperate nights” was found up to 900 m a.s.l. and up to 42° N, 600 m a.s.l. at 42°–44° N latitude, and 300 m a.sl. at 44°–46° N. Further north than 46° N, only “cool nights” and “very cool nights” were observed.
Regarding the average DI in the period 1991–2021 (Figure 3), Italy had not yet experienced extreme drought conditions (“very dry” class), being mostly classified as “moderately dry” (40%). The entire foothills of the Apennines and the Po Valley were classified as “sub-humid” (30%) and the remaining 30% as “humid”, especially in the Alpine region. The regions most frequently classified as “moderately dry” were Apulia, Sicily, and Sardinia for most, if not all, of the region (Table S2). Figure 6 shows how the altitudinal bands up to 900 m a.s.l. and below 42° N were classified as “moderately dry” on average, while at 42°–44° N the elevation was reduced to 300 m a.s.l.. However, the “sub-humid” strips were found above 900 m a.s.l. up to 42° N, an elevation that drops to 300 m a.s.l. at 42°–44° N and even reached sea level at 44°–46° N. Above 46° N, however, the area was classified as “humid” on average at all elevations.
On the basis of historical trends (Table 2), a clear and significant increase in the HI at all latitudes and elevations was observed. In particular, the significant increase also occurred beyond 46° N even at elevations higher than 900 m a.s.l., accounting for 78.5% of the territory. The CI trends increased significantly up to 44° N, while no significant increase was recorded at higher latitudes. Similarly, the DI trends were statistically significant below 46° N, while further north, due to greater water availability and less solar radiation at higher latitudes resulting in lower Et0 values, a substantially stable situation occurred over the years without any significant trend.
Table 2.
Mann–Kendall and Sen’s slope for historical trends (1991–2021) of Huglin index, cool night index, and dryness index by latitude and elevation in Italy.
3.2. Future Scenarios
Figure 7, Figure 8 and Figure 9 illustrate the evolution and spatial distribution of the HI, CI, and DI on the Italian territory based on two Shared Socioeconomic Pathways (SSPs), SSP2-4.5 and SSP5-8.5, for the periods 2021–2040, 2041–2060, and 2061–2080.

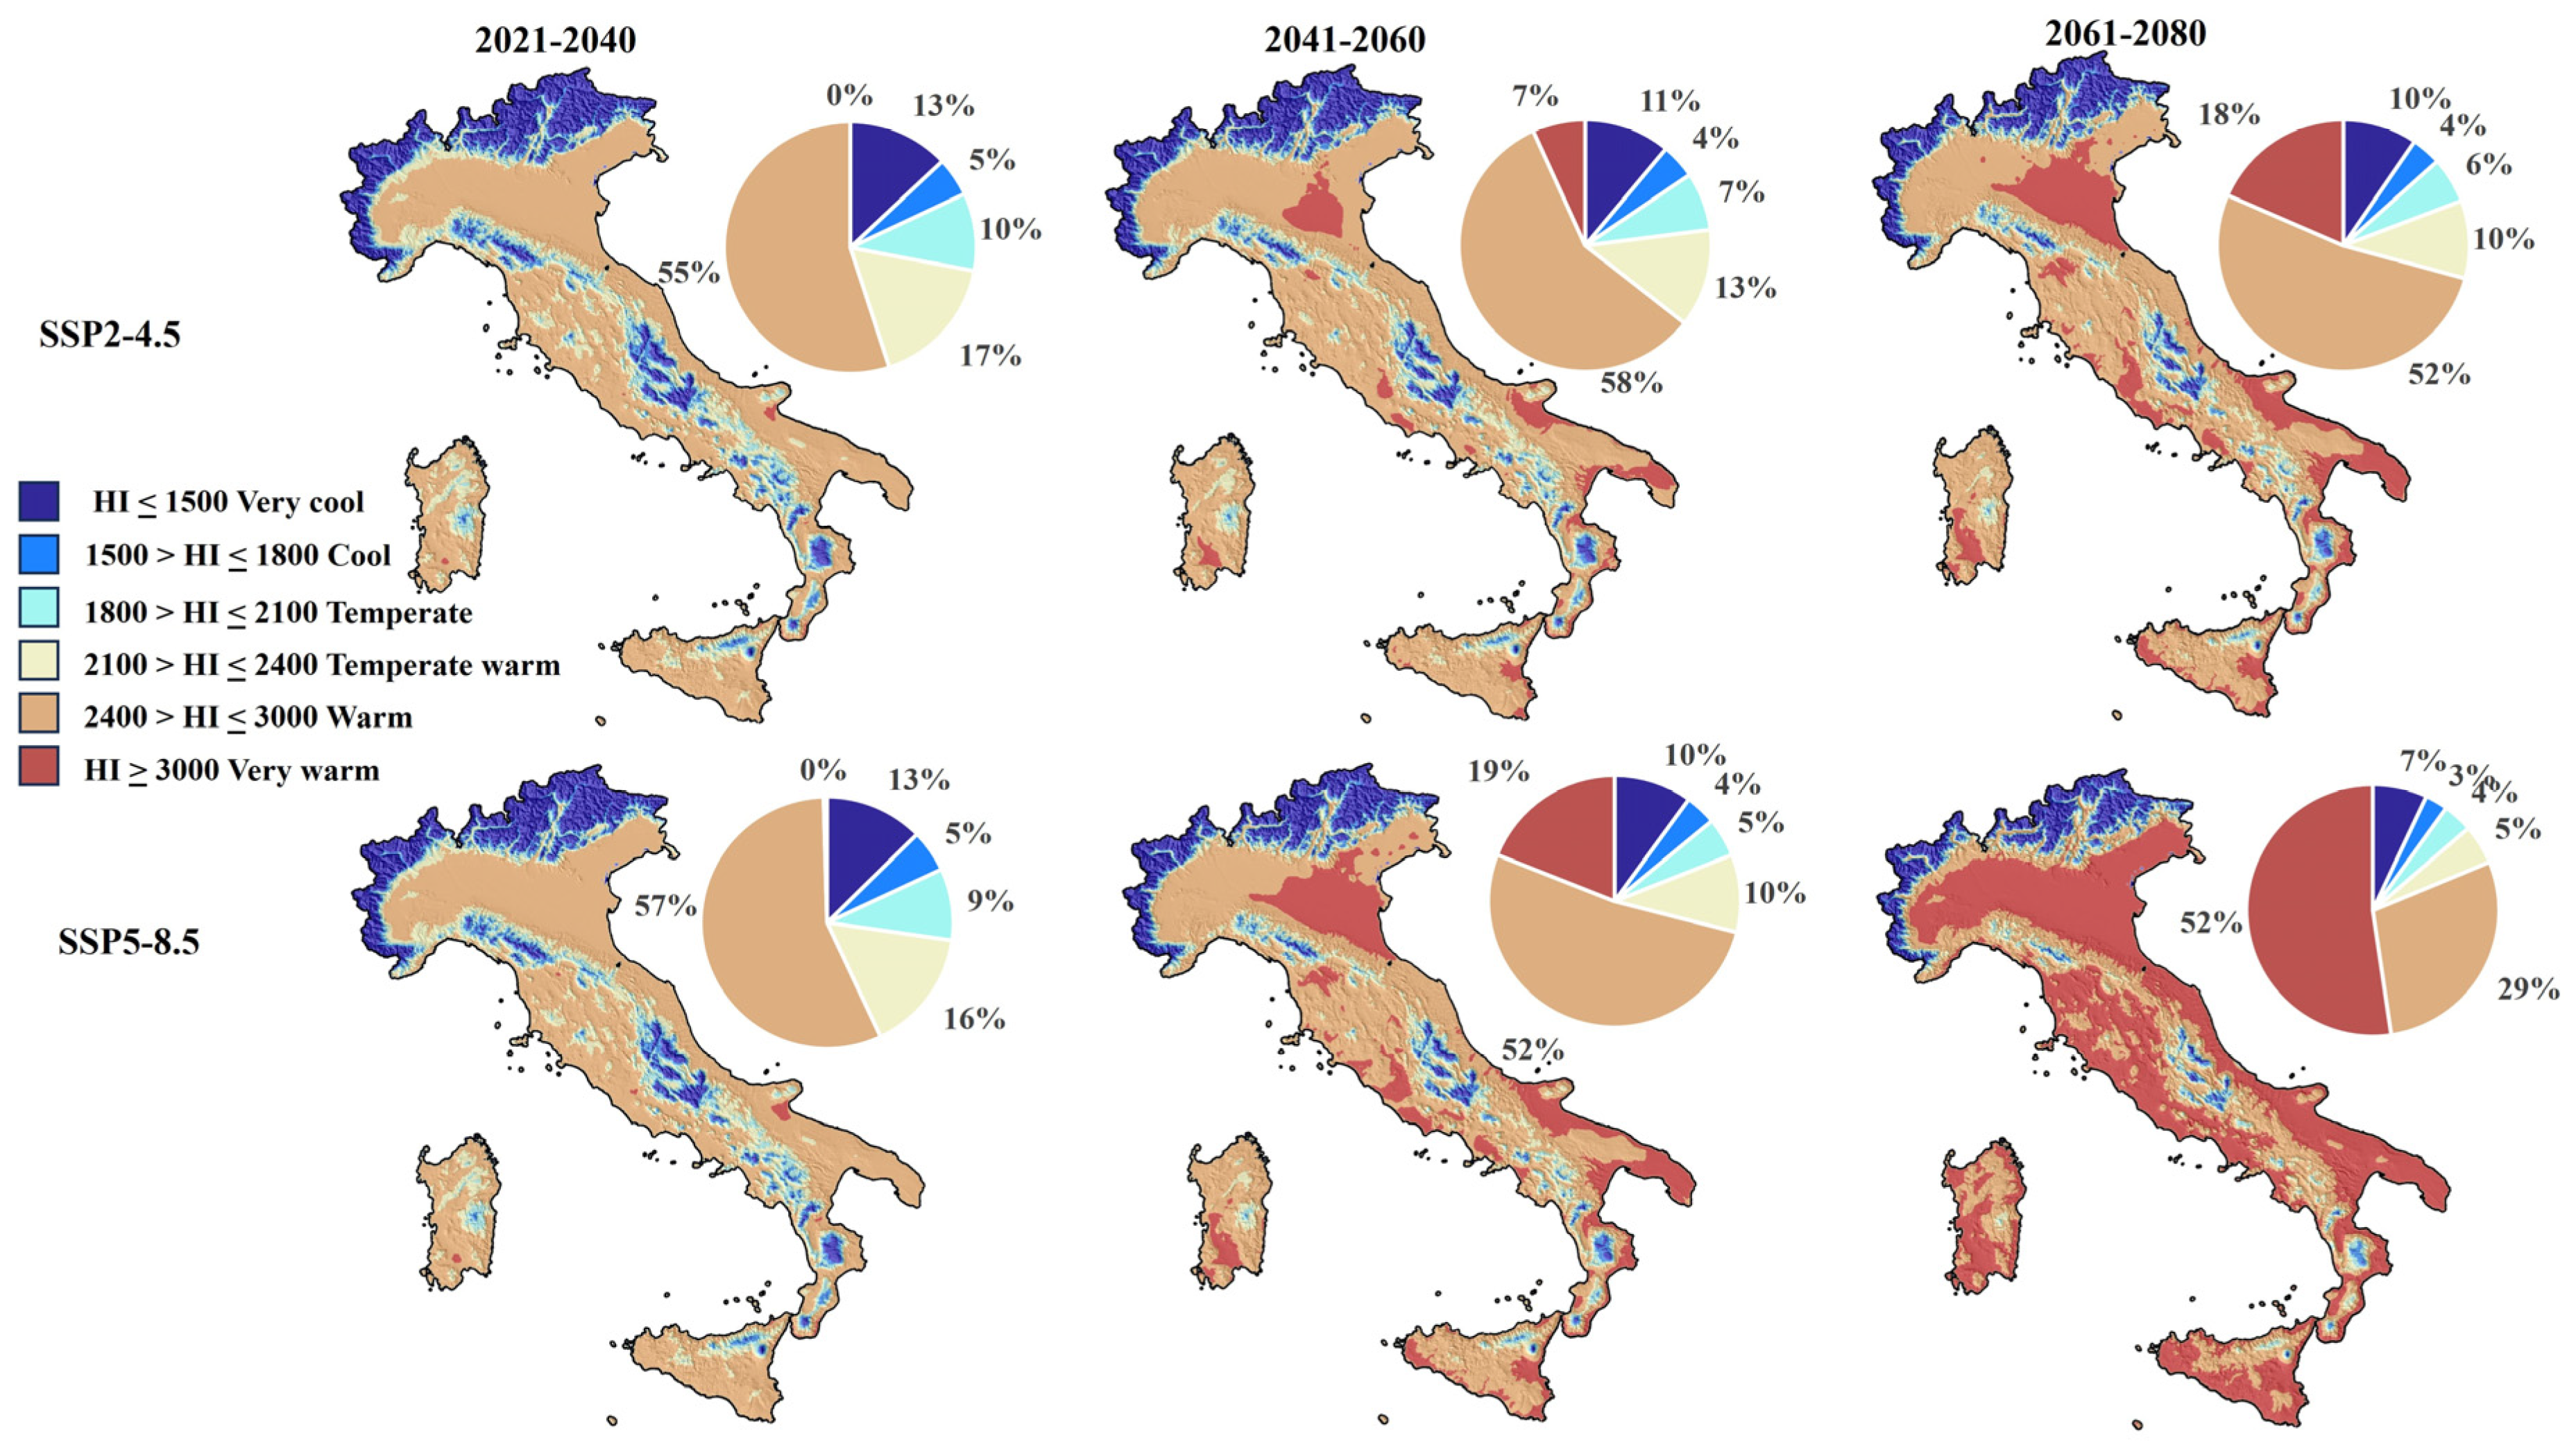
Figure 7.
Spatial distributions of Huglin index (HI) in Italy in future scenarios SSP2-4.5 and SSP5-8.5 in 2021–2040, 2041–2060, and 2061–2080 and percentage classifications.
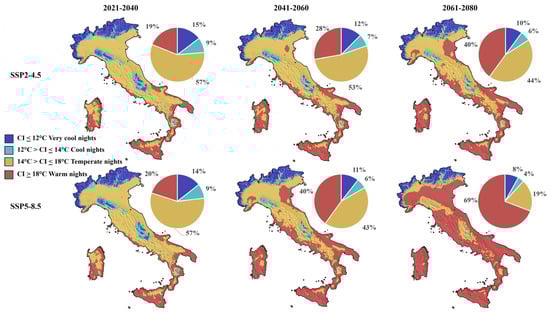
Figure 8.
Spatial distributions of cool night index (CI) in Italy in future scenarios SSP2-4.5 and SSP5-8.5 in 2021–2040, 2041–2060, and 2061–2080 and percentage classifications.
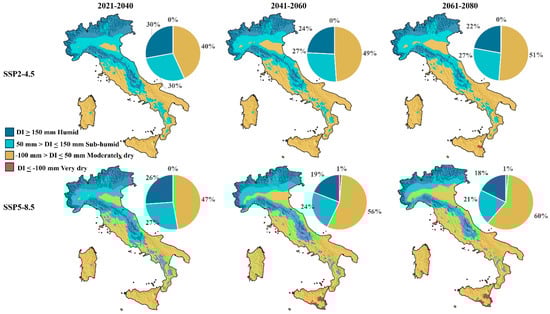
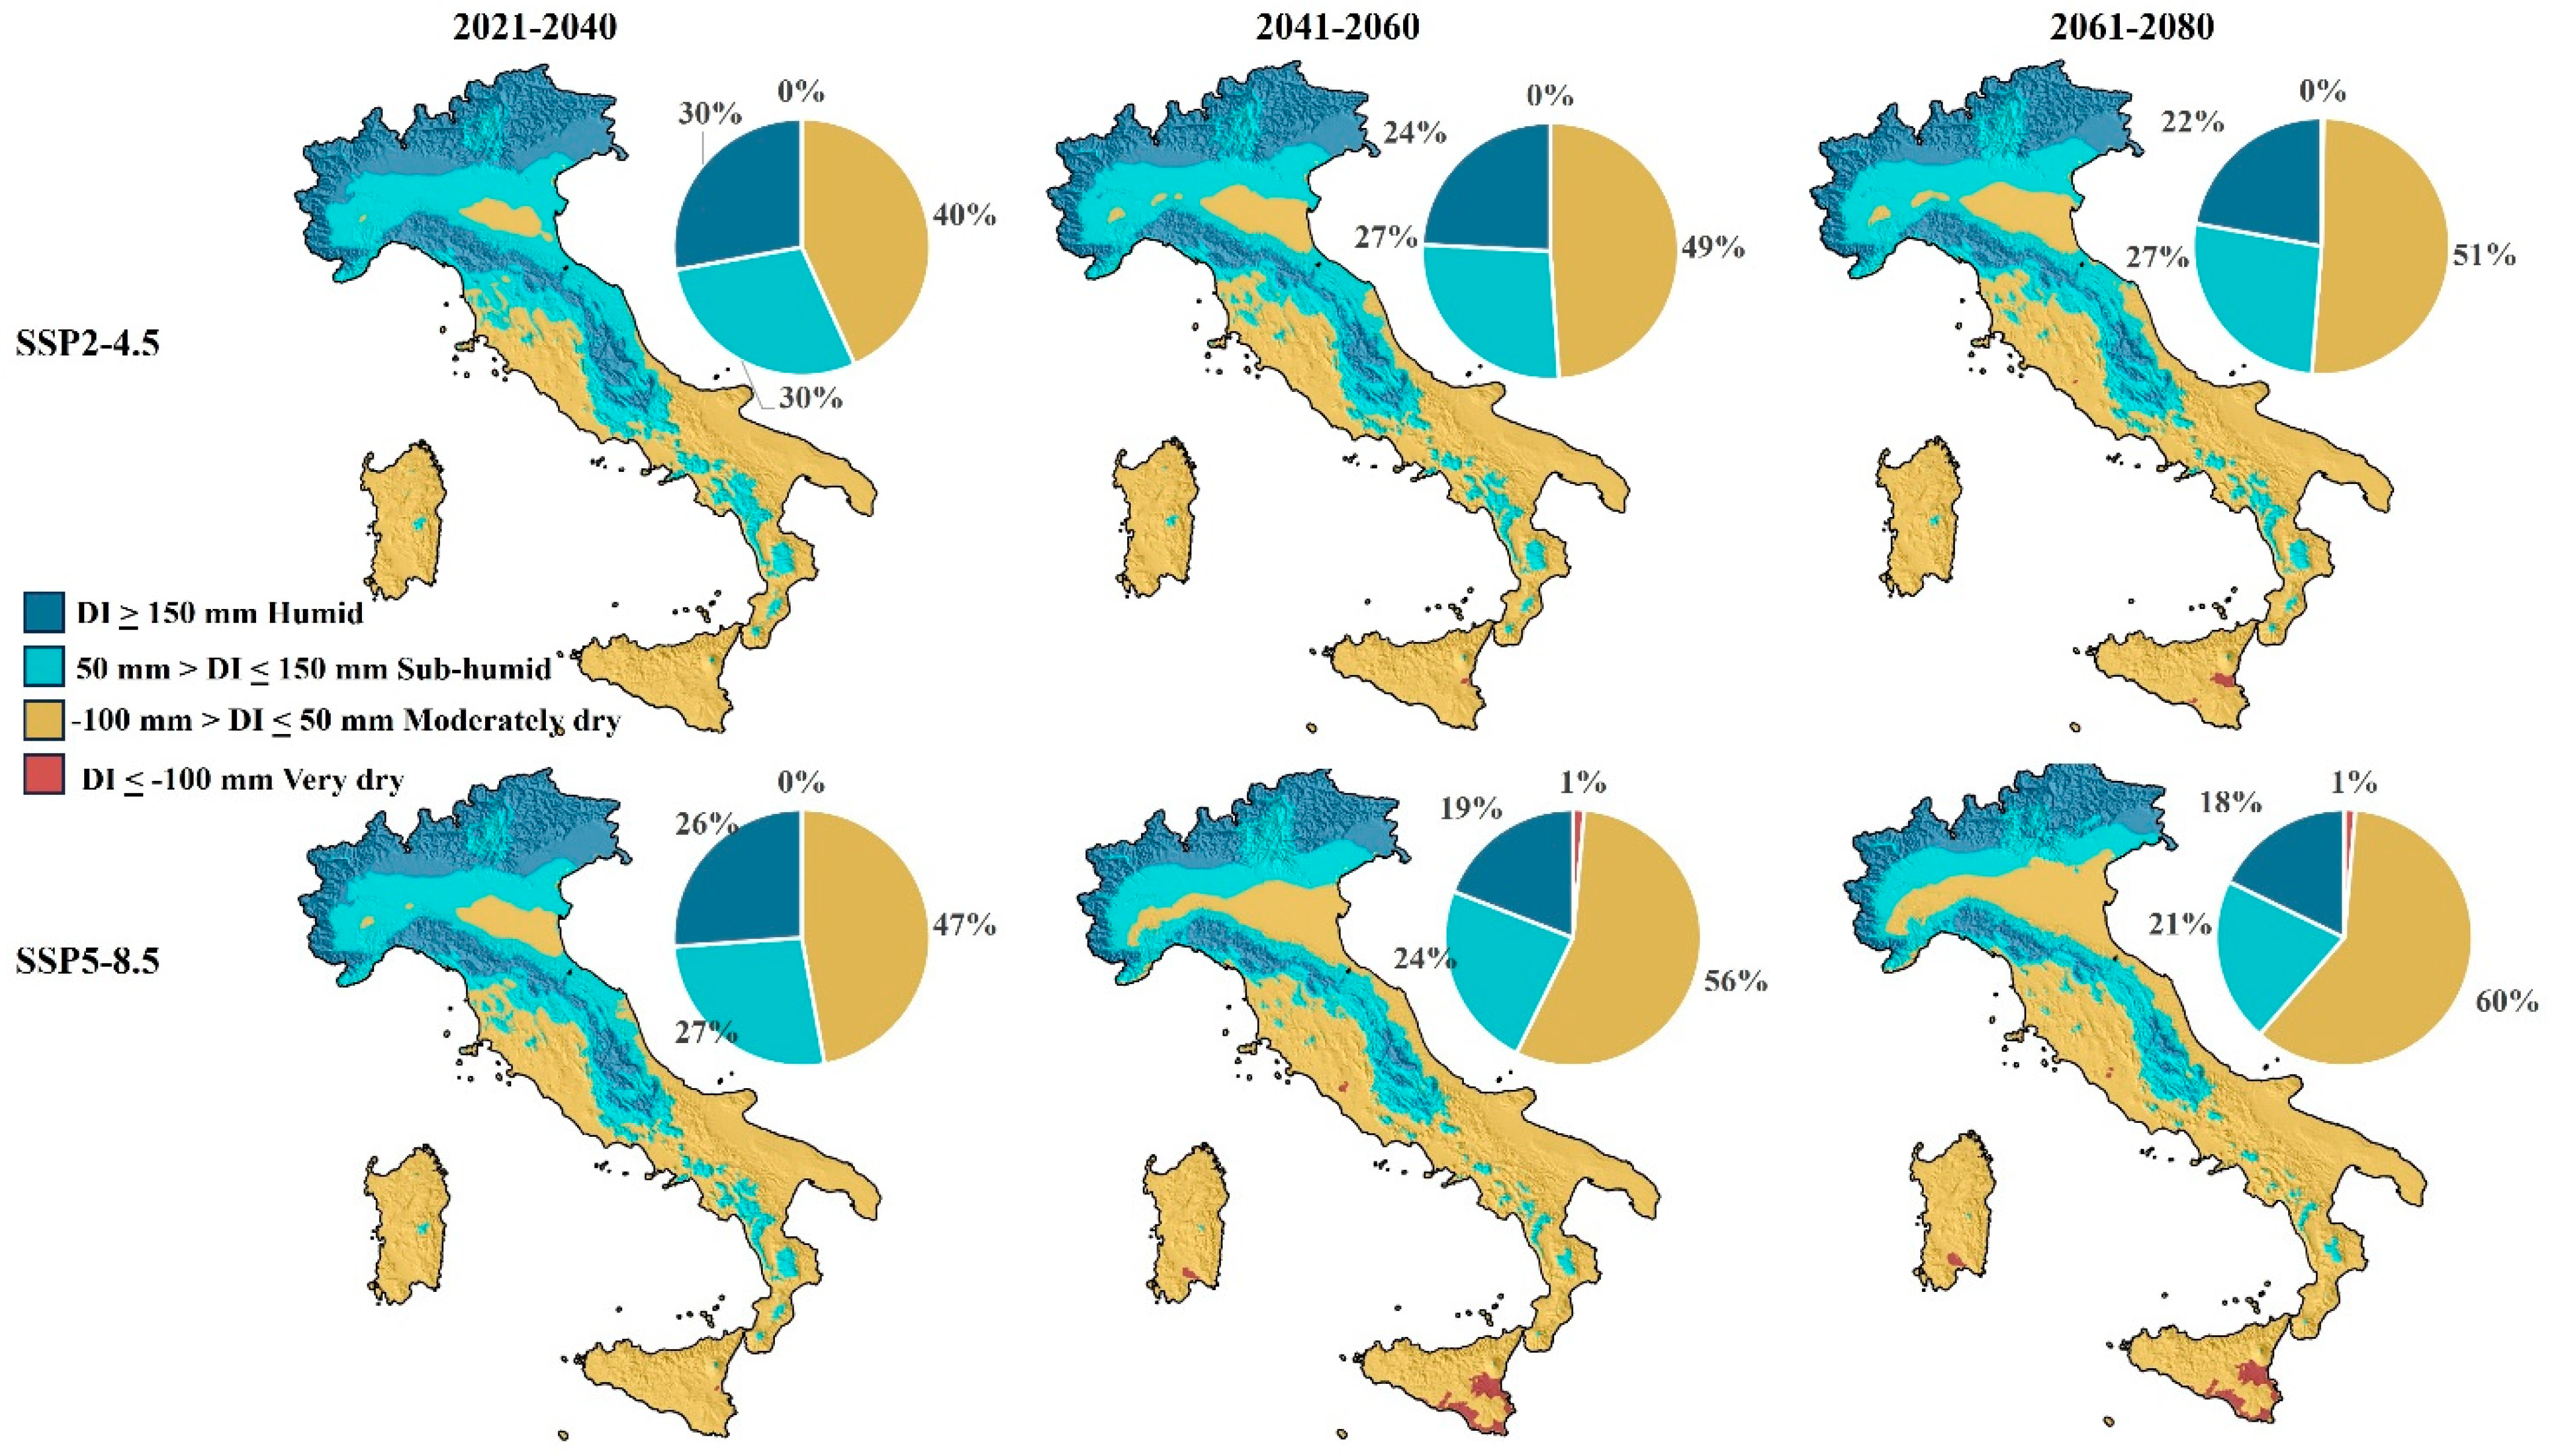
Figure 9.
Spatial distributions of dryness index (CI) in Italy in future scenarios SSP2-4.5 and SSP5-8.5 in 2021–2040, 2041–2060, and 2061–2080 and percentage classifications.
Figure 7, referring to the HI index, describes an essentially similar situation for the two SSPs considered in the first twenty years, 2021–2040, with the percentage of areas classified as “warm” being the most widespread, while those classified as “very warm” are practically non-existent. For both SSPs, the differences compared to the historical period 1991–2021 remained limited (Figure 4), also in terms of percentage distribution of the various classes on a regional scale, with the southern regions still leading the ranks of the hottest regions in both SSPs (Table S2). The first differences between the two SSPs appeared in the following period, 2041–2060, with the emergence of areas classified as “very warm”: 7% for SSP2-4.5 and 19% for SSP5-8.5. The areas most affected by this increase in the HI were the Ionian-Salentian Arc and the Capitanata in Apulia, the Po Valley, and some coastal areas in Lazio, as well as the two largest islands, Sardinia and Sicily. For SSP5-8.5 in particular, areas with elevations below 300 m a.s.l. at latitudes below 42° N moved into the “very warm” class (Figure 4). In particular, in the twenty-year period 2041–2060 in SSP2-4.5, 9 out of 20 regions began to see areas classified as “very warm”, with a percentage of 34% in Puglia, followed by Emilia Romagna (21%) and Calabria (14%). In the worst-case scenario SSP5-8.5, areas were classified as “very dry” in 15 out of 20 regions, from 2% in Friuli Venezia Giulia to 61% in Puglia. The regions immune to the occurrence of the hottest class according to the HI remained Liguria, Marche, Piedmont, Trentino-Alto Adige, and Valle d’Aosta, with a predominantly mountainous area (Table S2). In 2061–2080, a shift towards warmer classes appeared more intense, reaching the “very warm” class for 18% of the national territory for SSP2-4.5 and even 52% of the national territory for SSP5-8.5 (Figure 7). In the latter case, the entire Italian territory with elevations below 300 m a.s.l. was classified as “very warm” (Figure 4).
A shift towards warmer classes could be observed at all latitudes and elevations, with the exception of the Alpine region (>46° N and 900 m a.s.l.), where the HI value almost doubled, but the classification remained “very cool”. Furthermore, in SSP5-8.5, 15 out of a total of 20 regions had an area classified as “very warm” (Table S2), while the regions where the mountain component predominates remained quite well preserved, in particular in Valle d’Aosta, Trentino-Alto Adige, and part of Piedmont. Figure 8 shows the spatialization of the CI for both SSPs under consideration and for the same twenty-year windows. The period 2021–2040 showed differences compared to the historical reference 1991–2021 (Figure 3) for SSP2-4.5, which practically doubled the percentage of the area that shifted to the “warm nights” class, from an average of 10% in the historical period to 19% in the period 2021–2040, with CI values > 18 °C in the same areas defined as warmer by the previous HI index, i.e., in most coastal areas of southern Italy, as well as in Calabria, Apulia, Sardinia, and Sicily, with 59%, 50%, 56%, and 77% of the territory classified as “warm nights”, respectively (Table S2).
SSP5-8.5 behaved similarly, with 20% of the territory classified as “warm nights”, with the same regions taking the lead. In both scenarios, below 40° N, the areas at an elevation up to 600 m a.s.l. were on average classified as “warm nights”, while the “very cool nights” class disappeared below 44° N (Figure 5). The situation got worse when analyzing the following twenty years, 2041–2060, in which the areas classified as “warm nights” rose to 28% (SSP2-4.5) and 40% (SSP5-8.5), with the warmest areas increasing in the north of the peninsula. In the milder SSP2-4.5 scenario, some regions reached percentages of “warm nights” areas of over 70% in Apulia, 68% in Calabria, and even 86% of the territory of Sicily and 78% in Sardinia (Table S2). In the worst-case scenario SSP5-8.5, 60% of the area classified as “warm nights” was encountered in almost all regions, except for Trentino-Alto Adige and Valle d’Aosta. The areas below 40° N were all classified as “warm nights” up to 600 m a.s.l. (Figure 5) and even up to 900 m a.s.l. in SSP5-8.5. Above 40° N, despite a constant increase in the CI over the years, the situation remained overall unchanged in the SSP2-4.5 scenario compared to the previous twenty years, 2021–2040, while in the SSP5-8.5 scenario, there were areas classified as “warm nights” at least up to 42° N and up to 600 m a.s.l. In addition, in this scenario, there were transitions to the “warm nights” class in areas between 0 and 300 m a.s.l. at 42°–44° N and to the “temperate nights” class, which extended above 900 m a.s.l. For the areas above 44° N, however, there were only a few deviations. The analysis of the following twenty years, 2061–2080, showed CI values > 18° on 40% of the area in SSP2-4.5 and 69% in SSP5-8.5. If in the first case the area classified as “temperate nights” was still 44%, this percentage dropped to 19% in scenario SSP5-8.5, a negligible area if we consider that in both scenarios, the percentage of the area that still retained climatic conditions for good viticulture decreased as soon as the areas with excessive elevation combined with the “cool” or “very cool nights” classes and cannot be considered suitable for viticulture. Also, in the case of the CI, as for the previous HI, the regions that succeeded in reducing the percentage of areas that switched to “warm nights” were those with predominantly mountainous areas such as Trentino-Alto Adige and Valle d’Aosta. In the SSP2-4.5, in particular, Apulia, Sicily, and Sardinia were classified as “warm nights” at a percentage of around 90%, while in SSP5-8.5, all the regions, excepting once again Trentino-Alto Adige and Valle d’Aosta, experienced at least one-third of the regional area classified as “warm nights”, with values of 90% and more in Campania, Apulia, Sardinia, and Sicily. However, other regions where a dramatic increase in the CI occurred towards “warm nights” were those in central Italy such as Lazio (81%), Tuscany (77%), Marche (81%), and much of the flat areas of the Po Valley in Emilia Romagna, Piedmont, Veneto, and Lombardy.
Figure 9 illustrates the situation for the DI, for which an essentially unchanged situation can be observed in 2021–2040 compared to the historical period 1991–2021 (Figure 3). The percentage of areas classified as “moderately dry” represented on average 40% of the national territory, reaching values of 43% and 47% in the two SSP2-4.5 and SSP5-8.5 scenarios, respectively. However, in some regions such as Apulia, Sardinia, and Sicily, almost the entire area was classified as “moderately dry” (Table S2). The area below 40° N was uniformly “moderately dry” for both SSPs, even at elevations above 900 m above sea level. (Figure 6), although this represents only 9.9% of the area in question (Table 2). In the areas north of 40° N, the situation was instead rather stable, with small decreases in DI values but no changes in classification. In the following twenty years, 2041–2060, the number of areas classified as “moderately dry” increased slightly, while, on the other hand, in Sicily “very dry” areas started to appear on 4% and 22% of the territory in SSP2-4.5 and SSP5-8.5, respectively (Figure 9). Furthermore, all regions increased the percentage of areas shifted to the drier classes, and in SSP2-4.5, Emilia Romagna (+30%), Marche (+23%), Tuscany, and Veneto (+14) were the most affected. In scenario SSP5-8.5, Emilia Romagna was still 66% “moderately dry” (+26%), followed by Liguria (+21%) and Marche (+25%) (Table S2). With regard to the latitude and elevation bands (Figure 6), there have been few changes compared to the previous twenty years if we exclude the areas with elevations up to 600 m a.s.l., which, in SSP5-8.5 between 42° N and 44° N, changed from “sub-humid” to “moderately dry” and between 44° N and 46° N from “humid” to “sub-humid” in both SSPs. Finally, as far as the last twenty-year forecast period, 2061–2080, is concerned, Figure 6 for SSP2-4.5 showed a situation broadly comparable to that of the previous twenty-year period for SSP2-4.5, while in SSP5-8.5, the increase in “moderately dry” areas reached 60% of Italy, and at the same time, the “very dry” areas remained limited to a total of 1% of the country, concentrated mainly in lower Sicily (22% of the regional territory—Table S2).
4. Discussion
This work illustrates the spatialization of the bioclimatic indices the Huglin index, the cool night index, and the dryness index for the purpose of an MCC of the Italian territory both for the historical period 1991–2021 and for the future scenarios SSP2-4.5 and SSP5-8.5 for the time windows 2021–2040, 2041–2060, and 2061–2080.
The increase in temperature in the Mediterranean basin, with a consequent increase in the values of the bioclimatic indices based on these, has already been reported in other works [9,41]. Huglin’s positive growth trend based on historical data is also consistent with Santillán et al. [42], who have also shown that this trend is confirmed in the future until 2100 based on RCP6.0, which represents a middle ground between the two SSPs considered in this work. Similar to our paper, an average increase in the cool night index is expected by the end of this century in the same areas that we have identified as potential targets for a shift towards the warmer classes. Otherwise, however, as mentioned, the DI will tend to assume increasingly negative values but without shifting towards the “very dry” class. The same authors instead predict that most of the Italian territory will be classified as “very dry” by the end of the century, although the Standardized Precipitation Evapotranspiration Index (SPEI) was used as a bioclimatic indicator of the tendency towards drought instead of the DI.
As can be seen from the results, the differences between the two SSPs in the definition of the classification of the areas studied in the current twenty-year period do not appear to be significant. However, the analysis of the data illustrates how, from the twenty-year period 2041–2060, the differences between the two SSPs become evident. The gap between the two SSPs will widen further in the years 2061–2080 so that in SSP5-8.5 half of the Italian territory could be too hot for quality viticulture. SSP2-4.5 foresees an intensity of greenhouse gas emissions that, although defined as “intermediate”, would still lead to an average temperature increase of 2 °C for 2041–2060 [25]. It is considered the “most likely” future scenario, but other authors hypothesize that the SSP5-8.5 scenario is much more plausible than previously assumed [43]. In fact, the models used have underestimated, for example, the release of greenhouse gases resulting from permafrost thaw, which could help to bring current emissions in line with the worst-case scenario, i.e., SSP5-8.5 [44,45].
In this paper, we wanted to analyze Italy not only from a general point of view and on a regional administrative basis but also to deepen the analysis based on a subdivision by latitude and elevation, considering their importance in amplifying or mitigating the effects of the increase in temperature and of the decrease in precipitation. In particular, in the twenty-year period 2061–2080, the latitudes are also subject to the force of the increase in temperature, with the entire area below 300 m classified as “very warm” and “cold nights” up to 46° N and above.
A decrease in precipitation in the future seems to have less impact on the classification of areas for the DI, mainly because the width of the DI classes is quite large, such as the “moderately dry” class, which ranges from −100 mm to 50 mm. On the other hand, both the analysis of the historical trends of the DI (Table 2) and the future projections (Figure 5) show conditions that appear to be consistent over time for latitudes above 44° N and from 300 m above sea level.
However, it must be taken into account that precipitation, an essential component for the calculation of the DI, has greater spatial heterogeneity than temperature. Therefore, there may be large differences in the interpretation of precipitation changes in precipitation resulting from the choices made when summarizing and presenting the data [46]. Furthermore, projections, with respect to the precipitation from the GCM ensembles, can be subject to uncertainties, and conclusions should be drawn with caution as there is a large discrepancy between models, although a significant and consistent decrease in precipitation will affect the Mediterranean region in summer by the end of the 21st century [29].
To ensure the reliability of the results and as suggested by several authors [47,48,49,50], relying on a single GCM may be misleading or lead to an overestimation of the data. In our case, the 13 GCMs available on worldclim.org were considered simultaneously by creating an ensemble dataset. In addition, the data from the 13 GCMs were downscaled and calibrated using WorldClim v2.1 as the base climate (bias correction). Furthermore, Scafetta et al. [51], using the Equilibrium Climate Sensitivity (ECS) parameter to define the quality of a GCM, categorized 38 GCMs available in CMIP6 into three classes, low, medium, and high ECS, based on their accuracy and precision in back-projecting global mean surface warming. In our case and based on this classification, the GCM employed can be categorized as follows: two GCMs could be classified as high ECS (ACCESS-CM2, IPSL-CM6A-LR), five as medium ECS (BCC-CSM2-MR, ECS -Earth3-Veg, HadGEM3-GC31, UKESM1-0-LL, MRI-ESM2-0), four as low ECS (GISS-E2-1-G, INM-CM5-0, MIROC6, MPI-ESM1-2-HR), and two as unclassified (CMCC-ESM2, FIO-ESM-2-0). The IPCC 2021 [25] predicts an increase of 2° in SSP2-4.5 and 2.4 °C in SSP5-8.5 for the twenty-year period 2041–2060. However, if the presence of warming bias and therefore the GCM data are inaccurately downscaled, this could lead to an overestimation of warming if instead the predicted warming for 2040–2060 does not reach 2 °C even for SSP5-8.5 [51].
The global warming level approach has its limitations when variables that respond quickly to warming, such as temperature and precipitation, are taken into consideration since they show little dependence on the scenario. This is particularly the case when large-scale studies are conducted, while regional reanalyses, thanks to high-resolution models and local observations, represent climate extremes and variations better than global reanalyses [25].
Moreover, in our work, we have considered a 5 × 5 km2 grid of points, which inevitably cannot provide a resolution at the local level for our analyses as it aims to provide an overall view of the entire Italian territory. For studies with a higher level of detail, it would be necessary to limit the study areas and increase the density of the point grid
Apart from these considerations, however, it is a well-established fact that the increase in temperatures and the decrease in precipitation over the last 40 years have led to a shortening and shift in the phenological phases of grapes [6]. This trend is also confirmed by several authors for the future as we approach the end of the 21st century [52,53,54], with uneven values for the shortening of the overall cycle of the vine, especially depending on latitude and elevation and a reference value of about 3 days in advance per 100 m of elevation [12].
All this stated, the problem of climate change requires a search for solutions and strategies to mitigate the effects in viticulture. In the short term, single strategies to mitigate the effects of climate change have been pursued with the aim of protecting today’s vineyards from future warmer conditions [8,35]. This includes the ratio between leaf surface area and fruit weight through the introduction of training systems with higher trunk height such as the Tendone (horizontal pergola), which is often used in Apulia [55]. Rogiers et al. [56] summarized some other options. These include the use of later cultivars, rootstocks more resistant to stress induced by drought or heat waves, more efficient irrigation, delayed pruning, and row orientation. Some authors [57,58] performed late pruning at bud break both in Argentina and Spain and, despite preserving the yield, allowed bud break to be delayed by 10 days and a general delay in the whole phenological cycle duration, reducing the extent of evapotranspiration and consequently the drought stress of vines.
However, a rise of more than 2 °C, predicted by the IPCC 2022 [59] for the near future, would render the effects of any adaptation measures ineffective, at least in some areas, particularly in the regions of southern Italy [51]. Consequently, the concept of vineyard relocation will become more relevant than ever, often above 50° N and at higher elevations, as in the case of the United Kingdom, Germany, northern France, Belgium, and the Czech Republic, which will be or already are suitable for quality viticulture [60,61].
With regard to the Italian territory, it should be noted that various production requirements for DOC and DOCG wines provide for altitude restrictions in addition to administrative territorial limits, as in the case of Brunello di Montalcino DOCG (600 m a.s.l.), Montepulciano d’Abruzzo DOC (500–600 m a.s.l.), Nebbiolo d’Alba DOC (650 m a.s.l.), Chianti Classico DOCG (700 m a.s.l.), and Aglianico del Vulture Superiore DOCG (200–700 m a.s.l.) [62,63,64,65,66]. It would therefore be desirable to be able to modify the requirements of production by increasing the elevations authorized for the production of quality wines in the DOC administrative regions where this is possible due to their geographical characteristics. Additionally, as already mentioned, the comparison between the two SSPs reveals the greatest differences materialize in the twenty-year period 2061–2080, and for some regions they could even be more decisive than for others. In particular, the regions that cover the entire Po valley, Tuscany, and Friuli would still retain a good predisposition for quality viticulture in the case of SSP2-4.5, especially in relation to the HI and the CI. In the case of SSP5-8.5, however, the same regions would show a greater increase in excessively hot surfaces compared to SSP2-4.5. This would have consequences for the decline in the quality of wine grapes, especially white ones such as Müller-Thurgau, Pinot Gris, and Chardonnay, which fall under the various PDO specifications of the above-mentioned areas and which are considered to have moderate or low thermal requirements [67]. Even for some main black grape varieties such as Cabernet Franc, Merlot, or Sangiovese, the required average heat requirement would be reached too early compared to the whole vegetative cycle. The real risk is that these regions will soon have to change their production regulations, including new grape varieties that have significant heat requirements.
5. Conclusions
The results show that during the historical period, Italy was predominantly classified as “temperate warm” and “warm” based on the HI value, with a clear trend towards increasing temperatures, especially in the lower latitudes and elevations. This trend was more evident in the southern regions and coastal areas, while the northern mountain regions showed a less pronounced increase. Future scenarios showed further warming with an increase in the areas classified as “very warm” and “warm nights”, especially in the SSP5-8.5 scenario, where a large part of the Italian territory up to 300 m a.s.l. will fall into these classes by 2080. As for the DI, despite a decrease in precipitation, this change seems to have less impact on the classification than the other indices. However, in areas already classified as “moderately dry”, drought will see an increase, which will have an impact on water management and the sustainability of viticulture.
The wine regions will therefore have to adapt to significantly warmer climatic conditions, which could affect the quality and typicity of the wines. The possibility of having data region by region will allow us in the future to focus on specific areas and seek a more targeted approach mainly for those areas already identified as climate change hotspots like Sardinia, Sicily, Apulia, and more generally those areas located below 600 m a.s.l.
Climate change has a significant impact on viticulture, not only in Italy but worldwide. Observing its effects on the hydrological cycle, extreme temperatures, and climate variables provides crucial information for adapting viticultural techniques. Understanding how regional climate analysis can improve the prediction of these changes will allow winegrowers to adopt more precise and resilient strategies, such as targeted irrigation and the selection of heat-tolerant varieties. This knowledge can be applied in other wine-growing regions of the world and contribute to sustainable and adaptable viticulture in a rapidly changing climate.
Finally, short- and medium-term adaptation strategies for Italian viticulture are mandatory, both to preserve the current Italian wine-growing areas and to propose investment strategies for viticulture in areas with higher latitude and elevation.
Supplementary Materials
The following supporting information can be downloaded at: https://www.mdpi.com/article/10.3390/atmos15080885/s1, Table S1: Kriging and semivariogram statistics; Table S2: Italian Regional Muticriteria Classification in historical period (1991–2021) and future scenarios (2021–2040, 2041–2060, and 2061–2080) on the basis of SSP2-4.5 and SSP5-8.5.
Author Contributions
Conceptualization, V.A. and G.G.; methodology, V.A., G.G. and A.R.; software, V.A. and A.R.; validation, G.G. and A.R.C.; formal analysis, V.A.; investigation, V.A. and A.R.C.; resources, V.A.; data curation, V.A. and A.R.; writing—original draft preparation, V.A. and A.R.C.; writing—review and editing, V.A. and A.R.C.; visualization, G.G.; supervision, A.R.C. All authors have read and agreed to the published version of the manuscript.
Funding
This research received no external funding.
Institutional Review Board Statement
Not applicable.
Informed Consent Statement
Not applicable.
Data Availability Statement
TIFF Maps of single regions are available on request to the corresponding author for all bioclimatic indices in relation to the historical period and future scenarios. Processed climatic data on temperature and precipitation for historical and future scenarios are available at https://worldclim.org, while data on historical Et0 are available at https://surfobs.climate.copernicus.eu/dataaccess/access_eobs_indices.php (accessed on 6 June 2024).
Conflicts of Interest
The authors declare no conflicts of interest.
References
- Torquati, B.; Giacchè, G.; Venanzi, S. Economic analysis of the traditional cultural vineyard landscapes in Italy. J. Rural. Stud. 2015, 39, 122–132. [Google Scholar] [CrossRef]
- Massano, L.; Fosser, G.; Gaetani, M.; Bois, B. Assessment of climate impact on grape productivity: A new application for bioclimatic indices in Italy. Sci. Total Environ. 2023, 905, 167134. [Google Scholar] [CrossRef]
- Biasi, R.; Brunori, E.; Ferrara, C.; Salvati, L. Assessing Impacts of Climate Change on Phenology and Quality Traits of Vitis vinifera L.: The Contribution of Local Knowledge. Plants 2019, 8, 121. [Google Scholar] [CrossRef]
- Costa, R.; Fraga, H.; Fonseca, A.; de Cortazar-Atauri, I.G.; Val, M.C.; Carlos, C.; Reis, S.; Santos, J.A. Grapevine Phenology of cv. Touriga Franca and Touriga Nacional in the Douro Wine Region: Modelling and Climate Change Projections. Agronomy 2019, 9, 210. [Google Scholar] [CrossRef]
- van Leeuwen, C.; Darriet, P. The Impact of Climate Change on Viticulture and Wine Quality. J. Wine Econ. 2016, 11, 150–167. [Google Scholar] [CrossRef]
- van Leeuwen, C.; Sgubin, G.; Bois, B.; Ollat, N.; Swingedouw, D.; Zito, S.; Gambetta, G.A. Climate change impacts and adaptations of wine production. Nat. Rev. Earth Environ. 2024, 5, 258–275. [Google Scholar] [CrossRef]
- Moriondo, M.; Jones, G.V.; Bois, B.; Dibari, C.; Ferrise, R.; Trombi, G.; Bindi, M. Projected shifts of wine regions in response to climate change. Clim. Chang. 2013, 119, 825–839. [Google Scholar] [CrossRef]
- Piña–Rey, A.; González–Fernández, E.; Fernández–González, M.; Lorenzo, M.A.; Rodríguez-Rajo, F.J. Climate Change Impacts Assessment on Wine–Growing Bioclimatic Transition Areas. Agriculture 2020, 10, 605. [Google Scholar] [CrossRef]
- Charalampopoulos, I.; Polychroni, I.; Droulia, F.; Nastos, P.T. The Spatiotemporal Evolution of the Growing Degree Days Agroclimatic Index for Viticulture over the Northern Mediterranean Basin. Atmosphere 2024, 15, 485. [Google Scholar] [CrossRef]
- Irimia, L.M.; Patriche, C.V.; Petitjean, T.; Tissot, C.; Santesteban, L.G.; Neethling, E.; Foss, C.; Le Roux, R.; Quénol, H. Structural and Spatial Shifts in the Viticulture Potential of Main European Wine Regions as an Effect of Climate Change. Horticulturae 2024, 10, 413. [Google Scholar] [CrossRef]
- Fratianni, S.; Acquaotta, F. The Climate of Italy. In Landscapes and Landforms of Italy; Soldati, M., Marchetti, M., Eds.; World Geomorphological Landscapes; Springer: Cham, Switzerland, 2017. [Google Scholar] [CrossRef]
- Alikadic, A.; Pertot, I.; Eccel, E.; Dolci, C.; Zarbo, C.; Caffarra, A.; De Filippi, R.; Furlanello, C. The impact of climate change on grapevine phenology and the influence of elevation: A regional study. Agric. For. Meteorol. 2019, 271, 73–82. [Google Scholar] [CrossRef]
- Gaiotti, F.; Pastore, C.; Filippetti, I.; Lovat, L.; Belfiore, N.; Tomasi, D. Low night temperature at veraison enhances the accumulation of anthocyanins in Corvina grapes (Vitis vinifera L.). Sci. Rep. 2018, 8, 8719. [Google Scholar] [CrossRef]
- Amato, V.; Valletta, M. Wine Landscapes of Italy. In Landscapes and Landforms of Italy; Soldati, M., Marchetti, M., Eds.; World Geomorphological Landscapes; Springer: Cham, Switzerland, 2017. [Google Scholar] [CrossRef]
- Lamonaca, E.; Seccia, A.; Santeramo, F.G. Climate Cha(lle)nges in global wine production and trade patterns. Wine Econ. Policy 2023, 12, 85–102. [Google Scholar] [CrossRef]
- OIV. OIV Guidelines for Studying Climate Variability on Vitiviniculture in the Context of Climate Change and Its Evelution. 2015, pp. 1–7. Available online: https://www.oiv.int/public/medias/426/viti-2015-1-en.pdf (accessed on 13 June 2024).
- Tonietto, J.; Carbonneau, A. A multicriteria climatic classification system for grape–growing regions worldwide. Agric. For. Meteorol. 2004, 124, 81–97. [Google Scholar] [CrossRef]
- Huglin, P. Nouveau mode d’évaluation des possibilités héliothermiques d’un milieu viticole. Comptes Rendus L’académie D’agriculture Fr. 1978, 64, 1117–1126. [Google Scholar]
- Tonietto, J. Les Macroclimats Viticoles Mondiaux et L’influence du Mésoclimat sur la Typicité de la Syrah et du Muscat de Hambourg dans le sud de la France: Méthodologie de Caráctérisation. Ph.D. Thesis, Ecole Nationale Supérieure Agronomique, Montpellier, France, 1999; p. 233. [Google Scholar]
- Riou, C.; Becker, N.; Sotes Ruiz, V.; Gomez-Miguel, V.; Carbonneau, A.; Panagiotou, M.; Calo, A.; Costacurta, A.; Castro de, R.; Pinto, A.; et al. Le Déterminisme Climatique de la Maturation du Raisin: Application au Zonage de la Teneur em Sucre dans la Communauté Européenne; Office des Publications Officielles des Communautés Européennes: Luxembourg, 1994; p. 322. Available online: https://op.europa.eu/fr/publication-detail/-/publication/3edc0da9-f95a-4d53-871a-594267de7956/language-fr (accessed on 13 June 2024).
- Modina, D.; Cola, G.; Bianchi, D.; Bolognini, M.; Mancini, S.; Foianini, I.; Cappelletti, A.; Failla, O.; Brancadoro, L. Alpine Viticulture and Climate Change: Environmental Resources and Limitations for Grapevine Ripening in Valtellina, Italy. Plants 2023, 12, 2068. [Google Scholar] [CrossRef]
- Gentilesco, G.; Coletta, A.; Tarricone, L.; Alba, V. Bioclimatic Characterization Relating to Temperature and Subsequent Future Scenarios of Vine Growing across the Apulia Region in Southern Italy. Agriculture 2023, 13, 644. [Google Scholar] [CrossRef]
- Alsafadi, K.; Bi, S.; Bashir, B.; Alsalman, A.; Srivastava, A.K. Future Scenarios of Bioclimatic Viticulture Indices in the Eastern Mediterranean: Insights into Sustainable Vineyard Management in a Changing Climate. Sustainability 2023, 15, 11740. [Google Scholar] [CrossRef]
- Droulia, F.; Charalampopoulos, I. Future climate change impacts on European viticulture: A review on recent scientific advances. Atmosphere 2021, 12, 495. [Google Scholar] [CrossRef]
- IPCC. Climate Change 2021: The Physical Science Basis. Contribution of Working Group I to the Sixth Assessment Report of the Intergovernmental Panel on Climate Change; Masson-Delmotte, V., Zhai, P., Pirani, A., Connors, S.L., Péan, C., Berger, S., Caud, N., Chen, Y., Goldfarb, L., Gomis, M.I., et al., Eds.; Cambridge University Press: Cambridge, UK; New York, NY, USA, 2021; 2391p. [Google Scholar] [CrossRef]
- Sun, Q.; Granco, G.; Groves, L.; Voong, J.; Van Zyl, S. Viticultural Manipulation and New Technologies to Address Environmental Challenges Caused by Climate Change. Climate 2023, 11, 83. [Google Scholar] [CrossRef]
- Del Lungo, S.; Caputo, A.R.; Gasparro, M.; Alba, V.; Bergamini, C.; Roccotelli, S.; Mazzone, F.; Pisani, F. Lucania as the heart of III vine domestication center: The rediscovery of autochthonous vines. BIO Web. Conf. 2016, 7, 01021. [Google Scholar] [CrossRef]
- Fraga, H. Viticulture and Winemaking under Climate Change. Agronomy 2019, 9, 783. [Google Scholar] [CrossRef]
- Cos, J.; Doblas-Reyes, F.; Jury, M.; Marcos, R.; Bretonnière, P.-A.; Samsó, M. The Mediterranean climate change hotspot in the CMIP5 and CMIP6 projections. Earth Syst. Dynam. 2022, 13, 321–340. [Google Scholar] [CrossRef]
- Longobardi, A.; Villani, P. Trend analysis of annual and seasonal rainfall time series in the Mediterranean area. Int. J. Climatol. 2010, 30, 1538–1546. [Google Scholar] [CrossRef]
- Lionello, P.; Scarascia, L. The relation between climate change in the Mediterranean region and global warming. Reg. Environ. Chang. 2018, 18, 1481–1493. [Google Scholar] [CrossRef]
- Sgubin, G.; Swingedouw, D.; Mignot, J.; Gambetta, G.A.; Bois, B.; Loukos, H.; Noël, T.; Pieri, P.; García de Cortázar-Atauri, I.; Ollat, N.; et al. Non-linear loss of suitable wine regions over Europe in response to increasing global warming. Glob. Chang. Biol. 2023, 29, 808–826. [Google Scholar] [CrossRef]
- Egidi, G.; Cividino, S.; Paris, E.; Palma, A.; Salvati, L.; Cudlin, P. Assessing the impact of multiple drivers of land sensitivity to desertification in a Mediterranean country. Environ. Impact Assess. Rev. 2021, 89, 106594. [Google Scholar] [CrossRef]
- Allen, R.G.; Pereira, L.S.; Raes, D.; Smith, M. Crop Evapotranspiration. Guidelines for Computing Crop Water Requirements. FAO Irrigation and Drainage Paper No. 56. FAO; Food and Agriculture Organization of the United Nations: Rome, Italy, 1998; Available online: https://www.fao.org/3/x0490e/x0490e00.htm (accessed on 13 June 2024).
- van Leeuwen, C.; Destrac-Irvine, A.; Dubernet, M.; Duchêne, E.; Gowdy, M.; Marguerit, E.; Pieri, P.; Parker, A.; de Rességuier, L.; Ollat, N. An Update on the Impact of Climate Change in Viticulture and Potential Adaptations. Agronomy 2019, 9, 514. [Google Scholar] [CrossRef]
- Decree of the President of the Italian Republic 26 August 1993, n. 412. Regulation Containing Rules for the Design, Installation, Operation and Maintenance of Heating Systems in Buildings for the Purposes of Limiting Energy Consumption. GU General Series n.242 of 10/14/1993–Ordinary Supplement n. 96. Available online: https://www.gazzettaufficiale.it/atto/stampa/serie_generale/originario (accessed on 15 July 2024).
- Fick, S.E.; Hijmans, R.J. WorldClim 2: New 1km spatial resolution climate surfaces for global land areas. Int. J. Climatol. 2017, 37, 4302–4315. [Google Scholar] [CrossRef]
- Smith, M. CROPWAT: A Computer Program for Irrigation Planning and Management; Food and Agriculture Organization of the United Nations: Rome, Italy, 1992. [Google Scholar]
- Attorre, F.; Alfo, M.; De Sanctis, M.; Francesconi, F.; Bruno, F. Comparison of interpolation methods for mapping climatic and bioclimatic variables at regional scale. Int. J. Climatol. 2007, 27, 1825–1843. [Google Scholar] [CrossRef]
- Stone, M. Cross-validatory choice and assessment of statistical predictions. J. R. Stat. Soc. Ser. B 1974, 36, 111–147. Available online: http://www.jstor.org/stable/2984809 (accessed on 13 June 2024). [CrossRef]
- Prada, J.; Dinis, L.T.; Soriato, E.; Vandelle, E.; Soletkin, O.; Uysal, S.; Dihazi, A.; Santos, C.; Santos, J.A. Climate change impact on Mediterranean viticultural regions and site-specific climate risk-reduction strategies. Mitig. Adapt. Strateg. Glob. Chang. 2024, 29, 52. [Google Scholar] [CrossRef]
- Santillán, D.; Garrote, L.; Iglesias, A.; Sotes, V. Climate change risks and adaptation: New indicators for Mediterranean viticulture. Mitig. Adapt. Strateg. Glob. Chang. 2020, 25, 881–899. [Google Scholar] [CrossRef]
- Hausfather, Z.; Peters, G.P. Emissions—The ‘business as usual’ story is misleading. Nature 2020, 577, 618–620. [Google Scholar] [CrossRef] [PubMed]
- Friedlingstein, P.; Meinshausen, M.; Arora, V.K.; Jones, C.D.; Anav, A.; Liddicoat, S.K.; Knutti, R. Uncertainties in CMIP5 Climate Projections due to Carbon Cycle Feedbacks. J. Clim. 2014, 27, 511–526. [Google Scholar] [CrossRef]
- Lenton, T.M.; Rockström, J.; Gaffney, O.; Rahmstorf, S.; Richardson, K.; Steffen, W.; Schellnhuber, H.J. Climate tipping points–too risky to bet against. Nature 2019, 575, 592–595. [Google Scholar] [CrossRef]
- Daron, J.; Lorenz, S.; Taylor, A.; Dessai, S. Communicating future climate projections of precipitation change. Clim. Chang. 2021, 166, 23. [Google Scholar] [CrossRef]
- Di Virgilio, G.; Ji, F.; Tam, E.; Nishant, N.; Evans, J.P.; Thomas, C.; Riley, M.L.; Beyer, K.; Grose, M.R.; Narsey, S.; et al. Selecting CMIP6 GCMs for CORDEX Dynamical Downscaling: Model Performance, Independence, and Climate Change Signals. Earth’s Future 2022, 10, e2021EF002625. [Google Scholar] [CrossRef]
- Gaur, S.; Singh, R.; Bandyopadhyay, A.; Singh, R. Diagnosis of GCM-RCM-driven rainfall patterns under changing climate through the robust selection of multi-model ensemble and sub-ensembles. Clim. Chang. 2023, 176, 13. [Google Scholar] [CrossRef]
- Li, Z.; Ye, Y.; Lv, X.; Bai, M.; Li, Z. Hydrological Drought and Flood Projection in the Upper Heihe River Basin Based on a Multi-GCM Ensemble and the Optimal GCM. Atmosphere 2024, 15, 439. [Google Scholar] [CrossRef]
- Xie, T.; Chen, L.; Yi, B.; Li, S.; Leng, Z.; Gan, X.; Mei, Z. Application of the Improved K-Nearest Neighbor-Based Multi-Model Ensemble Method for Runoff Prediction. Water 2024, 16, 69. [Google Scholar] [CrossRef]
- Scafetta, N. CMIP6 GCM ensemble members versus global surface temperatures. Clim. Dyn. 2023, 60, 3091–3120. [Google Scholar] [CrossRef]
- Arias, L.A.; Berli, F.; Fontana, A.; Bottini, R.; Piccoli, P. Climate Change Effects on Grapevine Physiology and Biochemistry: Benefits and Challenges of High Elevation as an Adaptation Strategy. Front. Plant Sci. 2022, 13, 835425. [Google Scholar] [CrossRef]
- Fraga, H. Climate Change: A New Challenge for the Winemaking Sector. Agronomy 2020, 10, 1465. [Google Scholar] [CrossRef]
- Grillakis, M.G.; Doupis, G.; Kapetanakis, E.; Goumenaki, E. Future shifts in the phenology of table grapes on Crete under a warming climate. Agr. Water Manag. 2022, 318, 108915. [Google Scholar] [CrossRef]
- Pascuzzi, S. The effects of the forward speed and air volume of an air–assisted sprayer on spray deposition in tendone trained vineyards. J. Agric. Eng. 2013, 49, 125–132. [Google Scholar] [CrossRef]
- Rogiers, S.Y.; Greer, D.H.; Liu, Y.; Baby, T.; Xiao, Z. Impact of climate change on grape berry ripening: An assessment of adaptation strategies for the Australian vineyard. Front. Plant Sci. 2022, 13, 1094633. [Google Scholar] [CrossRef]
- Buesa, I.; Yeves, A.; Sanz, F.; Chirivella, C.; Intrigliolo, D.S. Effect of delaying winter pruning of Bobal and Tempranillo grapevines on vine performance, grape and wine composition. Aust. J. Grape Wine Res. 2021, 27, 94–105. [Google Scholar] [CrossRef]
- Morgani, M.B.; Perez Peña, J.E.; Fanzone, M.; Prieto, J.A. Pruning after budburst delays phenology and affects yield components, crop coefficient and total evapotranspiration in Vitis vinífera L. cv. ‘Malbec’ in Mendoza, Argentina. Sci. Hortic. 2022, 296, 110886. [Google Scholar] [CrossRef]
- IPCC. Climate Change 2022: Impacts, Adaptation, and Vulnerability. Contribution of Working Group II to the Sixth Assessment Report of the Intergovernmental Panel on Climate Change; Pörtner, H.-O., Roberts, D.C., Tignor, M., Poloczanska, E.S., Mintenbeck, K., Alegría, A., Craig, M., Langsdorf, S., Löschke, S., Möller, V., et al., Eds.; Cambridge University Press: Cambridge, UK; New York, NY, USA, 2022; 3056p. [Google Scholar] [CrossRef]
- Nesbitt, A.; Kemp, B.; Steele, C.; Lovett, A.; Dorling, S. Impact of recent climate change and weather variability on the viability of UK viticulture—Combining weather and climate records with producers’ Perspectives. Aust. J. Grape Wine Res. 2016, 22, 324–335. [Google Scholar] [CrossRef]
- Cardell, M.F.; Amengual, A.; Romero, R. Future effects of climate change on the suitability of wine grape production across Europe. Reg. Environ. Chang. 2019, 19, 2299–2310. [Google Scholar] [CrossRef]
- Disciplinare di Produzione della Denominazione di Origine Controllata e Garantita del vino “Brunello di Montalcino”, D.P.R. 28.03.1966, G.U. 132–30.06.1966. Available online: http://catalogoviti.politicheagricole.it/scheda_denom.php?t=dsc&q=1013 (accessed on 15 April 2024).
- Disciplinare di Produzione della Denominazione di Origine Controllata “Montepulciano d’Abruzzo”, D.P.R. 24.05.1968 G.U. n. 178–15.07.1968. Available online: http://catalogoviti.politicheagricole.it/scheda_denom.php?t=dsc&q=2200 (accessed on 15 April 2024).
- Disciplinare di Produzione della Denominazione di Origine Controllata “Nebbiolo d’Alba”, D.P.R. 27.05.1970 GU 228–09.09.1970. Available online: http://catalogoviti.politicheagricole.it/scheda_denom.php?t=dsc&q=2211 (accessed on 15 April 2024).
- Disciplinare di Produzione della Denominazione di Origine Controllata e Garantita del vino “Chianti Classico” D.P.R. 09.08.1967 G.U. 217–30.08.1967 and D.P.R. 02.07.1984 G.U. 290–20.10.1984. Available online: http://catalogoviti.politicheagricole.it/scheda_denom.php?t=dsc&q=1023 (accessed on 15 April 2024).
- Disciplinare di Produzione della Denominazione di Origine Controllata e Garantita “Aglianico del Vulture Superiore” D.M. 02.08.2010 GU 188–13.08.2010. Available online: http://catalogoviti.politicheagricole.it/scheda_denom.php?t=dsc&q=1002 (accessed on 15 April 2024).
- Jones, G.V. Climate and terroir: Impacts of climate variability and change on wine. In Fine Wine and Terroir–The Geoscience Perspective; Macqueen, R.W., Meinert, L.D., Eds.; Geoscience Canada; Geological Association of Canada: St. John’s, NL, Canada, 2006; pp. 1–14. [Google Scholar]


Disclaimer/Publisher’s Note: The statements, opinions and data contained in all publications are solely those of the individual author(s) and contributor(s) and not of MDPI and/or the editor(s). MDPI and/or the editor(s) disclaim responsibility for any injury to people or property resulting from any ideas, methods, instructions or products referred to in the content. |
© 2024 by the authors. Licensee MDPI, Basel, Switzerland. This article is an open access article distributed under the terms and conditions of the Creative Commons Attribution (CC BY) license (https://creativecommons.org/licenses/by/4.0/).