
Variations in Air Pollutant Concentrations on Dry and Wet Days with Varying Precipitation Intensity

Department of Meteorological Engineering, University of Samsun, 19 Mayis, Samsun 55420, Türkiye
Atmosphere 2024, 15(8), 896; https://doi.org/10.3390/atmos15080896 (registering DOI)
Submission received: 7 July 2024
/
Revised: 21 July 2024
/
Accepted: 23 July 2024
/
Published: 26 July 2024
(This article belongs to the Section Meteorology)
Abstract
:In this study, concentrations of three different air pollutants (PM10, SO2, and NO2) were obtained from four air quality monitoring stations (AQMSs) over an 11-year period from 2013 to 2023. Meteorological variables (temperature, dew point temperature, wind speed, sea level pressure, and precipitation) were then obtained from the nearest European Centre for Medium-Range Weather Forecasts (ECMWF) Reanalysis v5 (ERA5) grid point to each station, and their relationships were analyzed. Homogeneity and normality tests were conducted for air pollutant concentrations and meteorological variables, followed by data preprocessing analyses using non-parametric tests. The ultimate aim of this study is to determine the effects of the presence and intensity of precipitation on pollutant concentrations. Analyses based on four different precipitation intensity categories (light, moderate, heavy, and severe) indicated that increasing precipitation intensity is associated with decreasing pollutant concentrations. Specifically, higher precipitation intensities were associated with a reduction in pollutant levels, with reductions ranging from 15% to 35% compared to dry conditions. This effect was particularly pronounced during the winter season, when PM10 concentrations decreased by up to 45% on wet days compared to dry days. This finding highlighted the importance of not only precipitation intensity but also the type of hydrometeor for air pollution. The significant decrease observed during winter is thought to be due to snowfall, which is believed to have a greater removal effect on air pollution compared to rain.
1. Introduction
Despite the continuous advancements in industry and technology, which open new vistas, the increasing energy demands and industrial processes associated with these developments have led to a rise in air pollutant concentrations, especially in megacities, industrial regions, and urban areas [1,2]. The deterioration of air quality and the consequent air pollution occur when there is an increase in the concentrations of air pollutants in a specific area at a particular time. This has several adverse effects on human health [3,4,5,6,7], even leading to fatalities [8]. Particulate Matter (PM), SO2, and NO2 are highlighted in the literature as the most significant pollutants affecting health (e.g., [9,10,11]). PM originates from both natural sources such as volcanic activities, forest fires, and dust storms, and anthropogenic activities like industrial processes, motor vehicle emissions, construction activities, and agriculture [6]. SO2 is emitted from natural sources such as volcanic eruptions and biological activities in oceans, as well as from human activities, including the consumption of fossil fuels (e.g., coal, oil, natural gas) and vehicle emissions [12]. NO2 is released into the atmosphere from natural sources like lightning and soil microbial activities, and from human activities as a byproduct of fossil fuel combustion and various industrial processes [13].
While the variations in the concentrations of air pollutants are related to emission sources and their quantities, the occurrence of air pollution and the decline in air quality are also significantly influenced by meteorological conditions [14,15,16,17,18,19,20]. The changes in air pollution during dry and wet days for São Paulo were examined by Ibarra-Espinosa et al. (2021), who noted higher planetary boundary layers and less air pollution during wet periods [21]. Emekwuru and Ejohwomu (2023) analyzed temperature and air pollution variations during dry and wet seasons in Lagos, reporting higher concentrations of pollutants like NO2, O3, NO, PM1, PM2.5, and PM10 during the dry season compared to the wet season [22]. The relationship between air pollution and meteorological factors in Lanzhou, China, was investigated by Zhao et al. (2020) using a semi-parametric generalized additive model with daily datasets. Significant impacts of temperature and wind speed, as well as seasonal variations in meteorological variables affecting pollutant concentrations, were found [23]. Long-term changes in pollutant concentrations were studied by Govender and Sivakumar (2020) using k-means and hierarchical clustering techniques, demonstrating that meteorological variables and conditions could be better expressed in terms of their effects on air pollution using these methods [24]. Zhao and Wang (2021) analyzed the impact of synoptic weather patterns on air pollution during winter in Hangzhou, utilizing ERA5 reanalysis and ground observation datasets, and concluded that local winds and precipitation reduce air pollution when other conditions remain constant [25].
Zareba et al. (2024) found a significant relationship between air pollution and meteorological variables (especially temperature) in Krakow. Additionally, their seasonal analyses revealed that pollutant concentrations were higher during the cold season due to the prevalence of stable atmospheric conditions [26]. He et al. (2024), in their study examining the relationship between air pollution and weather and climate extremes, indicated that physical, thermodynamic, dynamic, chemical, and ecological processes affect pollutant concentrations. They also mentioned that, given the projected increase in the frequency and intensity of extreme precipitation events due to climate change, it is essential to conduct analyses related to the relationship between air pollution and precipitation [27]. Han et al. (2018) noted that wind speed, particularly its vertical variations, is influential in the transport of pollutants [28]. Hu et al. (2021) reported that PM2.5 concentrations decrease due to rainfall [29]. Muñoz et al. (2023), in their study of the impact of meteorological conditions on PM concentrations in Santiago, Chile, identified that near-surface stability and weak wind speeds were significant factors during heavy air pollution episodes across 25 selected cases [30]. Handhayani (2023) related the variations in pollutant concentrations in Jakarta to meteorological variables, expressing direct relationships with rainfall, wind speed, and duration of sunshine [31].
The literature typically analyzes the impacts of meteorological variables and stable/unstable atmospheric phenomena on pollutant concentrations. Additionally, changes in pollutant concentrations during rainy and dry conditions have been studied. However, no studies were found that specifically examine air pollution changes based on precipitation intensity. There are numerous studies in the literature on air pollution in Türkiye’s megacity, Istanbul (e.g., [32,33,34,35,36,37,38]). These studies have examined the effects of various atmospheric conditions [16,32] and conducted temporal analyses [18,39,40,41]. The main goal of the present study was to analyze the changes in pollutant concentrations and assess the influence of meteorological variables and precipitation conditions in Istanbul over an 11-year period (2013–2023). The study aimed to explore the impacts of various precipitation conditions and meteorological factors on air pollutant levels across four selected stations in Istanbul. An additional objective was to conduct a thorough analysis of pollutant concentrations under different precipitation intensity categories to understand how these conditions affect air quality. In the paper, Section 2 describes the datasets related to meteorological variables and air pollutants, introduces the study area, and outlines the methodologies. Section 3 presents all the analyses conducted in the study in sequence. Section 4 discusses the findings of the study and compares them with results from similar studies in the literature. Finally, Section 5 summarizes the key findings of the study in bullet points.
2. Data and Methodology
In this study, the changes in pollutant concentrations and the effects of meteorological variables and precipitation conditions in Istanbul over an 11-year period (2013–2023) were comprehensively analyzed. Due to the absence of meteorological stations at the AQMS locations, these variables were obtained for the specified period using reanalysis data. During the study period, stations with the most complete and reliable data for pollutants were prioritized. Homogeneity and normality tests were conducted for the air pollutant concentrations and meteorological variables obtained from four different air pollution stations and the nearest ERA5 grid points, followed by data preprocessing analyses using non-parametric tests. Subsequently, four out of twelve stations were selected. A correlation matrix was then created to understand the effects of temperature, dew point temperature, wind speed, sea level pressure, and precipitation conditions on pollutant concentrations. Analyses were performed separately for each of the four air pollution stations. Clustering analysis was then conducted for each station for a single variable. Subsequently, Principal Component Analysis (PCA) and multiple regression were conducted. Finally, the changes in concentrations of three different pollutants were examined under rainy and dry conditions, as well as four different precipitation intensity categories.
2.1. Study Area
In this study, there were several reasons for selecting Istanbul as the study area. According to official sources, Istanbul is a megacity, hosting approximately 16 million inhabitants, accounting for more than 20% of Türkiye’s population [42]. It is recognized globally in both population and economic terms and listed among the most developed cities in Europe and worldwide. Istanbul has historically been a hub for significant civilizations and is the only city in the world spanning two continents, Asia and Europe. Serving as Türkiye’s demographic, industrial, and economic powerhouse, the city boasts a strait connecting the continents of Asia and Europe. Situated to the north is the Black Sea, and to the south lies the Sea of Marmara, and it experiences generally Mediterranean climate characteristics, with hot, dry summers and warm, rainy winters. The northern part of the city is dominated by a Black Sea climate, while Mediterranean influences are observed in the south [8]. Hosting three airports, Istanbul accommodates a total of 54 meteorological stations and 31 air quality monitoring stations (AQMSs). The locations of Istanbul and the selected AQMSs are depicted in Figure 1.
2.2. Meteorological Data and Selection of Grid Points
In this study, daily average temperature, dew point temperature, wind speed, sea level pressure, and daily total precipitation data were used as meteorological variables affecting air pollutant concentrations. Due to the absence of meteorological stations at the locations of the AQMSs, these variables were obtained for the specified period using reanalysis data. The European Centre for Medium-Range Weather Forecasts (ECMWF) Reanalysis v5 (ERA5) dataset was chosen for reanalysis data. Specifically, “ERA5 hourly data on pressure levels from 1940 to present” was used for this study. The ECMWF Reanalysis v5 (ERA5) project has been providing meteorological variables for different atmospheric pressure levels free of charge for many years. The ERA5 dataset offers meteorological variables for a total of 137 pressure levels (from the surface to 0.01 hPa, approximately 80 km) [43]. ERA5 has a high horizontal resolution of 31 km (approximately 0.25 degrees). It is observed that the ERA5 dataset is widely used for obtaining meteorological variables in many similar pollution studies in the literature [44,45,46,47,48].
Twelve AQM stations were identified, and the nearest four stations were selected based on proximity to the nearest 0.25°. The primary reason for choosing a 0.25° interval is that the ERA5 dataset has a horizontal resolution of 31 km, which corresponds approximately to 0.25°. Meteorological variables were obtained for the AQM stations corresponding to the nearest grid points, and the analyses presented in the Section 3 of the paper were conducted accordingly.
2.3. Air Pollutant Data
In this study, PM10, SO2, and NO2 were chosen as air pollutants. This selection was made because, at many AQMSs in Istanbul, long-term data were unavailable, and the stations with reliable long-term data generally had data on PM10, SO2, and NO2. Pollutant concentration data were obtained as daily averages from the Turkish Ministry of Environment, Urbanization and Climate Change database [49], and necessary analyses were conducted. For each air pollutant, daily exceedances of limit values were considered. In this context, the threshold value for PM10 was set at 50 µg/m3, and for SO2 and NO2, it was set at 80 µg/m3, for industrial, residential, rural, and other areas [50]. Within the study period, stations with the healthiest data for these three air pollutants were prioritized. Subsequently, four out of twelve stations were selected. When selecting the four stations, the proximity to the grid points of the ERA5 dataset, from which the meteorological variables were obtained, was considered. Thus, four stations falling into different grid points were identified, and the data from the station closest to each grid point were used for analyses. Detailed information about the selected stations is provided in Table 1. The twelve stations were distributed across four different grid points. The Silivri-MTHM, Umraniye, Sile, and Uskudar-MTHM air quality measurement stations, located closest to the respective latitude–longitude distances of the four grid points, were selected for analysis in this study.
2.4. Statistical Tests for Data Analysis
In this section, initially, both the dataset containing pollutant concentrations and the values of meteorological variables obtained from the ERA5 reanalysis dataset were evaluated separately. First, preliminary statistical processes, such as detecting outliers and filling in missing data with appropriate statistical methods, were performed on the datasets. Then, it was checked whether the air pollutants were homogeneous on rainy and non-rainy days. The Levene test is used to assess whether the variances among groups are equal [51]. If the variances among groups are not equal, it is more appropriate to use non-parametric tests instead of parametric tests. Additionally, the Shapiro–Wilk test is commonly used for assessing normality [52]. According to the results of the Levene and Shapiro–Wilk tests in the study, it was determined that the p-value was less than 0.05, indicating that the air pollutant concentration values were not homogeneous and not normally distributed for different stations. Therefore, the non-parametric Mann–Whitney U test (also known as the Wilcoxon rank sum test) was used for further analysis [53,54]. Based on the Mann–Whitney U test results, since the p-value was less than 0.05, it was concluded that there was a significant difference in the median differences between the groups. This difference was found to be statistically significant.
2.5. K-Means Clustering, Principal Component Analysis (PCA), and Multiple Regression
K-means clustering is a method of assigning each data point in a dataset to the nearest average cluster. K center points are initialized randomly, and then each data point is assigned to the nearest center. The center point for each cluster is recalculated as the average of the points in that cluster, and steps 2 and 3 are repeated until the clusters no longer change. It is commonly used in anomaly detection and statistical fields that require data clustering [55]. In this study, K-means clustering was employed to segment the data into distinct groups based on the similarity observations. The algorithm initializes a set number of cluster centers randomly and then iteratively assigns data points to the nearest center while updating the centers based on the mean of the assigned points. This method was particularly useful for identifying patterns or anomalies within the dataset. By grouping similar observations together, a better understanding was possible of variations in pollutant levels and meteorological conditions across different clusters, which is valuable for targeted analysis.
Principal Component Analysis (PCA) is a dimensionality reduction technique that transforms the data into a series of uncorrelated components ordered by the amount of variance they explain. By identifying the sources of variability in the dataset, the principal components were made more usable by reducing the data to a low-dimensional space. It is preferred in areas such as maintaining variance while reducing dimensionality, visualizing high-dimensional data, and noise reduction [56]. In this study, this method helped in identifying the principal components that most significantly contributed to variability in the data, thus facilitating a clearer interpretation of underlying patterns and relationships.
Multiple regression is a technique for modeling the relationships between a dependent variable and multiple independent variables. The goal of the model is to create a linear model that best predicts the dependent variable and to identify the impact of the independent variables on the dependent variable [57]. In this study, we attempted to create a multiple regression model both before and after the K-means clustering and principal component analyses. In this study, multiple regression analysis was applied to model the relationships between air pollutant concentrations (dependent variable) and various meteorological factors (independent variables). This technique aimed to create a linear model that accurately predicts pollutant levels based on the given predictors. By assessing the impact of each independent variable on the dependent variable, multiple regression provided insights into how meteorological conditions influence air quality. This analysis was performed both before and after K-means clustering and PCA to ensure a comprehensive understanding of the relationships and to validate the robustness of the findings.
3. Results
3.1. Temporal Exceedance Rates of Air Pollutant Concentrations
In this section, we present our analysis of the temporal variations in the concentrations of three different air pollutants (PM10, SO2, and NO2) obtained from four different AQMSs over an 11-year period. The analyses were conducted on both an annual and seasonal basis. First, the number of days on which the threshold values were exceeded on an annual and seasonal basis was determined for each pollutant, using daily threshold values as a reference (see Section 2.3). Then, the exceedances were proportioned to the total number of available data for each station and pollutant in that year. This approach was necessary due to the annual data loss rates for each pollutant at the AQMSs. The annual analyses revealed that the PM10 exceeded the threshold value more frequently than the other pollutants. Each year, threshold exceedances for PM10 were observed at all four stations at varying rates (minimum 0.3%, maximum 33.0%), with the highest annual average exceedance of 20.4% observed at the Umraniye AQMS. The highest annual average PM10 exceedance occurred in 2014 at the Uskudar-MTHM AQMS. While SO2 measurements were not conducted at the Uskudar-MTHM AQMS, measurements were also absent for half the period at the other three stations. Over the 6-year period (2018–2023) when SO2 was measured, no threshold exceedances were observed at the Silivri-MTHM and Sile AQMSs. At the Umraniye AQMS, the only station where SO2 threshold exceedances were recorded, the exceedance rates were very low (1.8% and 2.5%) and only occurred in two years. For NO2, no threshold exceedances were recorded at Silivri-MTHM, and only in 2015 did the Sile AQMS record a very low exceedance rate of 0.6%. The Umraniye AQMS, where the highest NO2 exceedance rate of 45.7% was observed, had an average annual exceedance rate of 14.1% over the 5-year measurement period. At the Uskudar-MTHM AQMS, a decreasing trend in threshold exceedances was observed from the start to the end of the period. The highest annual exceedance was 13.2% in 2013, while no exceedances were observed in 2022 and 2023 (Table 2).
Seasonal variations in air pollutant concentrations are also quite important. At the Silivri-MTHM AQMS, the highest threshold exceedance rate for PM10 (23%) occurred in spring, while the lowest rate (5%) occurred in summer. No seasonal threshold exceedances were recorded for SO2 and NO2 at this station. At the Umraniye AQMS, the highest threshold exceedance rate for pollution was observed in winter (24%) and the lowest in summer (15%). SO2 exceedances were very limited, and NO2 threshold exceedances were notably higher in winter (17%). At the Sile AQMS, PM10 threshold exceedances were very low compared to all stations, with no significant seasonal variation. Lastly, at the Uskudar-MTHM AQMS, the highest PM10 threshold exceedance occurred in winter (28%) and the lowest in summer (2%). For this station, with no SO2 measurements, the highest NO2 threshold exceedance was notably in spring (10%) (Table 3).
3.2. Correlation Matrices of Meteorological Variables Influencing Air Pollutant Concentrations
In this section, correlation matrices were constructed for five different meteorological variables (temperature—T, dew point temperature—Td, wind speed—Ws, sea level pressure—SLP, and precipitation—PRE) influencing air pollutants concentrations. Analyses conducted across each station revealed markedly different outcomes. For PM10, precipitation (PRE) consistently exhibited the strongest negative correlation across all stations, while wind speed (Ws) was the primary variable in three stations. The Sile AQMS showed the strongest negative correlation with SLP for PM10, whereas SLP generally displayed the lowest correlation across other stations. Positive correlations with PM10 were observed only with T and Td variables at the Umraniye AQMS. For SO2, PRE and SLP had the lowest correlation rates among meteorological variables. The strongest correlations were generally negative with T and Td, while the Umraniye AQMS showed positive correlations with T and Td. For NO2, the strongest negative correlation was observed with Ws across all stations. Negative correlations were generally observed with PRE and other variables (Figure 2).
Overall, precipitation consistently showed negative correlations with all stations and pollutants. This contrasts with other meteorological variables, underscoring precipitation’s significant role in cleansing air pollutant concentrations. However, it should be considered that precipitation is generally less representative than temperature and pressure at sea level due to the ERA5 hourly data on pressure levels from 1940 to the present.
3.3. Cluster Analysis of Meteorological Variables and Air Pollutant Concentrations
In this section, we present a cluster analysis that was initially conducted for each station between all meteorological variables and pollutant concentrations. Since similar results were obtained across the stations, only the graphs from the analysis for the Silivri-MTHM AQMS are presented in this section (Figure 3). Subsequently, analyses including all stations were conducted between only the precipitation and pollutant concentrations, and the graphs are presented (Figure 4). For PM10, it is observed that values are generally below the threshold during higher temperatures, while higher concentration values are seen at lower temperatures. Additionally, it is observed that when the threshold is exceeded by 3 to 6 times, the temperature ranges between 10 and 16 °C (Figure 3a). Similarly, for SO2, the highest values are generally within the 5–15 °C range, and a decrease in concentration values is observed at higher temperatures (Figure 3b). Similar patterns are also valid for NO2 (Figure 3c). The dew point temperature values show similar patterns to the air temperature concerning pollutant concentrations. For PM10, the highest concentration values are within the 5–10 °C range (Figure 3d), and for SO2 and NO2, they are within the 0–10 °C range (Figure 3e,f). A clear inverse relationship between wind speed and concentration values is notable. Increasing wind values result in decreased pollutant concentrations for all three pollutants (Figure 3g–i). During times of high sea level pressure values, the presence of a high-pressure area, high-pressure center, or saddle point can be mentioned. As pressure values increase, parallel to the dominance of stable atmospheric conditions, an increase in pollutant concentrations for all three pollutants is observed (Figure 3j–l). Lastly, when looking at the precipitation, a negative relationship between increasing precipitation values and each of the three pollutants is observed. The results support the correlation matrix presented in the previous section (Figure 3m–o).
The graphs related to the cluster analysis of precipitation and pollutant concentrations at the other three air pollutant stations are provided in Figure 4. At all stations, for all variables, the highest pollutant concentration values were observed during periods of no precipitation or very light precipitation. However, it is quite difficult to clearly understand the changes in pollutant concentrations based on the intensity of precipitation with these graphs.
3.4. Multiple Regression and Principal Component Analyses
In this section, multiple regression analysis was used to isolate the effect of precipitation from other meteorological variables. Subsequently, PCA was performed to identify the sources of variability in the dataset and to reduce the data to a lower-dimensional space using principal components. Then, multiple regression analysis was repeated to compare the initial and final models. The metrics used to evaluate the models were Mean Absolute Error (MAE) and the coefficient of determination (R2).
According to the analyses conducted for PM10 across all stations, the effect of precipitation is low to moderate and has a negative contribution. Similarly, wind speed is among the most important variables affecting pollutant concentrations and, like precipitation, has a negative effect. The influence of meteorological variables on SO2 is not very pronounced. It is also observed that the effect of precipitation is minimal and contributes negatively. For NO2, wind speed again provides the highest contribution. The effect of precipitation also contributes negatively by reducing pollution concentrations (Table 4).
After the multiple regression analysis, PCA was performed. Although different results were obtained for each station, it was found that the first two principal components mainly explained the total variance in the dataset. Wind speed was observed as the primary component for all stations, while the second principal component was quite variable. A new multiple regression model was created following the PCA. However, the regression models created after PCA generally performed worse than the initial models. This indicates that PCA caused the model to lose a significant portion of the variance it could explain. The poor performance of PCA is thought to be due to the principal components not adequately capturing the complexity of the original variables. Therefore, it is predicted that the initial multiple regression model would be more suitable than the regression model created after PCA.
3.5. Variations in Air Pollutant Concentrations According to Precipitation Intensities
The ultimate aim of this study is to examine in detail the impact of precipitation on air pollutant concentrations and to reveal the differences in varying precipitation amounts. Therefore, in the sections preceding this one, the impact of precipitation on air pollutant concentrations was examined. After establishing the cleansing effect of precipitation on air pollutant concentrations, this section analyzes the changes in air pollutant concentrations under varying precipitation conditions.
First, for each station, three different pollutants were evaluated under the no-rain condition and four different precipitation intensity categories (light, moderate, heavy, and severe). The precipitation intensity categories were determined according to the rainfall ranges specified by the Turkish State Meteorological Service [58] (Table 5).
In the 11-year dataset obtained from the four ERA5 grid points closest to the four different AQMSs, it was found that throughout the period, 65% of the time there was no rain or less than 1 mm of precipitation; 26% of the time light rain was observed; 8% of the time moderate rain was observed; 1% of the time heavy rain was observed; and severe rain was observed only on a few days.
Overall, at all stations, the highest PM10 values were observed under no-rain conditions, and the concentration amounts generally decreased towards the severe rain category. Since there were only a few events in the severe rain category, the average concentration values in this category were similar to or slightly higher than those in the heavy rain and moderate rain categories. Similar trends to PM10 were observed for NO2, but some differences emerged for SO2. Although there was station-based variation for SO2, it can be said that air pollutant concentrations did not follow a clear trend based on precipitation intensity. In the section where the analysis of correlation matrices was conducted (Section 3.2), the correlation between SO2 and precipitation was found to be lower than for other variables. Therefore, the lack of a clear trend based on precipitation intensity was expected. This is thought to be related to the fact that there are roughly half the data available for SO2 compared to other variables. Since almost similar situations were observed at all stations, an example graph for the Silivri-MTHM AQMS is provided in Figure 5.
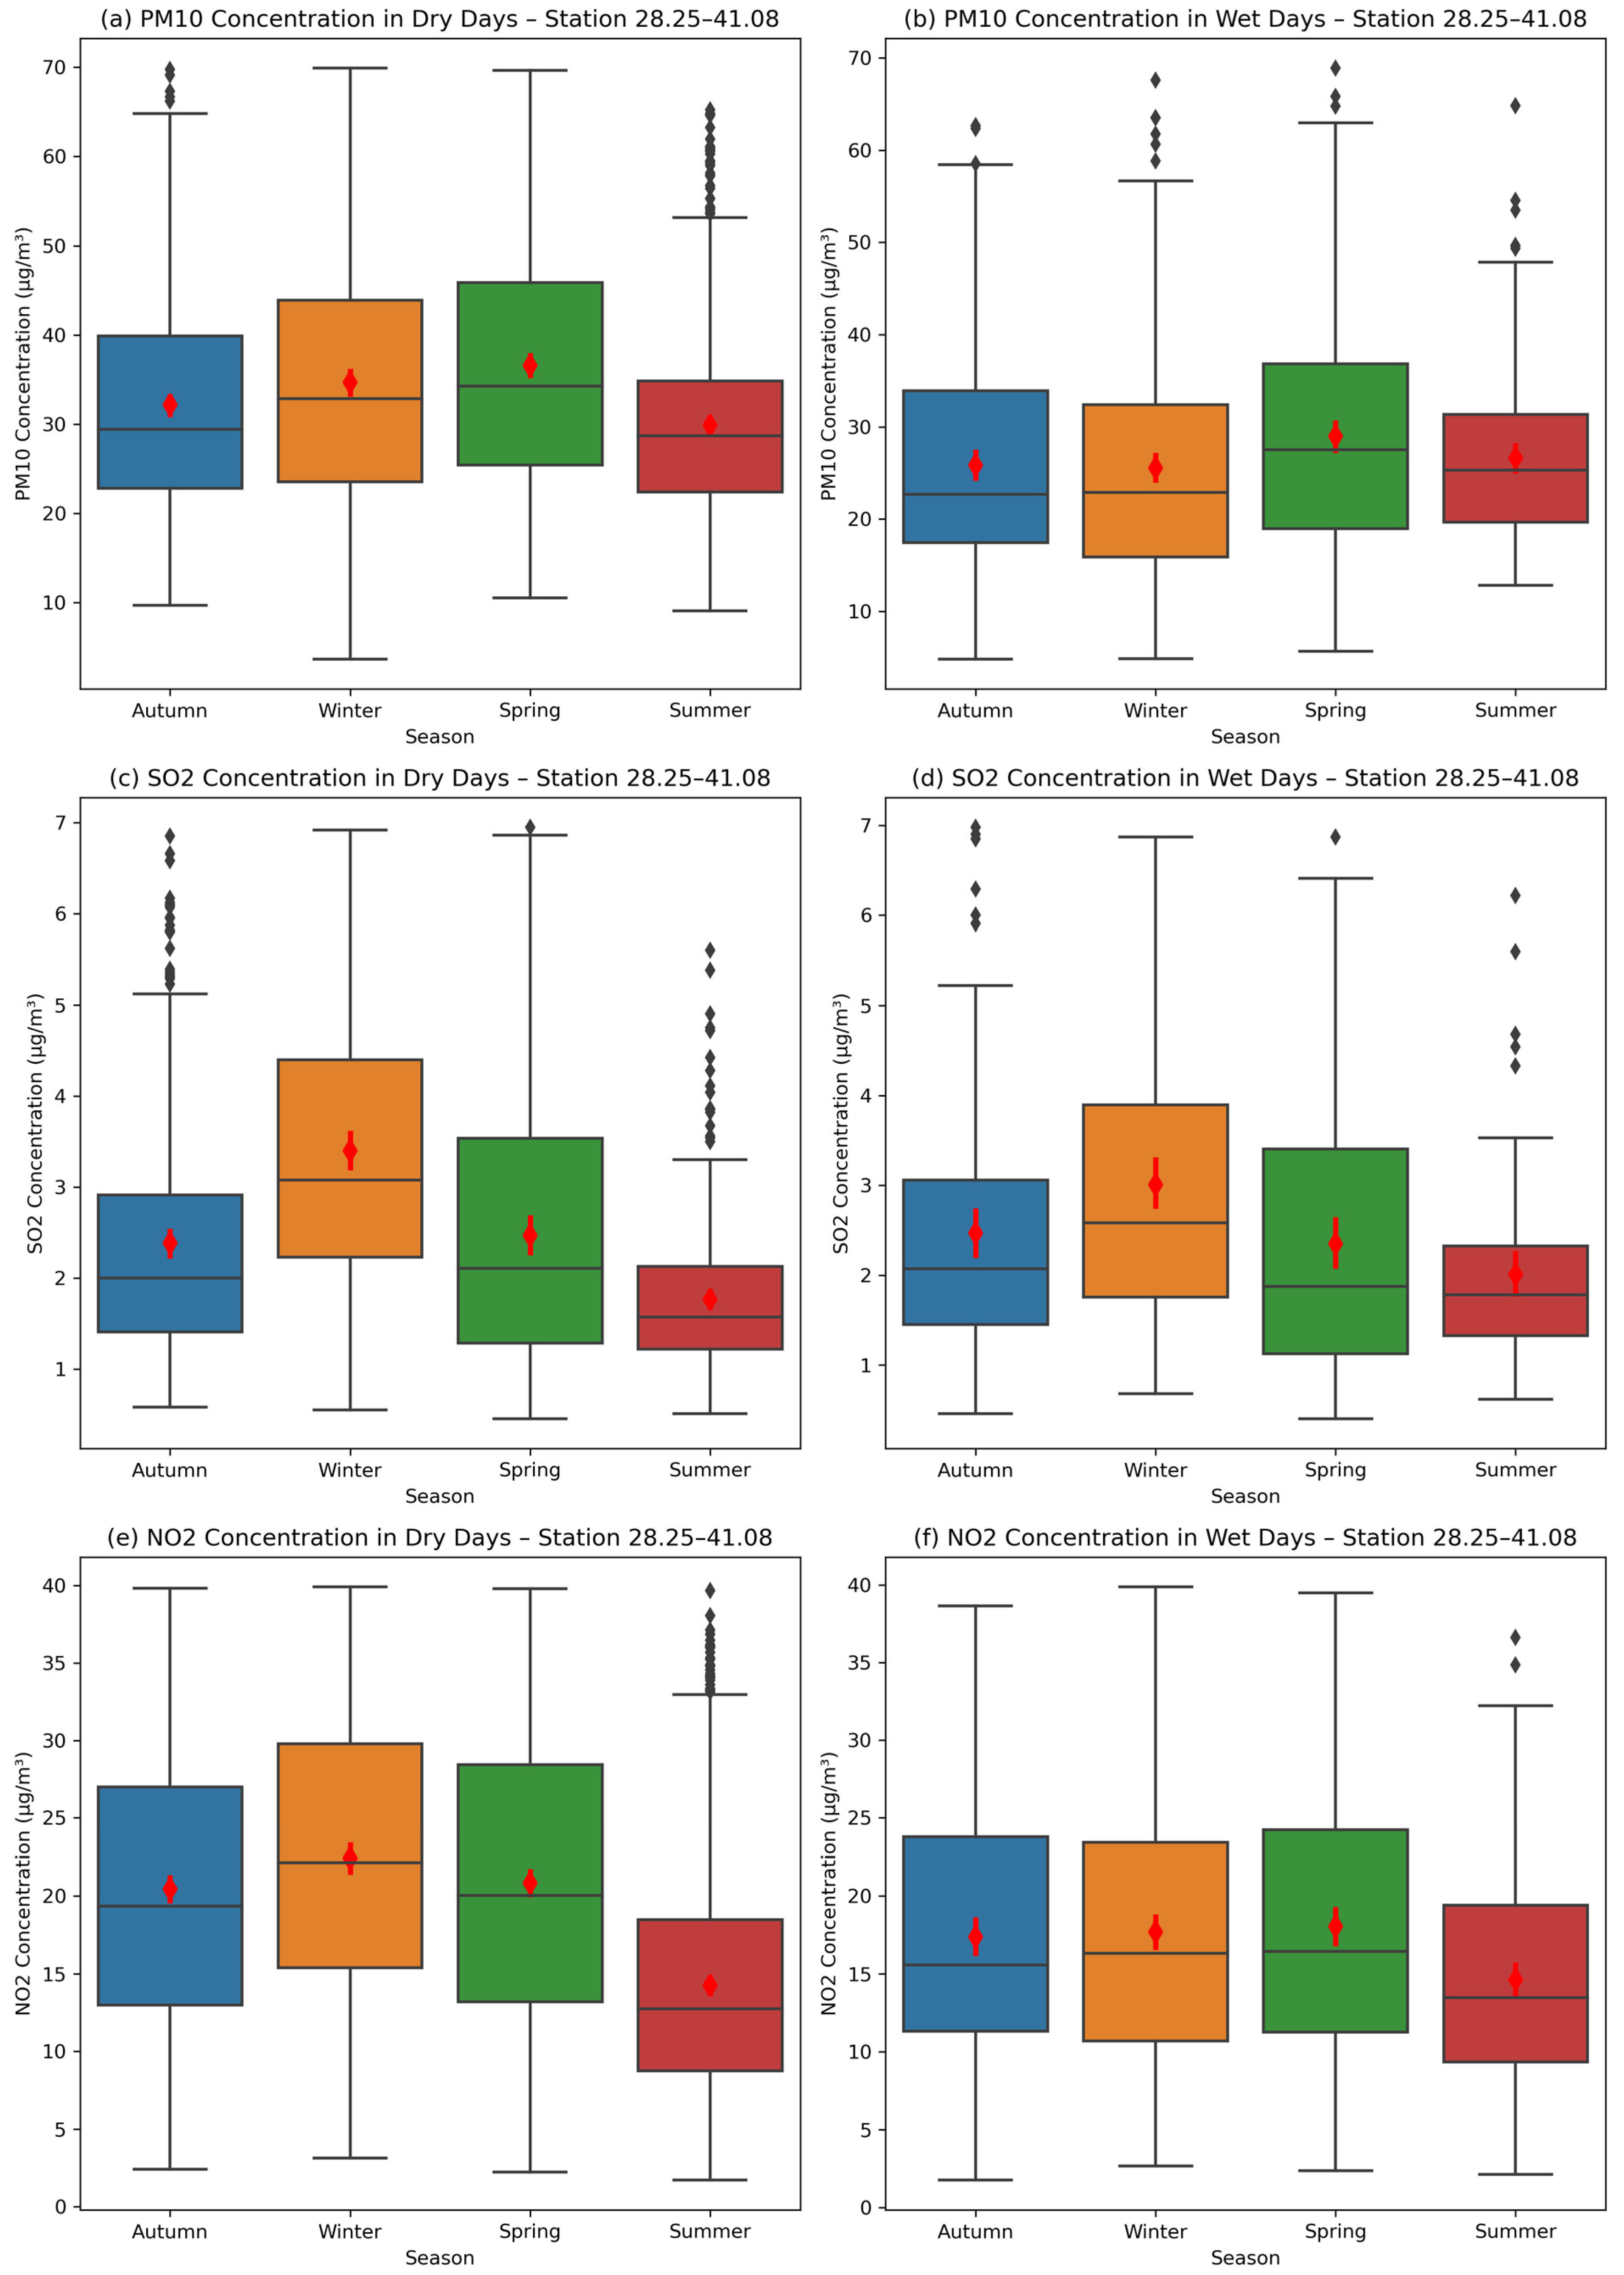
Unlike other meteorological variables, precipitation is not continuous. Therefore, seasonal variations also affect precipitation and, consequently, air pollutant concentrations. For this reason, seasonal changes in precipitation intensity categories and changes in pollutant concentrations were analyzed on a seasonal basis. Since similar results were encountered for each station, graphs of the results obtained for the Silivri-MTHM AQMS alone are presented in Figure 6. For PM10, higher average pollutant concentrations were detected on dry days compared to wet days in all seasons. On the other hand, the highest average values for both dry and wet days were observed in the spring season. A notable detail is that the lowest average pollutant concentrations on wet days were observed in the winter season. This is thought to be related to the fact that, in addition to the intensity of precipitation, the type of hydrometeor also affects pollutant concentrations, with snowfall having a greater cleaning effect. The same situation occurred on wet days at the other stations as well.
For SO2, the highest average values were observed in the winter season for both dry and wet days, and the lowest average values were observed in the summer season. No significant difference was detected in the average values between wet and dry days on a seasonal basis. For NO2, similar results to SO2 were obtained, but the average concentrations on dry days were significantly higher than those on wet days (except in the summer season) (Figure 6).
4. Discussion
Although the effects of meteorological variables on air quality and, consequently, air pollutant concentrations have been analyzed in many scientific studies, there are very few studies specifically examining the effects of precipitation and precipitation intensity on air quality. In their study analyzing the relationship between the air quality index (AQI) and PM2.5 pollution levels and rain and snowfall, Tian et al. (2021) found that the AQI increased by 23% to 32% with precipitation. The study’s significant findings indicated that snow and rain significantly improved air quality. However, this study did not consider precipitation intensity but only examined changes in air quality on rainy and snowy days [59].
Kluska et al. (2020) examined the effects of daily precipitation patterns on atmospheric pollen concentrations, analyzing different precipitation intensity categories. They also considered other meteorological variables. In their three-year study conducted in Poland, 81 rainy days were grouped into five different precipitation intensity categories, and they found that precipitation intensities of 5 mm/h and above significantly reduced pollen concentrations [60]. Zhao et al. (2020), in their study examining changes in PM2.5 concentrations under different precipitation intensity categories in China, found that there was no cleansing effect in the absence of precipitation or with light precipitation, but the removal effect was observed particularly during moderate and heavy precipitation [61].
Zheng et al. (2019), in their study examining the changes in PM10 and PM2.5 concentrations and the impact of precipitation, stated that drizzle-type precipitation (<1 mm/h) increased air pollutant concentrations and caused an anti-removal effect, while a positive removal effect was observed with increasing precipitation intensity. They also observed that precipitation in the spring season and nighttime precipitation were more effective and long-lasting in terms of the removal effect [62].
In this study, results similar to those found in similar studies in the literature were observed. Unlike studies in the literature, this study examined three different pollutants. Similar results to those in the literature were obtained for PM10, but some differences in precipitation and pollutant concentrations emerged for SO2 in particular. Therefore, the necessity of conducting separate analyses for each pollutant was also highlighted.
On the other hand, the effects of meteorological variables on air pollution have been addressed in many studies, with variables such as wind and temperature being examined in numerous studies. Many studies related to precipitation have only considered whether precipitation occurred, without analyzing precipitation type and intensity. In this study, however, the primary reason for the significantly lower air pollutant concentrations on wet days in the winter season compared to other seasons may be due to the greater removal effect of snowfall. Future studies should examine changes in air pollutant concentrations in detail, particularly based on hydrometeor size and precipitation type.
5. Conclusions
In this study, the effects of meteorological variables on air pollutant concentrations were examined, with a focus on understanding the impact of precipitation conditions on three different pollutants across four different stations. The key findings of the study are as follows:
- In Istanbul, pollutant concentration values show significant variations based on the station. Less air pollution was observed in rural areas of the city, while higher pollution levels were detected at stations located in more urbanized and densely populated inner areas.
- Between 2013 and 2023, a marked decrease in pollutant concentration values was observed, particularly in the last few years. This is believed to be related to the COVID-19 period, during which industrial and human activities declined.
- Generally, pollutant concentrations were higher in the winter season; however, there was a notable decrease in concentration values on wet days, especially when snowfall was observed.
- Among meteorological variables, wind and precipitation were the most influential on air quality. Negative correlations were found between these two variables and air pollutant concentrations in almost all cases, indicating that increased wind and precipitation values had a positive effect on air quality.
- The highest air pollutant concentrations were observed in the winter season, when there was no precipitation and stable atmospheric conditions prevailed.
- Similar to studies in the literature, higher air pollutant concentrations were observed in the absence of precipitation and during light rainfall, while lower concentrations were found in the moderate and severe rainfall categories. This indicates that increasing precipitation intensities have a cleansing effect on air pollution.
Funding
This research received no external funding.
Institutional Review Board Statement
Not applicable.
Informed Consent Statement
Not applicable.
Data Availability Statement
Air pollutant data (PM10, SO2, NO2) are publicly available online at https://sim.csb.gov.tr/STN/STN_Report/DataBank. ERA5 data are publicly available online at https://cds.climate.copernicus.eu/cdsapp#!/search?type=dataset. Accessed on 15 April 2024.
Acknowledgments
The author thanks the Ministry of Environment, Urbanization and Climate Change of the Republic of Türkiye for the air pollutant concentration data used in this study.
Conflicts of Interest
The author declares no competing interests.
References
- He, J.; Gong, S.; Yu, Y.; Yu, L.; Wu, L.; Mao, H.; Song, C.; Zhao, S.; Liu, H.; Li, X.; et al. Air pollution characteristics and their relation to meteorological conditions during 2014–2015 in major Chinese cities. Environ. Pollut. 2017, 223, 484–496. [Google Scholar] [CrossRef] [PubMed]
- An, X.; Yan, T.; Mi, S.; Sun, Z.; Hou, Q. Association between PM10 and respiratory hospital admissions in different seasons in heavily polluted Lanzhou City. J. Environ. Health 2015, 77, 64–71. [Google Scholar] [PubMed]
- Incecik, S.; İm, U. Air Pollution in Mega Cities: A Case Study of İstanbul. In Air Pollution—Monitoring, Modelling and Health; Intech Open Access Publisher: Rijeka, Croatia, 2012; pp. 77–116. [Google Scholar]
- Krzyzanowski, M.; Apte, J.S.; Bonjour, S.P.; Brauer, M.; Cohen, A.J.; Prüss-Ustun, A.M. Air Pollution in the Mega-cities. Curr. Environ. Health Rep. 2014, 1, 185–191. [Google Scholar] [CrossRef]
- Çapraz, Ö.; Deniz, A.; Doğan, N. Effects of air pollution on respiratory hospital admissions in İstanbul, Turkey, 2013 to 2015. Chemosphere 2017, 181, 544–550. [Google Scholar] [CrossRef] [PubMed]
- Zhang, Q.; Jiang, X.; Tong, D.; Davis, S.J.; Zhao, H.; Geng, G.; Feng, T.; Zheng, B.; Lu, Z.; Streets, D.G. Transboundary health impacts of transported global air pollution and international trade. Nature 2017, 543, 705–709. [Google Scholar] [CrossRef] [PubMed]
- Çapraz, Ö.; Deniz, A. Particulate matter (PM10 and PM2.5) concentrations during a Saharan dust episode in Istanbul. Air Qual. Atmos. Health 2021, 14, 109–116. [Google Scholar] [CrossRef]
- Çapraz, Ö.; Efe, B.; Deniz, A. Study on the association between air pollution and mortality in İstanbul, 2007–2012. Atmos. Pollut. Res. 2016, 7, 147–154. [Google Scholar] [CrossRef]
- Russo, A.; Trigo, R.M.; Martins, H.; Mendes, M.T. NO2, PM10 and O3 urban concentrations and its association with circulation weather types in Portugal. Atmos. Environ. 2014, 89, 768–785. [Google Scholar] [CrossRef]
- Ferenczi, Z.; Imre, K.; Lakatos, M.; Molnár, Á.; Bozó, L.; Homolya, E.; Gelencsér, A. Long-term Characterization of Urban PM10 in Hungary. Aerosol Air Qual. Res. 2021, 21, 210048. [Google Scholar] [CrossRef]
- Bolat, İ. Effect of Forest Fires on Air Quality: Antalya example. Bartın Fac. For. J. 2022, 24, 651–666. (In Turkish) [Google Scholar] [CrossRef]
- Ilten, N.; Selici, A.T. Investigating the impacts of some meteorological parameters on air pollution in Balikesir, Turkey. Environ. Monit. Assess. 2008, 140, 267–277. [Google Scholar] [CrossRef] [PubMed]
- Bernardino, A.D.; Iannarelli, A.M.; Casadio, S.; Perrino, C.; Barnaba, F.; Tofful, L.; Campanelli, M.; Di Liberto, L.; Mevi, G.; Siani, A.M.; et al. Impact of synoptic meteorological conditions on air quality in three different case studies in Rome, Italy. Atmos. Pollut. Res. 2021, 12, 76–88. [Google Scholar] [CrossRef]
- Liu, T.T.; Gong, S.; Yu, M.; Zhao, Q.C.; Li, H.R.; He, J.J.; Zhang, J.; Li, L.; Wang, X.G.; Li, S.L.; et al. Contributions of meteorology and emission to the 2015 winter severe haze pollution episodes in Northern China. Atmos. Chem. Phys. Discuss. 2016. preprint. [Google Scholar] [CrossRef]
- Wen, W.; Cheng, S.; Chen, X.; Wang, G.; Li, S.; Wang, X.; Liu, X. Impact of emission control on PM2.5 and the chemical composition change in Beijing-Tianjin-Hebei during the APEC summit 2014. Environ. Sci. Pollut. Res. 2016, 23, 4509–4521. [Google Scholar] [CrossRef] [PubMed]
- Özdemir, E.T.; Korkmaz, F.M.; Yavuz, V. Synoptic analysis of dust storm over Arabian Peninsula: A case study on February 28, 2009. Nat. Hazards 2018, 92, 805–827. [Google Scholar] [CrossRef]
- Yavuz, V.; Özen, C.; Çapraz, Ö.; Özdemir, E.T.; Deniz, A.; Akbayır, İ.; Temur, H. Analysing of atmospheric conditions and their effects on air quality in Istanbul using SODAR and CEILOMETER. Environ. Sci. Pollut. Res. 2022, 29, 16213–16232. [Google Scholar] [CrossRef] [PubMed]
- Yavuz, V. An analysis of atmospheric stability indices and parameters under air pollution conditions. Environ. Monit. Assess. 2023, 195, 934. [Google Scholar] [CrossRef] [PubMed]
- Kara, Y.; Şevik, S.E.Y.; Toros, H. Comprehensive analysis of air pollution and the influence of meteorological factors: A case study of adiyaman province. Environ. Monit. Assess. 2024, 196, 525. [Google Scholar] [CrossRef] [PubMed]
- Kara, Y.; Yavuz, V.; Temiz, C.; Lupo, A.R. Exploring Spatio-Temporal Precipitation Variations in Istanbul: Trends and Patterns from Five Stations across Two Continents. Atmosphere 2024, 15, 539. [Google Scholar] [CrossRef]
- Ibarra-Espinosa, S.; da Silva, G.A.M.; Rehbein, A.; Vara-Velaac, A.; de Freitas, E.D. Atmospheric effects of air pollution during dry and wet periods in São Paulo. Environ. Sci. Atmos. 2022, 2, 215–229. [Google Scholar] [CrossRef]
- Emekwuru, N.; Ejohwomu, O. Temperature, Humidity and Air Pollution Relationships during a Period of Rainy and Dry Seasons in Lagos, West Africa. Climate 2023, 11, 113. [Google Scholar] [CrossRef]
- Peng, L.; Zhao, X.; Tao, Y.; Mi, S.; Huang, J.; Zhang, Q. The effects of air pollution and meteorological factors on measles cases in Lanzhou, China. Environ. Sci. Pollut. Res. 2020, 27, 13524–13533. [Google Scholar] [CrossRef]
- Govender, P.; Sivakumar, V. Application of k-means and hierarchical clustering techniques for analysis of air pollution: A review (1980–2019). Atmos. Pollut. Res. 2020, 11, 40–56. [Google Scholar] [CrossRef]
- Zhao, J.; Wang, C. Objective Synoptic Weather Classification on Air Pollution during Winter Seasons in Hangzhou. J. Atmos. Sci. Res. 2021, 4, 1–13. [Google Scholar] [CrossRef]
- Zareba, M.; Weglinska, E.; Danek, T. Air pollution seasons in urban moderate climate areas through big data analytics. Sci. Rep. 2024, 14, 3058. [Google Scholar] [CrossRef]
- He, C.; Kumar, R.; Tang, W.; Pfister, G.; Xu, Y.; Qian, Y.; Brasseur, G. Air Pollution Interactions with Weather and Climate Extremes: Current Knowledge, Gaps, and Future Directions. Curr. Pollut. Rep. 2024. [Google Scholar] [CrossRef]
- Han, S.-Q.; Hao, T.-Y.; Zhang, Y.-F.; Liu, J.-L.; Li, P.-Y.; Cai, Z.-Y.; Zhang, M.; Wang, Q.-L.; Zhang, H. Vertical observation and analysis on rapid formation and evolutionary mechanisms of a prolonged haze episode over central-eastern China. Sci. Total Environ. 2018, 616–617, 135–146. [Google Scholar] [CrossRef]
- Hu, W.; Zhao, T.; Bai, Y.; Kong, S.; Xiong, J.; Sun, X.; Yang, Q.; Gu, Y.; Lu, H. Importance of regional PM2.5 transport and precipitation washout in heavy air pollution in the Twain-Hu Basin over Central China: Observational analysis and WRF-Chem simulation. Sci. Total Environ. 2021, 758, 143710. [Google Scholar] [CrossRef] [PubMed]
- Muñoz, R.C.; Garreaud, R.; Rutllant, J.A.; Seguel, R.; Corral, M. New Observations of the Meteorological Conditions Associated with Particulate Matter Air Pollution Episodes in Santiago, Chile. Atmosphere 2023, 14, 1454. [Google Scholar] [CrossRef]
- Handhayani, T. An integrated analysis of air pollution and meteorological conditions in Jakarta. Sci. Rep. 2023, 13, 5798. [Google Scholar] [CrossRef]
- Kindap, T. Identifying the Trans-Boundary Transport of Air Pollutants to the City of Istanbul under Specific Weather Conditions. Water Air Soil Pollut. 2008, 189, 279–289. [Google Scholar] [CrossRef]
- Ozcan, H.K. Long Term Variations of the Atmospheric Air Pollutants in Istanbul City. Int. J. Environ. Res. Public Health 2012, 9, 781–790. [Google Scholar] [CrossRef]
- Baltacı, H. Spatial and temporal variation of the extreme Saharan dust event over Turkey in March 2016. Atmosphere 2017, 8, 41. [Google Scholar] [CrossRef]
- Baltacı, H.; Akkoyunlu, B.O.; Arslan, H.; Yetemen, Ö.; Özdemir, E.T. The influence of meteorological conditions and atmospheric circulation types on PM10 levels in western Turkey. Environ. Monit. Assess. 2019, 191, 466. [Google Scholar] [CrossRef]
- Efe, B.; Öztaner, Y.B.; Deniz, A.; Unal, A. Analysis of air pollutants in Kagithane valley and Istanbul Metropolitan Area. Air Qual. Atmos. Health 2022, 15, 1027–1041. [Google Scholar] [CrossRef]
- Birinci, E.; Deniz, A.; Özdemir, E.T. The relationship between PM10 and meteorological variables in the mega city Istanbul. Environ. Monit. Assess. 2023, 195, 304. [Google Scholar] [CrossRef]
- Birinci, E.; Denizoğlu, M.; Özdemir, H.; Özdemir, E.T.; Deniz, A. Ambient air quality assessment at the airports based on a meteorological perspective. Environ. Monit. Assess. 2023, 195, 1542. [Google Scholar] [CrossRef]
- Demirtaş, M. A comprehensive overview of PM10 levels in İstanbul: Annual and seasonal spatio-temporal variations and the long-distance transport. Anadolu Univ. J. Sci. Technol. A-Appl. Sci. Eng. 2018, 19, 219–234. [Google Scholar] [CrossRef]
- Kasparoglu, S.; Incecik, S.; Topcu, S. Spatial and temporal variation of O3, NO and NO2 concentrations at rural and urban sites in Marmara Region of Turkey. Atmos. Pollut. Res. 2018, 9, 1009–1020. [Google Scholar] [CrossRef]
- Yurtseven, E.; Vehid, S.; Bosat, M.; Köksal, S.; Yurtseven, C.N. Assessment of Ambient Air Pollution in Istanbul during 2003–2013. Iran. J. Public Health 2018, 47, 1137–1144. [Google Scholar]
- TSI. Turkish Statistical Institu: Address Based Population Registration System Results. 2021. Available online: https://data.tuik.gov.tr/Bulten/Index?p=45500 (accessed on 12 March 2024).
- Hersbachi, H.; Bell, B.; Berrisford, P.; Hirahara, S.; Horányi, A.; Muñoz-Sabater, J.; Nicolas, J.; Peubey, C.; Radu, R.; Schepers, D.; et al. The ERA5 global reanalysis. Q. J. R. Meteorol. Soc. 2020, 146, 1999–2049. [Google Scholar] [CrossRef]
- Deng, X.; Chen, J.; Dai, R.; Zhai, Z.; He, D.; Zhao, L.; Jin, X.; Zhang, J. The Effects of Planetary Boundary Layer Features on Air Pollution Based on ERA5 Data in East China. Atmosphere 2023, 14, 1273. [Google Scholar] [CrossRef]
- Wang, Z.; Chen, P.; Wang, R.; An, Z.; Qiu, L. Estimation of PM2.5 concentrations with high spatiotemporal resolution in Beijing using the ERA5 dataset and machine learning models. Adv. Space Res. 2023, 71, 3150–3165. [Google Scholar] [CrossRef]
- Fania, A.; Monaco, A.; Pantaleo, E.; Maggipinto, T.; Bellantuono, L.; Cilli, R.; Lacalamita, A.; La Rocca, M.; Tangaro, S.; Amoroso, N.; et al. Estimation of Daily Ground Level Air Pollution in Italian Municipalities with Machine Learning Models Using Sentinel-5P and ERA5 Data. Remote Sens. 2024, 16, 1206. [Google Scholar] [CrossRef]
- Gündoğdu, S.; Elbir, T. A data-driven approach for PM2.5 estimation in a metropolis: Random forest modeling based on ERA5 reanalysis data. Environ. Res. Commun. 2024, 6, 035029. [Google Scholar] [CrossRef]
- Kouhi, M.; Oskouei, E.A. Understanding the spatial patterns of temperature hazards in Qazvin Province Using ERA5-Land Reanalysis data. J. Geogr. Environ. Hazards 2023, in press. [Google Scholar] [CrossRef]
- TMEUCC. Turkish Ministry of Environment, Urbanization and Climate Change. 2023. Available online: https://www.csb.gov.tr/en (accessed on 6 March 2024).
- WHO. World Health Organization. 2021. Available online: https://www.eea.europa.eu/en/analysis/publications (accessed on 15 April 2024).
- Aryani, W.; Mansur, M. Pengaruh Penggunaan Alat Peraga Mistar Hitung Terhadap Hasil Belajar Siswa Pokok Bahasan Penjumlahan Dan Pengurangan Bilangan Bulat. Utama J. Keilmuan Kependidikan Dasar 2017, 9, 55–78. [Google Scholar]
- Shapiro, S.S.; Wilk, M.B. An analysis of variance test for normality: Complete samples. Biometrika 1965, 52, 591–611. [Google Scholar] [CrossRef]
- Wilcoxon, F. Individual comparisons by ranking methods. Biom. Bull. 1945, 1, 80–83. [Google Scholar] [CrossRef]
- Mann, H.B.; Whitney, D.R. On a test of whether one of two random variables is stochastically larger than the other. Ann. Math. Stat. 1947, 18, 50–60. [Google Scholar] [CrossRef]
- Hartigan, J.A.; Wong, M.A. Algorithm AS 136: A K-Means Clustering Algorithm. J. R. Stat. Soc. Ser. C Appl. Stat. 1979, 28, 100–108. [Google Scholar] [CrossRef]
- Abdi, H.; Williams, L.J. Principal component analysis. WIREs Comput. Stat. 2010, 2, 433–459. [Google Scholar] [CrossRef]
- Sen, A.; Srivastava, M. Multiple Regression. In Regression Analysis: Theory, Methods, and Applications; Springer Texts in Statistics; Springer: Berlin/Heidelberg, Germany, 1990. [Google Scholar] [CrossRef]
- TSMS. Turkish State Meteorological Service. 2024. Available online: https://www.mgm.gov.tr/site/yardim1.aspx?=HadSid (accessed on 15 April 2024).
- Tian, X.; Cui, K.; Sheu, H.; Hsieh, Y.; Yu, F. Effects of Rain and Snow on the Air Quality Index, PM2.5 Levels, and Dry Deposition Flux of PCDD/Fs. Aerosol Air Qual. Res. 2021, 21, 210158. [Google Scholar] [CrossRef]
- Kluska, K.; Piotrowicz, K.; Kasprzyk, I. The impact of rainfall on the diurnal patterns of atmospheric pollen concentrations. Agric. For. Meteorol. 2020, 291, 108042. [Google Scholar] [CrossRef]
- Zhao, X.; Sun, Y.; Zhao, C.; Jiang, H. Impact of Precipitation with Different Intensity on PM2.5 over Typical Regions of China. Atmosphere 2020, 11, 906. [Google Scholar] [CrossRef]
- Zheng, Z.; Xu, G.; Li, Q.; Chen, C.; Li, J. Effect of precipitation on reducing atmospheric pollutant over Beijing. Atmos. Pollut. Res. 2019, 10, 1443–1453. [Google Scholar] [CrossRef]
Figure 1.
Study area. Blue, black, orange, and red dots represent Silivri-MTHM, Uskudar-MTHM, Umraniye, and Sile AQMSs, respectively. Black dots on the Türkiye map in the upper panel show ERA5 grid points at 0.25-degree intervals.
Figure 1.
Study area. Blue, black, orange, and red dots represent Silivri-MTHM, Uskudar-MTHM, Umraniye, and Sile AQMSs, respectively. Black dots on the Türkiye map in the upper panel show ERA5 grid points at 0.25-degree intervals.
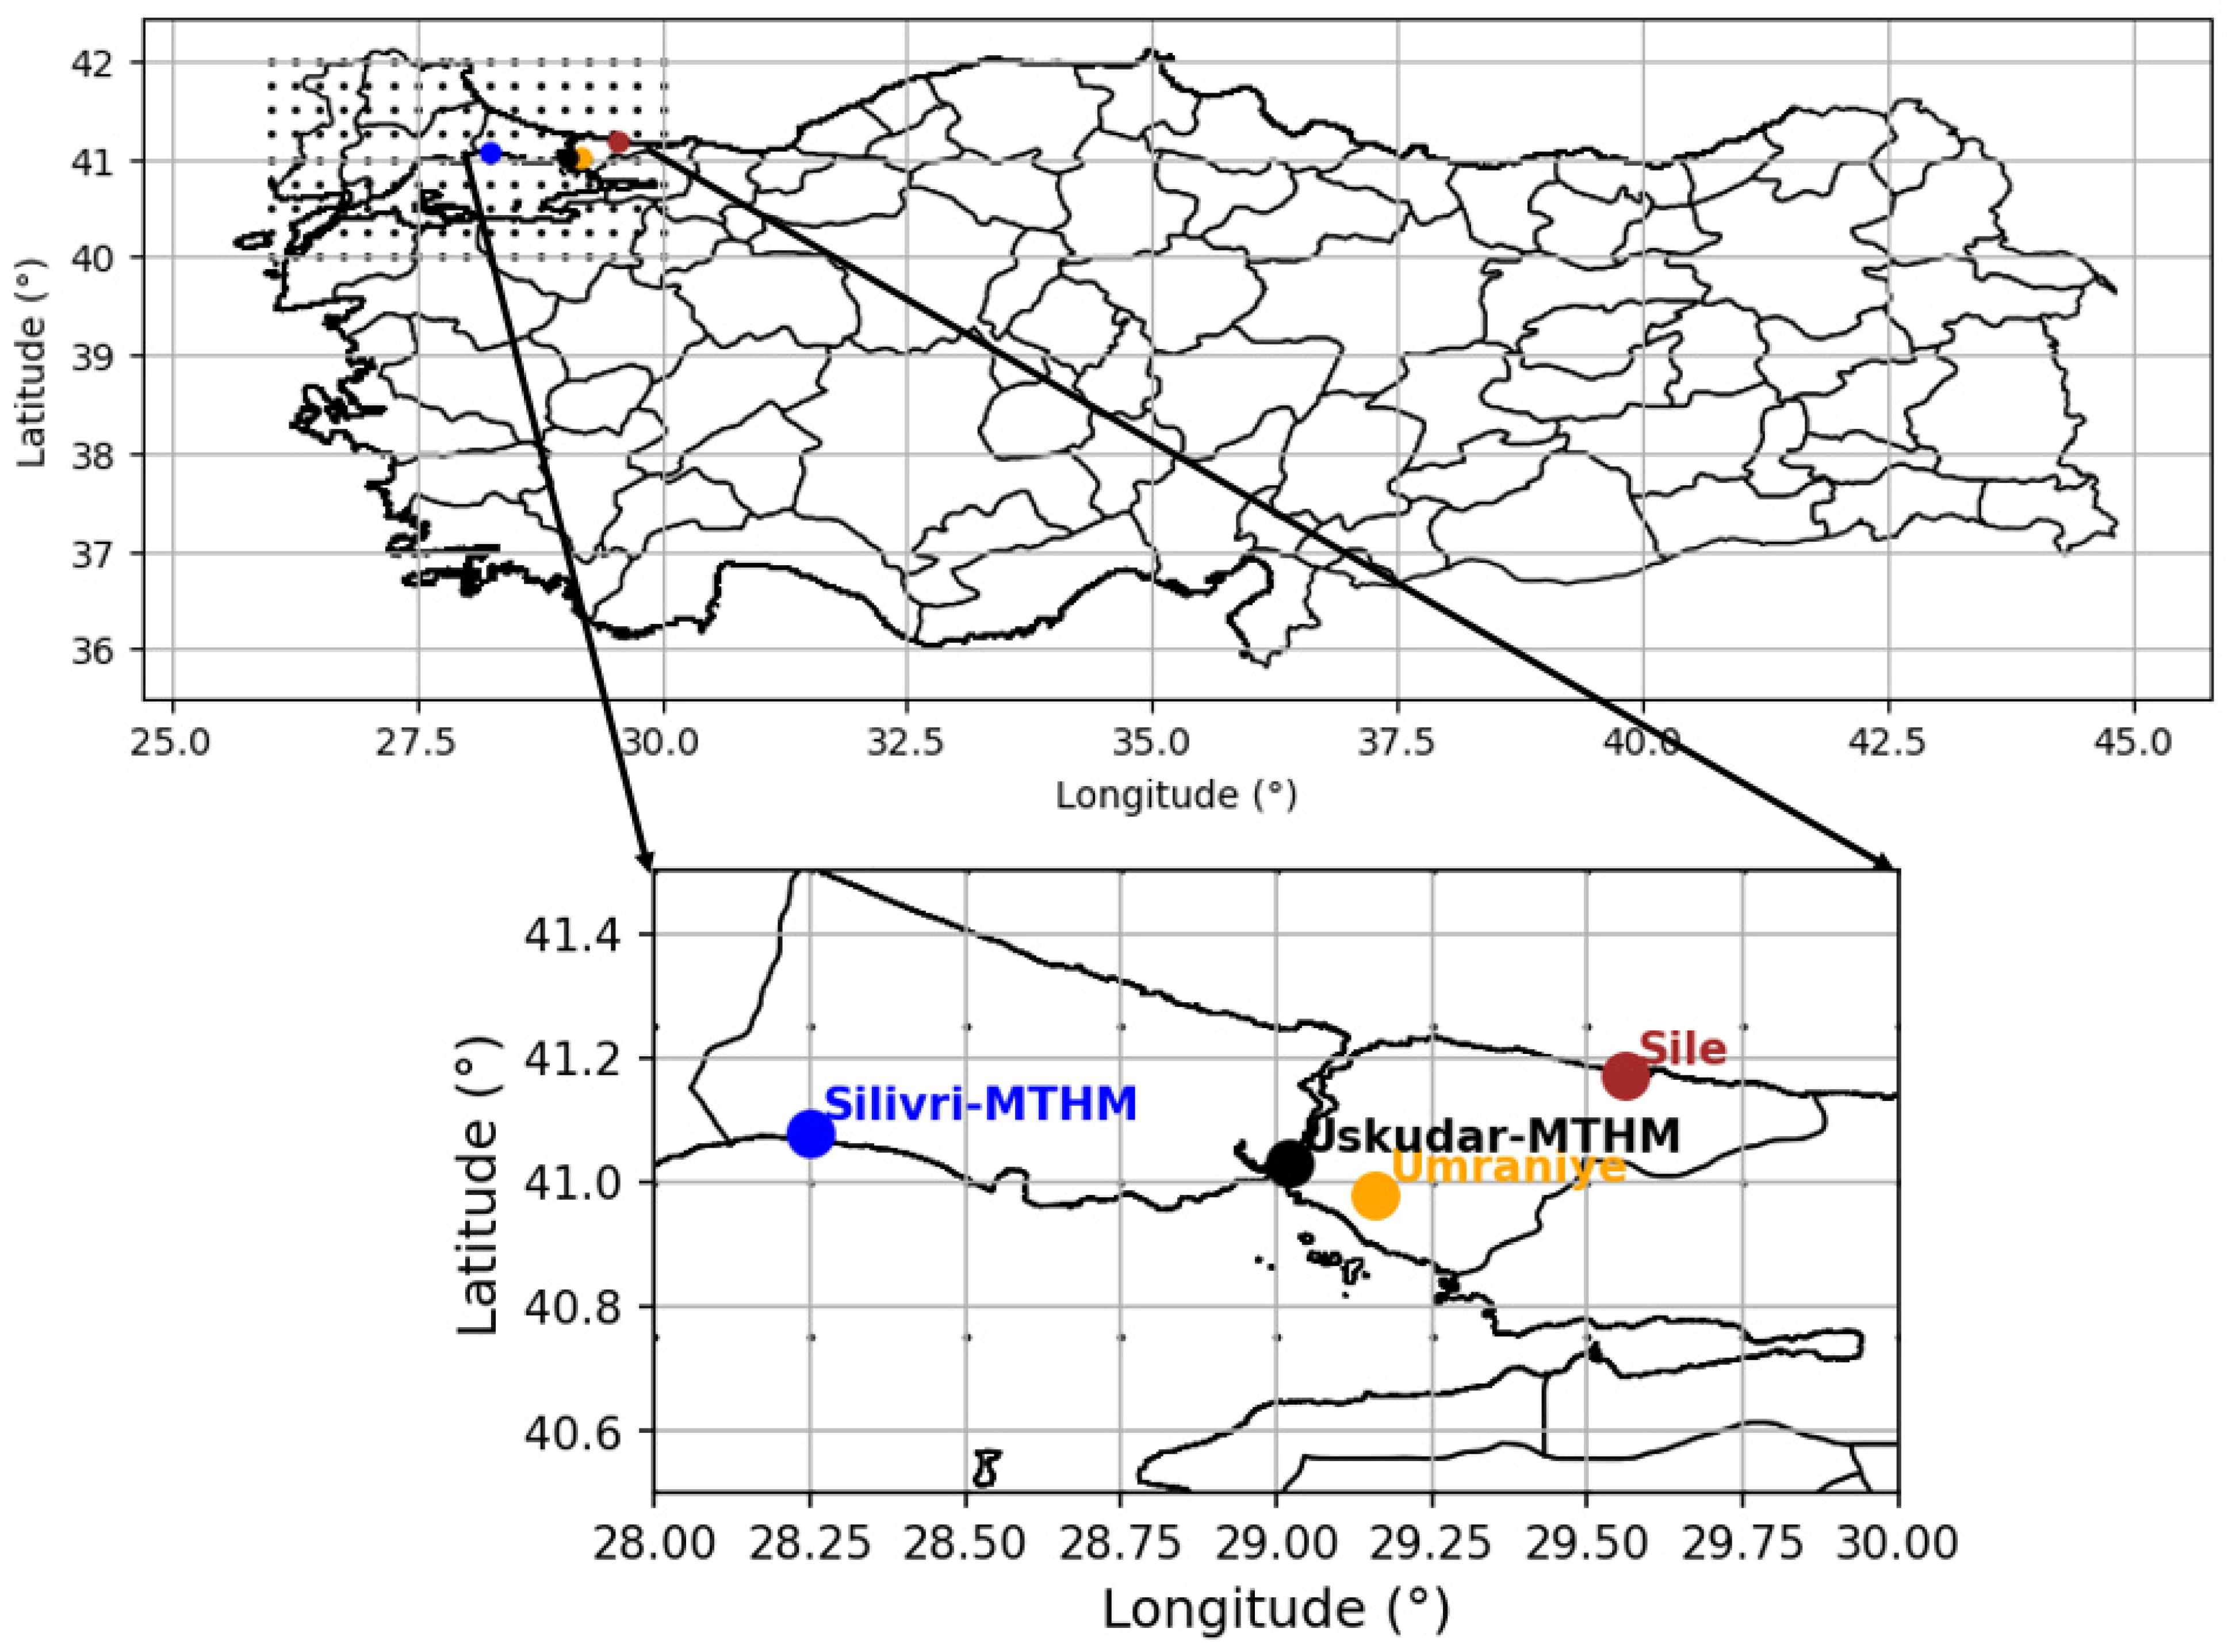
Figure 2.
Correlation matrices of air pollutants and meteorological variables. (a) Silivri-MTHM AQMS, (b) Uskudar-MTHM AQMS, (c) Umraniye AQMS, (d) Sile AQMS.
Figure 2.
Correlation matrices of air pollutants and meteorological variables. (a) Silivri-MTHM AQMS, (b) Uskudar-MTHM AQMS, (c) Umraniye AQMS, (d) Sile AQMS.
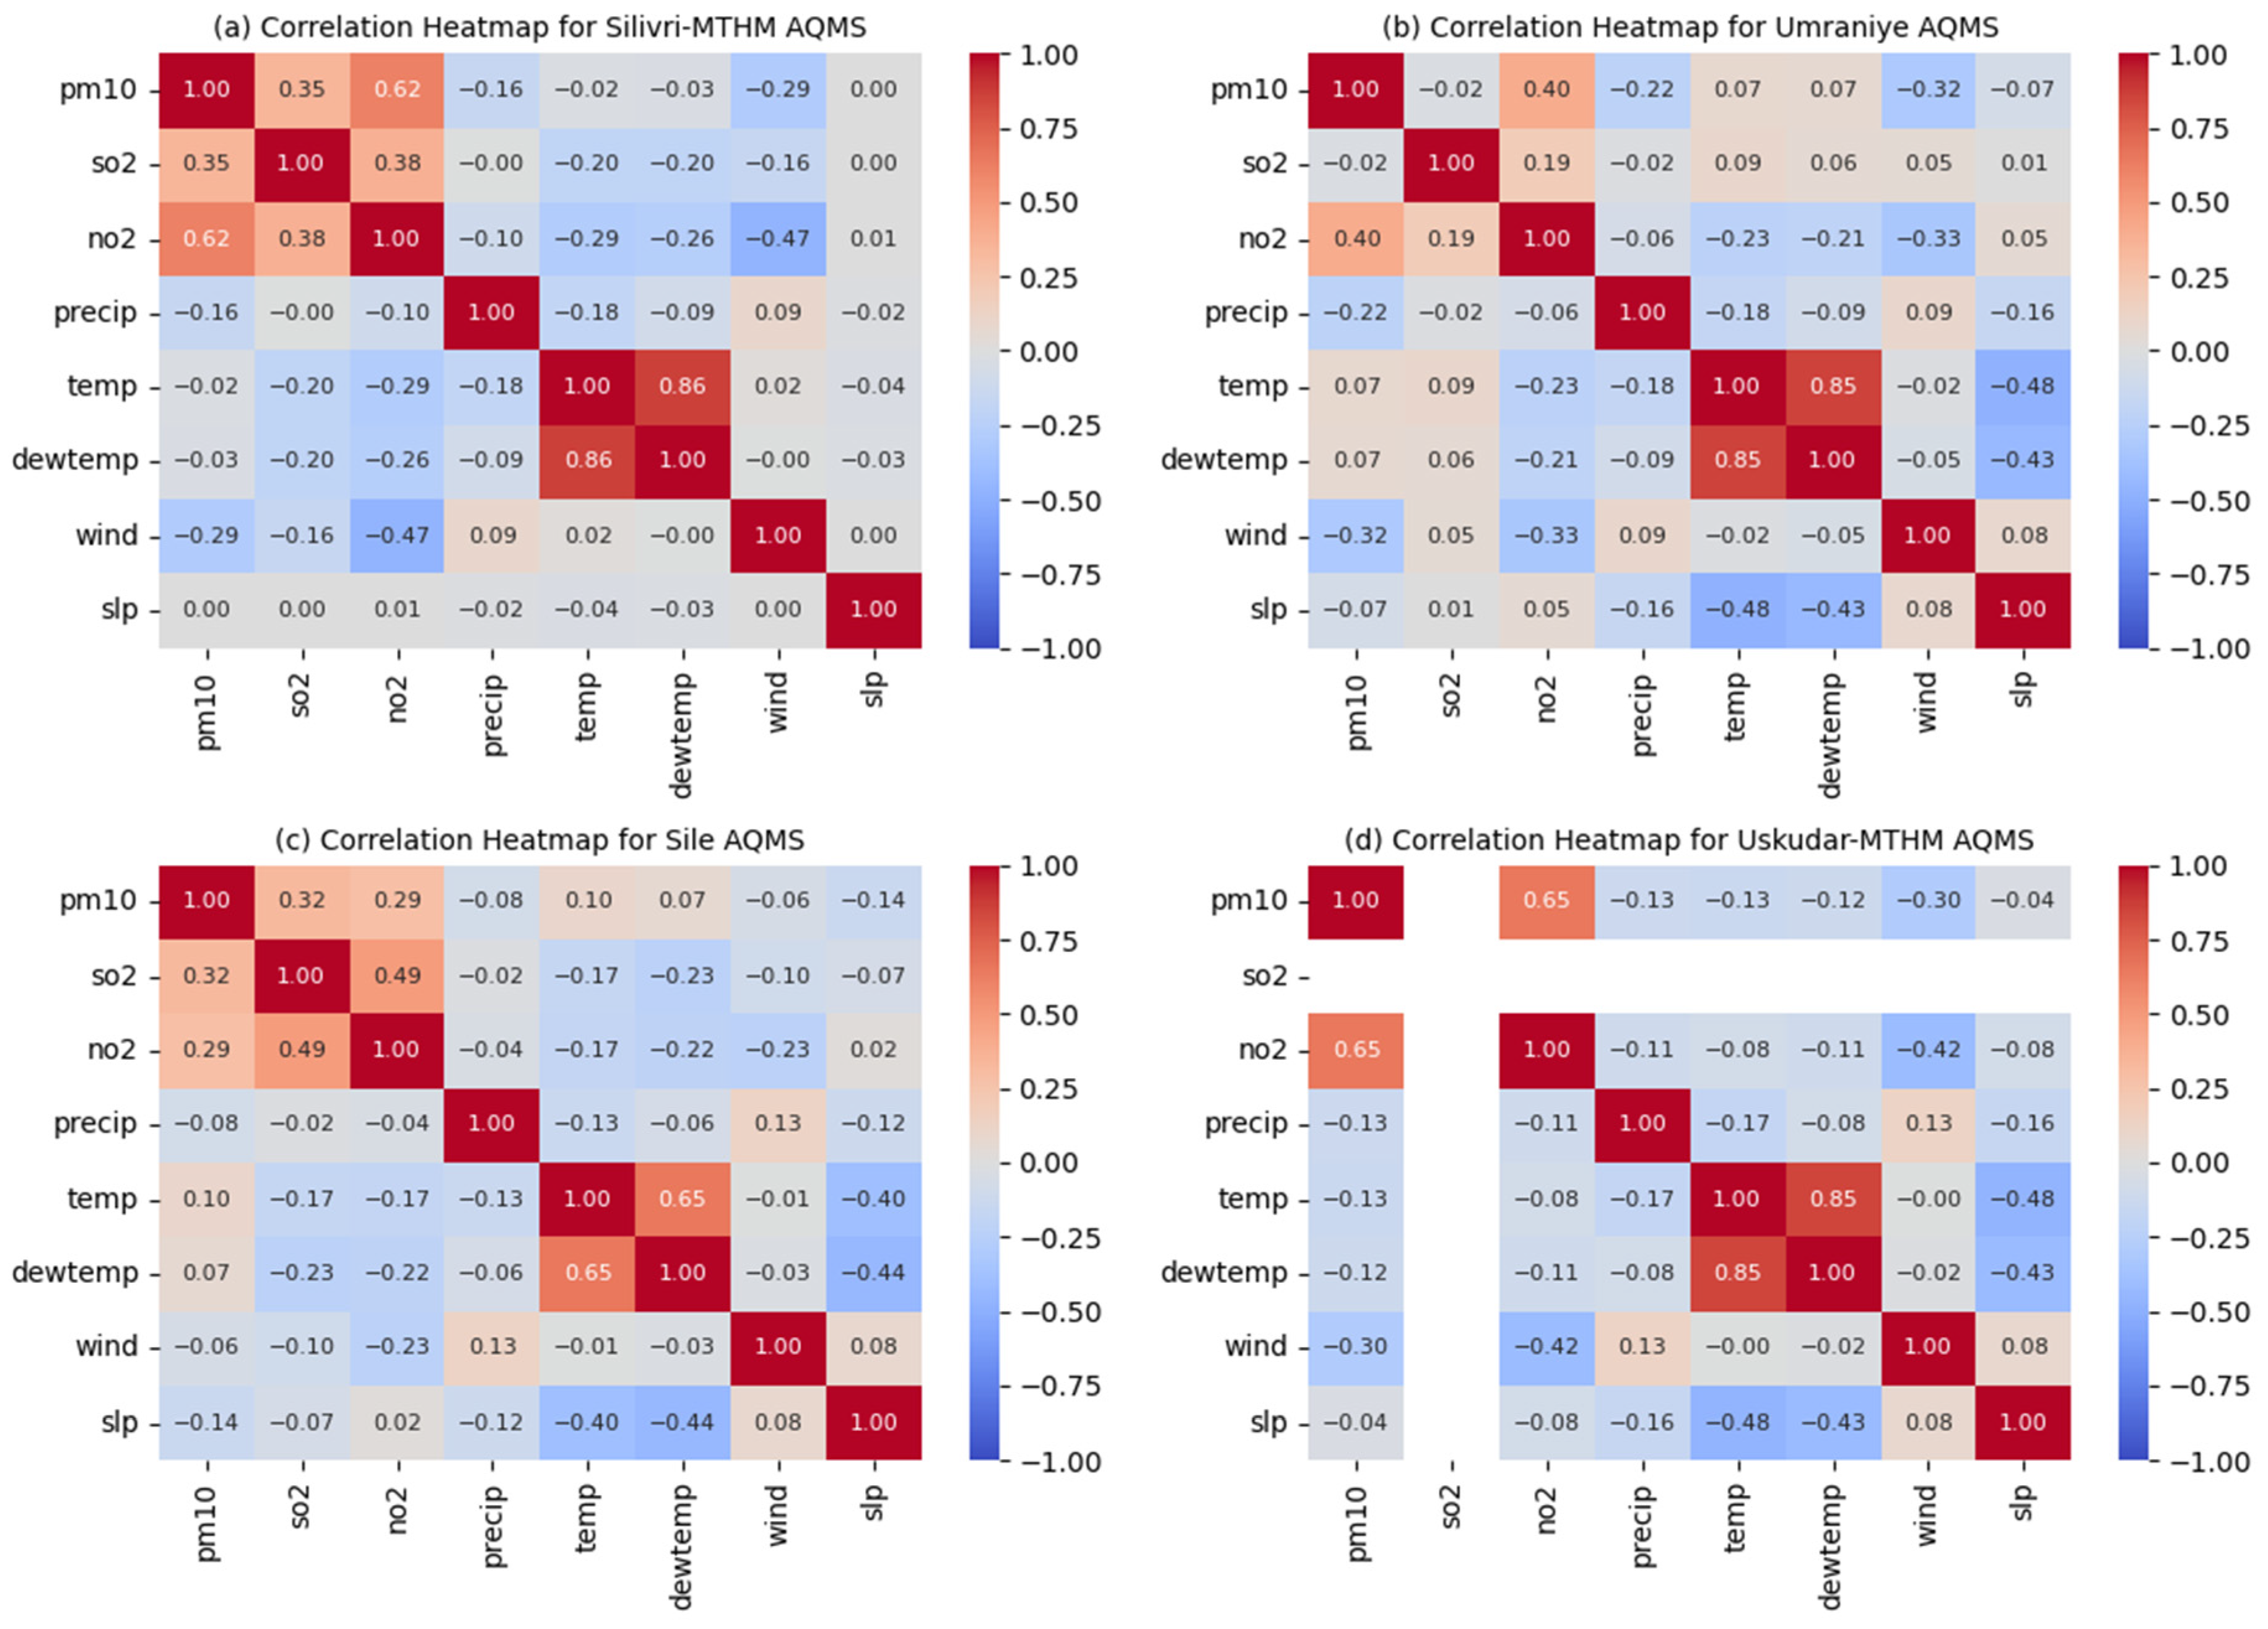
Figure 3.
Cluster analysis of meteorological variables and air pollutant concentrations.
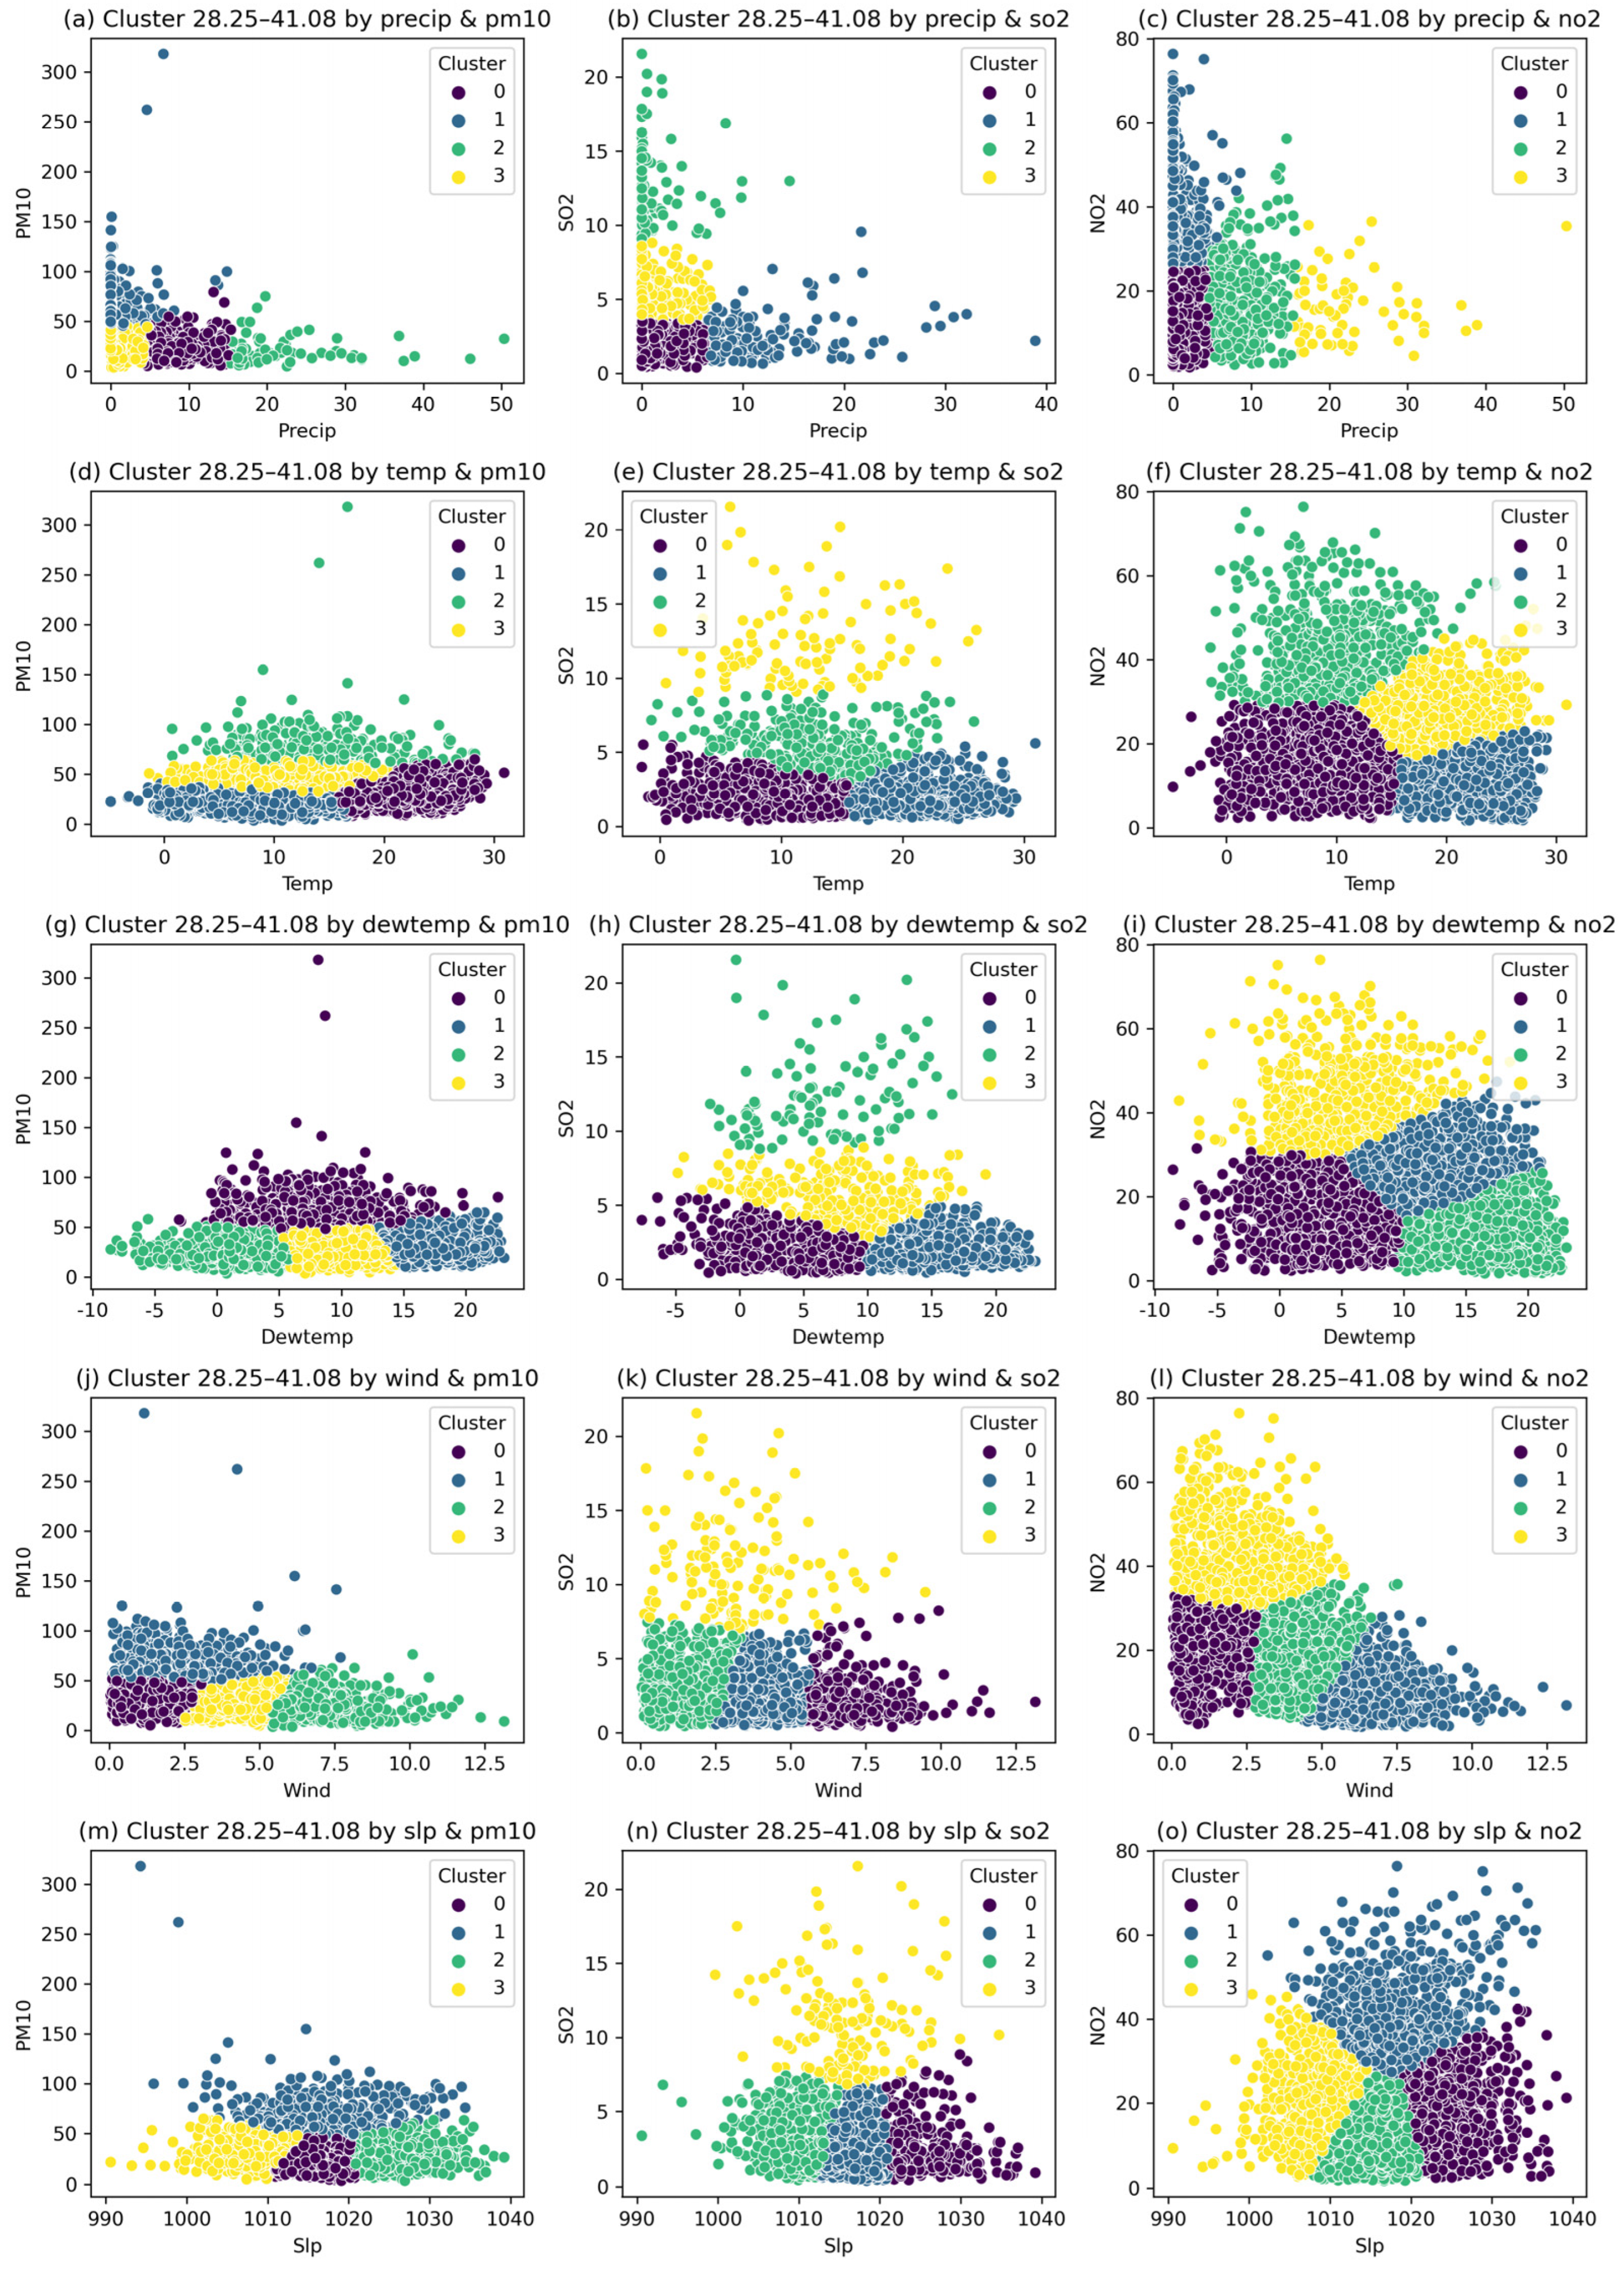
Figure 4.
Cluster analysis of precipitation and air pollutant concentrations.

Figure 5.
Changes in pollutant concentrations by precipitation intensity categories for Silivri-MTHM. (a) PM10, (b) SO2, and (c) NO2.
Figure 5.
Changes in pollutant concentrations by precipitation intensity categories for Silivri-MTHM. (a) PM10, (b) SO2, and (c) NO2.
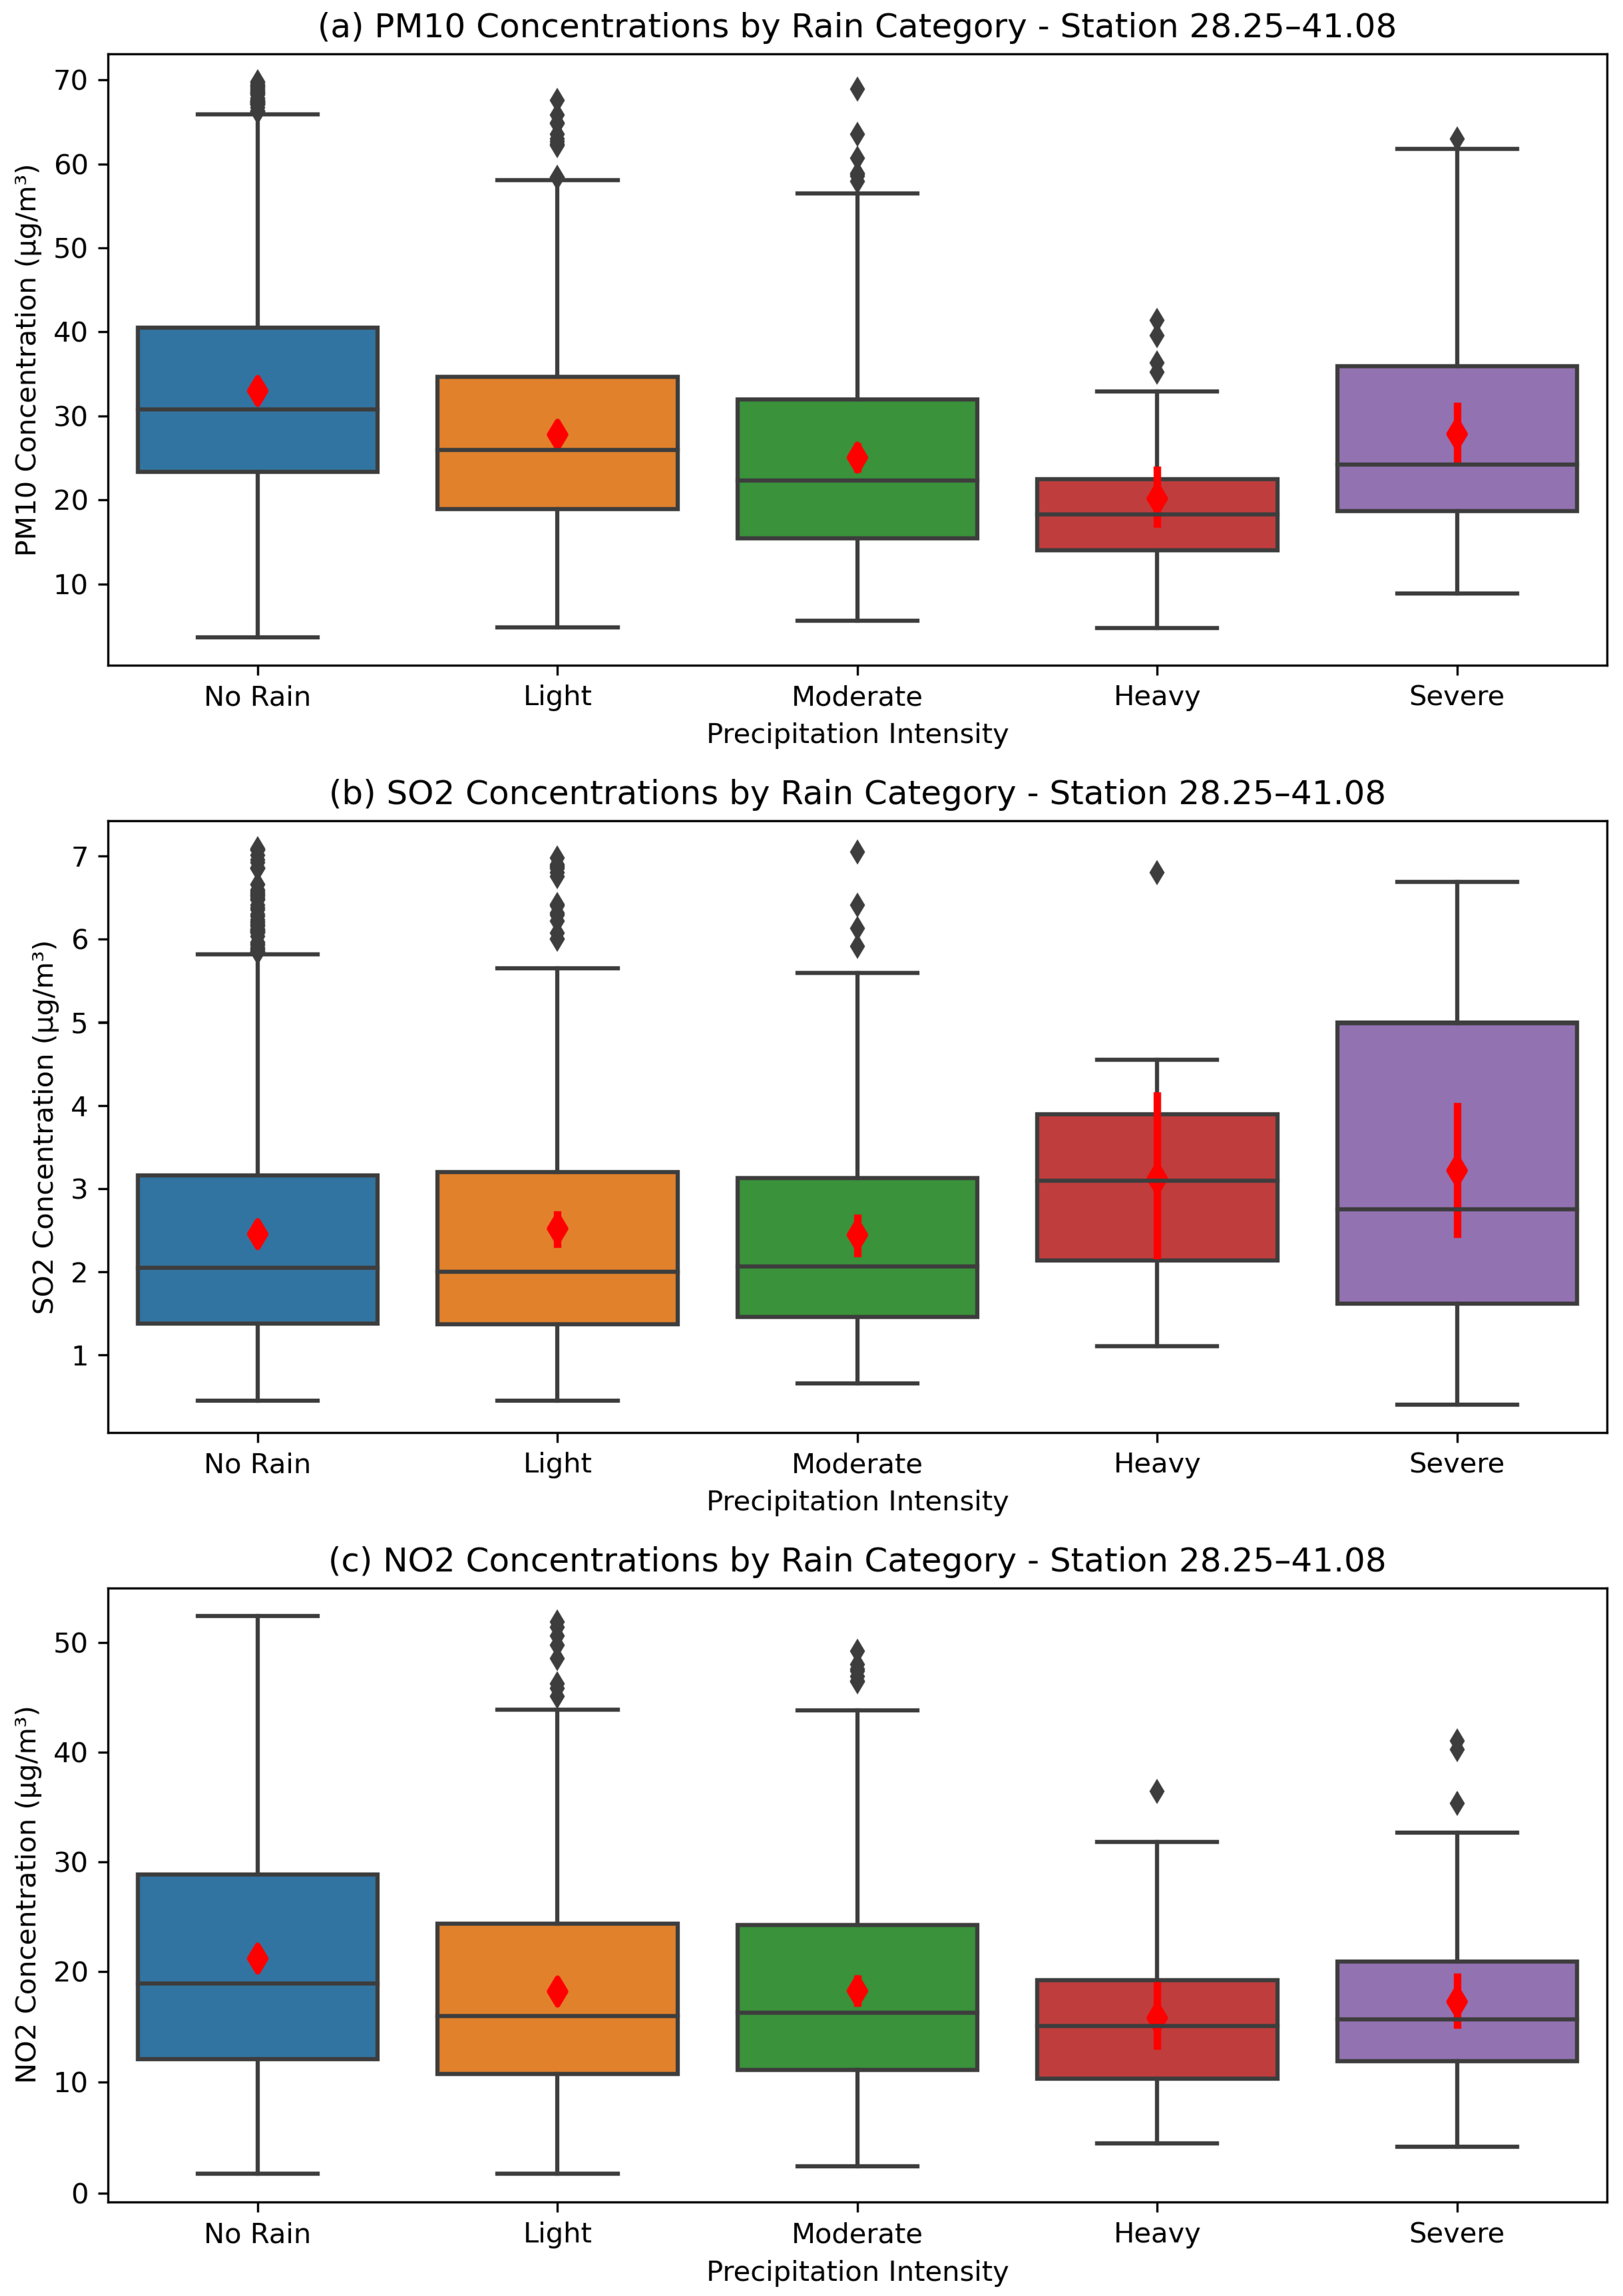
Figure 6.
Seasonal variation of air pollutant concentrations on dry and wet days for the Silivri-MTHM AQMS. (a) PM10 concentrations in dry days, (b) PM10 concentrations in wet days, (c) SO2 concentrations in dry days, (d) SO2 concentrations in wet days, (e) NO2 concentrations in dry days, and (f) NO2 concentrations in wet days.

Table 1.
Air quality measurement stations (AQMSs) used in the study. The plus sign indicates the stations selected within the scope of the study.
Table 1.
Air quality measurement stations (AQMSs) used in the study. The plus sign indicates the stations selected within the scope of the study.
| AQMS | Lat | Lon | Nearest 0.25° Lat | Nearest 0.25° Lon | Distance to Nearest 0.25° | Selected Station |
|---|---|---|---|---|---|---|
| Silivri-MTHM | 41.08° | 28.25° | 41.00° | 28.25° | 0.08° | + |
| Basaksehir | 41.10° | 28.80° | 41.00° | 28.75° | 0.15° | |
| Kagithane | 41.06° | 29.00° | 41.00° | 29.00° | 0.06° | |
| Umraniye | 41.01° | 29.16° | 41.00° | 29.25° | 0.10° | + |
| Umraniye-MTHM | 41.03° | 29.10° | 41.00° | 29.00° | 0.13° | |
| Sile | 41.17° | 29.56° | 41.25° | 29.50° | 0.14° | + |
| Uskudar-MTHM | 41.03° | 29.02° | 41.00° | 29.00° | 0.05° | + |
| Yenibosna | 41.00° | 28.83° | 41.00° | 28.75° | 0.08° | |
| Mecidiyekoy | 41.07° | 29.00° | 41.00° | 29.00° | 0.07° | |
| Kandilli | 41.06° | 29.06° | 41.00° | 29.00° | 0.12° | |
| Sirinevler | 41.00° | 28.84° | 41.00° | 28.75° | 0.09° | |
| Esenyurt | 41.03° | 28.66° | 41.00° | 28.75° | 0.12° |
Table 2.
Annual average threshold exceedance rates of air pollutant concentrations by station.
| Silivri-MTHM | Umraniye | Sile | Uskudar-MTHM | |||||||||
|---|---|---|---|---|---|---|---|---|---|---|---|---|
| Year | PM10 | SO2 | NO2 | PM10 | SO2 | NO2 | PM10 | SO2 | NO2 | PM10 | SO2 | NO2 |
| 2013 | 24.5% | - | 0.0% | - | - | - | 5.4% | - | 0.0% | 30.1% | - | 13.2% |
| 2014 | 21.7% | - | 0.0% | - | - | - | 3.0% | - | 0.0% | 33.0% | - | 12.9% |
| 2015 | 20.5% | - | 0.0% | - | - | - | 2.0% | - | 0.6% | 24.8% | - | 4.7% |
| 2016 | 16.6% | - | 0.0% | - | - | - | 2.8% | - | 0.0% | 19.3% | - | 6.7% |
| 2017 | 20.5% | - | 0.0% | - | - | - | 5.5% | - | 0.0% | 23.6% | - | 4.5% |
| 2018 | 14.0% | 0.0% | 0.0% | - | - | - | 3.4% | 0.0% | 0.0% | 16.1% | - | 3.1% |
| 2019 | 5.3% | 0.0% | 0.0% | 12.1% | 0.0% | 8.0% | 2.8% | 0.0% | 0.0% | 14.6% | - | 2.8% |
| 2020 | 7.2% | 0.0% | 0.0% | 13.0% | 2.5% | 11.5% | 2.8% | 0.0% | 0.0% | 9.7% | - | 2.0% |
| 2021 | 12.3% | 0.0% | 0.0% | 15.6% | 1.8% | 45.7% | 3.3% | 0.0% | 0.0% | 10.4% | - | 1.8% |
| 2022 | 12.6% | 0.0% | 0.0% | 32.1% | 0.0% | 0.0% | 4.3% | 0.0% | 0.0% | 12.1% | - | 0.0% |
| 2023 | 7.5% | 0.0% | 0.0% | 29.0% | 0.0% | 5.3% | 0.3% | 0.0% | 0.0% | 13.5% | - | 0.0% |
Table 3.
Seasonal average threshold exceedance rates of air pollutant concentrations by station.
| Silivri-MTHM | Umraniye | Sile | Uskudar-MTHM | |||||||||
|---|---|---|---|---|---|---|---|---|---|---|---|---|
| Season | PM10 | SO2 | NO2 | PM10 | SO2 | NO2 | PM10 | SO2 | NO2 | PM10 | SO2 | NO2 |
| Spring | 23% | 0% | 0% | 19% | 0% | 2% | 5% | 0% | 0% | 27% | - | 10% |
| Summer | 5% | 0% | 0% | 15% | 1% | 5% | 1% | 0% | 0% | 3% | - | 2% |
| Autumn | 14% | 0% | 0% | 19% | 2% | 6% | 5% | 0% | 0% | 18% | - | 4% |
| Winter | 18% | 0% | 0% | 24% | 0% | 17% | 3% | 0% | 0% | 28% | - | 3% |
Table 4.
Results and error metrics of the multiple regression models.
| PM10 | SO2 | NO2 | |||
|---|---|---|---|---|---|
| Silivri-MTHM | MAE | 117.5 | 1.9 | 58.1 | |
| R2 | 0.1 | 0.1 | 0.3 | ||
| Intercept | 34.4 | 3.5 | 29.8 | ||
| Coefficients | PRE | −0.6 | 0.0 | −0.2 | |
| T | 0.1 | 0.0 | −0.2 | ||
| Td | 0.0 | 0.0 | −0.1 | ||
| Ws | −1.4 | −0.1 | −0.2 | ||
| SLP | 0.0 | 0.0 | 0.0 | ||
| Umraniye | MAE | 210.4 | 3.2 | 210.1 | |
| R2 | 0.1 | 0.0 | 0.3 | ||
| Intercept | 363.5 | 10.8 | 300.8 | ||
| Coefficients | PRE | −1.0 | 0.0 | −0.3 | |
| T | 0.2 | 0.0 | −0.7 | ||
| Td | −0.3 | 0.0 | −0.3 | ||
| Ws | −1.6 | 0.0 | −2.4 | ||
| SLP | −0.3 | 0.0 | −0.2 | ||
| Sile | MAE | 71.7 | 2.3 | 6.5 | |
| R2 | 0.0 | 0.1 | 0.2 | ||
| Intercept | 80.0 | 68.7 | 138.3 | ||
| Coefficients | PRE | −0.4 | 0.0 | 0.0 | |
| T | 0.1 | 0.0 | 0.0 | ||
| Td | 0.0 | −0.1 | −0.1 | ||
| Ws | 0.0 | −0.1 | −0.4 | ||
| SLP | −0.1 | −0.1 | −0.1 | ||
| Uskudar-MTHM | MAE | 133.2 | − | 91.6 | |
| R2 | 0.1 | − | 0.2 | ||
| Intercept | 159.3 | − | 156.3 | ||
| Coefficients | PRE | −0.7 | − | −0.2 | |
| T | 0.1 | − | −0.3 | ||
| Td | −0.1 | − | −0.2 | ||
| Ws | −1.0 | − | −1.0 | ||
| SLP | −0.1 | − | −0.1 |
Table 5.
Precipitation intensity categories according to the Turkish State Meteorological Service [58].
Table 5.
Precipitation intensity categories according to the Turkish State Meteorological Service [58].
| Precipitation Intensity Category | Precipitation Amount |
|---|---|
| No Rain | <1 mm |
| Light Rain | 1–5 mm |
| Moderate Rain | 6–20 mm |
| Heavy Rain | 21–50 mm |
| Severe Rain | >50 mm |
Disclaimer/Publisher’s Note: The statements, opinions and data contained in all publications are solely those of the individual author(s) and contributor(s) and not of MDPI and/or the editor(s). MDPI and/or the editor(s) disclaim responsibility for any injury to people or property resulting from any ideas, methods, instructions or products referred to in the content. |
© 2024 by the author. Licensee MDPI, Basel, Switzerland. This article is an open access article distributed under the terms and conditions of the Creative Commons Attribution (CC BY) license (https://creativecommons.org/licenses/by/4.0/).
Share and Cite
MDPI and ACS Style
Yavuz, V. Variations in Air Pollutant Concentrations on Dry and Wet Days with Varying Precipitation Intensity. Atmosphere 2024, 15, 896. https://doi.org/10.3390/atmos15080896
AMA Style
Yavuz V. Variations in Air Pollutant Concentrations on Dry and Wet Days with Varying Precipitation Intensity. Atmosphere. 2024; 15(8):896. https://doi.org/10.3390/atmos15080896
Chicago/Turabian StyleYavuz, Veli. 2024. "Variations in Air Pollutant Concentrations on Dry and Wet Days with Varying Precipitation Intensity" Atmosphere 15, no. 8: 896. https://doi.org/10.3390/atmos15080896
Note that from the first issue of 2016, this journal uses article numbers instead of page numbers. See further details here.
Article Metrics
Article metric data becomes available approximately 24 hours after publication online.