Article

Effectiveness of Air Filtration in Reducing PM2.5 Exposures at a School in a Community Heavily Impacted by Air Pollution

by
McKenna Thompson
1,*,
Rosemary Castorina
2,3,
Wenhao Chen
3,
David Moore
4,
Kyle Peerless
5 and
Susan Hurley
1
1
Office of Environmental Health Hazard Assessment, California Environmental Protection Agency, Oakland, CA 94612, USA
2
Center for Environmental Research and Community Health, School of Public Health, University of California, Berkeley, CA 94704, USA
3
Environmental Health Laboratory Branch, Center for Laboratory Sciences, California Department of Public Health, Richmond, CA 94804, USA
4
Intrinsic Environment, Health and Safety, Occidental, CA 95465, USA
5
Occupational Health Branch, Center for Healthy Communities, California Department of Public Health, Richmond, CA 94804, USA
*
Author to whom correspondence should be addressed.
Atmosphere 2024, 15(8), 901; https://doi.org/10.3390/atmos15080901 (registering DOI)
Submission received: 7 June 2024 / Revised: 25 July 2024 / Accepted: 25 July 2024 / Published: 28 July 2024
(This article belongs to the Special Issue Exposure Assessment of Air Pollution (2nd Edition))

Abstract

:
Reducing children’s exposure to air pollution is a priority among California communities heavily impacted by air pollution exposures. We conducted an observational air quality study at a school to investigate the effectiveness of improved Heating, Ventilation, and Cooling (HVAC) system filters and portable air cleaners (PACs) in reducing children’s exposure to fine particulate matter (PM2.5) under real-world classroom conditions. This study included five classrooms, three of which had PACs. Halfway through the study period, high-efficiency HVAC filters were installed in all five classrooms. Continuous measurements of outdoor and in-classroom PM2.5 concentrations were used to evaluate filtration effectiveness. The air filtration strategies, alone and in combination, demonstrated 14–56% reductions in indoor PM2.5 concentrations compared to outdoor levels. There were significant improvements in filtration resulting from HVAC filter upgrades in the two classrooms without PACs (11% and 22% improvement, p < 0.001). Upgrading HVAC filters in classrooms with PACs did not significantly improve filtration effectiveness, suggesting that utilizing both strategies simultaneously may not meaningfully improve air quality under these circumstances. CO2 data, as a proxy for ventilation, helped demonstrate that the observed filtration effectiveness was likely impacted by the variable HVAC system use and open doors.

1. Introduction

Exposure to fine particulate matter (PM2.5) air pollution is associated with adverse health outcomes such as respiratory and cardiovascular diseases [1,2]. Children are especially susceptible to the health effects of PM2.5 exposure due to their higher respiratory rates in proportion to their body weight [3,4]. In California, children spend an average of 8–12% of their time in school, which suggests that minimizing exposures at school is important, particularly in communities with a disproportionately high burden of air pollution [5]. Clean air in classrooms can reduce absenteeism, improve students’ academic achievement and better the health of both staff and students [6].
Stockton is a city in California that has historically experienced poor air quality, with high PM2.5 concentrations due in large part to heavily trafficked freeways intersecting the city, the Port of Stockton, and industrial sources [7]. Census tracts in southwest Stockton rank above the state’s 90th percentile in PM2.5 exposure, as well as in adverse health indicators and socioeconomic stressors (asthma, cardiovascular disease, low birth weight, educational attainment, housing burdened low-income households, linguistic isolation, poverty, and unemployment) [8]. Due to this extreme burden of pollution and population vulnerability, Stockton is designated as an Assembly Bill (AB) 617 community in the California Air Resources Board’s (CARB) Community Air Protection Program [9]. AB 617 requires CARB and local air districts to engage with designated communities to develop and implement community air monitoring and emission reduction programs [10]. Stockton’s community emission reduction program (CERP) includes reducing children’s exposure to air pollution as a community priority, and calls for advanced air filtration at schools as a strategy to do so [7].
Several studies have shown air filtration to be an effective method of mitigating exposure to particulate air pollution in homes and offices and reducing associated morbidity and mortality [11,12,13,14]. However, there is limited research considering how air filtration can reduce PM2.5 exposure in occupied school classrooms. Previous studies concluded that classroom air filtration may be an effective way to mitigate children’s exposure to PM2.5 air pollution, but that the effectiveness is largely impacted by filter type, Heating Ventilation and Cooling (HVAC)-system design and ventilation modes. These studies suggested a need for more research on air filtration strategies [5,15,16,17].
In many AB 617 communities, including Stockton, the installation of high-efficiency filters in the HVAC systems of schools is an exposure reduction strategy stated in their CERP [7]. The American Society of Heating, Refrigerating and Air-Conditioning Engineers (ASHRAE) recommends Minimum Efficiency Reporting Value (MERV) 13 filters for classroom HVAC systems [18]. For schools whose HVAC systems are not capable of handling the high-efficiency filters, the use of portable air cleaners (PACs) in classrooms is suggested [7,19]. PACs usually contain high-efficiency particulate air (HEPA) filters. MERV filters are rated by particle removal efficiency under controlled testing conditions, with higher ratings indicating better particle capture from the air flow. HEPA filters are rated to have greater particle removal efficiency than the highest-rated MERV [20]. However, there are limited field studies demonstrating the effectiveness of these HVAC-based high-efficiency filters and portable air cleaners in reducing PM2.5 concentrations in occupied classrooms in U.S. communities heavily impacted by air pollution. Schools in historically underserved communities are often located in older buildings, have higher ambient air pollution, and are less likely to have dedicated facility managers [21]. As such, the provision of clear evidence-based recommendations for air filtration that ensure effective use of limited resources is critical.
This study aims to evaluate the effectiveness of two air filtration strategies (improved HVAC-based filters and portable air cleaners) when operated as they regularly would be by school personnel in both portable and permanent classrooms. The study results provide important data on the effectiveness of these strategies at a school in a community that faces many compounding environmental, health and socioeconomic stressors.

2. Materials and Methods

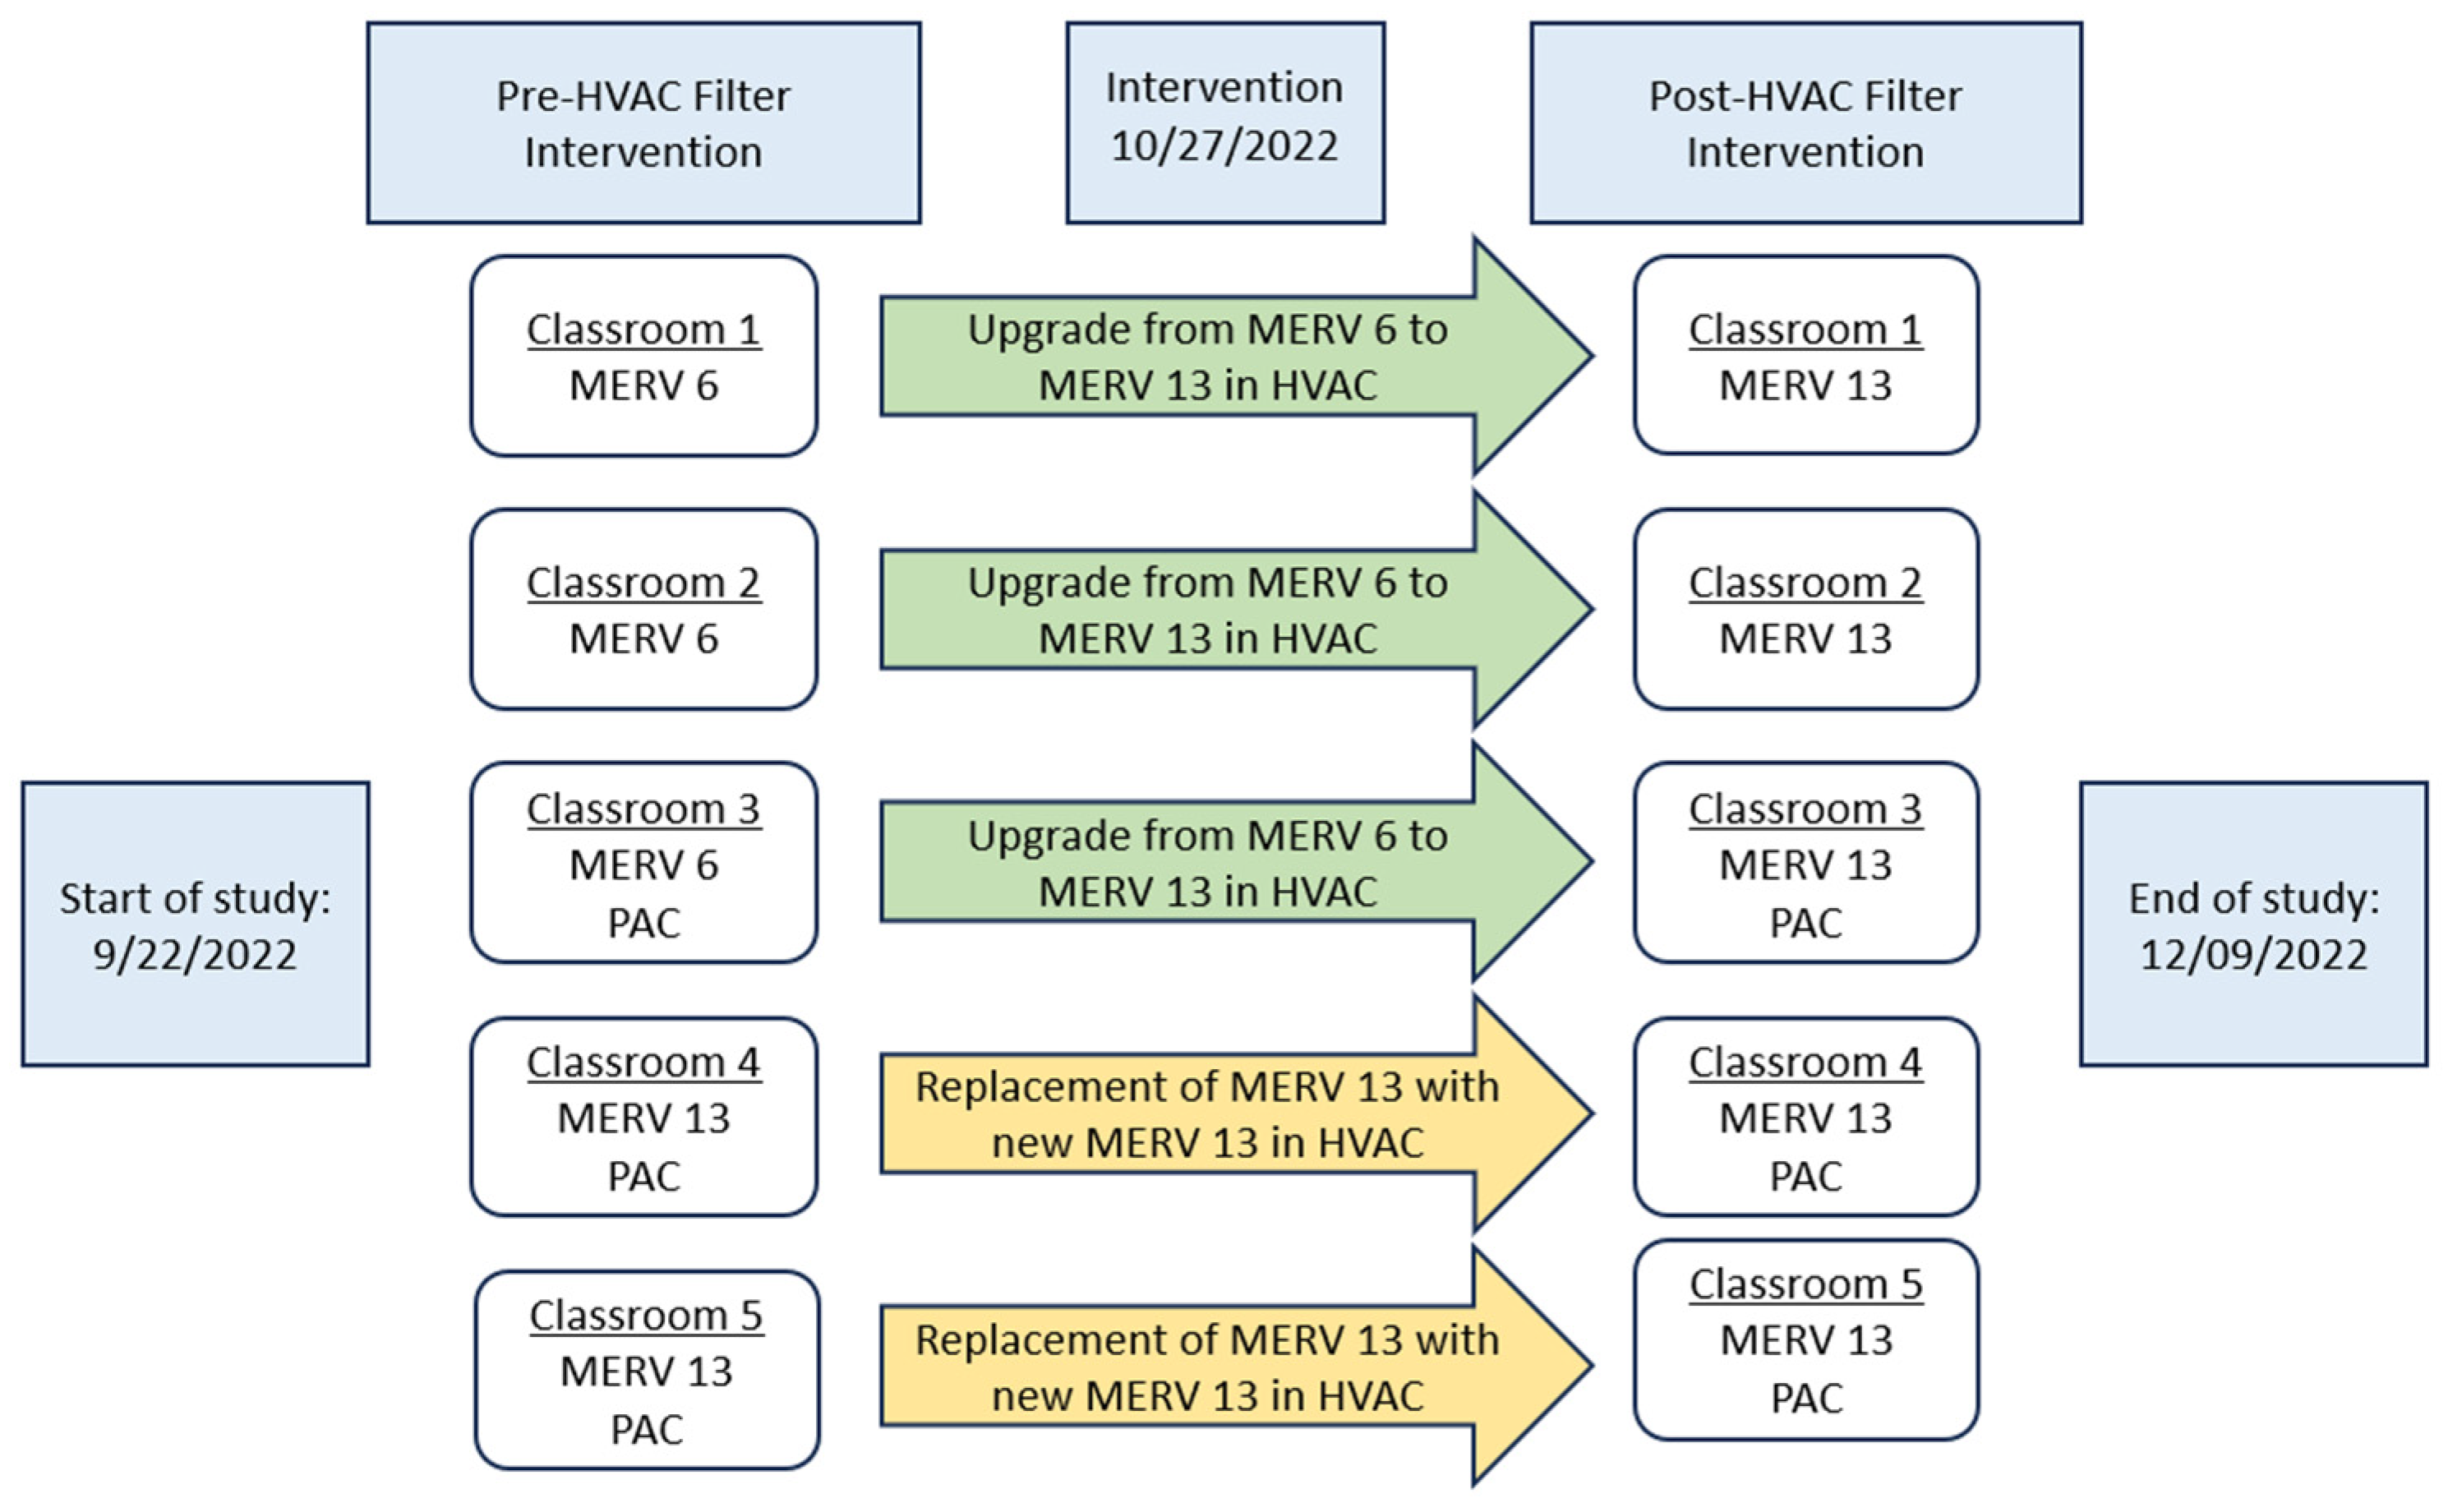
2.1. Study Setting and Design

This is an observational study with a nested intervention component, conducted at a Kindergarten—Grade 8 school in Stockton, California. The school is located within 2.5 miles and downwind of two heavily-trafficked freeways and the Port of Stockton, each to the northwest of the school site. The facility includes a total of nine classrooms, five of which were included in the present study (Figure 1). These five classrooms were chosen to match the classrooms that were included in a prior pilot study of air pollution at this school site [22,23]. Each classroom had its own door that opens to the outdoors, as well as its own decentralized HVAC system. Classrooms 1–3 were permanent classrooms with packaged unit HVAC systems (roof mounted) and adjustable dampers. Classrooms 4 and 5 were portable classrooms with Bard HVAC systems (wall mounted) and dampers that could not be adjusted. The windows in the classrooms did not open.
This study was designed to evaluate two types of air filtration strategies: portable air cleaners (PACs) and improved HVAC filters. The PACs were present in three of the five classrooms throughout the duration of this study (September–December 2022). Halfway through the study period, an intervention was implemented in which improved HVAC filters (MERV 13s) were installed in all five classrooms. The effectiveness of the air filtration strategies was assessed by their ability to reduce PM2.5 concentrations in the classrooms as measured by air monitors (PA-II, PurpleAir, Draper, UT, USA) deployed in all five participating classrooms and at two outdoor locations on the school premises. Classroom enrollment numbers were collected from school administrators.
This study was conducted under real-world conditions to assess how these air filtration strategies perform in the variable environment of occupied classrooms in a community with limited resources and high burdens of air pollution. We did not dictate specific settings for the portable air cleaners or the HVAC systems. At the start of the study period, we set the HVAC systems to “Fan On”, but the teachers were able to adjust the settings of their HVAC system (i.e., Fan On/Fan Auto, Heat/Cool/Off) and the portable air cleaners as they usually would.

2.2. Air Filtration Strategies

2.2.1. Portable Air Cleaners (PACs)

Before this study, we installed portable air cleaners (HealthPro Plus Air Purifier, IQAir, Goldach, Switzerland) in three of the five classrooms. These portable air cleaners are designed to filter aerosolized particles of all sizes, as well as gases and odors. They have six levels of fan speed settings, which the teachers were able to choose and adjust throughout this study. The air-flow rates corresponding to speed levels of 1–6 are 70, 130, 220, 290, 340 and 510 cubic meters per hour (m3/h), respectively [25]. The air cleaners use HEPA filters and are stated to remove more than 99% of PM2.5 from the air that flows through them.
Combining the given air-flow rate and HEPA filter removal efficiency, we estimated the clean air delivery rate (CADR) at each speed level using “air-flow rate × filter efficiency.” The equivalent clean air changes per hour (ACH) in each classroom were then calculated as “CADR/classroom volume”. The calculation results are provided in the Supplementary Materials, Table S1. It should be noted that these results are only based on theoretical calculations. We did not experimentally verify the equivalent ACH provided by PACs.
To continuously monitor and record when and what speed settings the PACs were on throughout this study, power use data loggers (HOBO UX 120-018, ONSET, Bourne, MA, USA) were installed on each portable air cleaner. Details on how these data loggers help to determine the speed setting (and therefore the flow rate of the PAC) are available in Section 2.3.

2.2.2. Improved HVAC Filters

Approximately halfway through the study period, we installed new MERV 13 filters in the return vent of the HVAC system in all five participating classrooms. MERV 13 filters are reported to capture at least 85% of fine particulate matter (PM2.5) in the air that passes through them [20].
Informed by a recent HVAC assessment, and in consultation with school staff, we designed this study under the assumption that prior to the start of this study, all five rooms’ HVAC systems had filters with a MERV 6 rating. However, at the start of this study in September 2022, only three of the classrooms had the MERV 6 filters. The remaining two classrooms already had filters with a MERV 13 rating, which had been installed in late July 2022 unbeknownst to the study team and school staff. As a result, only Classrooms 1–3 received the intended HVAC filter upgrade from a MERV 6 to a MERV 13. ASHRAE recommends that HVAC filters be replaced approximately every three months; so, we replaced all five classroom filters with new MERV 13 filters at the intervention point (27 October 2022), as the two original MERV 13s in Classrooms 4 and 5 were three months old by that time [18]. Filter details are in the footnotes of Table 1. An intervention timeline is provided in Figure 2.
On the day we installed the new MERV 13 filters (i.e., 27 October 2022), we measured both the supply and return air-flow rates in each classroom using a balometer (CH-15D Standard Hood, Evergreen Telemetry, Mesa, AZ, USA) and then converted the measurements to ACH based on classroom volume. The measurements were conducted immediately before and after the filter change (with the HVAC fan on, after school with no students present). The measurement results are provided in the Supplementary Materials, Table S2. The equivalent ACH provided by a HVAC filter is impacted by factors such as how frequently the HVAC fan is run and how well the filter bypass is minimized. In addition, the MERV ratings are established based on size-resolved removal efficiencies for 0.3–10 μm particles. Therefore, the equivalent ACH will also vary for different particle sizes. Since not all of the above-mentioned factors were fully controlled or documented in our study, it is difficult to accurately calculate the equivalent ACH provided by a HVAC filter.

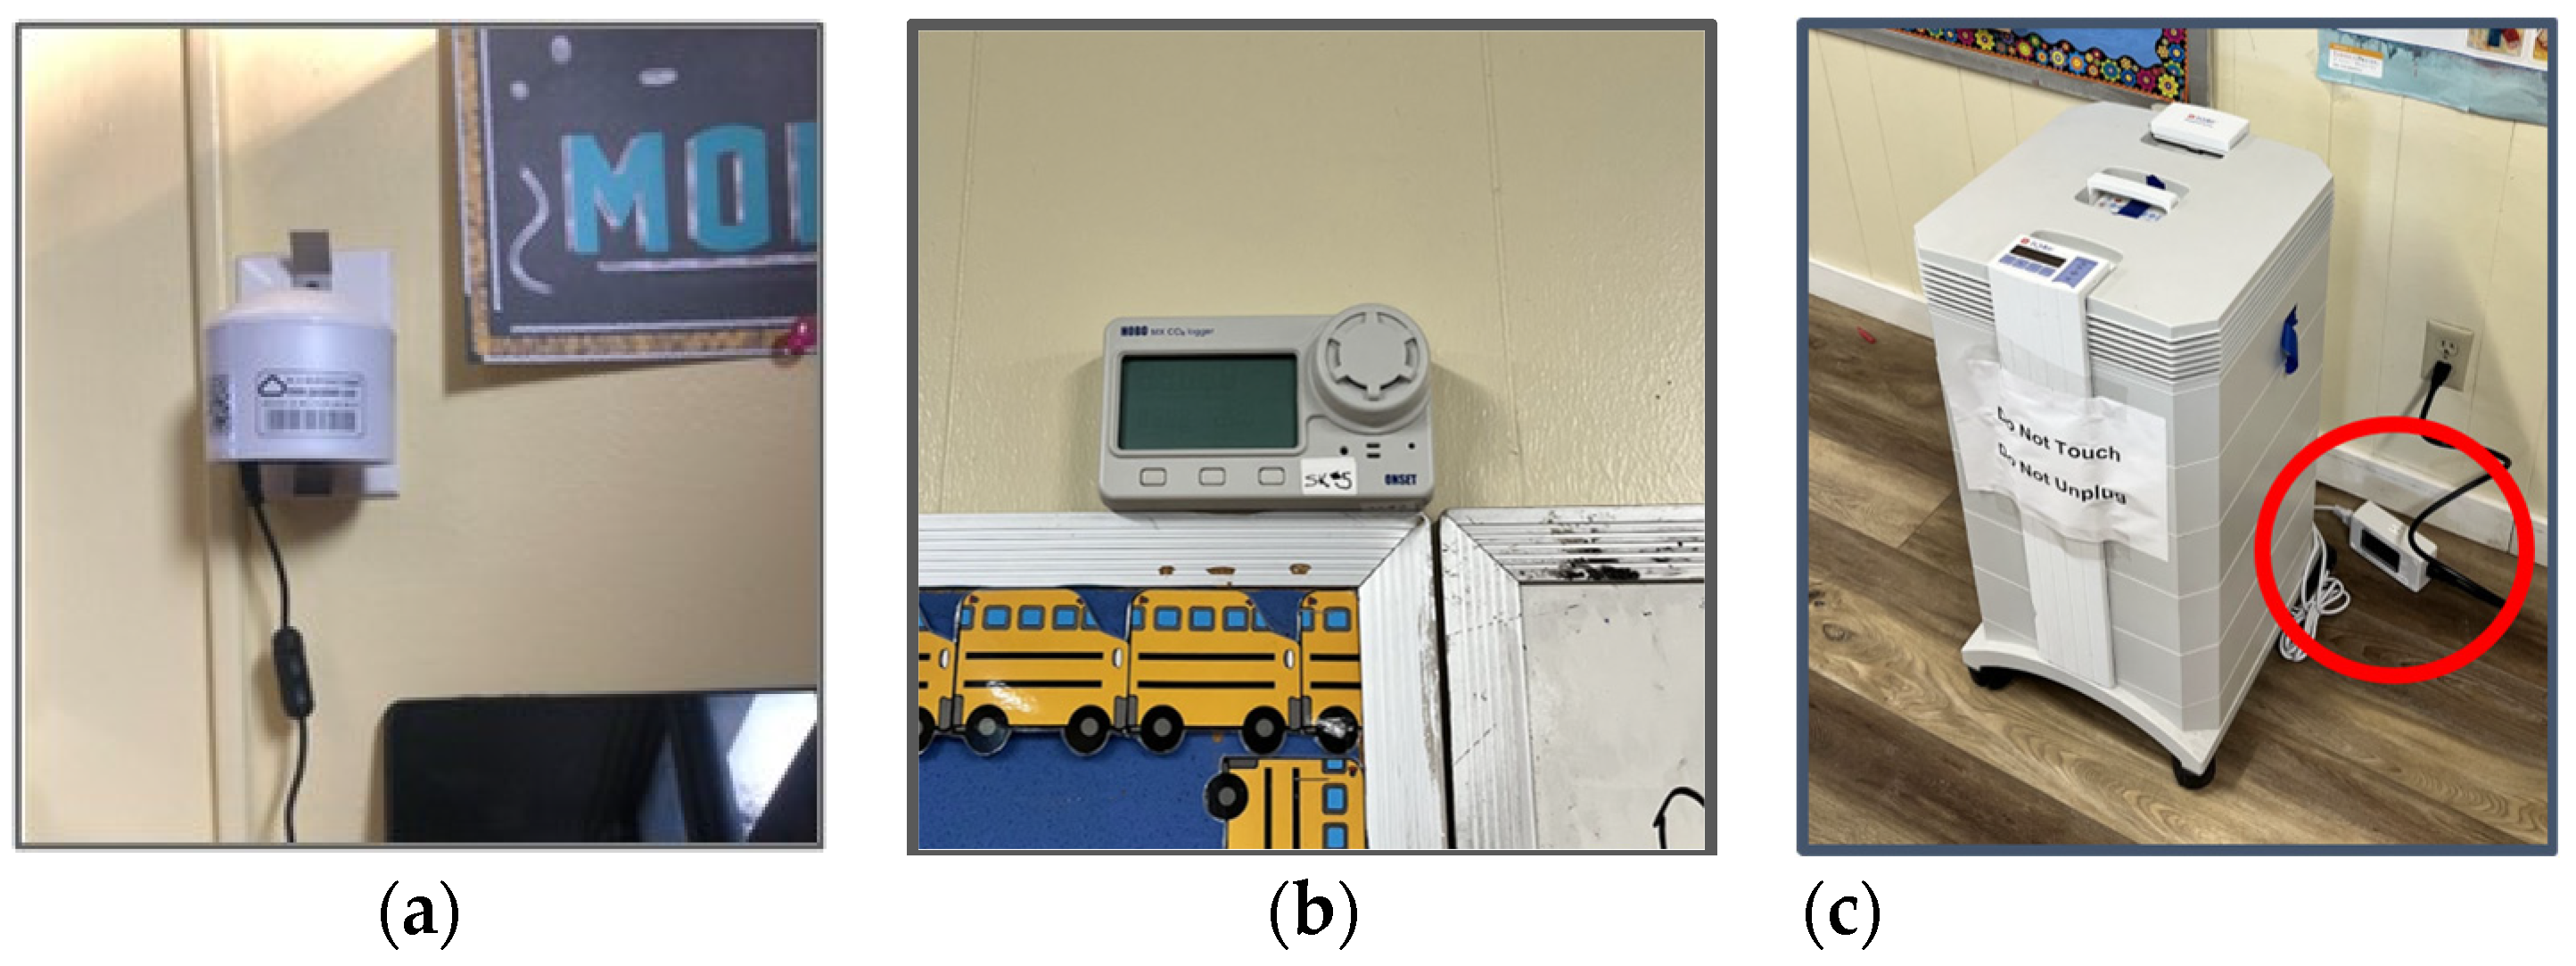
2.3. Data Collection

Each classroom was equipped with monitors and data loggers to measure PM2.5, CO2, and the use of the portable air cleaners over time (Figure 3). PM2.5 was also monitored at two outdoor locations on school grounds to provide context for the indoor air quality measurements. These air quality monitoring locations are labeled in Figure 1.
The primary outcome measured in this study was PM2.5 in the classrooms, measured by low-cost monitors with laser particle counters that estimate mass concentrations by light scattering (PA-II, PurpleAir, Draper, UT, USA) [29,30]. The monitors were tested prior to deployment and the PM2.5 data were calibrated by SJVAir, which is a coalition of community-based nonprofits in the San Joaquin Valley who maintain a network of low-cost air quality monitors [31]. Details on the monitor testing and calibration are provided in Appendix A. The indoor PM2.5 monitors were installed at approximately breathing height. The outdoor PM2.5 monitors were installed under the eaves on the outside of the buildings, approximately 8 feet above the ground.
Real-time CO2 concentrations were recorded by data loggers (HOBO MX1102, Onset, Bourne, MA, USA) mounted on classroom walls at approximately breathing height [32]. As a proxy measure of ventilation, the CO2 data contributed to our understanding of classroom conditions and HVAC system use.
Portable Air Cleaner (PAC) power-usage data loggers (HOBO UX 120-018, Onset, Bourne, MA, USA) were deployed on each PAC to continuously record the power usage which is linked to the speed settings of the PAC [33]. The relationship between power use data and PAC speed settings was pre-determined by measuring the power consumption at different speed settings for each PAC before the study period, reported in Table 2. The data loggers were used to inform interpretation of the PM2.5 concentrations and discussion about the use of PACs and their feasibility as a solution.
Details on data collection are provided in Table 3. All air monitoring measurements were collected for approximately 11 weeks.

2.4. Data Analysis

Analyses were completed using R Statistical Software version 4.3.1 [34]. PM2.5 data were averaged hourly prior to analysis [35]. Data included for evaluation of the air filtration strategies include only school hours (weekdays, 8:00–15:00), as this is the period most relevant to children’s school exposures. Days with any missing school hours were excluded, resulting in the inclusion of 21 school days (147 h) pre-HVAC filter intervention, and 21 school days (147 h) post-HVAC filter intervention. For outdoor monitors, daily PM2.5 averages were also calculated, including all days with at least 22 hours of data, to illustrate the trend in ambient air pollution.
Based on previous literature, we evaluated the effectiveness of the air filtration by percent reduction in classroom PM2.5 concentrations compared to concurrent outdoor concentrations, calculated from the hourly PM2.5 values as [(Outdoor Concentration—Indoor Concentration)/Outdoor Concentration] × 100 [5,15,36]. Indoor/Outdoor (I/O) ratios were also calculated. Although the two outdoor PM2.5 monitors were highly correlated (r = 0.97), we used the outdoor monitor closest to each classroom for these indoor/outdoor calculations. The particle filtration effectiveness values were compared in each classroom before and after the HVAC filter intervention via a Wilcoxon signed-rank test, as well as across the classrooms and their different filtration scenarios (PAC, no PAC, MERV 6, MERV 13).
Speed-setting data from the PAC usage data loggers were reviewed and used to help interpret the comparison of particle filtration effectiveness values.
CO2 concentrations are often used as a proxy indicator for ventilation adequacy. There are four methods for quantitively estimating classroom ventilation rates (VRs) based on CO2 monitoring, using occupant-exhaled CO2 as a tracer gas: steady-state, decay rate, build-up, and transient mass balance methods [37]. All these methods are based on the mass balance model assuming a well-mixed single zone. The transient mass balance method uses time-resolved occupancy and CO2 observations and has the least restrictions for applicable conditions, but it involves more complex numerical calculations. The other three methods are easier to use, but require that the number of students, the outdoor VR, and the outdoor CO2 concentration can be approximated as constants during the analysis period. The steady-state method is easiest to use and requires minimum model input parameters. This method has been found to have the least uncertainty in estimating classroom VRs when compared with decay and build-up methods [38]. Several previous school studies used this method to estimate classroom VRs [38,39,40,41,42]. However, when using the steady-state method, the cumulative student-occupied hours need to be sufficiently long and the outdoor VRs need to be sufficiently high so that a true (or near) steady-state can be reached within a school day. It is important to note that any VRs related to CO2 measurements reflect the total amount of outdoor air entering indoors. It is not possible to differentiate what percentage of outdoor air enters indoors through the mechanical HVAC system or through open doors via CO2 measurements alone.
In this study, since the HVAC fan operation time, the door-opening conditions and daily student attendance were not fully controlled or documented, we only analyzed the general trend of CO2 concentrations without further estimating VRs due to the concern that the underlying assumptions for using the steady-state CO2 approach to estimate VRs were not fully met in these classrooms. The main purposes of reporting CO2 measurement results are to compare with available classroom CO2 guideline values and to qualitatively illustrate the variations in ventilation and occupancy conditions in these classrooms, which can be useful in informing the interpretation of PM2.5 results.

3. Results

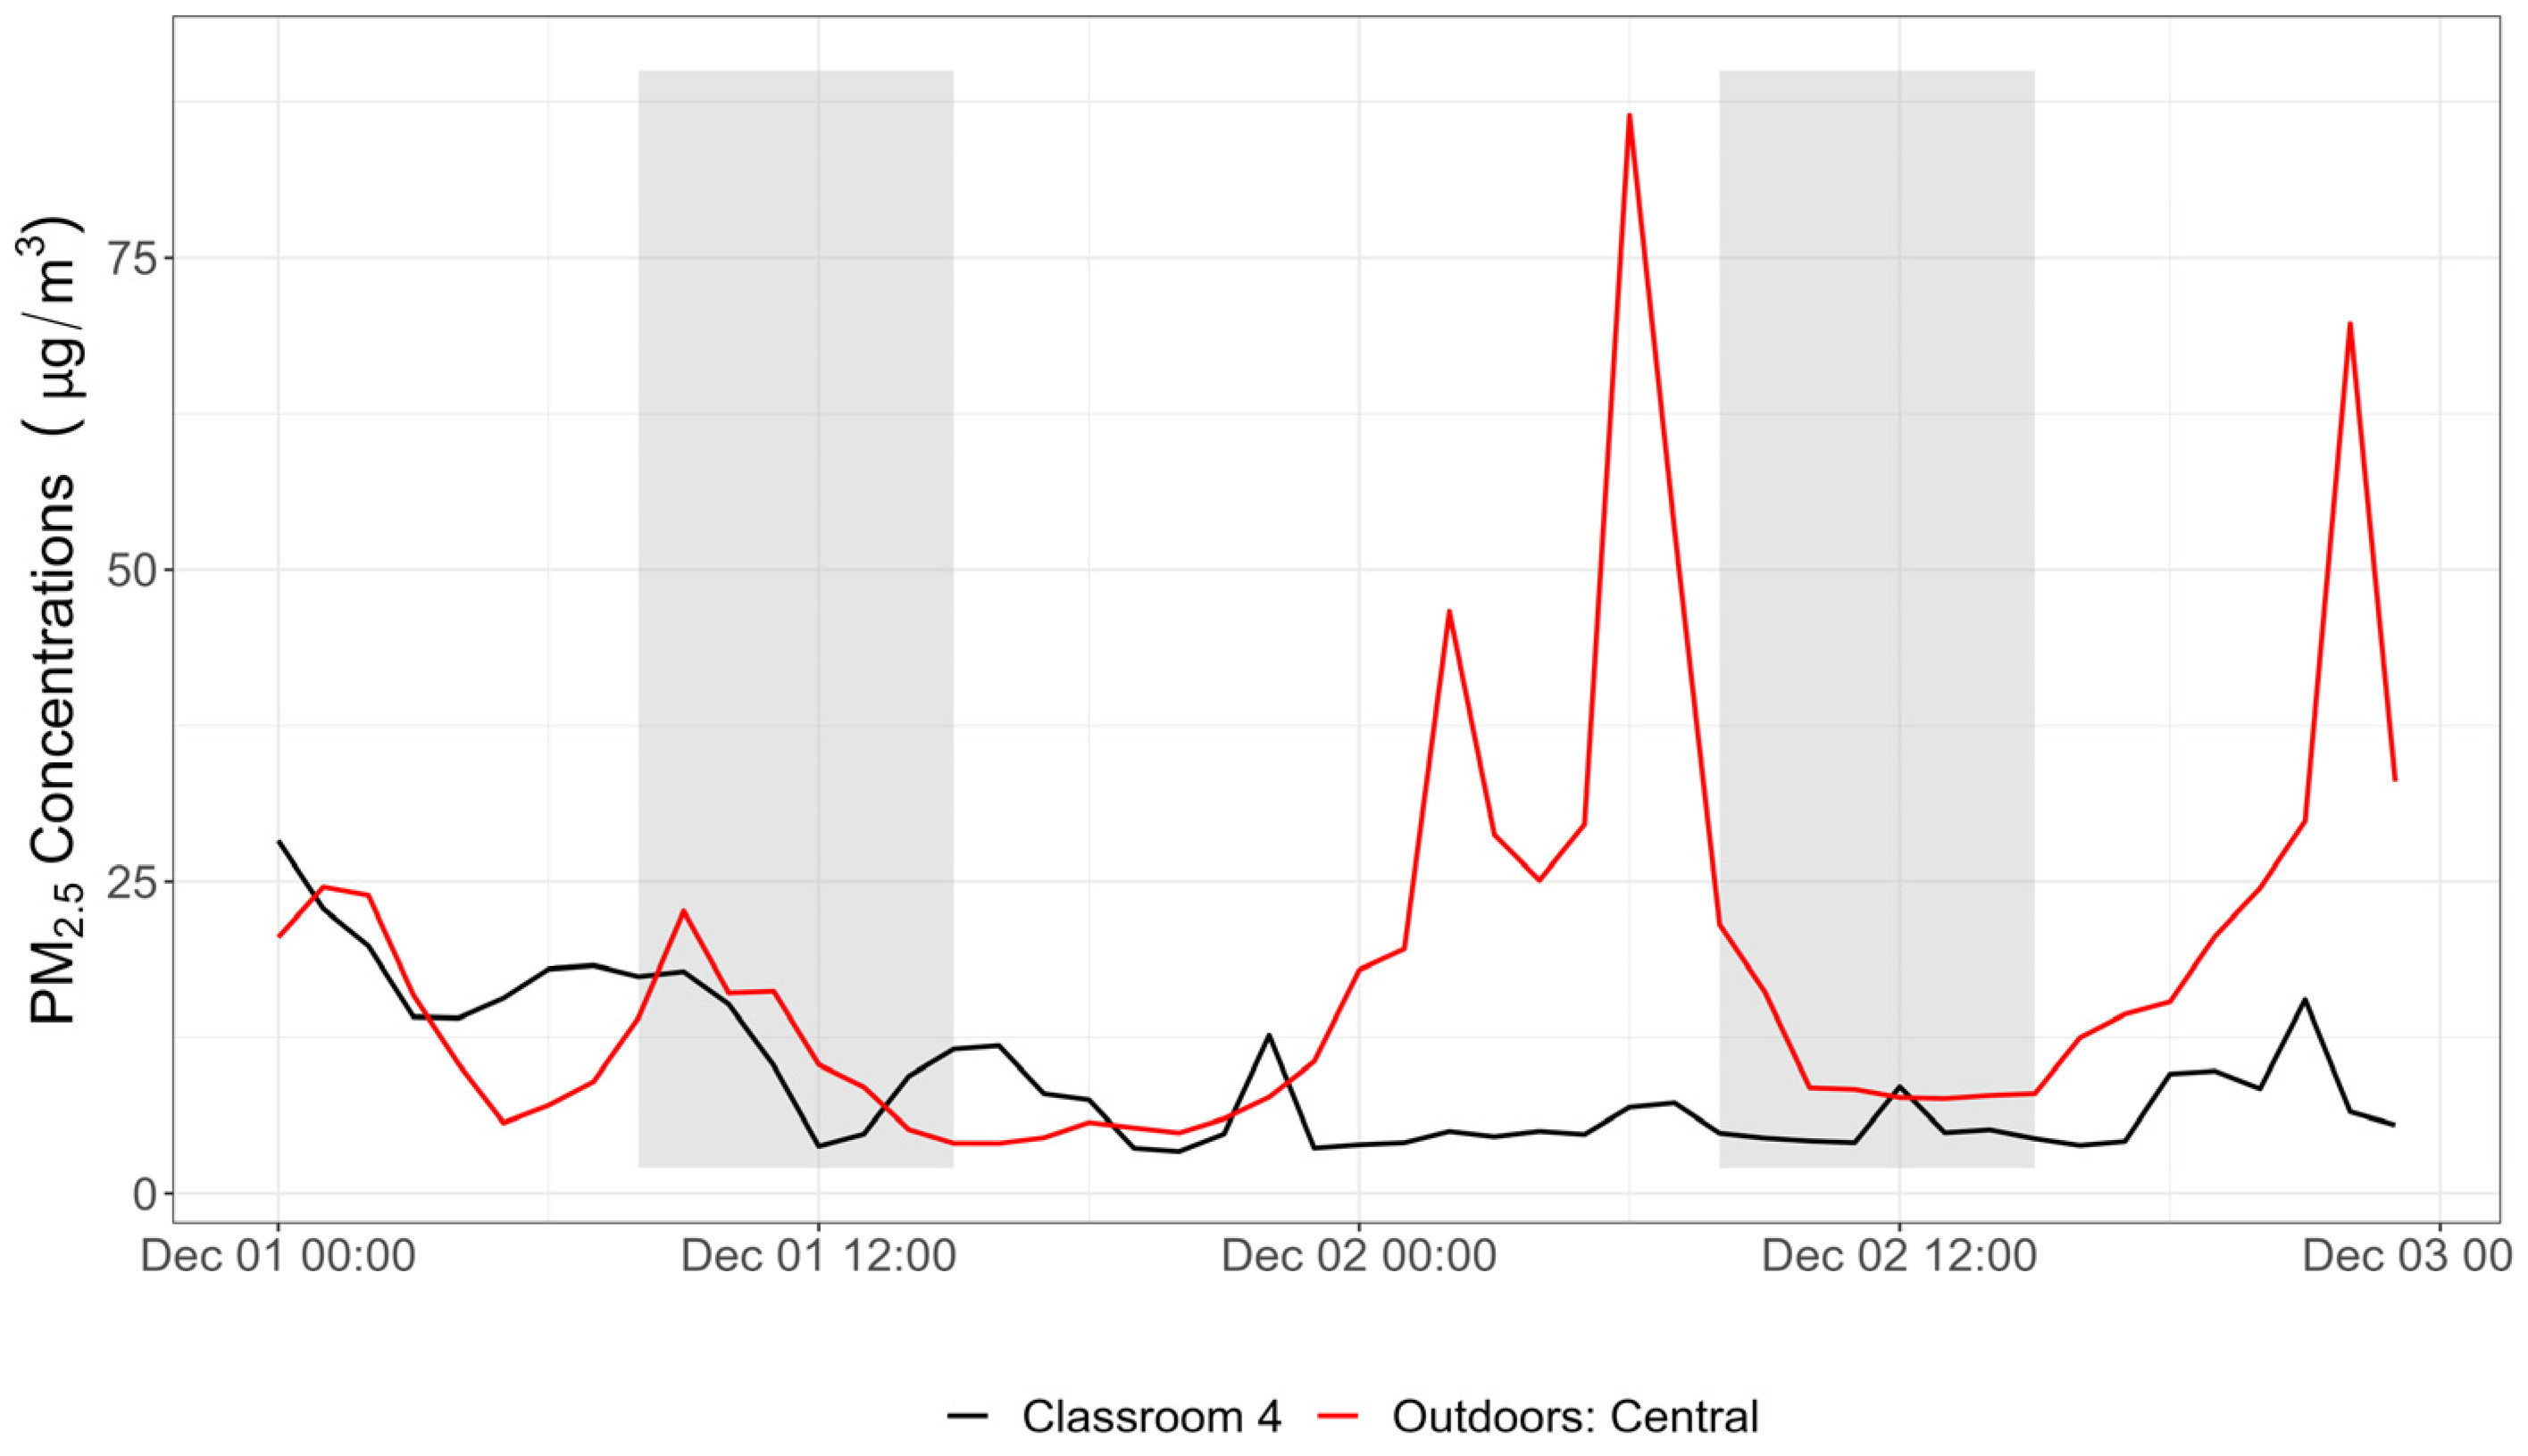
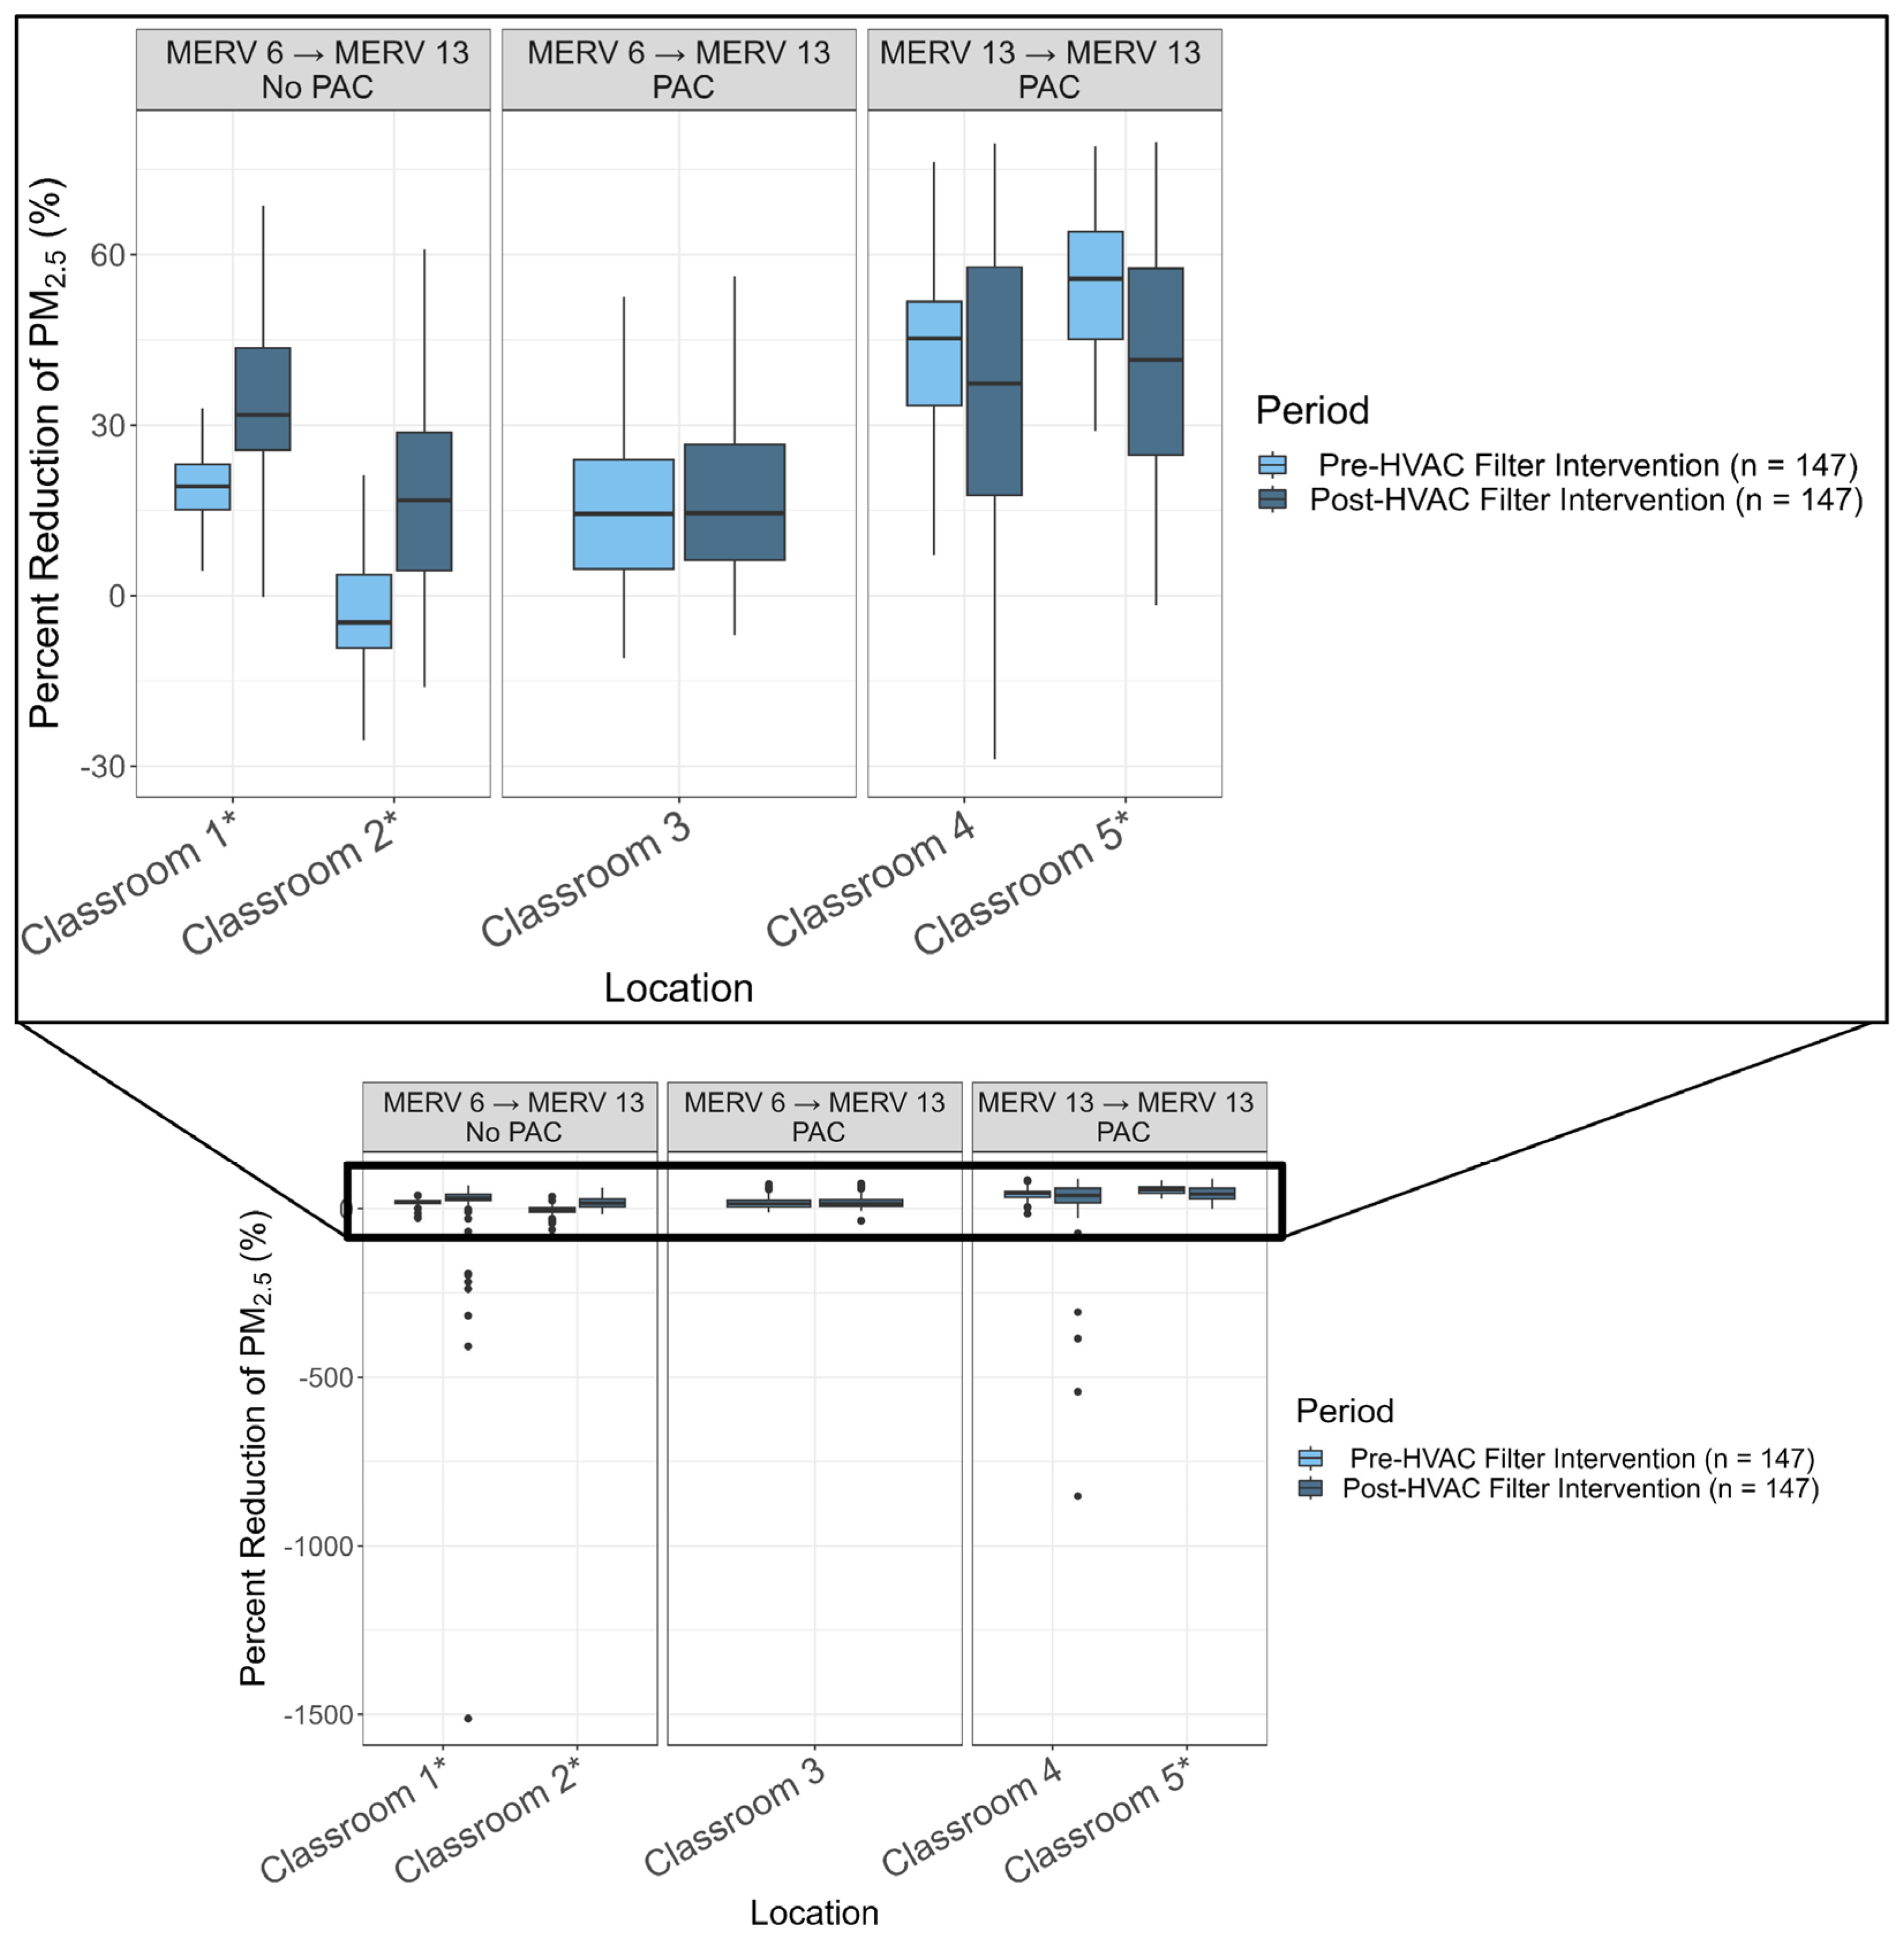
3.1. Fine Particulate Matter (PM2.5)

Average PM2.5 concentrations were higher in almost all outdoor and indoor locations in the post-HVAC filter intervention period, compared to the pre-HVAC filter intervention period (Table 4). This is expected due to known seasonal trends in particulate matter concentrations in the San Joaquin Valley where ambient PM concentrations increase during the winter months due largely to weather conditions, such as thermal inversions, that can lead to air stagnation and buildup of PM in the valley [43,44]. Trends in daily outdoor PM2.5 concentrations at the school are presented in Figure 4. Daily outdoor concentrations exceeded the U.S. Environmental Protection Agency’s (EPA) 24 h standard for ambient PM2.5 (35 µg/m3), as well as the World Health Organization’s (WHO) 24 h air quality guideline (AQG) for ambient and indoor PM2.5 (15 ug), on multiple occasions.
Outdoor concentrations during the study period were higher on average during non-school-hours (mean = 15.9 µg/m3 and 16.7 µg/m3 for Outdoors: North and Central, respectively), compared to school-hours (mean = 11.1 µg/m3 and 10.3 µg/m3 for Outdoors: North and Central, respectively). This is due in part to the impact of maximum PM2.5 concentrations seen during the Thanksgiving holiday week when school was not in session (20 November 2022–27 November 2022). It may also be due to pre- and post-school traffic elevating the non-school hour average. These higher concentrations during non-school hours are also consistent with reported trends that PM builds up overnight in the winter in the San Joaquin Valley [45]. As a result, differences in concentrations between the pre- and post-HVAC filter intervention periods are likely less pronounced when looking only at school hours to evaluate the filtration effectiveness, as in Table 4. We chose, however, to focus our analyses for the evaluation of the air filtration on school hours because this is the timeframe that is relevant for children’s exposures at the school. Note that average outdoor concentrations observed in this study both during and outside of school hours exceeded the EPA’s annual standard for ambient PM2.5 of 9 µg/m3 and the WHO’s annual AQG for ambient and indoor PM2.5 of 5 µg/m3, which aim to protect against harm from long-term exposure [46,47]. These observed ambient concentrations highlight the importance of filtering outdoor air entering indoors to reduce air pollution exposures in classrooms.
To account for the changing outdoor concentrations over the course of the study period, we focused on the percent reduction in PM2.5 in classrooms compared to concurrent outdoor concentrations as a measure of particle filtration effectiveness. Figure 5 and Appendix B, Table A1 summarize the particle filtration effectiveness achieved in each classroom during school hours, before and after the HVAC filter intervention. I/O ratios are also presented in Appendix B, Table A2.
The MERV 13 HVAC filters and PACs, alone and in combination, demonstrated 14–56% particle filtration effectiveness. During the pre-HVAC filter intervention period, there appeared to be better particle filtration in the classrooms with MERV 13s (i.e., Classrooms 4 and 5) compared with the MERV 6s (i.e., Classrooms 1, 2 and 3). Large variability in the data, driven by small sample size and varying classroom conditions, prevents the statistical comparison between these classrooms, but visual inspection of Figure 5 suggests that the MERV 13 filters provided some benefit. For classrooms with MERV 6s, the PAC did not appear to increase particle filtration, though this is likely impacted by varying classroom conditions which are discussed below.
To statistically evaluate the effect of the improved HVAC filters, we compared the median PM2.5 filtration effectiveness in each classroom, pre- and post-HVAC-based filter intervention (Table A1). Classrooms 1, 2 and 3 received the intended HVAC filter intervention: they were upgraded from MERV 6 filters in their HVAC system to MERV 13s. The two classrooms (1 and 2) that did not have portable air cleaners saw statistically significant improvements in particle filtration (Wilcoxon signed-rank test p value < 0.05) with the installation of the MERV 13 filter (11%, p < 0.001 and 22%, p < 0.001). Classroom 2 saw the largest improvement in particle filtration, increasing from −5% to 17% reduction in fine particles. The negative particle filtration effectiveness value pre-intervention suggests considerable indoor sources of PM2.5 in this classroom. Classroom 3, which had a portable air cleaner running for the duration of this study, did not see a significant improvement in filtration after the HVAC filter upgrade (0.11%, p = 0.12).
Classrooms 4 and 5 received new MERV 13 filters to replace their three-month-old MERV 13 filters during this study intervention and had portable air cleaners running for the duration of this study. As this replacement did not change the filter rating, we would not expect substantial improvements in particle filtration and did not see improvements in either classroom. In fact, both classrooms reported declines in filtration (−7%, p = 0.08 and −13%, p < 0.001). The decline in effectiveness likely resulted in part from behavior changes, explained further in the Discussion section. However, both classrooms reported the highest particle filtration effectiveness of all classrooms throughout the study period.
The air filtration solutions observed in this study brought average classroom concentrations below the EPA’s annual ambient standard of 9 µg/m3 in all but one classroom (Classroom 1), while only one classroom (Classroom 5) reported an average PM2.5 concentration below the WHO’s indoor annual guideline of 5 µg/m3.

3.2. Portable Air Cleaner (PAC) Use

Portable air cleaner usage data show that the PACs in each of the three classrooms were run consistently over the entire study period. Via the pre-determined power use and speed-setting relationship, the plug load logger data showed that the PACs in Classrooms 3 and 5 were set to Speed 3 (220 m3/h), and the PAC in Classroom 4 was set to Speed 5 (340 m3/h) for the duration of this study (Table 2, Figure 6).

3.3. Carbon Dioxide (CO2)

Figure 7 presents the distribution of daily 95th percentile of classroom CO2 concentrations during school hours before and after the HVAC filter intervention. The daily 95th percentile or maximum CO2 concentrations during school hours are commonly used as an approximation of steady-state CO2 concentration for estimating ventilation rates (VRs) based on the mass-balance equation because directly measuring outdoor ventilation rate airflows under real-world conditions can be difficult in many classrooms [38,41,42,48]. It should be noted that VRs can only be accurately estimated using 95th percentile (or maximum) CO2 concentrations if a true (or near) steady-state has been reached during a school day. The real-time CO2 data can help to illustrate if true (or near) steady-state has been reached. If the steady-state mass balance equation is applied to CO2 concentrations measured before reaching steady state, or if steady state is never reached, the VR will be overestimated [49]. Although there is no CO2 guideline value for existing California classrooms, the 2022 California Green Building (CalGREEN) Code set an indoor CO2 threshold of 1100 ppm for triggering notification to the facility staff or the teacher in newly constructed K-12 classrooms [50].
Our monitoring results show that the 95th percentile daily CO2 concentrations varied for different days in each classroom and among different classrooms. Three of the classrooms (classrooms 1, 4 and 5) regularly exceeded this threshold value of 1100 ppm. In particular, Classroom 5 had significantly higher daily 95th percentile CO2 concentrations for both pre- and post-HVAC filter intervention, suggesting it had the worst overall ventilation conditions during occupied school hours among all the classrooms studied. Classroom 5 did have the highest occupancy, and a very small opening for outdoor air in the HVAC system (Figure 8). Note that both Classrooms 4 and 5 are portable classrooms. These CO2 monitoring results are generally consistent with observations from previous studies that inadequate ventilation tended to occur more often in portable classrooms [26,51].
The results also indicate that there were significant differences between the distributions of daily 95th percentile CO2 concentrations during the pre- and post-HVAC filter intervention periods in some classrooms, and the reason is not fully clear. There are many factors that may influence classroom CO2 concentrations, including the number of students in each classroom and classroom occupancy schedule, the actual operation status of the mechanical ventilation system, the door-opening behaviors, and the classroom envelope tightness. Some hypotheses will be discussed in the Discussion section.
Regarding the relationship between CO2 and PM2.5 concentrations, some previous studies observed a high correlation between them in some school environments [52,53]. In our study, we observed increases in CO2 concentrations in classrooms during the occupied school hours in general. For each school day, the indoor CO2 concentration began to increase at the beginning of school when students entered the classroom. Indoor CO2 had a dynamic increase or decrease depending on the class bell schedule during the day. After the dismissal of the students, it gradually decreased. There were also occasionally increases in CO2 concentrations outside of school hours (evenings, weekends, etc.) due to other gathering activities in some classrooms. As for PM2.5 concentrations, they regularly peaked at the beginning of the school day. Throughout the school day, PM2.5 concentrations dynamically changed based on the bell schedule, but also followed trends in ambient air pollution and experienced increases likely due to additional indoor sources. There were occasional peaks in classroom PM2.5 outside of school hours due to after-school gathering activities, cleaning, and peaks in outdoor concentrations. Outside of those events, PM2.5 concentrations in classrooms with PACs generally declined overnight; however, PM2.5 concentrations in classrooms without PACs were often higher overnight in parallel with outdoor concentrations. These daily patterns are explored further in the Discussion section. Although some similarities exist in CO2 and PM2.5 generation as related to human activities as well as their removal by ventilation, there are PM2.5 sources indoors besides human activities, more variation in outdoor PM2.5 concentrations compared to outdoor CO2, and more PM removal mechanisms (e.g., surface deposition and filtration). Therefore, we did not conduct a further systematic correlation analysis between CO2 and PM2.5 concentrations.

4. Discussion

4.1. PM2.5 and Filtration Effectiveness

Overall, the PM2.5 filtration effectiveness achieved by the air filtration strategies evaluated in this study (14–56% particle removal) was consistent with most other studies [15,17,54]. However, Polidori’s study of air filtration in California classrooms reported much higher PM2.5 filtration effectiveness (>85%), at similar average outdoor concentrations [5]. The higher effectiveness reported in Polidori’s study may be explained by variation in the factors that impact observed filtration effectiveness and associated classroom PM2.5 concentrations unique to our study setting, including indoor sources, room volume, and both natural and mechanical ventilation. Research suggests adverse health effects at low PM2.5 concentrations; so, it is important to consider and address the impact of the aforementioned elements, in addition to ambient concentrations [46,55,56].
Added indoor sources of PM2.5 can drive the indoor air concentration up, working against improvement in the removal of other pre-existing and ambient sources of particulate matter. Classroom 1 and Classroom 4’s filtration effectiveness distributions included notable negative outliers in the post-intervention period, suggesting peaks in indoor generated PM (Figure 5). Classroom 1’s outliers are likely due in part to an essential oil diffuser that had been added to a classroom shelf directly next to the PM monitor, after the date of the HVAC filter upgrade and before the conclusion of this study (confirmed by photos taken at site visits). Classroom 4 also reported noticeable peaks in PM2.5 that did not follow patterns of the outdoor PM2.5 concentrations, which suggests significant contribution from indoor sources, including cleaning activities before school hours as well as occupant activity during the school day. In Appendix C, Figure A1 and Figure A2 show these trends in Classrooms 1 and 4’s I/O relationships.
In addition to indoor sources and fixed characteristics like room volume and HVAC system design, the observed effectiveness of the filtration interventions likely reflects the impact of modifiable factors such as the amount of time that the HVAC system fan was running. One key constraint of this evaluation is that the HVAC system fans were turned to “auto” rather than “on” in all classrooms by school staff shortly after the study period began, which significantly reduces the performance of HVAC-based filtration. When set to “auto”, the system only pulls air through the filter, and therefore removes particles from it, when the heating or cooling is active. We would expect to see buildup of both PM and CO2 more readily in classrooms running on fan “auto” mode. Use of the fan “auto” setting may have been due to a misunderstanding of the various settings of the HVAC system and their role in air filtration. The study team did not intervene when this was noticed because this study aimed to evaluate the effectiveness of this filtration system under such real-world conditions. This finding highlights a need for improving the understanding of how to optimize behaviors surrounding HVAC system use to see the maximum benefit of HVAC-based MERV 13 filters in classrooms, such as by leaving the fan set to “on”.
We observed that the HVAC systems were turned off (thermostat: off, fan: auto) at the end of each school day to conserve energy and costs. In classrooms without PACs, PM2.5 concentrations generally followed trends in ambient concentrations outside of school hours. In classrooms with PACs, PM2.5 concentrations generally declined overnight. As mentioned previously, all classrooms experienced peaks in concentrations due to after-school activities and outdoor sources, but the impact of the after-school peaks was reduced in classrooms with PACs. The overnight trends suggest that when the HVAC system is off, there is substantial infiltration of outdoor air and that the pollutants build up without active filtration and ventilation. While we cannot compare the impact of the HVAC modes directly as we do not know exactly when the HVAC was on during the day, this trend highlights the importance of running the HVAC system during school hours such that there is positive pressure in the classrooms.

4.2. Portable Air Cleaner Use

The data confirming stable use of each portable air cleaner enable us to conclude that changes in PM2.5 concentration levels before and after the MERV 13 installation were not due to changes in the PAC use. The consistent use of the portable air cleaners suggests that noise and other barriers were not too disruptive to prevent classroom use. This pattern of use indicates that PACs are a feasible option for classroom air filtration, albeit sometimes an expensive option when compared to the cost of upgrading filters in an existing HVAC system. The limited impact of PACs observed in this study may be due at least in part to moderately low median PM2.5 concentrations (4–8 µg/m3) in classrooms with PACs. The small number of classrooms with PACs, and their varying classroom conditions, also mean that these results may not be conclusive.

4.3. Ventilation and Particle Filtration Effectiveness

If the number of students and student occupancy schedule are similar during the pre- and post-HVAC filter intervention periods, we expect the 95th percentile of CO2 concentrations to remain similar in each classroom under the assumptions that the mechanical ventilation system continuously runs, and the doors remain closed during the class time. However, we observed significantly lower CO2 concentrations in some classrooms (Classrooms 2, 3 and 4) and higher CO2 concentrations in other classrooms (Classrooms 1 and 5) after filter replacement. This implies that the amount of time during which HVAC system fans were running, and the teachers’ behaviors of opening doors, might have changed during the post-HVAC filter intervention period due to the change in outdoor weather conditions or other unknown factors. It also suggests that these conditions differ among the classrooms studied.
As mentioned earlier, we observed that the outdoor PM2.5 concentrations were higher during the post-HVAC filter intervention period. If the lower CO2 concentrations during the post-HVAC filter intervention period were caused by greater time with open doors, the increased amount of unfiltered outdoor air may lead to less indoor PM2.5 reduction. On the other hand, if the lower CO2 concentrations during the post-HVAC filter intervention period were caused by an increased amount of time with the HVAC system running, the increased amount of filtered outdoor air may lead to higher indoor PM2.5 reduction. To accurately interpret the impact of ventilation on the change in PM2.5 concentration reduction before and after the MERV filter change, separate measurements for ventilation airflow rates from the HVAC system and from opening doors would be necessary but were beyond the scope of our current study.
Weather data suggest that in general, HVAC systems set on auto were likely running more often during the pre-HVAC filter intervention period due to consistently high outdoor temperatures compared to the post-HVAC filter intervention period in which the outdoor temperature remained temperate and unlikely to trigger classroom heating or cooling systems. This potential reduction in HVAC system use would minimize the observed average impact of the HVAC filter intervention. Further, in Classroom 5, we saw increased CO2 concentrations and decreased filtration effectiveness after the MERV 13 replacement, which is consistent with reduced HVAC system use.

4.4. Limitations

The results of this study should be interpreted with caution because of the variety of classroom and filtration conditions at baseline and the small number of classrooms overall. As an observational study, the lack of detailed information on HVAC system operation and door-opening patterns presents uncertainties in interpreting the impact of mechanical and natural ventilation on classroom PM2.5 concentrations. Without activity diaries, we were also not able to account for indoor PM sources, such as burning candles or other classroom activities, that may cause differences in results amongst classrooms.
Other limitations stem from utilizing low-cost monitors for particulate matter monitoring. We lost some days of data due to monitor issues ranging from unplugged monitors to database updates that paused data collection. Also, there exist some concerns about the accuracy of the PurpleAir sensors at low PM2.5 concentrations; however, recent evaluations report good precision and accuracy at the range of concentrations observed in this study, and the applied spatiotemporally relevant calibration process further improves data quality [57,58]. It is important to note that accuracy concerns are most relevant when PM measurements are used for regulatory purposes or to estimate health effects—neither of which were the focus of the current study. Since we have no reason to believe that the accuracy of the PurpleAir monitors would vary by filtration scenario, it is unlikely that constraints in accuracy would result in spurious findings.

5. Conclusions

To our knowledge, this was the first study to evaluate the prioritized school air filtration strategies of improved HVAC filters and portable air cleaners in occupied classrooms of a school within an AB 617 designated community in California. Implementing effective exposure reduction strategies is critical in AB 617 communities as they have some of the highest air pollution and population health burdens in California. High-efficiency HVAC filters and portable air cleaners are commonly included in AB 617 community emission reduction programs, but their real-world effectiveness has not been comprehensively studied. Most previous intervention studies evaluated these air filtration strategies only under strict conditions, dictated by study design and not necessarily reflective of how they are typically used. The observational design of this study enabled us to evaluate the effectiveness of these two air filtration strategies when used under normal operational conditions of a school in a community highly burdened with air pollution, which gives an indication of how these exposure reduction strategies are working in practice.
All filtration strategies observed in this study brought average classroom PM2.5 concentrations below average ambient levels (Table 4). The small number of classrooms and heterogeneity of ventilation and HVAC characteristics across classrooms precluded our ability to formally evaluate whether the PACs independently improved air quality. The results from the nested intervention study, however, demonstrated that installing high-efficiency HVAC filters in classrooms without PACs significantly reduced indoor PM2.5 exposures. Conversely, the installation of improved HVAC filters in classrooms with PACs did not significantly improve filtration effectiveness at the outdoor PM2.5 levels seen during this study. Overall, these observations suggest that utilizing both air filtration strategies simultaneously may not meaningfully increase the filtration effectiveness under these circumstances. This finding has important implications for an efficient use of resources in the often resource-limited setting of schools in AB 617 communities.
However, PM2.5 and CO2 data suggested that the filtration effectiveness was largely impacted by behavioral factors including variable HVAC system use and door-opening patterns. This highlighted a need for guidance for school personnel on optimal HVAC system settings for filtration, as well as for minimizing indoor sources of air pollution and optimizing natural ventilation with respect to air pollution.
While the observational design of our study prevented a rigorous evaluation of the independent effects of HVAC and PAC air filtration in reducing exposures, it provided a novel opportunity to assess the use of these filtration strategies as they were used in an under-resourced school in a community heavily impacted by air pollution. As such, it was able to identify some pragmatic solutions to improve air quality. Perhaps most importantly, our results suggest that schools utilizing these air filtration strategies could see improvements in filtration effectiveness, and an associated reduction in exposures, with behavior changes that require little to no additional investment. For example, during our study, we learned that it was common practice to set the HVAC system to “auto”, thereby limiting air filtration to times when the air conditioning or heat automatically turns on in response to temperature fluctuations. Thus, improvements in air quality could be enhanced by advising school personnel to program (or manually set) the HVAC system to turn on when children are present regardless of temperature. Additional improvements could be gained by reducing avoidable indoor sources of PM and keeping doors closed when outdoor air quality is poor. While future research is warranted, including more detailed exploration of the impact of these modifiable conditions and how to maximize the benefit from these air filtration technologies in occupied classroom settings, implementation of some of these simple mitigation strategies could provide some immediate improvements in the air that children breathe while at school.

Supplementary Materials

The following supporting information can be downloaded at: https://www.mdpi.com/article/10.3390/atmos15080901/s1, Table S1: Theoretical calculations of equivalent ACH from the use of PACs; Table S2: Classroom HVAC supply and return air-flow rate measurement results.

Author Contributions

Conceptualization, R.C., W.C., S.H. and M.T.; methodology, R.C., W.C., S.H., D.M. and M.T.; validation, M.T.; formal analysis, M.T.; investigation, R.C., W.C., D.M., K.P. and M.T.; data curation, M.T.; writing—original draft preparation, M.T.; writing—review and editing, R.C., W.C., S.H., D.M., K.P. and M.T.; visualization, M.T.; supervision, S.H.; project administration, R.C.; funding acquisition, R.C. and S.H. All authors have read and agreed to the published version of the manuscript.

Funding

This research was funded by the California Office of Environmental Health Hazard Assessment (OEHHA), Agreement Number 19-E0019.

Institutional Review Board Statement

All study instruments and activities were approved by the State of California Committee for the Protection of Human Subjects with reliance obtained from the UC Berkeley Committee for the Protection of Human Subjects (i.e., the Institutional Review Boards (IRBs)). (CPHS project number: 2021-081; date of approval: 25 August 2021). The study was consistent with the guidelines of the Declaration of Helsinki.

Informed Consent Statement

Informed consent was obtained from all biomonitoring subjects involved in the Stockton Air Pollution Exposure Project which provided the funding for the air monitoring equipment and portable air cleaners for the current study.

Data Availability Statement

The raw data supporting the conclusions of this article will be made available by the authors on request. The PM data are publicly available from SJVAir.com.

Acknowledgments

We thank the teachers and staff of the school for supporting this study. We also thank Monique Miller and Alex Muñoz for contributing to the ventilation assessment. The findings and conclusions in this article are those of the authors and do not necessarily represent the views or opinions of the California Department of Public Health, the California Health and Human Services Agency, the California Environmental Protection Agency, or OEHHA.

Conflicts of Interest

The authors declare no conflicts of interest.

Appendix A

The deployed PurpleAir monitors were calibrated by SJVAir using the following quality control and quality assurance process. The monitors were collocated and assessed for intra- and inter-device variability prior to deployment in the field. Monitors had to demonstrate good precision via intra-device (A versus B Channel) or inter-device (between monitors) correlation > 0.98 and average percent variance < 10% to be deployed. Correction equations were generated by regressing local collocated Federal Equivalent Method (FEM)-designated Beta Attenuation Monitor (BAM) and PurpleAir data over different time periods and selecting the best multivariable model fit for the day. The correction equations from the nearest collocation site were then applied to the data from the monitors deployed in this study [31]. If the correlation between the two particle counters (Channel A and B) in each monitor was ≥0.99 and the average percent variance was ≤10%, then the algorithm reported data from the channel with lower concentrations. If the correlation and variation were within these thresholds and there were collocated monitors, the algorithm compared peaks between monitors and reported data from the channels with the lower inter-device percent variance [59].

Appendix B

Table A1 reports the average percent reduction from outdoor to in-classroom PM2.5 concentrations, pre- and post-HVAC filter intervention. Table A2 reports the average PM2.5 indoor/outdoor ratios in each classroom, pre- and post-HVAC filter intervention.
Table A1. Particle filtration effectiveness values in classrooms, pre- and post-HVAC filter intervention.
HVAC Filter InterventionLocationPAC
(Yes/No)
Filtration Effectiveness 1 (%)
Median
Change in Filtration Effectiveness 1 after HVAC Filter Intervention (%)
Pre-HVAC Filter
Intervention 2
Post-HVAC Filter
Intervention 3
Upgrade:
MERV 6 →
MERV 13
Classroom 1 No19.2630.3311.07
(p < 0.001) 4
Classroom 2 No−5.3616.7422.10
(p < 0.001) 4
Classroom 3 Yes: Speed 3 (220 m3/h)14.3814.490.11
(p = 0.12)
Replacement:
MERV 13 →
MERV 13
Classroom 4 Yes: Speed 5 (340 m3/h)45.5038.98−6.52
(p = 0.08)
Classroom 5 Yes: Speed 3 (220 m3/h)55.8743.03−12.84
(p < 0.001) 4
1 Filtration effectiveness calculated as ((Outdoor PM2.5 Concentration—Indoor PM2.5 Concentration)/Outdoor PM2.5 Concentration) X 100. 2 22 September 2022–21 October 2022, excluding 18 October 2022 due to missing data. N = 147 h. 3 1 November 2022–9 December 2022, excluding Veterans Day and Thanksgiving Holiday Week: 11 November 2022, 18 November 2022–28 November 2022. N = 147 h. 4 Statistically significant difference between before and after HVAC filter intervention (Wilcoxon signed-rank test p value < 0.05).
Table A2. I/O ratios of PM2.5 concentrations before and after the HVAC filter intervention.
HVAC Filter
Intervention
LocationPortable Air CleanerMedian I/O Ratio
Pre-HVAC Filter
Intervention
Post-HVAC Filter
Intervention
Upgrade:
MERV 6 → MERV 13
Classroom 1 No0.810.70 *
Classroom 2 No1.050.83 *
Classroom 3 Yes: Speed 30.860.86
Replacement:
MERV 13 → MERV 13
Classroom 4 Yes: Speed 50.540.61
Classroom 5 Yes: Speed 30.440.57 *
* Significant difference between before and after HVAC filter intervention (Wilcoxon signed-rank test, p < 0.05).

Appendix C

Figure A1. Hourly indoor/outdoor ratios comparing (a) Classroom 1 and (b) Classroom 4 with Outdoors: North and Central, respectively in the post-HVAC intervention period. Points above the threshold of 1 (dashed line) indicate hours in which indoor PM2.5 concentrations were higher than outdoors.
Atmosphere 15 00901 g0a1
Figure A2. Example days of PM2.5 concentrations in Classroom 4 and Outdoors: Central, during which some hourly indoor concentrations are greater than outdoors.
Atmosphere 15 00901 g0a2

References

  1. Feng, S.; Gao, D.; Liao, F.; Zhou, F.; Wang, X. The health effects of ambient PM2.5 and potential mechanisms. Ecotoxicol. Environ. Saf. 2016, 128, 67–74. [Google Scholar] [CrossRef]
  2. Sharma, S.; Chandra, M.; Kota, S.H. Health Effects Associated with PM2.5: A Systematic Review. Curr. Pollut. Rep. 2020, 6, 345–367. [Google Scholar] [CrossRef]
  3. Buka, I.; Koranteng, S.; Osornio-Vargas, A.R. The effects of air pollution on the health of children. Paediatr. Child Health 2006, 11, 513–516. [Google Scholar] [PubMed]
  4. World Health Organization; Regional Office for Europe & European Centre for Environment and Health. Effects of Air Pollution on Children’s Health and Development: A Review of the Evidence; WHO Regional Office for Europe: Copenhagen, Denmark, 2005. [Google Scholar]
  5. Polidori, A.; Fine, P.M.; White, V.; Kwon, P.S. Pilot study of high-performance air filtration for classroom applications. Indoor Air 2013, 23, 185–195. [Google Scholar] [CrossRef]
  6. US EPA. Why Indoor Air Quality is Important to Schools. Available online: https://www.epa.gov/iaq-schools/why-indoor-air-quality-important-schools (accessed on 1 April 2023).
  7. San Joaquin Valley Air Pollution Control District. Community Emissions Reduction Program Stockton. Available online: https://community.valleyair.org/media/5hrl3haf/final-stockton-cerp-no-appendix-with-cover.pdf (accessed on 4 December 2022).
  8. OEHHA. CalEnviroScreen 4.0. Available online: https://oehha.ca.gov/calenviroscreen/report/calenviroscreen-40 (accessed on 15 December 2023).
  9. California Air Resources Board. Community Air Protection Program Stockton. Available online: https://ww2.arb.ca.gov/our-work/programs/community-air-protection-program/communityhub-2-0/stockton (accessed on 4 December 2022).
  10. California Air Resources Board. Community Air Protection Program. Available online: https://ww2.arb.ca.gov/capp/about (accessed on 27 April 2023).
  11. Bennett, D.H.; Moran, R.E.; Krakowiak, P.; Tancredi, D.J.; Kenyon, N.J.; Williams, J.; Fisk, W.J. Reductions in particulate matter concentrations resulting from air filtration: A randomized sham-controlled crossover study. Indoor Air 2022, 32, e12982. [Google Scholar] [CrossRef] [PubMed]
  12. Fisk, W.J. Health benefits of particle filtration. Indoor Air 2013, 23, 357–368. [Google Scholar] [CrossRef]
  13. Fisk, W.J.; Chan, W.R. Effectiveness and cost of reducing particle-related mortality with particle filtration. Indoor Air 2017, 27, 909–920. [Google Scholar] [CrossRef] [PubMed]
  14. Zhao, D.; Azimi, P.; Stephens, B. Evaluating the Long-Term Health and Economic Impacts of Central Residential Air Filtration for Reducing Premature Mortality Associated with Indoor Fine Particulate Matter (PM2.5) of Outdoor Origin. Int. J. Environ. Res. Public Health 2015, 12, 8448–8479. [Google Scholar] [CrossRef]
  15. van der Zee, S.C.; Strak, M.; Dijkema, M.B.; Brunekreef, B.; Janssen, N.A. The impact of particle filtration on indoor air quality in a classroom near a highway. Indoor Air 2017, 27, 291–302. [Google Scholar] [CrossRef]
  16. Tong, Z.; Li, Y.; Westerdahl, D.; Freeman, R.B. The impact of air filtration units on primary school students’ indoor exposure to particulate matter in China. Environ. Pollut. 2020, 266, 115107. [Google Scholar] [CrossRef]
  17. Park, J.-H.; Lee, T.J.; Park, M.J.; Oh, H.; Jo, Y.M. Effects of air cleaners and school characteristics on classroom concentrations of particulate matter in 34 elementary schools in Korea. Build. Environ. 2020, 167, 106437. [Google Scholar] [CrossRef] [PubMed]
  18. ASHRAE. ASHRAE Filtration/Disinfection. Available online: https://www.ashrae.org/technical-resources/filtration-disinfection (accessed on 15 December 2022).
  19. Walia, A. Preparing TK-12 Schools for California’s Changing Climate: Health and Energy Considerations for Preparing for Wildfire Smoke; Stanford Climate and Energy Policy Program; Stanford Woods Institute for the Environment: Stanford, CA, USA, 2023. [Google Scholar]
  20. US EPA. What Is a MERV Rating? Available online: https://www.epa.gov/indoor-air-quality-iaq/what-merv-rating (accessed on 4 December 2022).
  21. U.S. Department of Energy’s Office of Energy Efficiency and Renewable Energy. Efficient and Healthy Schools. Available online: https://www.energy.gov/eere/buildings/efficient-and-healthy-schools (accessed on 15 December 2023).
  22. Biomonitoring California. AB 617 Biomonitoring Update 032522. Available online: https://biomonitoring.ca.gov/sites/default/files/downloads/AB617UpdatePlanning032522.pdf (accessed on 21 April 2024).
  23. Biomonitoring California. AB 617 Biomonitoring Update 071621. Available online: https://biomonitoring.ca.gov/sites/default/files/downloads/AB617Update071621.pdf (accessed on 22 April 2024).
  24. Wagner, J.; Castorina, R.; Kumagai, K.; Thompson, M.; Sugrue, R.; Noth, E.M.; Bradman, A.; Hurley, S. Identification of Airborne Particle Types and Sources at a California School Using Electron Microscopy. Atmosphere 2023, 14, 1702. [Google Scholar] [CrossRef]
  25. IQAir. IQAir HealthPro Series User Manual. Available online: https://www.iqair.com/sites/default/files/pdf/HP-NE_User-Manual-US_120827.pdf (accessed on 29 June 2024).
  26. Jenkins, P.L.; Phillips, T.J.; Waldman, J. Environmental Health Conditions in California’s Portable Classrooms; California Environmental Protection Agency, Air Resources Board: Sacramento, CA, USA, 2004. Available online: https://ww2.arb.ca.gov/resources/documents/california-portable-classrooms-study (accessed on 1 March 2024).
  27. FilterBuy. Different Air Filter Ratings: FPR vs. MERV vs. MPR. Available online: https://filterbuy.com/resources/air-filter-basics/merv-mpr-fpr-ratings/ (accessed on 20 September 2022).
  28. Torkan Fazli, B.S. In-Situ Residential HVAC Filtration Efficiency for Fine and Ultrafine Particles. Available online: https://built-envi.com/wp-content/uploads/Fazli-and-Stephens-Air-Media-Fall-2016-In-situ-Filter-Testing.pdf (accessed on 25 April 2024).
  29. Ardon-Dryer, K.; Dryer, Y.; Williams, J.N.; Moghimi, N. Measurements of PM2.5 with PurpleAir under atmospheric conditions. Atmos. Meas. Tech. 2020, 13, 5441–5458. [Google Scholar] [CrossRef]
  30. PurpleAir. PurpleAir PA-II. Available online: https://www2.purpleair.com/products/purpleair-pa-ii?variant=40067691708513 (accessed on 20 November 2023).
  31. Monitor Testing and Calibration. Available online: https://www.sjvair.com/about/testing/ (accessed on 19 October 2022).
  32. Onset. HOBO CO2 Logger (MX1102) User’s Manual. Available online: https://www.onsetcomp.com/resources/documentation/19198-mx1102-manual (accessed on 27 April 2023).
  33. Onset. HOBO Plug Load Data Logger (UX120-018) User’s Manual. Available online: https://www.onsetcomp.com/resources/documentation/17838-man-ux120-018 (accessed on 27 April 2023).
  34. R Core Team. R: A Language and Environment for Statistical Computing, v4.3.1; R Foundation for Statistical Computing: Vienna, Austria, 2021.
  35. David, C.; Carslaw, K.R. openair—An R package for air quality data analysis. Environ. Model. Softw. 2012, 27–28, 52–61. [Google Scholar] [CrossRef]
  36. McCarthy, M.C.; Ludwig, J.F.; Brown, S.G.; Vaughn, D.L.; Roberts, P.T. Filtration effectiveness of HVAC systems at near-roadway schools. Indoor Air 2013, 23, 196–207. [Google Scholar] [CrossRef] [PubMed]
  37. Batterman, S. Review and Extension of CO2-Based Methods to Determine Ventilation Rates with Application to School Classrooms. Int. J. Environ. Res. Public Health 2017, 14, 145. [Google Scholar] [CrossRef] [PubMed]
  38. Kabirikopaei, A.; Lau, J. Uncertainty analysis of various CO2-Based tracer-gas methods for estimating seasonal ventilation rates in classrooms with different mechanical systems. Build. Environ. 2020, 179, 107003. [Google Scholar] [CrossRef]
  39. Andamon, M.M.; Rajagopalan, P.; Woo, J. Evaluation of ventilation in Australian school classrooms using long-term indoor CO2 concentration measurements. Build. Environ. 2023, 237, 110313. [Google Scholar] [CrossRef]
  40. Ding, E.; Zhang, D.; Hamida, A.; García-Sánchez, C.; Jonker, L.; de Boer, A.R.; Bruijning, P.C.J.L.; Linde, K.J.; Wouters, I.M.; Bluyssen, P.M. Ventilation and thermal conditions in secondary schools in the Netherlands: Effects of COVID-19 pandemic control and prevention measures. Build. Environ. 2023, 229, 109922. [Google Scholar] [CrossRef]
  41. Mendell, M.J.; Eliseeva, E.A.; Davies, M.M.; Spears, M.; Lobscheid, A.; Fisk, W.J.; Apte, M.G. Association of classroom ventilation with reduced illness absence: A prospective study in California elementary schools. Indoor Air 2013, 23, 515–528. [Google Scholar] [CrossRef]
  42. Chan, W.R.; Li, X.; Singer, B.C.; Pistochini, T.; Vernon, D.; Outcault, S.; Sanguinetti, A.; Modera, M. Ventilation rates in California classrooms: Why many recent HVAC retrofits are not delivering sufficient ventilation. Build. Environ. 2020, 167, 106426. [Google Scholar] [CrossRef]
  43. de Foy, B.; Schauer, J.J. Changes in speciated PM2.5 concentrations in Fresno, California, due to NOx reductions and variations in diurnal emission profiles by day of week. Elem. Sci. Anthr. 2019, 7, 45. [Google Scholar] [CrossRef]
  44. San Joaquin Valley Air Pollution Control District. Chapter 3. Air Quality in the San Joaquin Valley: Challenges and Trends. Available online: https://ww2.valleyair.org/media/xrkdi03x/03-chapter-3-aq-in-sjv.pdf (accessed on 23 April 2024).
  45. San Joaquin Valley Air Pollution Control District. San Joaquin Valley Air Pollution Control District: Frequently Asked Questions. Available online: https://ww2.valleyair.org/about/frequently-asked-questions/ (accessed on 15 May 2024).
  46. US EPA. Final Rule: Reconsideration of the National Ambient Air Quality Standards for Particulate Matter. Available online: https://www.federalregister.gov/documents/2024/03/06/2024-02637/reconsideration-of-the-national-ambient-air-quality-standards-for-particulate-matter (accessed on 17 May 2024).
  47. World Health Organization. WHO Global Air Quality Guidelines. Particulate matter (PM2.5 and PM10), Ozone, Nitrogen Dioxide, Sulfur Dioxide and Carbon Monoxide. Available online: https://iris.who.int/bitstream/handle/10665/345329/9789240034228-eng.pdf (accessed on 13 May 2024).
  48. Chen, W.; Wang, Z.-M.; Peerless, K.; Ullman, E.; Mendell, M.J.; Putney, D.; Wagner, J.; Kumagai, K. Monitoring of Ventilation, Portable Air Cleaner Operation, and Particulate Matter in California Classrooms: A Pilot Study. Sustainability 2024, 16, 2052. [Google Scholar] [CrossRef]
  49. Persily, A. Development and application of an indoor carbon dioxide metric. Indoor Air 2022, 32, e13059. [Google Scholar] [CrossRef] [PubMed]
  50. California Green Building Code 2022, Section 5.506.3 Carbon Dioxide (CO2) Monitoring in Classrooms. Available online: https://up.codes/s/carbon-dioxide-co2-monitoring-in-classrooms (accessed on 4 March 2024).
  51. Shendell, D.G.; Winer, A.M.; Weker, R.; Colome, S.D. Evidence of inadequate ventilation in portable classrooms: Results of a pilot study in Los Angeles County. Indoor Air 2004, 14, 154–158. [Google Scholar] [CrossRef] [PubMed]
  52. Fromme, H.; Twardella, D.; Dietrich, S.; Heitmann, D.; Schierl, R.; Liebl, B.; Rüden, H. Particulate matter in the indoor air of classrooms—Exploratory results from Munich and surrounding area. Atmos. Environ. 2007, 41, 854–866. [Google Scholar] [CrossRef]
  53. Lazovic, I.; Jovašević-Stojanović, M.; Zivkovic, M.; Tasic, V.; Žarko, S. PM and CO2 variability and relationship in different school environments. Chem. Ind. Chem. Eng. Q. 2014, 21, 179–187. [Google Scholar] [CrossRef]
  54. Choe, Y.; Shin, J.-S.; Park, J.; Kim, E.; Oh, N.; Min, K.; Kim, D.; Sung, K.; Cho, M.; Yang, W. Inadequacy of air purifier for indoor air quality improvement in classrooms without external ventilation. Build. Environ. 2022, 207, 108450. [Google Scholar] [CrossRef]
  55. Shi, L.; Zanobetti, A.; Kloog, I.; Coull, B.A.; Koutrakis, P.; Melly, S.J.; Schwartz, J.D. Low-Concentration PM2.5 and Mortality: Estimating Acute and Chronic Effects in a Population-Based Study. Environ. Health Perspect. 2016, 124, 46–52. [Google Scholar] [CrossRef]
  56. Papadogeorgou, G.; Kioumourtzoglou, M.A.; Braun, D.; Zanobetti, A. Low Levels of Air Pollution and Health: Effect Estimates, Methodological Challenges, and Future Directions. Curr. Environ. Health Rep. 2019, 6, 105–115. [Google Scholar] [CrossRef]
  57. South Coast Air Quality Management District. PurpleAir PA-II—Field Evaluation. Available online: https://www.aqmd.gov/docs/default-source/aq-spec/field-evaluations/purple-air-pa-ii---field-evaluation.pdf?sfvrsn=11 (accessed on 4 March 2024).
  58. Frederick, S.; Johnson, K.; Johnson, C.; Yaga, R.; Clements, A. Performance Evaluations of PM2.5 sensors in Research Triangle Park, NC: PurpleAir PA-II-SD, Aeroqual AQY, Applied Particle Technology Maxima, Vaisala AQT420, Sens-it RAMP, and Clarity Node-S. Available online: https://cfpub.epa.gov/si/si_public_record_report.cfm?Lab=CEMM&dirEntryId=348487 (accessed on 22 July 2024).
  59. Tyner, T.; Central California Asthma Collaborative, Fresno, CA, USA. Personal communication, 2022.
Figure 1. Layout of the school study site, labeled in bold with the air quality monitoring locations (Classrooms 1–5, and Outdoors: North and Central) and classroom portable air cleaners (PACs). Figure adapted from Ref. [24].
Atmosphere 15 00901 g001
Figure 2. Timeline of air filtration interventions.
Atmosphere 15 00901 g002
Figure 3. Photos of data collection equipment: (a) PurpleAir PA-II for PM2.5; (b) Onset HOBO MX1102A data logger for CO2; (c) Onset HOBO UX 120-018 plug load data logger to monitor the use of the PACs (indicated by the red circle).
Atmosphere 15 00901 g003
Figure 4. Daily 24 h average PM2.5 concentrations from the two outdoor monitors at the school (Outdoors: North and Outdoors: Central). Data presented in this figure include all days from the start—end of this study, including weekends and holidays. Missing days (18 October 2022, 25 October 2022–31 October 2022) were due to Wi-Fi outages and database updates.
Atmosphere 15 00901 g004
Figure 5. Particle filtration effectiveness by classroom and filtration scenario, before and after HVAC filter intervention. Figure shows a boxplot with outliers hidden, zoomed in from the boxplot including outliers. * Indicates that there is a statistically significant difference between before and after the HVAC filter intervention in Classrooms 1, 2 and 5 (Wilcoxon signed-rank test p value < 0.05).
Atmosphere 15 00901 g005
Figure 6. Portable air cleaner power usage data for the PACs in Classrooms 3–5. PACs which consistently used approximately 90 watts of power were on speed setting 3. The PAC which consistently used approximately 170 watts of power was on speed setting 5.
Atmosphere 15 00901 g006
Figure 7. Distribution of daily 95th percentile CO2 levels by classroom pre- and post-HVAC filter intervention.
Atmosphere 15 00901 g007
Figure 8. Outside air intake for Classroom 5, indicated by the red box.
Atmosphere 15 00901 g008
Table 1. Classroom air filtration characteristics.
Classroom NumberOccupancy 1Volume
(m3)
Classroom Type 2Classroom FunctionPortable Air Cleaner 3HVAC Filter:
Pre-Intervention 4
HVAC Filter:
Post-Intervention
Classroom 117245PermanentGeneral Ed.NoMERV 6MERV 13
Classroom 210240PermanentGeneral Ed.NoMERV 6MERV 13
Classroom 315240PermanentGeneral Ed.YesMERV 6MERV 13
Classroom 410195PortableEnglishYesMERV 13MERV 13
Classroom 520195PortableScienceYesMERV 13MERV 13
1 Occupancy reflects the number of students enrolled in the class. 2 Portable classrooms are transportable, and permanent classrooms are site-built [26]. 3 The Portable Air Cleaner used in this study was the IQAir HealthPro Plus Air Purifier. 4 At baseline, Classrooms 1–3 had filters with a Filter Performance (FPR) rating of 4, which corresponds to a Minimum Efficiency Reporting Value (MERV) 6 rating. They had been in use for three years prior to the start of this study. Classrooms 4 and 5 had filters with a FPR rating of 10, which corresponds to a MERV 13 rating [27,28]. These had been in use for approximately two months prior to the start of this study.
Table 2. Measured PAC power use and speed-setting data.
PAC Speed SettingFlow Rate (m3/h)Power Consumption (Watts)
Classroom 3Classroom 4Classroom 5
Level 170272727
Level 2130525251
Level 3220858887
Level 4290113114115
Level 5340168163167
Level 6510224220225
Table 3. Data collection summary.
ParameterInstrumentManufacturerData
Frequency
Locations Monitored
PM2.5PA-IIPurpleAir2 minClassrooms 1–5,
Outdoors: North and Central
CO2HOBO MX 1102 data loggerOnset5 minClassrooms 1–5
PAC Power
Usage
HOBO UX 120-018 plug load
data logger
Onset1 minClassrooms 3–5
Table 4. Averages of hourly PM2.5 concentrations pre- and post-HVAC filter intervention.
HVAC Filter
Intervention
LocationPAC
(Yes/No)
PM2.5 (µg/m3)
Mean +/− SD
Pre-HVAC Filter
Intervention 1
Post-HVAC Filter
Intervention 2
Outdoors: North Not applicable10.1 +/− 3.112.1 +/− 7.3
Outdoors: Central Not applicable9.7 +/− 3.510.9 +/− 7.9
Upgrade:
MERV 6 →
MERV 13
Classroom 1 No8.2 +/− 2.410.1 +/− 10.8
Classroom 2 No9.9 +/− 2.98.0 +/− 5.2
Classroom 3 Yes: Speed 3 (220 m3/h)7.7 +/− 2.08.1 +/− 5.6
Replacement:
MERV 13 → MERV 13
Classroom 4 Yes: Speed 5 (340 m3/h)5.2 +/− 1.66.2 +/− 6.0
Classroom 5 Yes: Speed 3 (220 m3/h)4.1 +/− 1.45.1 +/− 3.2
1 22 September 2022–21 October 2022, excluding 18 October 2022 due to missing data. N = 147 h. 2 1 November 2022–9 December 2022, excluding Veterans Day and Thanksgiving Holiday Week: 11 November 2022, 18 November 2022–28 November 2022. N = 147 h.
Disclaimer/Publisher’s Note: The statements, opinions and data contained in all publications are solely those of the individual author(s) and contributor(s) and not of MDPI and/or the editor(s). MDPI and/or the editor(s) disclaim responsibility for any injury to people or property resulting from any ideas, methods, instructions or products referred to in the content.

