
Construction of Linear Models for the Normalized Vegetation Index (NDVI) for Coffee Crops in Peru Based on Historical Atmospheric Variables from the Climate Engine Platform

 , ,
, ,  ,
,  and
and 
Abstract
1. Introduction
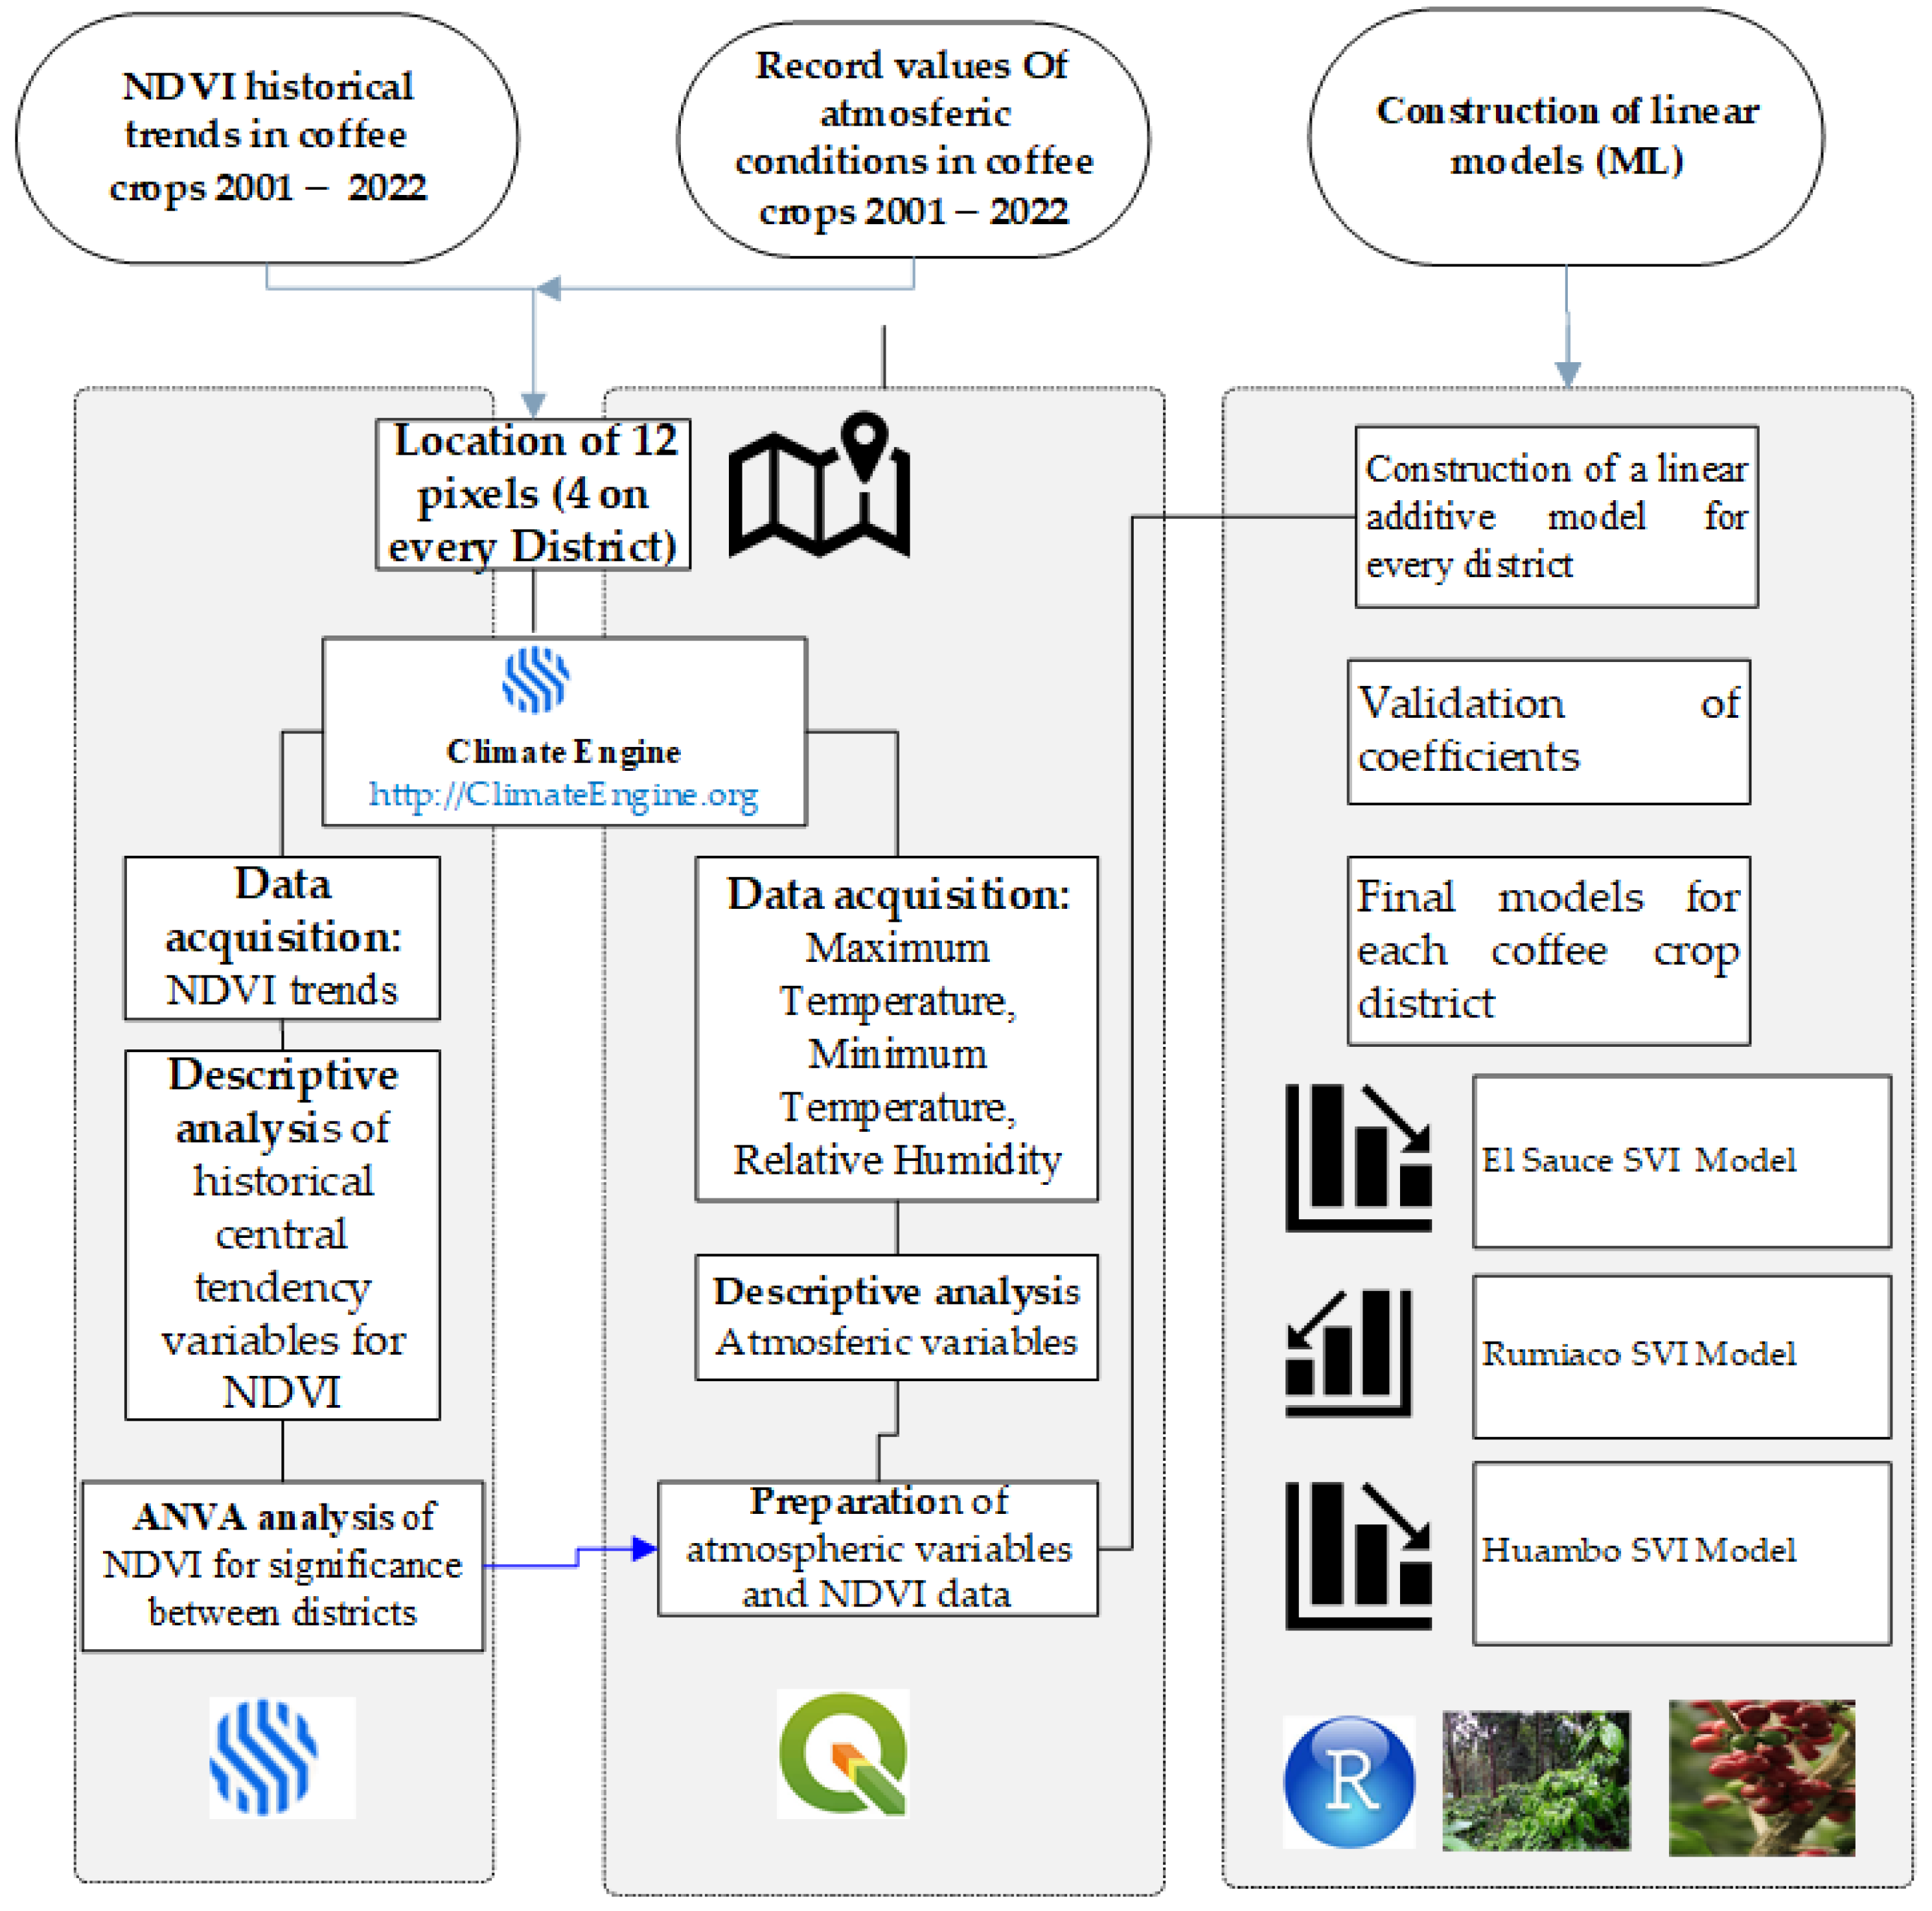
2. Materials and Methods
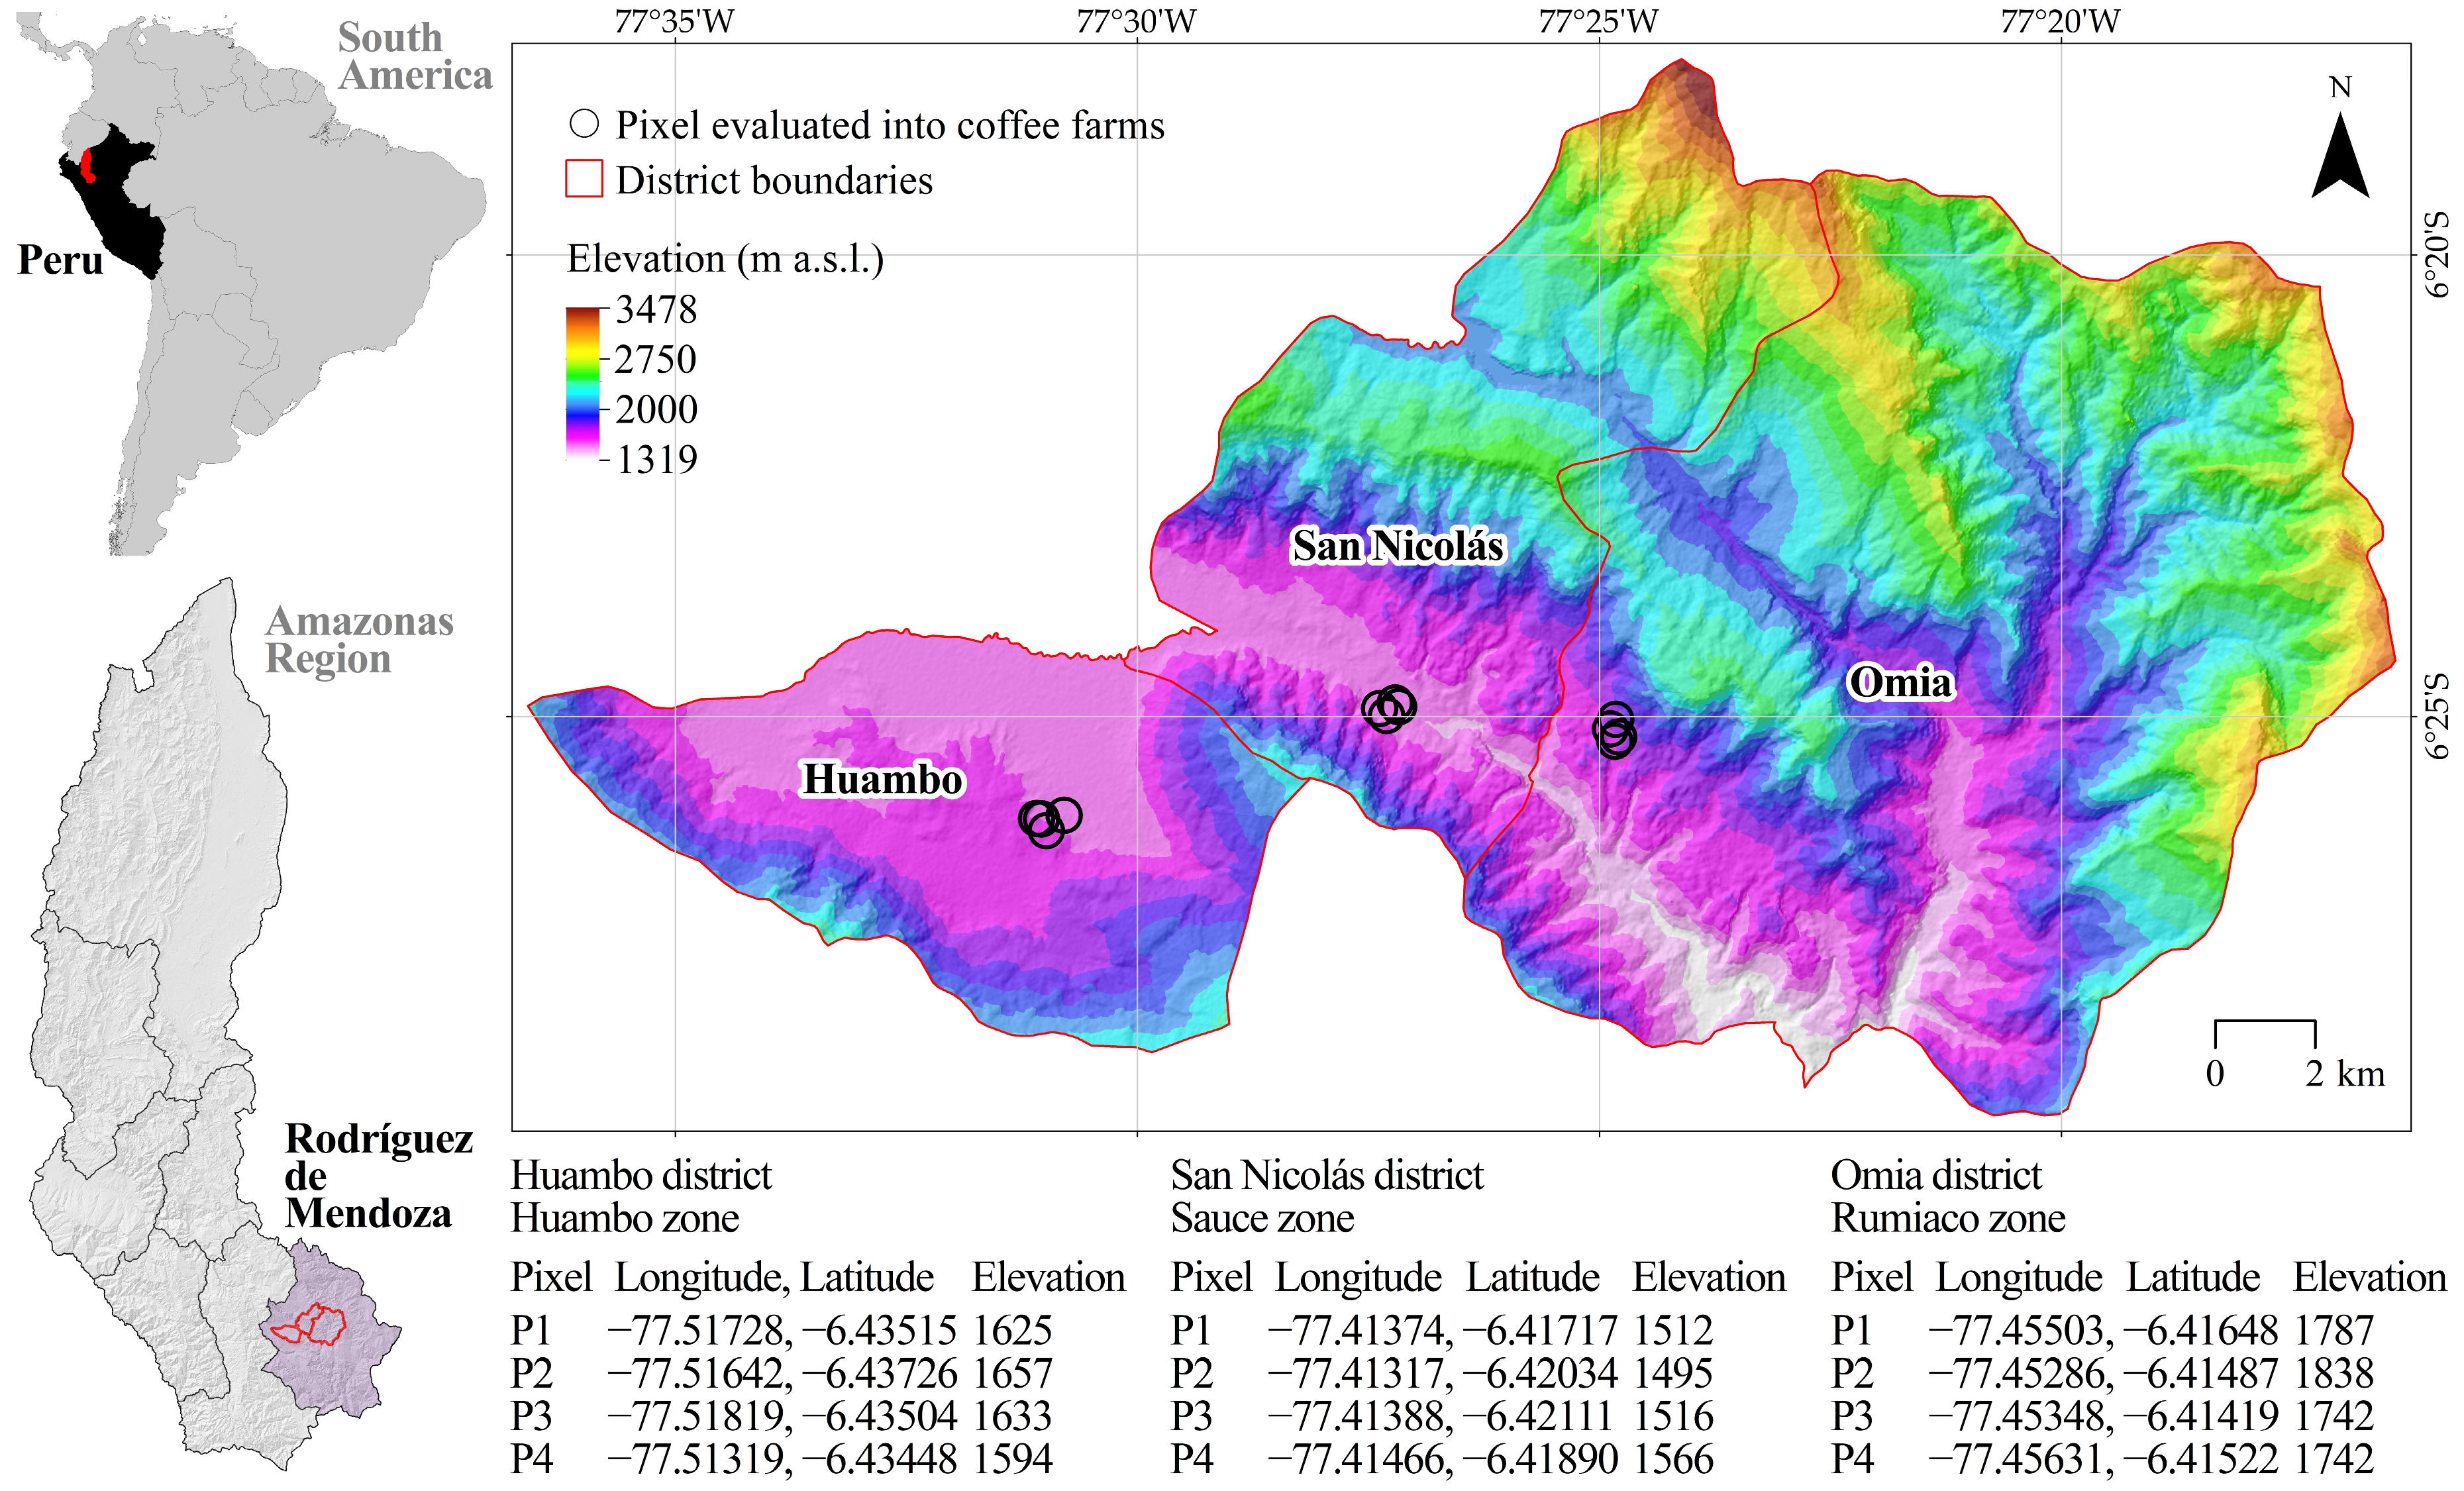
2.1. Study Area
2.2. Historical NDVI Time Series Trends (2002–2022) in Coffee Crops
2.3. Data Acquisition for Record of Historic Trends Values for Precipitation, Temperatures Maximum, Minimum, Relative Humidity, and Correlations with Altitude and NDVI
2.4. Linear Regression Model for Coffee Crop Zones
3. Results
3.1. NDVI Historical Trends in Coffee Crop Areas (2001–2022)
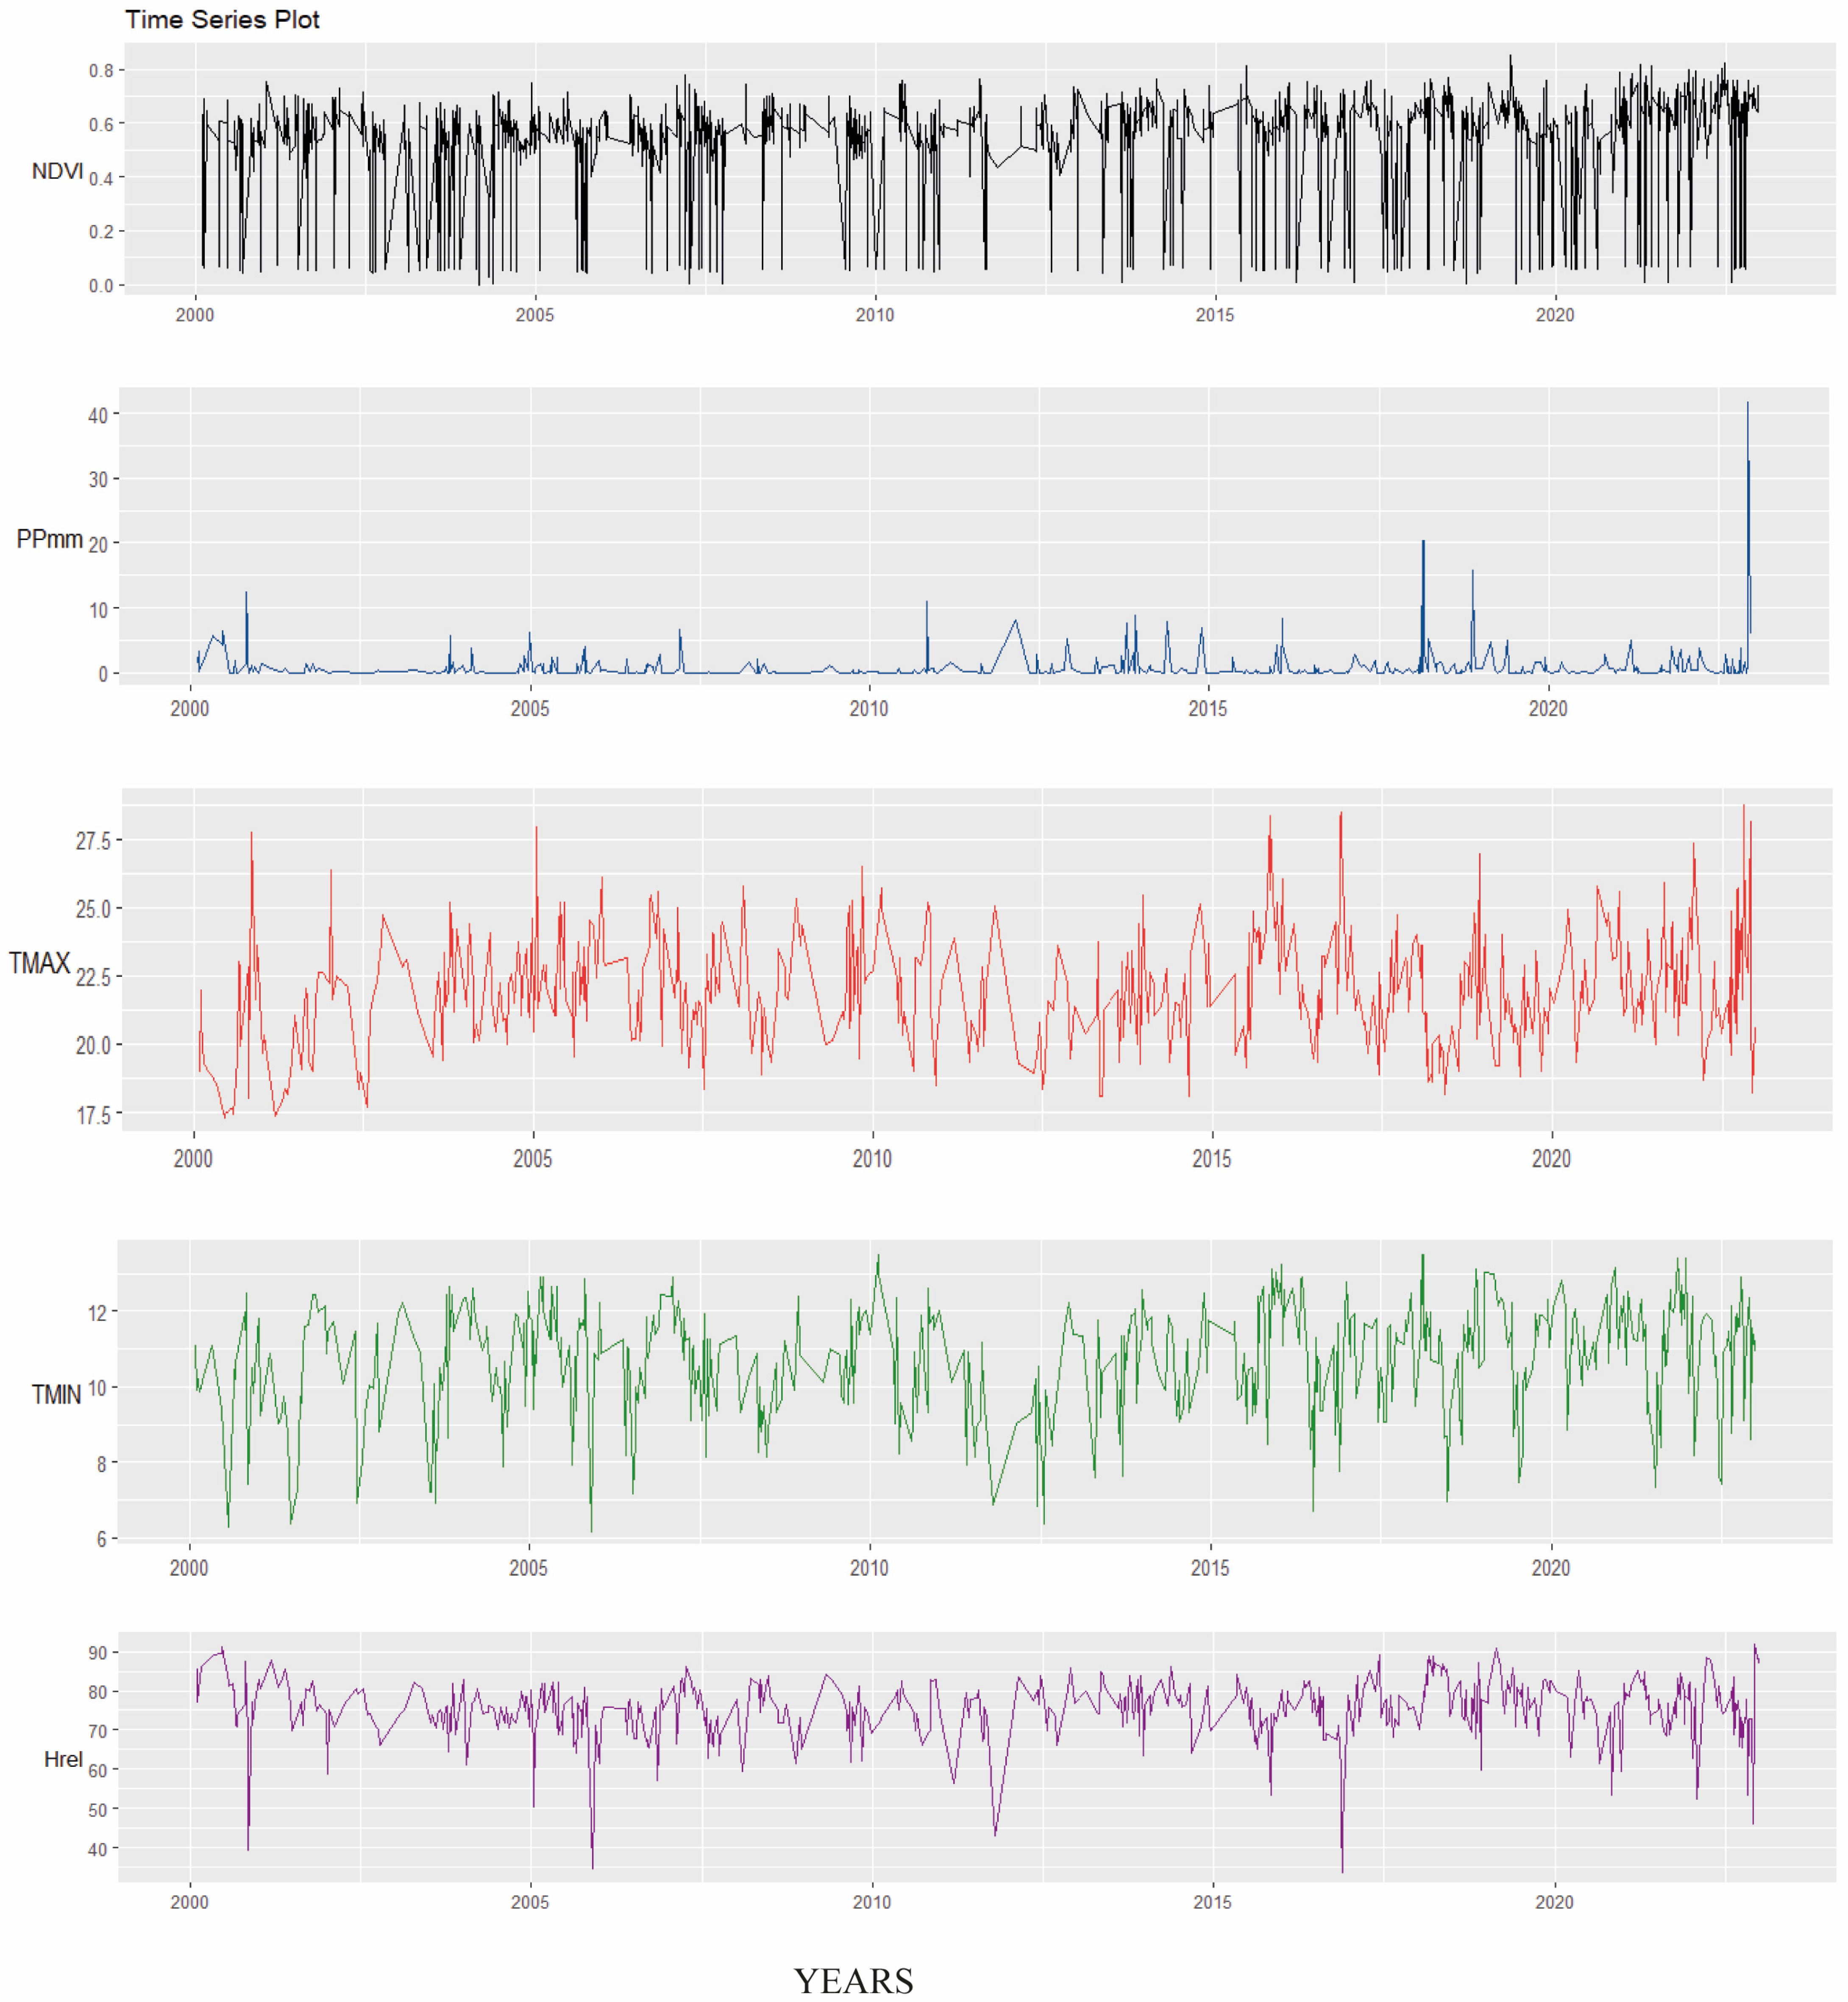
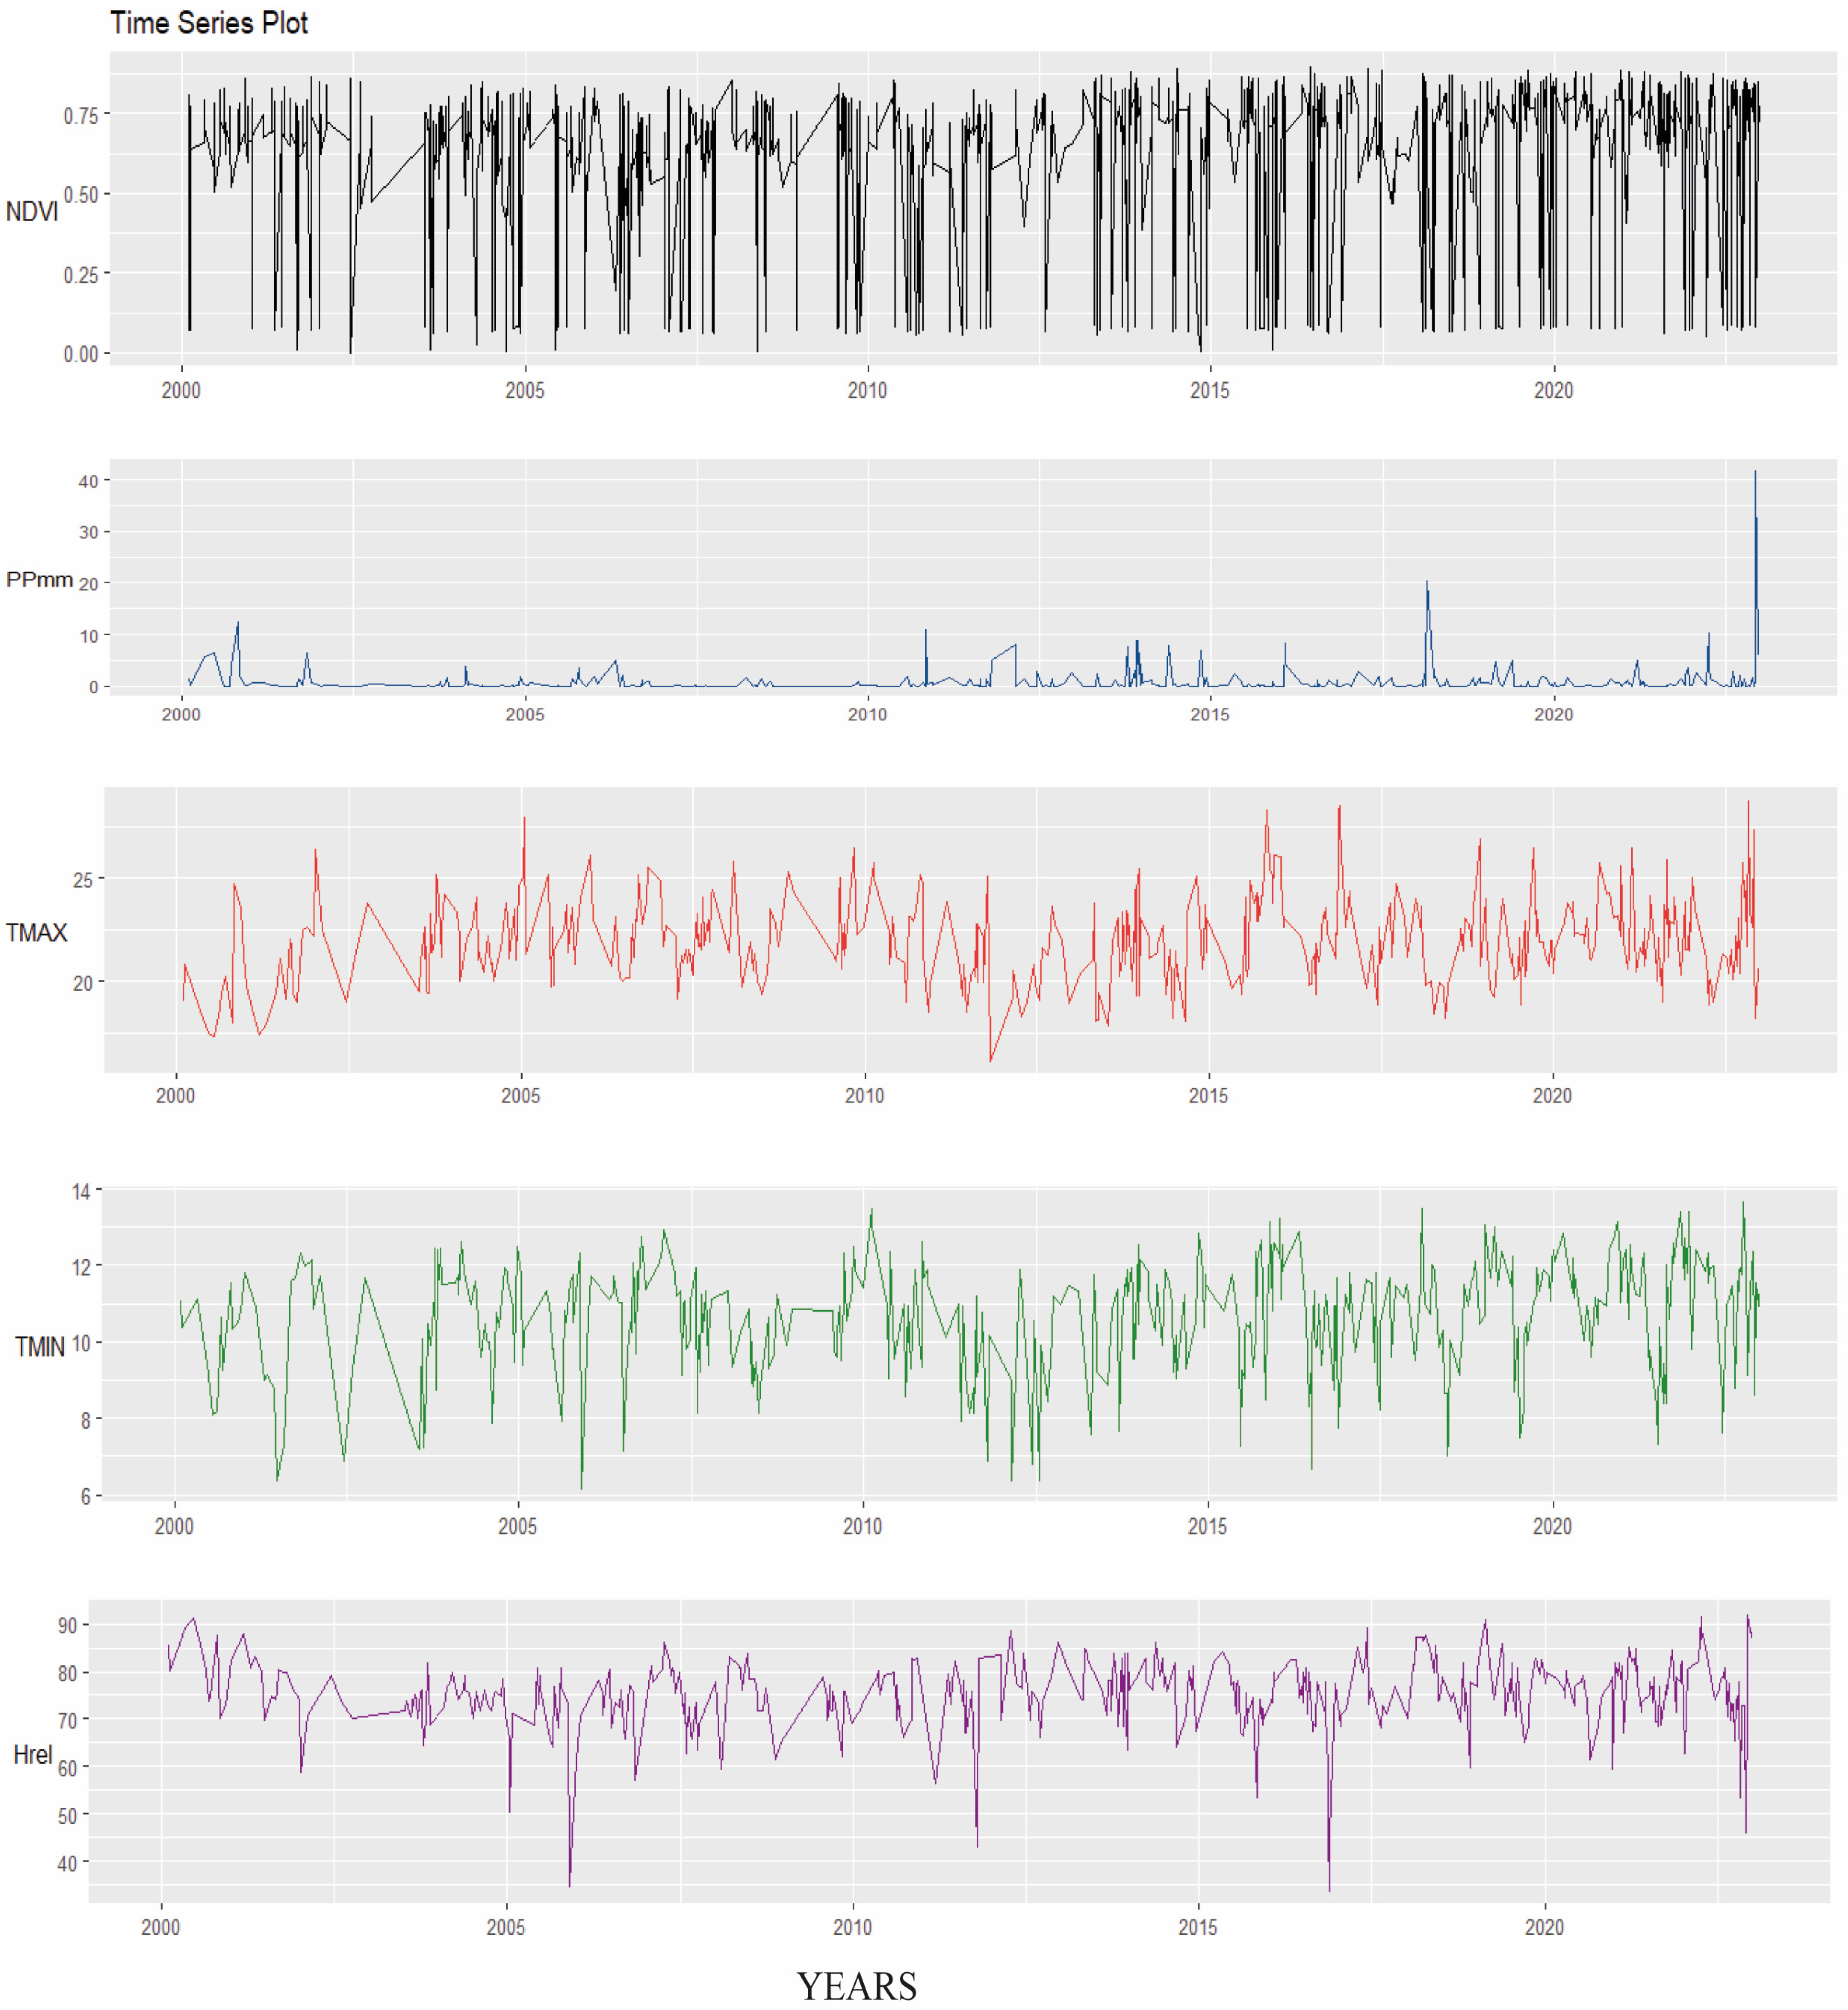
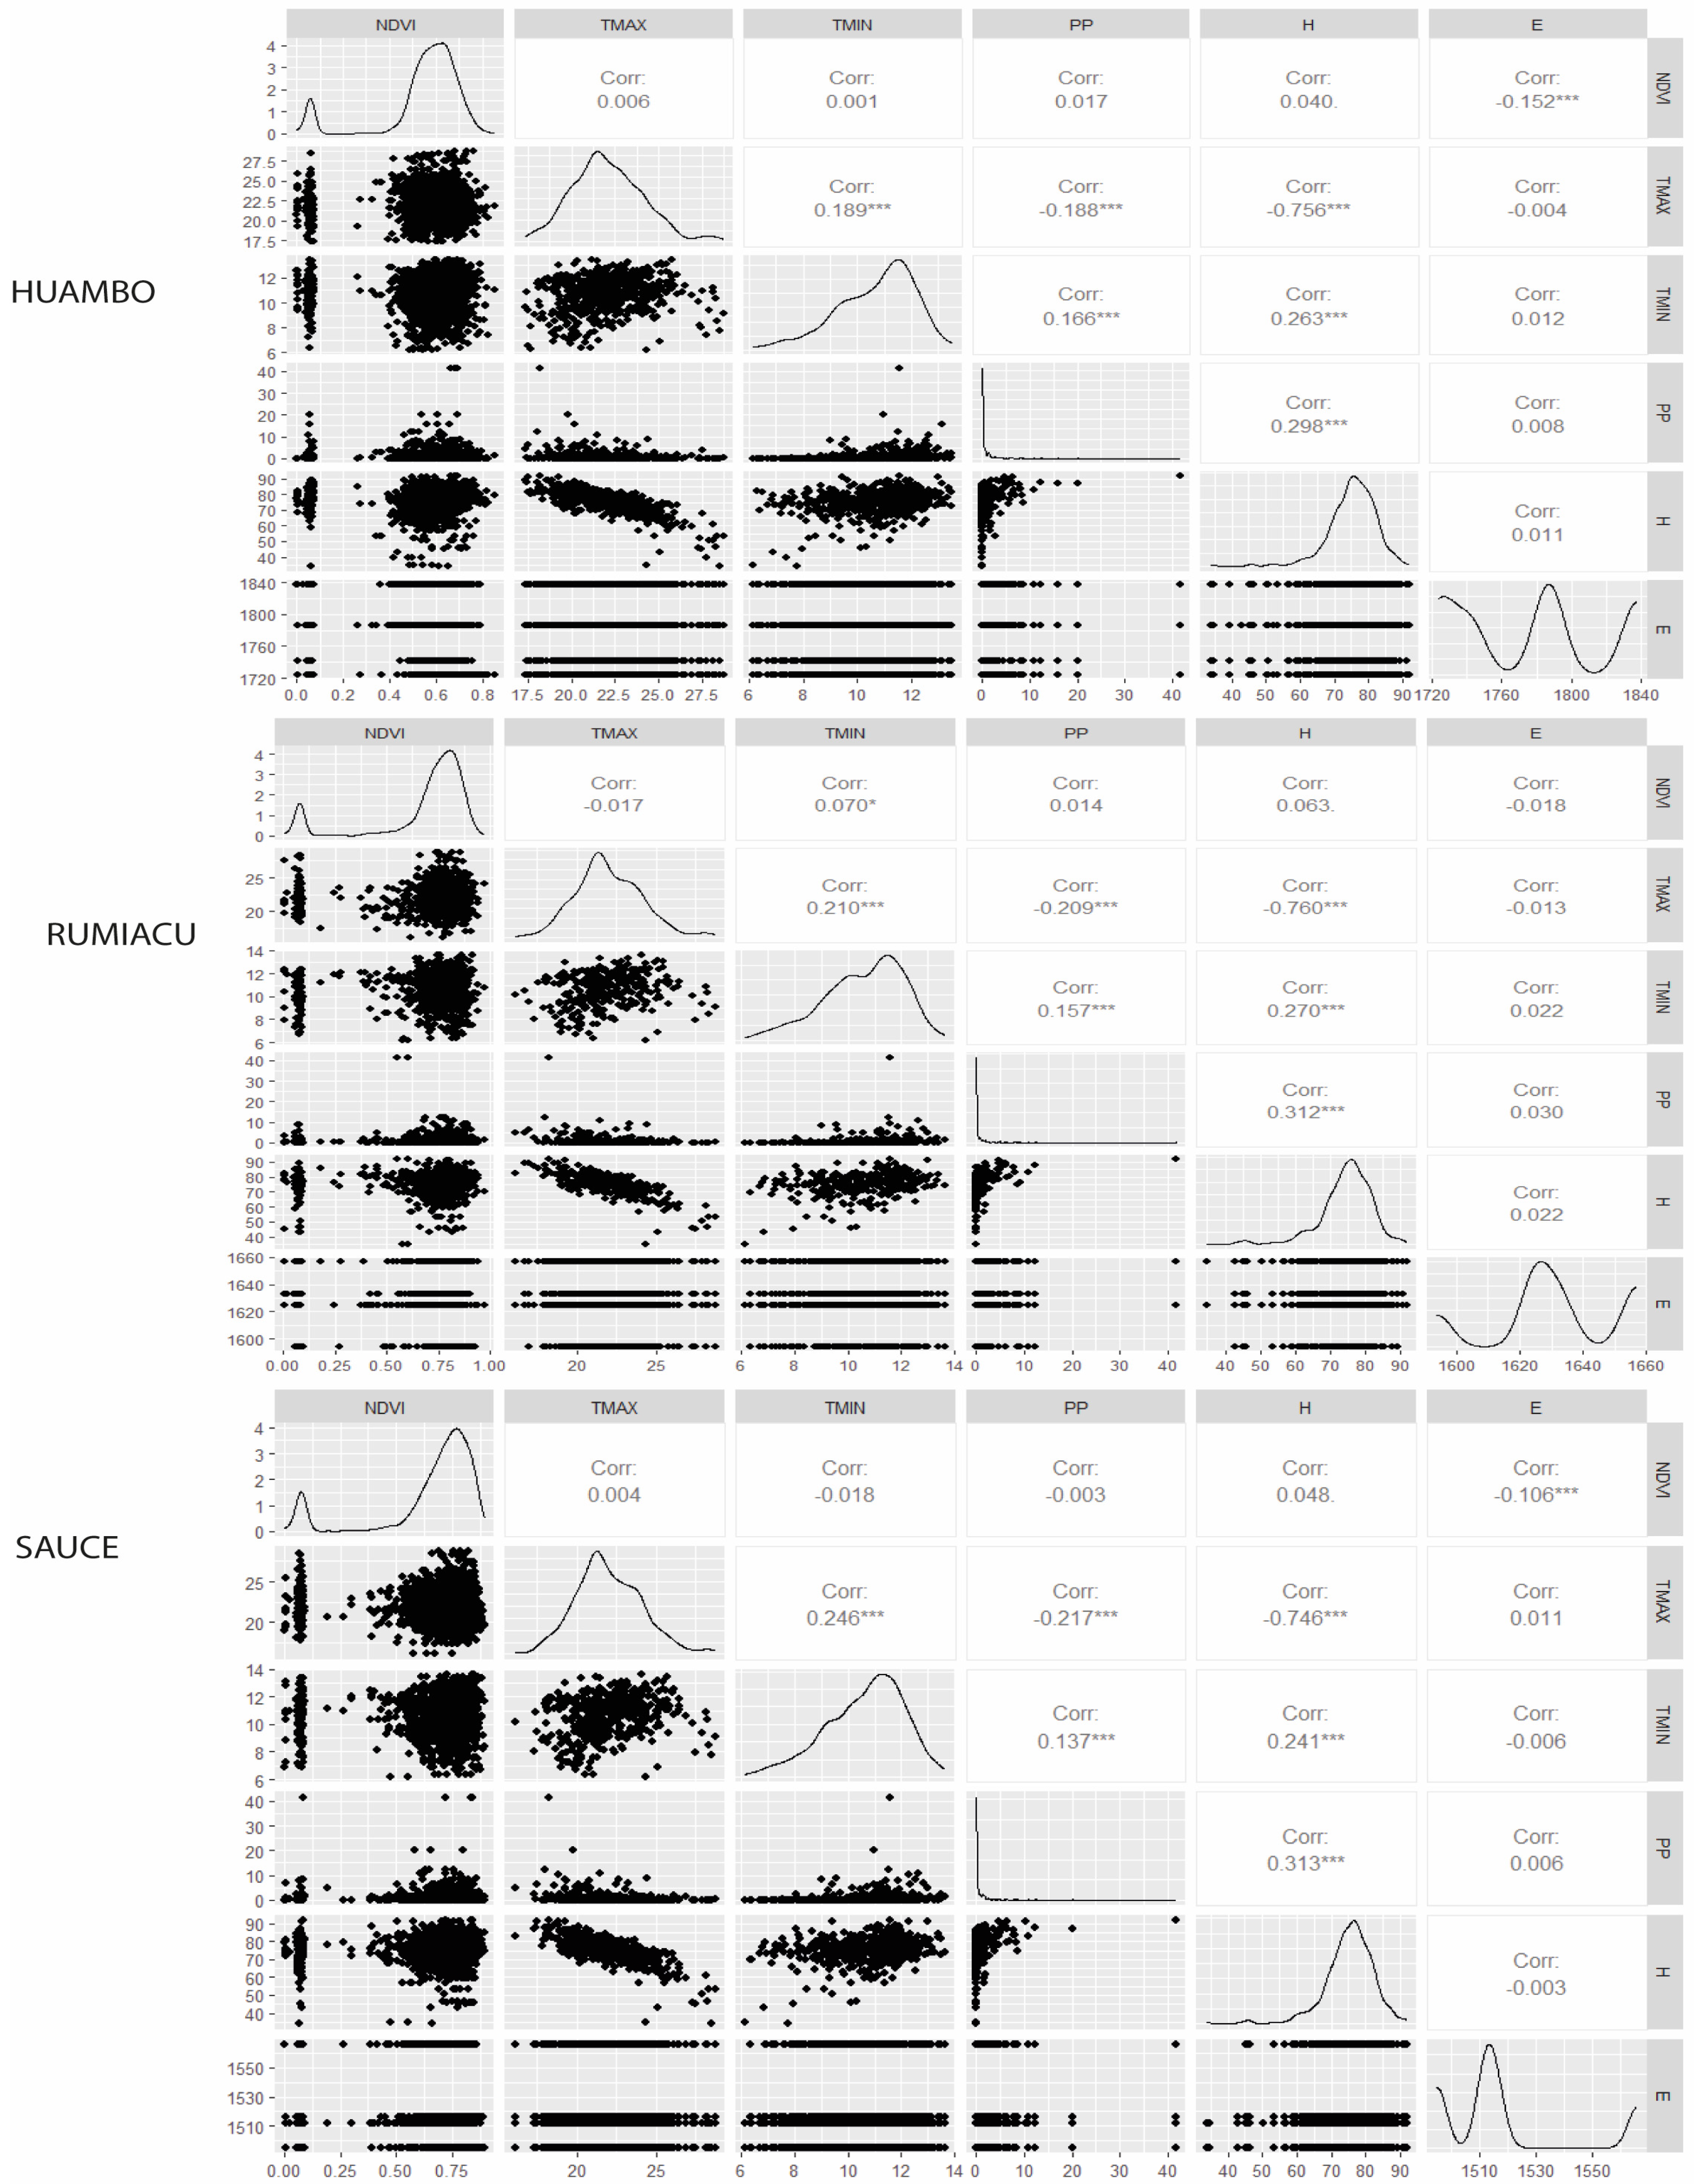
3.2. Record Values of Atmospheric Conditions in Coffee Crops 2001–2022, Tendencies, and Correlations
3.3. Linear Regression Model
3.3.1. Model for Sauce
3.3.2. Model for Rumiaco
3.3.3. Model for Huambo
4. Discussion
4.1. NDVI Trends in Coffee Crop Areas in the Time Series Ranging from 2000–2022
4.2. Values for Atmospheric Conditions in Coffee Crops from 2001–2022: Tendencies and Correlations
4.3. Linear Model According to Locations
5. Conclusions
Author Contributions
Funding
Institutional Review Board Statement
Informed Consent Statement
Data Availability Statement
Acknowledgments
Conflicts of Interest
References
- Pancsira, J. International Coffee Trade: A Literature Review. J. Agric. Inform. 2022, 13, 26–35. [Google Scholar] [CrossRef]
- International Coffee Organization. Diversification; Promotion; and Upgrading Coffee Production and Marketing; 23AD; International Coffee Organization: London, UK, 2023. [Google Scholar]
- Salas López, R.; Gómez Fernández, D.; Silva López, J.O.; Rojas Briceño, N.B.; Oliva, M.; Terrones Murga, R.E.; Iliquín Trigoso, D.; Barboza Castillo, E.; Barrena Gurbillón, M.Á. Land Suitability for Coffee (Coffea arabica) Growing in Amazonas, Peru: Integrated Use of AHP, GIS and RS. ISPRS Int. J. Geo-Inf. 2020, 9, 673. [Google Scholar] [CrossRef]
- Chichipe Oyarce, J.; Camacho, A.; Bobadilla, L.G.; Vigo, C.N.; Vásquez, H.V.; Silva Valqui, G. Clonal Propagation of Coffea arabica with Indole Butyric Acid and Acclimatization Conditions in Amazonas, Peru. Int. J. Agron. 2021, 2021, 8590590. [Google Scholar] [CrossRef]
- Vargas, C.D.; Willems, M.C. Línea Base del Sector Café en Peru; Programa de las Naciones Unidas para el Desarrollo—PNUD: Lima Peru, 2017; Available online: https://camcafeperu.com.pe/admin/recursos/publicaciones/Linea-base-del-sector-cafe-en-Peru.pdf (accessed on 25 July 2024).
- Tapaça, I.d.P.E.; Mavuque, L.; Corti, R.; Pedrazzani, S.; Maquia, I.S.A.; Tongai, C.; Partelli, F.L.; Ramalho, J.C.; Marques, I.; Ribeiro-Barros, A.I. Genomic Evaluation of Coffea arabica and Its Wild Relative Coffea Racemosa in Mozambique: Settling Resilience Keys for the Coffee Crop in the Context of Climate Change. Plants 2023, 12, 2044. [Google Scholar] [CrossRef] [PubMed]
- Damatta, F.M.; Avila, R.T.; Cardoso, A.A.; Martins, S.C.V.; Ramalho, J.C. Physiological and Agronomic Performance of the Coffee Crop in the Context of Climate Change and Global Warming: A Review. J. Agric. Food Chem. 2018, 66, 5264–5274. [Google Scholar] [CrossRef]
- Chalchissa, F.B.; Diga, G.M.; Tolossa, A.R. Modeling the Responses of Coffee (Coffea arabica L.) Distribution to Current and Future Climate Change in Jimma Zone, Ethiopia. Sains Tanah 2022, 19, 19–32. [Google Scholar] [CrossRef]
- Zhao, W.; Hu, Z.; Guo, Q.; Wu, G.; Chen, R.; Li, S. Contributions of Climatic Factors to Interannual Variability of the Vegetation Index in Northern China Grasslands. J. Clim. 2020, 33, 175–183. [Google Scholar] [CrossRef]
- Shrestha, R.; Di, L.; Yu, E.G.; Kang, L.; Li, L.; Shahinoor Rahman, M.; Deng, M.; Yang, Z. Regression Based Corn Yield Assessment Using MODIS Based Daily NDVI in Iowa State. In Proceedings of the 2016 Fifth International Conference on Agro-Geoinformatics (Agro-Geoinformatics), Tianjin, China, 18–20 July 2016. [Google Scholar]
- Atzberger, C. Advances in Remote Sensing of Agriculture: Context Description, Existing Operational Monitoring Systems and Major Information Needs. Remote Sens. 2013, 949–981. [Google Scholar] [CrossRef]
- Sari, D.N.; Sasmito, B.; Hadi, F.; Kurniawan, D.A. Estimasi Produktivitas Kopi Dengan Indeks Vegetasi Menggunakan Citra SPOT-7. Elipsoida J. Geod. Dan Geomatika 2022, 5, 44–52. [Google Scholar] [CrossRef]
- Xu, Y.; Dai, Q.Y.; Zou, B.; Xu, M.; Feng, Y.X. Tracing Climatic and Human Disturbance in Diverse Vegetation Zones in China: Over 20 Years of NDVI Observations. Ecol. Indic. 2023, 156, 111170. [Google Scholar] [CrossRef]
- Huang, S.; Tang, L.; Hupy, J.P.; Wang, Y.; Shao, G. A Commentary Review on the Use of Normalized Difference Vegetation Index (NDVI) in the Era of Popular Remote Sensing. J. For. Res. 2021, 32, 1–6. [Google Scholar] [CrossRef]
- Aburas, M.M.; Abdullah, S.H.; Ramli, M.F.; Ash’aari, Z.H. Measuring Land Cover Change in Seremban, Malaysia Using NDVI Index. Procedia Environ. Sci. 2015, 30, 238–243. [Google Scholar] [CrossRef]
- Berkessa, Y.W.; Bulto, T.W.; Moisa, M.B.; Gurmessa, M.M.; Werku, B.C.; Juta, G.Y.; Negash, D.A.; Gemeda, D.O. Impacts of Urban Land Use and Land Cover Change on Wetland Dynamics in Jimma City, Southwestern Ethiopia. J. Water Clim. Chang. 2023, 14, 2397–2415. [Google Scholar] [CrossRef]
- Chen, J.; Jönsson, P.; Tamura, M.; Gu, Z.; Matsushita, B.; Eklundh, L. A Simple Method for Reconstructing a High-Quality NDVI Time-Series Data Set Based on the Savitzky-Golay Filter. Remote Sens. Environ. 2004, 91, 332–344. [Google Scholar] [CrossRef]
- Dagnachew, M.; Dagnachew, M.; Kebede, A.; Moges, A.; Abebe, A. Effects of Climate Variability on Normalized Difference Vegetation Index (NDVI) in the Gojeb River Catchment, Omo-Gibe Basin, Ethiopia. Adv. Meteorol. 2020, 2020, 8263246. [Google Scholar] [CrossRef]
- Crichton, K.A.; Anderson, K.; Charman, D.J.; Gallego-Sala, A. Seasonal Climate Drivers of Peak NDVI in a Series of Arctic Peatlands. Sci. Total Environ. 2022, 838, 156419. [Google Scholar] [CrossRef] [PubMed]
- Jiang, F.; Kuang, R.; Xia, A.; Feng, Q.; Zhou, M. Variation Characteristics of Poyang Lake Water Area and Its Response to Meteorological Factors in the Past 35 Years. J. Water Clim. Chang. 2023, 14, 2706–2718. [Google Scholar] [CrossRef]
- Gelata, F.T.; Jiqin, H.; Gemeda, S.C.; Asefa, B.W. Application of GIS Using NDVI and LST Estimation to Measure Climate Variability-Induced Drought Risk Assessment in Ethiopia. J. Water Clim. Chang. 2023, 14, 2479–2489. [Google Scholar] [CrossRef]
- Wei, H.; Liu, X.; Hua, W.; Zhang, W.; Ji, C.; Han, S. Copula-Based Joint Drought Index Using Precipitation, NDVI, and Runoff and Its Application in the Yangtze River Basin, China. Remote Sens. 2023, 15, 4484. [Google Scholar] [CrossRef]
- Anand, A.; Pandey, P.C.; Petropoulos, G.P.; Pavlides, A.; Srivastava, P.K.; Sharma, J.K.; Malhi, R.K.M. Use of Hyperion for Mangrove Forest Carbon Stock Assessment in Bhitarkanika Forest Reserve: A Contribution towards Blue Carbon Initiative. Remote Sens. 2020, 12, 597. [Google Scholar] [CrossRef]
- Baniya, B.; Tang, Q.; Huang, Z.; Sun, S.; Techato, K. anan Spatial and Temporal Variation of NDVI in Response to Climate Change and the Implication for Carbon Dynamics in Nepal. Forests 2018, 9, 329. [Google Scholar] [CrossRef]
- Wang, R.; Gamon, J.A.; Montgomery, R.A.; Townsend, P.A.; Zygielbaum, A.I.; Bitan, K.; Tilman, D.; Cavender-Bares, J. Seasonal Variation in the NDVI-Species Richness Relationship in a Prairie Grassland Experiment (Cedar Creek). Remote Sens. 2016, 8, 128. [Google Scholar] [CrossRef]
- Veneros, J.E.; García, L. Application of the Standardized Vegetation Index (SVI) and Google Earth Engine (GEE) for Drought Management in Peru. Trop. Subtrop. Agroecosyst. 2022, 25, 1–13. [Google Scholar] [CrossRef]
- Liao, L.; Song, J.; Wang, J.; Xiao, Z.; Wang, J. Bayesian Method for Building Frequent Landsat-like NDVI Datasets by Integrating MODIS and Landsat NDVI. Remote Sens. 2016, 8, 452. [Google Scholar] [CrossRef]
- Gorelick, N.; Hancher, M.; Dixon, M.; Ilyushchenko, S.; Thau, D.; Moore, R. Google Earth Engine: Planetary-Scale Geospatial Analysis for Everyone. Remote Sens. Environ. 2017, 202, 18–27. [Google Scholar] [CrossRef]
- Ibrahim, E.S. Predicting Potato Diseases in Smallholder Agricultural Areas of Nigeria Using Machine Learning and Remote Sensing-Based Climate Data. PhytoFrontiers 2024, 4, 89–105. [Google Scholar] [CrossRef]
- Degano, M.F.; Rivas, R.E. Evaluación de Los Productos de Evapotranspiración Disponibles En Climate Engine y Del Algoritmo Support Vector Machine Regression Con Datos NASA Power. Rev. Geol. Apl. Ing. Ambiente 2023, 50, e005.s. [Google Scholar] [CrossRef]
- Peng, W.; Kuang, T.; Tao, S. Quantifying Influences of Natural Factors on Vegetation NDVI Changes Based on Geographical Detector in Sichuan, Western China. J. Clean. Prod. 2019, 233, 353–367. [Google Scholar] [CrossRef]
- Lamchin, M.; Lee, W.K.; Jeon, S.W.; Wang, S.W.; Lim, C.H.; Song, C.; Sung, M. Long-Term Trend and Correlation between Vegetation Greenness and Climate Variables in Asia Based on Satellite Data. Sci. Total Environ. 2018, 618, 1089–1095. [Google Scholar] [CrossRef] [PubMed]
- Qu, S.; Wang, L.; Lin, A.; Zhu, H.; Yuan, M. What Drives the Vegetation Restoration in Yangtze River Basin, China: Climate Change or Anthropogenic Factors? Ecol. Indic. 2018, 90, 438–450. [Google Scholar] [CrossRef]
- Pettorelli, N.; Vik, J.O.; Mysterud, A.; Gaillard, J.M.; Tucker, C.J.; Stenseth, N.C. Using the Satellite-Derived NDVI to Assess Ecological Responses to Environmental Change. Trends Ecol. Evol. 2005, 20, 503–510. [Google Scholar] [CrossRef] [PubMed]
- Huntington, J.L.; Hegewisch, K.C.; Daudert, B.; Morton, C.G.; Abatzoglou, J.T.; McEvoy, D.J.; Erickson, T. Climate Engine: Cloud Computing and Visualization of Climate and Remote Sensing Data for Advanced Natural Resource Monitoring and Process Understanding. Bull. Am. Meteorol. Soc. 2017, 98, 2397–2409. [Google Scholar] [CrossRef]
- Balconi, M.; Brusoni, S.; Orsenigo, L. In Defence of the Linear Model: An Essay. Res. Policy 2010, 39, 1–13. [Google Scholar] [CrossRef]
- Babar, I.; Ayed, H.; Chand, S.; Suhail, M.; Khan, Y.A.; Marzouki, R. Modified Liu Estimators in the Linear Regression Model: An Application to Tobacco Data. PLoS ONE 2021, 16, e0259991. [Google Scholar] [CrossRef] [PubMed]
- Mašek, J.; Tumajer, J.; Lange, J.; Vejpustková, M.; Kašpar, J.; Šamonil, P.; Chuman, T.; Kolář, T.; Rybníček, M.; Jeníček, M.; et al. Shifting Climatic Responses of Tree Rings and NDVI along Environmental Gradients. Sci. Total Environ. 2024, 908, 168275. [Google Scholar] [CrossRef] [PubMed]
- Prasai, R. Using Google Earth Engine for the Complete Pipeline of Temporal Analysis of NDVI in Chitwan National of Nepal. Res. Sq. 2022, 3, 151–157. [Google Scholar] [CrossRef]
- Huang, E.; Chen, Y.; Fang, M.; Zheng, Y.; Yu, S. Environmental Drivers of Plant Distributions at Global and Regional Scales. Glob. Ecol. Biogeogr. 2021, 30, 697–709. [Google Scholar] [CrossRef]
- Johnson, D.M.; Rosales, A.; Mueller, R.; Reynolds, C.; Frantz, R.; Anyamba, A.; Pak, E.; Tucker, C. Usa Crop Yield Estimation with Modis Ndvi: Are Remotely Sensed Models Better than Simple Trend Analyses? Remote Sens. 2021, 13, 4227. [Google Scholar] [CrossRef]
- Karkauskaite, P.; Tagesson, T.; Fensholt, R. Evaluation of the Plant Phenology Index (PPI), NDVI and EVI for Start-of-Season Trend Analysis of the Northern Hemisphere Boreal Zone. Remote Sens. 2017, 9, 485. [Google Scholar] [CrossRef]
- le Maire, G.; Marsden, C.; Nouvellon, Y.; Grinand, C.; Hakamada, R.; Stape, J.L.; Laclau, J.P. MODIS NDVI Time-Series Allow the Monitoring of Eucalyptus Plantation Biomass. Remote Sens. Environ. 2011, 115, 2613–2625. [Google Scholar] [CrossRef]
- Barichivich, J.; Briffa, K.R.; Myneni, R.; van der Schrier, G.; Dorigo, W.; Tucker, C.J.; Osborn, T.J.; Melvin, T.M. Temperature and Snow-Mediated Moisture Controls of Summer Photosynthetic Activity in Northern Terrestrial Ecosystems between 1982 and 2011. Remote Sens. 2014, 6, 1390–1431. [Google Scholar] [CrossRef]
- Camberlin, P.; Martiny, N.; Philippon, N.; Richard, Y. Determinants of the Interannual Relationships between Remote Sensed Photosynthetic Activity and Rainfall in Tropical Africa. Remote Sens. Environ. 2007, 106, 199–216. [Google Scholar] [CrossRef]
- Roznik, M.; Boyd, M.; Porth, L. Improving Crop Yield Estimation by Applying Higher Resolution Satellite NDVI Imagery and High-Resolution Cropland Masks. Remote Sens. Appl. Soc. Environ. 2022, 25, 100693. [Google Scholar] [CrossRef]
- Mbatha, N.; Xulu, S. Time Series Analysis of MODIS-Derived NDVI for the Hluhluwe-Imfolozi Park, South Africa: Impact of Recent Intense Drought. Climate 2018, 6, 95. [Google Scholar] [CrossRef]
- Kinyanjui, M.J. NDVI-Based Vegetation Monitoring in Mau Forest Complex, Kenya. Afr. J. Ecol. 2010, 49, 165–174. [Google Scholar] [CrossRef]
- Gkatzioura, P.E.; Perakis, K. Analysis of Urban Heat Island (UHI) through Climate Engine and Arcgis Pro in Different Cities of Bulgaria. In Proceedings of the Eighteenth International Scientific Conference, Sofia, Bulgaria, 19–21 October 2022. [Google Scholar]
- Guan, L.; Yang, J.; Bell, J.M. Cross-Correlations between Weather Variables in Australia. Build. Environ. 2007, 42, 1054–1070. [Google Scholar] [CrossRef]
- Schmidt, A.F.; Finan, C. Linear Regression and the Normality Assumption. J. Clin. Epidemiol. 2018, 98, 146–151. [Google Scholar] [CrossRef] [PubMed]
- Zhao, M.; Peng, C.; Xiang, W.; Deng, X.; Tian, D.; Zhou, X.; Yu, G.; He, H.; Zhao, Z. Plant Phenological Modeling and Its Application in Global Climate Change Research: Overview and Future Challenges. Environ. Rev. 2013, 21, 1–14. [Google Scholar] [CrossRef]
- Wu, S.; Di, B.; Ustin, S.L.; Wong, M.S.; Adhikari, B.R.; Zhang, R.; Luo, M. Dynamic Characteristics of Vegetation Change Based on Reconstructed Heterogenous NDVI in Seismic Regions. Remote Sens. 2023, 15, 299. [Google Scholar] [CrossRef]
- Aktas, A.F.; Berk Ustundag, B. Phenology Based NDVI Time-Series Compensation for Yield Estimation Analysis. In Proceedings of the 2017 6th International Conference on Agro-Geoinformatics, Agro-Geoinformatics, Fairfax, VA, USA, 7–10 August 2017; Institute of Electrical and Electronics Engineers Inc.: Piscataway, NJ, USA, 2017. [Google Scholar]
- Rodrigo, O.B. Innovación y Tecnología Para Mejorar La Sustentabilidad Agrícola En El Sector Pecuario. Rev. Colomb. Cienc. Pecu. 2019, 32, 22–33. [Google Scholar]
- Huang, J.; Wang, X.; Li, X.; Tian, H.; Pan, Z. Remotely Sensed Rice Yield Prediction Using Multi-Temporal NDVI Data Derived from NOAA’s-AVHRR. PLoS ONE 2013, 8, e70816. [Google Scholar] [CrossRef] [PubMed]
- Ferrer, M.; Echeverría, G.; Pereyra, G.; Gonzalez-Neves, G.; Pan, D.; Mirás-Avalos, J.M. Mapping Vineyard Vigor Using Airborne Remote Sensing: Relations with Yield, Berry Composition and Sanitary Status under Humid Climate Conditions. Precis. Agric. 2020, 21, 178–197. [Google Scholar] [CrossRef]
- Tenreiro, T.R.; García-Vila, M.; Gómez, J.A.; Jiménez-Berni, J.A.; Fereres, E. Using NDVI for the Assessment of Canopy Cover in Agricultural Crops within Modelling Research. Comput. Electron. Agric. 2021, 182, 106038. [Google Scholar] [CrossRef]
- Chiang, S.H.; Ulloa, N.I. Mapping and Tracking Forest Burnt Areas in the Indio Maiz Biological Reserve Using Sentinel-3 SLSTR and VIIRS-DNB Imagery. Sensors 2019, 19, 5423. [Google Scholar] [CrossRef] [PubMed]
- Chemura, A.; Mutanga, O.; Dube, T. Integrating Age in the Detection and Mapping of Incongruous Patches in Coffee (Coffea arabica) Plantations Using Multi-Temporal Landsat 8 NDVI Anomalies. Int. J. Appl. Earth Obs. Geoinf. 2017, 57, 1–13. [Google Scholar] [CrossRef]
- Chen, D.; Zhao, Q.; Jiang, P.; Li, M. Incorporating Ecosystem Services to Assess Progress towards Sustainable Development Goals: A Case Study of the Yangtze River Economic Belt, China. Sci. Total Environ. 2022, 806, 151277. [Google Scholar] [CrossRef] [PubMed]
- Guerron Barahona, A.M.; Viera Arroyo, W.F.; Campaña Cruz, D.F.; Vasquez Rojas, L.; Montufar Salcedo, C.L. Aplicación de Índices Vegetales (Banda Roja e Infrarrojo Cercano) En Plantaciones de Aguacate. Siembra 2022, 9, e3371. [Google Scholar] [CrossRef]
- Rahman, M.S.; Di, L.; Shrestha, R.; Yu, E.G.; Lin, L.; Kang, L.; Deng, M. Comparison of Selected Noise Reduction Techniques for MODIS Daily NDVI: An Empirical Analysis on Corn and Soybean. In Proceedings of the 2016 Fifth International Conference on Agro-Geoinformatics (Agro-Geoinformatics), Tianjin, China, 18–20 July 2016. [Google Scholar]
- Guan, S.; Fukami, K.; Matsunaka, H.; Okami, M.; Tanaka, R.; Nakano, H.; Sakai, T.; Nakano, K.; Ohdan, H.; Takahashi, K. Assessing Correlation of High-Resolution NDVI with Fertilizer Application Level and Yield of Rice and Wheat Crops Using Small UAVs. Remote Sens. 2019, 11, 112. [Google Scholar] [CrossRef]
- Belmahi, M.; Hanchane, M.; Krakauer, N.Y.; Kessabi, R.; Bouayad, H.; Mahjoub, A.; Zouhri, D. Analysis of Relationship between Grain Yield and NDVI from MODIS in the Fez-Meknes Region, Morocco. Remote Sens. 2023, 15, 2707. [Google Scholar] [CrossRef]
- Rivera, L.B.; Bonilla, B.M.; Obando-Vidal, F. Processing Multispectral Imaging Captured by Drones to Evaluate the Normalized Difference Vegetation Index of Castillo Coffee Plantations. Cienc. Tecnol. Agropecu. 2021, 22, 1578. [Google Scholar] [CrossRef]
- Campos, B.F.D.; Alves, H.M.R.; Volpato, M.M.L.; Inácio, F.D.; Silva, V.A. Distribuição do Ndvi e Exposição de Vertentes em Áreas Cafeeiras em Santo Antônio do Amparo, MG 1. In Proceedings of the X Simpósio de Pesquisa dos Cafés do Brasil, Vitoria, Brazil, 8–11 October 2019, ISSN 1984-9249. [Google Scholar]
- André, M.B.P.; De, M.A.C.; Rocha, J.; Chaves, M. Modelagem Espectro-Temporal Do NDVI Obtido de Imagens Landsat 7 e 8 Aplicado Na Cafeicultura. XiX Simpósio Bras. De Sensoriamento Remoto 2019, 19, 96622. [Google Scholar]
- Dos Santos, L.M.; E S Ferraz, G.A.; Marin, D.B.; Carvalho, M.A.; Guimarães, R.J.; O Alecrim, A.D. Ndvi Aplicado em Imagens Multiespectrais de Cafeeiros Sadios e Cafeeiros Infestados Com Bicho-Mineiro Ndvi Applied in Multiespectral Images of Healthy Coffee and Coffee Infested with “Bicho-Mineiro”. 2020. XLIX Congresso Brasileiro de Engenharia Agrícola—Brasil. Available online: https://ainfo.cnptia.embrapa.br/digital/bitstream/doc/1143370/1/NDVI-APLICADO-EM-IMAGENS-2020-1.pdf (accessed on 25 July 2024).
- Chuai, X.W.; Huang, X.J.; Wang, W.J.; Bao, G. NDVI, Temperature and Precipitation Changes and Their Relationships with Different Vegetation Types during 1998-2007 in Inner Mongolia, China. Int. J. Climatol. 2013, 33, 1696–1706. [Google Scholar] [CrossRef]
- Jiao, K.; Gao, J.; Liu, Z. Precipitation Drives the Ndvi Distribution on the Tibetan Plateau While High Warming Rates May Intensify Its Ecological Droughts. Remote Sens. 2021, 13, 1305. [Google Scholar] [CrossRef]
- Zhang, H.; Liu, L.; Jiao, W.; Li, K.; Wang, L.; Liu, Q. Watershed Runoff Modeling through a Multi-Time Scale Approach by Multivariate Empirical Mode Decomposition (MEMD). Environ. Sci. Pollut. Res. 2022, 29, 2819–2829. [Google Scholar] [CrossRef] [PubMed]
- Turvey, C.G.; McLaurin, M.K. Applicability of the Normalized Difference Vegetation Index (NDVI) in Index-Based Crop Insurance Design. Weather Clim. Soc. 2012, 4, 271–284. [Google Scholar] [CrossRef]
- Skok, G. Precipitation Attribution Distance. Atmos. Res. 2023, 295, 106998. [Google Scholar] [CrossRef]
- Gomez, C.; Despinoy, M.; Hamon, S.; Hamon, P.; Salmon, D.; Akaffou, D.S.; Legnate, H.; de Kochko, A.; Mangeas, M.; Poncet, V. Shift in Precipitation Regime Promotes Interspecific Hybridization of Introduced Coffea Species. Ecol. Evol. 2016, 6, 3240–3255. [Google Scholar] [CrossRef] [PubMed]
- Parada Molina, P.C.; Cervantes Pérez, J.; Ruiz Molina, V.E.; Cerdán Cabrera, C.R. Efectos de La Variabilidad de La Precipitación En La Fenología Del Café: Caso Zona Cafetalera Xalapa-Coatepec, Veracruz, Mex. Ing. Región 2020, 24, 61–71. [Google Scholar] [CrossRef]
- Drinnan, J.E.; Menzel, C.M. Temperature Affects Vegetative Growth and Flowering of Coffee (Coffea arabica L.). J. Hortic. Sci. 1995, 70, 25–34. [Google Scholar] [CrossRef]
- Davis, A.P.; Gargiulo, R.; Almeida, I.N.d.M.; Caravela, M.I.; Denison, C.; Moat, J. Hot Coffee: The Identity, Climate Profiles, Agronomy, and Beverage Characteristics of Coffea Racemosa and C. Zanguebariae. Front. Sustain. Food Syst. 2021, 5, 740137. [Google Scholar] [CrossRef]
- Gerson, A.A. Comportamiento de Tres Variedades de Café (Coffea arabica L.) en El Valle del Perené, Junín-Perú”; Universidad Nacional Agraria La Molia: Lima, Peru, 2016. [Google Scholar]
- Martinez, A.d.l.I.; Labib, S.M. Demystifying Normalized Difference Vegetation Index (NDVI) for Greenness Exposure Assessments and Policy Interventions in Urban Greening. Environ. Res. 2023, 220, 115155. [Google Scholar] [CrossRef] [PubMed]
- Johnson, M.D.; Hsieh, W.W.; Cannon, A.J.; Davidson, A.; Bédard, F. Crop Yield Forecasting on the Canadian Prairies by Remotely Sensed Vegetation Indices and Machine Learning Methods. Agric. For. Meteorol. 2016, 218–219, 74–84. [Google Scholar] [CrossRef]
- Garcia-Garcia, D.; Reynafarje la Rosa, X.; Grados Bedoya, D.; Schrevens, E. Linear Mixed Model Analysis of NDVI-Based Canopy Coverage, Extracted from Sequential UAV Multispectral Imagery of an Open Field Tomato Irrigation Experiment. Comput. Electron. Agric. 2021, 189, 106399. [Google Scholar] [CrossRef]
- Bolton, D.K.; Friedl, M.A. Forecasting Crop Yield Using Remotely Sensed Vegetation Indices and Crop Phenology Metrics. Agric. For. Meteorol. 2013, 173, 74–84. [Google Scholar] [CrossRef]
- Xu, C.; Katchova, A.L. Predicting Soybean Yield with NDVI Using a Flexible Fourier Transform Model. J. Agric. Appl. Econ. 2019, 51, 402–416. [Google Scholar] [CrossRef]


| Variable | Download Source | Download Date | Start and End of Download | Number of Data Downloaded (Every Factor) | Number of Data Used (Every Factor) |
|---|---|---|---|---|---|
| NDVI | http://ClimateEngine.org (accessed on 10 January 2024). | R = 321 | R = 321 | ||
| 2 April 2000 | 25 December 2022 | H = 562 | H = 562 | ||
| S = 559 | S = 459 | ||||
| Maximum Temperatures, Minimum Temperatures, Precipitation, and Relative Humidity | http://ClimateEngine.org (accessed on 10 January 2024). | R = 8401 | R = 8401 | ||
| 2 April 2000 | 25 December 2022 | H = 8401 | H = 8401 | ||
| S = 8401 | S = 8401 |
| Pixel with Coffee Crop | Number | Mean | Standard Deviation | Standard Error | Coefficient of Variation |
|---|---|---|---|---|---|
| P1 NDVI Huambo | 562 | 0.573 a | 0.078 | 0.003 | 0.136 |
| P2 NDVI Huambo | 455 | 0.571 a | 0.083 | 0.004 | 0.146 |
| P3 NDVI Huambo | 436 | 0.641 b | 0.077 | 0.004 | 0.121 |
| P4 NDVI Huambo | 317 | 0.617 b | 0.060 | 0.003 | 0.097 |
| P9 NDVI Sauce | 459 | 0.687 c | 0.098 | 0.005 | 0.143 |
| P12 NDVI Sauce | 253 | 0.695 c | 0.093 | 0.006 | 0.133 |
| P7 NDVI Rumiaco | 197 | 0.720 d | 0.095 | 0.007 | 0.132 |
| P5 NDVI Rumiaco | 321 | 0.759 e | 0.108 | 0.006 | 0.143 |
| P6 NDVI Rumiaco | 265 | 0.772 e | 0.103 | 0.006 | 0.134 |
| P10 NDVI Sauce | 378 | 0.771 e | 0.085 | 0.004 | 0.110 |
| P11 NDVI Sauce | 317 | 0.760 e | 0.084 | 0.005 | 0.110 |
| P8 NDVI Rumiaco | 140 | 0.799 f | 0.104 | 0.009 | 0.130 |
| Source of Variance | Sum of Squares | Degree of Freedom | Mean Sum of Square | F-Calc | p-Value |
|---|---|---|---|---|---|
| Model | 25.63 | 11 | 2.33 | 300.05 | <0.0001 |
| PIXEL | 25.63 | 11 | 2.33 | 300.05 | <0.0001 |
| Error | 31.75 | 4088 | 0.01 | ||
| Total | 57.38 | 4099 |
| Place | Mean | Standard Deviation | Number |
|---|---|---|---|
| Huambo | 0.597 a | 0.082 | 1770 |
| Suace | 0.727 b | 0.098 | 1407 |
| Rumiaco | 0.760 c | 0.106 | 923 |
| Source of Variance | Sum of Squares | Degree of Freedom | Mean Sum of Square | F-Calc | p-Value |
|---|---|---|---|---|---|
| Model | 21.35 | 2 | 10.67 | 1213.93 | <0.0001 |
| Zone | 21.35 | 2 | 10.67 | 1213.93 | <0.0001 |
| Error | 36.03 | 4097 | 0.01 | ||
| Total | 57.38 | 4099 |
| Pixel Summary | Minimum Temperatures (°C) | Precipitation (mm) | Relative Humidity (%) | Maximum Temperatures (°C) | |
|---|---|---|---|---|---|
| 1 | Number | 562 | 562 | 562 | 562 |
| 1 | Mean | 10.67 | 0.81 | 75.17 | 22.02 |
| 1 | Standard deviation | 1.47 | 2.52 | 7.51 | 2.05 |
| 1 | Coefficient of variation | 13.74 | 310.51 | 3.9 | 9.29 |
| 1 | Minimum | 6.17 | 0.00 | 33.88 | 17.33 |
| 1 | Maximum | 13.49 | 41.7 | 91.81 | 28.72 |
| 1 | Median | 10.94 | 0.04 | 75.85 | 21.81 |
| 1 | Sum of squares | 65239.5 | 3947.86 | 3207600 | 274810.23 |
| 2 | Number | 455 | 455 | 455 | 455 |
| 2 | Mean | 10.71 | 0.86 | 75.06 | 22.09 |
| 2 | Standard deviation | 1.45 | 2.74 | 7.6 | 2.08 |
| 2 | Coefficient of variation | 13.52 | 319.73 | 10.13 | 9.41 |
| 2 | Minimum | 6.17 | 0.00 | 33.88 | 17.33 |
| 2 | Maximum | 13.49 | 41.7 | 91.81 | 28.72 |
| 2 | Median | 10.89 | 0.04 | 75.81 | 21.97 |
| 2 | Sum of squares | 53120.84 | 3749.15 | 2589556 | 223960.13 |
| 3 | Number | 436 | 436 | 436 | 436 |
| 3 | Mean | 10.69 | 0.84 | 74.97 | 22.1 |
| 3 | Standard deviation | 1.45 | 2.078 | 7.63 | 0.08 |
| 3 | Coefficient of variation | 13.52 | 332.27 | 10.18 | 9.41 |
| 3 | Minimum | 6.17 | 0 | 33.88 | 17.33 |
| 3 | Maximum | 13.49 | 41.7 | 91.81 | 28.72 |
| 3 | Median | 10.98 | 0.04 | 75.69 | 21.96 |
| 3 | Sum of squares | 50743.99 | 3663.9 | 2475633 | 214778.94 |
| 4 | Number | 317 | 317 | 317 | 317 |
| 4 | Mean | 10.6 | 0.73 | 74.78 | 22.06 |
| 4 | Standard deviation | 1.43 | 2.09 | 7.81 | 2.08 |
| 4 | Coefficient of variation | 13.49 | 285 | 10.45 | 9.44 |
| 4 | Minimum | 6.17 | 0 | 33.88 | 17.4 |
| 4 | Maximum | 13.49 | 20.25 | 91.12 | 28.49 |
| 4 | Median | 10.86 | 0.04 | 75.81 | 21.88 |
| 4 | Sum of squares | 36291.18 | 1554.29 | 1791757 | 155601.54 |
| 5 | Number | 321 | 321 | 321 | 321 |
| 5 | Mean | 10.62 | 0.86 | 75 | 21.92 |
| 5 | Standard deviation | 1.48 | 2.86 | 7.73 | 2.15 |
| 5 | Coefficient of variation | 13.94 | 331.09 | 10.31 | 9.82 |
| 5 | Minimum | 6.17 | 0 | 34.75 | 16.12 |
| 5 | Maximum | 13.65 | 41.7 | 91.81 | 28.72 |
| 5 | Median | 10.88 | 0.03 | 75.94 | 21.69 |
| 5 | Sum of squares | 36924.38 | 2863.26 | 1824519 | 155667.13 |
| 6 | Number | 265 | 265 | 265 | 265 |
| 6 | Mean | 10.57 | 0.92 | 74.49 | 22.02 |
| 6 | Standard deviation | 1.51 | 3.1 | 7.8 | 2.13 |
| 6 | Coefficient of variation | 14.3 | 336.14 | 10.48 | 9.68 |
| 6 | Minimum | 6.17 | 0 | 34.75 | 16.12 |
| 6 | Maximum | 13.65 | 41.7 | 91.81 | 28.72 |
| 6 | Median | 10.87 | 0.02 | 75.62 | 21.81 |
| 6 | Sum of squares | 30229 | 2769.45 | 1486493 | 129661.57 |
| 7 | Number | 197 | 197 | 197 | 197 |
| 7 | Mean | 10.56 | 0.75 | 74.29 | 22.08 |
| 7 | Standard deviation | 1.49 | 1.89 | 7.56 | 2.15 |
| 7 | Coefficient of variation | 14.07 | 251.56 | 10.18 | 9.73 |
| 7 | Minimum | 6.37 | 0 | 43.06 | 16.77 |
| 7 | Maximum | 13.65 | 12.42 | 90.94 | 28.72 |
| 7 | Median | 10.82 | 0.01 | 75.38 | 21.81 |
| 7 | Sum of squares | 22404.78 | 810.16 | 1098349 | 96906.16 |
| 8 | Number | 140 | 140 | 140 | 140 |
| 8 | Mean | 10.43 | 0.67 | 73.64 | 22.16 |
| 8 | Standard deviation | 1.53 | 1.9 | 7.61 | 2.13 |
| 8 | Coefficient of variation | 14.65 | 283.87 | 10.33 | 9.63 |
| 8 | Minimum | 6.37 | 0 | 43.06 | 17.02 |
| 8 | Maximum | 13.65 | 12.42 | 89.44 | 28.72 |
| 8 | Median | 10.39 | 0.01 | 74.81 | 21.8 |
| 8 | Sum of squares | 15548.72 | 564.11 | 767285.3 | 69360.24 |
| 9 | Number | 459 | 459 | 459 | 459 |
| 9 | Mean | 10.65 | 0.8 | 75.13 | 21.99 |
| 9 | Standard deviation | 1.46 | 2.67 | 7.46 | 2.08 |
| 9 | Coefficient of variation | 13.67 | 331.4 | 9.92 | 9.47 |
| 9 | Minimum | 6.17 | 0 | 33.88 | 16.12 |
| 9 | Maximum | 13.65 | 41.7 | 91.81 | 28.72 |
| 9 | Median | 10.94 | 0.03 | 75.81 | 21.8 |
| 9 | Sum of squares | 53043.17 | 3553.84 | 2616608 | 223881.29 |
| 10 | Number | 378 | 378 | 378 | 378 |
| 10 | Mean | 10.65 | 0.77 | 74.93 | 22.04 |
| 10 | Standard deviation | 1.45 | 2.78 | 7.66 | 2.12 |
| 10 | Coefficient of variation | 13.59 | 361.23 | 10.22 | 9.6 |
| 10 | Minimum | 6.17 | 0 | 33.88 | 16.12 |
| 10 | Maximum | 13.65 | 41.7 | 91.81 | 28.72 |
| 10 | Median | 10.92 | 0.03 | 75.81 | 21.83 |
| 10 | Sum of squares | 43688.66 | 3139.46 | 2144594 | 185330.92 |
| 11 | Number | 317 | 317 | 317 | 317 |
| 11 | Mean | 10.58 | 0.8 | 75.06 | 21.99 |
| 11 | Standard deviation | 1.47 | 2.99 | 7.17 | 2.11 |
| 11 | Coefficient of variation | 13.91 | 371.9 | 9.55 | 9.59 |
| 11 | Minimum | 6.37 | 0 | 43.06 | 16.12 |
| 11 | Maximum | 13.65 | 41.7 | 91.81 | 28.72 |
| 11 | Median | 10.82 | 0.03 | 75.81 | 21.73 |
| 11 | Sum of squares | 36168.98 | 3026.33 | 1802337 | 154689.45 |
| 12 | Number | 253 | 253 | 253 | 253 |
| 12 | Mean | 10.62 | 0.82 | 74.92 | 22.08 |
| 12 | Standard deviation | 1.47 | 3.09 | 7.13 | 2.12 |
| 12 | Coefficient of variation | 13.85 | 374.81 | 9.51 | 9.61 |
| 12 | Minimum | 6.37 | 0 | 45.12 | 16.12 |
| 12 | Maximum | 13.65 | 41.7 | 91.81 | 28.72 |
| 12 | Median | 10.83 | 0.03 | 75.69 | 21.88 |
| 12 | Sum of squares | 29059.21 | 2569.99 | 1432929 | 124472.26 |
Disclaimer/Publisher’s Note: The statements, opinions and data contained in all publications are solely those of the individual author(s) and contributor(s) and not of MDPI and/or the editor(s). MDPI and/or the editor(s) disclaim responsibility for any injury to people or property resulting from any ideas, methods, instructions or products referred to in the content. |
© 2024 by the authors. Licensee MDPI, Basel, Switzerland. This article is an open access article distributed under the terms and conditions of the Creative Commons Attribution (CC BY) license (https://creativecommons.org/licenses/by/4.0/).
Share and Cite
García, L.; Veneros, J.; Oliva-Cruz, M.; Olivares, N.; Chavez, S.G.; Rojas-Briceño, N.B. Construction of Linear Models for the Normalized Vegetation Index (NDVI) for Coffee Crops in Peru Based on Historical Atmospheric Variables from the Climate Engine Platform. Atmosphere 2024, 15, 923. https://doi.org/10.3390/atmos15080923
García L, Veneros J, Oliva-Cruz M, Olivares N, Chavez SG, Rojas-Briceño NB. Construction of Linear Models for the Normalized Vegetation Index (NDVI) for Coffee Crops in Peru Based on Historical Atmospheric Variables from the Climate Engine Platform. Atmosphere. 2024; 15(8):923. https://doi.org/10.3390/atmos15080923
Chicago/Turabian StyleGarcía, Ligia, Jaris Veneros, Manuel Oliva-Cruz, Neiro Olivares, Segundo G. Chavez, and Nilton B. Rojas-Briceño. 2024. "Construction of Linear Models for the Normalized Vegetation Index (NDVI) for Coffee Crops in Peru Based on Historical Atmospheric Variables from the Climate Engine Platform" Atmosphere 15, no. 8: 923. https://doi.org/10.3390/atmos15080923
APA StyleGarcía, L., Veneros, J., Oliva-Cruz, M., Olivares, N., Chavez, S. G., & Rojas-Briceño, N. B. (2024). Construction of Linear Models for the Normalized Vegetation Index (NDVI) for Coffee Crops in Peru Based on Historical Atmospheric Variables from the Climate Engine Platform. Atmosphere, 15(8), 923. https://doi.org/10.3390/atmos15080923