Article

Evaluation of the Forecasting Performance of Supercooled Clouds for the Weather Modification Model of the Cloud and Precipitation Explicit Forecasting System

1
Weather Modification Center of Jiangsu Province, Nanjing 210000, China
2
China Meteorological Administration Aerosol-Cloud and Precipitation Key Laboratory, Nanjing University of Information Science and Technology, Nanjing 210044, China
3
Meteorology Bureau of Yancheng City, Yancheng 224000, China
4
Key Laboratory of Transportation Meteorology of China Meteorological Administration, Nanjing Joint Institute for Atmospheric Sciences, Nanjing 210000, China
5
Meteorology Bureau of Xuzhou City, Xuzhou 221000, China
*
Authors to whom correspondence should be addressed.
Atmosphere 2024, 15(8), 928; https://doi.org/10.3390/atmos15080928 (registering DOI)
Submission received: 4 June 2024 / Revised: 25 July 2024 / Accepted: 29 July 2024 / Published: 3 August 2024
(This article belongs to the Special Issue Numerical Weather Prediction Models and Ensemble Prediction Systems)

Abstract

:
Through the application of cloud top temperature data and the extraction of supercooled cloud information in cloud-type data from the next-generation Himawari-8 geostationary satellite with high spatial–temporal resolution, a quantitative evaluation of the forecasting performance of the weather modification model named the Cloud and Precipitation Explicit Forecasting System (CPEFS) was conducted. The evaluation, based on selected forecast cases from 8 days in September and October 2018 initialized at 00 and 12 UTC every day, focused especially on the forecasting performance in supercooled clouds (vertical integrated supercooled liquid water, VISL > 0), including the comprehensive spatial distribution of cloud top temperature (CTT) and 3 h precipitation over 0.1 mm (R3 > 0.1). The results indicated that the forecasting performance for VISL > 0 was relatively good, with the Threat Score (TS) ranging from 0.46 to 0.67. The forecasts initialized at 12 UTC slightly outperformed the forecasts initialized at 00 UTC. Additionally, the corresponding spatial Anomaly Correlation Coefficient (ACC) of CTT between forecasts and observations was 0.23, and the TS for R3 > 0.1 reached as high as 0.87. For a mix of cold and warm cloud systems, there was a correlation between the forecasting performance of VISL > 0 and CTT. The trends in the TS for VISL > 0 and the ACC of CTT aligned with the forecast lead-time.

1. Introduction

Artificial precipitation stimulation is an important method of protecting ecological and water resources through the scientific exploitation of airborne cloud water resources. In order to improve the service benefits of artificial precipitation stimulation in drought resistance, disaster reduction, and ecological civilization construction, China’s meteorological department developed a Cloud-Resolvable Weather Modification Model (CR-WMM) [1]. This model is applied in the fine-scale forecasting of cloud seeding conditions, providing a decision-making basis for scientifically designing cloud seeding operations to improve rainfall enhancement efficiency.
The CR-WMM is established within the framework of mesoscale model dynamics and coupled with the explicit dual-parameter cloud microphysics scheme developed and improved independently by the China Academy of Meteorological Science (CAMS) [2,3,4]. In 2007, based on the GRAPES and MM5 mesoscale models, the weather modification numerical prediction systems of GRAPES-CAMS and MM5-CAMS were established and put into quasi-operational application, with a best resolution of 5 km. These systems released the products of cloud macroscopic and microscopic features, cloud seeding conditions, and precipitation daily. The products were applied for rain reduction services during the opening ceremony of the 2008 Olympics and drought resistance services in five southwestern provinces of China in 2010 [5]. Sun et al. [6], Liu et al. [7], and Ma et al. [8] quantitatively verified the forecasting capabilities of GRAPES-CAMS for precipitation, supercooled clouds, and various types of hydrometeors, respectively, according to the observation data of ground precipitation, six radiosonde stations, and the TRMM polar satellite. Shi et al. [9], Sun et al. [10], and Ding et al. [11] verified the forecasting capabilities of MM5-CAMS for cloud bands compared with geostationary satellite observation data of cloud images, cloud optical thickness, and blackbody brightness temperature. In 2014, the weather modification numerical prediction system of WRF-CAMS, also named the Cloud and Precipitation Explicit Forecasting System (CPEFS), was established based on the new-generation WRF mesoscale model and put into operational application with a maximum resolution of 3 km [12]. After Liu et al. [1] introduced a four-dimensional data assimilation system [13,14] into the WRF model, added an aerosol emission scheme to the CAMS cloud microphysics scheme, and increased the resolution to 1 km, a high-resolution numerical prediction system for cloud–precipitation–aerosol interactions was established. Researchers [1,15,16,17] qualitatively verified the forecasting capabilities of WRF-CAMS for precipitation, cloud bands, and hydrometeors compared with observational data of ground precipitation, blackbody brightness temperature from geostationary satellites, hydrometeors from polar satellites, and radar reflectivity. The above studies were mostly qualitative verifications of the forecasting capabilities of weather modification models for cloud macro- and micro-features compared with radar and geostationary satellite images due to limited observational elements, with limited quantitative verification according to the observation data from radiosondes with low spatial resolution and polar satellites with low time resolution and limited coverage. Therefore, there are still challenges such as a limited coverage of observational data, low spatial–temporal resolution, and limited observational elements, which hinder the meeting of the requirements of operational and quantitative performance evaluation in weather modification numerical model systems.
Obviously, the performance evaluation of the weather modification numerical model systems is not only a key scientific issue for the development of such models but also an important operational issue for forecasters to accurately analyze the macro- and micro-characteristics of clouds and the conditions of cloud seeding according to the model products. Therefore, in order to promote the operational and quantitative development of the performance evaluation of weather modification models, Zhang et al. [18] explored the use of Fengyun-2 geostationary satellite data, which have a wide coverage range that meets operational requirements, to quantitatively evaluate the forecasting performance of cloud top temperature by a weather modification model with an ACC of 0.17–0.25. Recently, the next-generation geostationary meteorological satellite Himawari-8 with high spatial–temporal resolution was launched successfully [19,20], with the Advanced Himawari Imager (AHI) at a time resolution of 10 min and a spatial resolution of less than 4 km. It has more advantages than the Fengyun-2 geostationary satellite in the operational and quantitative evaluation of the forecasting performance of weather modification models, especially with the integrated Fengyun geostationary algorithm platform (FYGAT) [21], which provides more diverse cloud products with higher spatial–temporal resolution. This advancement could further promote the multi-element evaluation of the forecasting performance of weather modification models, offering strong data support for evaluating the forecasting performance of weather modification models regarding cloud macro-features, cloud seeding conditions, and cloud precipitation. However, the observation data from the Himawari-8 satellite have not yet been applied in the performance evaluation of weather modification models. Therefore, in this study, we tried to utilize and further extract cloud observation information from the Himawari-8 satellite, focusing on the forecasting of cloud seeding conditions of supercooled clouds. We evaluated the forecasting performance of supercooled clouds and comprehensively assessed the forecasting performance of cloud macro-features, such as the spatial distribution of cloud top temperature and cloud precipitation.

2. Materials and Methods

According to the cloud top temperature and cloud type data from the next-generation Himawari-8 geostationary satellite with a high spatial–temporal resolution, and the merged precipitation data from automatic meteorological stations, satellites, and radars, the spatial Anomaly Correlation Coefficient (ACC) and Threat Score (TS) methods were adopted to evaluate the forecasting performance of CPEFS Version 1.0 developed by the Weather Modification Center of the China Meteorological Administration regarding supercooled clouds, cloud top temperature, and 3 h precipitation. The 16 evaluation cases with rainfall processes and cold cloud seeding conditions for artificial rain enhancement from 8 days during September and October in 2018 were selected considering the saved data integrity of the model and satellite, each starting at 00 and 12 UTC. This study aimed to assess the forecasting ability of weather modification numerical model systems in terms of cloud seeding conditions, cloud macro-characteristics, and cloud precipitation by comprehensive analysis of the correlation between the forecasting performance of supercooled clouds and the forecasting performance of cloud top temperature.

2.1. Verification Methods for the Weather Modification Model of CPEFS

The CPEFS used the mesoscale numerical weather model of WRF Version 3.5 as its dynamic framework and coupled with the cloud and precipitation explicit scheme of CAMS developed by the China Academy of Meteorological Science. It can provide forecast products such as cloud macro, cloud micro, and precipitation fields. The horizontal resolution of the forecast products is 3 km with 19 vertical layers from 100 to 1000 hPa at an interval of 50 hPa. Its forecast lead-time is 48 h. It adopts the RRTM longwave radiation scheme, the Dudhia shortwave radiation scheme, the YSU boundary layer scheme, and the Noah land surface process scheme.
This study selected forecast products of vertical integrated supercooled liquid water (VISL), cloud top temperature (CTT), and 3 h precipitation (R3) released at 00 and 12 UTC on 8 days: 4, 19, 21, 22, 23, and 24 September and 12 and 21 October in 2018 (named 0904, 0919, 0921, 0922, 0923, 0924, 1012, 1021). The synoptic conditions of these cases in September were related to the low-pressure trough in the westerly belt and Western Pacific Subtropical High. For cases 0919, 0921, 0922, and 0923, due to the development and maintenance of the Western Pacific Subtropical High, with the eastward movement of the westerly belt, convective and stratiform mixed clouds were generated in the north of the Subtropical High. For cases 0904 and 0924, due to the eastern withdrawal of the Subtropical High, the convection in the mixed clouds weakened significantly. The synoptic conditions of these cases in October were related to the low-pressure trough in the westerly belt and southwest warm and humid airflow from the Bay of Bengal. For cases 1012 and 1021, the stratiform clouds were generated in the research region. The above convective and stratiform mixed clouds and stratiform clouds with supercooled water were the optimal target clouds for artificial precipitation stimulation in autumn within the research region.
We utilized and extracted the high-spatial–temporal-resolution cloud products from the Himawari-8 geostationary satellite with a wide coverage and high-quality precipitation observation data from the integrated sources of Chinese automatic stations, satellites, and radars. The forecast and observation results were interpolated onto model grid points at a resolution of 6 km. Quantitative verifications were conducted to assess the forecasting ability of the weather modification model of the CPEFS in the central region of China (29~39° N, 107~124° E), focusing especially on supercooled cloud systems of the artificial precipitation stimulation target regarding its macroscopic characteristics and surface precipitation.
This study adopted a binary classification test method to evaluate the forecasting performance of supercooled clouds and CTT. Taking supercooled clouds as an example, firstly, both cloudy results from model and satellite observations were extracted, except for precipitation, which was extracted from the whole region. Then, on the basis of the contingency table (Table 1), the model forecasts and satellite observations of supercooled clouds were labeled as 1, while non-supercooled/warm clouds were labeled as 0. Supercooled clouds contain supercooled water, indicated by the deep pink color in the following figures. Non-supercooled/warm clouds do not contain supercooled water, indicated by the blue color in the following figures. Then, the number of grid points with correct forecasts in the region was denoted as NA, the number of grid points with incorrect forecasts was denoted as NB, and the number of missed forecasts was denoted as NC. Finally, the TS, False Alarm Rate (FAR), and Missed Detection Rate (MDR) were calculated to quantitatively evaluate the forecasting performance of the model in predicting supercooled clouds. The values of TS, FAR, and MDR range from 0 to 1. Perfect scores for TS, FAR, and MDR are 1, 0, and 0 respectively.
T S = N A N A + N B + N C
F A R = N B N A + N B
M D R = N C N A + N C
The spatial ACC was used to evaluate the forecasting performance of cloud top temperature in terms of the spatial distribution. The specific formula is as follows:
A C C = 1 n k = 1 n ( S m , k S m ¯ ) ( S h , k S h ¯ ) 1 n k = 1 n ( S m , k S m ¯ ) 2 1 n k = 1 n ( S h , k S h ¯ ) 2  
where S m , k and S h , k represent the cloud top temperature values of the k-th grid point from the model and the Himawari-8 satellite cloud products, respectively, and n is the number of grid points. S m ¯ and S h ¯ represent the spatial average of cloud top temperature values from the model and Himawari-8 satellite cloud products, respectively. The value of ACC ranges from −1 to 1. The value of ACC with 1 is a perfect score.
The above verification metrics for evaluating the forecasting performance of cloud characteristics, such as supercooled clouds and CTT, were strictly only valid where there were clouds in both model and satellite observation fields.

2.2. Processing of the Himawari-8 Geostationary Satellite Cloud Products

This study planned to utilize the cloud top temperature observation data from the cloud products of the Himawari-8 satellite at a resolution of 4 km and extract the observation information of the supercooled clouds from the cloud type observation data to evaluate the forecasting performance of the CPEFS regarding cloud characteristics.
The cloud type observation data refer to the thermodynamic types of cloud tops, with the main products of clear sky, warm water clouds, supercooled water clouds, mixed clouds, thick ice clouds, thin ice clouds, and multi-layer clouds. (1) Clear sky is determined by the cloud detection products, which distinguish between clear and cloudy skies based on the 8th and 9th spectral channels of the Advanced Geosynchronous Radiation Imager (AGRI) according to different spectral, spatial, and temporal characteristics. (2) Warm water clouds are liquid water clouds with a cloud top temperature above 273 K, which do not contain supercooled water. They are important target clouds for artificial rain enhancement and warm cloud seeding, as shown by the deep blue color in the following figures. (3) Supercooled water clouds are liquid water clouds with a cloud top temperature below 273 K. Mixed clouds are composed of liquid water and ice phase particles at the cloud top. Thick ice clouds are ice clouds with a cloud optical thickness >2.0. Firstly, the greater the cloud optical thickness, the more abundant the liquid water content in the cloud. Especially, some studies used a cloud optical thickness >1.0 to diagnose whether the ice clouds contain the supercooled water [22]. Meanwhile, thick ice clouds, supercooled water clouds, and mixed clouds are all important target clouds for artificial rain enhancement and cold cloud seeding. Therefore, this study aimed to extract the observation information of supercooled water clouds, mixed clouds, and thick ice clouds, collectively defined as the cloud systems containing the supercooled water, as indicated by the pink color in the following figures. (4) Thin ice clouds are the ice clouds with a cloud optical thickness <2.0, usually with a low water content, and are not suitable for artificial rain enhancement. Multi-layer clouds refer to thin ice clouds stacked on top of the warm water clouds or supercooled water clouds, making it difficult to distinguish whether the lower cloud layer are the warm water clouds or supercooled water clouds. Therefore, the thin ice clouds and multi-layer clouds in this study were handled as the missing data, representing cloud types that cannot be determined accurately.

2.3. Application of Integrated Precipitation Data from Automatic Meteorological Stations, Satellites, and Radars

This study evaluated the precipitation forecast performance of the weather modification model of the CPEFS according to the hourly merged precipitation data from automatic meteorological stations, satellites, and radars provided by the China Meteorological Information Center with a spatial resolution of approximately 0.05°.

3. Results

Figure 1 presents the average forecast performance of CTT, R3 > 0.1, and VISL > 0 over 48 h for the weather modification model of the CPEFS. According to the black bars (All), on average, across all 16 cases, the spatial ACC between the model-forecasted CTT and observed results was 0.23, the TS for R3 > 0.1 was 0.87, and the TS for VISL > 0 (the frequency of occurrence was 79.3% within the observed cloud region) was 0.58. Comparing the dark (S00) and light blue bars (S12), it was observed that the forecasting performances of R3 > 0.1 between the 00 and 12 UTC model initialization were similar. The spatial ACC of cloud top temperature and TS for supercooled clouds initialized at 12 UTC were slightly higher at 0.25 and 0.59, respectively, compared to the scores of 0.22 and 0.56 for the 00 UTC initialization.

3.1. Variability in the Forecasting Performance of Supercooled Clouds for Cases

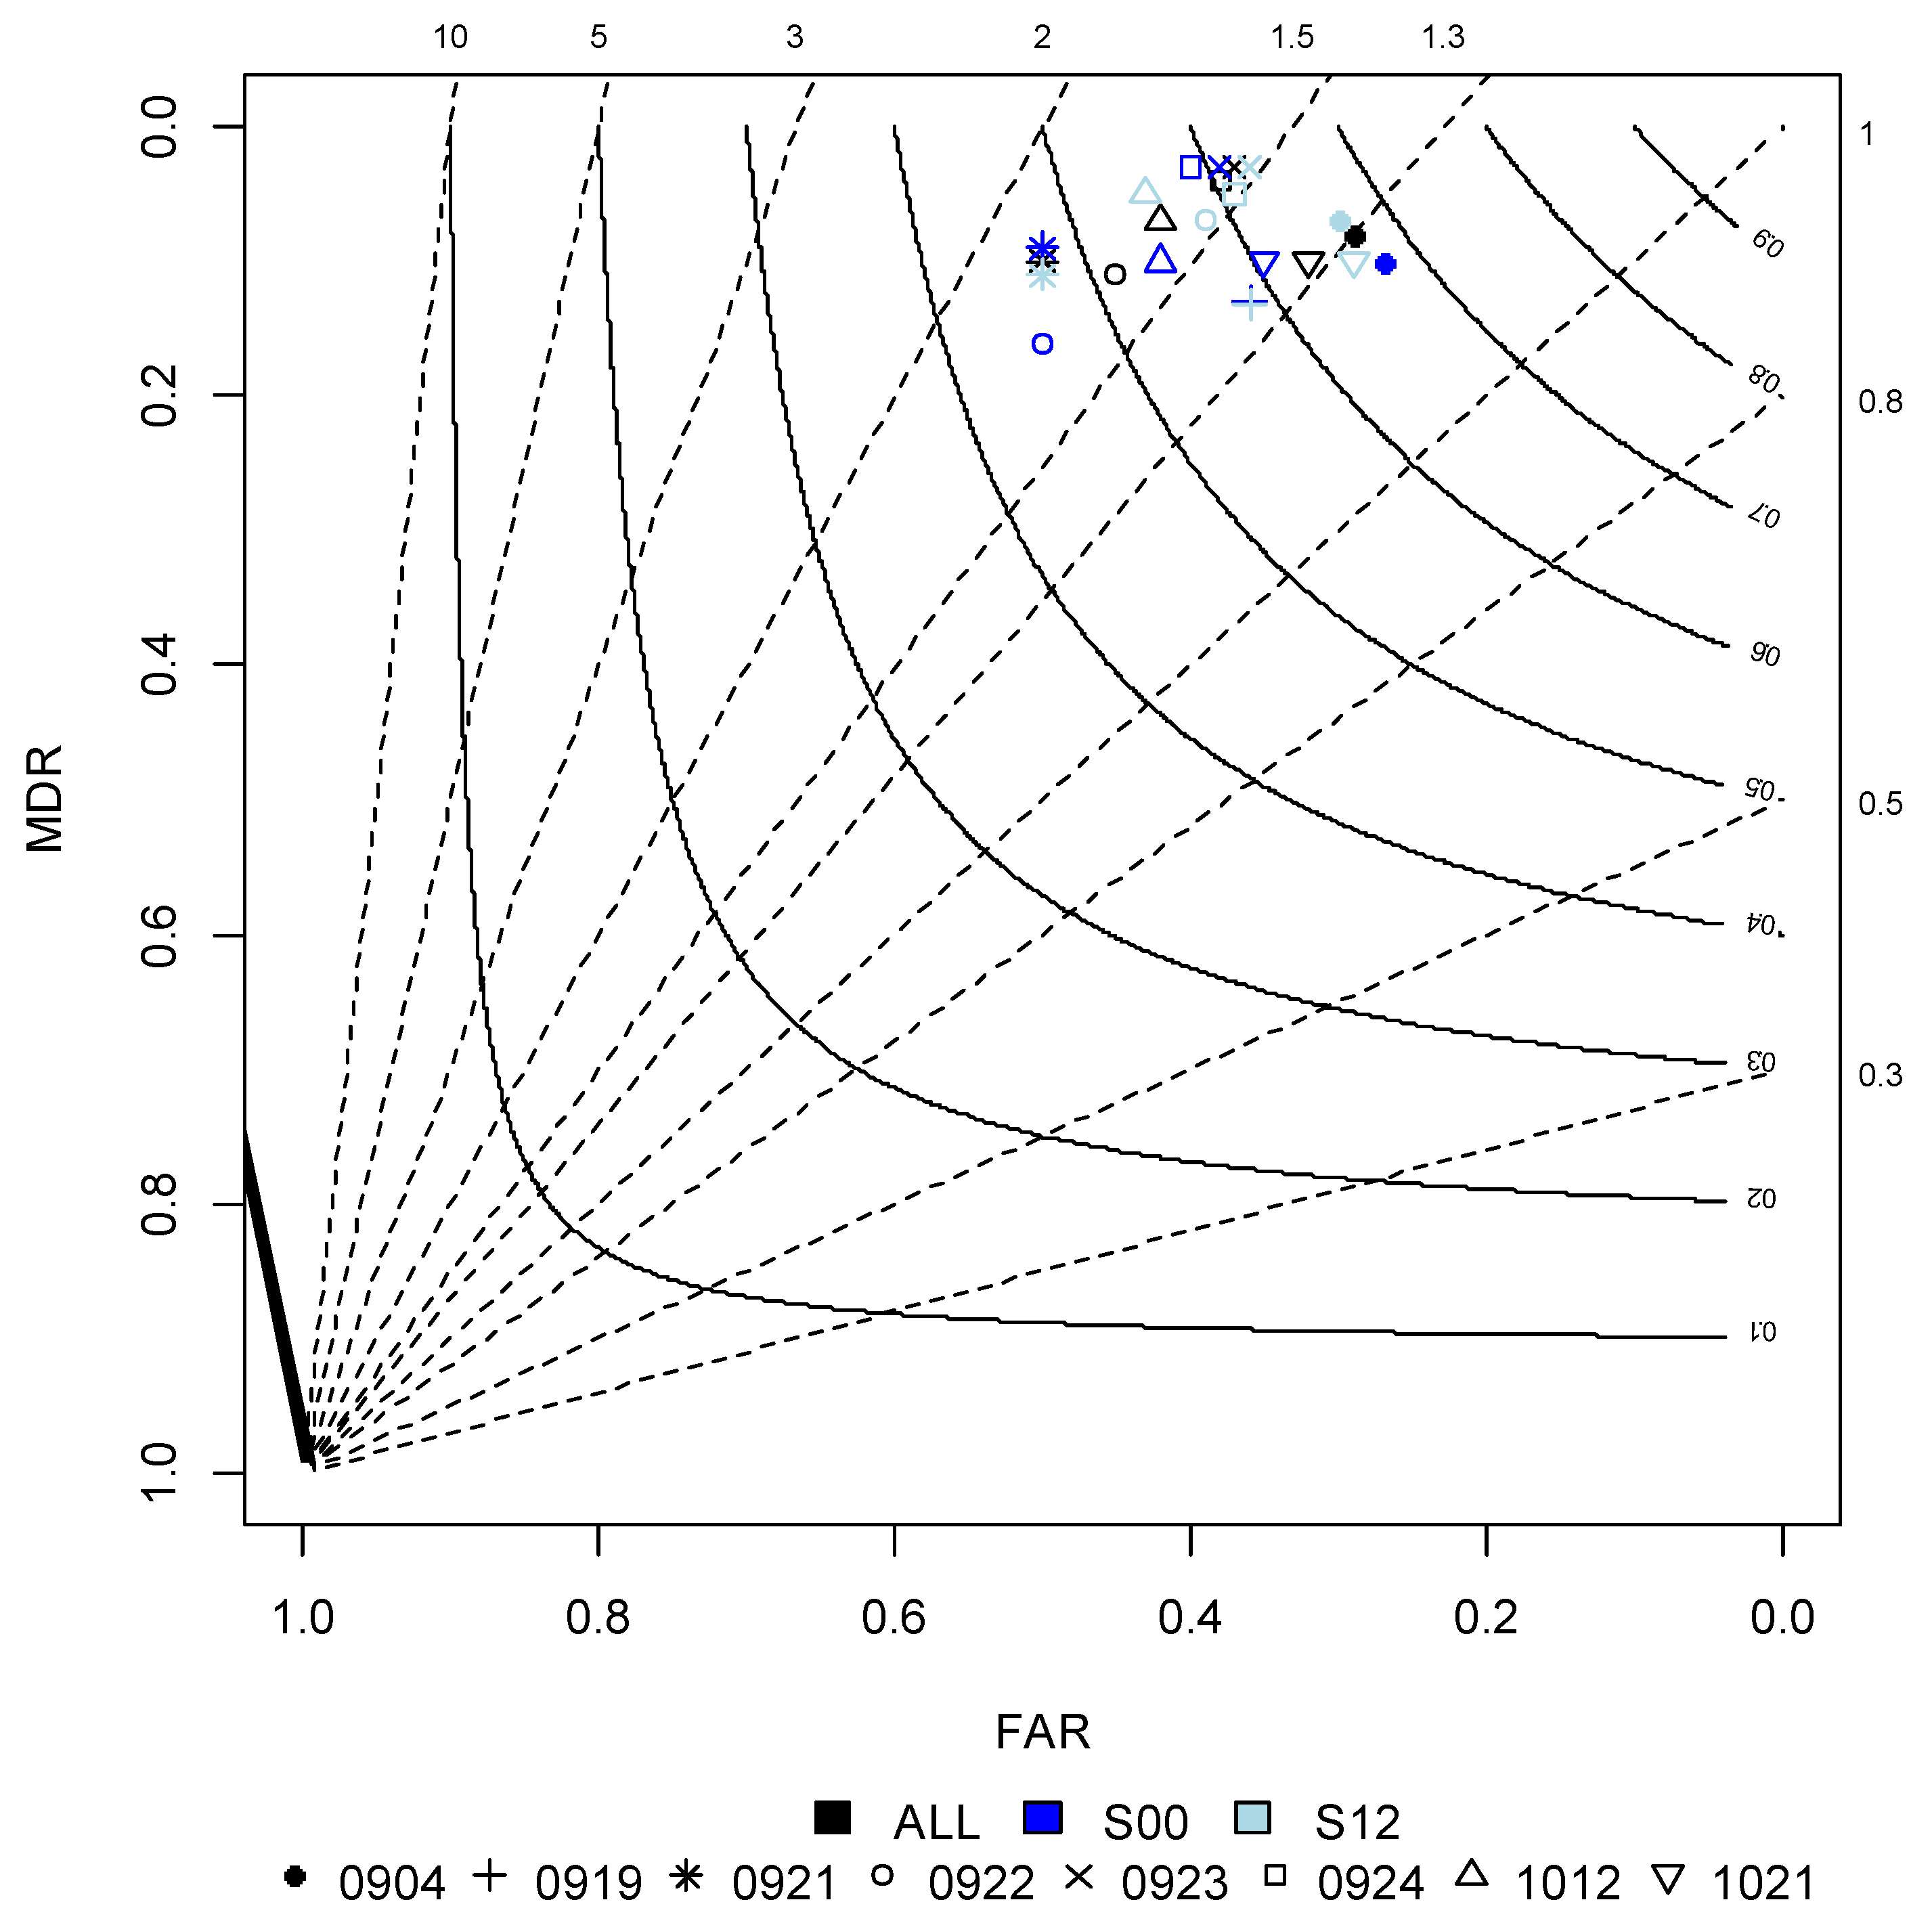
Figure 2 and Table 2, respectively, provide the performance diagram and rank table of the mean TS, FAR, and MDR for supercooled clouds in the 48 h forecasts of various cases initialized at 00 and 12 UTC over 8 days in the model. The TS ranged from 0.46 to 0.67. Cases 0904 and 1021 had higher scores, while cases 0921, 0922, and 1012 had lower scores. Case 0904 initialized at 00 UTC had the highest TS of 0.67, while case 0921 initialized at 12 UTC had the lowest TS of only 0.46. The FAR ranged from 0.29 to 0.50, aligning with the TS results. Cases 0904 and 1021 had a higher TS and lower FAR, whereas cases 0921, 0922, and 1012 had a lower TS and higher FAR. The MDRs were generally low, ranging from 0.03 to 0.13. Additionally, the average TS, FAR, and MDR for cases initialized at 12 UTC were 0.59, 0.38, and 0.08 respectively, which were better than the averages for cases initialized at 00 UTC with 0.56, 0.40, and 0.09, respectively. Based on the comparison rank table (Table 2), it can be seen that cases 0922, 0923, 0924, 1012, and 1021 initialized at 12 UTC had a better TS and FAR compared to the cases initialized at 00 UTC. The advantage of cases initialized at 12 UTC in the performance of MDR was slightly reduced compared to those initialized at 00 UTC. Only cases 0904, 0922, and 1012 initialized at 12 UTC outperformed those initialized at 00 UTC. Even case 0924 initialized at 00 UTC had a better MDR than 12 UTC.

3.2. Correlation between the Forecasting Performance of Supercooled Clouds and Cloud Top Temperature Distribution

Supercooled water refers to the liquid water that exists in the atmosphere when the temperature is below 273 K. Typically, warm clouds with a cloud top temperature above 273 K do not contain supercooled water, while cold clouds with a cloud top temperature below 273 K may have supercooled water. In particular, cold clouds with a low cloud top temperature and deep development are more likely to have abundant supercooled water. Therefore, the distribution of supercooled clouds is correlated with the distribution of cloud top temperature.
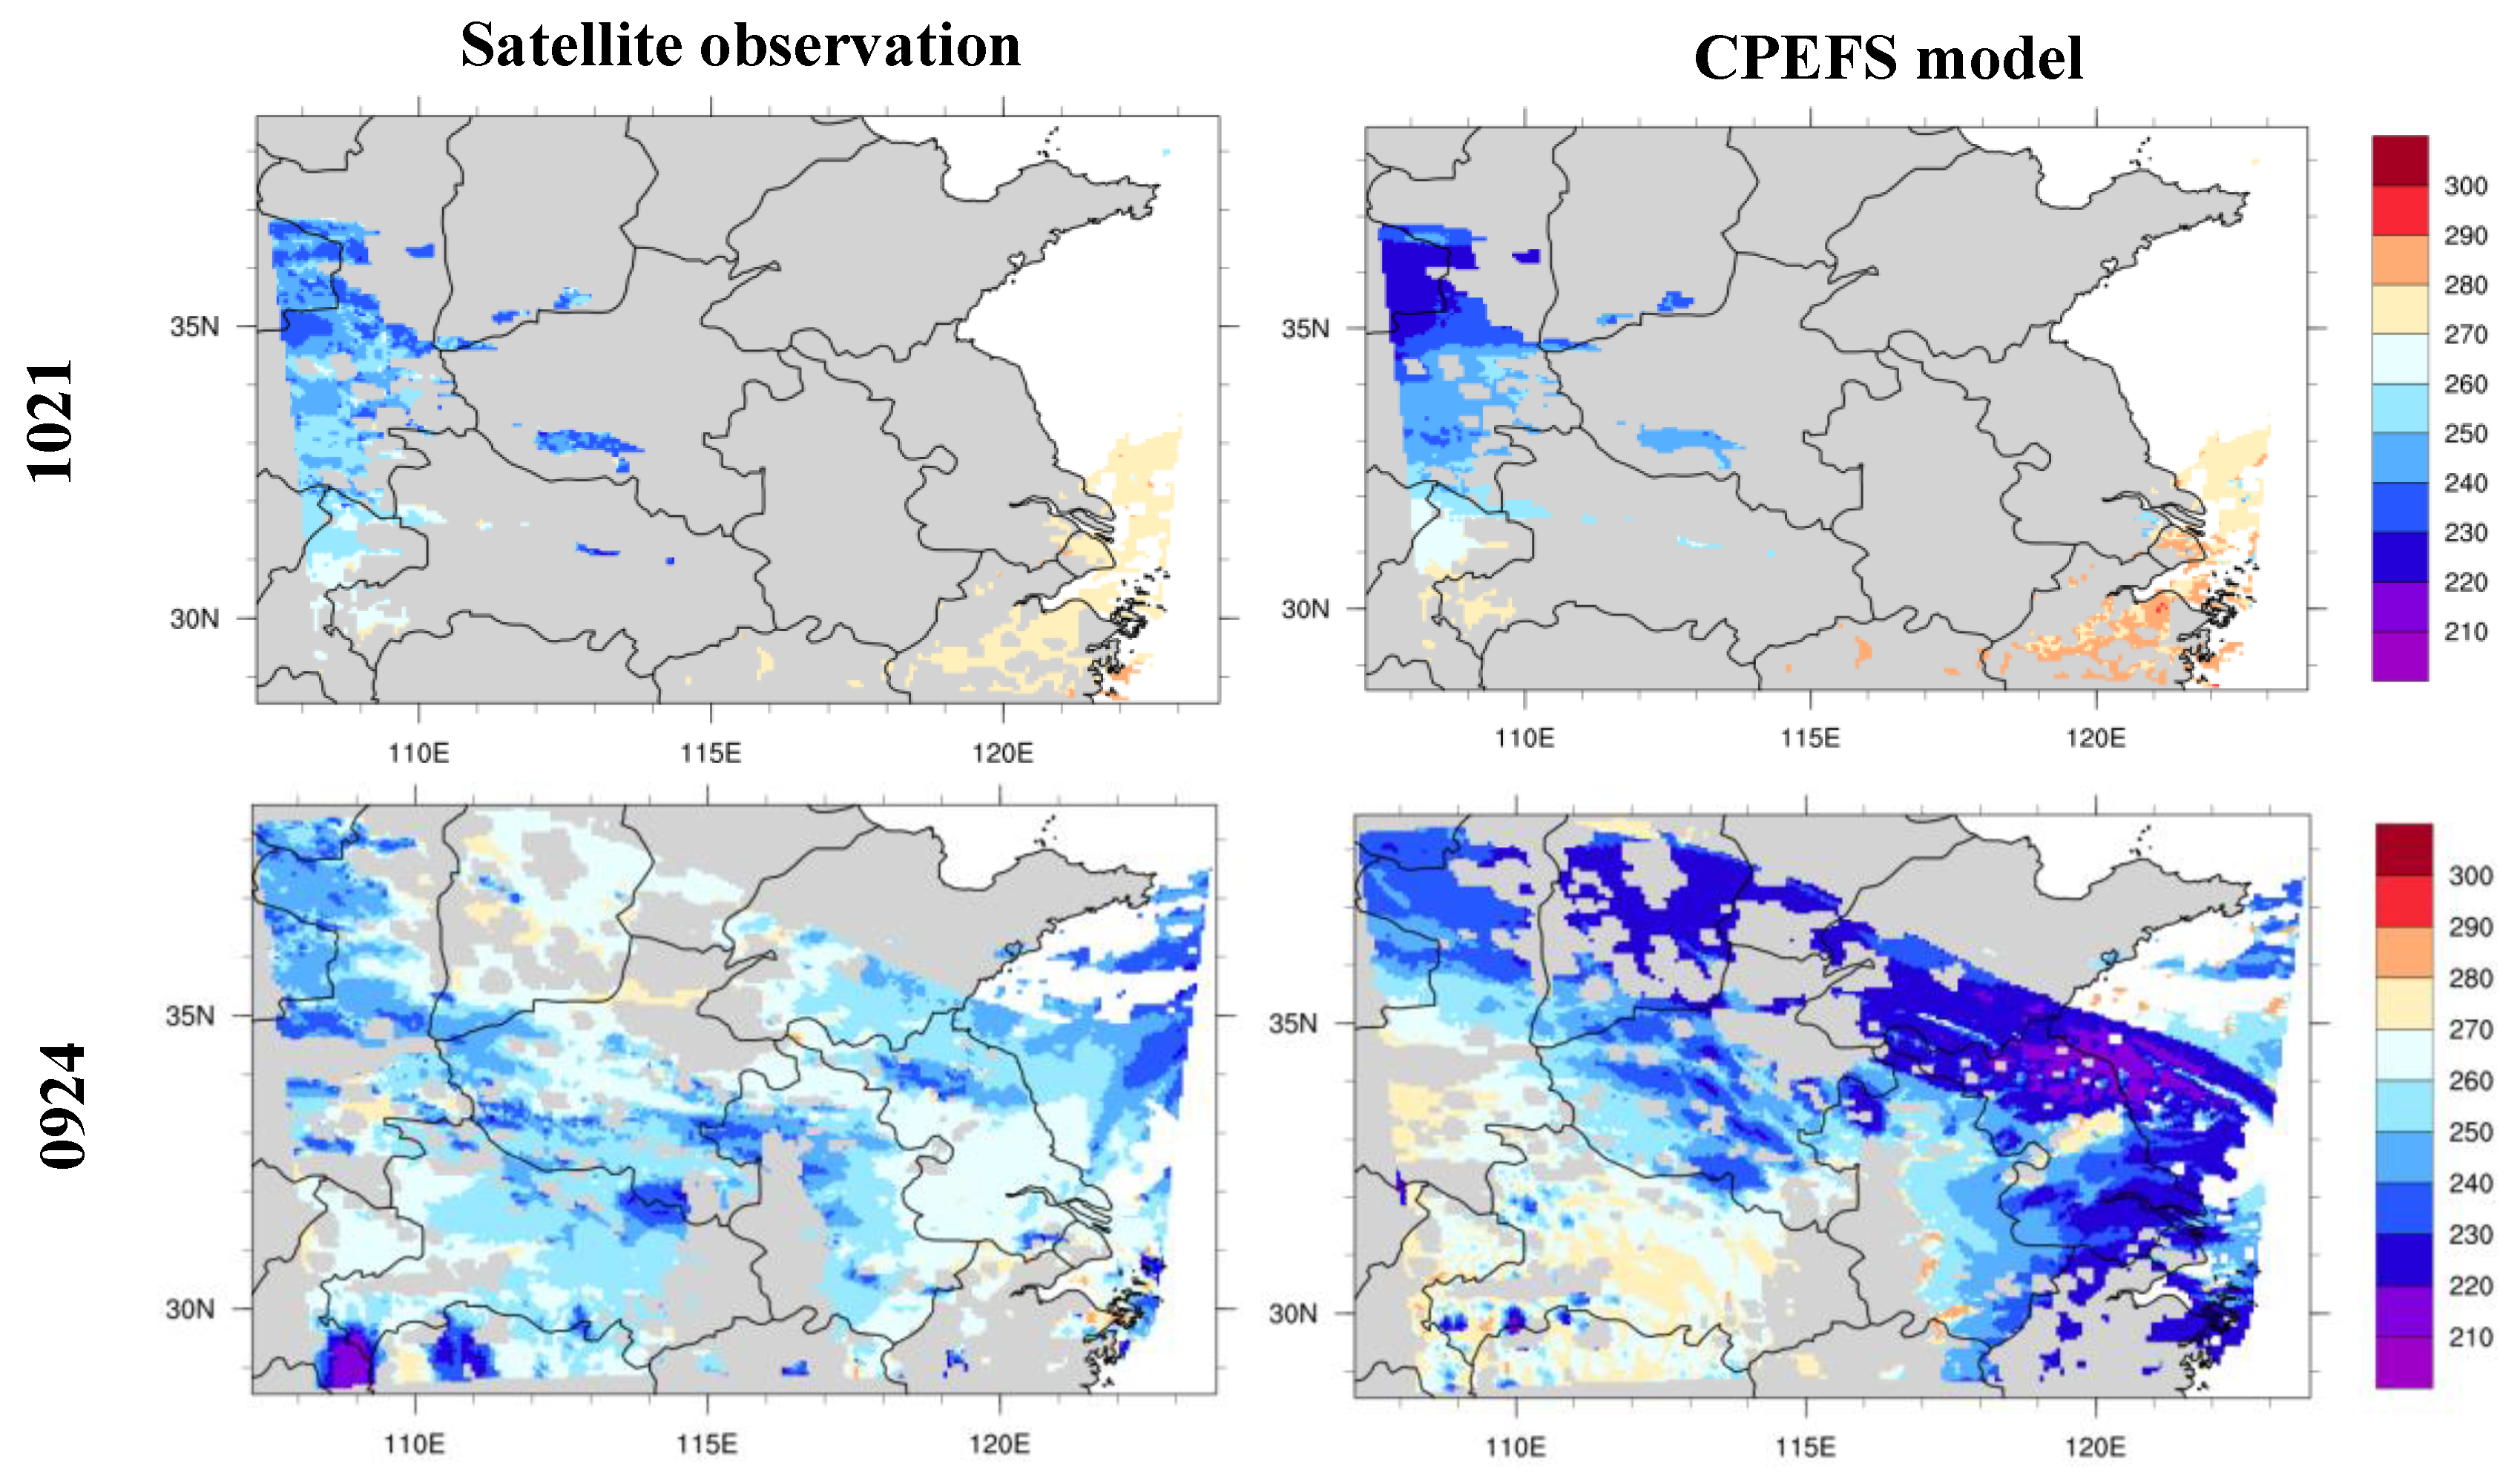
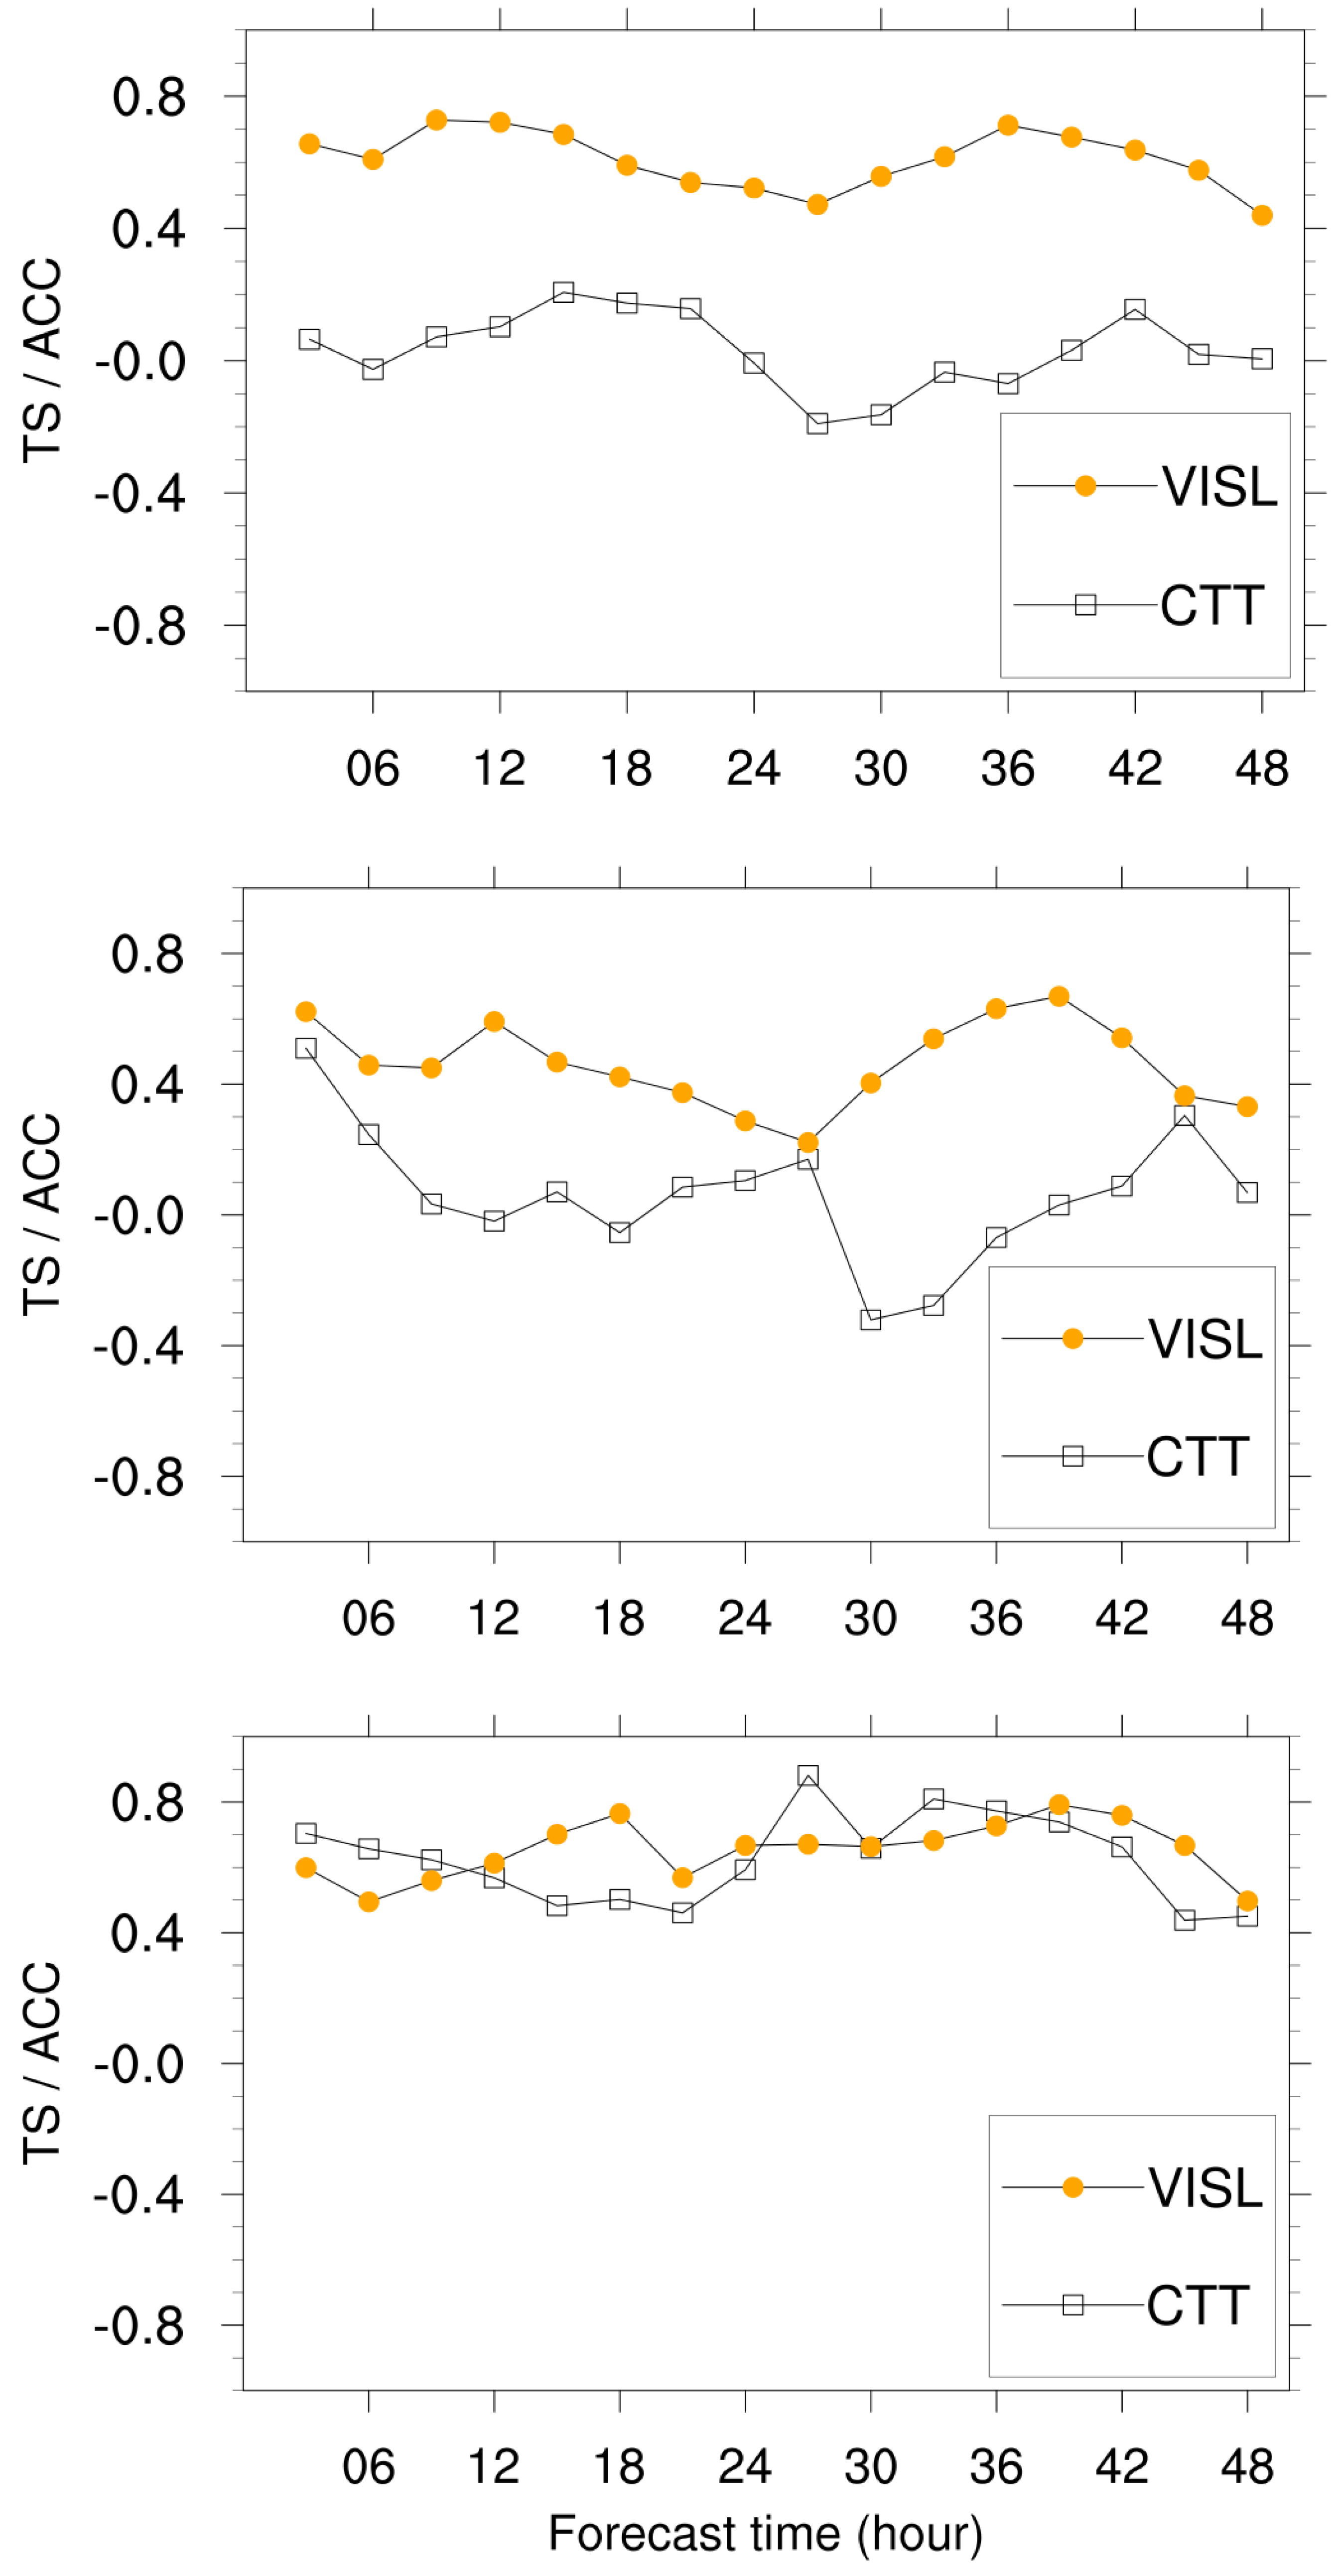
Figure 3 shows the scatter plot between the TS of supercooled clouds and spatial ACC of cloud top temperature for eight cases initialized at 00 and 12 UTC. The ACC of CTT for different cases ranged from 0.03 to 0.63, showing large variability. In the case of 1021, the ACCs of CTT initialized at 00 and 12 UTC were highest at 0.60 and 0.63, respectively, with their corresponding TS for supercooled clouds ranking second (Table 3). Comparatively, in the case of 0921, the ACCs of CTT initialized at 00 and 12 UTC were the second lowest, at only 0.07 and 0.06, and the corresponding TSs for supercooled water were lowest (Table 3). When comparing the 27th forecasts from the 12 UTC initialization of 1021 with the satellite observations (Figure 4, top), the model accurately predicted the spatial distribution structure of the lower CTT in the west and higher CTT in the east, indicating the cold clouds in the west and warm clouds in the east. However, for the case of 0921, the model significantly mispredicted the CTT (Figure 5, top). Satellite observations showed that there were cold cloud covers in the southwest and southeast regions, with the CTT slightly lower in the southwest than the southeast. However, the model forecasted a large area of warm cloud covers in the southwest, with the CTT significantly higher than the observed, while in the southeast, despite forecasting the cold cloud covers, the CTTs were lower than in the southwest. The correlation between the 30th-hour forecast and the actual CTT was only −0.35 (Figure 6, middle). The spatial ACC of CTT in cases 0904, 0919, 0922, 0923, and 1012, as well as the TS of supercooled clouds, were all good (Figure 7). However, the case of 0924 exhibited a lower spatial ACC for CTT and higher TS for supercooled clouds. Further analysis revealed that this case was mainly covered by cold clouds with few warm clouds, so the spatial distribution of CTT could not represent the spatial distribution differences between the cold and warm clouds, leading to a significant reduction in the spatial distribution of CTT in the association with supercooled clouds (Figure 4, below). In conclusion, when both the cold and warm clouds covers were present in the research area, a more reasonable spatial distribution of CTT usually led to a higher accuracy in forecasting supercooled clouds.
In addition, Figure 6 shows the sequence of changes in the spatial ACC of the cloud top temperature and TS of supercooled clouds for cases 0924, 0921, and 1021 with the forecast lead-time. It was found that although the forecasting performance of supercooled clouds for case 0924 was poorly correlated with the forecasting performance of cloud top temperature, for the same case and the same cloud system processes, the trends in the spatial ACC of cloud top temperature and TS of supercooled clouds were consistent with the forecast lead-time.

4. Conclusions and Discussions

This study utilized and extracted the next generation of Himawari-8 geostationary satellite cloud products to conduct operational evaluations of the forecasting performance of supercooled clouds, cloud top temperature spatial distribution, and 3 h surface precipitation in the new generation of the weather modification model of the CPEFS. This research provided technical support for comprehensive assessments of the forecasting performance of cloud macroscopic characteristics and precipitation for the weather modification models. Specific conclusions were as follows:
(1)
On average, the forecasting performance of supercooled clouds by the weather modification model was relatively good, with a TS of 0.58. The results from the 12 UTC initialization were slightly better than those from the 00 UTC initialization. The spatial Anomaly Correlation Coefficient of cloud top temperature between forecasts and observations was 0.23, and the TS for 3 h precipitation exceeding 0.1 mm was 0.87.
(2)
The forecasting performance of supercooled clouds exhibited individual case differences. For example, in the case of 0904 initialized at 00 UTC, the highest TS reached 0.67, while in the case of 0921 initialized at 12 UTC, the lowest TS was only 0.46. False Alarm Rates ranged from 0.29 to 0.50, with a higher TS associated with lower False Alarm Rates. The Missed Detection Rates were as low as 0.03 to 0.13. Overall, the results from the 12 UTC initialization were better than those from the 00 UTC initialization.
(3)
The forecasting performance of supercooled clouds in relation to the spatial distribution of cloud top temperature was correlated. For cold–warm mixed cloud processes, the cases of 1021 and 0921 exhibited the highest and lowest correlation coefficients in terms of the spatial distribution of cloud top temperature, correspondingly ranking as the higher and lower TSs for supercooled clouds. For single cold cloud or warm cloud processes, the correlation between the forecasting performance of supercooled clouds and the spatial distribution of cloud top temperature significantly weakened in the case of 0924. However, within the same case, as the forecast lead-time increased, the trends in the changes in the spatial ACC of cloud top temperature and the TS of supercooled clouds aligned.
The above research results indicated that the CPEFS model had the ability to predict the presence of supercooled water in clouds, but its ability needs further improvement when compared with the forecast skill of precipitation regarding whether clear or rain. This study utilized the observation data of Himawari-8 geostationary satellite cloud products with a wide coverage area to achieve quantitative and operational evaluation of the forecasting performance of the characteristic parameters of cloud seeding conditions for the weather modification models. This laid the foundation for objectively analyzing the prediction errors of the models, designing a reasonable ensemble forecasting scheme in combination with the international new dual-parameter microphysical schemes in the future, and further improving the forecasting performance of the characteristic parameters of the cloud seeding condition for the weather modification models.

Author Contributions

Conceptualization, J.W.; methodology, J.W.; software, Q.M.; validation, J.W., Q.M., and H.M.; formal analysis, J.W.; investigation, Q.M.; resources, J.G.; data curation, T.L. All authors have read and agreed to the published version of the manuscript.

Funding

This work was jointly supported by the Foundation of the China Meteorological Administration Aerosol-Cloud and Precipitation Key Laboratory (Grant No. KDW2405), the Foundation of the Key Laboratory for Cloud Physics and Weather Modification of China Meteorological Administration (Grant No. 2017Z01608), and the Foundation of Jiangsu Meteorological Bureau, China (Grant No. KM201803).

Institutional Review Board Statement

Not applicable.

Informed Consent Statement

Not applicable.

Data Availability Statement

The model data used in this research are from China Meteorological Administration Weather Modification Center.

Conflicts of Interest

The authors declare that they have no conflict of interest.

References

  1. Liu, Y.B.; Ding, Q.J.; Shi, Y.Q.; Fang, C.G.; Duan, J.; Lou, X.F.; Li, P.; Huo, Z.Y.; Zhou, Y.B.; Wang, H.L.; et al. Development of a cloud-resolvable weather modification model: Model description, preliminary results and challenges. Adv. Meteorol. Sci. Technol. 2021, 11, 77–85. [Google Scholar]
  2. Hu, Z.J.; Yan, C.F. Numerical simulation of microphysical processed in stratiform clouds (I)—Microphysical model. China J. Acad. Meteorol. Sci. 1986, 1, 37–52. [Google Scholar]
  3. Hu, Z.J.; He, G.F. Numerical simulation of microprocesses in cumulonimbus clouds (I) microphysical model. Acta Meteorol. Sin. 1987, 45, 467–484. [Google Scholar]
  4. Lou, X.F. Development and Implementation of a New Explicit Microphysical Scheme and Comparisons of Original Scheme of MM5; Peking University: Beijing, China, 2002. [Google Scholar]
  5. Lou, X.; Shi, Y.; Sun, J.; Xue, L.; Hu, Z.; Fang, W.; Liu, W. Cloud-resolving model for weather modification in China. Chin. Sci. Bull. 2012, 57, 1055–1061. [Google Scholar] [CrossRef]
  6. Sun, J.; Lou, X.F.; Hu, Z.J.; Shen, X.S. Numerical experiment of the coupling of CAMS complex microphysical scheme and GRAPES model. J. Appl. Meteorol. Sci. 2008, 19, 315–325. [Google Scholar]
  7. Liu, W.G.; Tao, Y.; Dang, J.; Zhou, Y.Q. Seeding modeling study of two precipitation processes over northern China in the spring of 2014. Chin. J. Atmos. Sci. 2016, 40, 669–688. [Google Scholar]
  8. Ma, Z.S.; Liu, Q.J.; Qin, Y.Y.; Kang, Z.M.; Yan, H. Verification of forecasting efficiency to cloud microphysical characters of mesoscale numerical model for artificial rainfall enhancement by using TRMM satellite data. Acta Meteorol. Sin. 2009, 67, 260–271. [Google Scholar]
  9. Hu, Z. Simulations of mesoscale and microphysical characteristics of cold front clouds in South China. Chin. J. Atmos. Sci. 2008, 32, 1019–1036. [Google Scholar]
  10. Sun, J.; Shi, Y.Q.; Cai, M.; Zhou, Y.Q.; Tang, L. Analysis on cloud structure forecast and seeding conditions of 3 types of cloud system in South China. Meteorology 2015, 41, 1356–1366. [Google Scholar]
  11. Li, D.; Ding, Y.W.; Wei, L.; Li, W.; Tang, L.; Li, Q.; Wang, L. Forecast verification of different weather types in summer and autumn for weather modification model in Hunan Province. J. Meteorol. Res. Appl. 2020, 41, 50–54. [Google Scholar]
  12. Lou, X.F.; Shi, Y.Q.; Li, J.M. Development and application of the cloud and seeding models in weather modification. Adv. Meteorol. Sci. Technol. 2016, 6, 75–82. [Google Scholar]
  13. Liu, Y.B.; Warner, T.T.; Bowers, J.F.; Carson, L.P.; Chen, F.; Clough, C.A.; Davis, C.A.; Egeland, C.H.; Halvorson, S.; Huck, T.W., Jr.; et al. The operational mesogammascale analysis and forecast system of the U.S. Army Test and Evaluation Command. Part 1: Overview of the modeling system, the forecast products. J. Appl. Meteorol. Climatol. 2008, 47, 1077–1092. [Google Scholar] [CrossRef]
  14. Pan, L.; Liu, Y.; Liu, Y.; Li, L.; Jiang, Y.; Cheng, W.; Roux, G. Impact of four-dimensional data assimilation (FDDA) on urban climate analysis. J. Adv. Model. Earth Syst. 2011, 7, 1997–2011. [Google Scholar] [CrossRef]
  15. Gao, W. Improved CAMS cloud microphysics scheme and numerical experiment coupled with WRF model. Chin. J. Geophys. 2012, 55, 396–405. [Google Scholar]
  16. Liu, L.J.; Zhang, R.B.; Zou, G.Y.; Zhang, Z.G. Test of cloud model forecasting results of Guangxi weather modification. J. Meteorol. Res. Appl. 2009, 30, 49–51. [Google Scholar]
  17. Mei, Q.; Wang, J.; Zhi, X.; Zhang, H.; Gao, Y.; Yi, C.; Yang, Y. Preliminary application of a multi-physical ensemble transform kalman filter in cloud and precipitation forecasts. Atmosphere 2022, 13, 1359. [Google Scholar] [CrossRef]
  18. Zhang, L.P.; Zhi, X.F.; Wang, J.; Wang, Y.H. Multi-scheme comparative test and ensemble of cloud top height and temperature forecasting. Meteorol. Sci. Technol. 2018, 46, 1136–1146. [Google Scholar]
  19. Bessho, K.; Date, K.; Hayashi, M.; Ikeda, A.; Imai, T.; Inoue, H.; Kumagai, Y.; Miyakawa, T.; Murata, H.; Ohno, T.; et al. An introduction to himawari-8/9 Japans new-generation geostationary meteorological satellites. J. Meteorol. Soc. Jpn. Ser. II 2016, 94, 151–183. [Google Scholar] [CrossRef]
  20. Zhang, P.; Guo, Q.; Chen, B.Y.; Feng, X. The Chinese next-generation geostationary meteorological satellite FY-4 compared with the Japanese Himawari-8/9 satellites. Adv. Meteorol. Sci. Technol. 2016, 6, 72–75. [Google Scholar]
  21. Min, M.; Wu, C.; Li, C.; Liu, H.; Xu, N.; Wu, X.; Chen, L.; Wang, F.; Sun, F.; Qin, D.; et al. Developing the science product algorithm testbed for Chinese next-generation geostationary meteorological satellites: Fengyun-4 series. J. Meteorol. Res. 2017, 31, 708–719. [Google Scholar] [CrossRef]
  22. Wang, Z.; Letu, H.; Shang, H.; Zhao, C.; Li, J.; Ma, R. A supercooled water cloud detection algorithm using Himawari-8 satellite measurements. J. Geophys. Res. Atmos. 2019, 124, 2724–2738. [Google Scholar] [CrossRef]
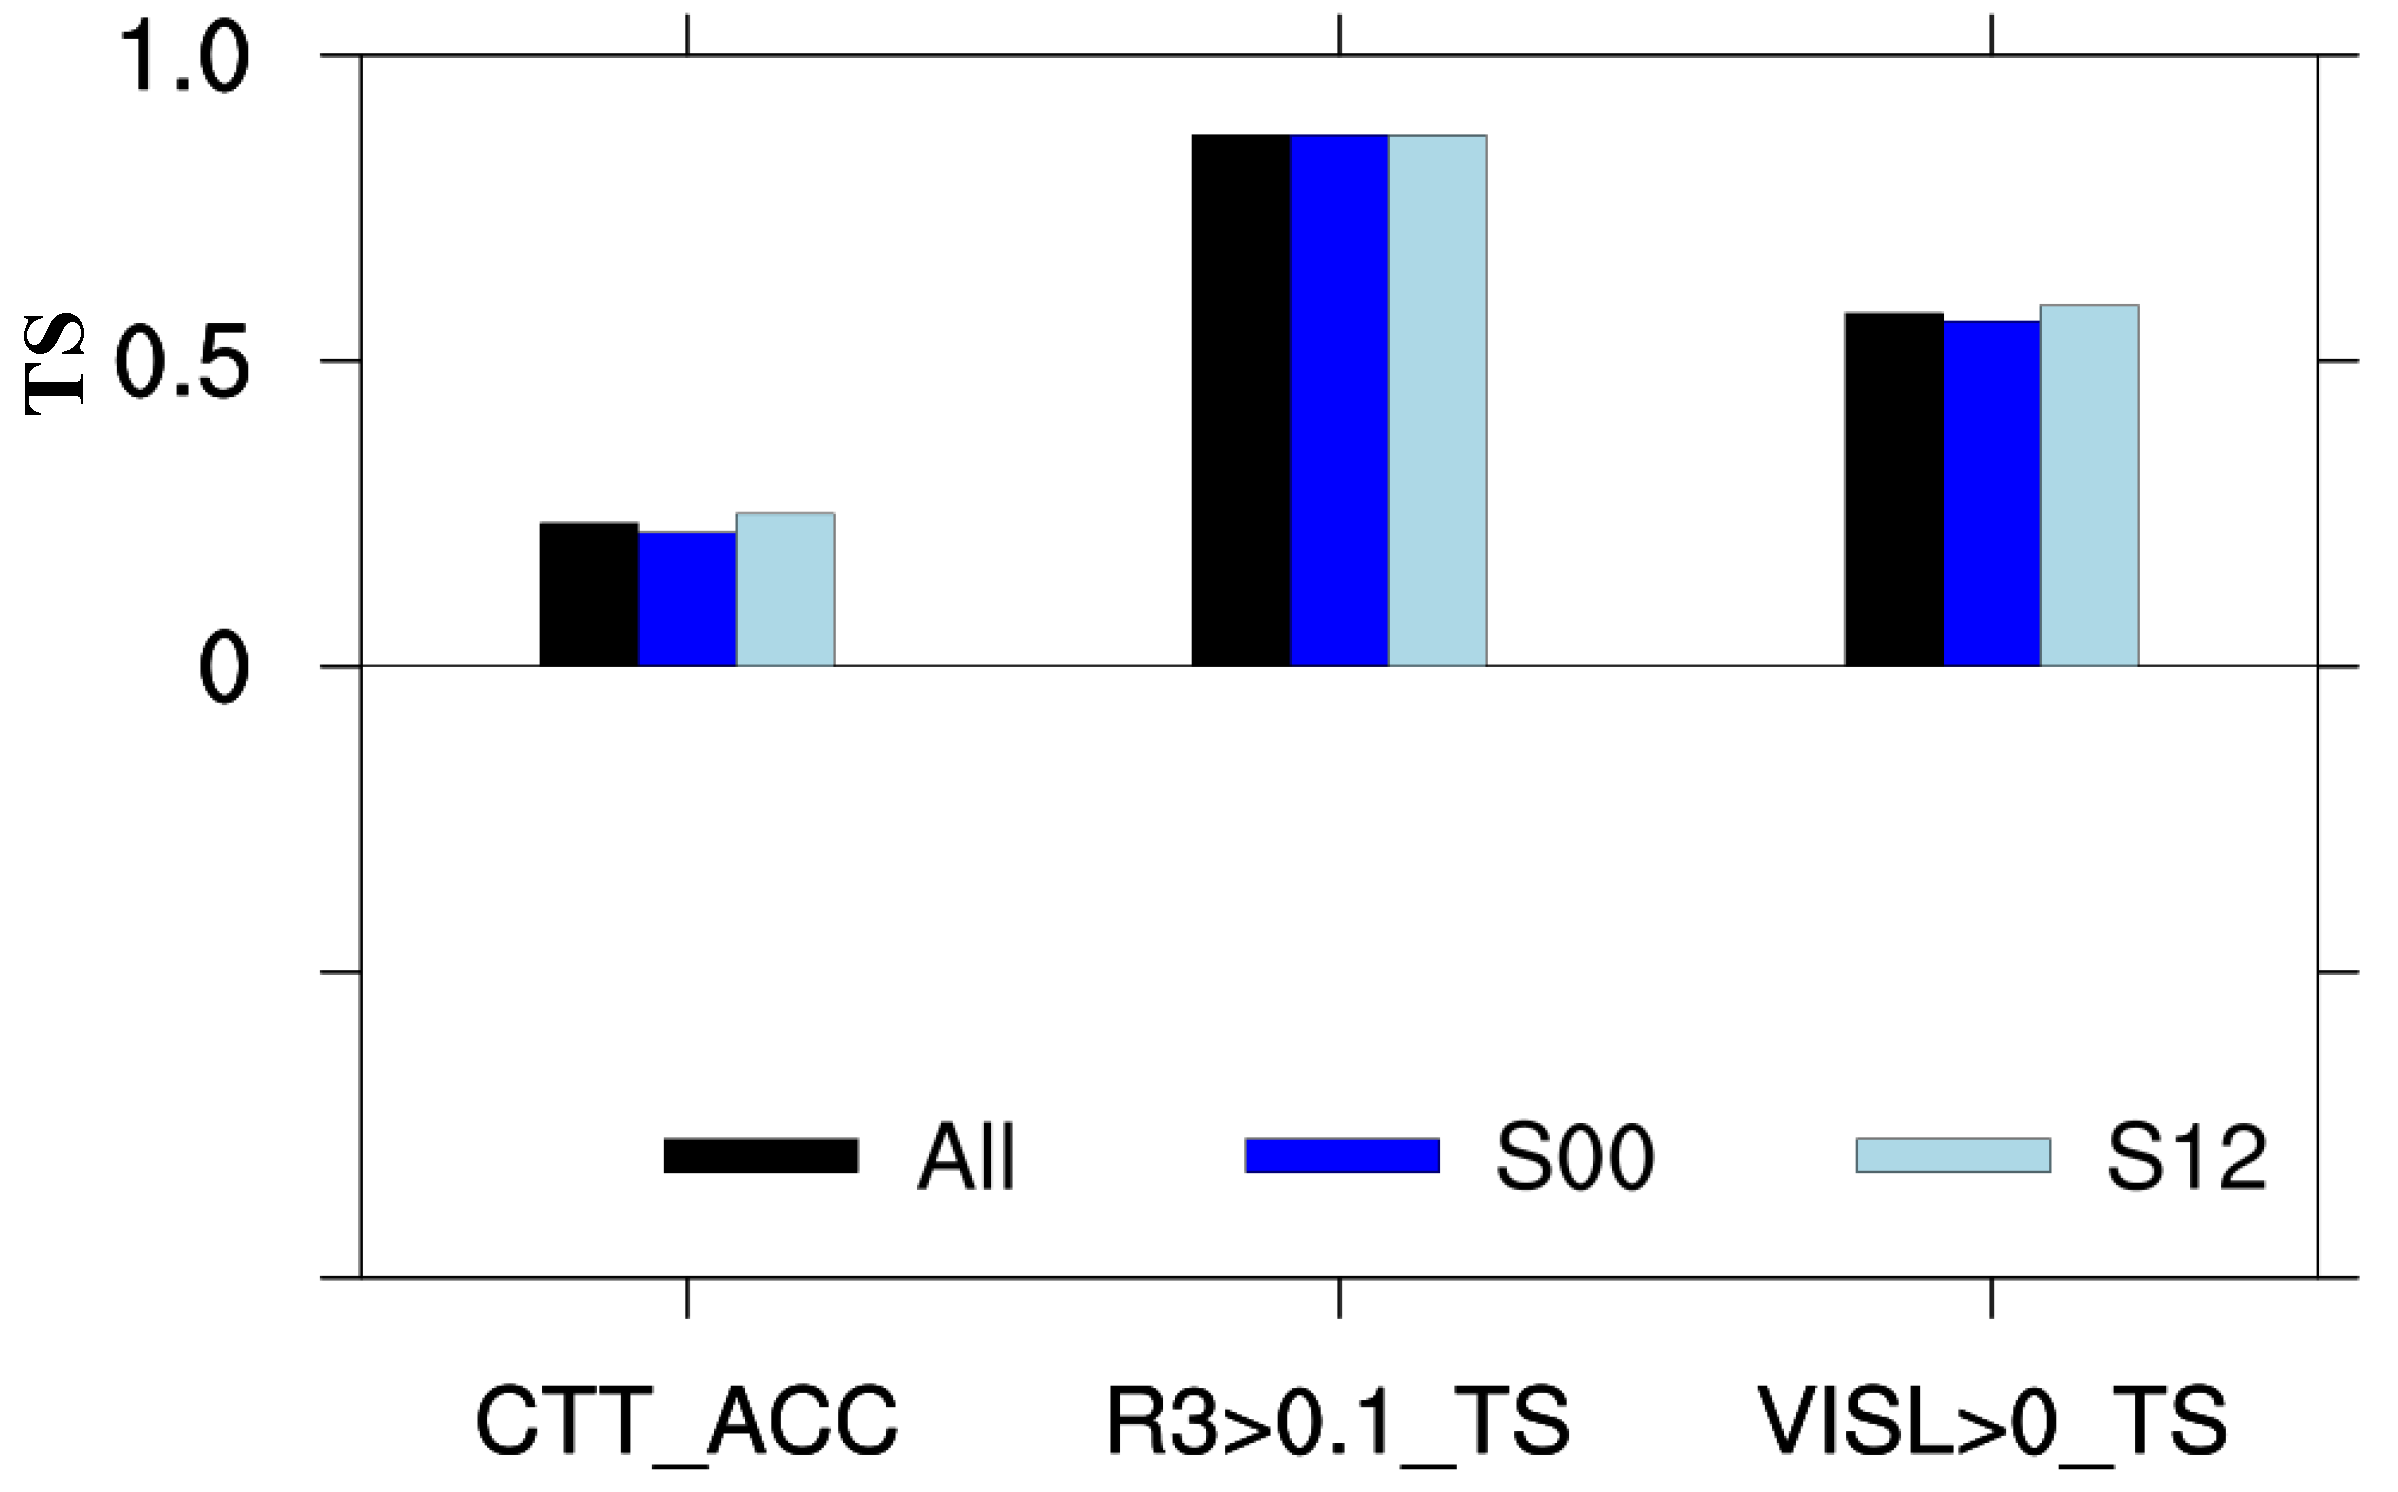
Figure 1. The 48 h average spatial Anomaly Correlation Coefficient of cloud top temperature (CTT_ACC), Threat Score for 3 h precipitation exceeding 0.1 mm, and vertical integrated supercooled liquid water exceeding 0 (R3 > 0.1_TS, VISL > 0_TS) between observations and model forecast results (All represents the average for all 16 cases, while S00 and S12 represent the averages for cases initialized at 00 and 12 UTC, respectively).
Atmosphere 15 00928 g001
Figure 2. Performance diagram summarizing the average Threat Score (TS, labeled solid contours), False Alarm Rate (FAR, X-axis), and Missed Detection Rate (MDR, Y-axis) of supercooled clouds (VISL > 0) in 48 h forecasts for different cases (different shapes, first two digits represent the month and last two digits represent the date of the cases) initialized at 00 (S00, dark blue) and 12 UTC (S12, light blue) over 8 days in the model (ALL is the average of S00 and S12, black).
Atmosphere 15 00928 g002
Figure 3. The scatter plot between the TS of supercooled clouds and spatial Anomaly Correlation Coefficient (ACC) of cloud top temperature (CTT) for 8 cases (0904, 0919, 0921, 0922, 0923, 0934, 1021, and 1021) initialized at 00 and 12 UTC (S00, S12, and All as shown in Figure 2).
Atmosphere 15 00928 g003
Figure 4. Comparison of the 27th-hour forecasts of CTT (K, right) for cases 1021 (top) and 0924 (bottom) initialized at 12 UTC with observations (left).
Atmosphere 15 00928 g004
Figure 5. Comparison of the 30th-hour forecasts (right) of CTT (K, top) and supercooled water (pink areas, bottom) for case 0921 initialized at 12 UTC with observations (left).
Atmosphere 15 00928 g005
Figure 6. Sequence of variations in the spatial ACC of CTT and TS of supercooled clouds with forecast lead-time for cases 0924 (top), 0921 (middle), and 1021 (bottom) initialized at 12 UTC.
Atmosphere 15 00928 g006
Figure 7. Comparison of the 30th-hour forecasts (right) of CTT (K, top) and supercooled water (pink areas, bottom) for case 0904 initialized at 12 UTC with observations (left).
Atmosphere 15 00928 g007
Table 1. Contingency table of binary classification for supercooled clouds forecast.
Observation
Forecast Supercooled cloudsNon-supercooled/Warm clouds
(1)(0)
Supercooled cloudsCorrect forecastsIncorrect forecasts
(1)(NA)(NB)
Non-supercooled/Warm cloudsMissed forecastsCorrect forecasts
(0)(NC)(NA)
Table 2. Rank and comparative (S00 and S12) table of TS, FAR, and MDR of supercooled clouds (VISL > 0) for 8 days according to Figure 2.
09040919092109220923092410121021
Rank of TS15873462
Better (S00 and S12)similarsimilarsimilarS12S12S12S12S12
Rank of FAR13874562
Better (S00 and S12)similarsimilarsimilarS12S12S12S12S12
Rank of MDR48671235
Better (S00 and S12)S12similarsimilarS12similarS00S12similar
Table 3. Rank and comparative (S00 and S12) table of the TS for supercooled clouds (VISL > 0) and ACC for CTT distribution for 8 days according to Figure 3.
09040919092109220923092410121021
Rank of TS for supercool clouds15873462
Better (S00 and S12)similarsimilarsimilarS12S12S12S12S12
Rank of ACC for CTT distribution62743851
Better (S00 and S12)S12S00similarS12S00similarS12S12
Disclaimer/Publisher’s Note: The statements, opinions and data contained in all publications are solely those of the individual author(s) and contributor(s) and not of MDPI and/or the editor(s). MDPI and/or the editor(s) disclaim responsibility for any injury to people or property resulting from any ideas, methods, instructions or products referred to in the content.