Article

Raindrop Size Distribution Characteristics for Typhoons over the Coast in Eastern China

1
Ningbo Meteorological Observatory Academician Workstation, Ningbo Meteorological Bureau, Ningbo 315012, China
2
Key Laboratory of Remote Sensing of Gansu Province, Heihe Remote Sensing Experimental Research Station, Northwest Institute of Eco-Environment and Resources, Chinese Academy of Sciences, Lanzhou 730000, China
3
Southern Laboratory of Ocean Science and Engineering, Zhuhai 519000, China
4
School of Geography and Tourism, Jiaying University, Meizhou 514015, China
5
Meteorological Observation Center, China Meteorological Administration, Beijing 100081, China
*
Author to whom correspondence should be addressed.
Atmosphere 2024, 15(8), 951; https://doi.org/10.3390/atmos15080951
Submission received: 22 May 2024 / Revised: 5 August 2024 / Accepted: 7 August 2024 / Published: 9 August 2024
(This article belongs to the Special Issue Tropical Cyclones: Observations and Prediction)

Abstract

:
This study investigates the characteristics of the raindrop size distribution (DSD) for five typhoons that made landfall or passed by Zhejiang on the eastern coast of China, from 2019 to 2022. Additionally, it examines the raindrop shape–slope (µ-Λ) relationship, as well as the local Z-R relationship for these typhoons. The DSD datasets were collected by the DSG1 disdrometer located in Ningbo, Zhejiang Province. Based on rainfall rate (R), the DSD can be categorized into convective and stratiform rainfall types. Some rainfall parameters can also be derived from the DSDs to further analyze the specific characteristics of rainfall. The histograms of the generalized intercept parameter (log10Nw) exhibit negative skewness in both convective and stratiform rainfall, whereas the histograms of the mass-weighted mean diameter (Dm) of raindrops display positive skewness. During typhoon periods on the eastern coast of China, the DSD characteristic was composed of a lower number concentration of small and midsize raindrops (3.42 for log10Nw, 1.43 mm for Dm in the whole dataset) as compared to Jiangsu in eastern China, Tokyo, in Japan, Miryang, in South Korea, and Thiruvananthapuram in south India, respectively. At the same time, the scatter plots of Dm and log10Nw indicate that the convective rain during typhoon periods exhibits characteristics that are intermediate between “maritime-like” and “continental-like” clusters. Additionally, the raindrop spectra of convective rainfall and midsize raindrops in stratiform rainfall are well-represented by a three-parameter gamma distribution. The µ-Λ relation in this region is similar to Taiwan and Fujian, located along the southeastern coast of China. The Z-R relationship for eastern coastal China during typhoons based on filtered disdrometer data is Z = 175.04R1.53. These results could offer deeper insights into the microphysical characteristics of different rainfall types along the eastern coast of China and potentially improve the accuracy of precipitation estimates from weather radar observations.

1. Introduction

China is ranked as one of the countries most significantly impacted by typhoons. The associated intense rainfall each year leads to a high number of natural disasters [1,2]. Exploring the characteristics and underlying physical mechanisms of typhoon-induced heavy rainfall is crucial for enhancing efforts in meteorological disaster prevention and mitigation [3,4]. The study of typhoon-induced heavy rainfall has been analyzed by numerous meteorologists who obtained valuable findings through synoptic diagnostic analysis, numerical simulations, and various approaches [5,6,7]. Current predictions of typhoons are significantly reliant on how numerical weather prediction (NWP) models depict microphysical processes, which remain subject to considerable uncertainties [7]. Therefore, it is imperative to know more about these microphysical processes. Acquiring a comprehensive understanding of these microphysical characteristics is key to enhance the precipitation parameterization schemes in numerical models [8,9,10,11]. The microphysical properties of various rain types (e.g., convective, stratiform, mixed, and light rainfall) within typhoon-induced rainfall exhibit unique characteristics [12,13,14]. The raindrop size distribution (DSD) is also pivotal in studying the microphysical structural characteristics of clouds [15,16,17,18]. By examining the concentration of raindrops per unit volume as a function of scale, rainfall integral parameters and the dual polarimetric radar variables can be calculated [3,16,19,20], which has significant implications for improving typhoon forecast and weather radar quantitative precipitation estimation (QPE). The precision of QPE hinges on the accuracy of the power-law Z-R relationship, denoted as Z = ARb. Here, Z denotes the abstract radar reflectivity factor measured by single-polarization and dual-polarization radars, with R indicating the rainfall rate [21,22,23]. An accurate radar precipitation relationship can improve the precision of regional radar QPE and NWP.
The characteristics of ground-measured raindrop spectra are regularly influenced by factors such as regional climate, topography, and rainfall types [24,25,26,27]. Feng et al. [27] examined the DSDs of Typhoon Mangkhut during its landfall in southern China, discovering that its DSDs significantly varied from those observed in various Chinese regions and even from typhoons within the same region. Bao et al. [12] demonstrated that the characteristics of typhoon DSDs vary significantly with increasing rainfall rates across different convective rainbands. Their findings further suggest that the variations in DSD parameters could be affected by the considerable amount of water vapor transported from the ocean by the typhoon, coupled with the typhoon’s strong winds. Bringi et al. [24] conducted extensive research on the characteristics of DSDs across various global climatic regions using disdrometers and polarimetric radars. Their studies indicate that compared to continental convective rainfall, maritime convective rainfall contains a higher concentration of smaller-sized raindrops; they delineated convective rainfall into two distinct types: “maritime-like” and “continental-like” clusters. Chang et al. [23] studied the DSDs of typhoons landing in northern Taiwan and proposed that the interaction of these typhoons with the complex terrain of Taiwan causes convective rainfall to exhibit characteristics intermediate between “maritime-like” and “continental-like” clusters. However, the DSD characteristics during the landfall of seven typhoons in continental China (Guangdong and Jiangsu Provinces) tend to resemble those of a “maritime-like” cluster [13]. This is due to the smaller mean mass-weighted diameter (Dm) in the convective rainfalls compared to those observed in southeastern China [23,28] and the United States [4]. The Dm in northern Taiwan is slightly larger, attributed to the lifting effect of the Central Mountain Range [23].
Current research points to a trend of typhoon paths moving northward due to global warming [27,29]. Zhejiang province is located in east China, to the north of Taiwan, Guangdong, and Fujian. This suggests that Zhejiang is likely to witness a rise in the occurrence of typhoons making landfall. Despite extensive research about DSDs of typhoons in southern and southeastern China [13,21,22,23], there is a notable gap in studies focusing on the microphysical characteristics of rainfall in the Zhejiang coastal region, part of China’s eastern seaboard. It is not only located at a critical juncture connecting Southern and Northern China but also encompasses the most complex terrain within the Yangtze River Delta. This further drives us to investigate the characteristics of typhoon raindrop spectra along the eastern coast of China. The purpose of this study is to investigate the DSD of five typhoons that affected Zhejiang and its surrounding areas from 2019 to 2022. These typhoons include “Lekima” in 2019, “Hagubit” in 2020, “In-Fa” and “Chanthu” in 2021, and “Muifa” in 2022. In this study, we concentrate on analyzing the DSD characteristics, raindrop shape–slope relationship, and local Z-R relationship for the five typhoons along China’s eastern coast. This research may contribute to enhancing the predictive accuracy of regional models for typhoon precipitation and improve the precision of local radar QPE.
Following this introduction, Section 2 provides a concise overview of the datasets and methods used in this study. Section 3 examines the DSD characteristics of various typhoons, presenting detailed statistical analyses of DSDs across various rain types and contrasting their distinct characteristics. Finally, Section 4 summarizes the findings and draws conclusions based on observations.

2. Materials and Methods

2.1. Instruments and Datasets

Figure 1 illustrates that the eastern coast of China was impacted by the five typhoons from 2019 to 2022. The data for these typhoons were sourced from the Tropical Cyclone Data Center of the China Meteorological Administration (https://tcdata.typhoon.org.cn/zjljsjj.html, accessed on 21 May 2024). The DSD data, collected by an DSG1 disdrometer and processed by the Jiangsu Institute of Electronics and Information Technology Corporation of China, are used to reveal microphysical properties during the five typhoons. The DSG1 disdrometer is situated at the Ningbo Meteorological Observatory in Zhejiang Province, roughly a 10 m distance from the rain gauge. The disdrometer operates on a principle similar to the OTT PARSIVEL disdrometer, with both utilizing the attenuation of laser light by raindrops. This enables precise measurements of particle diameter, velocity, and rain rate at one-minute intervals [29,30,31]. Several studies have utilized the DSG1 to analyze DSD characteristics [29,30,31].
The DSG1 has a sampling area of 54 cm2, with a sampling interval of 1 min [32]. It includes 32 size channels (median diameter spans from 0.062 to 24.5 mm) and 32 velocity channels (median velocity spans from 0.05 to 20.8 m s−1). Since raindrops are generally non-spherical during their descent, it is necessary to correct the raindrop spectrum data for shape distortion to reduce errors [33,34,35]. According to the research results of Battaglia et al. [36], the shape distortion is considered negligible and the drops are assumed to be spherical with diameters below 1 mm. The raindrops are oblate ellipsoidal with an aspect ratio (ar, the ratio of particle height to width) ranging from 1 to 0.7 when the diameter is between 1 and 5 mm, that is, ar = 1.075 − 0.075D, where D is the raindrop diameter. Moreover, they are considered oblate ellipsoidal particles with an aspect ratio of 0.7 (ar = 0.7) when they have a diameter greater than 5 mm.

2.2. Methods

The accuracy of the disdrometer detection can be compromised by various factors, including sampling and noise effects, such as raindrop splashes and strong winds [37,38]. These instrument issues could lead to the misidentification of unrealistically large slow-falling raindrops and small fast-falling raindrops [16,39]. In this study, the following data quality control procedures were executed. (1) Since the signal-to-noise ratio is very low for the first two diameter bins in the disdrometer and raindrops larger than 8 mm are almost non-existent in natural rainfall, we remove data from the first two diameter bins with low signal-to-noise ratios (0.062 and 0.187 mm), as well as the sizes greater than 8 mm [3]. The final effective range of raindrop diameters is from 0.25 to 8.0 mm. (2) According to the Atlas et al. (1973), the relationship between the terminal velocity (V) of falling raindrops and diameter is V = 9.65 − 10.3exp(−0.6D) in the ideal conditions. However, the disdrometer tends to produce velocity errors when winds are stronger than 10 m s−1. Therefore, it is necessary to exclude disdrometer data that deviate from the theoretical terminal velocity of raindrops by more than ±60% [3,13,30]. (3) Remove the noise data from the disdrometer that raindrop numbers are lower than 10 or R is less than 0.1 mm h−1 within one minute. Moreover, precipitation events exceeding 10 min are deemed valid and shorter ones are excluded [21,22]. Finally, this study utilized 9218 one-minute DSD samples from the five typhoons. The rainfall can be categorized as stratiform and convective, according to the characteristics of R and its temporal variation from the previous studies [3,21,22]. It is of significant importance to investigate the characteristics and distinctions between these two rainfall types. According to the classification methodology outlined by Tokay et al. [40] and Chen et al. [3], stratiform rainfall is characterized by the R lies between 0.5 to 5 mm h−1 from ti to ti + N and its standard deviation of R is less than 1.5 mm h−1. Comparatively, convective rainfall is defined as when R exceeds 5 mm h−1 and the standard deviation of R is over 1.5 mm h−1. The other remaining data are categorized as mixed rainfall, which is not the primary focus of this study. The N is set to be ten samples in this study. Consequently, the dataset contains approximately 736 one-minute samples (7.98%) categorized as convective and 3363 one-minute samples (36.48%) classified as stratiform, respectively. Interestingly, during the five typhoon-induced precipitation events, 80.39% of the rainfall samples had an R below 5 mm h−1, while 11.04% had an R between 5 and 10 mm h−1.
The raindrop number concentration in the ith size class, denoted as N(Di), and can be mathematically represented as follows:
N ( D i ) = j = i 32 n i j A × Δ t × V j × Δ D i
where N(Di) (mm−1 m−3) is the number concentration of raindrops per unit volume per unit size interval for raindrop diameter Di (mm); nij is the total number of drops recorded at the ith size class and the jth velocity class; Δt is the sampling time (60 s); A(m2) is the sampling area; and Vj (m s−1) is the falling velocity at the jth velocity class. Based on V(D), N(Di), and the density of water (ρw, considered to be 1.0 g cm−3), various parameters can be calculated, such as the total concentration of raindrops (NT, m−3), R (mm h−1), liquid water content (W, g m−3), and radar reflectivity factor (Z, mm6 m−3), which are defined as follows:
N T = D min D max N ( D ) d D
R = 6 π 10 4 D min D max D 3 N ( D ) V ( D ) d D
W = π ρ w 6000 D min D max D 3 N ( D ) d D
Z = D min D max D 6 N ( D ) d D
The three-parameter gamma function adeptly characterizes the raindrop spectra [41,42], and is expressed as
N ( D ) = N 0 D μ e Λ D
where N0 represents the intercept parameter, μ denotes the shape parameter, and Λ indicates the slope parameter. The truncated moment method [26,43,44] is selected for calculating the three parameters (N0, μ, and Λ), utilizing the 2nd, 4th, and 6th moments as follows. The nth-order moment can be described as
M n = 0 N ( D ) D n d D = N 0 0 D n + μ e Λ D d D = N 0 Γ ( n + 1 + μ ) Λ n + 1 + μ
η = M 4 2 M 2 M 6
μ = ( 7 11 η ) [ ( 7 11 η ) 2 4 ( η 1 ) ( 30 η 12 ) ] 1 / 2 2 ( η 1 )
Λ = [ ( 4 + μ ) ( 3 + μ ) M 2 M 4 ] 1 / 2
N 0 = M 2 Λ 3 + μ Γ ( 3 + μ )
The Dm (mm), which is pivotal in characterizing the DSD, involves computing the ratio of the 4th moment to the 3rd moment of the DSD. This mathematical expression is presented as follows:
D m = M 4 M 3 = D min D max D 4 N ( D ) d D D min D max D 3 N ( D ) d D
And the generalized intercept parameter (Nw, mm −1 m −3) is computed as
N w = 4 4 π ρ w ( W D m 4 )

3. Results

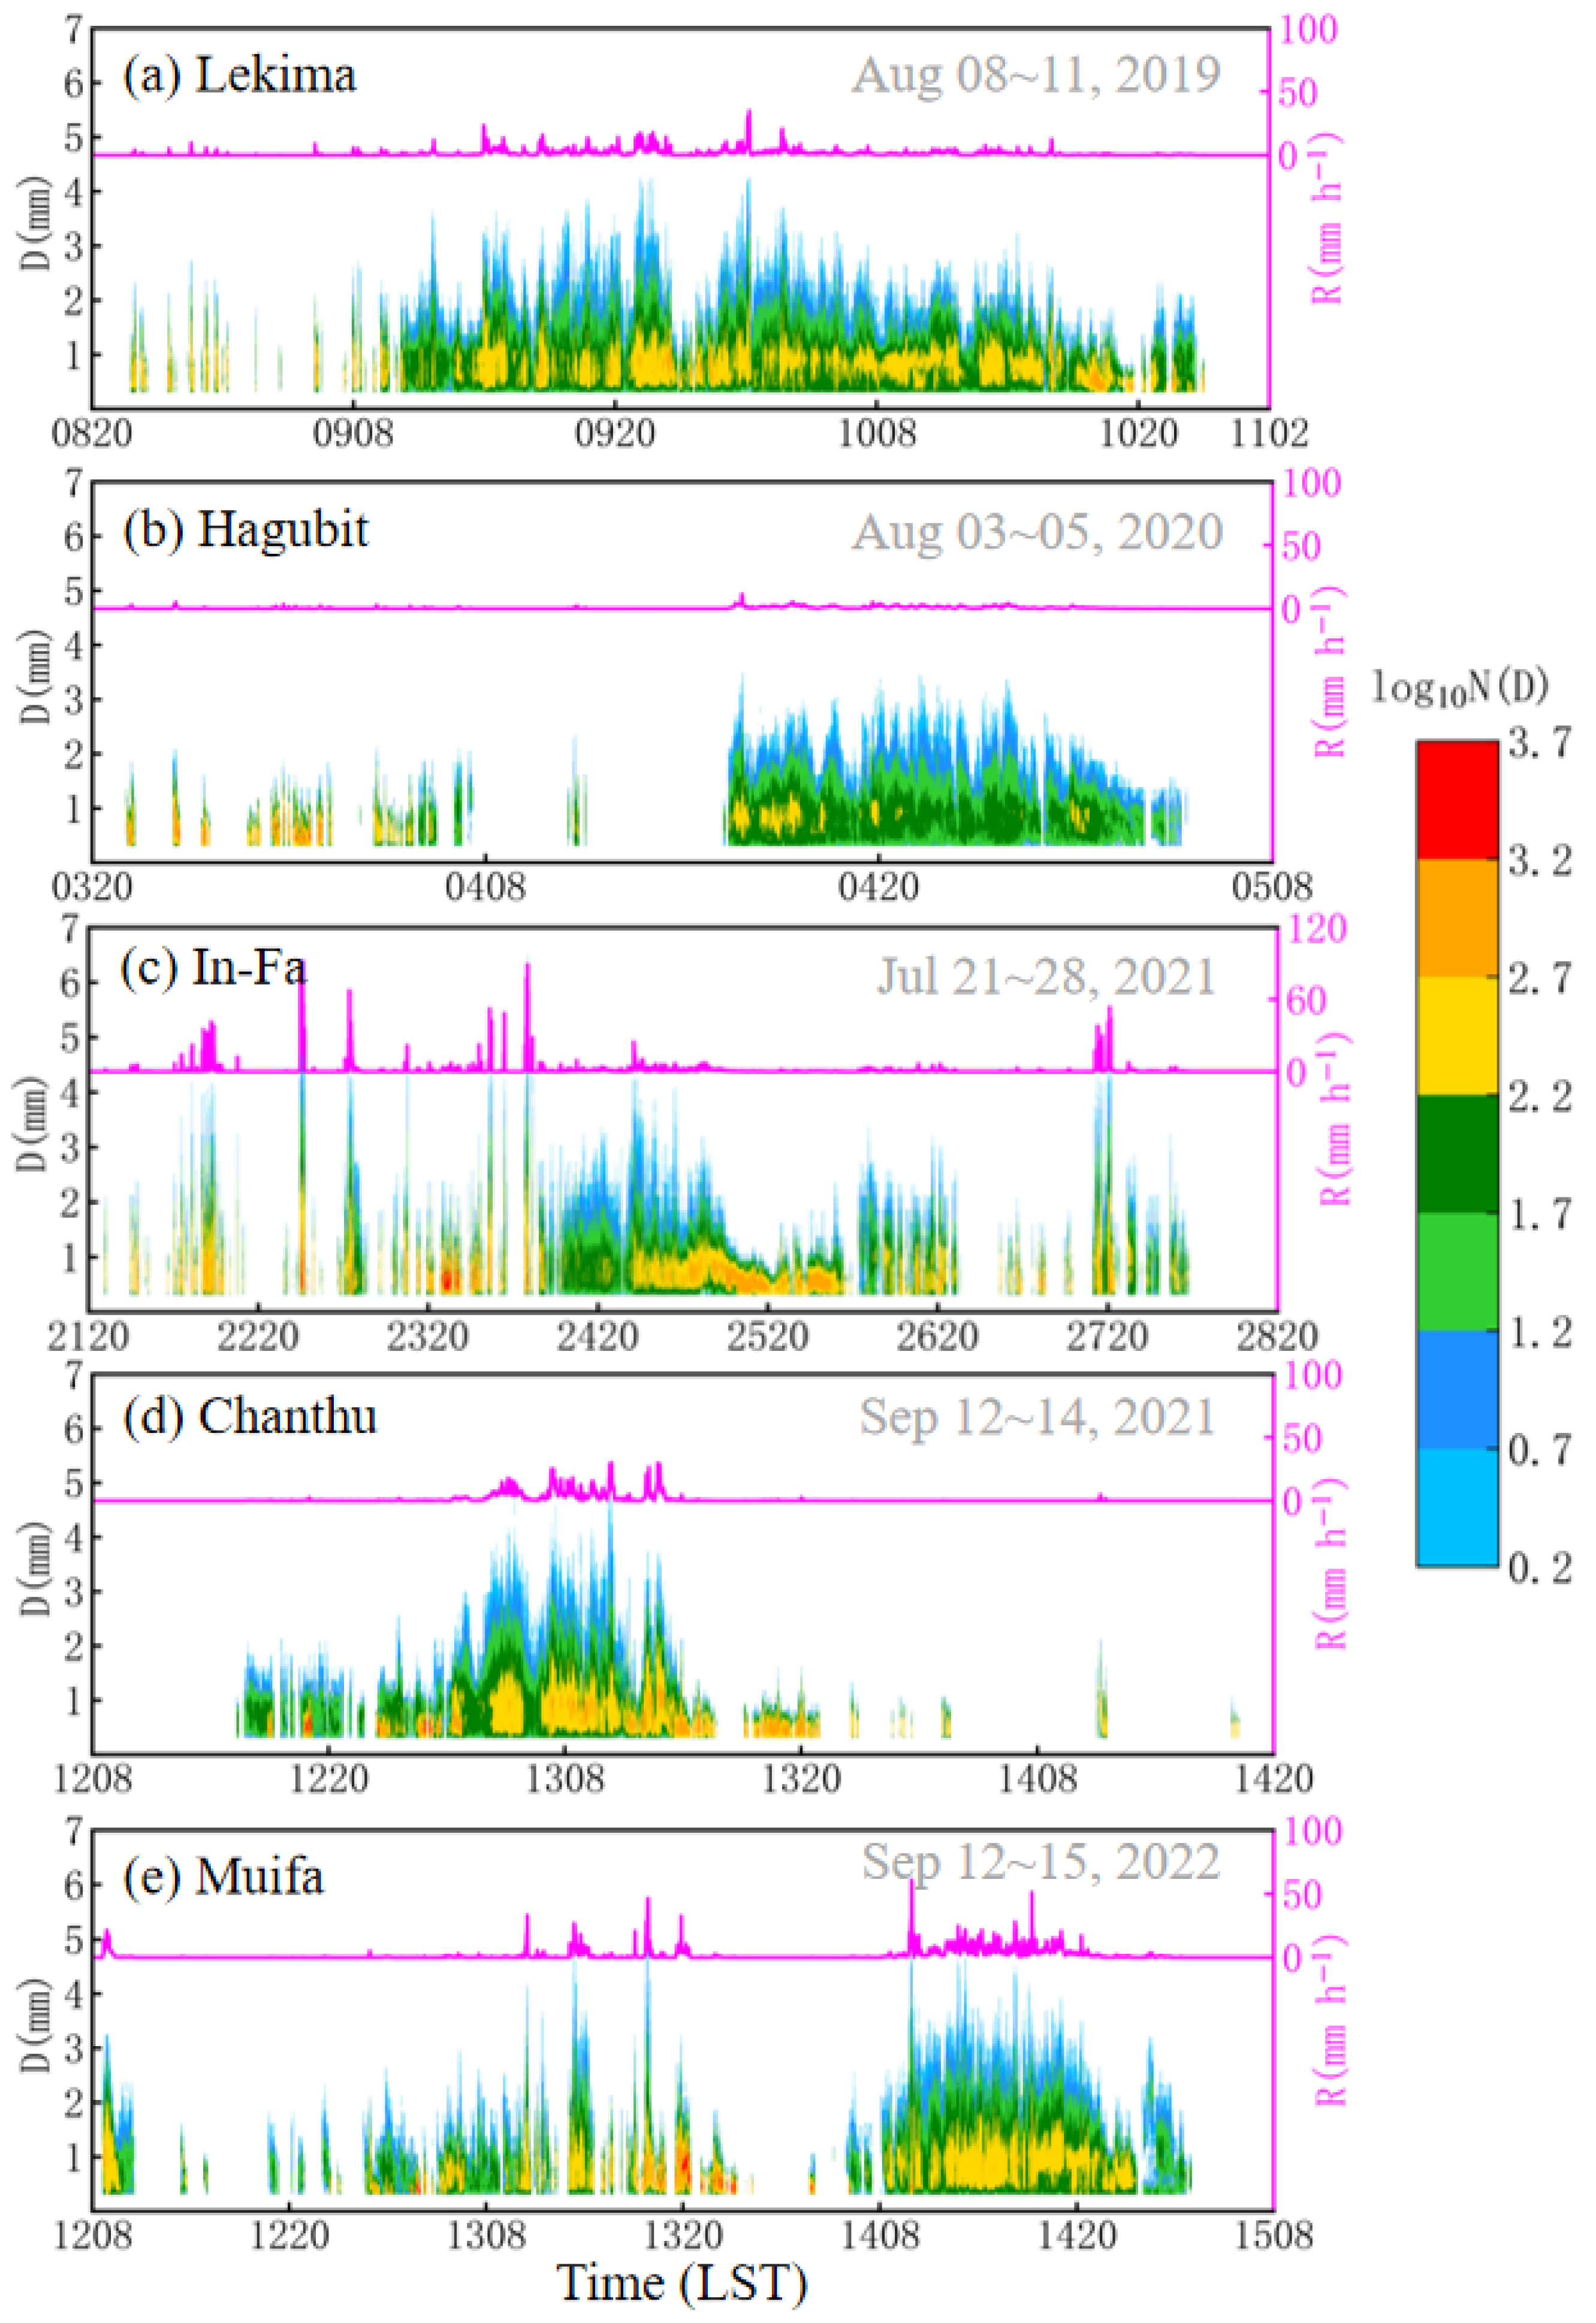
3.1. Overview of Typhoons

Figure 2 illustrates the temporal evolution of the DSD characteristics during the periods affected by five distinct typhoons. The DSG1 disdrometer recorded the raindrop spectrum data for the five typhoons that either made landfall or closely skirted Zhejiang (Figure 1). The specific description of the variations in DSD characteristics across different typhoons are as follows.
It can be seen that before 0800 LST (local standard time) on 9 August 2019, the Ningbo area may have been affected by the spiral rainband of typhoon Lekima and then the main rainband of the typhoon hit the area (Figure 2a). Raindrops can be classified into three categories according to their diameters: small raindrops (0.3~1 mm), medium raindrops (1~3 mm), and large raindrops (more than 3 mm) [4,45]. Most of Lekima’s raindrops are under 3 mm in diameter and the principal rainband features a significantly high concentration of small raindrops, with the number concentration exceeding a logarithmic value of 2.2 (log10N(D)). In contrast, following its rapid decline in strength after making landfall, Typhoon Hagupit demonstrated less variability in its DSDs compared to Typhoon Lekima (Figure 2b). In addition, as illustrated in Figure 2b, it is evident that Typhoon Hagupit had two distinct impact processes on Ningbo. The first segment is characterized by intermittent precipitation with a short-duration high concentration of small drops, while the latter segment involves sustained precipitation with a comparatively lower number concentration. The R is relatively weak in both segments.
Typhoon In-Fa was the one among these five typhoons with the longest duration of rainfall, lasting about 7 days (Figure 2c). Initially, the rainfall intensity was weak with nearly all raindrops under 3 mm in size and a low number concentration. However, with the rapid increase in the concentration of small and midsize raindrops, the precipitation intensity quickly strengthened, resulting in some short-duration heavy rainfall events. The maximum R was 102.0 mm h−1 at 0217 LST on 23 July 2021. During the occurrence of short-duration heavy rainfall, the concentration of small and midsize raindrops reached over logarithmic 2.7 (log10N(D)), accompanied by the emergence of large raindrops exceeding 4 mm in diameter. The maximum drop diameter (7.5 mm) appeared at 0157 LST on 23 July 2021 with a corresponding R of 80.8 mm h−1. Typhoon Chanthu had a shorter duration of impact compared to typhoon In-Fa. Additionally, due to its greater distance from China’s eastern coast (Figure 1a), Typhoon Chanthu had comparatively weaker wind and rain impacts. The short-duration heavy rainfall of Typhoon Chanthu mainly occurred around 1000 LST on 13 September 2021 but its intensity was much weaker than Typhoon In-Fa. The maximum rainfall rate was 30.1 mm/h at 1023 LST on 13 September 2021, with a maximum raindrop diameter of 4.75 mm, both of which are less than those recorded during Typhoon In-Fa. Additionally, the DSD characteristics of Typhoon Chanthu exhibited similarity to those of Typhoon Lekima, with a high concentration of small and midsize raindrops (Figure 2d). However, the impact duration of Chanthu was shorter. Throughout the period affected by Typhoon Chanthu, the majority of the rainfall was recorded on 13 September 2021.
During the period of influence of Typhoon Muifa, two distinct precipitation episodes were recorded on 13 and 14 September 2022, respectively. The Muifa brought only a small amount of rain on 12 September 2022, characterized primarily by sporadic light showers (Figure 2e). Subsequently, the intensity of the rainfall gradually increased, primarily due to a rising concentration of small- and medium-sized raindrops, along with increasing larger droplets. The peak R was about 46.6 mm h−1 at 1753 LST on 13 September 2022. This was due to the high concentration of small- and medium-sized raindrops, accompanied by large raindrops exceeding 5 mm in diameter. Rainfall intensity gradually diminished from the evening of 13 September to the dawn of 14 September 2022. The intensity increased once more on the morning of the 14 September, continuing through to the evening of the same day. Note that a substantial number of small- and medium-sized raindrops reappeared during this period. The peak R on 14 September was recorded at 0957 LST, achieving 60.8 mm h−1.

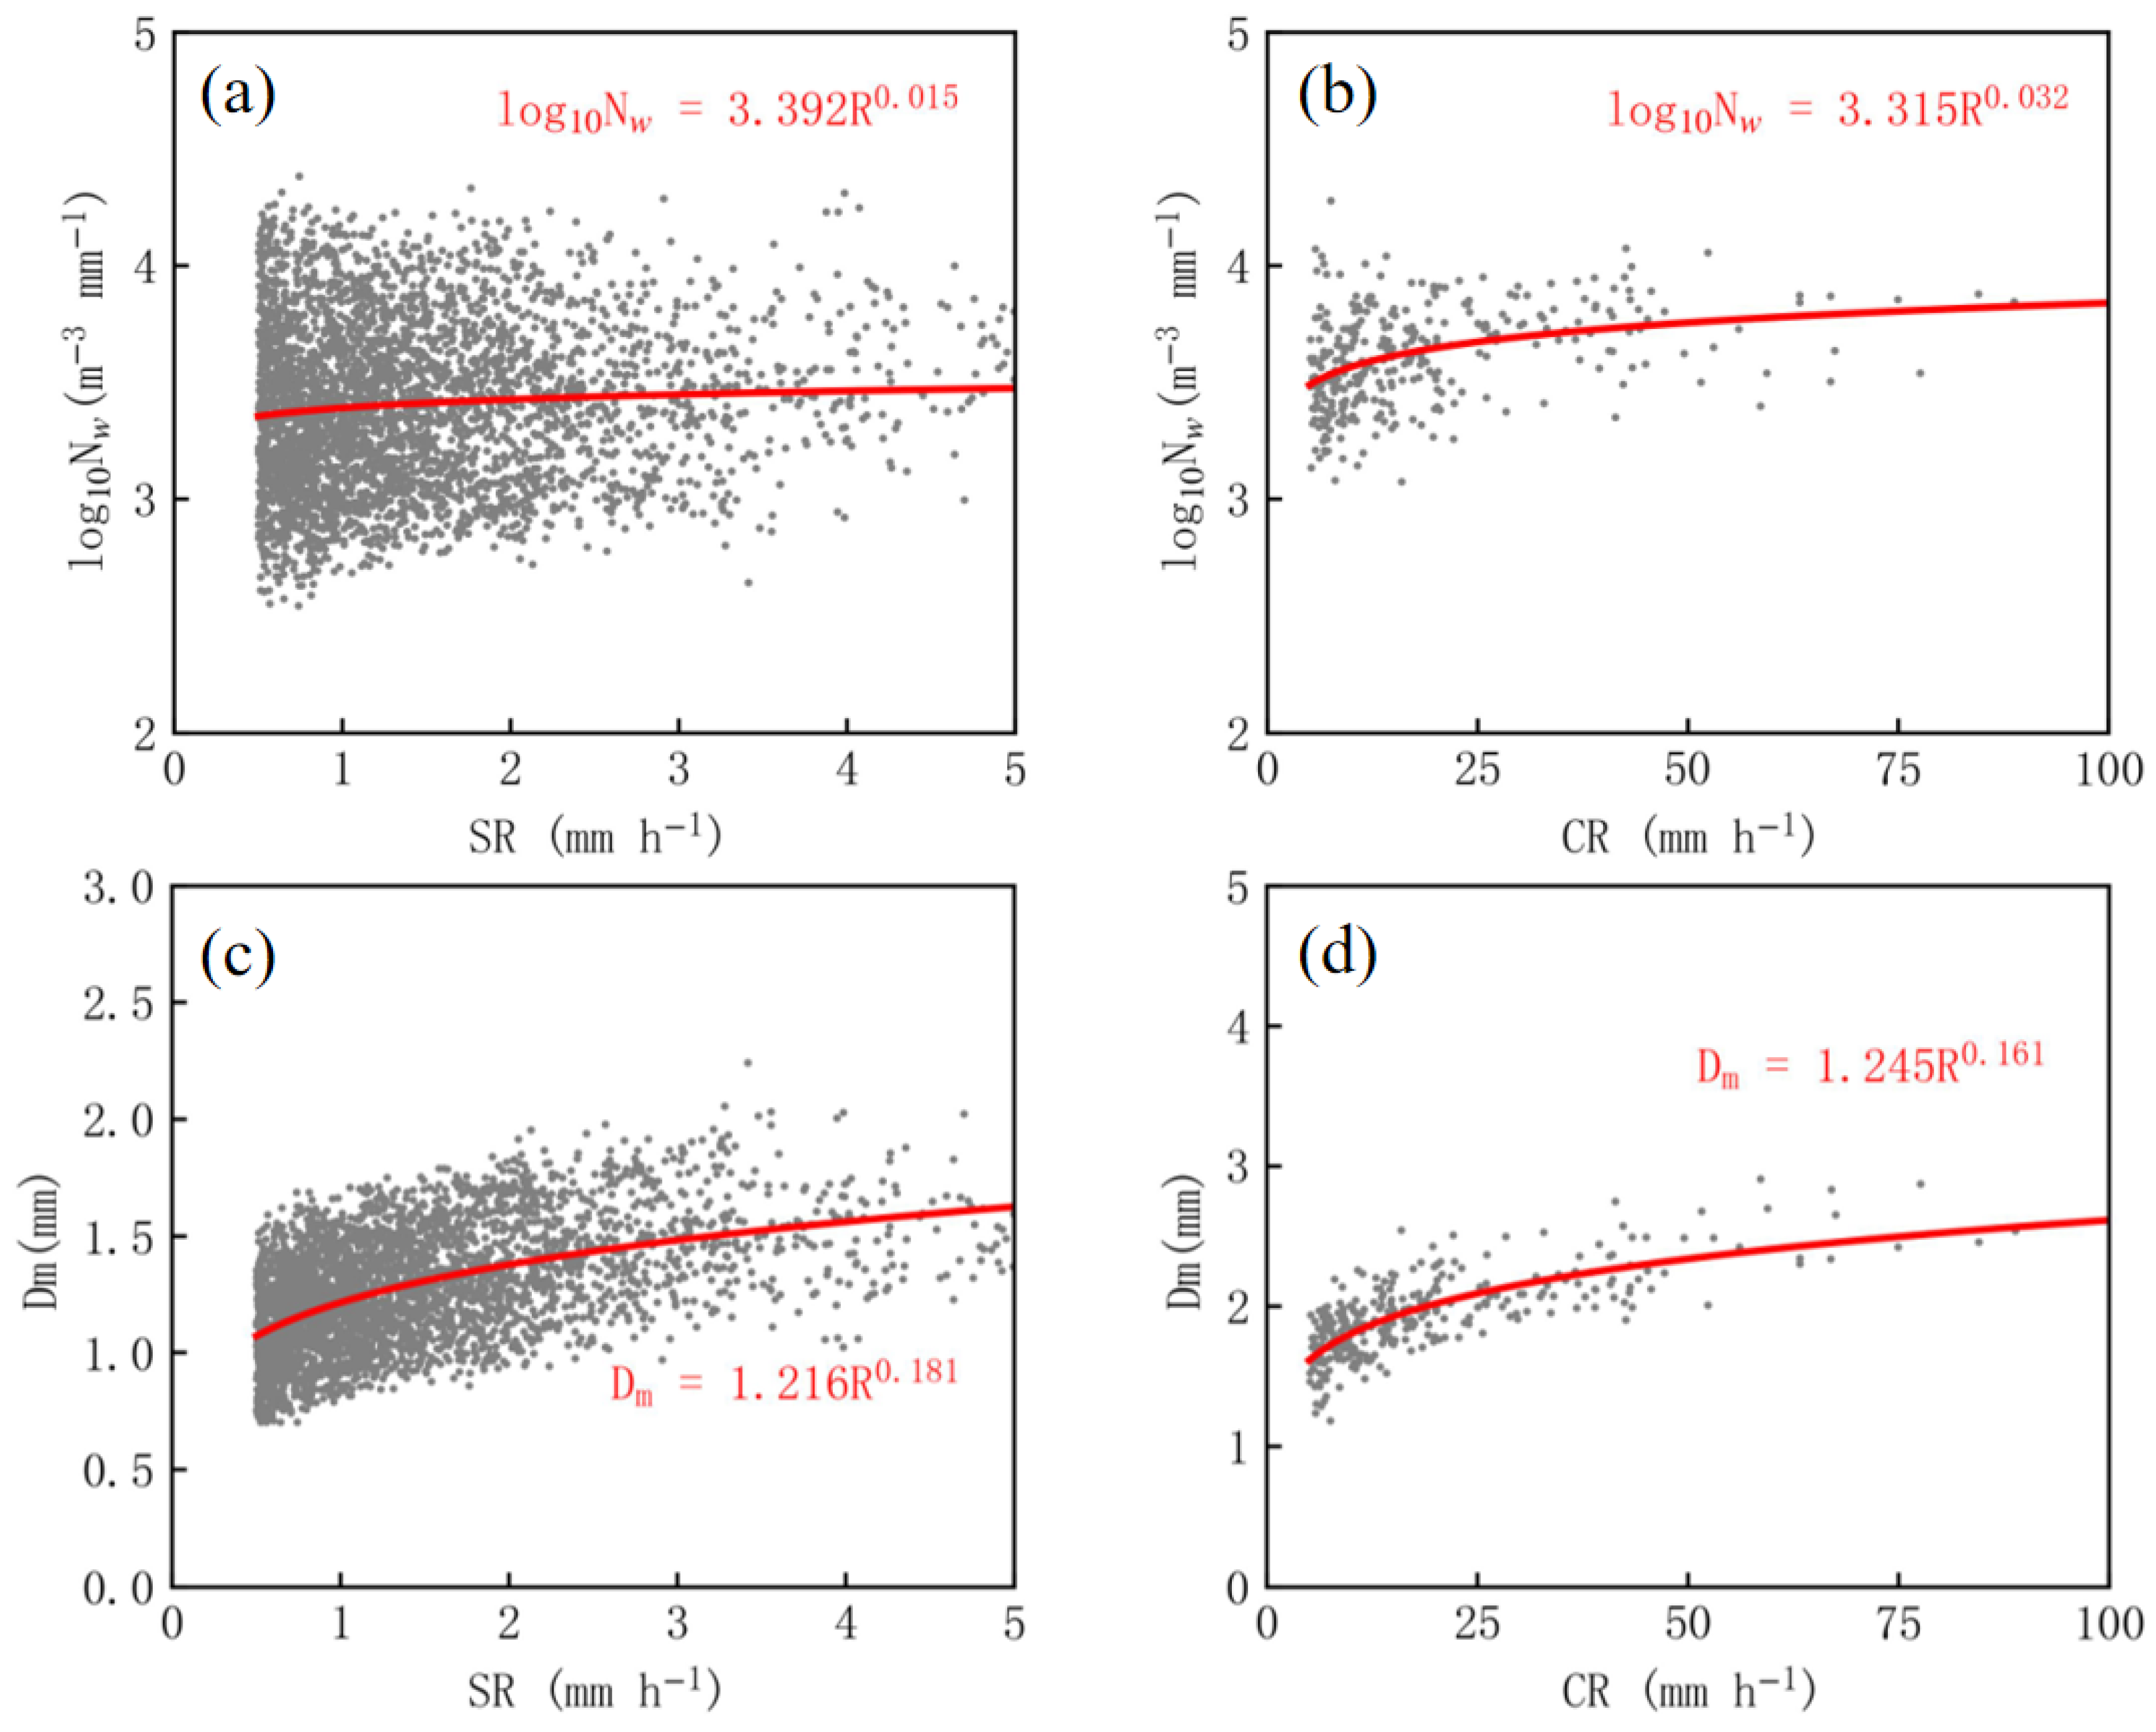
3.2. Distribution of Dm and Nw

Figure 3 presents the frequency histograms of Dm and log10Nw with three commonly used indexes (mean, standard deviation (SD), and skewness (SK)) extracted from both the entire and individual datasets for each type of rain during typhoon periods. The mean values of Dm and log10Nw along the eastern coast of China showcase the largest raindrops (1.43 mm for Dm) and the lowest concentrations (3.42 for log10Nw), in contrast to other regions such as Jiangsu in eastern China (1.41 mm for Dm, 4.67 for log10Nw) [13], Tokyo in Japan (1.25 mm for Dm, 3.74 for log10Nw) [46], Miryang in South Korea (1.19 mm for Dm, 3.44 for log10Nw) [47], and Thiruvananthapuram in southern India (1.21 mm for Dm, 3.66 for log10Nw) [10]. The larger Dm and the lower Nw values may be attributed to the orographic effects of Zhejiang [23]. Moreover, Figure 3a highlights considerable variability in Dm and Nw across the whole dataset, evidenced by their high SD (Dm for 0.42 mm and log10Nw for 0.43, respectively). Considering the two main types, the mean of Dm and log10Nw values for stratiform rainfall are 1.33 mm and 3.33, respectively, which are lower compared to those for convective rainfall (1.99 mm and 3.58, respectively). Additionally, while the Dm for both stratiform and convective rainfall show positive skewness (1.95 and 1.67, respectively), their log10Nw exhibit negative skewness (−0.31 and −0.90, respectively) from Figure 3b,c.
Figure 4 illustrates the distribution of log10Nw-Dm scatter points for convective (orange) and stratiform (sky blue) rainfall during the typhoon periods. Bringi et al. [24] reported that convective rainfall systems characterized as “maritime-like” generally have a Dm of around 1.5–1.75 mm and a logarithmic Nw of approximately 4–4.5. In contrast, “continental-like” systems feature a Dm of 2–2.75 mm and a logarithmic Nw of 3–3.5, as illustrated by the two rectangles in Figure 4. As illustrated in Figure 4, the convective log10Nw-Dm data in this study fall between the “maritime-like” and “continental-like” clusters, with only a portion of the convective log10Nw-Dm data situated within the “continental-like” cluster and a minor fraction observed in the “maritime-like” cluster. The solid circle represents the average of convective log10Nw-Dm taken from this study (Ningbo). Zheng et al. [8] and Feng et al. [27] conducted analyses on typhoon Kajiki (cross symbol) and Mangkhut (solid triangle) convective rainfall in the South China Sea and Guangdong, respectively, finding that the DSD characteristics in these regions lean toward the “maritime-like” cluster. The square boxes denoted the results of the four typhoon convective rainfalls in Jiangsu, eastern China, which were obtained by Wen et al. [13]. They found that the average values of Dm and log10Nw for convective rainfall from the typhoons over Jiangsu (eastern China) were 1.28 mm and 4.55, respectively (solid square). Their results also show that the DSD characteristics of typhoons over eastern China lean toward the “maritime-like” cluster. These results further indicate that the convective precipitation of typhoons contains larger raindrop diameters and lower raindrop concentrations over the eastern coast of China. Chang et al. [23] revealed a slightly larger raindrop diameter (2 mm for Dm) and marginally higher concentration (3.8 for log10Nw) for 13 typhoon convective rainfalls over northern Taiwan (plus sigh) compared to the eastern coast of China. These characteristics may be attributed to the more complex topography of Zhejiang. Note that the classification of convective DSDs as “maritime-like” or “continental-like” clusters depends on the geographical locations and mechanisms of the rainfall system.
The Nw and Dm values offered insights into the characteristics of the DSD and these parameters exhibited a unique relationship with the R [3,9]. As illustrated in Figure 5, scatter distributions of Dm-R and log10Nw-R for the two rainfall types are depicted during the typhoon periods and the corresponding least squares fitted curves. The fitted exponent of both Dm-R and log10Nw-R for convective and stratiform rainfall is positive, indicating that the values of Dm and Nw are positively correlated with the R. The log10Nw-R relationship reveals that the exponent associated with stratiform rainfall is lower than that for convective rainfall, showing that with increasing rainfall intensity, the rate at which raindrop concentration rises is lower for stratiform rainfall compared to convective rainfall. Furthermore, the exponents for log10Nw-R for both rainfall types are lower compared to those for Dm-R. This implies that the increase in rainfall for stratiform rainfall is mainly driven by the size of raindrops, whereas for convective rainfall, it is influenced by both the size and concentration of the raindrops. Nevertheless, the distribution of raindrop sizes narrows with increasing R. The Dm for convective rainfall stabilized at nearly 2.5 mm, while for stratiform rainfall, it leveled off at around 1.8 mm. This indicates that the size of the raindrops reaches an equilibrium state (attained through raindrop breakup and coalescence processes [48]). The further increase in rainfall rates is attributed to the elevated number concentration under the raindrop DSD equilibrium condition [49] and such behaviors were also reported for tropical cyclone rainfall [9,13,23,46,50].

3.3. Composite Raindrop Spectra

To further explore the microphysical processes during typhoon rainfalls, Figure 6 presents the composite raindrop spectra for the convective and stratiform rainfalls. Furthermore, the average rainfall parameters, meticulously detailed in Table 1, are derived from the DSDs recorded during the five typhoons. As noted earlier, we apply the truncated moments to fit the three parameters of the DSDs of the convective and stratiform rainfall using a gamma distribution model. As illustrated in Figure 6, the DSDs for both rain types demonstrate different characteristics. Convective rainfall exhibits a broader spectrum width compared to stratiform rainfall, with maximum raindrop diameters exceeding 5 mm. The peak number concentration of convective rainfall primarily ranges from 0.44 to 1.05 mm. Moreover, the number of concentrations for different diameters in convective rainfall tends to be higher than those in stratiform rainfall. These analyses indicate that compared with stratiform rainfall, convective rainfall has a higher raindrop concentration, liquid water content, and rainfall rate (Table 1). Figure 6 clearly demonstrates that the three-parameter gamma distribution primarily matches the DSD characteristics of convective rainfall and aligns well with the medium diameter (1.0 to 2.3 mm) raindrops of stratiform rainfall, although its fit is less accurate for larger diameters. This study further demonstrates that the mathematically modeled gamma distribution might exhibit some discrepancies with the raindrop spectrum characteristics of stratiform rainfall. Zhang et al. [26] offer a detailed analysis of biases in DSD parameters, which were not accounted for in this study.

3.4. µ-Λ Relationship

Several studies indicate that the Gamma distribution is well-suited for characterizing DSD in different rain types, making it a widely utilized way in microphysical parameterization schemes [19,25,51]. Nevertheless, the shape parameter μ is typically assumed to be a constant [3,26]. The three parameters of the Gamma distribution function, N0, μ, and Λ, are interdependent [5,19,52]. Understanding the relationship among them can enhance the parameterization scheme of the Gamma distribution in eastern coastal China. This is crucial for improving model forecasts and QPE using dual-polarization radar. Drawing on video-disdrometer data from Florida in the summer of 1998, Zhang et al. [26] established an empirical µ-Λ relationship for R greater than 5 mm h−1 and raindrop numbers exceeding 1000. Additionally, Zhang et al. [26] also indicate that the µ-Λ relationship changes depend on climatological conditions, rain types, and geographical location. In recent years, different µ-Λ relationships have been reported at several different climate regimes, including Oklahoma [35], Scotland [53], Taiwan [9,23], Singapore [51], Palau islands [50], central China [31], northern China [20], South China Sea [54], and southern China [21,22]. Therefore, analyzing and determining the µ-Λ relationship for the eastern coast of China is essential. In this study, we utilized the methods outlined by Zhang et al. [26] to fit the DSD data that satisfied the specified criteria. Consequently, the µ-Λ relationship specific to convective rainfall during typhoons in eastern coastal China is as follows and is depicted with a black line in Figure 7.
Λ = 0.023μ2 + 0.541μ + 1.594
Furthermore, upon comparing the μ-Λ relationships during typhoons in Taiwan (red dashed line), Fujian (orange dashed line), and continental China (Jiangsu and Guangdong; blue dashed line), it becomes evident that the μ-Λ relationship from this study closely aligns with those of Taiwan and Fujian, yet significantly diverges from those observed in continental China [13]. Notably, the μ-Λ relationship identified in our research exhibits a considerably higher μ value for a given Λ than those reported in the aforementioned studies. Ulbrich et al. [41] discovered that the relationship between μ and Λ could be expressed as ΛDm = 4 + μ. The three gray lines correspond to Dm values of 1.0 mm, 1.5 mm, and 2.5 mm, respectively (Figure 8). The relationships identified within this study’s region, as well as those in Fujian and Taiwan, all reside within the relatively larger Dm region. Furthermore, Zhejiang is geographically proximate to Fujian and Taiwan, exhibiting comparable complex terrain characteristics. They are all susceptible to direct influence from similar typhoon systems in the western Pacific Ocean. Such factors may contribute to the similarity in microphysical processes during typhoons across these three regions, ultimately resulting in the formation of relatively large raindrop diameters. However, Wen et al. [13] reported that the continental regions of China (Guangdong and Jiangsu) feature higher concentrations of small raindrops during typhoons. This phenomenon could be attributed to the interplay between the vast amounts of water vapor from the ocean and the local anthropogenic aerosols, which might significantly influence the distinctive features of DSDs during typhoons [13]. However, it is important to note that exploring this topic is beyond the scope of the present study and remains a topic for future research. This further illustrates that the typhoon DSD characteristics in the eastern coast of China significantly differ from those in continental China [13]. Therefore, the aforementioned conclusions clearly demonstrate that the µ-Λ relationship varies depending on the specific location.

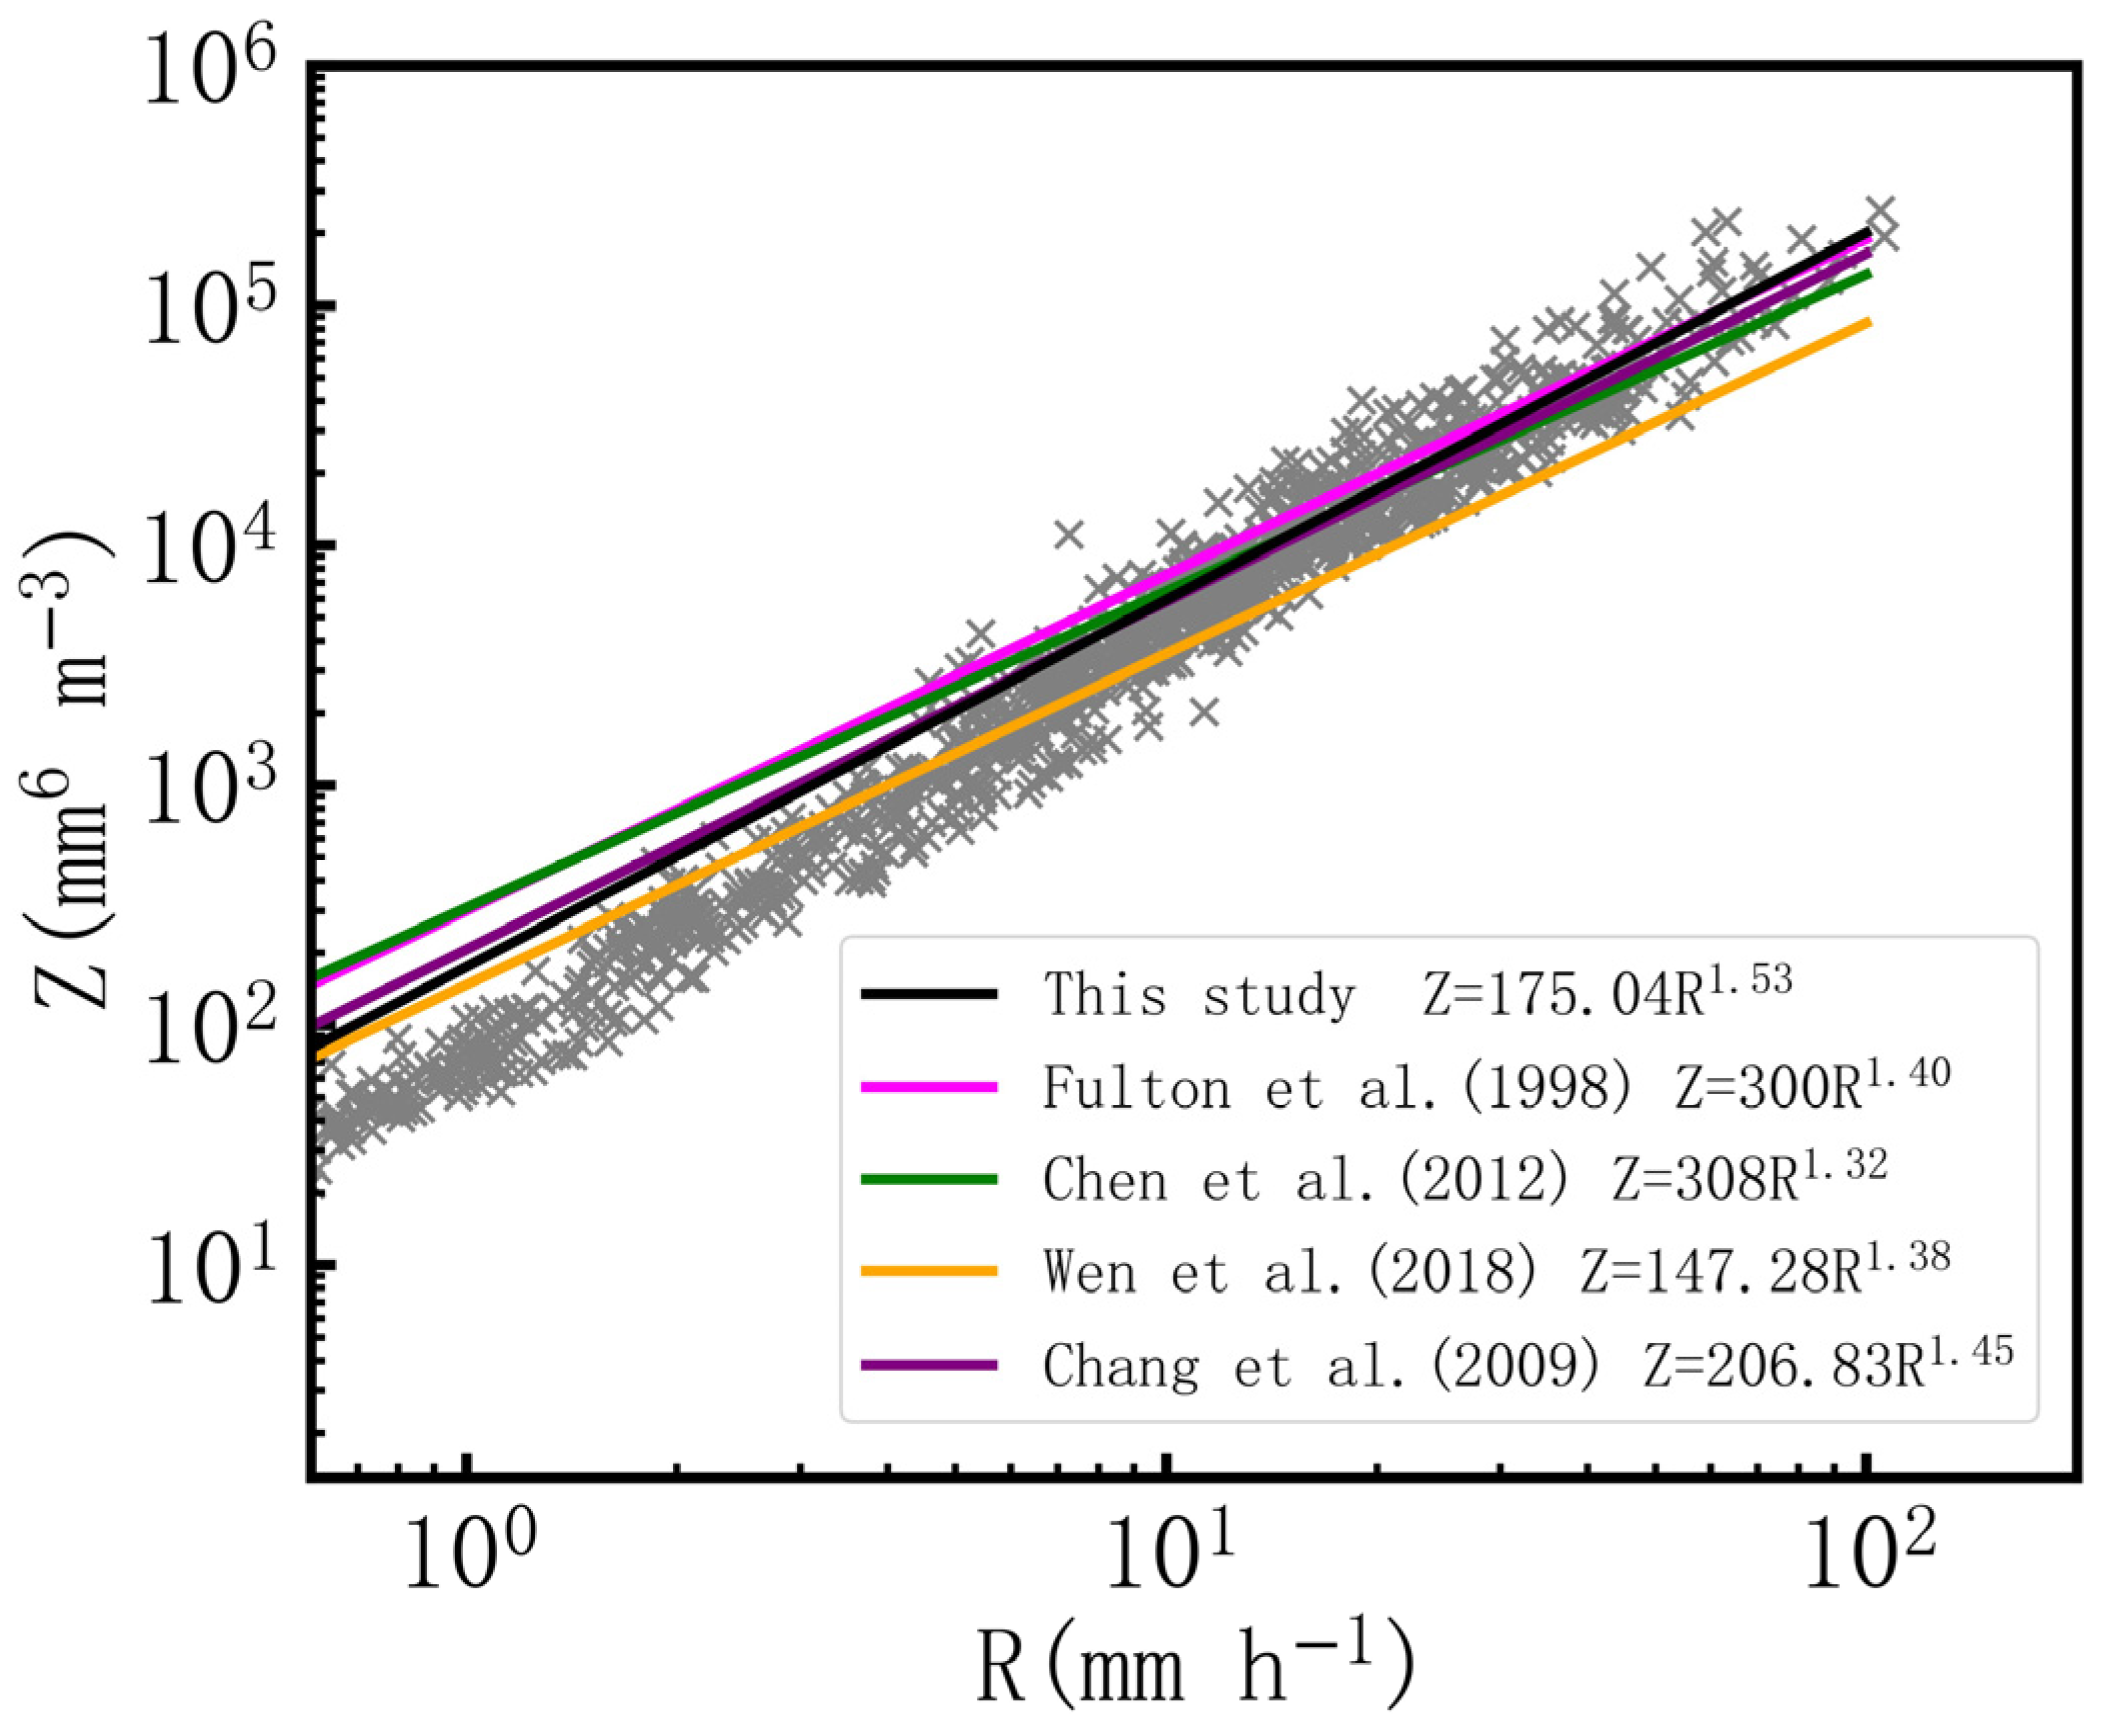
3.5. Z-R Relationship

The Z-R relationship (Z = aRb) serves as the cornerstone for radar QPE. In the classic Z-R relationship for continental rainfall in the mid-latitude regions of the United States, it is expressed as Z = 300R1.40 [55]. Numerous studies have illustrated the multifaceted influence of factors such as atmospheric conditions, climate, rainfall systems, geographical location, and topography on the Z-R relationship [5,10,34,35,50]. Therefore, it is imperative to derive a local Z-R relationship based on the DSD characteristics of eastern coastal China to enhance the precision of local radar QPEs.
Using the least squares method, we fitted the Z and R for whole rainfall derived from raindrop spectrum data, focusing on minute samples containing more than 1000 raindrop numbers. Consequently, we established the radar Z-R relationship for the eastern coastal China as Z = 175.04R1.53. The exponent greater than 1 in the relationship equation may result from the collision and coalescence of raindrops [50,56]. Research indicates that in mid-latitude regions, the Z-R relationship for convective rainfall generally features a larger coefficient A and a smaller exponent b. Conversely, tropical regions tend to have a smaller coefficient A and a larger exponent b. This suggests that typhoon rainfall impacting eastern coastal China may be similar to tropical rainfall. To compare the Z-R relationships with those from other regions, Figure 8 illustrates the Z-R relationships for continental China (Jiangsu and Guangdong, shown with orange line) [13], southeastern coastal China (Fujian, depicted with green line) [28], and Taiwan (illustrated with purple line) [23]. The specific equations are detailed in Table 2. The Z-R fitting curve for eastern coastal China (depicted by the black solid line) closely resembles that of Taiwan and exhibits similarities to Fujian within the 10–30 mm h−1 rainfall intensity (Figure 8). In comparison to the typhoon rainfall in the eastern coastal region, the Z-R relationship for Fujian tends to underestimate rainfall intensities below 10 mm h−1 and overestimate those above 30 mm h−1 for a given Z value. Additionally, the purple line (orange line) rests above (below) the black line, suggesting that the NEXRAD (continental China (Jiangsu and Guangdong)) has a tendency to underestimate (overestimate) typhoon rainfall in eastern coastal China. These findings further reveal that Z-R relationships can differ markedly across various regions, terrains, and climatic regimes.

4. Conclusions and Discussions

This research employs data from a DSG1 disdrometer in Ningbo to examine the characteristics of DSD during the five typhoons in eastern coastal China from 2019 to 2022. It further conducts a comparative analysis of Z-R relationships in various regions affected by typhoons. The key conclusions are summarized below.
(1)
Across all rainfall types, including stratiform and convective rainfall, log10Nw shows negative skewness, while Dm shows positive skewness. The average Dm for the whole rainfall is 1.43 mm, with an average log10Nw of 3.42. These values are larger than those found in stratiform rainfall (Dm = 1.33 mm, log10Nw = 3.33) but smaller than those observed in convective rainfall (Dm = 1.99 mm, log10Nw = 3.58). Compared to other regions, eastern coastal China experiences typhoon rainfall with lower concentrations and larger-sized raindrops. Therefore, the log10Nw-Dm data for convective rainfall in the region lies within the range of the “continental” and “maritime” clusters;
(2)
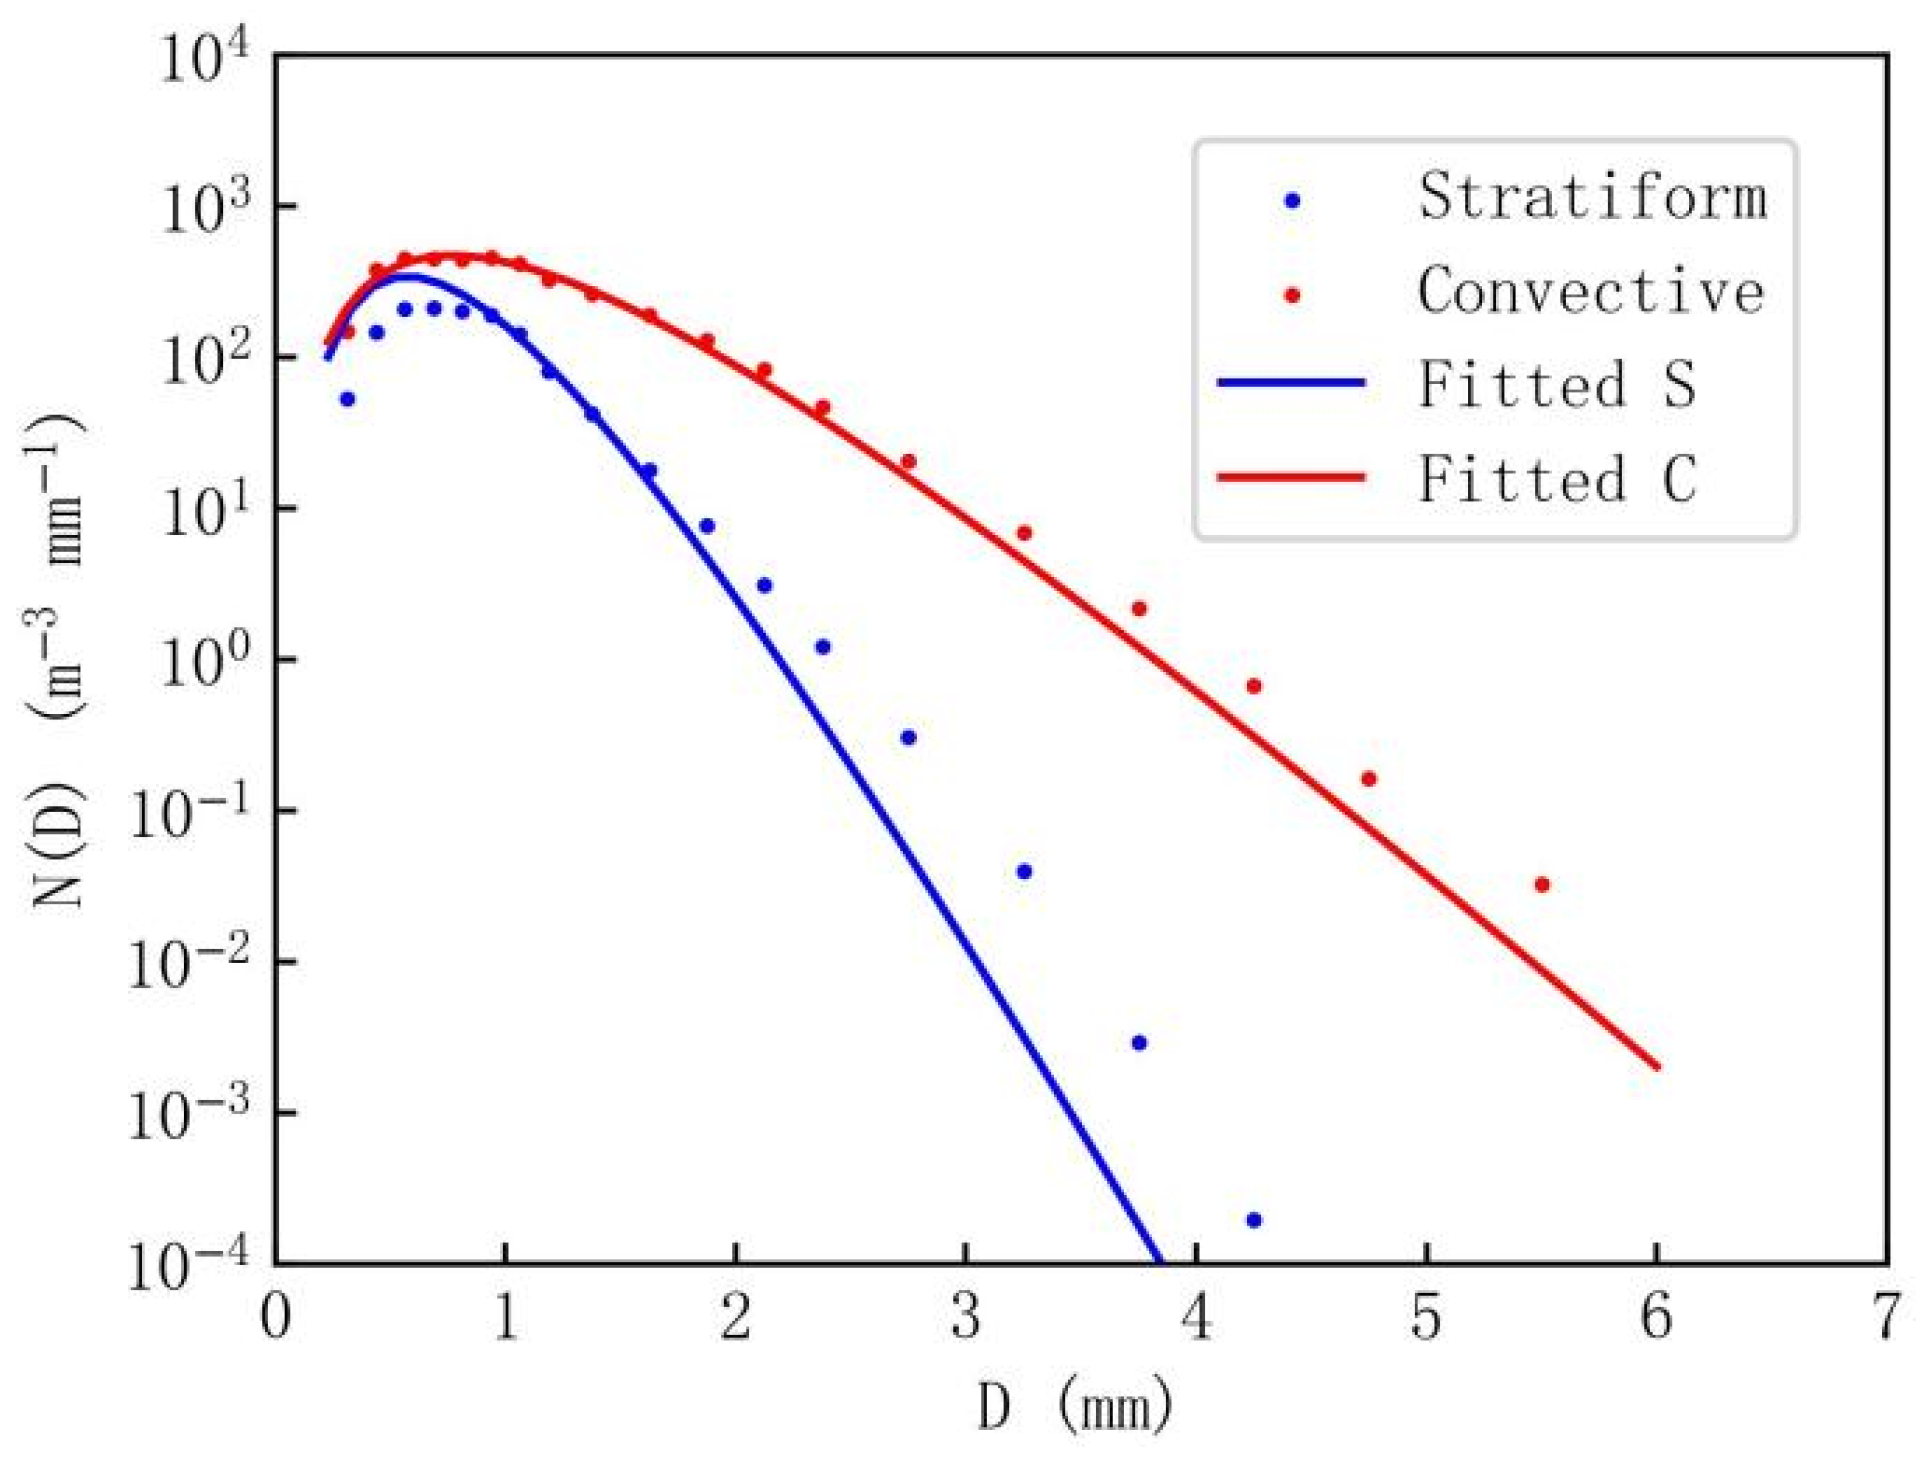
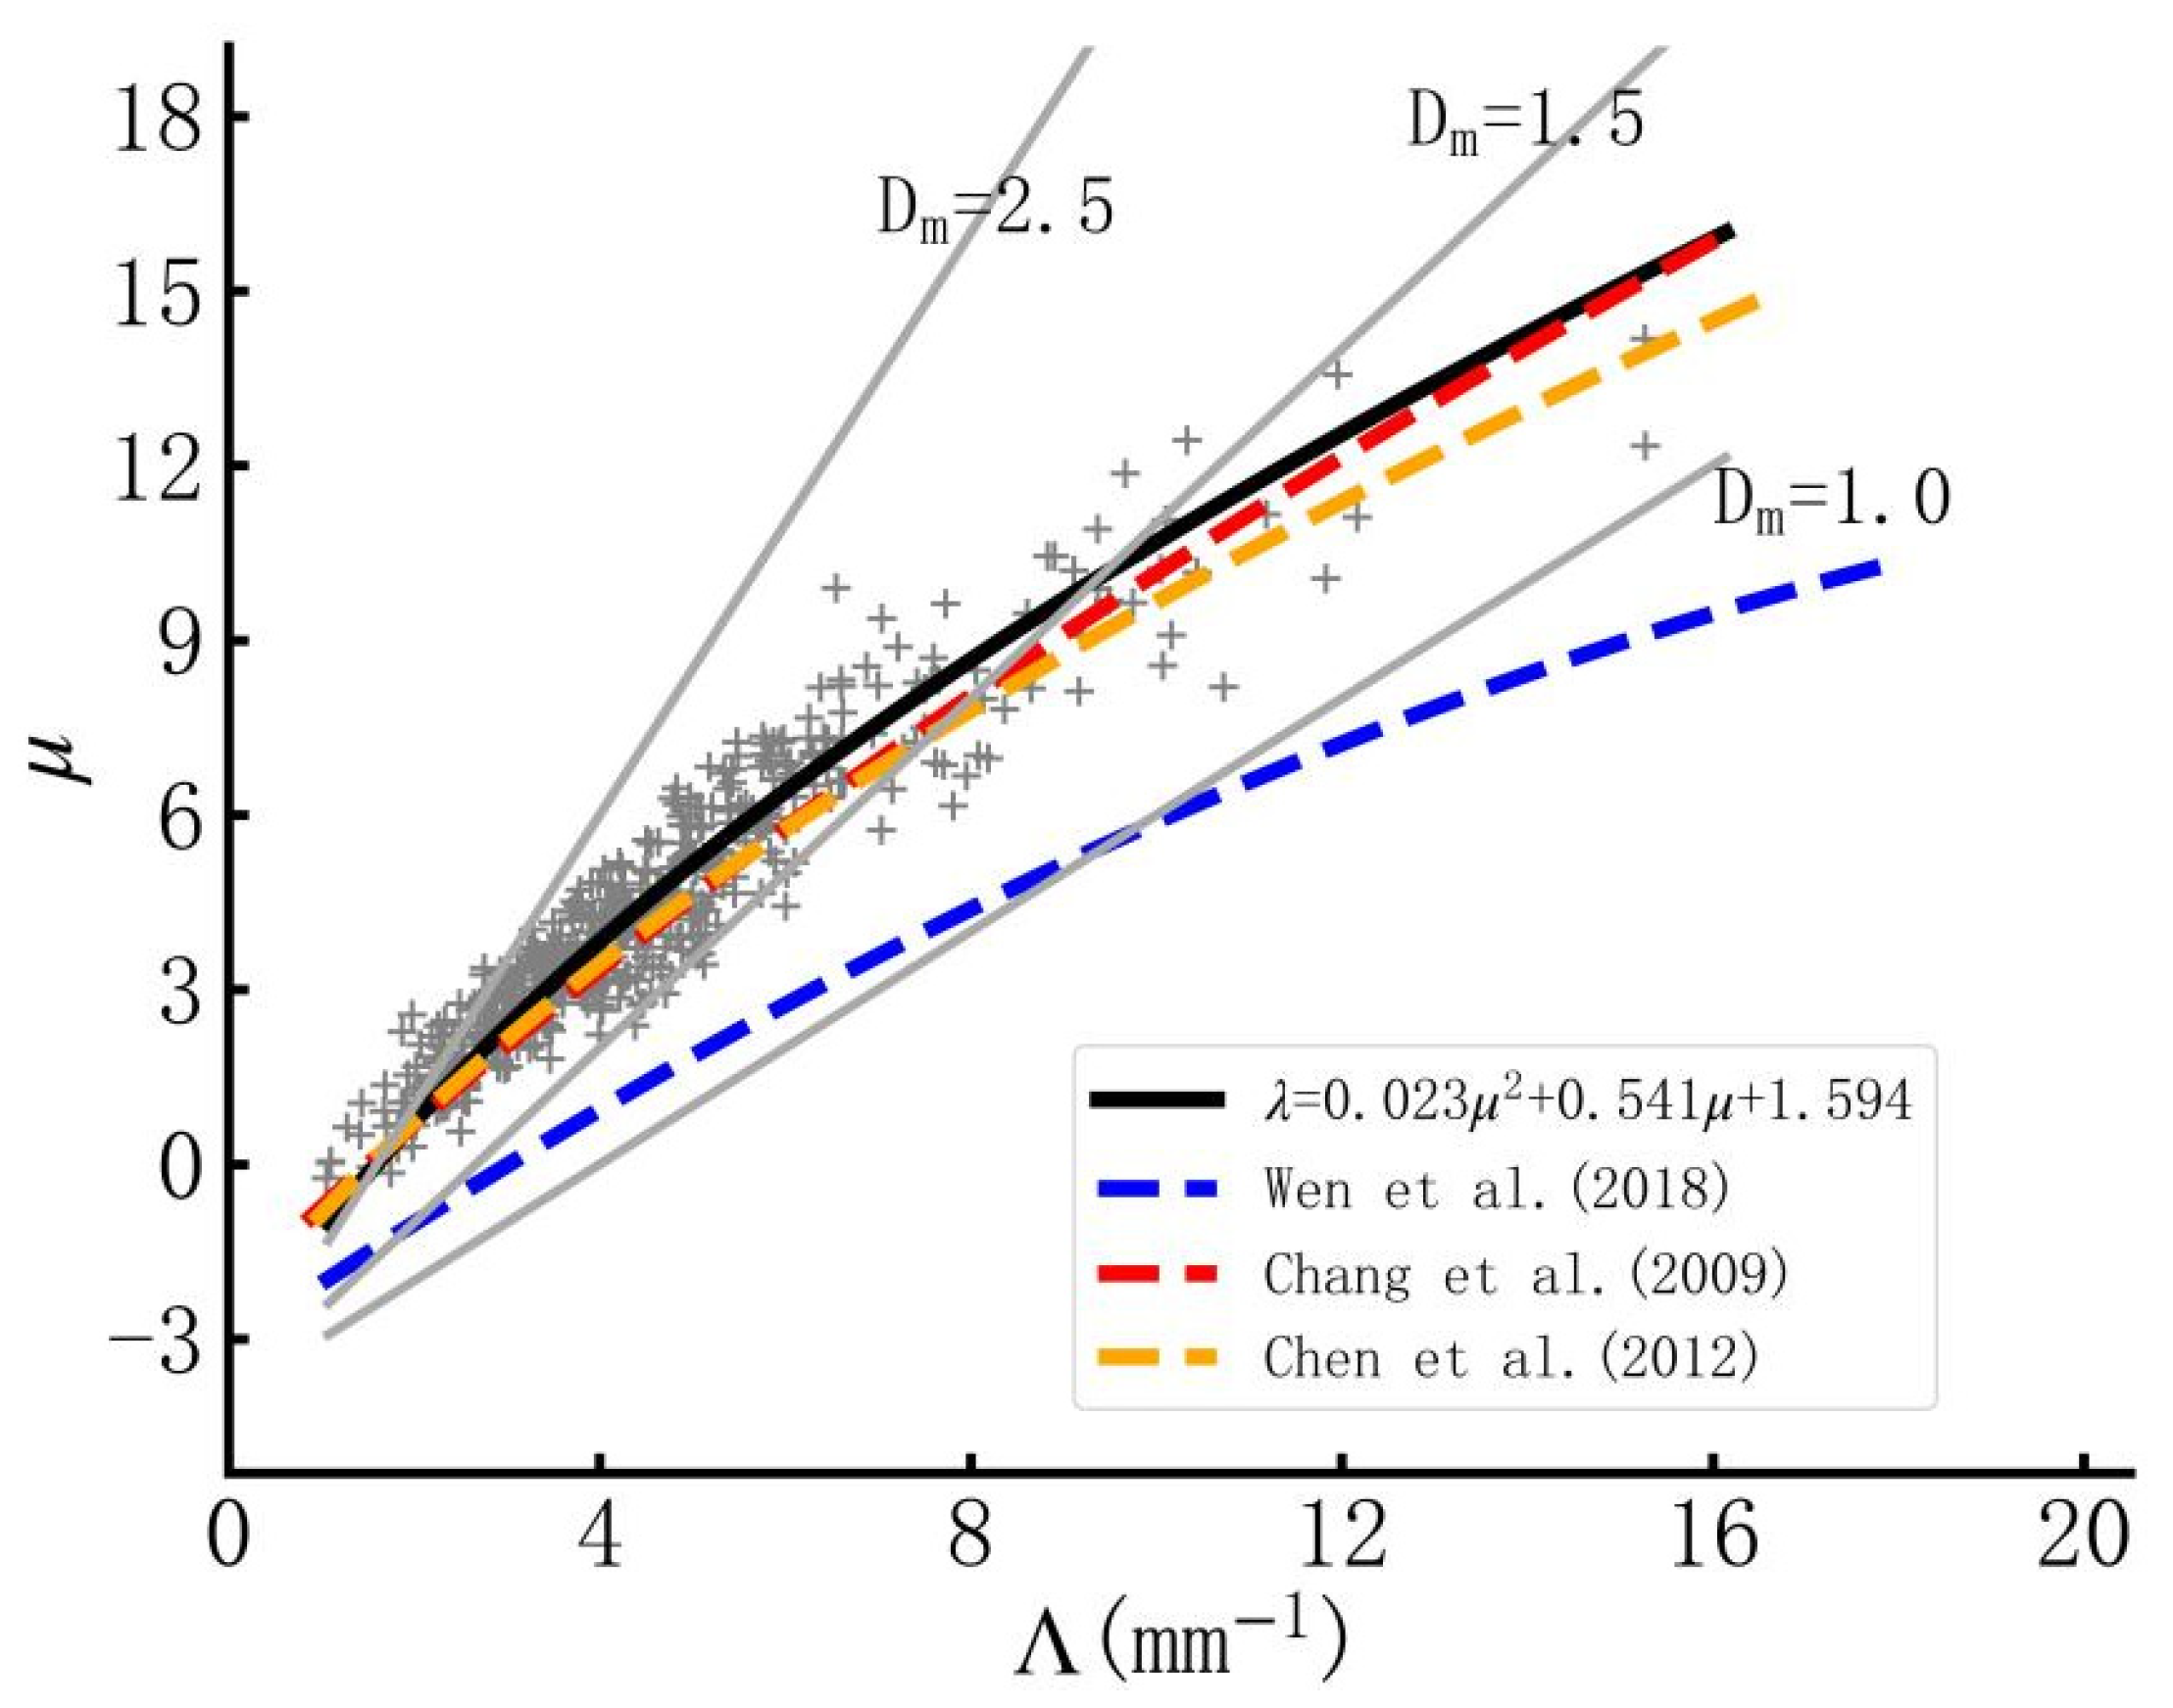
By separately fitting the average diameter and corresponding mean number concentration of convective and stratiform rainfall, the results reveal that the raindrop spectra of convective rainfall closely match the three-parameter gamma distribution model, while the mid-sized raindrops of stratiform rainfall generally conform to the gamma distribution model. Additionally, the convective R substantially exceeds that of stratiform and whole rainfall, primarily driven by the larger diameter of raindrops in convective rainfall, along with higher liquid water content and concentration. The µ-Λ relationship for convective rainfall from typhoons on the eastern coast of China is represented by Λ = 0.023μ2 + 0.541μ + 1.594. This finding closely resembles typhoon rainfalls in Taiwan and Fujian along the southeastern coastal China but exhibits notable disparities compared to typhoon rainfall in continental China (Jiangsu and Guangdong);
(3)
A least-squares fit is conducted on datasets where the number of raindrops in whole samples exceeded 1000, resulting in the Z-R relationship for eastern coastal China during typhoons being Z = 175.04R1.53. This relationship closely aligns with the Z-R relationship observed in Taiwan. Using the Z-R relationship for Fujian tends to underestimate R below 10 mm h−1 and overestimate those above 30 mm h−1. Conversely, the NEXRAD system’s Z-R relationship generally underestimates typhoon rainfall in eastern coastal China, while the Z-R relationships from continental China (Jiangsu and Guangdong) tend to overestimate it.
This study is the first to analyze the DSD characteristics of different rainfall types during typhoons in eastern coastal China. It enhances understanding of the variations in microphysical characteristics of typhoon raindrop distributions caused by different precipitation processes. This is particularly significant for model microphysical parameterization and QPE using dual-polarization radar and rainfall measurement satellites. Because of varying DSD characteristics, the coefficients of Z-R relationships for different samples vary significantly. For a given radar echo, QPE values from different relationships can differ substantially. Although the study unearthed intriguing insights from the DSD characteristics during the typhoon periods, these findings could remain preliminary due to the limited number of precipitation episodes sampled and the absence of comprehensive observations across a sufficient number of surface sites. Long-term observations ought to be implemented, utilizing a greater amount of collected data during typhoon periods. Previous studies have shown significant differences in the DSD characteristics of various rainfall systems within the same region [3,13]. Therefore, further analysis of warm-season (non-typhoon) rainfall in eastern coastal China is warranted. Future studies should focus on comparing these properties to those observed during the warm season (non-typhoon), aiming to quantitatively discern the differences in DSD among distinct rainfall systems. Additionally, the thermal and dynamic processes in a typhoon’s spiral rainbands differ significantly from those in the eyewall, leading to notable differences in DSD characteristics at various stages of the typhoon [8,12]. Overall, eyewall rainfall exhibits a broader spectral width and higher raindrop concentration across all sizes compared to spiral rainbands [12,30]. Future research should focus on further analyzing the differences in DSD between spiral rainbands and eyewall regions of multiple typhoons in eastern coastal China. Furthermore, this study only suggests that topography may influence the DSDs of typhoons, without offering a detailed analysis. More comprehensive studies will likely require DSD data from various locations, radar observations, and numerical simulations.
The findings of this study suggest that the Dm is larger and the Nw is lower compared to continental China (Jiangsu and Guangdong) during typhoons, possibly due to topographical influences or potential measurement errors [23,57]. The principle of the DSG1 disdrometer is similar to the OTT that exhibits limitations in measuring small droplets compared to instruments like the meteorological particle spectrometer (MPS) and two-dimensional video disdrometer (2DVD) [13,21,22]. It has become crucial to secure more comprehensive DSD measurements through the utilization of more precise instruments, such as the MPS and 2DVD. Additionally, it is worth exploring the application of the drizzle mode reconstruction technique in this region. This initiative is slated for implementation in the near future.

Author Contributions

S.C. conceived the conceptualization and methodology of this study; D.W. performed the experiments and analyzed the data; Y.K., X.L. and S.Y. investigated and prepared the data; X.G., X.N. and H.S. helped to analyze the results and revise the manuscript; D.W. and S.C. wrote the paper. All authors have read and agreed to the published version of the manuscript.

Funding

This research was partially funded by the "Pioneer" and "Leading Goose" R&D Program of Zhejiang (Grant No. 2024C03256); Ningbo Commonweal Research Project (Grant Nos. 2023S065, 2022S181); Ningbo Key R&D Program (Grant No. 2023Z139); Guangxi Key R&D Program (Grant Nos. AB22080104, AB22035016); Innovation Group Project of Southern Marine Science and Engineering Guangdong Laboratory (Zhuhai) (No. 311022001).

Institutional Review Board Statement

Not applicable.

Informed Consent Statement

Not applicable.

Data Availability Statement

The data presented in this study are available on request from the corresponding author. The data are not publicly available due to privacy.

Conflicts of Interest

The authors declare no conflicts of interest.

References

  1. Qin, W.; Cai, Y.; He, L. The Relationship between the Typhoons Affecting South China and the Pacific Decadal Oscillation. Atmosphere 2024, 15, 285. [Google Scholar] [CrossRef]
  2. Wang, Y.; Xia, B.; Chen, Y.; Chen, H.; Xie, J. Revisiting the Characteristics of Super Typhoon Saola (2023) Using GPM, Himawari-9 and FY-4B Satellite Data. Atmosphere 2024, 15, 290. [Google Scholar] [CrossRef]
  3. Chen, B.; Yang, J.; Pu, J. Statistical Characteristics of Raindrop Size Distribution in the Meiyu Season Observed in Eastern China. J. Meteorol. Soc. Jpn. 2013, 91, 215–227. [Google Scholar] [CrossRef]
  4. Tokay, A.; Bashor, P.G.; Habib, E.; Kasparis, T. Raindrop size distribution measurements in tropical cyclones. Mon. Weather. Rev. 2008, 136, 1669–1685. [Google Scholar] [CrossRef]
  5. Ulbrich, C.W.; Atlas, D. Microphysics of Raindrop Size Spectra: Tropical Continental and Maritime Storms. J. Appl. Meteorol. Climatol. 2007, 46, 1777–1791. [Google Scholar] [CrossRef]
  6. Ren, F.; Wu, G.; Dong, W.; Wang, X.; Wang, Y.; Ai, W.; Li, W. Changes in tropical cyclone precipitation over China. Geophys. Res. Lett. 2006, 33. [Google Scholar] [CrossRef]
  7. Lau, D.-S.; Chan, W.-S.; Wong, Y.-C.; Lam, C.-C.; Chan, P.-W. Hindcast Insights from Storm Surge Forecasting of Super Typhoon Saola (2309) in Hong Kong with the Sea, Lake and Overland Surges from Hurricanes Model. Atmosphere 2024, 15, 17. [Google Scholar] [CrossRef]
  8. Zheng, H.P.; Zhang, Y.; Zhang, L.F.; Lei, H.C.; Wu, Z.H. Precipitation microphysical processes in the inner rainband of tropical cyclone Kajiki (2019) over the South China Sea revealed by polarimetric radar. Adv. Atmos. Sci. 2021, 38, 65–80. [Google Scholar] [CrossRef]
  9. Janapati, J.; Seela, B.K.; Lin, P.; Lee, M. Microphysical features of typhoon and non-typhoon rainfall observed in Taiwan, an island in the northwest Pacific. Hydrol. Earth Syst. Sci. 2021, 25, 4025–4040. [Google Scholar] [CrossRef]
  10. Seela, B.K.; Janapati, J.; Kalath Unnikrishnan, C.; Lin, P.-L.; Le Loh, J.; Chang, W.-Y.; Kumar, U.; Reddy, K.K.; Lee, D.-I.; Venkatrami Reddy, M. Raindrop Size Distributions of North Indian Ocean Tropical Cyclones Observed at the Coastal and Inland Stations in South India. Remote Sens. 2021, 13, 3178. [Google Scholar] [CrossRef]
  11. Liu, X.; Xue, L.; Chen, B.; Zhang, Y. Characteristics of raindrop size distributions in Chongqing observed by a dense network of disdrometers. J. Geophys. Res. Atmos. 2021, 126, e2021JD035172. [Google Scholar] [CrossRef]
  12. Bao, X.; Wu, L.; Tang, B.; Ma, L.; Wu, D.; Tang, J. Variable Raindrop Size Distributions in Different Rainbands Associated with Typhoon Fitow (2013). J. Geophys. Res. Atmos. 2019, 124, 262–281. [Google Scholar] [CrossRef]
  13. Wen, L.; Zhao, K.; Chen, G.; Wang, M.; Zhou, B.; Huang, H. Drop size distribution characteristics of seven typhoons in China. J. Geophys. Res. Atmos. 2018, 123, 6529–6548. [Google Scholar] [CrossRef]
  14. Thurai, M.; Gatlin, P.N.; Bringi, V.N. Separating stratiform and convective rain types based on the drop size distribution characteristics using 2D video disdrometer data. Atmos. Res. 2016, 169, 416–423. [Google Scholar] [CrossRef]
  15. Cheng, P.; Chang, Y.; Liu, Q. A case study of raindrop size distribution and orographic impact characteristics in spring stratiform precipitation over the Qilian mountains. Chin. J. Atmos. Sci. 2021, 45, 1232–1248. (In Chinese) [Google Scholar]
  16. Zhang, A.; Chen, C.; Wu, L. Regional Variability of Raindrop Size Distribution from a Network of Disdrometers over Complex Terrain in Southern China. Remote Sens. 2023, 15, 2678. [Google Scholar] [CrossRef]
  17. Abin, T.; Vijay, P.K.; Kaustav, C. Characterization of raindrop size distributions and its response to cloud microphysical properties. Atmos. Res. 2021, 249, 105292. [Google Scholar]
  18. Tokay, A.; Short, D.A. Evidence from Tropical Raindrop Spectra of the Origin of Rain from Stratiform versus Convective Clouds. J. Appl. Meteorol. 1996, 35, 355–371. [Google Scholar] [CrossRef]
  19. Zhang, G.; Sun, J.; Brandes, E.A. Improving Parameterization of Rain Microphysics with Disdrometer and Radar Observations. J. Atmos. Sci. 2006, 63, 1273–1290. [Google Scholar] [CrossRef]
  20. Tang, Q.; Xiao, H.; Guo, C.; Feng, L. Characteristics of the raindrop size distributions and their retrieved polarimetric radar parameters in northern and southern China. Atmos. Res. 2014, 135, 59–75. [Google Scholar] [CrossRef]
  21. Zhang, A.; Hu, J.; Chen, S.; Hu, D.; Liang, Z. Statistical Characteristics of Raindrop Size Distribution in the Monsoon Season Observed in Southern China. Remote Sens. 2019, 11, 432. [Google Scholar] [CrossRef]
  22. Li, X.; Chen, S.; Li, Z.; Huang, C.; Hu, J. Statistical Characteristics of Warm Season Raindrop Size Distribution in the Beibu Gulf, South China. Remote Sens. 2022, 14, 4752. [Google Scholar] [CrossRef]
  23. Chang, W.-Y.; Wang, T.-C.C.; Lin, P.-L. Characteristics of the raindrop size distribution and drop shape relation in typhoon systems in the western Pacific from the 2D video disdrometer and NCU C-band polarimetric radar. J. Atmos. Ocean. Technol. 2009, 26, 1973–1993. [Google Scholar] [CrossRef]
  24. Bringi, V.N.; Chandrasekar, V.; Hubbert, J.; Gorgucci, E.; Randeu, W.L.; Schoenhuber, M. Raindrop Size Distribution in Different Climatic Regimes from Disdrometer and Dual-Polarized Radar Analysis. J. Atmos. Sci. 2003, 60, 354–365. [Google Scholar] [CrossRef]
  25. Zhang, G.; Vivekanandan, J.; Brandes, E. A method for estimating rain rate and drop size distribution from polarimetric radar measurements. IEEE Trans. Geosci. Remote Sens. 2001, 39, 830–841. [Google Scholar] [CrossRef]
  26. Zhang, G.; Vivekanandan, J.; Brandes, E.A.; Meneghini, R.; Kozu, T. The Shape–Slope Relation in Observed Gamma Raindrop Size Distributions: Statistical Error or Useful Information? J. Atmos. Ocean. Technol. 2003, 20, 1106–1119. [Google Scholar] [CrossRef]
  27. Feng, F.; Hu, S.; Liu, X.; Xiao, H. Precipitation Microphysical Characteristics of Typhoon Mangkhut in Southern China Using 2D Video Disdrometers. Atmosphere 2020, 11, 975. [Google Scholar] [CrossRef]
  28. Chen, B.; Wang, Y.; Ming, J. Microphysical characteristics of the raindrop size distribution in Typhoon Morakot (2009). J. Trop. Meteorol. 2012, 18, 162–171. [Google Scholar]
  29. Wang, G.; Zhang, D.; Sun, J. A Multiscale Analysis of a Nocturnal Extreme Rainfall Event of 14 July 2017 in Northeast China. Mon. Weather. Rev. 2021, 149, 173–187. [Google Scholar] [CrossRef]
  30. Mao, J.; Chen, Y.; Zhang, A.; Chen, S. Comparative Analysis of Rainfall Droplet Spectra of Typhoon Wipha (201907) in Chongzuo and Fangchenggang, China. Chin. J. Atmos. Sci. 2023, 47, 1–12. (In Chinese) [Google Scholar]
  31. Fu, Z.; Wan, R.; Xiao, Y. Comparison of precipitation measurement by DSG5 and Parsivel present weather instrument. Torrential Rain Disasters 2022, 41, 434–444. (In Chinese) [Google Scholar]
  32. Löffler-Mang, M.; Joss, J. An Optical Disdrometer for Measuring Size and Velocity of Hydrometeors. J. Atmos. Ocean. Technol. 2000, 17, 130–139. [Google Scholar] [CrossRef]
  33. Lü, J.; Zhou, Y.; Fu, Z.; Lu, C.; Huang, Q. Variability of Raindrop Size Distribution during a Regional Freezing Rain Event in the Jianghan Plain of Central China. Adv. Atmos. Sci. 2023, 40, 725–742. [Google Scholar] [CrossRef]
  34. Maki, M.; Keenan, T.D.; Sasaki, Y.; Nakamura, K. Characteristics of the Raindrop Size Distribution in Tropical Continental Squall Lines Observed in Darwin, Australia. J. Appl. Meteorol. 2001, 40, 1393–1412. [Google Scholar] [CrossRef]
  35. Cao, Q.; Zhang, G.; Brandes, E.; Schuur, T.; Ryzhkov, A.; Ikeda, K. Analysis of Video Disdrometer and Polarimetric Radar Data to Characterize Rain Microphysics in Oklahoma. J. Appl. Meteorol. Climatol. 2008, 47, 2238–2255. [Google Scholar] [CrossRef]
  36. Battaglia, A.; Rustemeier, E.; Tokay, A.; Blahak, U.; Simmer, C. PARSIVEL Snow Observations: A Critical Assessment. J. Atmos. Ocean. Technol. 2010, 27, 333–344. [Google Scholar] [CrossRef]
  37. Nešpor, V.; Krajewski, W.F.; Kruger, A. Wind-Induced Error of Raindrop Size Distribution Measurement Using a Two-Dimensional Video Disdrometer. J. Atmos. Ocean. Technol. 2000, 17, 1483–1492. [Google Scholar] [CrossRef]
  38. Jaffrain, J.; Berne, A. Experimental Quantification of the Sampling Uncertainty Associated with Measurements from PARSIVEL Disdrometers. J. Hydrometeorol. 2010, 12, 352–370. [Google Scholar] [CrossRef]
  39. Yuter, S.E.; Kingsmill, D.E.; Nance, L.B.; Löffler-Mang, M. Observations of Precipitation Size and Fall Speed Characteristics within Coexisting Rain and Wet Snow. J. Appl. Meteorol. Clim. 2006, 45, 1450–1464. [Google Scholar] [CrossRef]
  40. Tokay, A.; Bashor, P.G. An experimental study of small-scale variability of raindrop size distribution. J. Appl. Meteorol. Climatol. 2010, 49, 2348–2365. [Google Scholar] [CrossRef]
  41. Ulbrich, C.W. Natural Variations in the Analytical Form of the Raindrop Size Distribution. J. Clim. Appl. Meteorol. 1983, 22, 1764–1775. [Google Scholar] [CrossRef]
  42. Brandes, E.A.; Zhang, G.; Vivekanandan, J. Comparison of Polarimetric Radar Drop Size Distribution Retrieval Algorithms. J. Atmos. Ocean. Technol. 2004, 21, 584–598. [Google Scholar] [CrossRef]
  43. Ulbrich, C.W.; Atlas, D. Rainfall Microphysics and Radar Properties: Analysis Methods for Drop Size Spectra. J. Appl. Meteorol. 1998, 37, 912–923. [Google Scholar] [CrossRef]
  44. Vivekanandan, J.; Zhang, G.; Brandes, E. Polarimetric Radar Estimators Based on a Constrained Gamma Drop Size Distribution Model. J. Appl. Meteorol. 2004, 43, 217–230. [Google Scholar] [CrossRef]
  45. Huang, X.; Yin, J.; Ma, L.; Huang, Z. Comprehensive Statistical Analysis of Rain Drop Size Distribution Parameters and Their Application to Weather Radar Measurement in Nanjing. Chin. J. Atmos. Sci. 2019, 43, 691–704. (In Chinese) [Google Scholar]
  46. Loh, J.L.; Lee, D.; You, C.-H. Inter-comparison of DSDs between Jincheon and Miryang at South Korea. Atmos. Res. 2019, 227, 52–65. [Google Scholar] [CrossRef]
  47. Hu, Z.; Srivastava, R. Evolution of raindrop size distribution by coalescence, breakup, and evaporation: Theory and observations. J. Atmos. Sci. 1995, 52, 1761–1783. [Google Scholar] [CrossRef]
  48. Bringi, V.; Chandrasekar, V. Polarimetric Doppler Weather Radar: Principles and Applications; Cambridge University Press: Cambridge, UK, 2001. [Google Scholar]
  49. Chen, Y.; Duan, J.; An, J.; Liu, H. Raindrop Size Distribution Characteristics for Tropical Cyclones and Meiyu-Baiu Fronts Impacting Tokyo, Japan. Atmosphere 2019, 10, 391. [Google Scholar] [CrossRef]
  50. Seela, B.K.; Janapati, J.; Lin, P.-L.; Lan, C.-H.; Shirooka, R.; Hashiguchi, H.; Reddy, K.K. Raindrop Size Distribution Characteristics of the Western Pacific Tropical Cyclones Measured in the Palau Islands. Remote Sens. 2022, 14, 470. [Google Scholar] [CrossRef]
  51. Kumar, L.S.; Lee, Y.H.; Ong, J.T. Two-Parameter Gamma Drop Size Distribution Models for Singapore. IEEE Trans. Geosci. Remote Sens. 2011, 49, 3371–3380. [Google Scholar] [CrossRef]
  52. Testud, J.; Oury, S.; Amayenc, P.; Black, R.A. The concept of “normalized” distributions to describe raindrop spectra: A tool for cloud physics and cloud remote sensing. J. Appl. Meteor. 2001, 40, 1118–1140. [Google Scholar] [CrossRef]
  53. Brawn, D.; Upton, G.J. Estimation of an atmospheric gamma drop size distribution using disdrometer data. Atmos. Res. 2008, 87, 66–79. [Google Scholar] [CrossRef]
  54. Huang, C.; Chen, S.; Zhang, A.; Pang, Y. Statistical Characteristics of Raindrop Size Distribution in Monsoon Season over South China Sea. Remote Sens. 2021, 13, 2878. [Google Scholar] [CrossRef]
  55. Fulton, R.A.; Breidenbach, J.P.; Seo, D.-J.; Miller, D.A.; O’Bannon, T. The WSR-88D Rainfall Algorithm. Weather Forecast. 1998, 13, 377–395. [Google Scholar] [CrossRef]
  56. Steiner, M.; Smith, J.A.; Uijlenhoet, R. A microphysical interpretation of radar reflectivity-rain rate relationships. J. Atmos. Sci. 2004, 61, 1114–1131. [Google Scholar] [CrossRef]
  57. Wen, L.; Zhao, K.; Zhang, G.; Liu, S.; Chen, G. Impacts of instrument limitations on estimated raindrop size distribution, radar parameters, and model microphysics during Mei-Yu season in East China. J. Atmos. Ocean. Technol. 2017, 34, 1021–1037. [Google Scholar] [CrossRef]
Figure 1. (a) Five typhoons that affect the eastern coastal areas of China, along with their differently colored trajectories. (b) Geographical location of the eastern coast of China corresponds to the red box in Figure 1a. The red-colored solid circle indicates the location of the DSG1. The white polygon represents the Ningbo area of Zhejiang Province and the shading indicates topographic elevation levels (the data are derived from ETOPO 2022).
Atmosphere 15 00951 g001
Figure 2. The time series (local standard time; LST) of the DSDs observed on the eastern coast of China during the five typhoons. The shading indicates the logarithmic number concentration (mm−1 m−3) of the DSDs. The left y-axis denotes the diameter (D, mm) of raindrops and the right y-axis represents the rainfall rate (R, mm h−1) derived from the disdromete, illustrated by a pink curve.
Atmosphere 15 00951 g002
Figure 3. Histogram panels for Dm and log10Nw, with Dm depicted in gray and log10Nw in black. Mean values, standard deviation (SD), and skewness (SK) are also shown in the respective panel. (a) For the whole, (b) for the stratiform, and (c) for the convective.
Atmosphere 15 00951 g003
Figure 4. Scatter distributions of log10Nw-Dm for convective and stratiform rainfall types during the five typhoons over the eastern coast of China, with convective rainfall depicted in orange and stratiform in sky blue. The two outlined rectangles represent the “maritime-like” and “continental-like” clusters identified by Bringi et al. [24]. The solid circle illustrates the mean of log10Nw-Dm for the convective rainfall of five typhoons on the eastern coast of China. Mean of convective log10Nw-Dm for the typhoon rainfall in the South China Sea (cross symbol) from Zheng et al. [8], Guangdong (solid triangle) from Feng et al. [27], Jiangsu (solid square) from Wen et al. [13], and northern Taiwan (plus sigh) from Chang et al. [23] are given as well, respectively.
Atmosphere 15 00951 g004
Figure 5. Relationship between log10Nw (a,b) and Dm (c,d) with R of the two rainfall types. The red solid lines denote their fitting curves. (a,c) for stratiform rainfall (SR) and (b,d) for convective rainfall (CR).
Atmosphere 15 00951 g005
Figure 6. The average raindrop spectral distribution and gamma fitting distribution of the two types of rainfall during the five typhoons.
Atmosphere 15 00951 g006
Figure 7. The µ-Λ relationship for convective rainfall during typhoons with the number of raindrops exceeding 1000. The black, blue, red, and orange lines represent the findings from this research, alongside the studies of Chang et al. [23], Chen et al. [28], and Wen et al. [13], respectively. The gray lines depict the relationship ΛDm = 4 + µ, with Dm values of 1.0, 1.5, and 2.5 mm.
Atmosphere 15 00951 g007
Figure 8. Scatter plot and fitted line of radar reflectivity factor (Z) versus rainfall rate (R) for whole rainfall based on filtered disdrometer data, along with fitted lines from previous studies by Fulton et al. [55], Chen et al. [28], Wen et al. [13], and Chang et al. [23].
Atmosphere 15 00951 g008
Table 1. Average parameters of the raindrop spectrum for various rain types.
Rain TypesNTRDmWlog10Nw
Convective56619.721.990.853.58
Stratiform1651.461.330.083.33
Whole2344.041.430.193.42
Table 2. Z-R relationship (Z = aRb) coefficient (a) and power (b) over different regions.
StudiesRegionab
Fulton et al. [55]NEXRAD3001.4
Chang et al. [23]Taiwan, Southeastern China206.831.45
Chen et al. [28]Fujian, Southeastern China3081.32
Wen et al. [13]Continental China (Jiangsu and Guangdong)147.281.38
This studyeastern coast of China175.041.53
Disclaimer/Publisher’s Note: The statements, opinions and data contained in all publications are solely those of the individual author(s) and contributor(s) and not of MDPI and/or the editor(s). MDPI and/or the editor(s) disclaim responsibility for any injury to people or property resulting from any ideas, methods, instructions or products referred to in the content.

