Article

Humidity-Controlling Ceramic Bricks: Enhancing Evaporative Cooling Efficiency to Mitigate Urban Heat Island Effect

1
College of Architectural Engineering, Guangzhou Panyu Polytechnic, Guangzhou 511400, China
2
State Key Laboratory of Subtropical Building and Urban Science, South China University of Technology, Guangzhou 510640, China
3
College of Civil Engineering and Architecture, Guangxi University, 100 University Road, Nanning 530004, China
*
Author to whom correspondence should be addressed.
Atmosphere 2024, 15(8), 964; https://doi.org/10.3390/atmos15080964
Submission received: 24 June 2024 / Revised: 27 July 2024 / Accepted: 9 August 2024 / Published: 13 August 2024

Abstract

:
Passive evaporative cooling technology using the building envelope is a crucial measure to mitigate the urban heat island effect. This study aims to enhance the cooling efficiency of the surface of enclosure structures by utilizing volcanic ash, potassium–sodium stone powder, and silica-based mesoporous oxide (SMO) as primary materials. These components are incorporated into the ceramic brick production process to create innovative humidity-controlling ceramic bricks (HCCTs). This study extensively investigates the impact of SMO and the amount of applied glaze on the physical and mechanical characteristics of these HCCTs. Additionally, it examines the water absorption and evaporative cooling properties of the studied materials under optimal substitution conditions. Numerical calculations are used to determine the heat and moisture transfer properties of HCCTs. The results indicate that incorporating 2% SMO and applying 70 g/m2 of glaze results in a moisture absorption capacity of 385 g/m2 and a moisture discharge capacity of 370 g/m2. These conditions also yield a notable flexural strength of 15.2 MPa. Importantly, the HCCTs exhibit significantly enhanced capillary water absorption and water retention capabilities. Increased water absorption reduces surface temperature by 2–3 °C, maintaining the evaporative cooling effect for 20 to 30 h. It is also found that the temperature of HCCTs decreases linearly with increasing water content and porosity, while the temperature difference gradually decreases with thickness. Water migration in HCCTs with greater thickness is notably influenced by gravity, with water moving from top to bottom. Therefore, it is recommended that brick thickness does not exceed 15 mm.

1. Introduction

Under the background of China’s large-scale urbanization, the rapid expansion of urban infrastructure has led to an excessive amount of land being covered by artificial surfaces under cities, breaking the original balance of heat and moisture exchange between the natural soil interface and the atmosphere and resulting in many urban thermal environmental problems, such as the urban heat island (UHI) effect [1]. The Guangdong–Hong Kong–Macao Greater Bay Area is characterized by a typical humid and hot climate. One notable feature of this climate is the high solar radiation levels, particularly during the scorching summer season, wherein the cumulative solar radiation between June and August peaks at 545 MJ/m2. This intense solar radiation serves as a primary heat source contributing to overheating in the built environment, making it an ideal candidate for UHI mitigation strategies such as evaporative cooling [2,3]. Furthermore, this region experiences strong monsoons, and the urban areas in the Greater Bay Area are well suited to harness wind energy resources. With over 6000–8000 h of wind speeds exceeding 3 m/s per year, both theoretical and experimental studies indicate that this abundant wind energy resource can enhance the evaporation of surface water. This, in turn, augments the effectiveness of evaporative cooling on building surfaces [4,5].
Notably, the evaporation ratio β (β = actual evaporation E/climatic evaporation EO) in this region is high. The value of β serves as a quantitative measure of the suitability for regional passive evaporative cooling technology. In the Guangdong–Hong Kong–Macao Greater Bay Area, the annual evaporation ratio stands at 0.8, a notable contrast to the lower values (ranging from 0.05 to 0.2) found in Northwest China. Additionally, this area experiences concentrated precipitation during the hot summer season (June, July, and August), further enhancing its potential for passive evaporative cooling. These climatic conditions create a robust foundation for passive evaporative cooling technology. The region can rely on the autonomous behavior of climate elements to ensure a guaranteed rate of over 80% during the cooling of the building environment when it is most needed. This rate can be further enhanced with the strategic addition of artificial water. Leveraging the unique attributes of the local natural environment, the seasonal climate energy advantage for passive evaporative cooling technology in this area is particularly promising [6].
Passive evaporative cooling, which is a cornerstone of the theory of natural harmony, plays a pivotal role in enhancing environmental quality and reducing artificial energy consumption in building design. This technology leverages a range of natural harmonious effects. Roofs and walls, serving as the primary interface between buildings and the natural environment, are key surfaces exposed to sunlight, heat, and precipitation [7]. In regions with hot summers and warm winters, these elements are vital in the design of building insulation. As construction technology advances rapidly, exterior walls are no longer confined to their traditional load-bearing role. There is a growing emphasis on comfort and ecological concerns, leading to heightened demands for additional functionalities in exterior-wall finishing materials. These demands have paved the way for the use of porous materials with water storage capabilities [4]. By applying such materials to the building envelope, evaporative cooling methods like surface water drenching can be employed to achieve effective water storage and cooling for building facades. The heat and moisture transfer attributes of porous materials delay water evaporation on the material surface, thereby enhancing the evaporative cooling effect [8,9].
A historical example of passive evaporative cooling through porous materials is the ancient oyster-shell wall from the Lingnan coastal area. This distinctive design utilizes the water-absorbing properties of oyster shells during rainy days. On sunny days, the stored water evaporates, contributing to natural cooling, resulting in a warm environment during winter and a cool one during summer. Despite its historical efficacy, the traditional oyster-shell wall faces limitations due to the unique characteristics of its materials and appearance, which have hindered its broader adoption in architectural practices [10]. Nevertheless, the concept of passive evaporative cooling has continued to inspire contemporary research and innovations in building design. For instance, Zhang et al. [6] utilized a thermal- and humid-climate wind-tunnel testing platform to investigate the thermodynamic properties of moistened aerated concrete blocks. This research also delved into the climatic suitability of porous bricks with varying thicknesses. Zhang proposed a suitable wall structure for exterior walls based on the passive evaporative cooling theory [11].
Expanding on this work, Pan et al. [12] conducted numerous experiments and established that porous-surface brick wall components with a high moisture content and significant solar radiation absorption coefficients exhibited superior moisture absorption and dissipation capabilities. Consequently, they demonstrated more pronounced passive evaporative cooling effects under identical conditions. Wang et al. [13] furthered this research by experimenting with the drenching and cooling of porous brick walls under natural conditions. Their research revealed that the effectiveness of evaporative cooling in decorative brick walls was closely tied to the water absorption rate, monitored at two-hour intervals. Their results illustrated that higher water absorption rates led to more effective evaporative cooling. Additionally, differences in the evaporative cooling performance due to various drenching methods were identified. These findings provide essential theoretical insights for the practical application of porous tiles in engineering projects. Furthermore, Zhang et al. [11] explored the dynamic surface heat transfer coefficient of porous building materials during the evaporation process using a wind tunnel in a hot and humid climate. Their work included proposing an experimental calculation method for determining the external surface heat transfer coefficient of porous building materials during water storage and evaporation.
Currently, porous tiles are considered to be an eco-friendly material and are crafted from primary resources like clay, fly ash, and silt subjected to high-temperature roasting. However, the effectiveness of sintered porous bricks in managing wetness is hampered by the propensity of the mesopores to become obstructed by the glass phase formed during high-temperature firing. This limitation reduces their humidity-controlling performance. Furthermore, the selection of sintered porous bricks is somewhat restricted when it comes to their color, texture, and overall appearance, making them less appealing to designers. In contrast, ceramic tiles/bricks represent a widely used material for exterior wall decoration, boasting attributes such as moisture resistance, resistance to pollutants, and ease of cleaning. Ceramic tiles, with their extensive variety of colors, textures, and finishes, can cater to diverse architectural styles [14]. However, the evaporative cooling potential of ceramic tiles has often been overlooked. Previous studies have demonstrated that diatom ceramic bricks with a compressive strength of 4.6 MPa, a density of 1.35 g/cm3, a hygrometric capacity of 32 mg/g, and a discharge capacity of 30 mg/g can be successfully prepared at a calcination temperature of 900 °C [15]. In a novel approach, Vu et al. [16] utilized volcanic ash and waste glass slag subjected to calcination at 800 °C to create humidity-controlling ceramic bricks (HCCTs). These bricks exhibited a moisture absorption capacity of 275 g/m2 and a moisture discharge capacity of 235 g/m2. However, their average flexural strength measured at only 5.6 MPa, falling considerably short of the national standards’ requirements for the flexural strength of ceramic bricks. Consequently, the development of high-strength, humidity-controlling ceramic tiles with evaporative cooling capabilities holds significant importance.
To address a critical research gap, this study leverages volcanic ash’s abundance and cost-effectiveness as a primary raw material. In conjunction, silicon-based mesoporous oxide (SMO) serves as an additive to enhance performance. SMO synthesis is achieved through an acid–base etching process. Subsequently, these materials are seamlessly integrated into the ceramic matrix, resulting in the successful fabrication of HCCTs with remarkable humidification capabilities. This research scrutinizes the impact of SMO and the quantity of glaze-spraying on these HCCTs’ inherent properties. The ensuing analysis includes an assessment of the innovative HCCTs’ hygrothermal properties. In terms of simulation, based on COMSOL Multiphysics software, the heat and moisture transfer characteristics of the HCCTs are numerically calculated, and the influence of optimizing the parameters of the HCCTs on their heat and moisture performance is further discussed.

2. Materials and Methods

2.1. Raw Materials

In this study, we utilized four key raw materials: silica-based mesoporous oxide (SMO), volcanic ash, potassium–sodium stone powder, and a low-temperature melting block. The chemical composition of each primary material is delineated in Table 1. The SMO was synthesized from volcanic ash through a template-free method, meticulously engineered to enhance the strength and moisture control characteristics of the ceramic tiles. For a detailed description of the production process, please consult our previously published research [17].

2.2. Preparation of HCCTs

In this study, each HCCT consisted of a green body and a glaze layer. The green body was composed of raw materials in the following weight percentages: 80% volcanic ash with a nano-mesoporous structure, 15% borax, and 3.5% silica-based mesoporous oxide. Fumed silica with a specific surface area of 200 m2/g was used as an additive. Slurries of volcanic powder with 0–4% fumed silica were prepared with distilled water and 0.5% sodium polyacrylate, resulting in a mixture mass ratio of 1:1. The slurries were planetary-milled for 30 min. The resultant powders with 4.2–15.1% water content were prepared by drying, granulating, and sieving through a 30-mesh sieve. Green bodies (dimensions: 8 × 45 × 95 mm) with different SMO contents were formed by dry-pressing the resultant powders at 9 MPa. The green bodies were dried at 120 °C in a drying oven and fired in an electrically heated muffle furnace (Nabertherm P330) with an air temperature heating rate of 5 °C/min and a holding time of 30 min. The glaze layer included the following weight percentages: 35% SiO2, 20% Al2O3, 18% B2O3, 12% Li2O, 13% Na2O, 5% K2O, and 3% CaCO3. Our investigation aimed to explore the influence of varying proportions of SMO and glaze coating quantities on the final product. Subsequently, two different glaze colors were prepared and each one was applied to an HCCT to control the reflectivity of its specific surface: one HCCT specimen was coated in red, named HCCT-R, and another was coated in white, named HCCT-W. A comprehensive depiction of the HCCT preparation process is illustrated in Figure 1.
In this paper, two types of wet tiles are designed. The reflectivity of their specific surfaces is mainly controlled by the color of the glaze layer on the surface of the tile.

2.3. Experimental Methods

2.3.1. Flexural Strength and Water Absorption Tests

According to ASTM C78/C78M-2015a [18], the determination of flexural strength was conducted on specimens sized 8 × 45 × 95 mm through a three-point bending test employing an INSTRON-5567 apparatus from Instron Engineering Corporation, Norwood, MA, USA. The test configuration featured a lower span of 60 mm, and the test was executed under a crosshead speed of 0.5 mm/min for accurate and controlled measurement. The water absorption of the ceramic samples was tested according to ASTM C1585 [19].

2.3.2. Pore Structure Test

For pore size distribution analysis, the HCCT samples underwent drying in an oven at 200 °C for a duration of 4 h. The nitrogen adsorption and desorption properties of the inorganic silica-based mesoporous material were assessed using a specific surface area and porosity analyzer (TriStar II 3flex, Micromeritics, Norcross, GA, USA) at 77 K, and N2 adsorption–desorption isotherms were generated for comprehensive analysis.

2.3.3. Microstructural Analysis

Preceding testing, the HCCT samples underwent a series of preparatory steps, including drying, grinding, and sieving through a 200-mesh sieve. Subsequently, a Rigaku SmartLab SE X-ray diffractometer equipped with a Cu Kα radiation source (λ = 1.5418 Å) and a D/te X Ultra detector facilitated the analysis of their crystal structure and phase composition. The scanning parameters were set at a speed of 2°/min and an angle range of 5° to 80°. Further elucidation of the energy spectrum was conducted using X-ray photoelectron spectroscopy (K-Alpha*, Thermo Fisher Scientific, Waltham, MA, USA) with a monochromatized AlKa source (energy of 1486.6 eV). The full-spectrum scan featured a pass energy of 100 eV and a step size of 1 eV, while the narrow-spectrum scan employed a pass energy of 30 eV and a step size of 0.1 eV. Microstructural observations at both the micrometer and nanometer scales were carried out utilizing a field emission scanning electron microscope (TESCAN MIRA LMS, Brno, Czech Republic) and an ultra-high-resolution cold field scanning electron microscope (SU8220, Hitachi, Tokyo, Japan), respectively.

2.3.4. Evaporation Performance Test

In pursuit of a comprehensive analysis of the hygrothermal characteristics inherent to HCCTs, the primary investigation focused on the initial test section within a wind tunnel expressly designed for hot and humid climates. This innovative wind tunnel bifurcates into two distinct sections: the former is dedicated to scrutinizing the thermal and humid milieu of the surrounding materials and the latter is dedicated to analyzing the atmospheric boundary layer, as delineated in Figure 2. The inaugural test section adeptly emulates conditions of heightened thermal and humid extremity, thereby facilitating a nuanced evaluation of building materials, components, and modules across diverse environmental scenarios. In contrast, the latter test section emulates both neutral and non-neutral atmospheric boundary layers, rendering it particularly apt for inquiries into phenomena such as urban heat islands and regional planning. The dimensional specifications of the primary test section are calibrated at 3.0 × 2.5 × 6.0 m and it is equipped with a suite of instruments, including a temperature stratification device, a turbulence generator, a hot-and-cold radiant plate, and a model turntable with a 2.4 m diameter aligned along the airflow direction. This sophisticated platform excels in the meticulous replication of complex meteorological parameter environments. For further elucidation on the intricate design parameters of the wind tunnel, we direct readers to our antecedent work [13].
Meteorological parameters were calibrated to mimic the prevalent weather conditions in Guangzhou, as delineated in Figure 3, in strict adherence to the design standards articulated in JGJ 286-2013 [20]. In order to monitor the evaporation during the evaporation process, a BW32KH-series electronic scale (measuring range: 0–32 kg, accuracy: 0.01 g) was used to continuously and automatically record the quality changes in the samples (Figure 4). The sample to be tested was placed in a square box made of acrylic, and its four sides and bottom were wrapped with polyethylene foam plates to cut off the influence of local heat sources around the evaporation of the specimen, so as to ensure heat transfer from the surface of the specimen to the interior. The sample surface was adjusted to be consistent with the illumination of the light source by adjusting the height supported by the type II stainless-steel bracket under the acrylic box. The electronic balance, intricately linked to a computer via a professional transmission line, systematically recorded alterations in specimen mass on a minute-by-minute basis. Temperature alterations in the specimens were monitored with a high-precision T-type thermocouple line affixed to the specimen’s surface, securely bonded with heat-conducting silica gel. The opposing terminus of the thermocouple line was interfaced with a data acquisition instrument. The entire duration of the evaporation experiment spanned 48 h, during which all samples were preconditioned by saturation through immersion in distilled water.

2.4. Numerical Simulation

When studying the evaporative cooling characteristics of an HCCT, it is only feasible to select one or more measuring points on its surface for measurement. The temperature and humidity distributions along its internal one-dimensional line cannot be measured. Under certain specific meteorological conditions, the heat and moisture transfer process of an HCCT in a complex environment cannot be predicted. In this study, we employed a two-dimensional (2D) numerical model to simulate the influence of humidity and porosity variations on HCCTs. The internal pore structure of the actual materials is highly complex and heterogeneous. Accurately capturing this complexity in a 3D model would require extremely detailed input data and significant computational resources. Given the current scope and objectives of our study, the use of a 2D model provided a feasible and practical approach for investigating the factors influencing the heat and moisture transfer of HCCTs.

2.4.1. Model Foundation

In this section of our study, COMSOL Multiphysics 6.0 was used to simulate the heat and moisture transfer characteristics of the HCCTs, and then the wind-tunnel test results were used to verify the reliability of the simulation results, and then the structural parameters of the HCCT samples were optimized using the simulation software. A 2D model of the HCCT structure was developed, as shown in Figure 5. The typical parameters of an HCCT is shown in Table 2.

2.4.2. Governing Equations

As a typical porous medium, an HCCT’s structure is usually composed of three phases: solid, liquid, and gas. In unsaturated porous media, wet fractions not only exist in the porous media’s skeleton pores in the form of liquid and vapor, but also consider the movement of non-condensate gasses (such as air) inside the pores. In order to reveal the transmission mechanism of moisture in the HCCT structure, we mainly focused on the water vapor diffusion movement in the process of evaporation and drying. Under the node “Water Transport in Building Materials” in COMSOL Multiphysics, the moisture control equation includes both water transfer and gas diffusion. For the solid skeleton part of an HCCT, the main established moisture control equation is as follows:
ω ϕ t ( ω D w ϕ + δ p ( ϕ P sat ) ) = G
where ω represents water storage, kg/m3; Dω represents water diffusivity, m2/s; G is the water vapor source, kg/(m3·s); and ϕ is porosity.
The heat transfer process of an HCCT includes mutual contact between the solid skeleton (particles) and the heat conduction process of fluids in the void space, convective heat transfer of fluids in the void space (forced convection or natural convection), phase-change heat transfer such as evaporation, and radiation heat transfer between solid particles (the skeleton) or gasses. To facilitate accurate modeling, the following assumptions were made:
(i) The expansion and contraction deformation of the HCCT skeleton were not considered, and the surface material was assumed to be homogeneous and isotropic;
(ii) Heat radiation and air convection heat transfer in the void were not considered;
(iii) Viscosity dissipation and pressure variation were not considered;
(iv) The satisfaction of local thermal equilibrium was assumed, that is, Ts = Tf = T, where Ts and Tf denote the temperature of the solid phase and that of the fluid phase, respectively. According to the local thermal equilibrium assumption, the thermal governing equation for an HCCT is as follows:
ρ c m T t + ρ c p f V T = λ m T + ϕ q m
λ m = 1 ϕ λ s + ϕ λ f
q m = 1 ϕ q s + ϕ q f
ρ c m = 1 ϕ ρ c s + ϕ ρ c p f
where the subscripts s and f denote solid phase and fluid phase, respectively, and qm, λm, and (ρc)m denote the apparent heat generation rate, apparent thermal conductivity, and apparent heat capacity of the internal heat source, respectively. cp is the specific heat of the fluid at constant pressure (J/(kg·K)); c is the specific heat of the solid (J/(kg·K)); λ is the thermal conductivity (W(m·°C)); ρ is the density of the solid or fluid phase (kg/m3); and q″ is the heat per unit volume generated by the internal heat source (W/m3).

2.4.3. Boundary Conditions

The perimeter boundary and bottom surface of the HCCT were set to thermal insulation, and the initial temperature was set to 20 °C. The ambient temperature, solar radiation, humidity, and wind speed were consistent with the wind-tunnel meteorological data, and the convective heat flux on the surface of the HCCT was calculated as follows:
q 0 = h c T s T a
where hc is the heat transfer coefficient, W/(m2·K); Ts and Ta are, respectively, the initial specimen temperature and air temperature, K.
The convective water vapor flux of HCCT was calculated as follows:
G 0 = β ( θ e x t p s a t ( T e x t ) θ p s a t ( T ) )
where β is the water transport coefficient, 2 × 10⁻⁸ s/m; θ and θext are the initial and external relative humidity, respectively.

3. Results and Discussion

3.1. Flexural Strength and Water Absorption

Figure 6a illustrates the impact of the SMO content on the flexural strength of HCCTs. The results reveal a discernible trend wherein the flexural strength experienced an incremental rise with the increasing SMO content until reaching an optimal threshold, beyond which a decline can be observed. Notably, at a 2% SMO content, the flexural strength of the HCCTs exhibits a substantial improvement from 9.5 MPa to 11.3 MPa, constituting a noteworthy 19% augmentation compared to SMO-free HCCTs. This enhancement is ascribed to the robust interfacial bonding between SMO and the ceramic matrix, fostering enhanced cohesion and crack resistance at the optimum SMO content. However, an excessive presence of SMO is observed to have induced heightened porosity, thinning of the pore walls, and an unstable pore structure within the HCCTs, detrimentally impacting their mechanical properties.
Figure 6b portrays the water absorption behavior of the HCCTs under high-humidity conditions (humidity: 75–90%). A discernible positive correlation emerges between the SMO content and the water absorption of the HCCTs. This underscores the pivotal role played by SMO, rich in mesopores, in significantly enhancing the moisture-absorbing capabilities of these ceramic tiles. The impact of SMO on water absorption is more pronounced than that on flexural strength primarily due to the extensive mesoporous structure introduced by SMO, which significantly increases the overall porosity and water retention capacity of HCCTs.
To explore the mechanism by which SMO improves HCCT strength, we measured the XRD spectra, presented in Figure 7, of samples prepared without and with the 2% addition of SMO. This figure indicates that the diffraction pattern of the HCCTs prepared with SMO has characteristic diffraction peaks corresponding to hydrated calcium silicate, confirming the formation of calcium silicate hydrate (C-S-H). Further insight is provided by Figure 8, presenting the full-spectrum X-ray photoelectron spectroscopy (XPS) scans of the samples. Seven prominent photoelectron lines of O 1s, Si 2p, Mg 2p, Al 2p, C 1s, Ca 2p, and Na 2p indicate the presence of O, Si, Mg, Al, C, Ca, and Na elements in the samples. Peak-fitting of the Si 2p photoelectron line revealed binding energies of 103.3 eV, 102.6 eV, and 101.7 eV, aligning with the phases of silica, silicate, and tobermorite, respectively, as established by Black et al. [21]. The existence of tobermorite, a calcium silicate hydrate mineral with a Ca/Si ratio of 5:6, further confirms the formation of C-S-H phases in the samples with the addition of 2% SMO.
Figure 9 presents the SEM micrograph results for HCCTs that were fabricated with either 0% or a 2% addition of SMO. It can be clearly seen that HCCTs with the 2% addition of SMO exhibit loose lamellar aggregates compared to those without this addition. These lamellae structures, aligned with the pore size distribution curve in Figure 9a,b, accommodate numerous mesopores, facilitating the condensation and evaporation of water vapor. In the absence of SMO, the pore sizes span from 4.0 to 100.0 nm. Contrastingly, a 2% addition expands this range to 4.0 to 1000.0 nm, with a predominant presence of mesopores in the 5.0–10.0 nm range. This indicates that the introduction of inorganic silica-based mesoporous materials augments the mesopore count and overall tile porosity. Additionally, Figure 9c reveals that the adsorption–desorption isotherms of these tiles exhibit a Type V hysteresis loop, indicative of a combination of Type D and Type E hysteresis loops. This suggests that the primary pore types in these ceramic tiles are slit-like and ink-bottle-shaped. This structural arrangement empowers the ceramic tiles to effectively regulate humidity in response to environmental changes.

3.2. Impact of Glaze Quantity

Under standard conditions, applying glaze to the surface of an HCCT is crucial. This dual-purpose method enhances the decorative elements of the moistened ceramic brick while simultaneously serving functions such as anti-fouling, concealing the color of the unfired body, and facilitating the adhesion of decorative ceramic ink. To assess the impact of different amounts of sprayed surface glaze on the characteristics of HCCTs, a glaze-spraying machine was employed to apply low-temperature glaze of different qualities to the surface of the dry HCCTs. Following this, the HCCTs underwent calcination at 700 ℃ for 30 min, resulting in the production of glazed HCCTs. The hygrometric properties of these glazed HCCTs were then subjected to testing. Figure 10 illustrates the hygroscopic capacity of the glazed HCCTs prepared using different quantities of sprayed glaze.
Observations of this figure reveal that, as the amount of glaze sprayed on the ceramic brick body’s surface increases, the water absorption of the glazed HCCTs within the high humidity range (70–95%) gradually diminishes. When the spraying amount is below 70 g/m2, the reduction in moisture absorption is relatively gradual. However, exceeding the threshold of 70 g/m2 leads to a rapid decline in moisture absorption. This highlights a direct correlation between the quantity of sprayed glaze and the hygroscopic properties of the ceramic tiles. Excessive glaze on the surface obstructs nano-pores, diminishing the hygroscopic properties of the ceramic tiles through the melting and blocking of the glaze.

3.3. Hygrothermal Properties

The analyses conducted above reveal that the optimal conditions for the fabrication of glazed HCCTs involve a 2% addition of SMO and a glaze-spraying amount of 70 g/m2. Subsequently, two HCCTs were re-prepared with different glaze colors: one in red, named HCCT-R, and the other in white, named HCCT-W. These innovative HCCTs exhibited an average flexural strength of 15.2 MPa, surpassing the stipulated requirement of the Chinese National Standard [22] (GB/T4100-2015) for ceramic tiles. Furthermore, the water absorption of these tiles was measured at 303 g/m2, significantly exceeding the standard set by JC/T 2082-2011 [23].
The primary objective of this study was to evaluate the viability of these innovative HCCTs as functional decorative materials for external building walls. A comprehensive assessment of the hygrothermal properties of these tiles was conducted, and a comparative analysis was made with the properties of a porous fired ceramic tile (PFCT) available in the market.

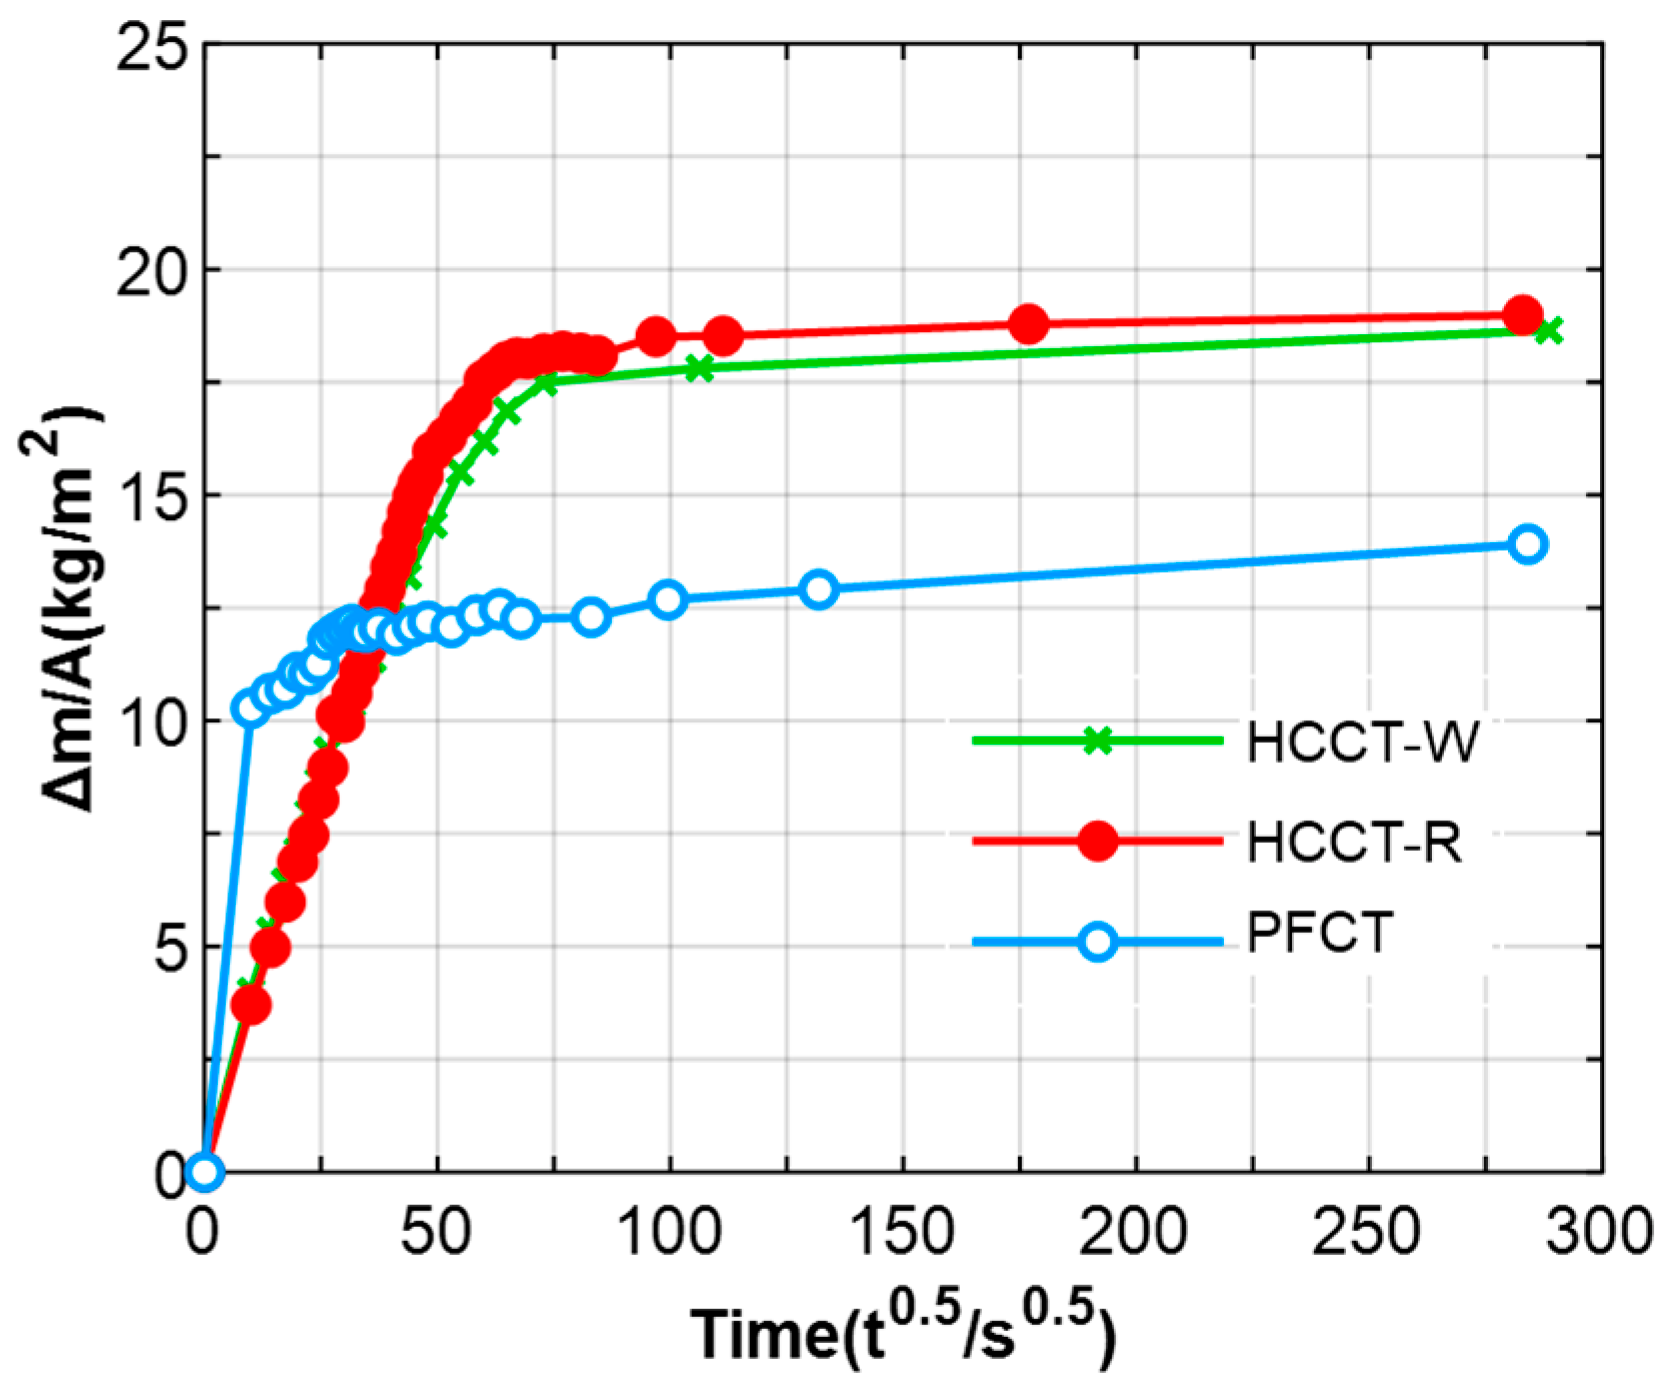
3.3.1. Water Absorption Profile

The capillary water absorption coefficient serves as a crucial parameter for characterizing the water absorption capacity of porous materials. According to ASTM standard C1585 [19], the capillary water absorption process of porous materials can be divided into two distinct stages. The first stage covers the initial 6 h of water absorption, while the second stage encompasses the subsequent 6 to 192 h. To calculate the capillary water absorption coefficient, the slope of the curve relating the cumulative water absorption per unit area to the square of time is fitted through regression analysis.
Figure 11 illustrates the water absorption profiles of the three porous tile specimens. These profiles demonstrate a common trait, featuring a rapid water absorption rate during the initial stages, followed by a relatively slower rate in the later stages. The outcomes of the single-side immersion test indicate that the two types of humidity-controlling ceramic tiles exhibit similar water absorption process. Table 3 further compares the water absorption coefficient of the three porous tile specimens. The results from the single-side immersion test revealed that the first-stage water absorption coefficients (S1) of HCCT-W and HCCT-R were 3.69 × 10⁻² and 3.65 × 10⁻² mm/s0.5, respectively. These values were approximately 30% lower than that of the PFCT. This disparity is attributed to the capillary water absorption’s connection to the pore-related structural characteristics of porous tile, including factors like porosity, pore size, and pore shape.
The results of the vacuum saturation test reveal that the three specimen types display comparable levels of open porosity. Consequently, the distinctions in water absorption are primarily attributed to variations in pore distribution. In contrast to the PFCT, the HCCTs exhibit loosely structured lamellar aggregates, with a notable abundance of mesopores in the range of 10–30 nm, as previously found in the porosity analysis. These mesoporous structures contribute significantly to enhancing the capillary water absorption capacity and volumetric water content of the ceramic bricks. The impact of pore structure on the second-stage capillary water absorption coefficients (S2) of the three specimen types is relatively marginal, as the water absorption capacity of porous materials tends to become saturated during the later stage. In summary, the final total water absorption capacities (Wcap) of the three materials can be ranked as follows: PFCT < HCCT-W < HCCT-R.

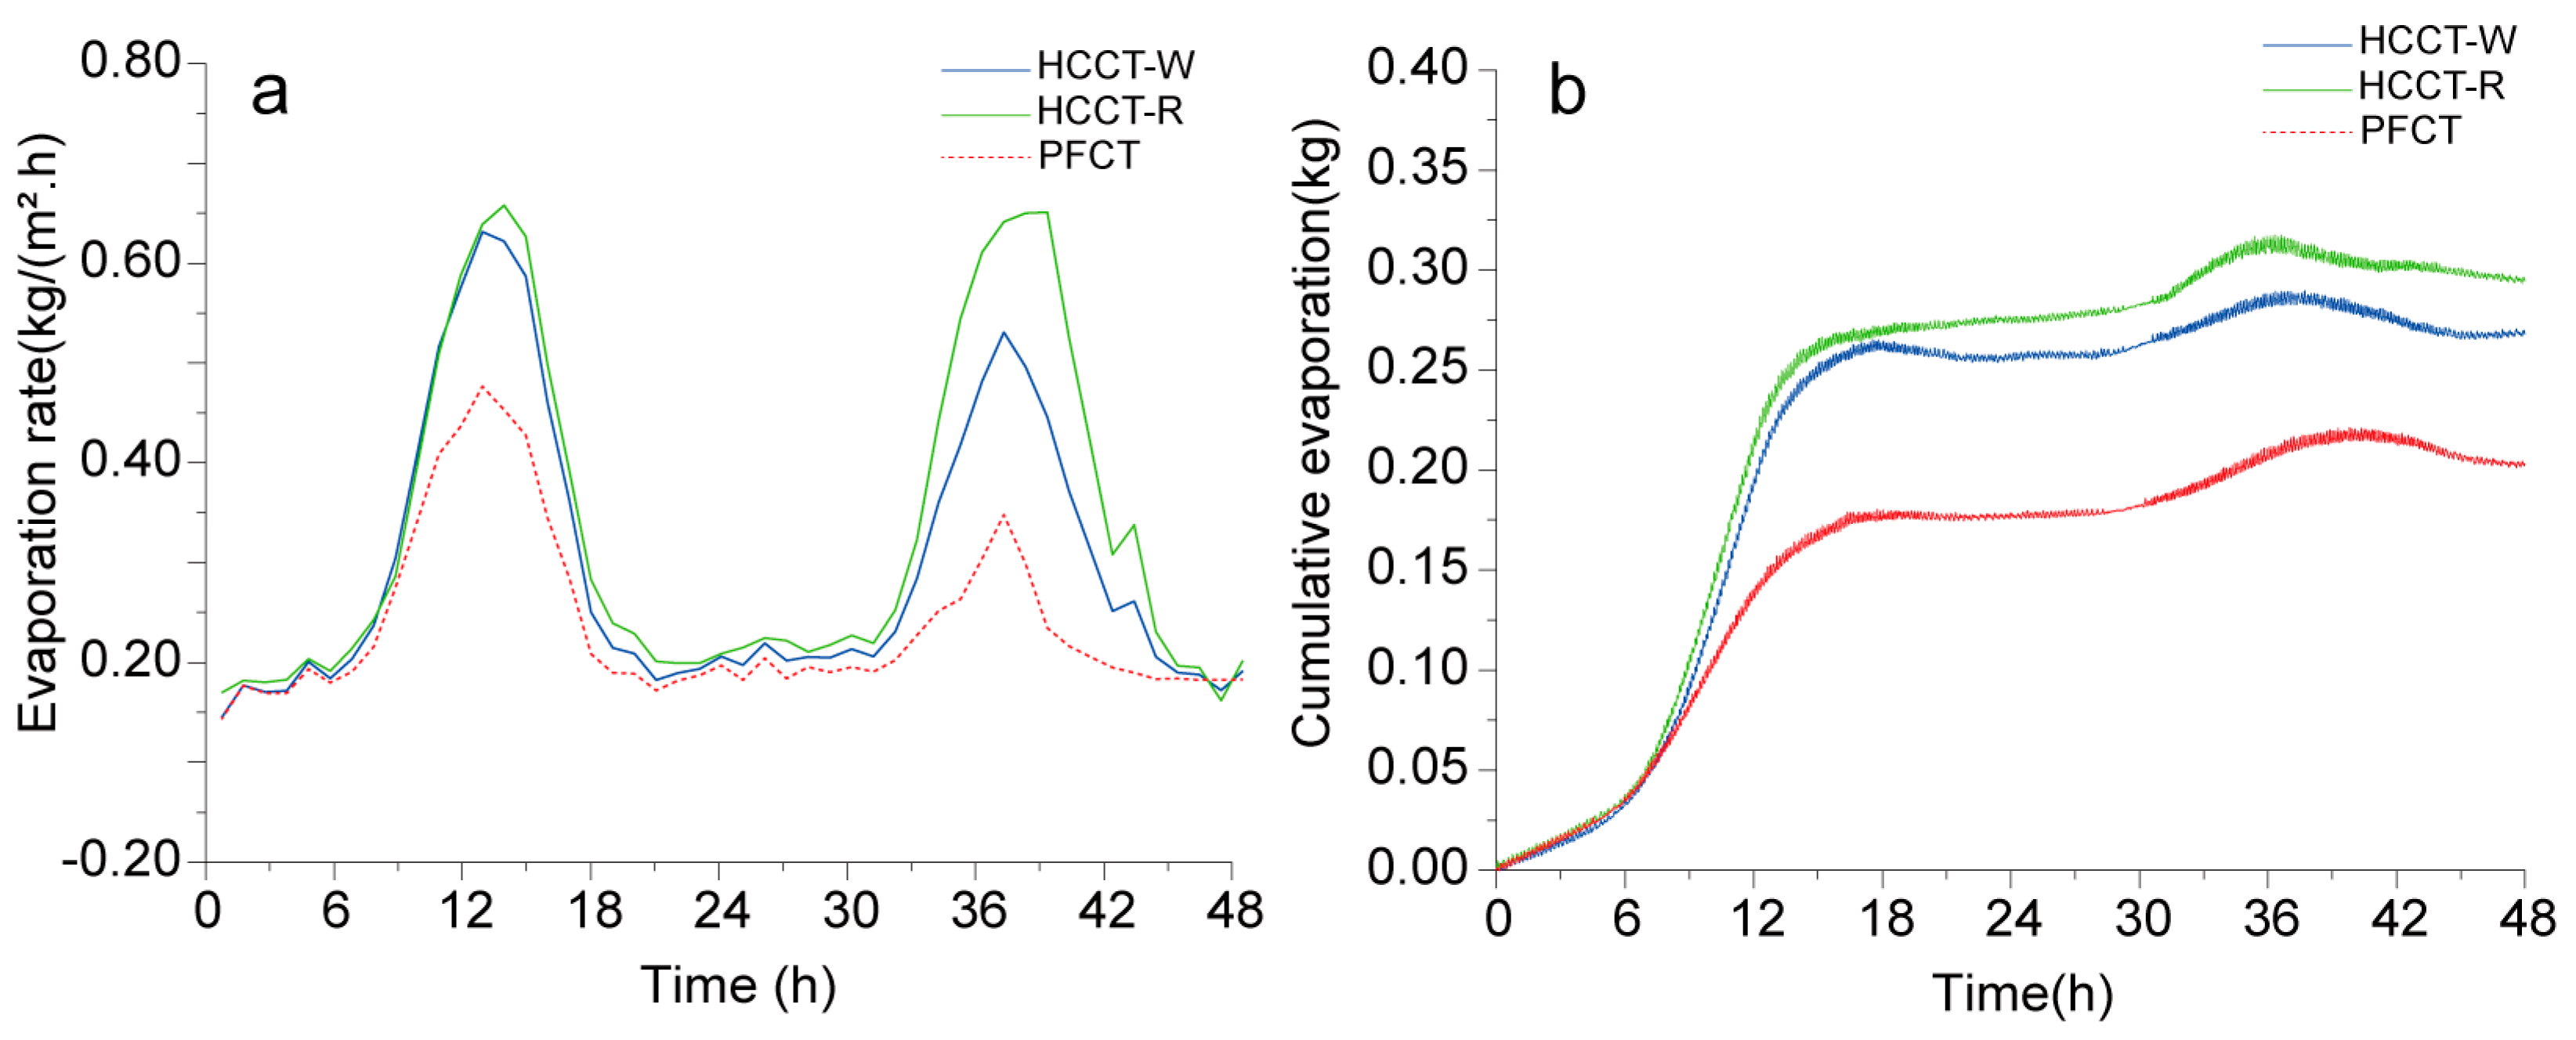
3.3.2. Evaporation Profile

The evaporation process of porous materials after their capacity for water absorption reaches saturation can be categorized into two stages. In the first stage, evaporation is primarily driven by the vapor pressure differences in the surrounding environment, and water is transported from the saturated zone to the evaporation surface through capillary action. The second stage of evaporation predominantly occurs within the material medium. As free water on the surface evaporates, the free water within the pores also initiates an evaporation process. Internal water vapor diffuses to the surface through molecular diffusion and subsequently evaporates into the air.
Figure 12 compares the hourly evaporation rates and cumulative evaporation over time for the aforementioned three saturated porous tile samples. It is evident that the hourly evaporation rates for the porous tiles closely follow the fluctuations in solar radiation. The specimens exhibited substantial evaporation during the daytime but minimal evaporation at night, underscoring the predominant influence of solar radiation intensity on water evaporation. At noon on the first day after water spraying, both the HCCT-W and HCCT-R specimens reached similar peak evaporation rates, at approximately 0.63 kg/(m2·h) and 0.61 kg/(m2·h), respectively, while the evaporation rate of the PFCT specimen was only 0.42 kg/(m2·h). However, these rates decreased to nearly zero during the night. This is attributed to the porous ceramics absorbing moisture from the near-surface air at night. On the second day, the evaporation rates of all specimens declined to varying degrees. The HCCT-R specimen peaked at an evaporation rate of about 0.61 kg/(m2·h), while the HCCT-W specimen was only approximately 0.52 kg/(m2·h), with the difference between the two gradually widening. This is attributable to the fact that when their initial water retention volumes are equal, the HCCT-R specimen has a lower surface solar radiation reflectance; thus, road surfaces built with this material would be more prone to water evaporation due to its increased capacity to absorb solar radiation. Regarding 48 h cumulative evaporation, the HCCT-R specimen sustained evaporative cooling for a longer duration than the HCCT-W specimen (Figure 12b).

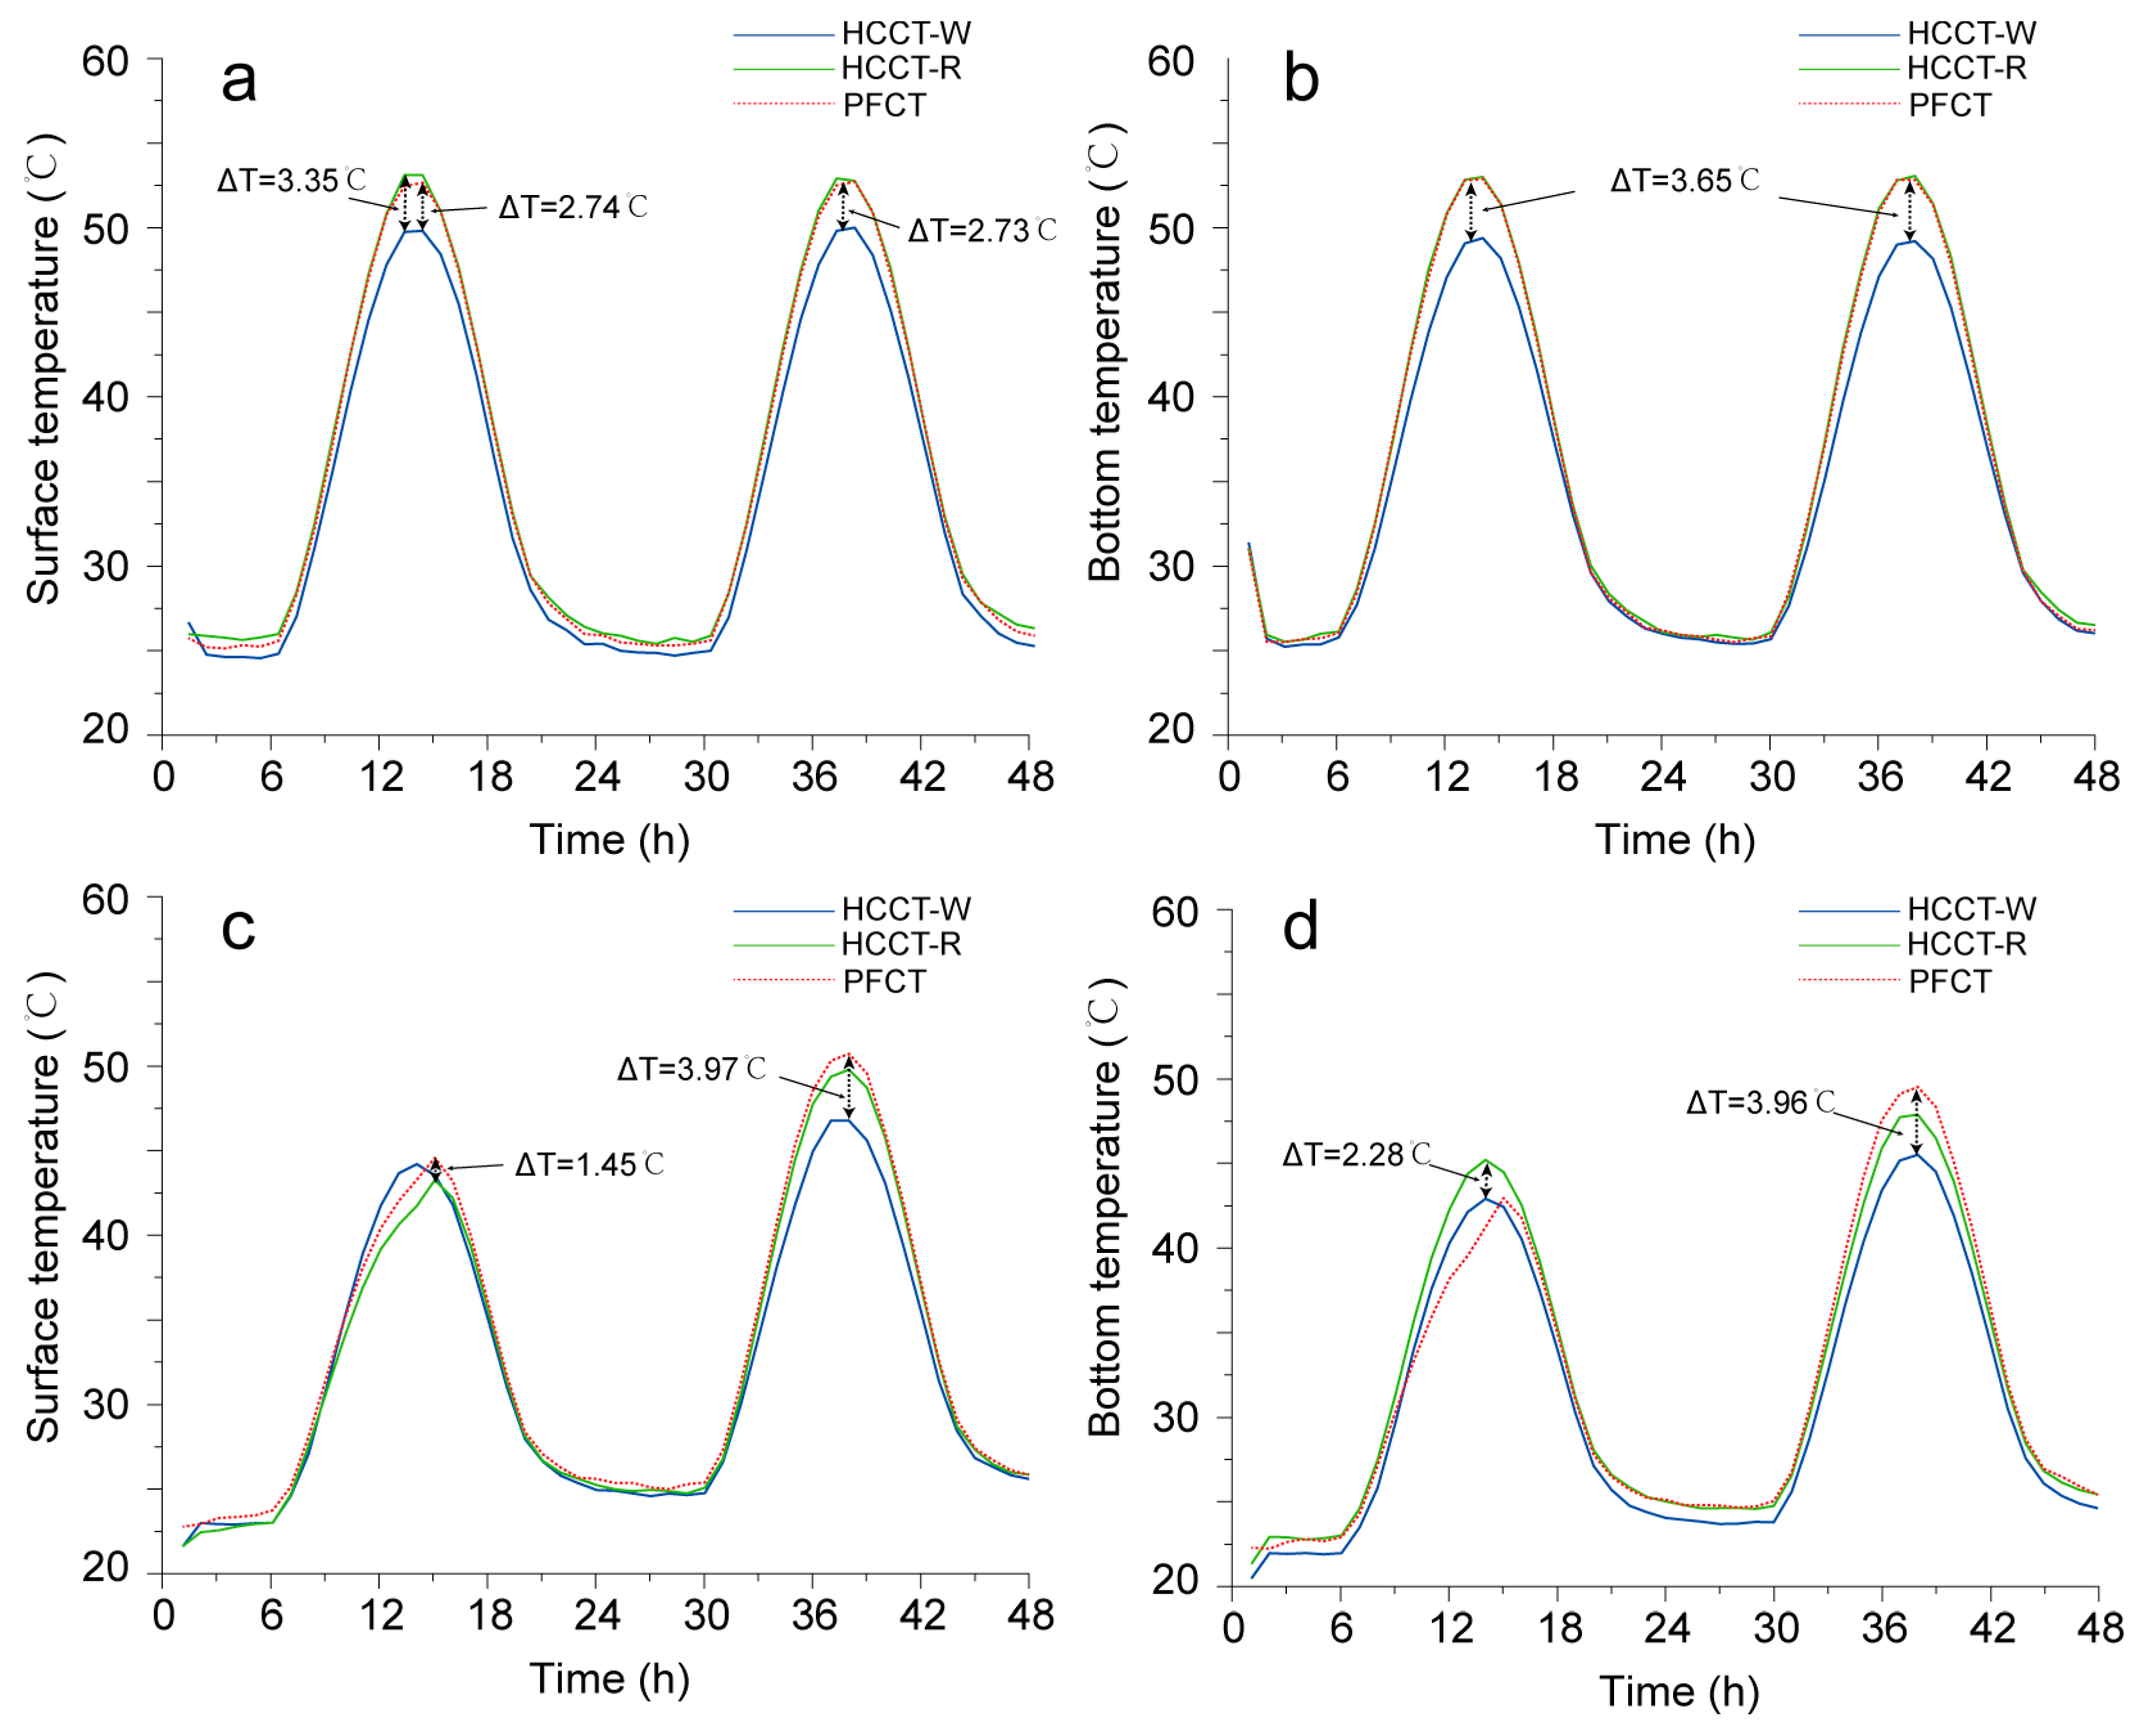
3.3.3. Temperature Profile

Figure 13 shows that the temperature at various points within the three porous tile specimens exhibits periodic fluctuations due to the influence of outdoor weather conditions. The surface temperature exhibits the following characteristics:
In the dry state (Figure 13a,b), the PFCT specimen had the highest temperature (52.0 °C), followed by the HCCT-R specimen (51.8 °C), and then the HCCT-W specimen (48.9 °C). This variation may be related to surface reflectivity, as surfaces with higher reflectivity tend to absorb less solar radiation. At night, the surface temperatures of the HCCT specimens were slightly lower than that of the PFCT. This is due to the high emissivity of porous ceramic, allowing for the dissipation of surface heat through thermal radiation heat transfer at night, resulting in a decrease in the nighttime surface temperature.
In the wet state (Figure 13c,d), the temperatures of the three porous tile specimens decreased by 5–8 °C compared to the dry state, and this cooling effect lasted for 20–30 h. This reduction is the outcome of forced heat exchange due to the latent heat of water evaporation and the temperature difference between the water and the porous tiles. This suggests that water spraying can significantly reduce the surface temperature of ceramic-tile walls during the day, mitigating the overall building’s energy consumption. Notably, in the high-speed evaporation stage, water is continuously transported from the saturated layer to the material surface, and the evaporative cooling characteristics are mainly affected by meteorological conditions. Therefore, the temperature curves of the three porous ceramics show almost the same trend. This result is consistent with the findings reported by Wang et al. [13]. They suggested that in the whole evaporation process, about 60–70% of heat is lost in the first stage of evaporation so that the material can maintain a low temperature for a certain amount of time. At this time, the amount of evaporation that occurs is controlled by the heat distribution. With the depletion of water inside the porous material, the heat flow distribution during evaporation in the second stage gradually changes to be controlled by reflectivity. On the second day of our experiment, the maximum temperatures of HCCT-W and HCCT-W rose slower than that of the PFCT under the same heat source, with maximum temperature drops of 3.9 °C and 3.2 °C, respectively. A similar trend could be observed in the minimum temperature data, which are presented in Figure 13d. Hence, the temperature results confirm that our innovative HCCTs can increase the length of the first stage of evaporation, thereby increasing the evaporation rate and prolonging the evaporative cooling effect.

3.4. Numerical Calculation of Heat and Moisture Transfer Process in HCCTs

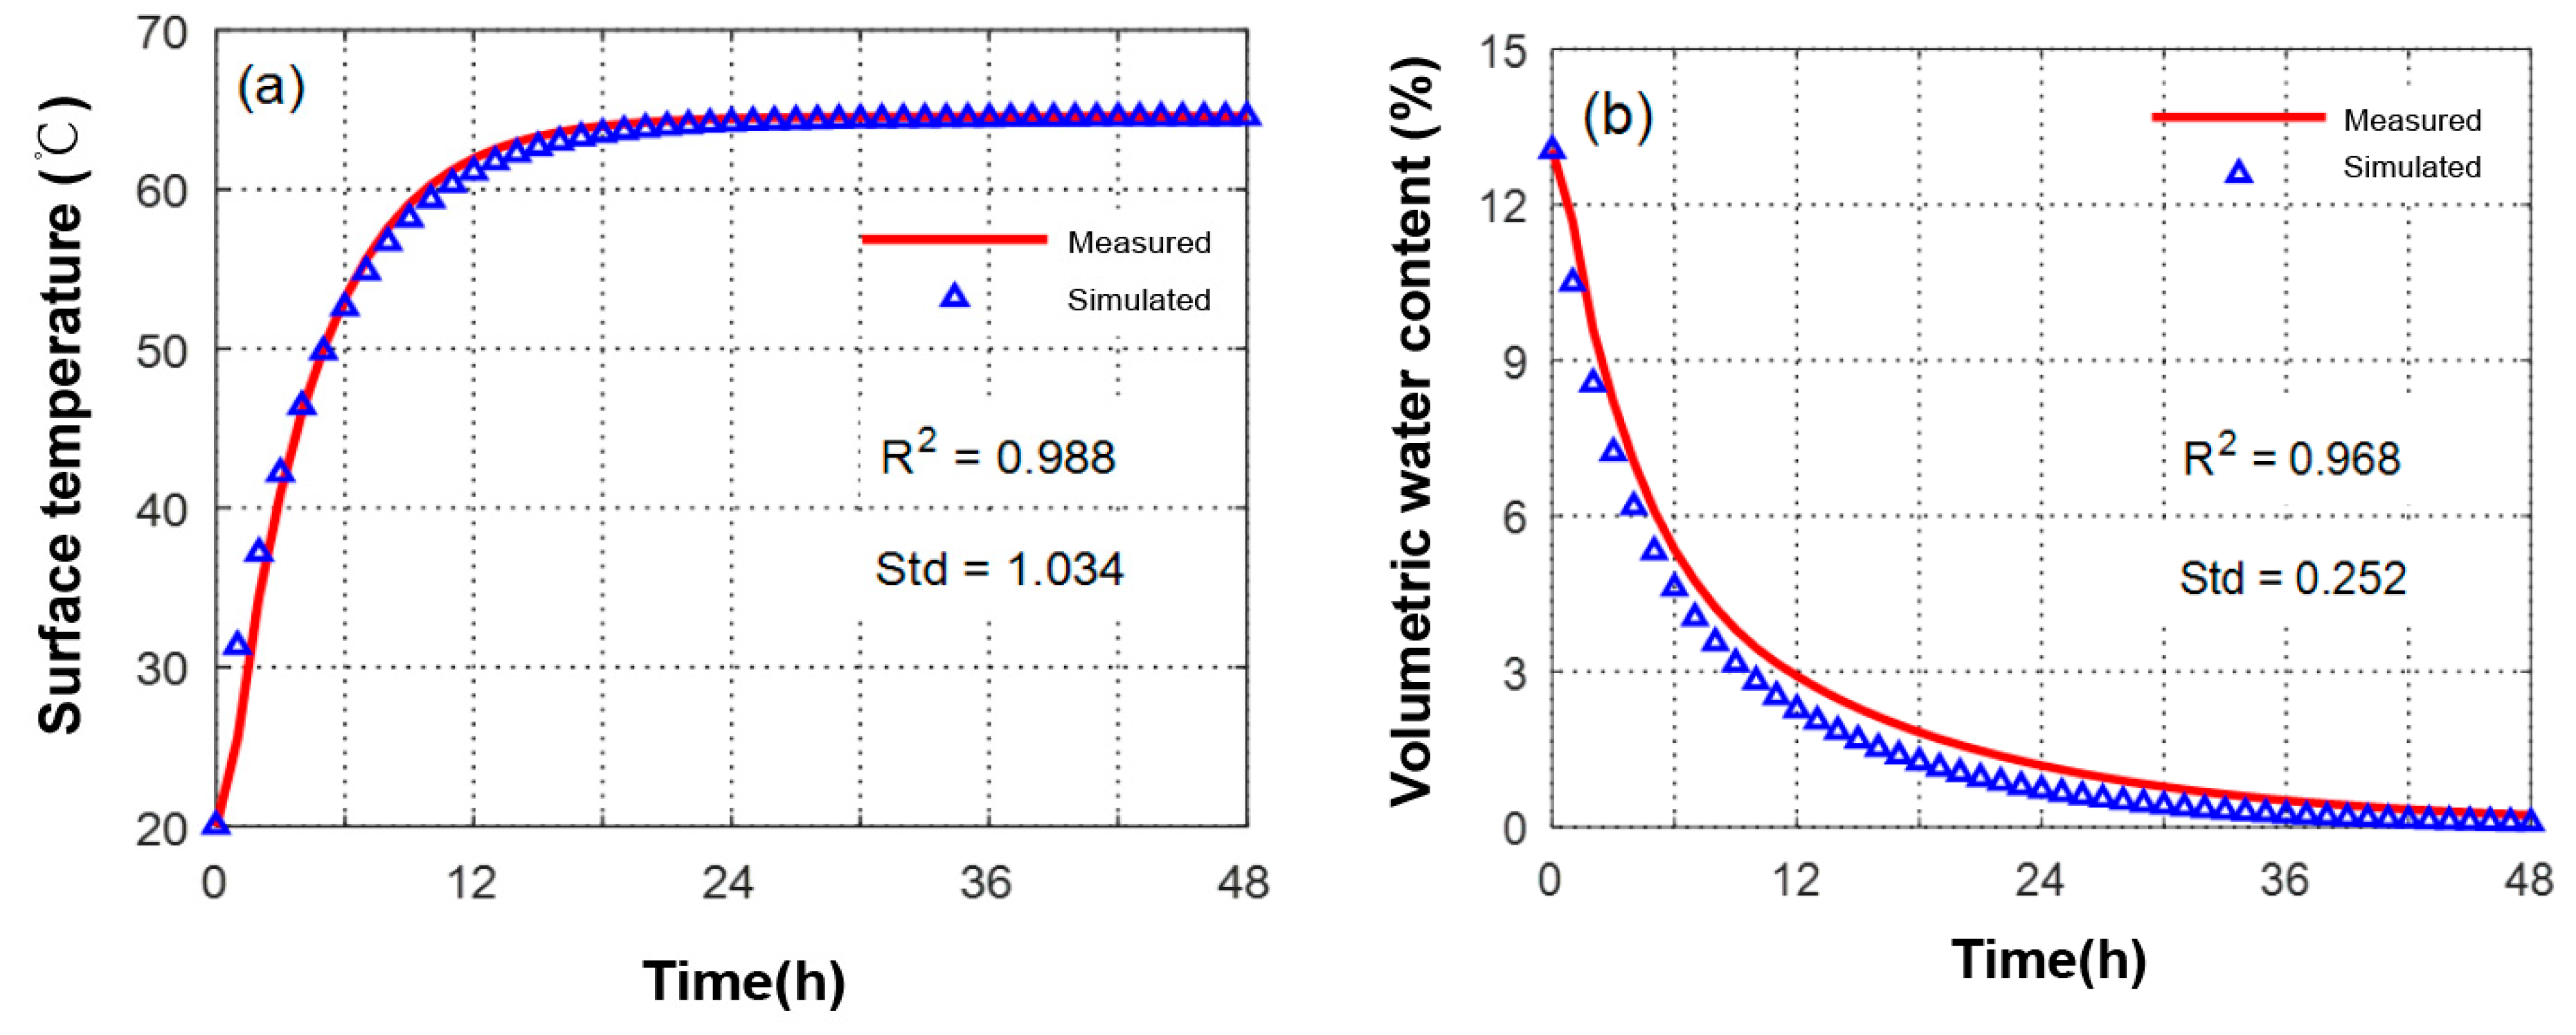
3.4.1. Validation Model

As shown in Figure 14, the surface and volume moisture content changes of the HCCTs were simulated, wherein the ambient temperature of the HCCTs in the wind tunnel was 33 °C, the ambient wind speed was 1.5 m/s, the ambient relative humidity was 60%, and the net radiant heat flow was 500 W/m2. It can be seen that the two curves of temperature change have a high degree of fitting: R2 = 0.98; Std = 1.034 °C. In addition, there is a certain deviation between the simulated calculations of the volumetric moisture content of the HCCTs and the measured values, which may be due to fluctuations in the meteorological parameters in the wind-tunnel environment resulting in the measured values being slightly higher than the simulated values.

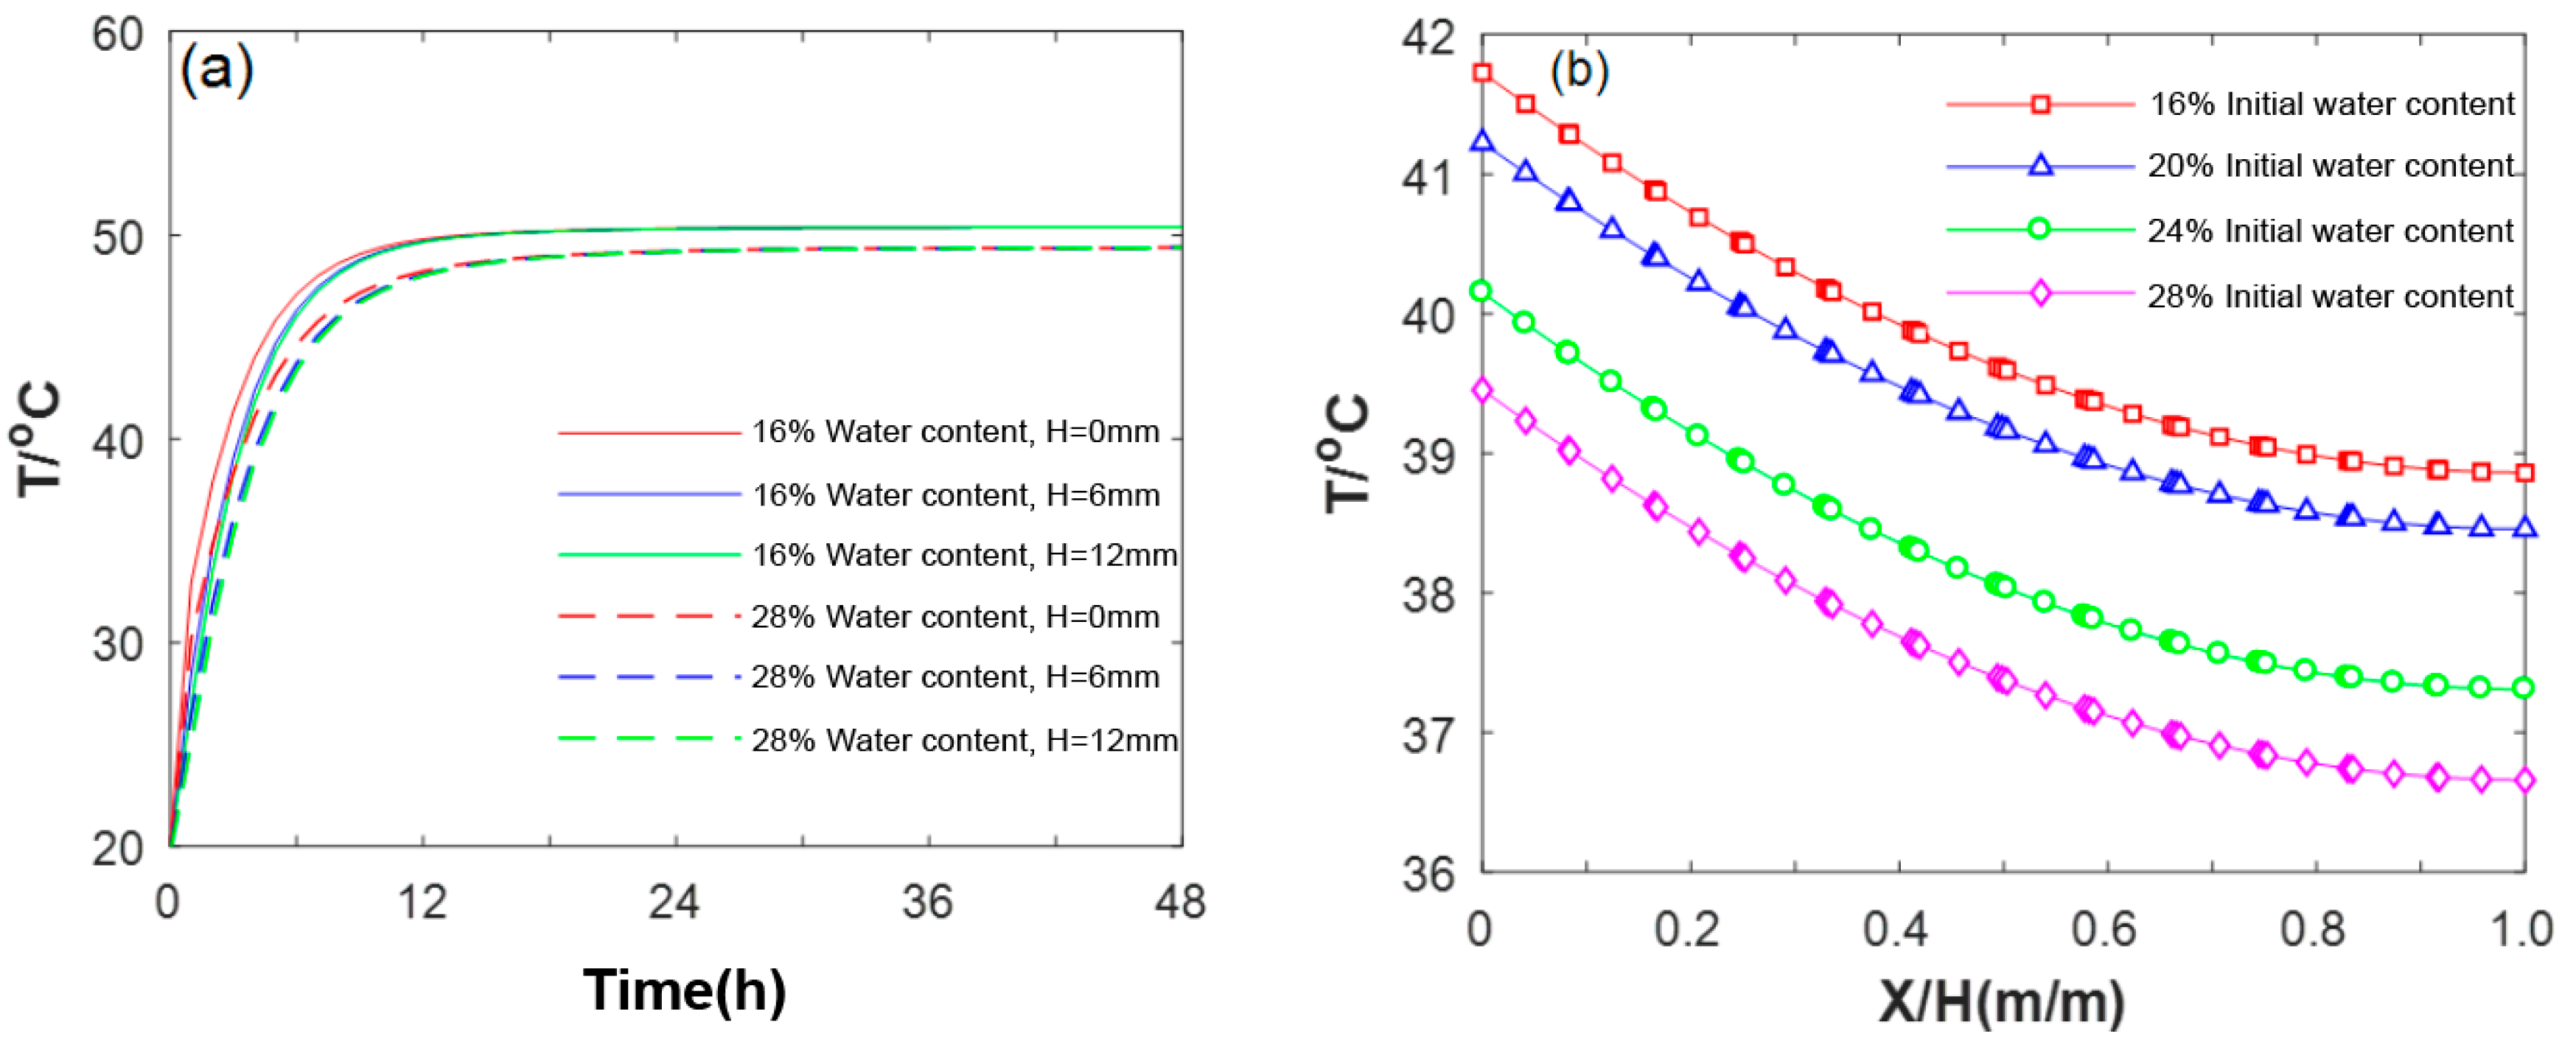
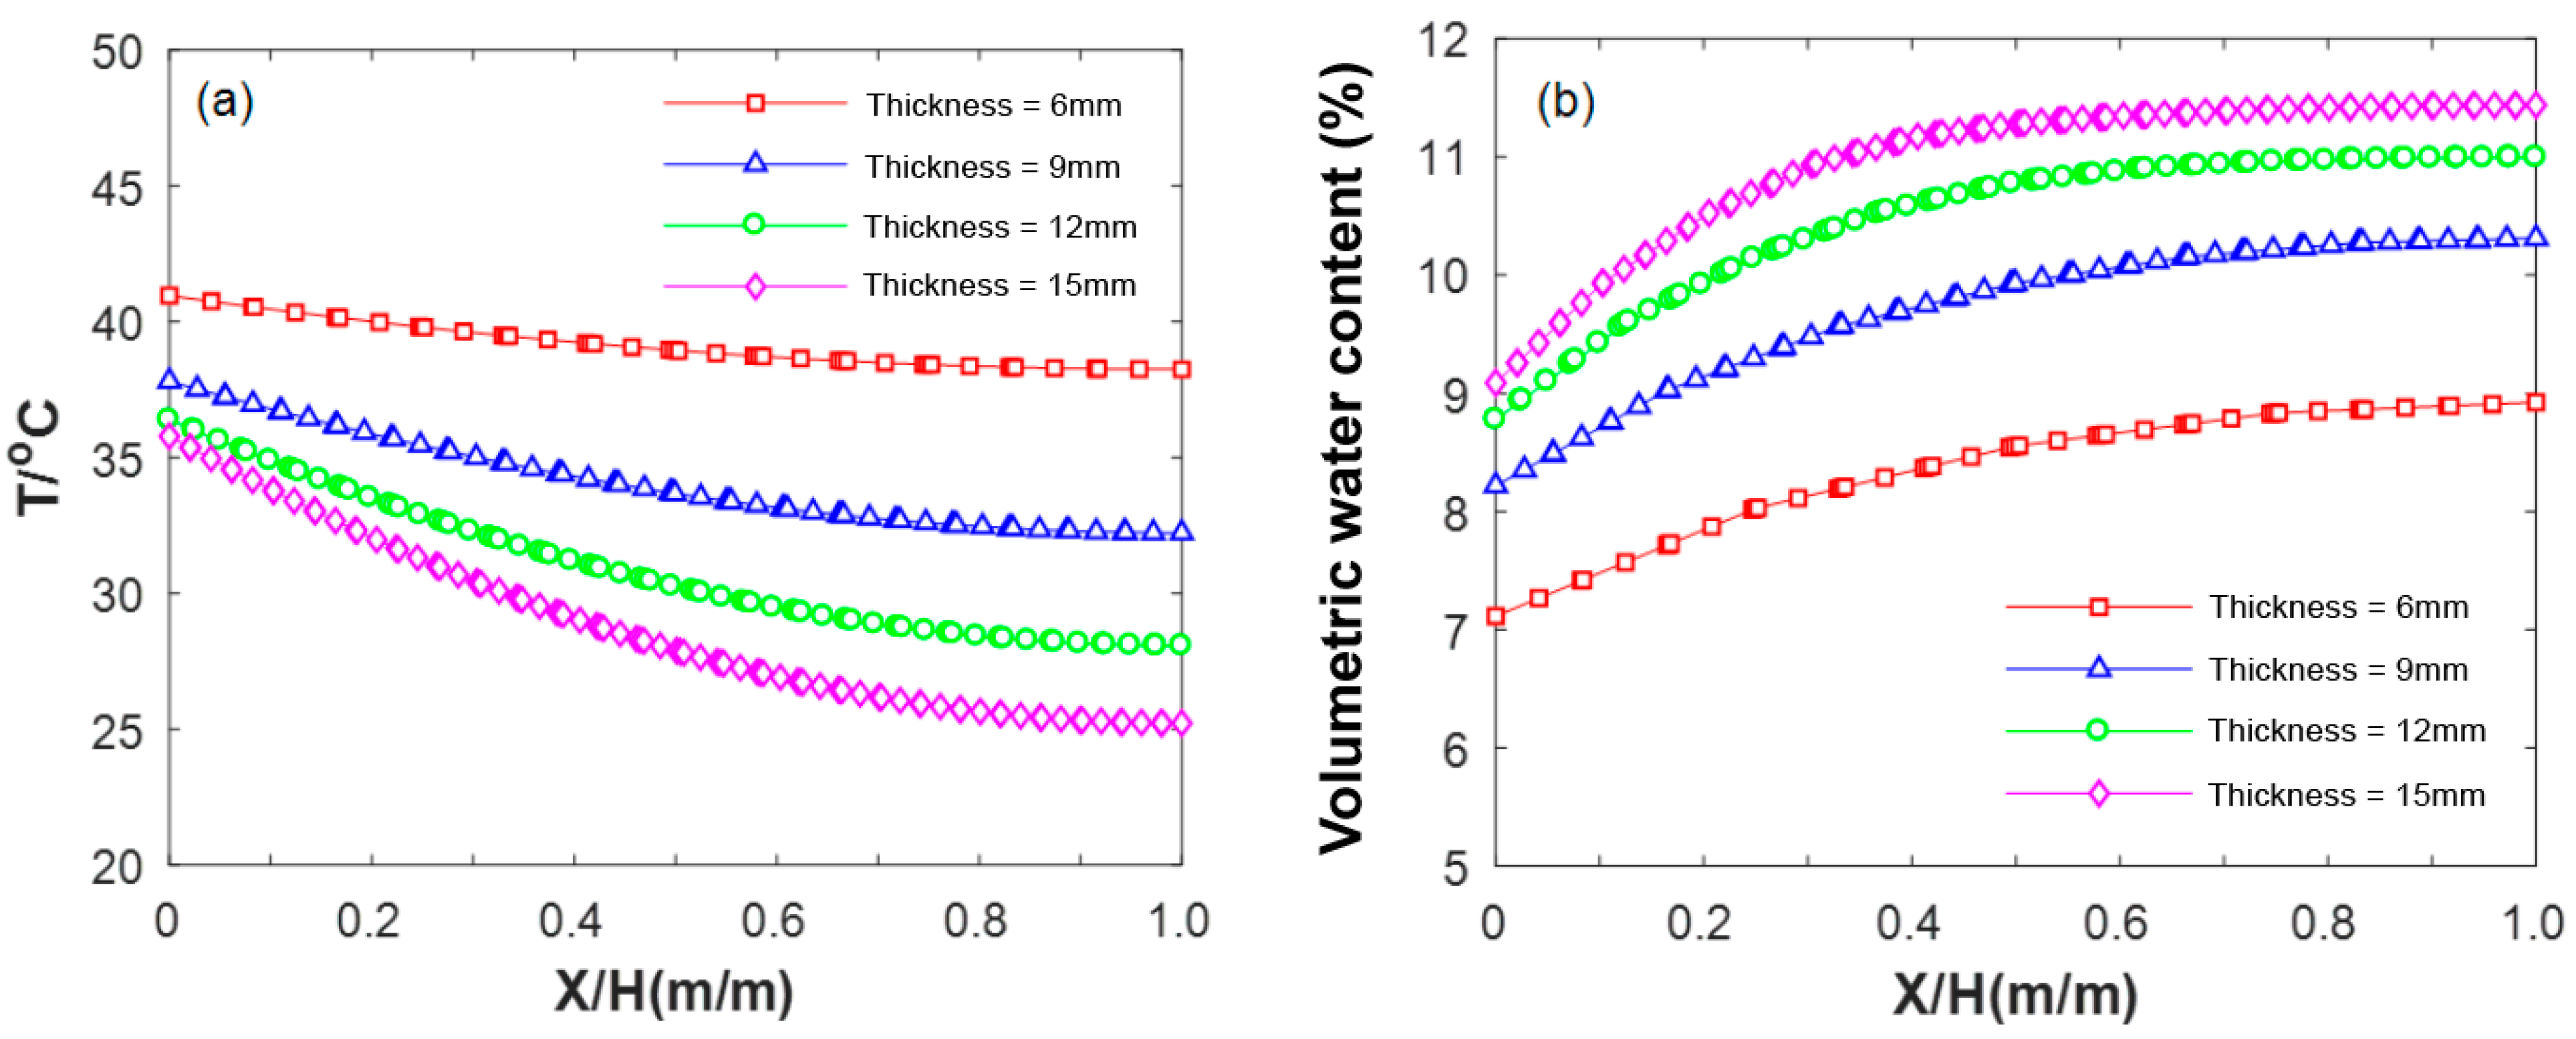
3.4.2. Factors Influencing Heat and Moisture Transfer of HCCTs

(1)
Volumetric water content
Figure 15a illustrates the results pertaining to the influence of the volumetric water content on the internal temperature field of the HCCTs. It can be seen from this figure that the temperature variations reveal a gradual decrease in the temperature gradient in accordance with the thickness of the material. HCCTs with a higher water content maintain a larger temperature gradient, contributing to their enhanced heat transfer capacity. For example, the temperatures of the HCCTs with a 16% volumetric water content at thicknesses of 0 mm, 6 mm, and 12 mm were 39.1 °C, 36.8 °C, and 36.0 °C, respectively. In comparison, at a 28% volumetric water content, the corresponding temperatures were 41.3 °C, 39.1 °C, and 38.2 °C, representing increases of 2.25 °C, 2.19 °C, and 2.15 °C, respectively. Furthermore, in HCCTs with a higher water content, the capillary force of water, unable to overcome gravity, initiates a water redistribution process, leading to increased liquid-phase movement speed and higher convection intensity. Simultaneously, strong phase transitions at the liquid-gas interface enhance heat transfer speed in HCCTs, resulting in a slower temperature rise. Figure 15b further details the temperature distribution among HCCTs of different thicknesses after 3 h of evaporation. The observations presented in this figure reveal a gradual decrease in the temperature gradient as the thickness increases. Notably, HCCTs with a higher water content demonstrate an ability to maintain a larger temperature gradient, contributing to their substantial heat transfer capacity. This phenomenon is a key factor influencing the enhanced heat transfer capacity of HCCTs with a high initial moisture content.
(2)
Porosity
Figure 16a shows the results pertaining to the influence of different porosity levels on the internal temperature field of HCCTs in the early stage of evaporation (3 h). The temperature at each point within the brick exhibits a linear decrease with increasing porosity. However, a nuanced observation reveals a gradual temperature decrease as the thickness increases, resulting in an increasing gap between the three points. For instance, in permeable bricks with 25% porosity, the maximum temperatures at 0 cm, 3 cm, and 6 cm are 41.1 °C, 39.2 °C, and 38.5 °C, respectively. In comparison, HCCTs with 10% porosity have maximum temperatures of 40.5 °C, 37.9 °C, and 36.7 °C at the corresponding points. The former values are lower by 0.6 °C, 1.3 °C, and 1.8 °C, respectively. This temperature difference arises due to the higher thermal diffusivity of air compared to that of HCCTs. Consequently, a larger air content results in a faster temperature change in the HCCTs. Additionally, the heat capacity of air is smaller than that of permeable bricks, and as their porosity increases, the heat capacity of HCCTs decreases, leading to larger temperature fluctuations. Figure 16b depicts changes in the volumetric water content of the HCCTs alongside their varying porosity. Remarkably, porosity has minimal influence on the changes in bulk moisture content within the brick, exhibiting a consistent trend. The overall moisture change results effectively reflect the pattern of water migration. However, the distribution of volumetric moisture content in the HCCTs along the depth-wise direction demonstrates notable non-monotonic changes; further investigations are required to elucidate the underlying factors causing these changes.
(3)
Thickness
Figure 17a presents the results illustrating the impact of different thicknesses on the internal temperature field of HCCTs. Notably, the surface temperature of the brick decreases with an increase in thickness, and this temperature difference intensifies with greater depth. For instance, during the early stages of evaporation (3 h), the surface layer temperatures of bricks with thicknesses of 6 mm, 9 mm, 12 mm, and 15 mm are 41.0 °C, 37.8 °C, 36.4 °C, and 35.8 °C, respectively. In comparison, the corresponding temperatures of the bottom layer are 38.2 °C, 32.2 °C, 28.1 °C, and 25.2 °C, respectively. The former are lower than the latter by 2.7 °C, 5.6 °C, 8.3 °C, and 10.6 °C, respectively. This observation indicates that water migrates from the lower layer to the surface layer, emphasizing the significant role of gravity in influencing water migration. When the brick thickness reaches 15 mm, the moisture in the HCCT can no longer overcome the internal resistance to reach the surface for evaporation. This implies that further increasing the thickness of the brick contributes negligibly to the cooling effect. A similar phenomenon is also evident in its impact on the volumetric water content of the HCCTs (Figure 17b). Considering both thermal and moisture-related performance, the HCCT thickness correlates with the evaporative cooling effect of the road surface. Consequently, it is recommended that the thickness of each brick does not exceed 15 mm.

4. Conclusions

This study investigates the preparation and performance of HCCTs using volcanic ash with a nanoporous structure and potassium–sodium powder with a high alkali content as the primary raw materials, as well as SMO as an additive. This research explores the impact of SMO addition and the amount of glaze coating on the humidity-controlling capabilities of HCCTs, resulting in the following key findings:
(1) The inclusion of SMO substantially improves the flexural strength and water absorption of HCCTs. Specifically, with a 2% SMO content, our HCCTs achieved a flexural strength of 11.6 MPa and a water absorption rate of 480 g/m2. Microstructural analysis revealed the formation of CSH and an increase in mesopores within the HCCTs, contributing significantly to the enhancement of both their mechanical properties and their humidity-controlling properties.
(2) With a 2% SMO content and a glaze coating of 70 g/m2, HCCTs sintered at 700 °C exhibit an average flexural strength of 15.2 MPa and a water absorption rate of 385 g/m2 under high-humidity conditions. These results align with the standards outlined in GB/T 4100-2015 [23].
(3) Our innovative HCCTs have a rich porous-structure network that can improve their water storage capacity, and their cumulative water absorption capacity is up to 40% higher than that of a PFCT. Under dry conditions, the surface temperature of the porous tiles during the day is controlled by their reflectance; in contrast, humidified tiles have better heat dissipation at night. In the wet condition, the temperature of HCCT-W and HCCT-R pavement is 5–8 °C lower than that of the PFCT material, and HCCT-W pavement has a longer cooling time.
(4) Under the action of temperature gradient, the temperature of a high-moisture-content HCCT is less than that of a low-moisture-content one. The temperature of an HCCT decreases linearly with the increase in its porosity, but this temperature difference decreases gradually with increases in the HCCT’s thickness. Water migration of HCCTs with higher thicknesses is obviously affected by gravity, and water migrates from top to bottom under the action of gravity. It is recommended that the thickness of an HCCT should not be more than 15 mm.
Future work should focus on the long-term performance and durability of HCCTs under various environmental conditions. Optimizing the SMO content and exploring additional additives can enhance both mechanical and humidity-controlling properties. Developing advanced 3D numerical models will provide deeper insights into HCCTs’ heat and moisture transfer mechanisms. A comprehensive environmental impact assessment, including life-cycle analyses, is crucial for evaluating the sustainability-related benefits of HCCTs. Scaling-up HCCT production and applying it in real-world scenarios will be vital for encouraging their broader adoption. Exploring different glaze formulations to enhance reflectivity, thermal properties, and aesthetic appeal can increase HCCTs’ versatility. Despite promising results, this study could be improved through efforts to more directly correlate HCCT performance with urban heat island mitigation, quantifying potential temperature reductions and their impacts on urban microclimates. Addressing these areas will further improve the effectiveness of HCCTs in mitigating urban heat islands.

Author Contributions

Investigation, K.T.; Writing—original draft, X.J.; Writing—review & editing, Z.Z.; Supervision, J.W. All authors have read and agreed to the published version of the manuscript.

Funding

The author would like to thank the National Natural Science Foundation of China (No. 51878287), Guangdong Provincial Department of Education Innovation Team Project (No. 2023KCXTD071), Guangzhou Yangcheng Scholar Project (No. 202235323) and the China Postdoctoral Science Foundation (No. 2024M750943).

Data Availability Statement

The original contributions presented in the study are included in the article, further inquiries can be directed to the corresponding author.

Conflicts of Interest

The authors declare no conflict of interest.

References

  1. Maka, A.O.; Alabid, J.M. Solar energy technology and its roles in sustainable development. Clean Energy 2022, 6, 476–483. [Google Scholar] [CrossRef]
  2. Zhang, L.; Zhang, R.; Zhang, Y.; Hong, T.; Meng, Q.; Feng, Y. The impact of evaporation from porous tile on roof thermal performance: A case study of Guangzhou’s climatic conditions. Energy Build. 2017, 136, 161–172. [Google Scholar] [CrossRef]
  3. Wang, J.; Meng, Q.; Yang, C.; Ren, P.; Santamouris, M. Spray optimization to enhance the cooling performance of transparent roofs in hot-humid areas. Energy Build. 2023, 286, 112929. [Google Scholar] [CrossRef]
  4. Zhang, Y.; Zhang, L.; Pan, Z.; Meng, Q.; Feng, Y.; Chen, Y. Hydrological properties and solar evaporative cooling performance of porous clay tiles. Constr. Build. Mater. 2017, 151, 9–17. [Google Scholar] [CrossRef]
  5. Li, L.; Xu, F.; Tang, H.; Wang, J.; Meng, Q. Experimental and theoretical study on cooling performance of membrane roof with circulated water film. Constr. Build. Mater. 2023, 403, 133115. [Google Scholar] [CrossRef]
  6. Zhang, L.; Zhang, R.; Hong, T.; Zhang, Y.; Meng, Q. Impact of post-rainfall evaporation from porous roof tiles on building cooling load in subtropical China. Appl. Therm. Eng. 2018, 142, 391–400. [Google Scholar] [CrossRef]
  7. Mao, H.; Meng, Q.; Liu, Z.; Wang, S.; Wang, J. A comprehensive evaluation of water spray system on transparent roof towards optimal operation schedule. Build. Environ. 2023, 242, 110590. [Google Scholar] [CrossRef]
  8. He, J.; Hoyano, A. Experimental study of practical applications of a passive evaporative cooling wall with high water soaking-up ability. Build. Environ. 2011, 46, 98–108. [Google Scholar] [CrossRef]
  9. He, J.; Hoyano, A. Experimental study of cooling effects of a passive evaporative cooling wall constructed of porous ceramics with high water soaking-up ability. Build. Environ. 2010, 45, 461–472. [Google Scholar] [CrossRef]
  10. Hall, M.R. Assessing the environmental performance of stabilised rammed earth walls using a climatic simulation chamber. Build. Environ. 2007, 42, 139–145. [Google Scholar] [CrossRef]
  11. Zhang, Y.; Zhang, L.; Meng, Q.; Feng, Y.; Chen, Y. A dynamic experimental study on the evaporative cooling performance of porous building materials. Heat Mass Transf. 2017, 53, 2651–2662. [Google Scholar] [CrossRef]
  12. Pan, Z.; Meng, Q.; Li, Q.; Xie, J.; Liu, J. Evaporative cooling of porous tiles with seawater in a tropical climate with salty humid air. Constr. Build. Mater. 2019, 204, 727–739. [Google Scholar] [CrossRef]
  13. Wang, J.; Santamouris, M.; Meng, Q.; He, B.-J.; Zhang, L.; Zhang, Y. Predicting the solar evaporative cooling performance of pervious materials based on hygrothermal properties. Sol. Energy 2019, 191, 311–322. [Google Scholar] [CrossRef]
  14. Tian, W.; Shui, A.; Ke, S.; Huang, L.; Xi, X.; He, C.; Chen, W.; Du, B. Low-temperature preparation of humidity self-regulating porous ceramics with high strength performance. Mater. Lett. 2019, 243, 128–131. [Google Scholar] [CrossRef]
  15. Dal, S.; Sutcu, M.; Gok, M.S.; Gencel, O. Characteristics of lightweight diatomite-based insulating firebricks. J. Korean Ceram. Soc. 2020, 57, 184–191. [Google Scholar] [CrossRef]
  16. Vu, D.-H.; Wang, K.-S.; Bac, B.H. Humidity control porous ceramics prepared from waste and porous materials. Mater. Lett. 2011, 65, 940–943. [Google Scholar] [CrossRef]
  17. Tian, W.; Du, B.; Shui, A.; Ke, S.; Shan, Q.; He, C.; Ma, J. Template-free preparation of humidity self-regulating silica-based mesoporous oxide from volcanic ash. J. Sol-Gel Sci. Technol. 2020, 94, 416–424. [Google Scholar] [CrossRef]
  18. ASTM C78/C78M-2015a; Standard Test Method for Flexural Strength of Concrete (Using Simple Beam with Third-Point Loading). ASTM: West Conshohocken, PA, USA, 2015.
  19. ASTM C1585e13; Standard Test Method for Measurement of Rate of Absorption of Water by Hydraulic-Cement Concretes. ASTM: West Conshohocken, PA, USA, 2013.
  20. JGJ 286-2013; Design Standard for Thermal Environment of Urban Residential Areas. Ministry of Housing and Urban-Rural Development: Beijing, China, 2013.
  21. Black, L.; Stumm, A.; Garbev, K.; Stemmermann, P.; Hallam, K.R.; Allen, G.C. X-ray photoelectron spectroscopy of aluminium-substituted tobermorite. Cem. Concr. Res. 2005, 35, 51–55. [Google Scholar] [CrossRef]
  22. GB/T 4100-2015; Ceramic Tiles. China National Standardization Administration: Beijing, China, 2015.
  23. JC/T 2082-2011; Humidification Function Interior Building Decoration Materials. Ministry of Science and Technology of the People’s Republic of China: Beijing, China, 2011.
Figure 1. Schematic representation of the preparation process for an innovative HCCT.
Atmosphere 15 00964 g001
Figure 2. Test specimens were subjected to an evaporation cooling experiment in a wind-tunnel device.
Atmosphere 15 00964 g002
Figure 3. The wind tunnel reproduced typical meteorological daily parameters of Guangzhou.
Atmosphere 15 00964 g003
Figure 4. Sample evaporation measurement unit: (a) top view; (b) section view.
Atmosphere 15 00964 g004
Figure 5. Geometric physical model of an HCCT.
Atmosphere 15 00964 g005
Figure 6. Effect of different SMO contents on the properties of HCCTs: (a) flexural strength; (b) water absorption.
Atmosphere 15 00964 g006
Figure 7. Effect of different SMO contents on the XRD patterns of HCCTs.
Atmosphere 15 00964 g007
Figure 8. XPS spectra of HCCTs prepared with 2% SMO.
Atmosphere 15 00964 g008
Figure 9. Microstructural analysis of HCCTs: (a) SEM images of HCCTs without SMO addition; (b) SEM images of HCCTs with 2% SMO addition; (c) N2 adsorption–desorption curves and pore size distribution for HCCTs with 2% SMO and without SMO.
Atmosphere 15 00964 g009
Figure 10. Adsorbed moisture content curve for glazed HCCTs prepared with varied amounts of sprayed glaze.
Atmosphere 15 00964 g010
Figure 11. Cumulative water absorption of three different porous tile specimens.
Atmosphere 15 00964 g011
Figure 12. Evaporation profiles of three different porous tile specimens: (a) hourly evaporation rate; (b) cumulative evaporation.
Atmosphere 15 00964 g012
Figure 13. Surface temperature of three different porous tile specimens: (a,b) under dry conditions; (c,d) under wet conditions.
Atmosphere 15 00964 g013
Figure 14. Simulated and measured values in the evaporation process of HCCTs: (a) surface temperature; (b) volumetric water content.
Atmosphere 15 00964 g014
Figure 15. Temperature field of HCCTs: (a) temperature variation at different thicknesses; (b) temperature distribution across different initial water contents.
Atmosphere 15 00964 g015
Figure 16. Influence of porosity on temperature–moisture field in HCCTs: (a) temperature; (b) moisture.
Atmosphere 15 00964 g016
Figure 17. Influence of thickness on temperature–moisture field in HCCTs: (a) temperature; (b) moisture.
Atmosphere 15 00964 g017
Table 1. Chemical compositions of the primary materials (wt%).
MaterialsSiO2Al2O3Fe2O3TiO2CaOMgOK2ONa2O
Volcanic powder 67.9212.441.120.153.144.120.431.15
Potassium–sodium powder72.4313.380.060.080.430.018.065.29
Low-temperature melt27.321.050.133.123.451.122.8911.63
SMO91.111.920.080.140.50.010.280.22
Table 2. Thickness and physical parameters of an HCCT.
MaterialThickness
(mm)
Density
(kg/m3)
Heat Capacity
(J/(kg·K))
Thermal Conductivity
(W(m·°C))
Porosity
(%)
HCCT1217009001.520
Table 3. Water absorption properties of the three porous tile specimens.
MaterialS1
(×10−2 mm/s0.5)
S2
(×10−2 mm/s0.5)
Wvap
(kg/m3)
Open Porosity
(%)
MeanSD*MeanSD*Mean SD*Mean SD*
PFCT 4.920.2510.040.034130.854.20535.050.124
HCCT-W3.690.3120.070.052173.395.03136.980.261
HCCT-R3.650.1230.070.047177.414.93636.240.173
S1—initial rate of sorptivity; S2—secondary rate of sorptivity; Wvap—total water absorption capacity; SD*—standard deviation.
Disclaimer/Publisher’s Note: The statements, opinions and data contained in all publications are solely those of the individual author(s) and contributor(s) and not of MDPI and/or the editor(s). MDPI and/or the editor(s) disclaim responsibility for any injury to people or property resulting from any ideas, methods, instructions or products referred to in the content.

