Article

The Evaluation of Rainfall Forecasting in a Global Navigation Satellite System-Assisted Numerical Weather Prediction Model

1
Xi’an Meteorological Bureau, Xi’an 710016, China
2
Key Laboratory of Transportation Meteorology, Nanjing Joint Institute for Atmospheric Sciences, China Meteorological Administration, Nanjing 210041, China
3
Key Laboratory of Ecological Environment Meteorology in Qinling and Loess Plateau, Xi’an 710014, China
4
College of Geomatics, Xi’an University of Science and Technology, Xi’an 710054, China
5
PowerChina Northwest Engineering Corporation Limited, Xi’an 710065, China
*
Author to whom correspondence should be addressed.
Atmosphere 2024, 15(8), 992; https://doi.org/10.3390/atmos15080992
Submission received: 15 July 2024 / Revised: 12 August 2024 / Accepted: 15 August 2024 / Published: 17 August 2024
(This article belongs to the Special Issue Characteristics of Extreme Climate Events over China)

Abstract

:
Accurate water vapor information is crucial for improving the quality of numerical weather forecasting. Previous studies have incorporated tropospheric water vapor data obtained from a global navigation satellite system (GNSS) into numerical weather models to enhance the accuracy and reliability of rainfall forecasts. However, research on evaluating forecast accuracy for different rainfall levels and the development of corresponding forecasting platforms is lacking. This study develops and establishes a rainfall forecasting platform supported by the GNSS-assisted weather research and forecasting (WRF) model, quantitatively assessing the effect of GNSS precipitable water vapor (PWV) on the accuracy of WRF model forecasts for light rain (LR), moderate rain (MR), heavy rain (HR), and torrential rain (TR). Three schemes are designed and tested using data from seven ground meteorological stations in Xi’an City, China, in 2021. The results show that assimilating GNSS PWV significantly improves the forecast accuracy of the WRF model for different rainfall levels, with the root mean square error (RMSE) improvement rates of 8%, 15%, 19%, and 25% for LR, MR, HR, and TR, respectively. Additionally, the RMSE of rainfall forecasts demonstrates a decreasing trend with increasing magnitudes of assimilated PWV, particularly effective in the range of [50, 55) mm where the lowest RMSE is 3.58 mm. Moreover, GNSS-assisted numerical weather model shows improvements in statistical forecasting indexes such as probability of detection (POD), false alarm rate (FAR), threat score (TS), and equitable threat score (ETS) across all rainfall intensities, with notable improvements in the forecasts of HR and TR. These results confirm the high precision, visualization capabilities, and robustness of the developed rainfall forecasting platform.

1. Introduction

Numerical weather prediction (NWP) models, through the approximation of mathematical and physical equations under defined initial conditions, not only quantitatively and objectively forecast future meteorological changes, but also provide a critical foundation for advancing meteorological forecasting and research [1]. In these models, the accuracy of initial fields, particularly with regard to water vapor, represents the initial atmospheric moisture conditions, directly influencing the accuracy of weather parameter forecasts, particularly in rainfall forecasts. Consequently, the enhancement in and precise assimilation of water vapor data within the initial fields are recognized as crucial for improving the reliability and quality of NWP forecasts [2,3].
Although it constitutes only 4% of atmospheric constituents, water vapor plays a significant role in climate variability and numerical weather prediction [4]. The pronounced spatiotemporal variability of water vapor complicates the timely and accurate monitoring of its distribution. This condition has been identified as a significant source of errors in the rainfall forecasts of NWP models [5,6]. Precipitable water vapor (PWV) is used to quantify atmospheric water vapor. With the continuous development of global navigation satellite system (GNSS) meteorology and the comprehensive completion of the BDS navigation satellite system (BDS) in China, the new generation of the GNSS observation system with Global Positioning System, BDS, GLONASS, and Galileo as the core has laid an important space infrastructure foundation for the high-precision detection of atmospheric water vapor and meteorological applications [7]. The use of GNSS technology to obtain PWV has gradually become one of the important methods for atmospheric water vapor monitoring [8,9].
At present, the primary factor that constrains the accuracy of NWP is the initial field error of the model [10]. With the wide application of GNSS water vapor observations in NWP models, assimilating GNSS PWV has gradually become one of the effective techniques for reducing the initial field error of the model [11]. With regard to improving the rainfall forecasting capability of the model, Kuo et al. [12] verified for the first time the role of assimilated GNSS PWV data in improving the accuracy of the model’s prediction of a heavy rainfall event in 1979, confirming the ability of GNSS PWV to improve the model’s rainfall forecasting capability. Mateus et al. [13] expanded on this by showing that GNSS-derived PWV data could correct not only humidity but also temperature (T) and wind fields in the NWP model. Yuan et al. [14] found that PWV data improved the model initial field humidity information, resulting in an average improvement of 5% in the threat score (TS) for 6 h of cumulative rainfall forecasts, and the improvement was more pronounced with increasing rainfall. Sharifi et al. [15] further demonstrated a reduction in the mean absolute error (MAE) of 24 h accumulated precipitation forecasts by 13% in northern Iran through the 3D variational assimilation of PWV. Risanto et al. [16] verified that assimilating GNSS PWV reduced the model’s initial field humidity error, creating favorable conditions for rainfall forecasting in northwestern Mexico. Rohm et al. [17] used 4D variational assimilation to assimilate PWV from more than 100 GNSS stations in Poland into the weather research and forecasting (WRF) model, reducing the mean error in vertical relative humidity (RH). In addition, the model assimilation of PWV also resulted in stronger low-level water vapor irradiation, leading to an improvement in the location of precipitation fallout zones [18]. Gong et al. [19] showed that assimilating both GNSS-derived PWV and radiosonde meteorological profiles into the WRF model significantly enhanced the forecasting performance of PWV and rainfall over South China. Specifically, the most comprehensive data assimilation scheme improved rainfall forecast probability of the detection and equitable threat score by 9% and 6%, respectively. Imrišek et al. [20] demonstrated that the assimilation of water vapor from GNSS observations significantly improved rainfall forecasts in Slovakia through a three-dimensional variational analysis. Satellite data are now integral to NWP models, significantly enhancing forecast accuracy through dynamic assimilation. Studies indicate that satellite data account for approximately 64% of the reduction in forecast error in short-range global NWP systems, underscoring their critical role in modern meteorological operations [21]. The Met Office global NWP system leverages a variety of satellite data types, demonstrating the broad usage of satellite inputs in contemporary NWP models [22]. The aforementioned studies have demonstrated that GNSS data have assumed an increasingly important role in weather analyses and forecasting in numerical prediction models. However, the current study has less assessments of forecast accuracy for different rainfall levels and lacks the corresponding research on the construction of rainfall forecasting platforms.
This study is the first to propose a rainfall forecasting platform construction method based on a GNSS-assisted WRF model. Moreover, it quantitatively evaluates the effect of the GNSS PWV-assisted WRF model on rainfall forecasting accuracy.

2. Data and Methods

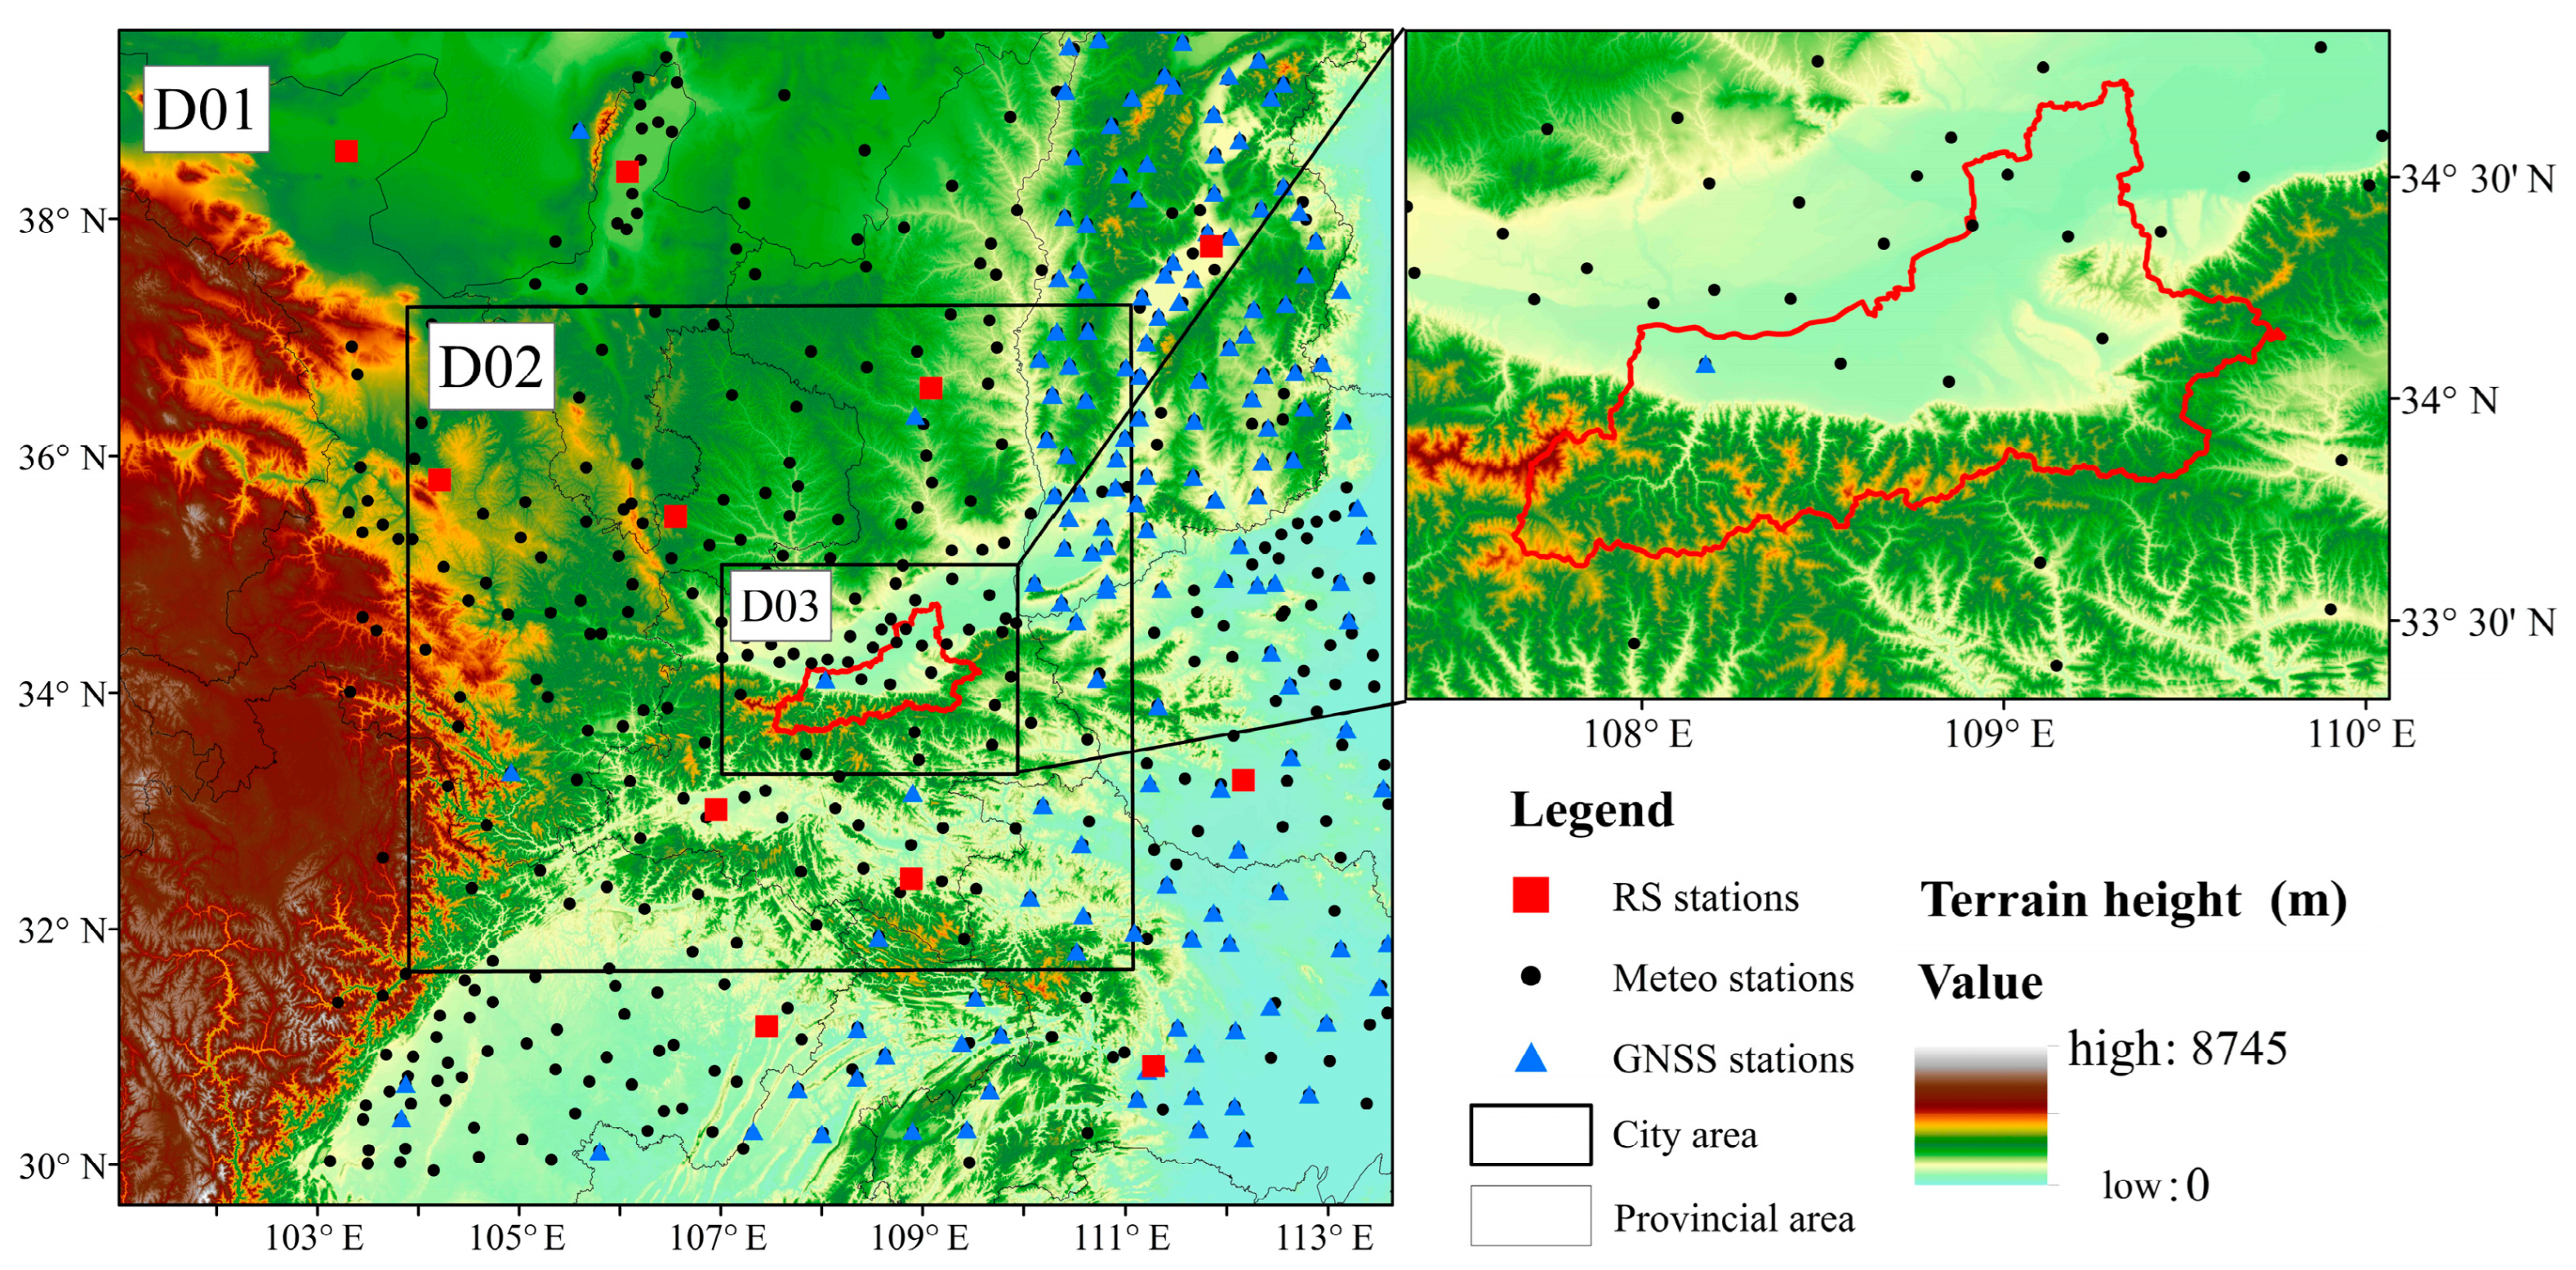
2.1. Data Description

Three types of data are used in this study, GNSS-derived PWV, radiosonde data, and surface meteorological data (including rainfall, RH, surface temperature, and pressure), along with the fifth-generation reanalysis by European Centre for Medium-Range Weather Forecasts (ERA5) reanalysis data, spanning the period from 18 August 2021 at 00:00 to 25 August 2021 at 00:00. In this work, Xi’an City, Shaanxi Province, is selected as the study area, and 11 radiosonde stations, 172 GNSS stations, and 519 ground meteorological stations in Shaanxi Province and the surrounding areas are selected as the observation data required for assimilation. The location distribution of the selected stations is shown in Figure 1. Although the distribution of GNSS stations across the study area is not uniform, they still provide a substantial amount of high-resolution water vapor data, which is crucial for enhancing the initial moisture fields of the WRF model. The assimilation of GNSS-derived PWV into the outer domain of the WRF model significantly benefits the inner nested domains, effectively mitigating the impact of the spatial unevenness of GNSS station distribution.

2.1.1. GNSS PWV Data

The GNSS data used in this experiment are obtained from the Meteorological Observation Center of the China Meteorological Administration, and the temporal resolution of the original GNSS measurements is 30 s. First, observations from GNSS stations are processed using precise point positioning technology to obtain the total zenith tropospheric delay (ZTD). Then, the zenith hydrostatic delay (ZHD) is calculated using the Saastamoinen model [23], with the following formula. Finally, the GNSS observations are further processed into lower resolution (minute-level) PWV using PPP technology. Since the assimilation time window of the WRF model is 1 h, we have selected the PWV data with a 1 h time resolution [24].
ZHD = 0.0022768 · P s 1 0.00266 · cos 2 φ 0.00028 · h
where P s represents the surface pressure (unit: hPa), φ represents the latitude of the station (unit: rad), and h represents the geodetic height of the station (unit: km). In accordance with the calculation ZWD = ZTD ZHD , zenith wet delay (ZWD) was obtained.
PWV can be obtained from ZWD data conversion and calculated using the following formula:
PWV = 10 6 ρ w · R v k 3 / T m + k 2 · ZWD
where ρ w represents the density of liquid water, R v represents the specific gas constant for water vapor (461.51 J/kg/K), T m represents the atmospheric weighted average temperature (unit: K), and k 2 and k 3 represent the atmospheric refractive index constants, which are 17 ± 10 K/hPa and (3.776 ± 0.004) × 105 K2/hPa, respectively. The acquisition method f2.52. or atmospheric weighted average temperature is calculated using the empirical formula [25].

2.1.2. Meteorological Data

Meteorological data are sourced from ground-based meteorological stations provided by the Meteorological Observation Center of the China Meteorological Administration, with a time resolution of 1 h. These parameters include temperature, atmospheric pressure, rainfall, and RH, which have undergone strict quality control including a data integrity check, outlier detection, and correction. They can be used as data sources for assimilation into the WRF model.

2.1.3. Radiosonde Data

Radiosonde data are obtained from the Global Radiosonde Archive Version 2 (IGRA2) dataset. IGRA2 was produced by the National Climatic Data Center (NCDC) of the United States in 2016 [26]. They include parameters such as atmospheric pressure, temperature, and RH, with a temporal resolution of two or four times per day. The meteorological parameters observed by radiosondes exhibit high accuracy and are commonly used as a standard for evaluating the accuracy of other observation methods [27]. The data can be obtained from https://www.ncei.noaa.gov/pub/data/igra/ (accessed on 1 August 2023). The radiosonde data used in this study were last accessed on 26 August 2021. Table 1 shows the information of the 11 radiosonde stations in this study.

2.1.4. ERA5 Reanalysis Data

ERA5 is the fifth-generation reanalysis dataset from the European Centre for Medium-Range Weather Forecasts. It provides global reanalysis grid products from 1979 to the present, and it is still being updated until now [28]. This dataset assimilates observational data from ground meteorological stations, radiosonde stations, and satellites, aiming to accurately estimate the atmospheric state. This study selects ERA5 reanalysis data as the background field for the WRF model, with a spatial resolution of 0.25° × 0.25° and a temporal resolution of 1 h, including meteorological parameters across 37 layers (from 1000 hPa to 1 hPa). ERA5 meteorological parameters can be obtained from https://cds.climate.copernicus.eu/ (accessed on 12 September 2023). The ERA5 reanalysis data used in this study were last accessed on 26 August 2021.

2.2. WRF Model

The WRF model is a new-generation mesoscale numerical forecasting model developed jointly by the U.S. National Center for Atmospheric Research, the National Centers for Environmental Prediction, and the Weather Forecasting System Laboratory of the National Oceanic and Atmospheric Administration (NOAA), among other research departments and institutions [29]. The model focuses on a horizontal resolution of 1–10 km and is widely used in operational forecasting and mesoscale system research [30]. WRF primarily consists of three modules: the WRF pre-processing system (WPS) module, the main module WRF, and the post-processing module advanced research WRF (ARWpost). The model supports multi-layered grid nesting, which allows for different resolutions of grid settings on nested layers, using lower-resolution grids in the background region and higher-resolution grids in key analysis areas.
The WRF model assimilates external data by using the 3D variational assimilation method (3DVAR), which was developed based on the fifth-generation Penn State/NCAR mesoscale model (MM5) 3D assimilation system. It can assimilate various observational data to improve the model’s initial field, making it closer to the actual atmospheric state and enhancing the accuracy of WRF model forecasts [31]. The 3DVAR method assumes that background field and observational errors follow Gaussian probability distributions. The optimal linear unbiased estimate of the atmospheric state is determined by observational values, the background field, and their error covariance matrices [32]. The analysis field is adjusted by minimizing the cost function, which assimilates data into a minimization problem of a quadratic functional that represents the discrepancies among the analysis, observational, and background fields. The expression for this is
J x = 1 2 X X b T B 1 X X b + 1 2 H X Y 0 T R 1 H X Y 0
where B is the covariance matrix of errors in the background field; and H is the calculation factor of observation, and its function is to realize the projection of the mode variable from the mode space to the observation space through the operator. X is the optimal solution that corresponds to the initial state of the mode, Xb is the background field, Y0 is the observed vector factor, R is the covariance matrix of the observation error, E is the error covariance matrix obtained through instrument observation calculation, and F is the error covariance matrix represented by the observation value. The relationship among the three is R = E + F .

3. Construction of a Rainfall Forecast Platform for GNSS-Assisted NWP Model

This platform uses GNSS data to assist the WRF model in conducting rainfall forecast experiments, and performs an accuracy evaluation and visualization analysis of the results to improve the accuracy of rainfall forecasts. It provides support to users in data assimilation research and visualization analyses of WRF meteorological data. The platform operates on a Linux system and uses version 4.3.1 of the WRF for numerical weather prediction research.

3.1. Platform Parameter Setting

In this study, the WRF model data assimilation 3D variational module is used to assimilate a variety of observational data, and the nesting scheme is designed as a three-layer nested grid (D01, D02, and D03) in accordance with the range of the simulation area. Lower-resolution grids are used for the outer region, while higher-resolution grids are selected for the inner region, such that higher-resolution numerical prediction and simulation can be realized in the inner region through the three-layer nesting scheme to improve the ability of model prediction and simulation. The advantage of the three-layer nesting scheme is that it can satisfy simulation accuracy in key areas while avoiding the consumption of a large number of computational resources. The nested regions of this experiment are shown in Figure 1. D01 is Shaanxi Province and its surrounding areas, D02 is most of Shaanxi Province, and D03 is Xi’an City and its surrounding areas, with resolutions of 9, 3, and 1 km, respectively. The latitude and longitude of the center of the simulation region is (34.0° N, 108.5° E), and the background data are the pressure-level and single-level products of ERA5 reanalysis data, with a spatial resolution of 0.25° × 0.25° and a temporal resolution of 1 h. Table 2 provides the parameter settings of the GNSS-assisted WRF model rainfall forecasting platform constructed in this study. The background field of the WRF model is provided by ERA5 reanalysis data, including necessary meteorological parameters in three and two dimensions. Table 3 shows the necessary input variables required for the WRF model background field provided by ERA5.

3.2. Experimental Scheme and Process

From 18 August to 25 August 2021, a widespread and persistent rainfall event occurred in Xi’an, Shaanxi Province, and its surrounding areas. During 18–20 August, hourly rainfall exceeded 50 mm at 12 stations. The heavy rainfall triggered floods that damaged several roads in Xi’an, as well as residential houses and crops. Therefore, the selected time range is from 00:00 on 18 August 2021 to 00:00 on 25 August 2021. To evaluate the effect of GNSS PWV on the accuracy of rainfall forecasts made by the WRF model, this experiment designs three schemes (one control scheme and two data assimilation schemes). Scheme 1 is a control experiment without assimilating any external data. Scheme 2 assimilates RS and meteorological station data as the traditional assimilation scheme. Scheme 3 assimilates RS, meteorological station, and GNSS PWV data. The aim of Scheme 3 is to evaluate the improvement in assimilating GNSS data relative to traditional assimilation methods. The forecast accuracy for precipitation is verified through the platform. The types of assimilated data and forecast parameters included in each scheme are provided in Table 4. The forecast results are extracted and interpolated to seven meteorological stations in Xi’an using the bilinear interpolation method to verify the improvement effect of assimilating GNSS PWV on the accuracy of WRF rainfall forecasts. The overall workflow of the GNSS-assisted WRF model rainfall forecast platform experiment is illustrated in Figure 2.

3.3. Accuracy Validation Index

This study selects five accuracy indicators to evaluate the performance of the GNSS-assisted WRF model rainfall forecasting platform. These indicators are the root mean square error (RMSE), RMSE improvement rate (RMSEIR), bias, probability of detection (POD), false alarm rate (FAR), TS, and equitable threat score (ETS).
(1)
RMSE
RSME = i = 1 n X i Y i 2 / n
(2)
RMSEIR
RMSEIR = RMSE 1 RMSE 2 RMSE 1 × 100 %
(3)
Bias
Bias = i = 1 n X i X ¯ i / n
(4)
POD
POD = N h i t s N h i t s + N m i s s e s
(5)
FAR
FAR = N F a l s e A l a r m s N h i t s + N F a l s e A l a r m s
(6)
TS
TS = N h i t s N h i t s + N m i s s e s + N F a l s e A l a r m s
(7)
ETS
ETS = N h i t s C H N h i t s + N m i s s e s + N F a l s e A l a r m s C H CH = ( N h i t s + N m i s s e s ) × N h i t s + N F a l s e A l a r m s N h i t s + N m i s s e s + N F a l s e A l a r m s + N C o r r e c t N e g a t i v e
where i ∈ (1, 2, 3, …,n). n represents the total number of sample data. X i ,   X i ¯ , respectively, represent the simulated data values and their mean (in this study, it refers to the output data from the WRF model). Y i represents the reference data values (in this work, ground meteorological station observation data are used as reference data). N h i t s denotes the number of correctly predicted events, N m i s s e s denotes the number of events that actually occurred but were not predicted by the model, and N F a l s e A l a r m s refers to the number of events that the model incorrectly predicted to occur, but did not actually happen. N C o r r e c t N e g a t i v e refers to the number of events where the model correctly predicted that rainfall would not occur, and indeed no rainfall occurred.

4. Results and Analysis

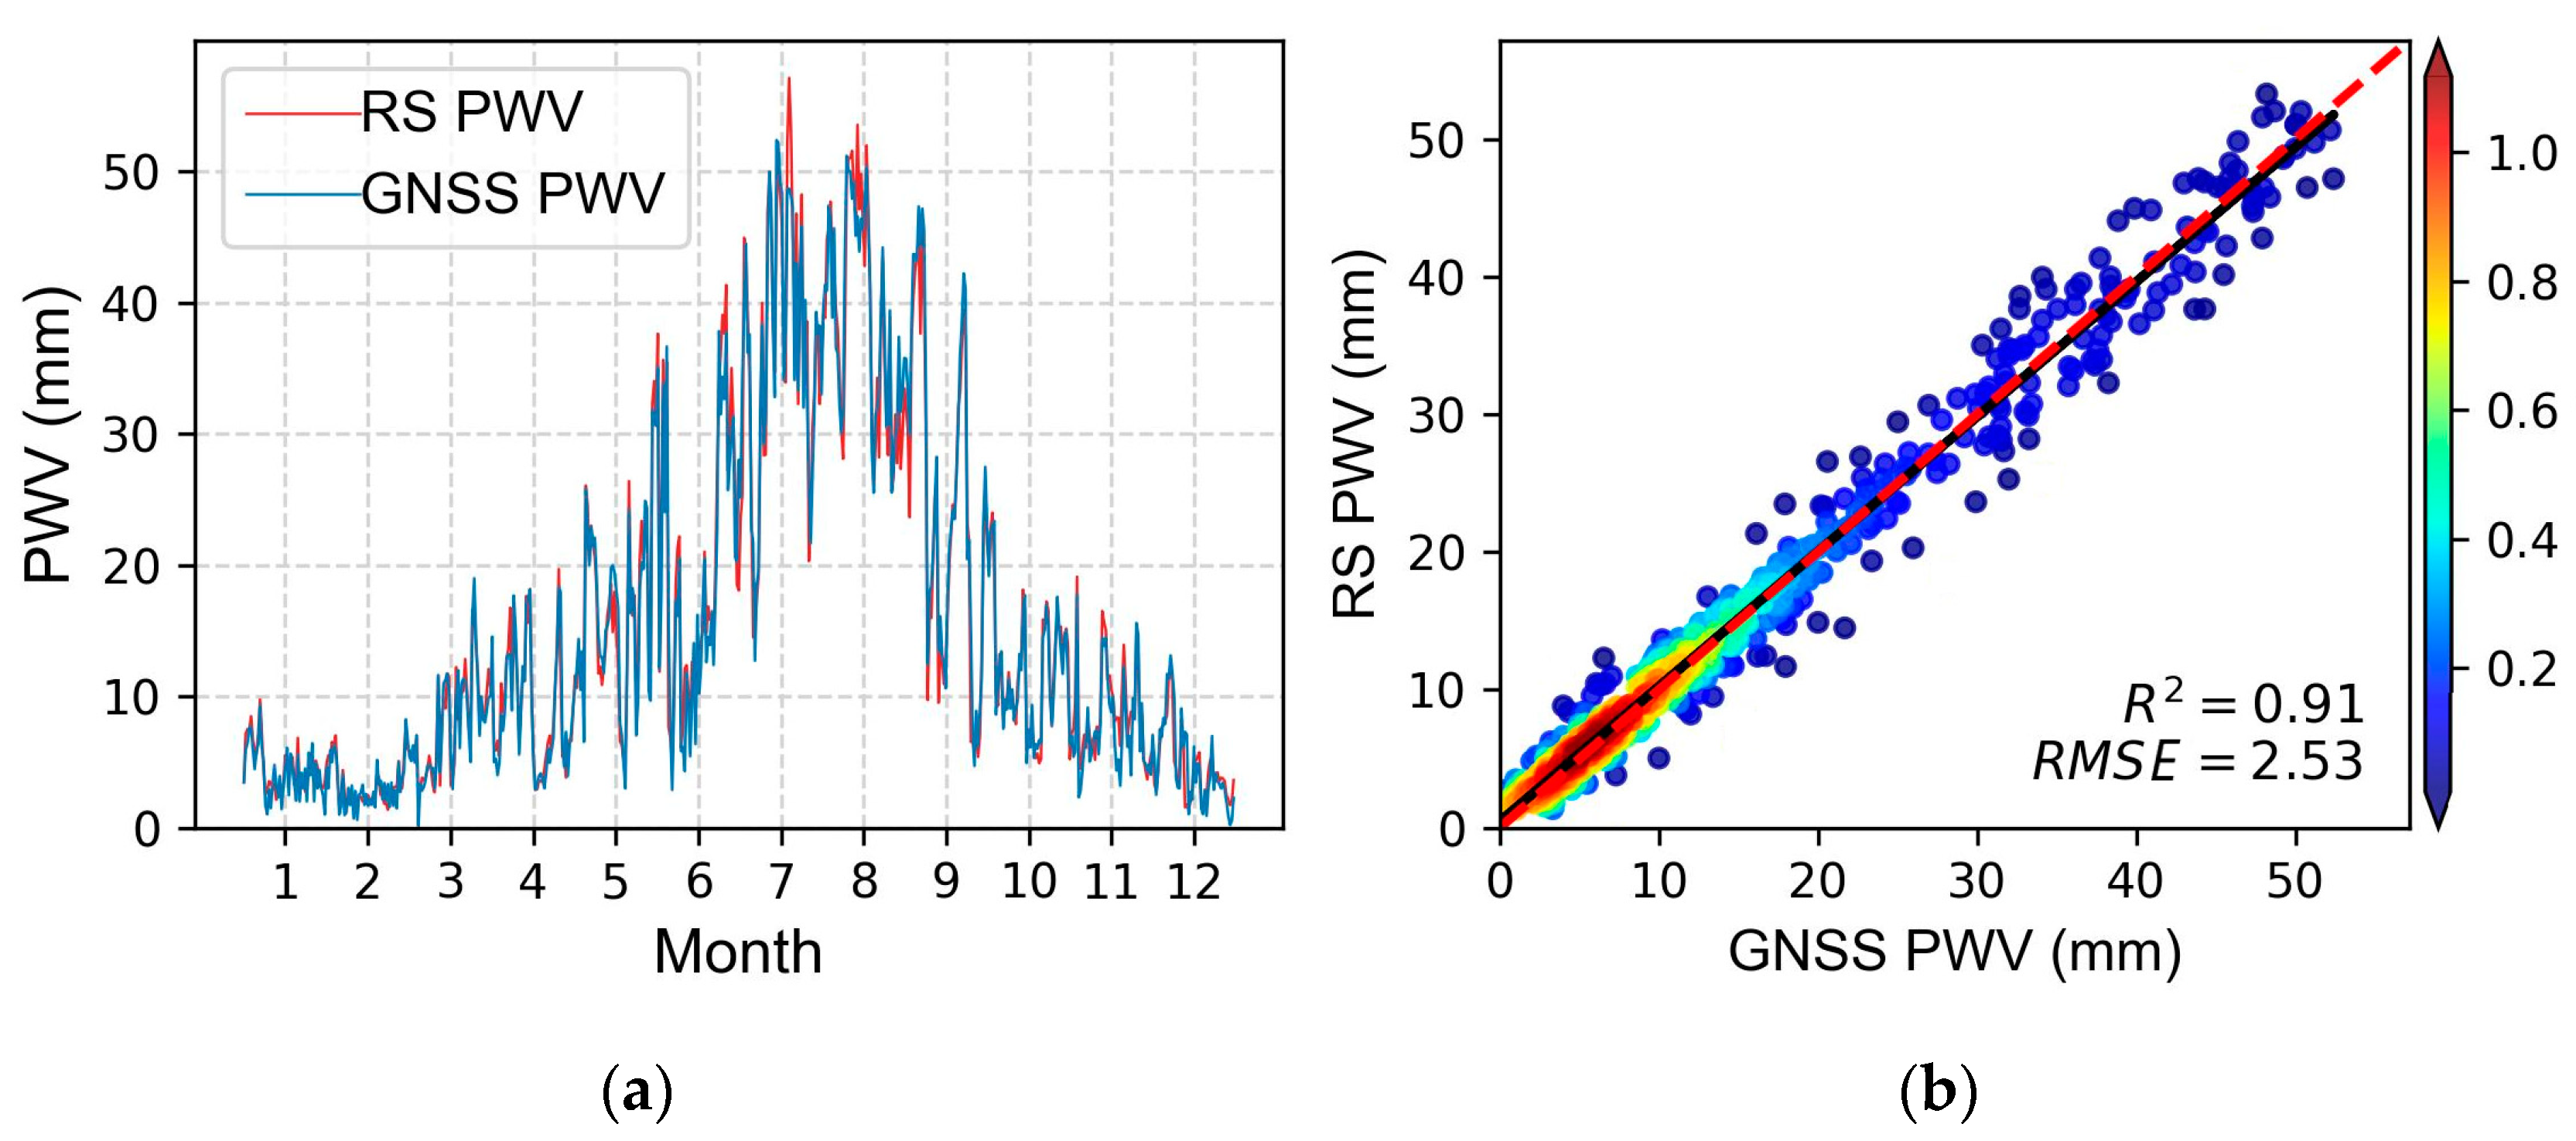
4.1. Validation of GNSS-Derived PWV

To validate the accuracy of GNSS-derived PWV data used in the experiment, the data of one GNSS station (SXHZ) and the nearby RS station (57127) are selected, and the results in 2021 are compared. A total of 608 pairs of PWV data are obtained because RS data are launched twice daily. Figure 3 presents the long time series comparison between RS PWV and GNSS PWV, and the corresponding scatter density diagram between GNSS- and RS-derived PWV in 2021. The PWV derived from GNSS and RS reveal good consistency, and their R is 0.91 (p < 0.05). The statistical result shows that the average RMSEs of PWV difference between GNSS and RS are 2.53 mm. It verifies that the GNSS-derived PWV has high accuracy and can meet the needs of WRF assimilation experiments.

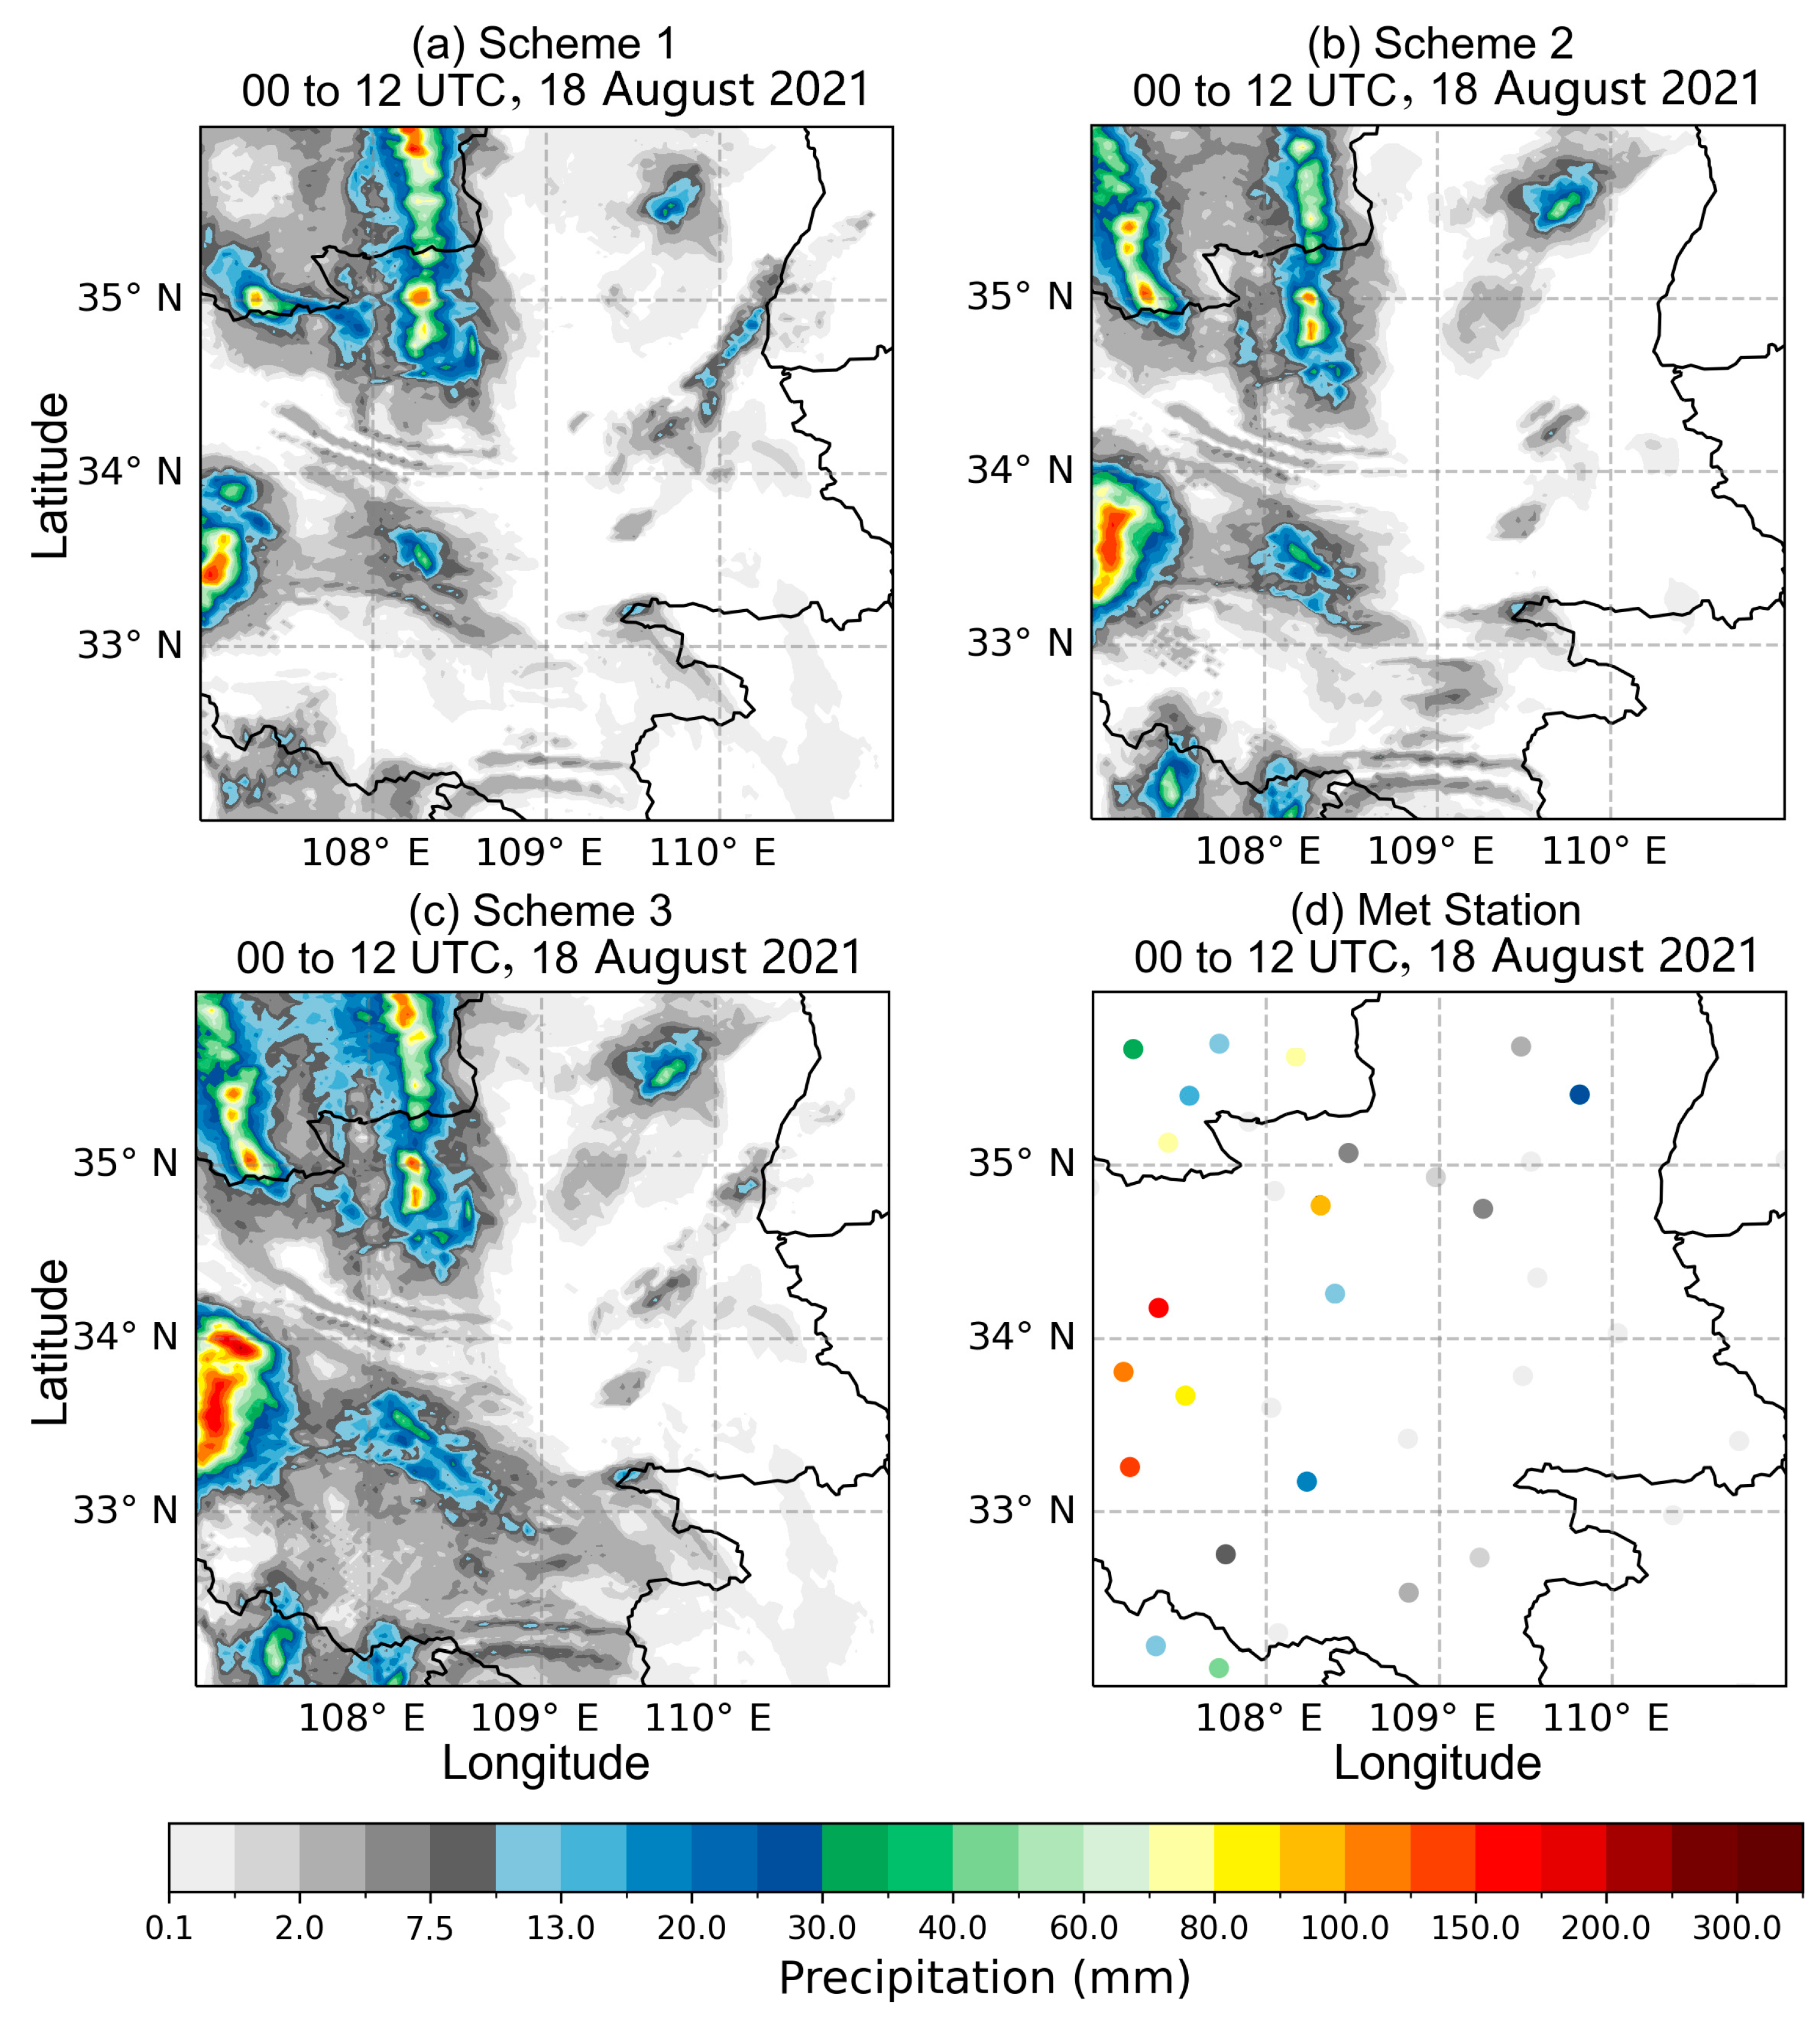
4.2. Accuracy Validation of Forecast Results

To investigate the duration of the impact of GNSS PWV assimilation on the accuracy of rainfall forecasting, we assimilate the external observation data at UTC 00:00 and calculate the RMSE of 1–24 h forecast results. Figure 4 shows the RMSE statistics of rainfall from 1 h to 24 h after data assimilation at 00:00 h UTC, using meteorological station observations as a reference. It can be found that the RMSEs of rainfall in Schemes 2 and 3 are noticeably different in the first 6 h, and their difference gradually decreases in 7–12 h, and there is almost no difference in 13–24 h. This finding indicates that after assimilating GNSS-derived PWV, the forecast accuracy of rainfall improves considerably in the first 6 h and gradually decreases in 7–12 h, and there is almost no improvement after 12 h. Table 5 shows the RMSE of rainfall for Schemes 2 and 3 at 1 h, 6 h, and 12 h after data assimilation. The RMSE difference of rainfall is the largest for the two schemes at 1 h after assimilation; at 6 h after assimilation, the difference is smaller; and at 12 h after assimilation, the difference is the smallest. This further indicates that the assimilation of GNSS-derived PWV can significantly improve the forecast accuracy of rainfall at the first 6 h. Therefore, this study used a 1 h assimilation frequency in rainfall forecasting experiments and evaluated the accuracy of the hourly forecast results obtained.
To evaluate the overall improvement effect of assimilating GNSS PWV on the rainfall forecasting accuracy of the WRF model, Figure 5 presents the forecast results of 12 h accumulated rainfall for three schemes and meteorological stations. As shown in Figure 5, compared to Schemes 1 and 2, Scheme 3 more accurately displays the rainfall forecast results, and it better aligns with the observed results from meteorological stations in terms of rainfall distribution and intensity. This study further statistically analyzes the forecasting accuracy of rainfall at seven ground meteorological stations within the research area. Figure 6 presents the RMSE and bias comparison results of rainfall amounts from 18 August 2021 00:00 to 25 August 2021 00:00 at the seven meteorological stations under different schemes. As shown in Figure 6, Scheme 3 generally performs better than Schemes 1 and 2, with relatively lower RMSE and bias, indicating that GNSS PWV significantly improves overall forecasting accuracy in the study area. Figure 7 shows the Taylor statistical diagram of the rainfall forecasting results, revealing that Scheme 3 achieves higher accuracy in rainfall prediction, with the smallest standard deviation and RMSE, and the highest correlation coefficient.
Furthermore, in accordance with the rainfall level classification standards in the “Basic Terminology of Weather Forecasting” issued by the National Meteorological Bureau, rainfall is categorized into light rain (LR) (0.1–4.9 mm), moderate rain (MR) (5.0–14.9 mm), heavy rain (HR) (15.0–29.9 mm), and torrential rain (TR) (30.0–69.9 mm) based on 12 h of cumulative rainfall [33,34] (https://std.samr.gov.cn/, accessed on 1 August 2023). The WRF model cannot output each rainfall type and quantity directly; it needs to calculate the cumulative amount for each hourly rainfall forecast result before categorizing the rainfall type. In this study, hourly rainfall forecasts of the WRF model are first conducted for the period 18 August 2021 at 00:00 to 25 August 2021 at 00:00 and cumulative rainfall is calculated for each 12 h period consecutively, and then categorized according to the magnitude of the cumulative rainfall as LR, MR, HR, and TR. In addition, the hourly rainfall observed by the meteorological station is also calculated for each 12 h cumulative rainfall and classified into corresponding rainfall types to evaluate the accuracy of rainfall forecasts for different types of rainfall. Figure 8 compares the POD, FAR, TS, and ETS for different rainfall levels of the three schemes. It can be observed that as the rainfall level increases, the POD, TS, and ETS of the three schemes decline, whereas FAR increases, indicating that forecast accuracy diminishes with the increase in the rainfall level. Among these, Scheme 3 outperforms Schemes 1 and 2. Table 6 provides the overall statistical results of POD, FAR, TS, and ETS for different rainfall categories under the three schemes. Evidently, Scheme 3 achieves the best results among the three schemes, with PODs of 0.94, 0.85, 0.76, and 0.69; FARs of 0.05, 0.11, 0.17, and 0.24; TSs of 0.91, 0.75, 0.64, and 0.57; and ETSs of 0.80, 0.61, 0.53, and 0.46, respectively. These results highlight particularly noticeable improvements in the predictions of HR and TR. They also verify that the assimilation of GNSS PWV can enhance the initial humidity information in the WRF model, positively affecting the model’s rainfall forecasting capabilities.
To further evaluate the improvement effect of assimilating GNSS PWV on the forecasting accuracy of different rainfall levels, this study calculated the RMSE improvement rates for Schemes 2 and 3 compared with that of Scheme 1, which did not assimilate observational data. The obtained comparison results are presented in Figure 9. As shown in this figure, Schemes 2 and 3 improve forecasting accuracy for different rainfall levels. In particular, Scheme 3, which assimilates GNSS PWV, exhibits relatively higher RMSE improvement rates of 8%, 15%, 19%, and 25%, respectively, demonstrating notable improvements for HR and TR. This finding also indicates that GNSS PWV can enhance the initial field accuracy of the WRF model, improving forecasting capability for different rainfall levels, particularly for HR and TR.

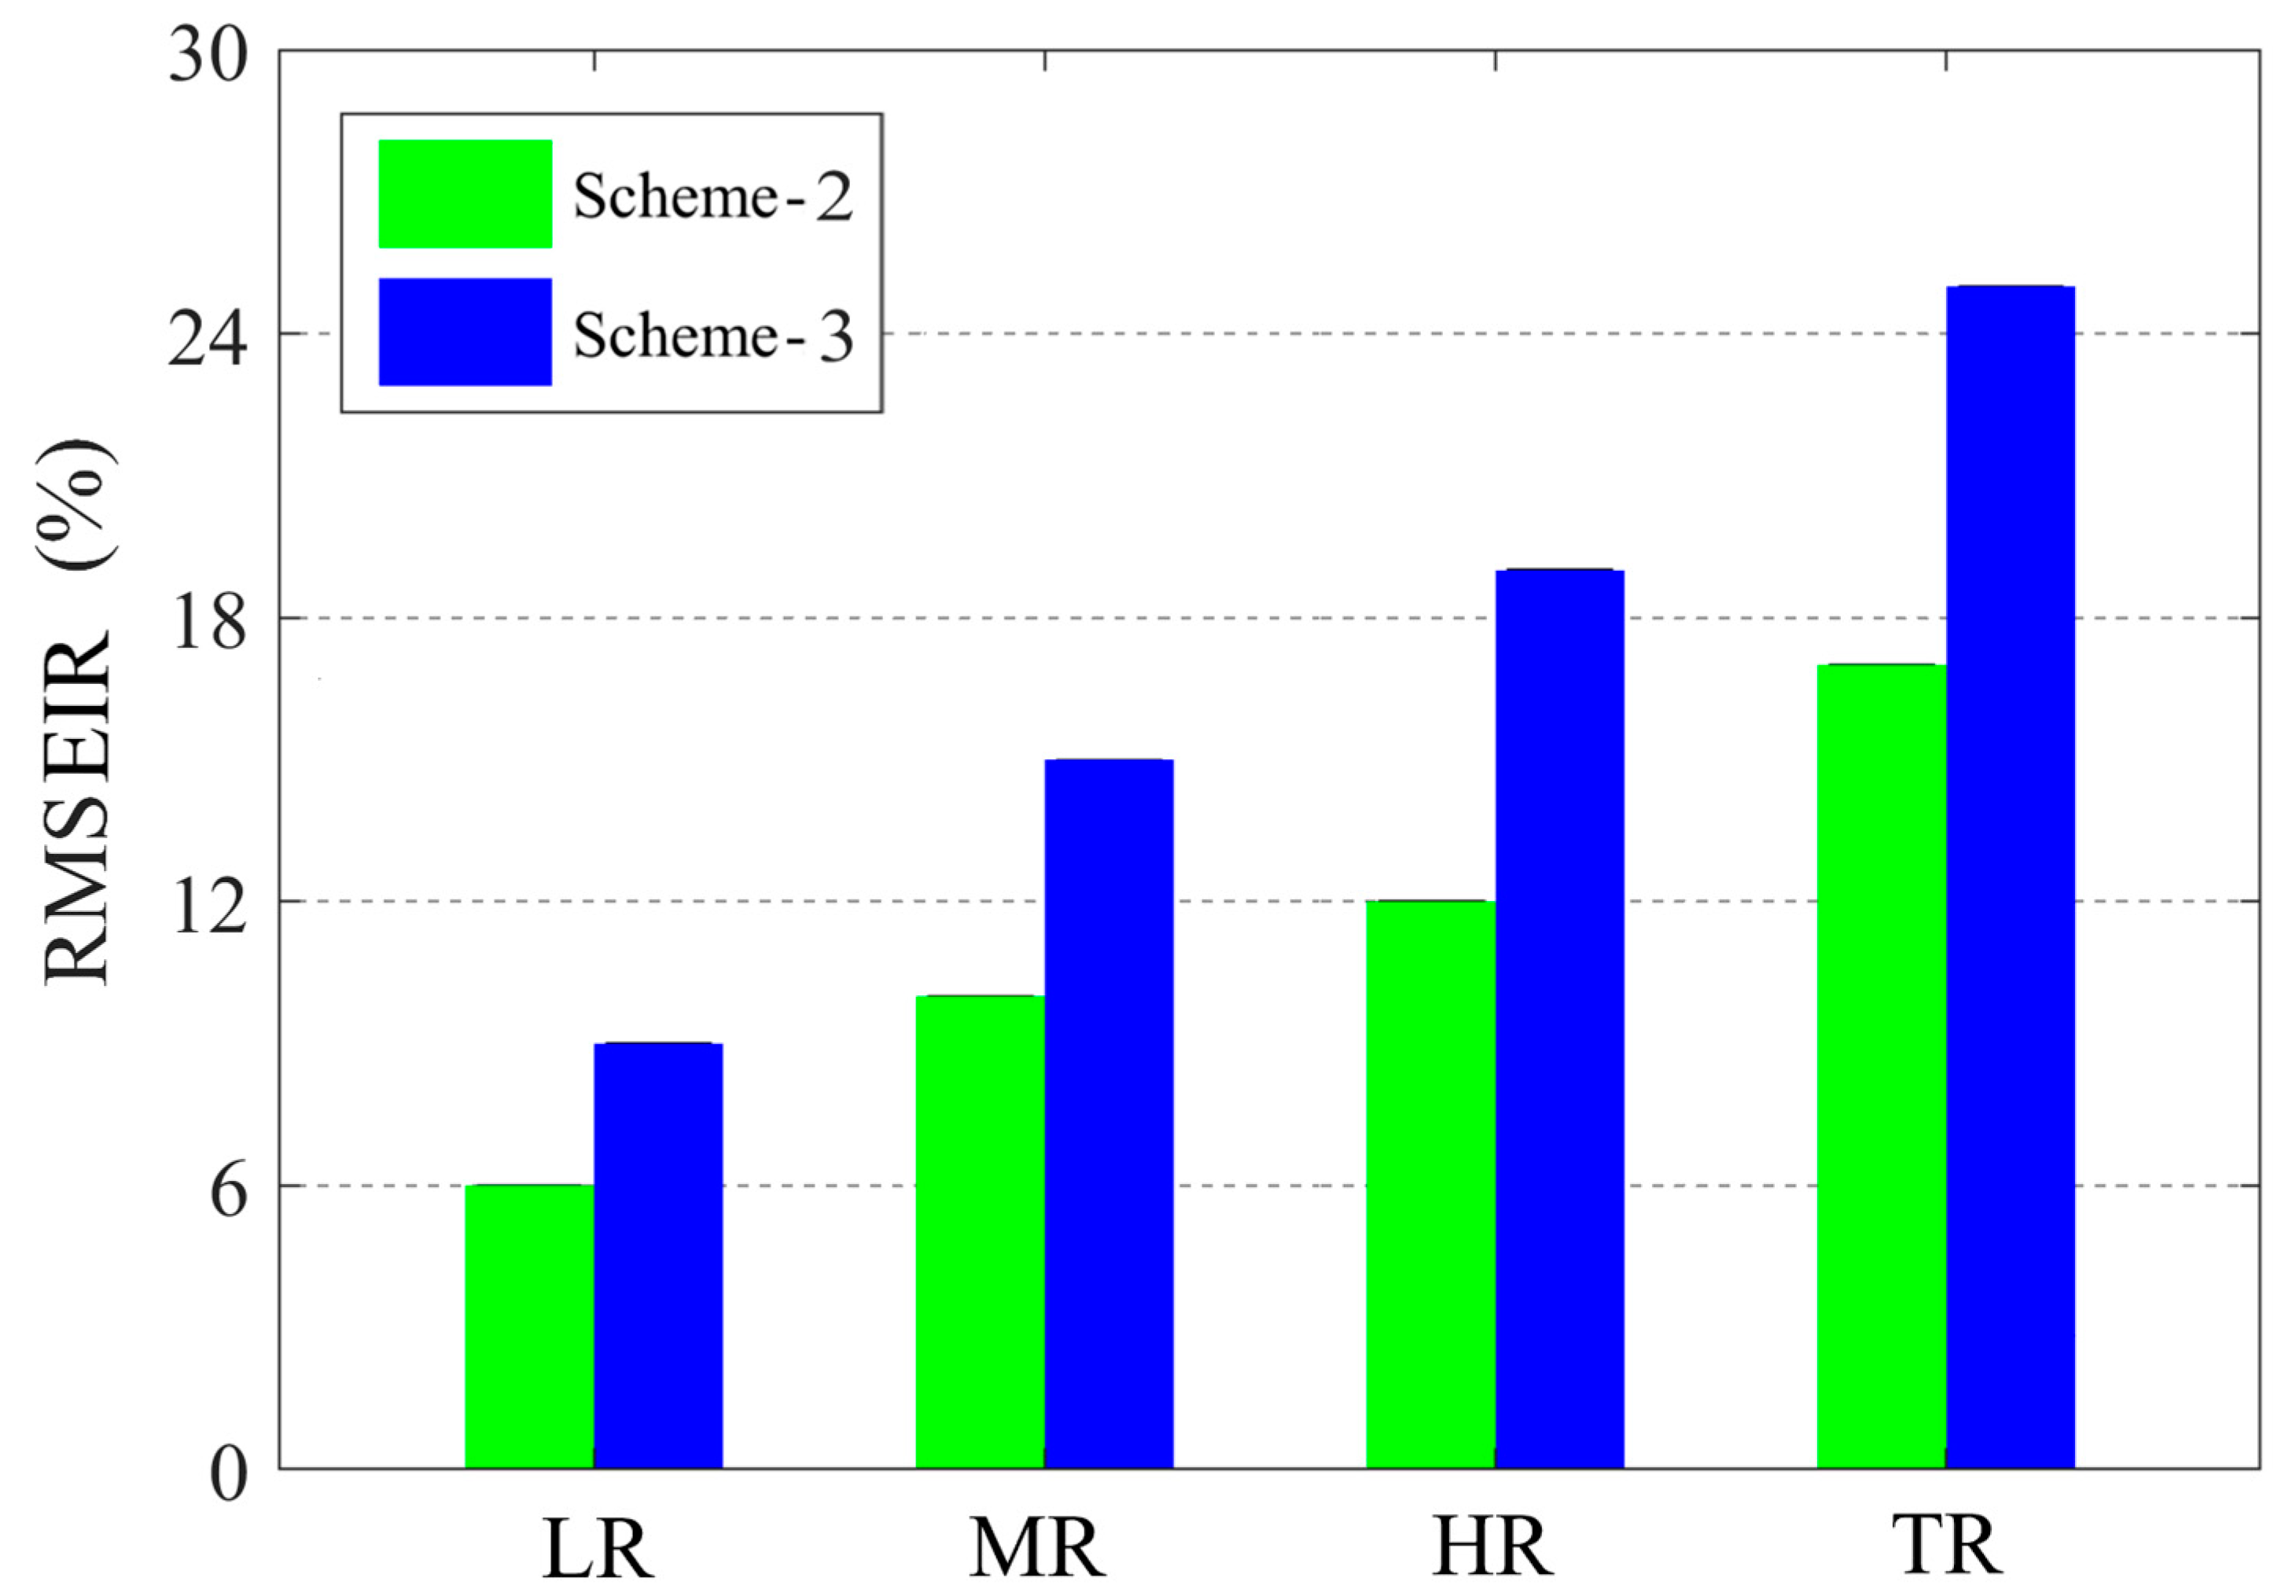
4.3. Analysis of the Impact of the PWV Magnitude on WRF Rainfall Forecast

To evaluate the effect of GNSS-derived PWV magnitude further, quantitatively, on the forecast accuracy of rainfall of the WRF model, the average RMSE and the mean GNSS-derived PWV values of the forecast results of different schemes at the station every three hours are compared, as shown in Figure 10. It can be seen that the RMSE of the forecast results of three schemes generally decreases with increasing PWV. The statistical results also indicate that the PWV values from small to large are divided into three groups, namely, [40, 45), [45, 50), and [50, 55), resulting in statistical results of comparing the PWV of each group with the average RMSE of rainfall. The RMSE of rainfall is lowest in the group [50, 55) at 3.58 mm. Based on the results, the magnitude of PWV has a significant impact on the forecast accuracy of rainfall in the WRF model.

5. Discussion

The assimilation of GNSS-derived PWV can enhance the accuracy of rainfall forecasts in the WRF model, which is associated with the magnitude of GNSS PWV and the frequency of its assimilation. Variations in atmospheric moisture are a crucial condition for the occurrence of rainfall. The high precision of moisture information provided by GNSS PWV to the initial field of the WRF model allows for a more accurate representation of the atmospheric moisture state, thus positively impacting the accuracy of rainfall forecasts. Compared to Scheme 2, which does not assimilate GNSS PWV, this effect is quite apparent within the first 6 h after assimilation and then gradually diminishes. Therefore, increasing the frequency of GNSS PWV assimilation can effectively improve the accuracy of rainfall forecasts. This conclusion is consistent with previous studies. Additionally, the magnitude of assimilated GNSS PWV also significantly influences rainfall forecast accuracy. Statistical results show that as the magnitude of PWV increases, the RMSE of rainfall forecasts decreases, with the impact being more pronounced at higher PWV levels. Statistical indexes such as POD, FAR, TS, and ETS (Figure 7 and Table 6) also demonstrate improvements in forecasts of different rainfall intensities following the assimilation of GNSS PWV in Scheme 3 compared to Scheme 2, which does not assimilate GNSS PWV (Figure 9). These results all indicate the benefits of increasing both the frequency and magnitude of PWV assimilation for enhancing rainfall forecasting capabilities of the WRF model.

6. Conclusions

This study proposes for the first time a method for constructing a rainfall forecasting platform based on GNSS-assisted WRF models, utilizing GNSS data to assist in rainfall forecasting experiments with the WRF model. Three schemes are designed, and the results are validated and analyzed for accuracy. The experimental results show that GNSS data assistance significantly improves the accuracy of rainfall forecasts, with the data assimilation of GNSS PWV enhancing forecasting accuracy for different rainfall levels, achieving RMSE improvement rates of 8%, 15%, 19%, and 25% for LR, MR, HR, and TR, respectively. It is observed that the RMSE of the rainfall forecast results decreases as the magnitude of the assimilated PWV increases, with the lowest RMSE of 3.58 mm observed in the range of PWV magnitude from 50 to 55 mm. The RMSE of the rainfall forecast results decreases as the magnitude of the assimilated PWV increases. The rainfall forecast results after assimilating PWV have the highest POD, TS, and ETS and the lowest FAR at different rainfall levels. Furthermore, Scheme 3, in particular, demonstrates superior performance with notable improvements in statistical indexes such as POD, FAR, TS, and ETS across all rainfall intensities. The rainfall forecasting platform developed in this study features high precision, visualization, and robustness, demonstrating research significance and practical value for data assimilation studies and the visualization of WRF meteorological data analyses.

Author Contributions

Conceptualization, H.G. and Y.M.; methodology and formal analysis, Q.Z.; validation, Y.M., Z.L. and Y.Z.; investigation, H.G. and Y.Z.; resources, H.G.; data curation, H.G., Z.L. and Y.M.; writing—original draft preparation, Y.M. and Q.Z.; writing—review and editing, H.G. and Q.Z.; funding acquisition, H.G. and Q.Z. All authors have read and agreed to the published version of the manuscript.

Funding

This research was supported by the National Natural Science Foundation of China (42274039), Arctic Pavilion Open Research Fund of Nanjing Meteorological Science and Technology Innovation Research Institute (BJG202411), Key Research and Development Plan of Xianyang City (Social Development Field) (L2023-ZDYF-SF-005), and Open Research Fund for Ecological Environment Meteorology Key Laboratory of Qinling and Loess Plateau of Shaanxi Provincial Meteorological Administration (2023K-1).

Institutional Review Board Statement

Not applicable.

Informed Consent Statement

Not applicable.

Data Availability Statement

The data presented in this study are available on request from the corresponding author. The data are not publicly available due to privacy restrictions.

Acknowledgments

The authors would like to thank the European Centre for Medium-Range Weather Forecasts (ECMWF) for providing the ERA5 dataset, the Meteorological Observation Center of the China Meteorological Administration for the GNSS dataset and hourly data from ground meteorological stations, and the National Climatic Data Center (NCDC) of the United States for supplying the IGRA2 data.

Conflicts of Interest

Zufeng Li is employee of PowerChina Northwest Engineering Corporation Limited. The paper reflects the views of the scientists and not the company.

References

  1. Palmer, T. The primacy of doubt: Evolution of numerical weather prediction from determinism to probability. J. Adv. Model. Earth Syst. 2017, 9, 730–734. [Google Scholar] [CrossRef]
  2. Moya-Álvarez, A.S.; Gálvez, J.; Holguín, A.; Estevan, R.; Kumar, S.; Villalobos, E.; Martínez-Castro, D.; Silva, Y. Extreme rainfall forecast with the WRF-ARW model in the Central Andes of Peru. Atmosphere 2018, 9, 362. [Google Scholar] [CrossRef]
  3. Vaquero-Martínez, J.; Antón, M. Review on the role of GNSS meteorology in monitoring water vapor for atmospheric physics. Remote Sens. 2021, 13, 2287. [Google Scholar] [CrossRef]
  4. Khaniani, A.S.; Motieyan, H.; Mohammadi, A. Rainfall forecast based on GPS PWV together with meteorological parameters using neural network models. J. Atmos. Sol. Terr. Phys. 2021, 214, 105533. [Google Scholar] [CrossRef]
  5. Flamant, C.; Chazette, P.; Caumont, O.; Di Girolamo, P.; Behrendt, A.; Sicard, M.; Totems, J.; Lange, D.; Fourrié, N.; Brousseau, P.; et al. A network of water vapor Raman lidars for improving heavy precipitation forecasting in southern France: Introducing the WaLiNeAs initiative. Bull. Atmos. Sci. Technol. 2021, 2, 1–21. [Google Scholar] [CrossRef]
  6. Shrestha, D.L.; Robertson, D.E.; Wang, Q.J.; Pagano, T.C.; Hapuarachchi, H.A.P. Evaluation of numerical weather prediction model precipitation forecasts for short-term streamflow forecasting purpose. Hydrol. Earth Syst. Sci. 2013, 17, 1913–1931. [Google Scholar] [CrossRef]
  7. Cao, Y.; Kuznetsov, E.; Miao, C.; Chen, S.; Meng, T. The current situation of Russia’s GNSS continuous operating reference station network and thinking on future development. Adv. Space Res. 2024, 73, 3896–3908. [Google Scholar] [CrossRef]
  8. Zhang, K.; Li, H.; Wang, X.; Zhu, D.; He, Q.; Li, L.; Hu, A.H.A.; Zheng, N.; Li, H. Recent progresses and future prospectives of ground-based GNSS water vapor sounding. Acta Geod. Cartogr. Sin. 2022, 51, 1172–1191. [Google Scholar]
  9. Wu, Z.; Lu, C.; Zheng, Y.; Liu, Y.; Liu, Y.; Xu, W.; Jin, K.; Tang, Q. Evaluation of shipborne GNSS precipitable water vapor over global oceans from 2014 to 2018. IEEE Trans. Geosci. Remote Sens. 2022, 60, 5802515. [Google Scholar] [CrossRef]
  10. Bauer, P.; Thorpe, A.; Brunet, G. The quiet revolution of numerical weather prediction. Nature 2015, 525, 47–55. [Google Scholar] [CrossRef] [PubMed]
  11. Risanto, C.B.; Castro, C.L.; Moker, J.M., Jr.; Arellano, A.F., Jr.; Adams, D.K.; Fierro, L.M.; Minjarez Sosa, C.M. Evaluating forecast skills of moisture from convective-permitting WRF-ARW model during 2017 North American Monsoon season. Atmosphere 2019, 10, 694. [Google Scholar] [CrossRef]
  12. Kuo, Y.H.; Guo, Y.R.; Westwater, E.R. Assimilation of precipitable water measurements into a mesoscale numerical model. Mon. Weather Rev. 1993, 121, 1215–1238. [Google Scholar] [CrossRef]
  13. Mateus, P.; Tomé, R.; Nico, G.; Catalão, J. Three-dimensional variational assimilation of InSAR PWV using the WRFDA model. IEEE Trans. Geosci. Remote Sens. 2016, 54, 7323–7330. [Google Scholar] [CrossRef]
  14. Yuan, Z.; Ding, J.; Chen, M. Preliminary study on applying GPS observations to mesoscale numerical weather prediction model. Acta Meteorol. Sin. 2004, 62, 200–212. [Google Scholar]
  15. Sharifi, M.A.; Azadi, M.; Khaniani, A.S. Numerical simulation of rainfall with assimilation of conventional and GPS observations over north of Iran. Ann. Geophys. 2016, 59, 0322. [Google Scholar]
  16. Risanto, C.B.; Castro, C.L.; Arellano, A.F.; Moker, J.M.; Adams, D.K. The impact of assimilating gps precipitable water vapor in convective-permitting wrf-arw on north american monsoon precipitation forecasts over northwest mexico. Mon. Weather Rev. 2021, 149, 3013–3035. [Google Scholar] [CrossRef]
  17. Rohm, W.; Guzikowski, J.; Wilgan, K.; Kryza, M. 4DVAR assimilation of GNSS zenith path delays and precipitable water into a numerical weather prediction model WRF. Atmos. Meas. Tech. 2019, 12, 345–361. [Google Scholar] [CrossRef]
  18. Wang, H.; Liu, Y.; Liu, Y.; Cao, Y.; Liang, H.; Hu, H.; Liang, J.; Tu, M. Assimilation of GNSS PWV with NCAR-RTFDDA to Improve Prediction of a Landfall Typhoon. Remote Sens. 2022, 14, 178. [Google Scholar] [CrossRef]
  19. Gong, Y.; Liu, Z.; Chan, P.W.; Hon, K.K. Assimilating GNSS PWV and radiosonde meteorological profiles to improve the PWV and rainfall forecasting performance from the Weather Research and Forecasting (WRF) model over the South China. Atmos. Res. 2023, 286, 106677. [Google Scholar] [CrossRef]
  20. Corrales, P.B.; Galligani, V.; Ruiz, J.; Sapucci, L.; Dillon, M.E.; García Skabar, Y.; Sacco, M.; Schwartz, C.S.; Nesbitt, S.W. Hourly assimilation of different sources of observations including satellite radiances in a mesoscale convective system case during RELAMPAGO campaign. Atmos. Res. 2023, 281, 106456. [Google Scholar] [CrossRef]
  21. Brotzge, J.A.; Berchoff, D.; Carlis, D.L.; Carr, F.H.; Carr, R.H.; Gerth, J.J.; Gross, B.D.; Hamill, T.M.; Haupt, S.E.; Jacobs, N.; et al. Challenges and opportunities in numerical weather prediction. Bull. Am. Meteorol. Soc. 2023, 104, E698–E705. [Google Scholar] [CrossRef]
  22. Imrišek, M.; Derková, M.; Janák, J. Estimation of GNSS tropospheric products and their meteorological exploitation in Slovakia. Contrib. Geophys. Geod. 2020, 50, 83–111. [Google Scholar] [CrossRef]
  23. Saastamoinen, J. Atmospheric correction for the troposphere and stratosphere in radio ranging satellites. Use Artif. Satell. Geod. 1972, 15, 247–251. [Google Scholar]
  24. Huva, R.; Verbois, H.; Walsh, W. Comparisons of next-day solar forecasting for Singapore using 3DVAR and 4DVAR data assimilation approaches with the WRF model. Renew. Energy 2020, 147, 663–671. [Google Scholar] [CrossRef]
  25. Sun, Z.; Zhang, B.; Yao, Y. A global model for estimating tropospheric delay and weighted mean temperature developed with atmospheric reanalysis data from 1979 to 2017. Remote Sens. 2019, 11, 1893. [Google Scholar] [CrossRef]
  26. Ding, J.; Chen, J.; Tang, W.; Song, Z. Spatial–Temporal Variability of Global GNSS-Derived Precipitable Water Vapor (1994–2020) and Climate Implications. Remote Sens. 2022, 14, 3493. [Google Scholar] [CrossRef]
  27. Meng, L.; Liu, J.; Tarasick, D.W.; Randel, W.J.; Steiner, A.K.; Wilhelmsen, H.; Wang, L.; Haimberger, L. Continuous rise of the tropopause in the Northern Hemisphere over 1980–2020. Sci. Adv. 2021, 7, eabi8065. [Google Scholar] [CrossRef]
  28. Huang, J.; Yin, J.; Wang, M.; He, Q.; Guo, J.; Zhang, J.; Liang, X.; Xie, Y. Evaluation of five reanalysis products with radiosonde observations over the Central Taklimakan Desert during summer. Earth Space Sci. 2021, 8, e2021EA001707. [Google Scholar] [CrossRef]
  29. Pryor, S.C.; Shepherd, T.J.; Barthelmie, R.J.; Hahmann, A.N.; Volker, P. Wind farm wakes simulated using WRF. In Journal of Physics: Conference Series; IOP Publishing: Bristol, UK, 2019; Volume 1256, p. 012025. [Google Scholar]
  30. Zhang, S.; Xu, S.; Fu, H.; Wu, L.; Liu, Z.; Gao, Y.; Zhao, C.; Wan, W.; Wan, L.; Lu, H.; et al. Toward Earth system modeling with resolved clouds and ocean submesoscales on heterogeneous many-core HPCs. Natl. Sci. Rev. 2023, 10, nwad069. [Google Scholar] [CrossRef] [PubMed]
  31. Gao, L.; Liu, Z.; Chen, D.; Yan, P.; Zhang, Y.; Hu, H.; Liang, H.; Liang, X. GPS-ZTD data assimilation and its impact on wintertime haze prediction over North China Plain using WRF 3DVAR and CMAQ modeling system. Environ. Sci. Pollut. Res. 2021, 28, 68523–68538. [Google Scholar] [CrossRef]
  32. Liu, Y.; Liu, J.; Li, C.; Yu, F.; Wang, W. Effect of the assimilation frequency of radar reflectivity on rain storm prediction by using WRF-3DVAR. Remote Sens. 2021, 13, 2103. [Google Scholar] [CrossRef]
  33. Gleiter, T. Improving Data Assimilation for MJO Prediction Based on Experiments with the Skeleton Model for Tropical Intraseasonal Variability. Master’s Thesis, Ludwig-Maximilians-Universität, München, Germany, 2021. [Google Scholar]
  34. Ye, X.; Zhu, H.; Wang, J.; Zheng, W.; Zhang, W.; Schenato, L.; Pastuto, A.; Catani, F. Towards hydrometeorological thresholds of reservoir-induced landslide from subsurface strain observations. Sci. China Technol. Sci. 2024, 67, 1907–1922. [Google Scholar] [CrossRef]
Figure 1. Study area and station distribution.
Atmosphere 15 00992 g001
Figure 2. Flow chart of GNSS-assisted WRF model rainfall forecast platform experiment.
Atmosphere 15 00992 g002
Figure 3. (a) Comparison of RS PWV and GNSS PWV long time series in Shaanxi Province in 2021; (b) RS PWV and GNSS PWV scatter density map.
Atmosphere 15 00992 g003
Figure 4. Hourly RMSE of rainfall forecast results for Schemes 2 and 3, compared to WRF no-data-assimilation scheme (Scheme 1), at 1 h to 24 h after data assimilation.
Atmosphere 15 00992 g004
Figure 5. Comparison of 12 h accumulated rainfall forecast results for (a) scheme 1, (b) scheme 2, (c) scheme 3 on 00 to 12 UTC 18 August 2021, as well as (d) the observed data from meteorological stations.
Atmosphere 15 00992 g005
Figure 6. Comparison of (a) RMSE and (b) bias statistical results of rainfall forecasts with different schemes at seven meteorological stations.
Atmosphere 15 00992 g006
Figure 7. Comparison of the forecast accuracy of (a) LR, (b) MR, (c) HR and (d) TR rainfall levels in different schemes (Taylor statistical chart).
Atmosphere 15 00992 g007
Figure 8. Comparison of (a) POD, (b) FAR, (c) TS, and (d) ETS for different rainfall levels of three schemes in 2021.
Atmosphere 15 00992 g008
Figure 9. RMSE improvement rate of different rainfall levels in Schemes 2 and 3.
Atmosphere 15 00992 g009
Figure 10. RMSE comparison of GNSS PWV magnitude with WRF model for rainfall in different schemes of forecast results.
Atmosphere 15 00992 g010
Table 1. The information of the 11 radiosonde stations in this study.
StationLocation
LatitudeLongitude
5249540.8104.5
5268138.6103.1
5298335.9104.2
5346340.9111.6
5351340.7107.4
5354339.8109.9
5361438.5106.2
5377237.6112.6
5384536.6109.5
5391535.6106.7
5712733.1107.0
Table 2. Configuration of rainfall forecast platform.
ConfigurationDomains
D01D02D03
ProjectionLambert conformal conicLambert conformal conicLambert conformal conic
Number of grid points
(North–South × East–West)
136 × 99259 × 148278 × 222
Grid spacing9 km3 km1 km
Number of WRF layers383838
Model top pressure1 hPa1 hPa1 hPa
Table 3. Input variables required for the WRF model background field provided by ERA5.
Variable TypeVariable Name
Three-dimensional dataTemperature
Relative Humidity
Geopotential height
Wind field U and V components
Two-dimensional dataSurface pressure
Mean sea level pressure
Surface temperature
2 m temperature
2 m relative humidity or specific humidity
10 m wind field U and V components
Soil temperature and moisture
Table 4. Design of forecast experiment scheme.
Experimental SchemeAssimilation DataForecast Parameters
scheme 1No assimilationPrecipitation
scheme 2RS + MetPrecipitation
scheme 3GNSS PWV + RS + MetPrecipitation
Table 5. The RMSE of rainfall of Schemes 2 and 3 at 1 h, 6 h, and 12 h after assimilation.
ParameterSchemeRMSE after Data Assimilation
1 h6 h12 h
Rainfall (mm)22.173.875.12
31.393.564.93
Table 6. Comparison of the statistical results of the forecast accuracy of different levels of rainfall in three schemes.
IndexSchemeLRMRHRTR
POD10.890.750.680.61
20.910.770.700.63
30.940.850.760.69
FAR10.070.160.220.28
20.060.140.210.27
30.050.110.170.24
TS10.840.660.570.49
20.860.680.580.51
30.910.750.640.57
ETS10.800.610.530.46
20.820.640.550.48
30.870.690.600.53
Disclaimer/Publisher’s Note: The statements, opinions and data contained in all publications are solely those of the individual author(s) and contributor(s) and not of MDPI and/or the editor(s). MDPI and/or the editor(s) disclaim responsibility for any injury to people or property resulting from any ideas, methods, instructions or products referred to in the content.

