Article

Simulation and Diagnosis of Physical Precipitation Process of Local Severe Convective Rainstorm in Ningbo

1
Ningbo Meteorological Observatory, Ningbo 315012, China
2
Zhejiang Climate Center, Hangzhou 310051, China
3
The Department of Meteorology and Atmospheric Science, College of Earth and Mineral Sciences, University Park, PA 16801, USA
4
Zhejiang Meteorological Observatory, Hangzhou 310051, China
*
Author to whom correspondence should be addressed.
Atmosphere 2024, 15(6), 658; https://doi.org/10.3390/atmos15060658
Submission received: 24 April 2024 / Revised: 22 May 2024 / Accepted: 27 May 2024 / Published: 30 May 2024
(This article belongs to the Special Issue Characteristics of Extreme Climate Events over China)

Abstract

:
On 31 July 2021, Ningbo, an eastern coast city in China, experienced a severe convective rainstorm, characterized by intense short-duration precipitation extremes with a maximum rainfall rate of 130 mm h−1. In this research, we first analyzed this rainstorm using Doppler radar and precipitation observation and then conducted high-resolution simulation for it. A three-dimensional precipitation diagnostic equation is introduced to quantitatively analyze the microphysical processes during the rainstorm. It is shown that this rainstorm was triggered and developed locally in central Ningbo under favorable large-scale quasi-geostrophic conditions and local conditions. In the early stage, the precipitation increase is mainly driven by the strong convergence of water vapor, and a noticeable increase in both the intensity and spatial extent of uplift promotes the upward transportation of water vapor. As the water vapor flux and associated convergence weaken in the later stage, the precipitation reduces accordingly. Cloud microphysical processes are also important in the entire precipitation process. The early stage updraft supports the escalations in raindrops, with the notable fluctuations in raindrop concentrations directly linked to variations in ground precipitation intensity. The behavior of graupel particles is intricately connected to their melting as they fall below the zero-degree layer. Although cloud water and snow exhibit changes during this period, the magnitudes of these adjustments are considerably less pronounced than those in raindrops and graupels, highlighting the differentiated response of various condensates to the convective dynamics. These results can help deepen the understanding of local severe rainstorms and provide valuable scientific references for practical forecasting.

1. Introduction

China, situated in the renowned monsoon region, is characterized by its complex terrain and diverse landforms. This geographical setting, coupled with the influence of circulation systems of varying scales, makes the country prone to frequent and severe rainstorms, drawing widespread concern from all sectors of society. Historical and recent studies [1,2,3] have shed light on this climatic challenge. Thanks to the collaborative efforts of numerous scholars, significant research advancements have been made [4,5,6]. For instance, researchers [7] employed the high-resolution WRF model to simulate a rainstorm event in Sichuan, uncovering how the complex interplay between the region’s terrain, large-scale circulation, and low-level southeast winds, alongside the accumulation and dissipation of unstable energy, dictates the onset and cessation of rainstorms. The FLEXPART trajectory model was utilized [8] to trace the moisture sources of Sichuan’s rainstorms, quantitatively assessing the contributions from different regions. Furthermore, warm season precipitation in Beijing was analyzed using minute-level data [9], revealing the spatiotemporal patterns of short-duration heavy precipitation events and exploring factors influencing these patterns. Researchers [10] reconstructed a short squall line process in Zhejiang based on a high-resolution numerical model and revealed its causes. They found that topographic convergence, abundant water vapor, and mesoscale mountain ranges contributed to the process. The numerical model is instrumental in further deepening the understanding of the occurrence and development mechanisms of rainstorms. The water vapor and cloud budgets of three precipitation processes in Zhejiang Province were analyzed based on a two-dimensional cloud scale model equation set [11]. Recent urbanization trends have resulted in cities with expanded size and scope, while also altering their surfaces. This urban expansion, combined with complex terrains, frequently triggers local or regional rainstorms, leading to severe disasters [12,13,14]. Moreover, the increasing complexity and extremity of precipitation events [15,16] further heighten the disaster risk in urban areas, emphasizing the need for continued research and mitigation strategies. East China, characterized by its dense urban areas and high population density, has historically faced numerous instances of extreme rainstorms since the establishment of the People’s Republic of China, drawing significant attention from researchers [17,18,19]. For example, from 17 to 22 July 2021, Henan experienced an extreme rainstorm event. This intense and prolonged rainstorm led to catastrophic flooding and urban waterlogging. Zhengzhou recorded a maximum hourly rainfall of 201.9 mm and a 24 h cumulative rainfall of 624.1 mm. The highest cumulative precipitation was recorded at the Hebi Science and Technology Innovation Center meteorological station, reaching 1122.6 mm, making it the largest rainstorm event in Henan since the rainstorm that occurred in August 1975 [20]. Ningbo, situated on the southeastern coast and within the southern flank of the Yangtze River Delta, exhibits a terrain that transitions in a stepped fashion from the southwest to the northeast. This area comprises a mix of hills, plains, basins, mountains, and cities, whose diverse topography and expanding urbanization contribute to the frequency and severity of local rainstorms.
Precipitation, a complex interplay of macro- and microphysical processes, necessitates water vapor, vertical motion, and cloud droplet growth for its formation, with cloud droplet growth being crucial for cloud system formation and surface precipitation. Building on this foundation, the two-dimensional diagnostic formula linking surface precipitation intensity with atmospheric water vapor and cloud budgets was developed [3], which has been applied in numerous studies. This approach establishes a quantitative precipitation analysis standard system centered around the ground precipitation equation. Within the basic framework of surface precipitation equations, the dynamic, thermal, and cloud microphysical processes that are closely related to the formation, development, and dissipation of precipitation can be systematically and quantitatively analyzed and studied. Advancing this approach, a three-dimensional surface precipitation diagnostic equation based on the WRF model was formulated [21], enhancing the analysis of precipitation in scenarios like tropical cyclones and topographic rainstorms. This methodology was successfully applied in ref. [22], who demonstrated how water vapor convergence, condensation, and the convergence of liquid-phase water condensates drive the development of heavy precipitation cloud systems before peak precipitation, with a subsequent decline in these processes leading to the dissipation of the system. Additionally, with the accelerating urbanization process, local severe convection rainstorms are occurring more frequently. However, research on these events remains limited, and the mechanisms of their occurrence and development are not yet well understood. Due to the small spatial scale of these storms, the simulation requirements are more stringent. Therefore, it is particularly important to strengthen research on their occurrence and development mechanisms. The three-dimensional precipitation diagnostic equation, being an excellent diagnostic tool, is highly necessary for studying local severe convection rainstorms.
Despite the proven benefits of the three-dimensional precipitation diagnostic equation in dissecting the nuanced dynamics of precipitation, its application remains limited. Given the intricate interplay of factors influencing strong convective rainstorms, employing this diagnostic tool in further studies is imperative for advancing our understanding and management of these meteorological events. Building on the foundations laid by preceding research [23,24,25,26,27], this study zeroes in on 31 July as a pivotal instance to scrutinize the principal precipitation phase of the local severe convection rainstorm on this date. Utilizing the WRF model in conjunction with the three-dimensional precipitation diagnostic equation [21], this paper aims to unveil the intricate macro- and microphysical processes that culminate in the storm’s formation. The goal of this article is to enhance the comprehension of the mechanisms behind precipitation occurrence and development by delving into both macro- and microphysical processes. Additionally, it aims to offer practical references for enhancing forecasting capabilities. The structure of this paper is methodically organized into six key sections: the first part is the introduction. The second part of this article is an introduction to the data, model schemes, and three-dimensional precipitation diagnostic equations. The third part is the introduction of the July local strong convection rainstorm process. The fourth part aims to compare and verify the model simulation results. The fifth part uses a three-dimensional precipitation diagnostic equation to diagnose and analyze the main period of the July local severe convection rainstorm process. The sixth part is the conclusion.

2. Materials and Methods

2.1. Data

The dataset employed in this research comprises the following:
(1) Observational data from Ningbo’s encrypted automatic stations: recorded on 31 July 2021, this dataset includes readings from 471 stations, offering high spatiotemporal resolution across various meteorological parameters such as temperature, pressure, humidity, wind, and precipitation. The dataset has undergone stringent quality control to ensure its reliability.
(2) Doppler Radar Data: utilizing the Z9574 Doppler radar, this dataset provides observations at six-minute intervals. Radar reflectance data has been preliminarily processed to compute the combined reflectance factor, offering insights into the spatial distribution and intensity of the precipitation.
(3) ERA5 Reanalysis Data: sourced from the European Centre for Medium-Range Weather Forecasts (ECMWF), this dataset offers a fine spatial resolution of 0.25 degrees and a temporal resolution of six hours. It includes comprehensive meteorological elements such as height, temperature, wind field, relative humidity, specific humidity, divergence, and vertical velocity across 26 isobaric surfaces (http://apps.ecmwf.int/datasets/data/interim-full-daily/levtype=sfc/ (accessed on 1 August 2021)) [28].
(4) FNL Reanalysis Data: provided by the National Centers for Environmental Prediction (NCEP) in the United States, this dataset features a spatial resolution of 1 degree and a temporal resolution of six hours. Similar to the ERA5 data, it covers an extensive range of meteorological elements at 26 isobaric surfaces (http://rda.ucar.edu/datasets/ds083.2/ (accessed on 1 August 2021)) [29]. These diverse and detailed datasets form the backbone of our study, enabling a comprehensive analysis of the local severe convective rainstorm from multiple perspectives.
The data used in the paper are shown in Table 1.

2.2. Mode Scheme

In this study, the WRF (v3.6.1) model is utilized to conduct a high-resolution numerical simulation of the primary precipitation event during a localized severe convective storm. The simulation employs a triple one-way nested grid structure (Figure 1), featuring vertical stratification across 50 layers, with the model’s top layer set at 50 hPa. The horizontal resolutions are meticulously set to 12 km (D01), 4 km (D02), and 1.33 km (D03) to capture the intricate details of the storm’s evolution. To accurately simulate the physical processes driving the precipitation, the simulation incorporates a suite of sophisticated parameterization schemes. These include the WDM6 microphysical parameterization scheme for detailing microphysical processes, the RRTM longwave and Dudhia shortwave radiation schemes for atmospheric radiation dynamics, the Yonsei University (YSU) scheme for boundary layer physics, and the Kain–Fritsch (KF) cumulus convection parameterization scheme, which is exclusively applied within the outermost grid (D01). To optimize resource use and computational efficiency while improving the simulation’s accuracy, the “ndown” method is employed. This technique facilitates the transfer of initial and boundary values from the model’s outer grid to its inner layers, ensuring consistency and enhancing detail in the simulation’s finer scales. The integration period spans from 00:00 to 18:00 on 31 July 2021 for the D01 and D02 regions, totaling 18 h. To refine the simulation outcomes further, the integration for the D03 region begins 6 h later, running from 06:00 to 18:00 on the same day, a total of 12 h. This staggered integration approach, detailed in Table 2, is meticulously designed to capture the complex dynamics of the severe convective rainstorm, offering insights into its development and potential impacts.

2.3. Three-Dimensional Precipitation Diagnostic Equation

Drawing on the water mass equation within the WRF model as outlined [30], a three-dimensional diagnostic equation specifically for surface precipitation was developed [19], utilizing the WRF model framework. This equation serves as a foundational tool for diagnosing and understanding the dynamics of ground precipitation, highlighting the model’s capability to intricately simulate and analyze atmospheric precipitation processes.
P S = Q W V + Q C M
In the context of analyzing precipitation processes, Q W V = Q W V L + Q W V A + Q W V E + Q W V D represents the total rate of variation in water vapor-related processes. Similarly, Q C M = Q C L + Q C I denotes the total rate of variation in cloud-related processes, among which Q C L = Q C L L + Q C L A + Q C L D for the liquid-phase cloud process and Q C I = Q C I L + Q C I A + Q C I D for the ice-phase cloud process. Each of these terms captures specific aspects of the precipitation process, from water vapor dynamics to the nuances of cloud phase changes, providing a comprehensive framework for understanding the multifaceted nature of precipitation formation and development.
P S = Z s Z t x ( r , i , s , g , h ) ( ρ a Q X V Q X ) z d z
Q W V L = z s Z t [ ( ρ a Q V ) t ] d z
Q W V A = z s Z t [ 3 · ( ρ a Q V V ) ] d z
Q W V E = Z s Z t E s d z
Q W V D = Z s Z t D I F F Q V d z
Q C L L = Z s Z t [ X ( c , r ) ( ρ a Q X ) t ] d z
Q C L A = Z s Z t X ( c , r ) [ 3 · ( ρ a Q X V ) ] d z
Q C L D = Z s Z t X ( c , r ) D I F F Q x d z
Q C I L = Z s Z t [ X ( i , s , g , h ) ( ρ a Q X ) t ] d z
Q C I A = Z s Z t X ( i , s , g , h ) [ 3 · ( ρ a Q X V ) ] d z
Q C I D = Z s Z t X ( i , s , g , h ) D I F F Q x d z
In this section, we define and elucidate the key variables and parameters integral to the analysis of precipitation physical processes. These include the heights of the top ( Z t ) and bottom ( Z s ) of the model layer, atmospheric density ( ρ a ), the water vapor mixing ratio ( Q V ), and the mixing ratios of various cloud water condensates ( Q X ), where Q c , Q r , Q i , Q s , Q g , and Q h denote cloud water, raindrops, ice particles, snow particles, graupel particles, and hail particles, respectively. The falling velocity of precipitation particles is represented by V Q X , while V signifies the three-dimensional wind speed. The dissipation rates of water vapor and cloud water condensates are denoted by D I F F Q V and D I F F Q X , respectively, and E s indicates the surface evaporation rate. These variables are essential for understanding the complex dynamics of precipitation and are detailed further in Table 3, providing a foundational understanding of the processes at play in the formation and evolution of precipitation.

3. Results

3.1. Local Severe Convective Rainstorm Process on 31 July 2021

Following the passage of Typhoon Fireworks in 2021, Ningbo City experienced a significant convective weather event on 31 July, triggered by the influence of robust convective cloud clusters. This event was marked by widespread, intense lightning and localized, short-duration heavy rainfall, showcasing a dramatic and sudden influx of rain. Notably, the weather phenomenon began at 09:00 on 31 July 2021 (Beijing Standard Time; the same standard is used below) and finished at 20:00, spanning a duration of 12 h. The storm’s impact was predominantly felt in Ninghai County, within Ningbo City, where a network of 13 monitoring stations recorded precipitation levels surpassing 150 mm, indicating the severity of the downpour. The peak of this deluge was recorded at Qiujia Station in Ninghai County, between 16:00 and 19:00, where rainfall reached an unprecedented 170 mm (Figure 2).

3.2. Simulation Verification

3.2.1. Verification of Circulation Characteristics and Evolution Simulation

Analyzing the atmospheric circulation patterns during this period reveals a significant influence on the weather events experienced in Ningbo City. The entire East Asian region was under the control of a high-altitude trough, with its lowest point reaching southward into China’s southern regions. On the morning of 31 July, this trough began moving eastward at a slow pace, positioning Ningbo in the path of warm and humid air flows in front of the trough. This set the stage for a unique atmospheric interaction. At the 850 hPa level, a notable shear line emerged along the coast, formed by the collision of northerly and southerly winds. This interaction not only provided optimal humidity conditions but also facilitated the accumulation of unstable energy in the lower atmosphere, along with the local convergence of water vapor. Ground observations further indicated that, by 14:00 on 31 July, Ningbo was predominantly under the influence of southerly winds. However, by 20:00, the city witnessed a transition to northerly winds in its western part, establishing a shear line near Ningbo with prevailing warm and humid conditions. From 14:00 to 20:00, a distinct local convergence zone of water vapor flux emerged in Ningbo’s western region, signaling the formation of local unstable conditions. This situation was the result of the synergistic effects of low-level shear lines and the influx of southerly warm and humid air, within a larger favorable atmospheric context. These dynamics laid the groundwork for the subsequent development of convective weather, illustrating a complex interplay of regional and local meteorological factors conducive to the occurrence of the severe convection observed on 31 July.
The simulation results from the WRF model for the D01 region, which boasts a resolution of 12 km (Figure 3), present an intriguing picture when juxtaposed with the ERA5 reanalysis data. As compared to that shown in Figure 3, the WRF model accurately reproduces the position and evolution of the high-altitude trough that impacted Eastern Asia during the rainstorm, although the simulated 500 hPa trough bottom is slightly displaced northward. The low-level shear line along the coast is also successfully reproduced by the model (as shown in the simulated wind fields at 850 hPa in Figure 4), despite minor northern displacement. There are discrepancies in the finer details of the high and low altitude circulation patterns and their evolution—such as the positioning of the 500 hPa trough bottom, the location of the 850 hPa shear line, and wind directions—and these variations have influenced the simulation’s depiction of radar echoes and the precipitation area during Ningbo’s localized heavy rainfall event (Figure 4). However, despite these variances leading to deviations in the simulated radar echo locations and the mapped precipitation areas, the model demonstrates a robust capacity to capture the essence of the main circulation system accurately. It reproduces echo structures and cumulative precipitation patterns that are remarkably consistent with actual observations. This fidelity suggests that although there are minor differences in specific atmospheric features, the overall effectiveness of the model in replicating the key characteristics of the weather system and its impact on Ningbo remains intact. The simulation, therefore, serves as a valuable tool in understanding and analyzing the meteorological dynamics at play, providing insights into the conditions conducive to the observed severe convective activity.

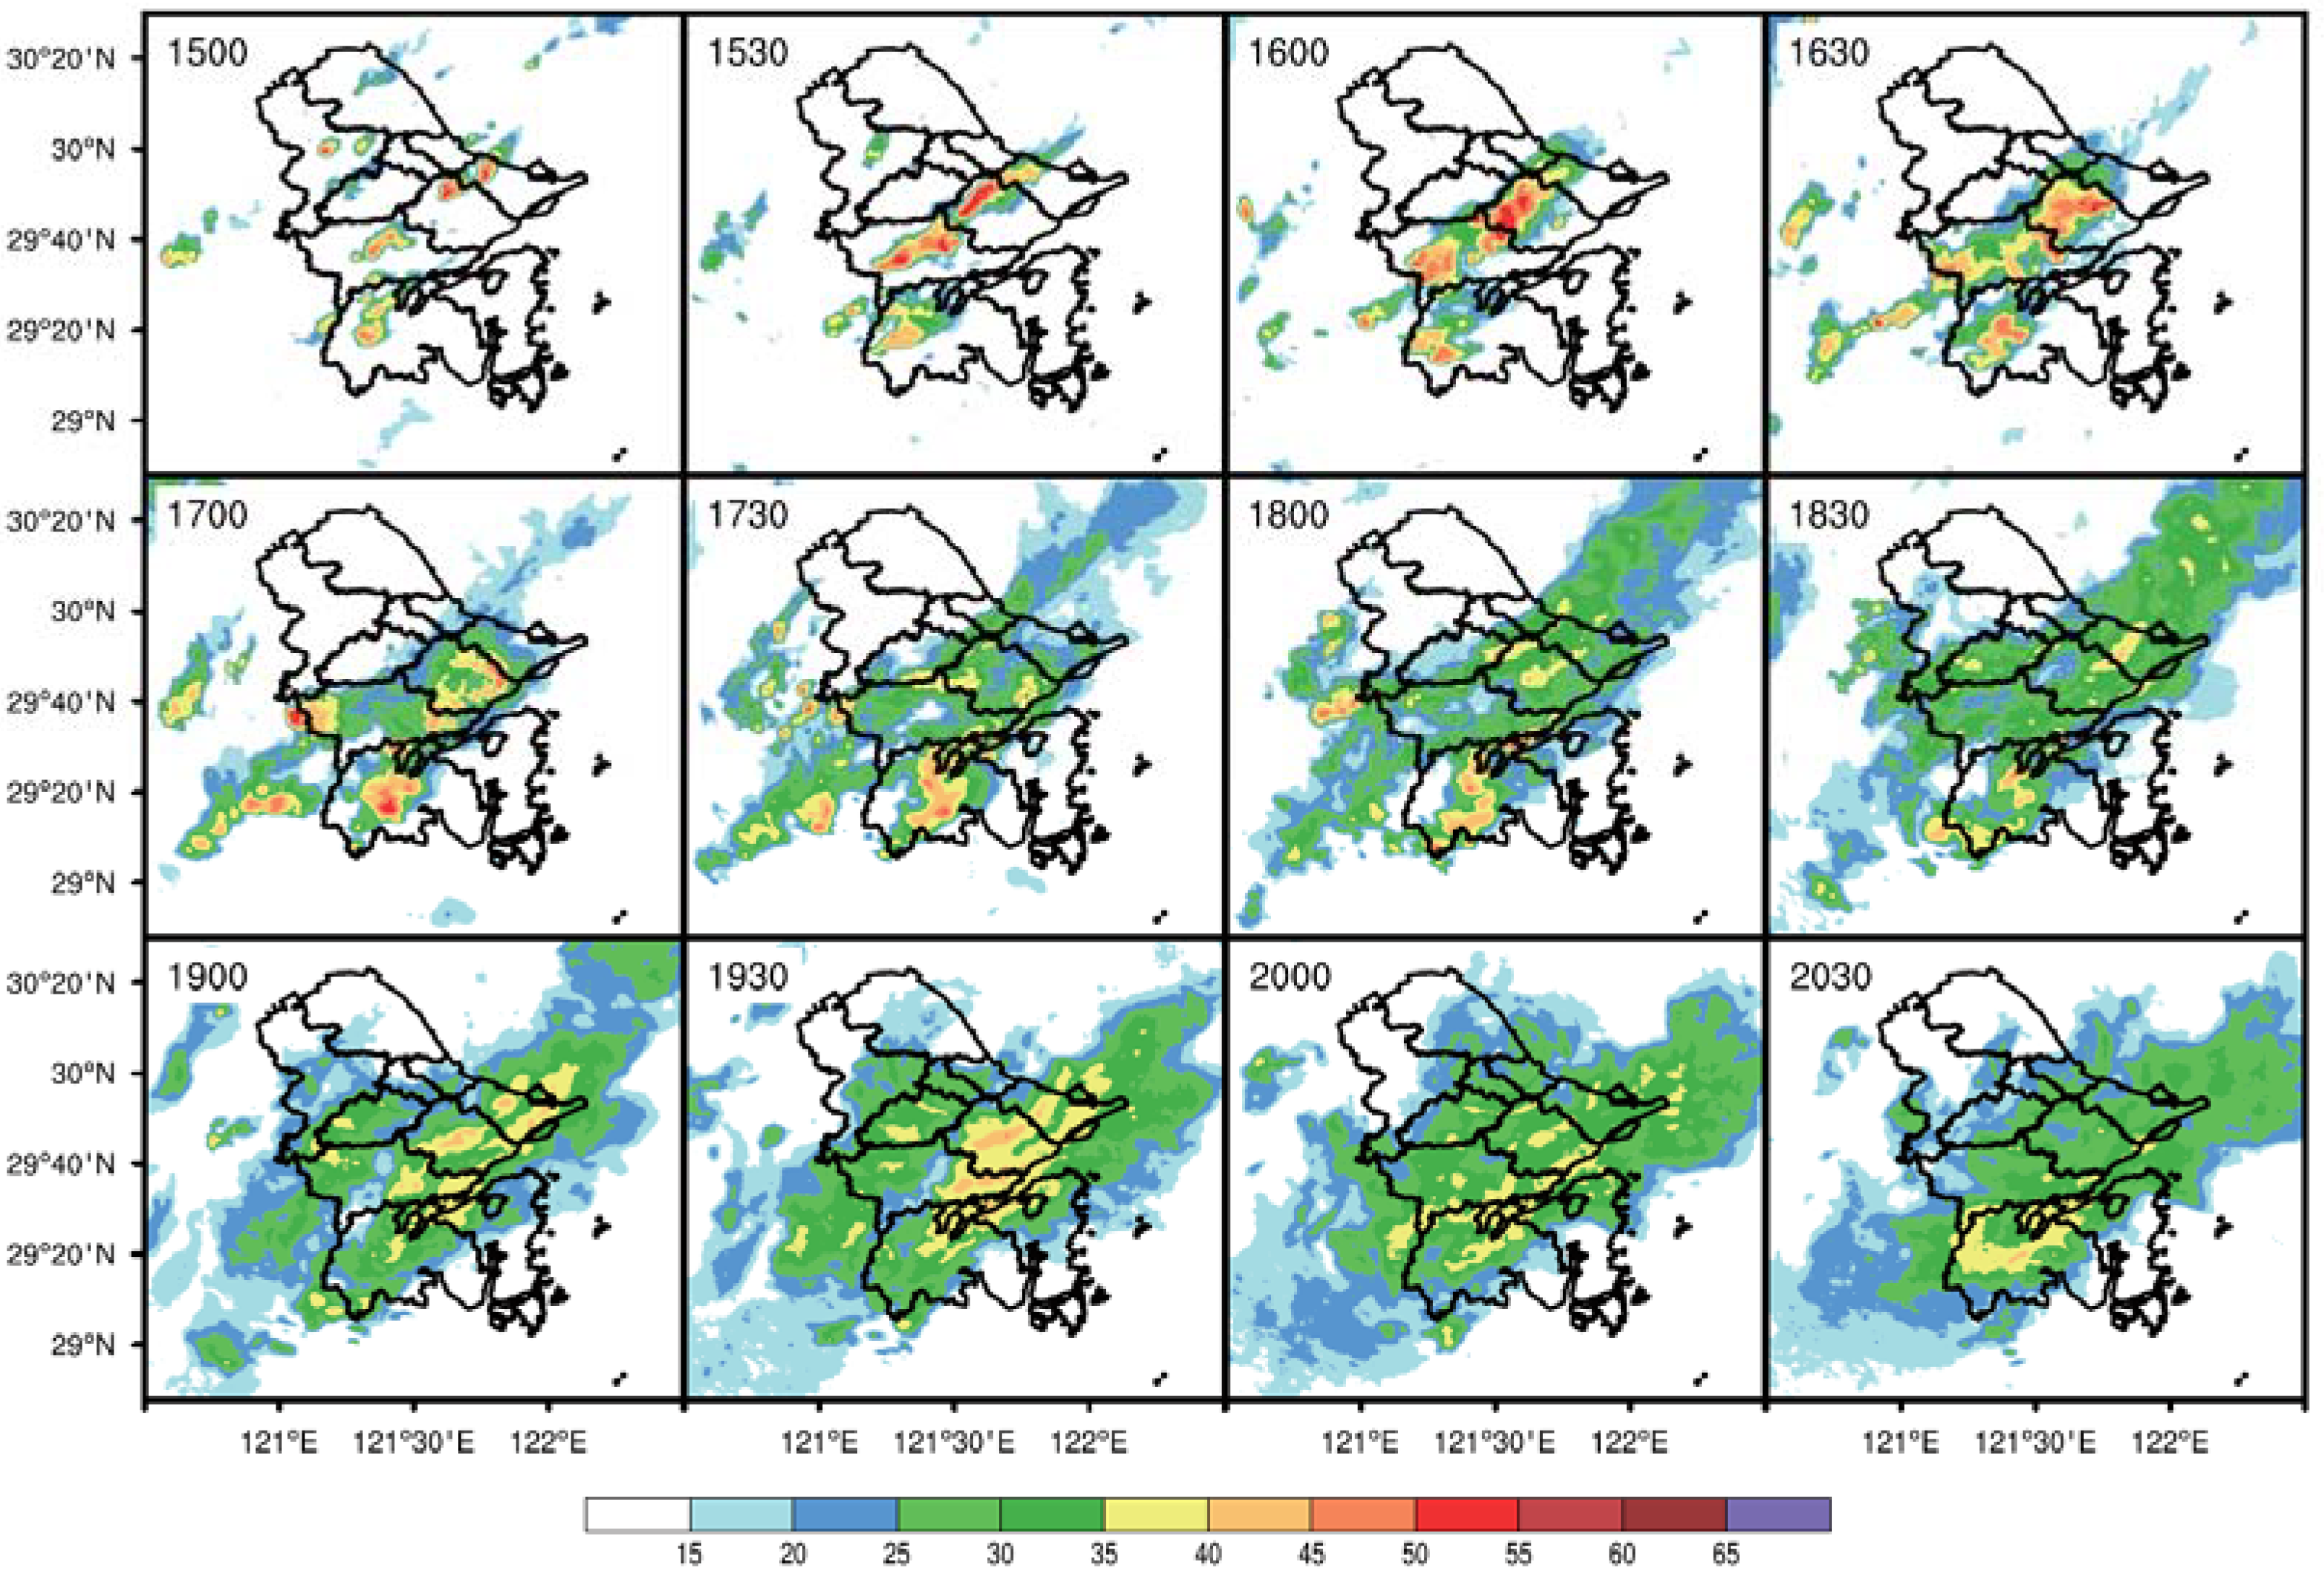
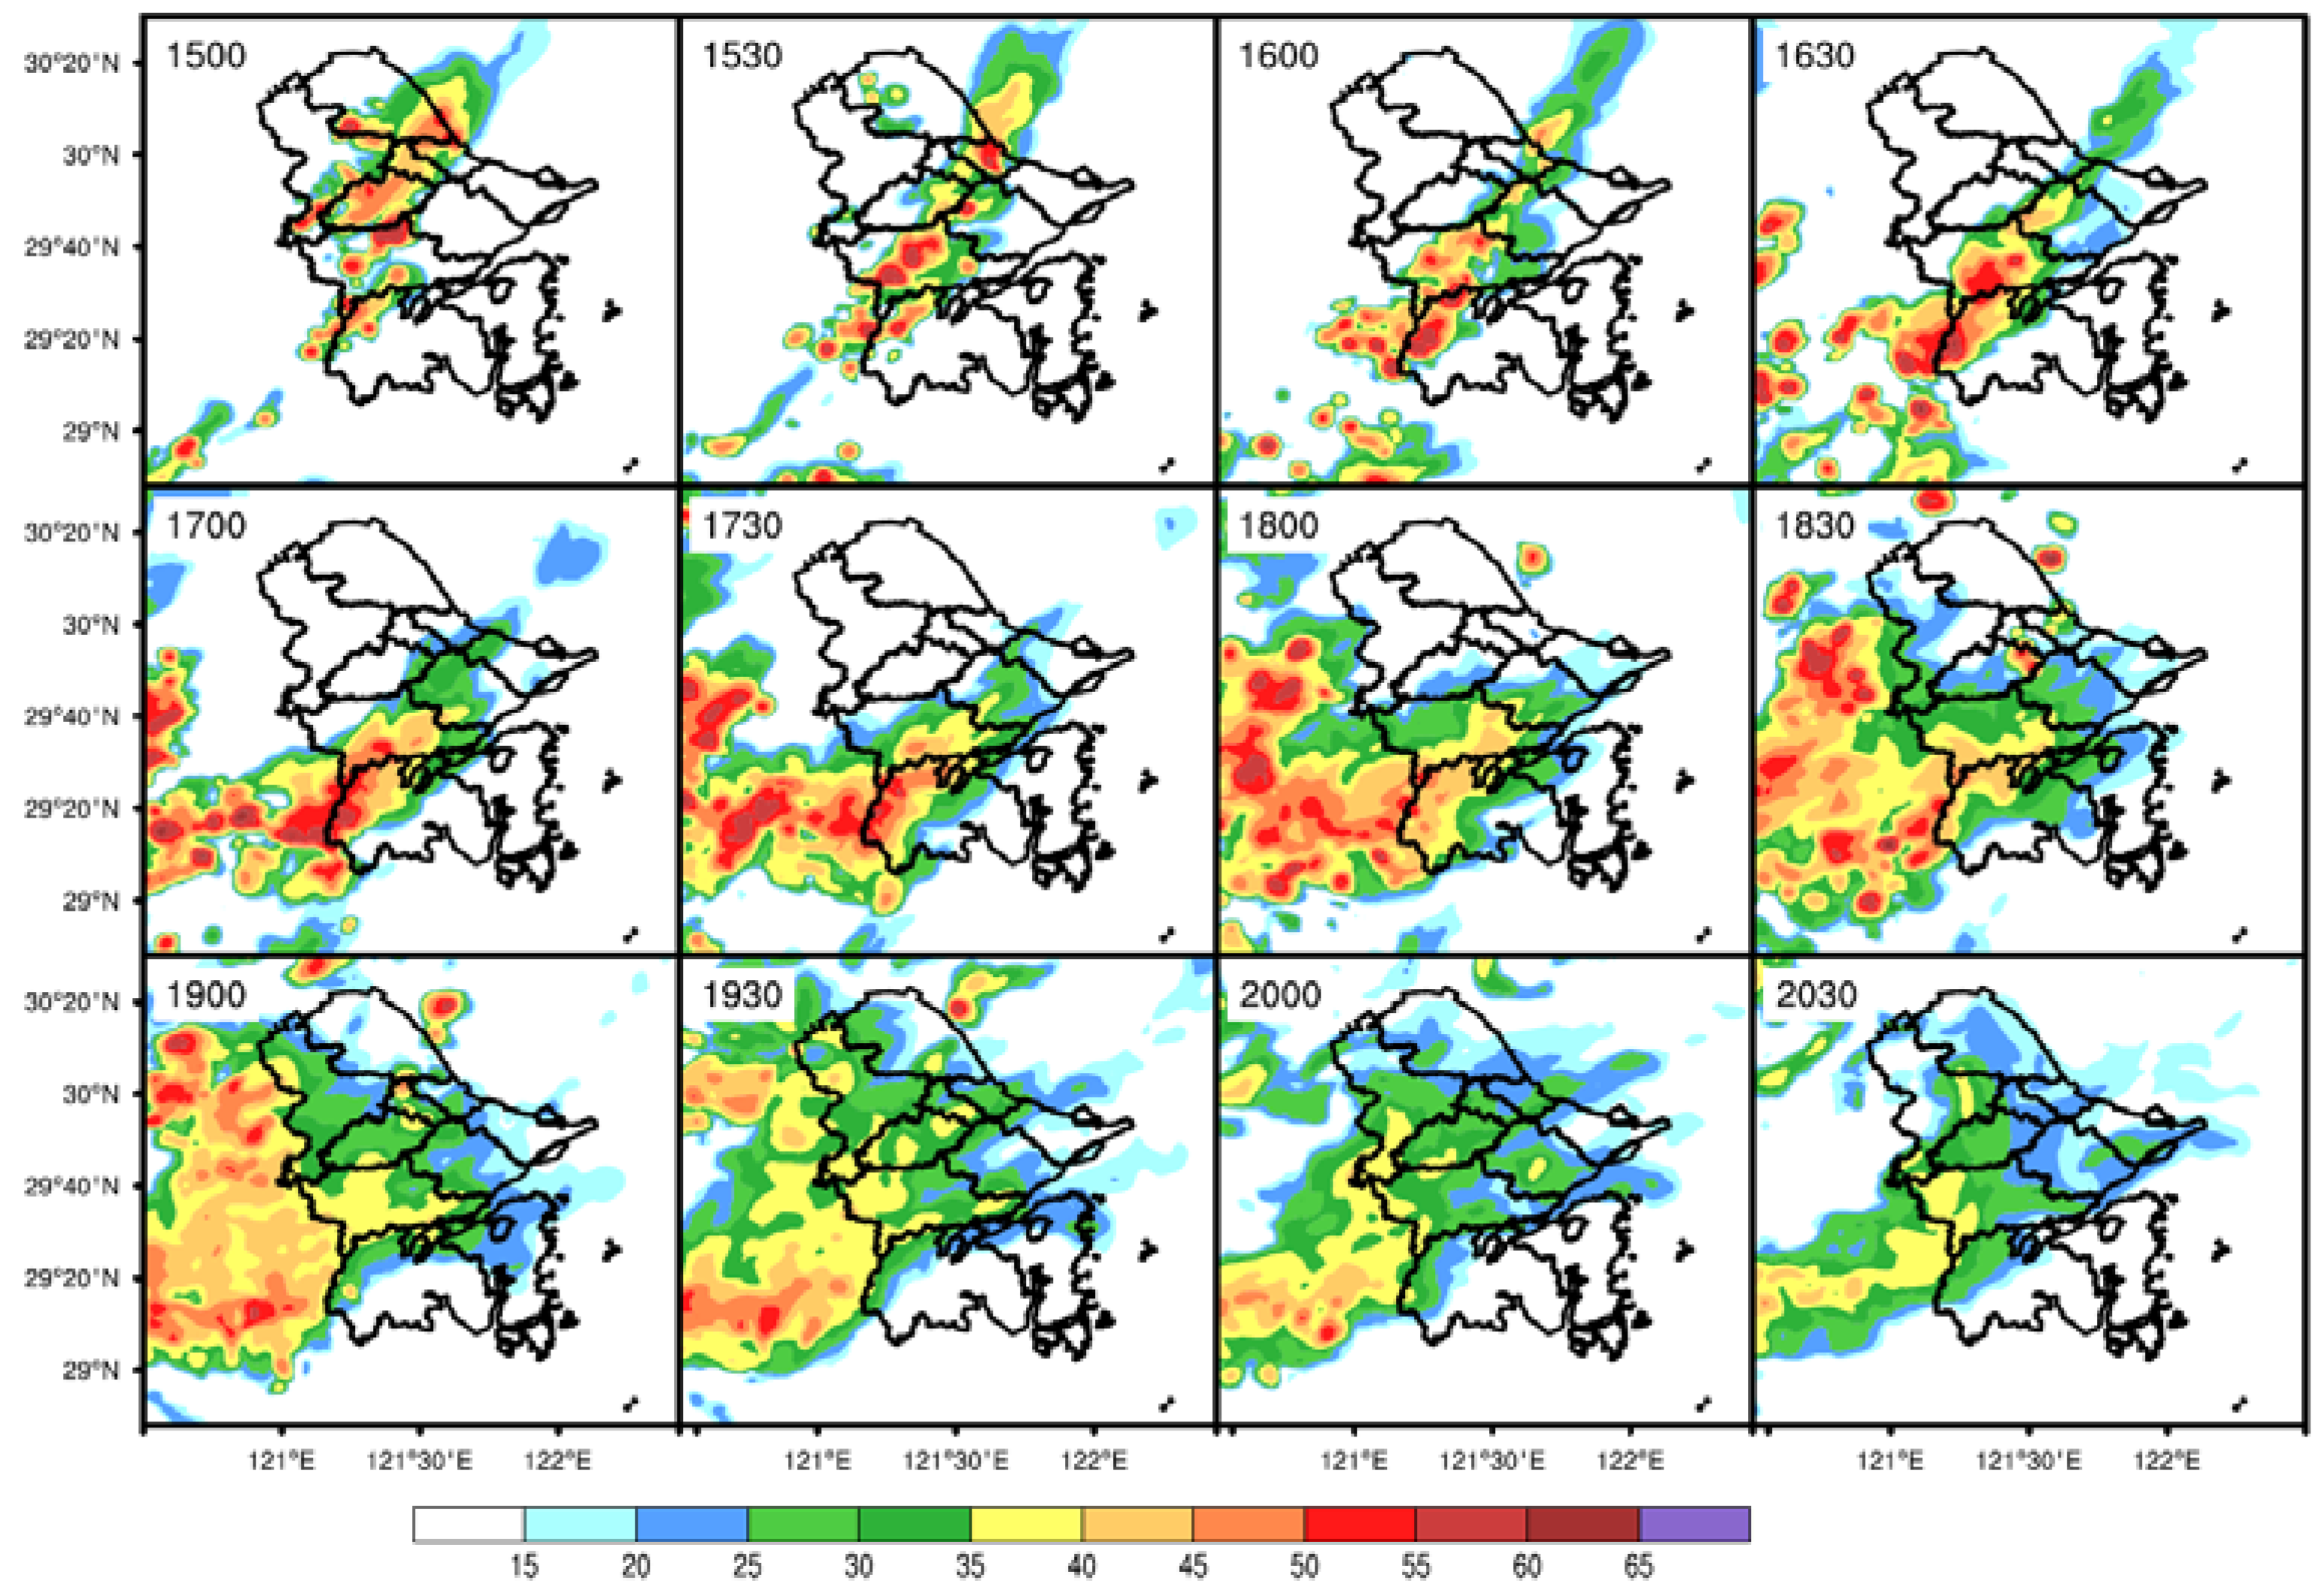
3.2.2. Radar Reflectivity Characteristics and Evolution Simulation Verification

The WRF model also accurately reproduces the convective system that results in the rainstorm event in Ningbo, as compared with simulated and observed radar reflectivity (cf., Figure 5 and Figure 6). Initially, precipitation echoes are predominantly located in the central and northern areas of Ningbo, exhibiting increasing intensity and organizing into linear convection patterns that intensify and move toward the southwest (Figure 5). The simulation captures the convection initiation (CI) from 15:00 and reproduces the upscale growth of the CI into a linear convective system. However, the convection system is slightly northward-displaced, as it is impacted by the displacement of the simulated atmospheric circulations (e.g., the 500 hPa trough bottom and the low-level shear line). In addition, the simulated linear convection is a bit longer and has greater reflectivity than the observation during its development from 15:00 to 16:30 (Figure 6). It is generally acceptable because the simulated radar reflectivity accurately reproduces the initiated location and subsequent merge of the rainstorm. By approximately 17:00, observed echoes are initiated in the western mountainous regions and yield the second heavy precipitation center from 17:00 to 18:00 (Figure 5 and Figure 7). Our simulation also captures the development of this western convection after 17:00, although the center of this convection is more intense and displaced slightly westward compared to the observation (Figure 6). The extended convection towards the western mountains is reasonable in the simulation because the radar could hardly observe the convections over the western mountains due to the block of echo by the mountains; therefore, the observed radar reflectivity is usually underestimated over mountainous regions. (Figure 5). The simulation accurately reflects the trend throughout the rainstorm event, ensuring that the characteristics of heavy precipitation evolution in Ningbo align well with the observation. Nonetheless, the simulation suggests a westward and more intense echo compared to the actual observations, leading to a corresponding westward shift in the depicted precipitation intensity within the Ningbo area. This nuanced portrayal underscores the model’s effectiveness in replicating key weather phenomena, while also highlighting areas for refinement in simulating the spatial distribution and intensity of precipitation.

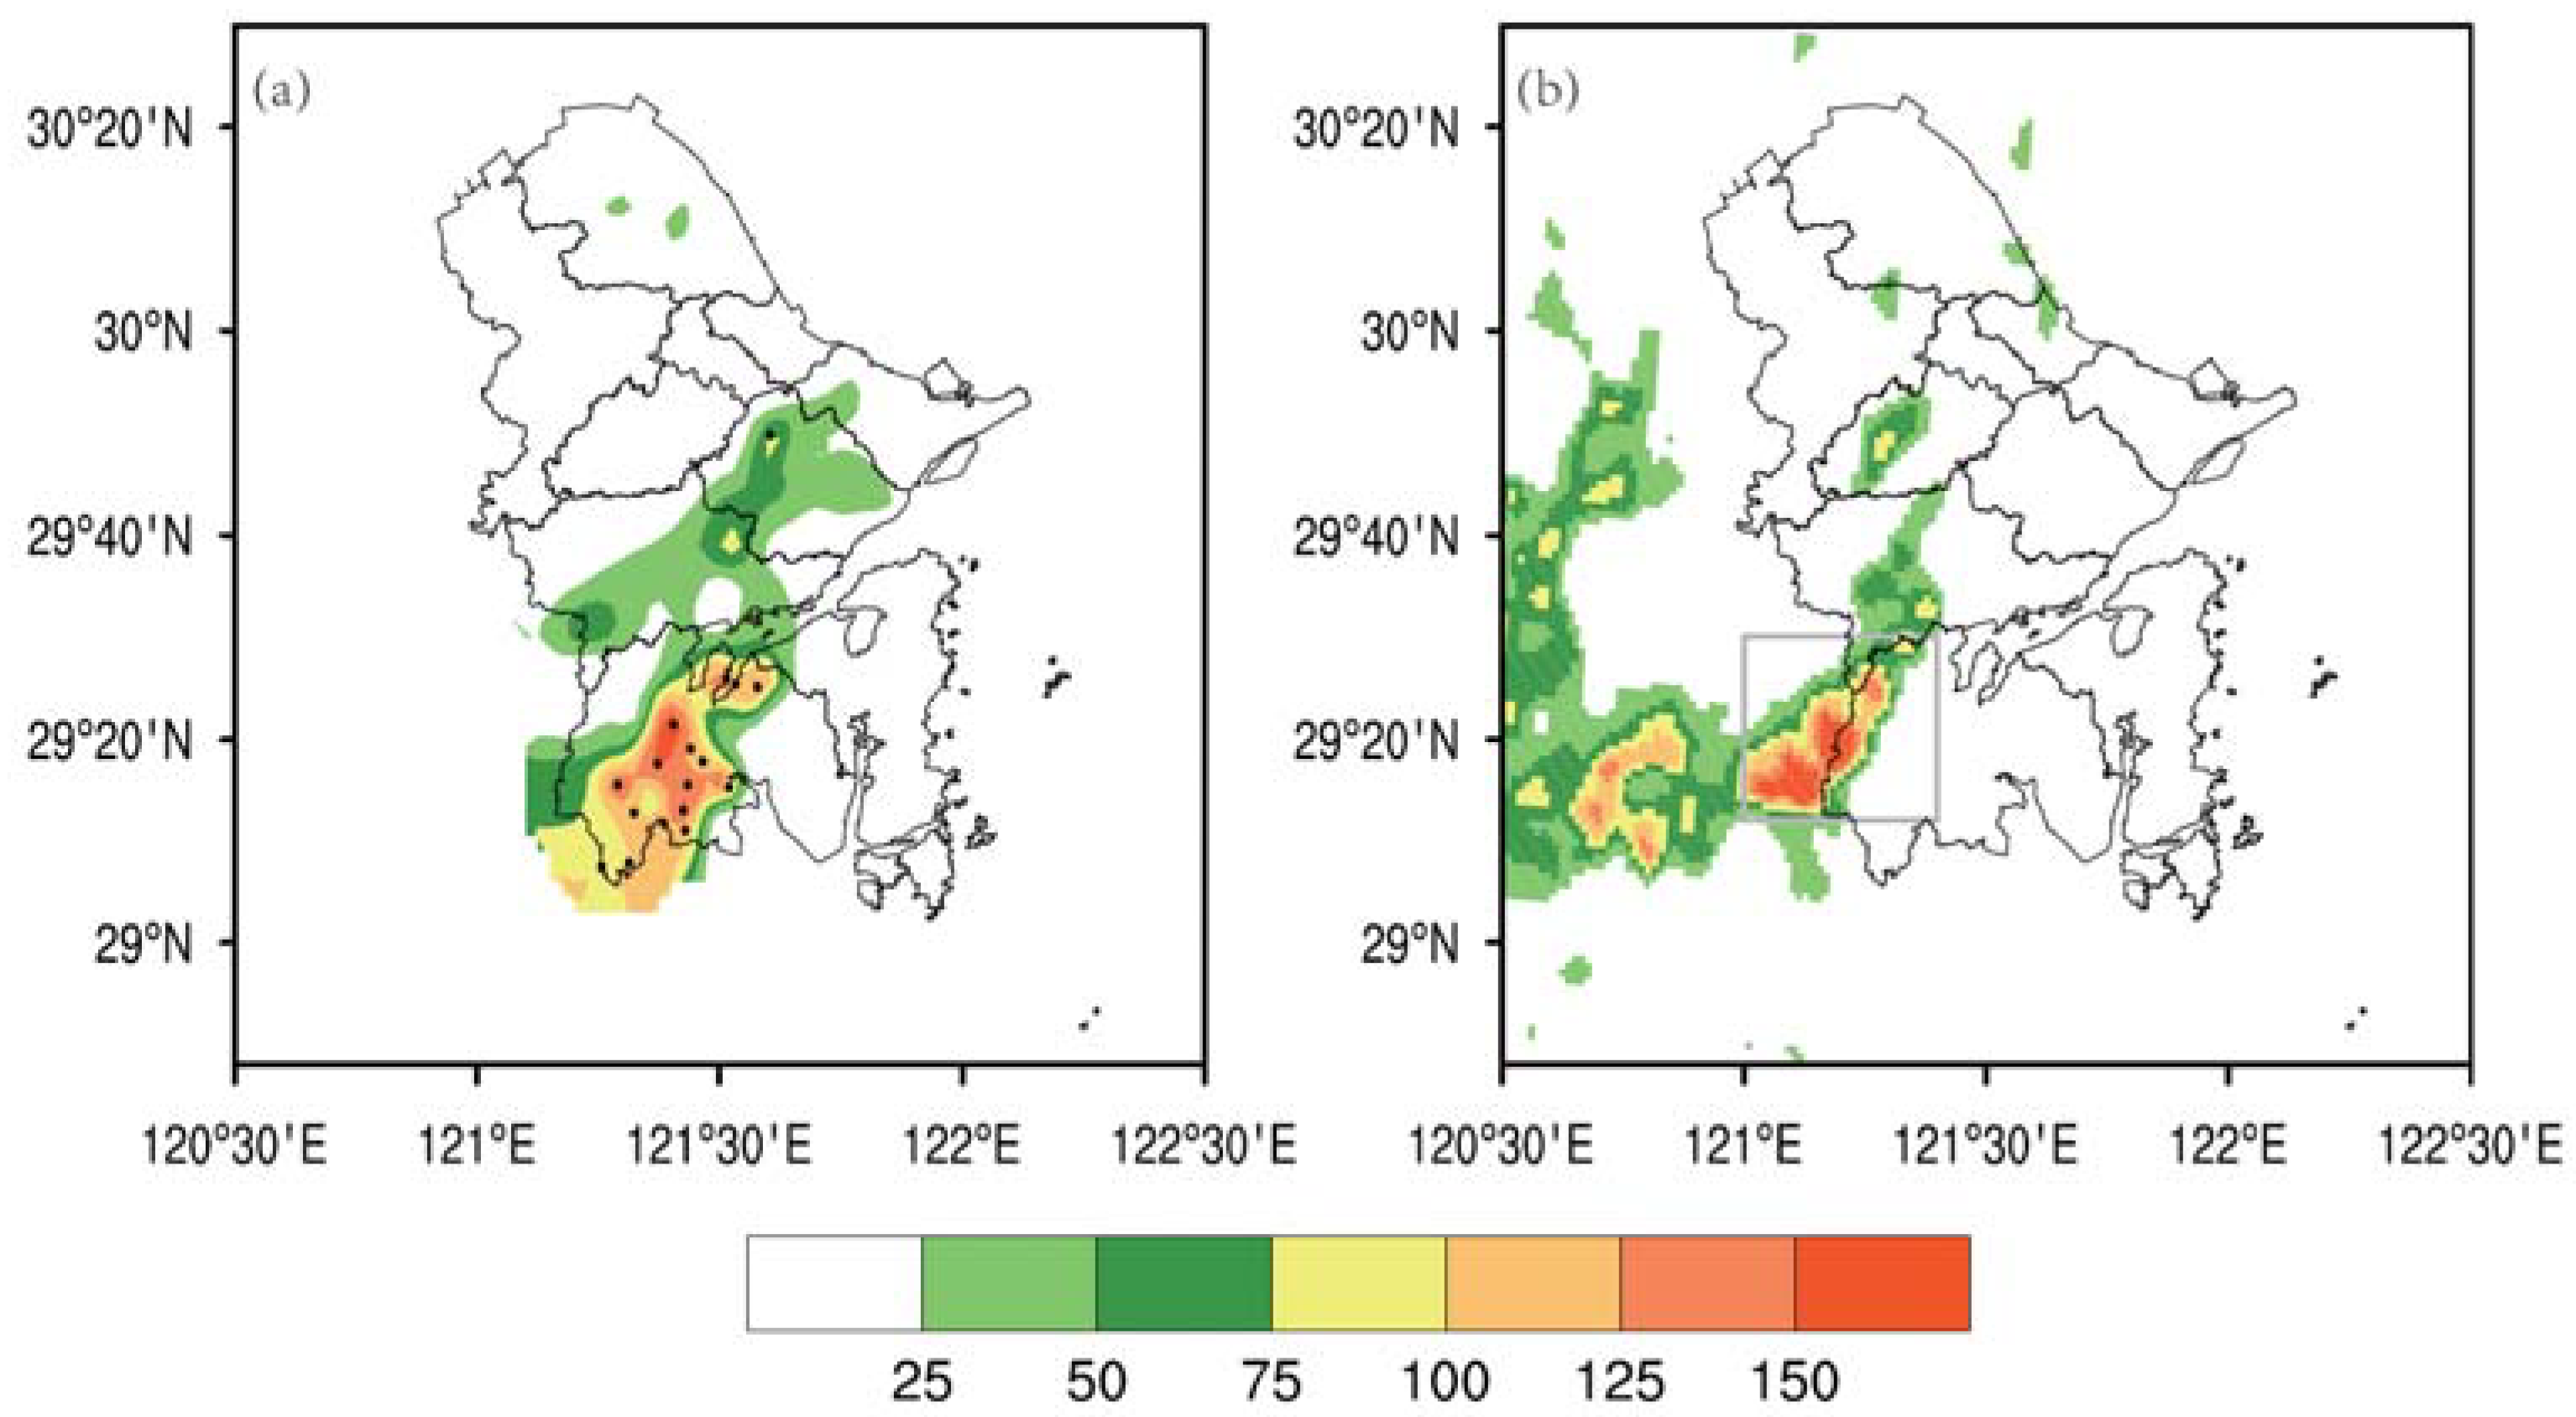
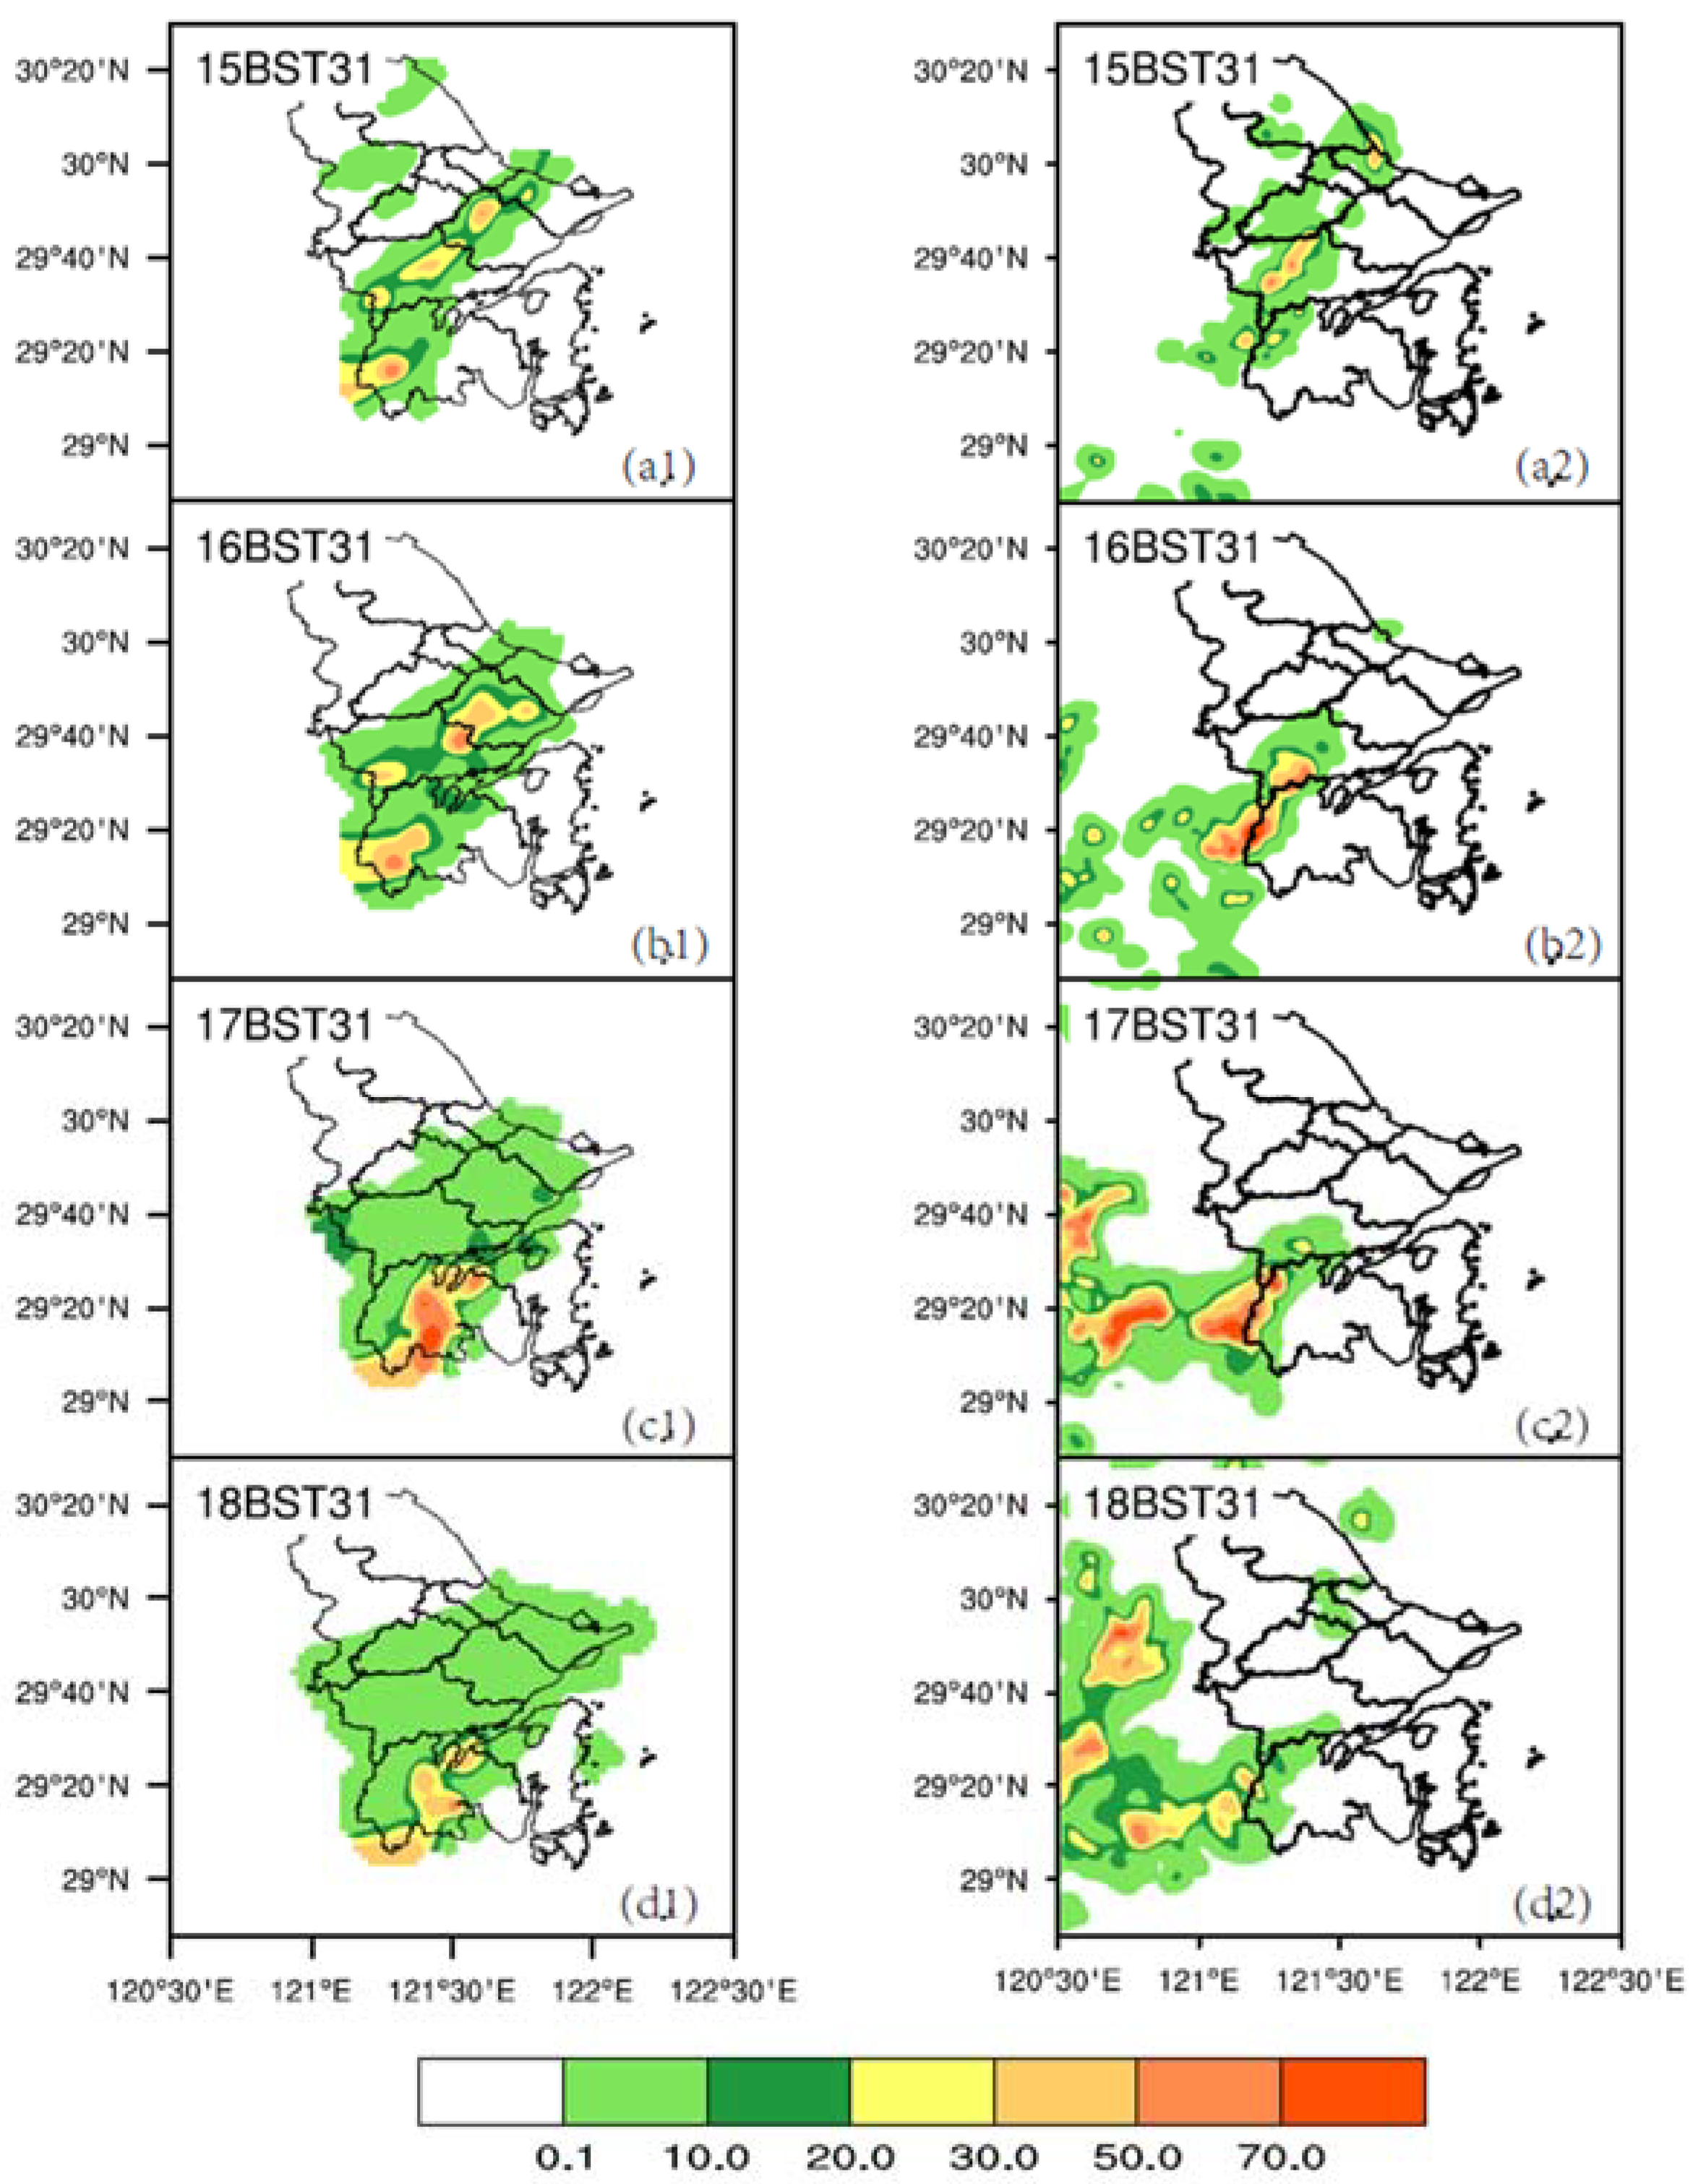
3.2.3. Simulation and Verification of Hourly Rainfall Evolution

The analysis of hourly precipitation data from automatic stations reveals that the local severe convective rainstorm on 31 July primarily unfolded between 15:00 and 18:00, typifying a classic afternoon convective precipitation event. The precipitation initially emerged in the central and western mountainous regions of Ningbo, eventually coalescing and shifting southward. This movement culminated in an hourly maximum precipitation center exceeding 130 mm per hour in Ninghai at 17:00, suggesting a significant interaction with the local terrain. Subsequently, the system continued its southward trajectory, albeit with diminishing intensity, and by 19:00, the convective precipitation process concluded, departing the Ningbo area.
The WRF model adeptly captured the development and evolution of the main precipitation period of this localized severe convective storm. During the first stage of this rainstorm (15:00 to 16:00), the simulation reproduces the initiation location of the rainstorm and linear morphology of the subsequent upscale growth (Figure 8). However, the rainfall center transfers earlier from the northern area to the western mountainous regions at 16:00. Nevertheless, the simulation accurately reproduces the western rainfall over the mountainous regions, with consistent rainfall amount but slightly westward-displaced location (Figure 8). Despite minor discrepancies, such as a slight misalignment in the location of peak hourly precipitation rates, the model accurately replicated the onset, the south-to-north distribution along the mountainous regions from 15:00 onwards, and the timing of the short-term heavy rainfall events in later stages. The two rainfall centers in the northern area and western mountains are well captured by the model, reasonably reflecting the initiation of the linear convection and the subsequent development of the western convection. This fidelity is attributed to the model’s accurate simulation of the 500 hPa high-altitude trough and the primary precipitation systems, resulting in a rainfall simulation that aligns well with actual observations. We should also admit that differences exist between the simulated rainfall and observations, especially the shorter duration of the northern rainfall and the westward displacement of the mountainous rainfall. Nevertheless, these discrepancies may not influence the following analysis once appropriate regions and timing are selected.
In summary, given the model’s effectiveness in mirroring the event’s progression and the key atmospheric conditions, the high-resolution numerical simulation results presented in this study offer a valuable foundation for the further diagnostic analysis of the precipitation’s physical processes. The following analyses are focused on the rainfall evolution during different periods. Since the simulation captures the spatial distribution and evolution of major rainfall centers reasonably well, and the main discrepancies as compared with observations exist in the slight displacements of distribution, we may use the simulation results in the next section to analyze the quantitative precipitation process during the rainstorm. This analysis not only enhances our understanding of the dynamics behind severe convective storms but also underscores the utility of advanced modeling techniques in predicting and studying weather phenomena.

3.3. Diagnosis of Precipitation Physical Processes

To investigate the macroscopic and microscopic physical processes driving precipitation during the main phase of the July localized severe convective rainstorm, we employed the three-dimensional precipitation diagnostic equation [19]. Focusing on key precipitation zones (29.2°~29.5° N, 121.0°~121.4° E), highlighted within the gray boxed area in Figure 2b, we utilize high-resolution numerical simulation data (D03, with a temporal resolution of 6 min and a spatial resolution of 1.33 km). This enables a detailed diagnosis and analysis of the physical precipitation mechanisms during the critical phase of the July rainstorm event.
Figure 9 illustrates the temporal dynamics of the average precipitation rate alongside the variations in processes related to water vapor, liquid-phase clouds, and ice-phase clouds within the specified regions from 15:00 to 19:00 on 31 July 2021. When evaluating the overall precipitation budget, the trends in water vapor budget-related changes ( Q W V ) and precipitation intensity ( P S ) align closely, both exhibiting a pattern of initial increase followed by a decrease. Prior to reaching the peak precipitation intensity at 17:06, water vapor not only facilitates the onset and expansion of precipitation but also supports the growth of cloud systems ( Q C M ). An analysis into the fluctuations in water vapor-related processes reveals that before the peak in Q W V , the rate of three-dimensional water vapor flux convergence ( Q W V A ) plays a crucial role in both precipitation formation and atmospheric humidification (indicated by a negative Q W V L ). As precipitation progresses, the strength of Q W V A diminishes, falling below the precipitation intensity ( P S ), which suggests that while water vapor convergence is no longer sufficient to sustain precipitation, it still contributes to ongoing precipitation processes. Consequently, the moisture content in the local atmosphere notably reduces (positive Q W V L ), indicating its role in supporting the continuation of moderately intense precipitation ( P S ).
While the variability in the cloud water condensate budget ( Q C M ) is similar in magnitude to that of the water vapor budget ( Q W V ), its behavior is more intricate. The transition from water vapor to surface precipitation crucially hinges on the cloud water condensate budget process, underscoring its vital role in precipitation’s genesis and growth. Examining the dynamics of liquid-phase water condensate (encompassing cloud water and raindrops), the dominant factor is the negative local strain rate of liquid-phase water condensate ( Q C L L ). Before the peak of precipitation, robust water vapor condensation leads to a steady increase in liquid-phase water condensate, facilitating the rapid expansion of the precipitation cloud system. This underscores the cloud microphysical processes’ significant contribution to the rapid intensification of the local severe convective storm and the robust precipitation cloud system on 31 July. Notably, during this phase, the divergence rate of liquid-phase cloud water condensate ( Q C L A in Figure 8) is considerably lower than its generation rate ( Q C L L in Figure 8), likely due to the supportive role of abundant atmospheric water vapor in cloud system development. As precipitation begins to wane, the echo diminishes, and substantial liquid-phase water condensate is consumed, destabilizing the precipitation system. Conversely, the ice-phase water condensate budget (including ice crystals, snow particles, and graupel) follows a distinct trajectory. The negative local strain rate ( Q C I L ) and flux convergence/divergence rate ( Q C I A ) of ice-phase water condensate are both critical. Throughout the precipitation event, the dynamic divergence of ice-phase water condensates ( Q C I A ) remains negative, indicating a vertical motion-driven dispersion and upward transport during the precipitation phase. The formation rate of ice-phase water condensate ( Q C I L ) exhibits a positive-negative-positive pattern, suggesting an initial conversion to liquid phase followed by an increase due to vertical movements. Post-precipitation peak, both liquid and ice-phase condensates decrease, contributing to ongoing precipitation.
As the storm cloud system evolves and approaches Ningbo, depicted in Figure 6, the convection dynamics within the area begin to intensify, leading to an increase in vertical updrafts. By around 17:00, these vertical movements reach their peak in both intensity and vertical extent, coinciding with periods of heavy rainfall in Ningbo, as illustrated in Figure 8. Subsequently, with the precipitation cloud system’s movement away from the area, there is a noticeable weakening and shrinking of vertical upward movements, paralleled by a dissipation of rain echoes in areas of heavy rainfall, captured in Figure 6. During the early phases of the main precipitation event, the initial vertical updrafts are relatively weak, peaking at a height of approximately 4 km below the zero-degree isotherm, before intensifying and expanding upwards to a maximum height of 12 km. In the later stages of the precipitation event, the descending motion of raindrops create a negative center of vertical movement below the zero-degree isotherm, located roughly at 4 km. As the storm system continues to move away, as shown in Figure 8, the profile of vertical movements starts to narrow, marking the conclusion of the significant precipitation event.
Under the influence of robust vertical uplift, Ninghai experiences pronounced variations in the levels of different water condensates. This change is catalyzed by the strengthening of vertical updrafts, leading to a general uptick in the quantity of water condensates, albeit at varying rates. Notably, the accumulation of graupel particles and raindrops sees the most substantial increase, peaking concurrently with the apex of precipitation intensity, thereafter initiating a gradual decline. The marked fluctuations in raindrop concentrations are directly tied to shifts in surface precipitation intensity ( P s ), as illustrated in Figure 8, while the dynamics of graupel particles are closely linked to the melting processes occurring beneath the zero-degree layer. While cloud water and snow also underwent changes, their variations are less pronounced compared to those of raindrops and graupel particles. A key observation is that the intensified vertical upward motion led to localized water vapor convergence and the activation of microphysical processes associated with cloud-scale dynamic convergence and vapor condensation, as seen in Figure 8. This results in an augmented content of cloud water condensates. However, the interplay between various water condensates, driven by microphysical transformations and cloud-scale dynamic processes, further instigates the dispersion of upper-level ice-phase particles, as depicted in Figure 8. This complex interplay results in relatively minor changes in cloud water and snow particle concentrations.

4. Conclusions

This study delves into the critical precipitation phase of the July localized severe convective rainstorm event in Ningbo, employing a multidisciplinary approach for comprehensive analysis. Leveraging minute-level precipitation data from regional automatic weather stations, Doppler radar echo insights, and reanalysis datasets from both the European Centre for Medium-Range Weather Forecasts (ERA5) and the National Centers for Environmental Prediction’s Final Analysis (FNL), we meticulously explore the precipitation’s distribution and progression, atmospheric circulation patterns, and the intricacies of the three-dimensional precipitation diagnostic equation. Utilizing the WRF, we conduct high-resolution simulation studies to enhance our understanding of this severe convective rainstorm. Our findings are summarized as follows:
(1)
The precipitation event on 31 July in Ningbo was initiated and intensified locally, catalyzed by favorable large-scale quasi-geostrophic dynamics alongside specific regional conditions. These included the eastward movement of the 500 hPa trough and the 850 hPa shear line, as well as potentially influential outflows from the cold pool of the local convective system. The validation of the simulation across various parameters—such as high- and low-altitude circulation patterns, combined radar reflectivity, and hourly precipitation rates—indicates a commendable alignment with observational data. Despite some discrepancies in finer details, the model adeptly captured the primary characteristics and progression of major atmospheric circulations and weather systems. The simulated radar echo’s structure and evolution closely mirrored actual observations, with the onset of heavy rainfall matching real-world timings. Additionally, the model accurately represented the spatial distribution of intense rainfall, its developmental phases, and the duration, aligning well with recorded events.
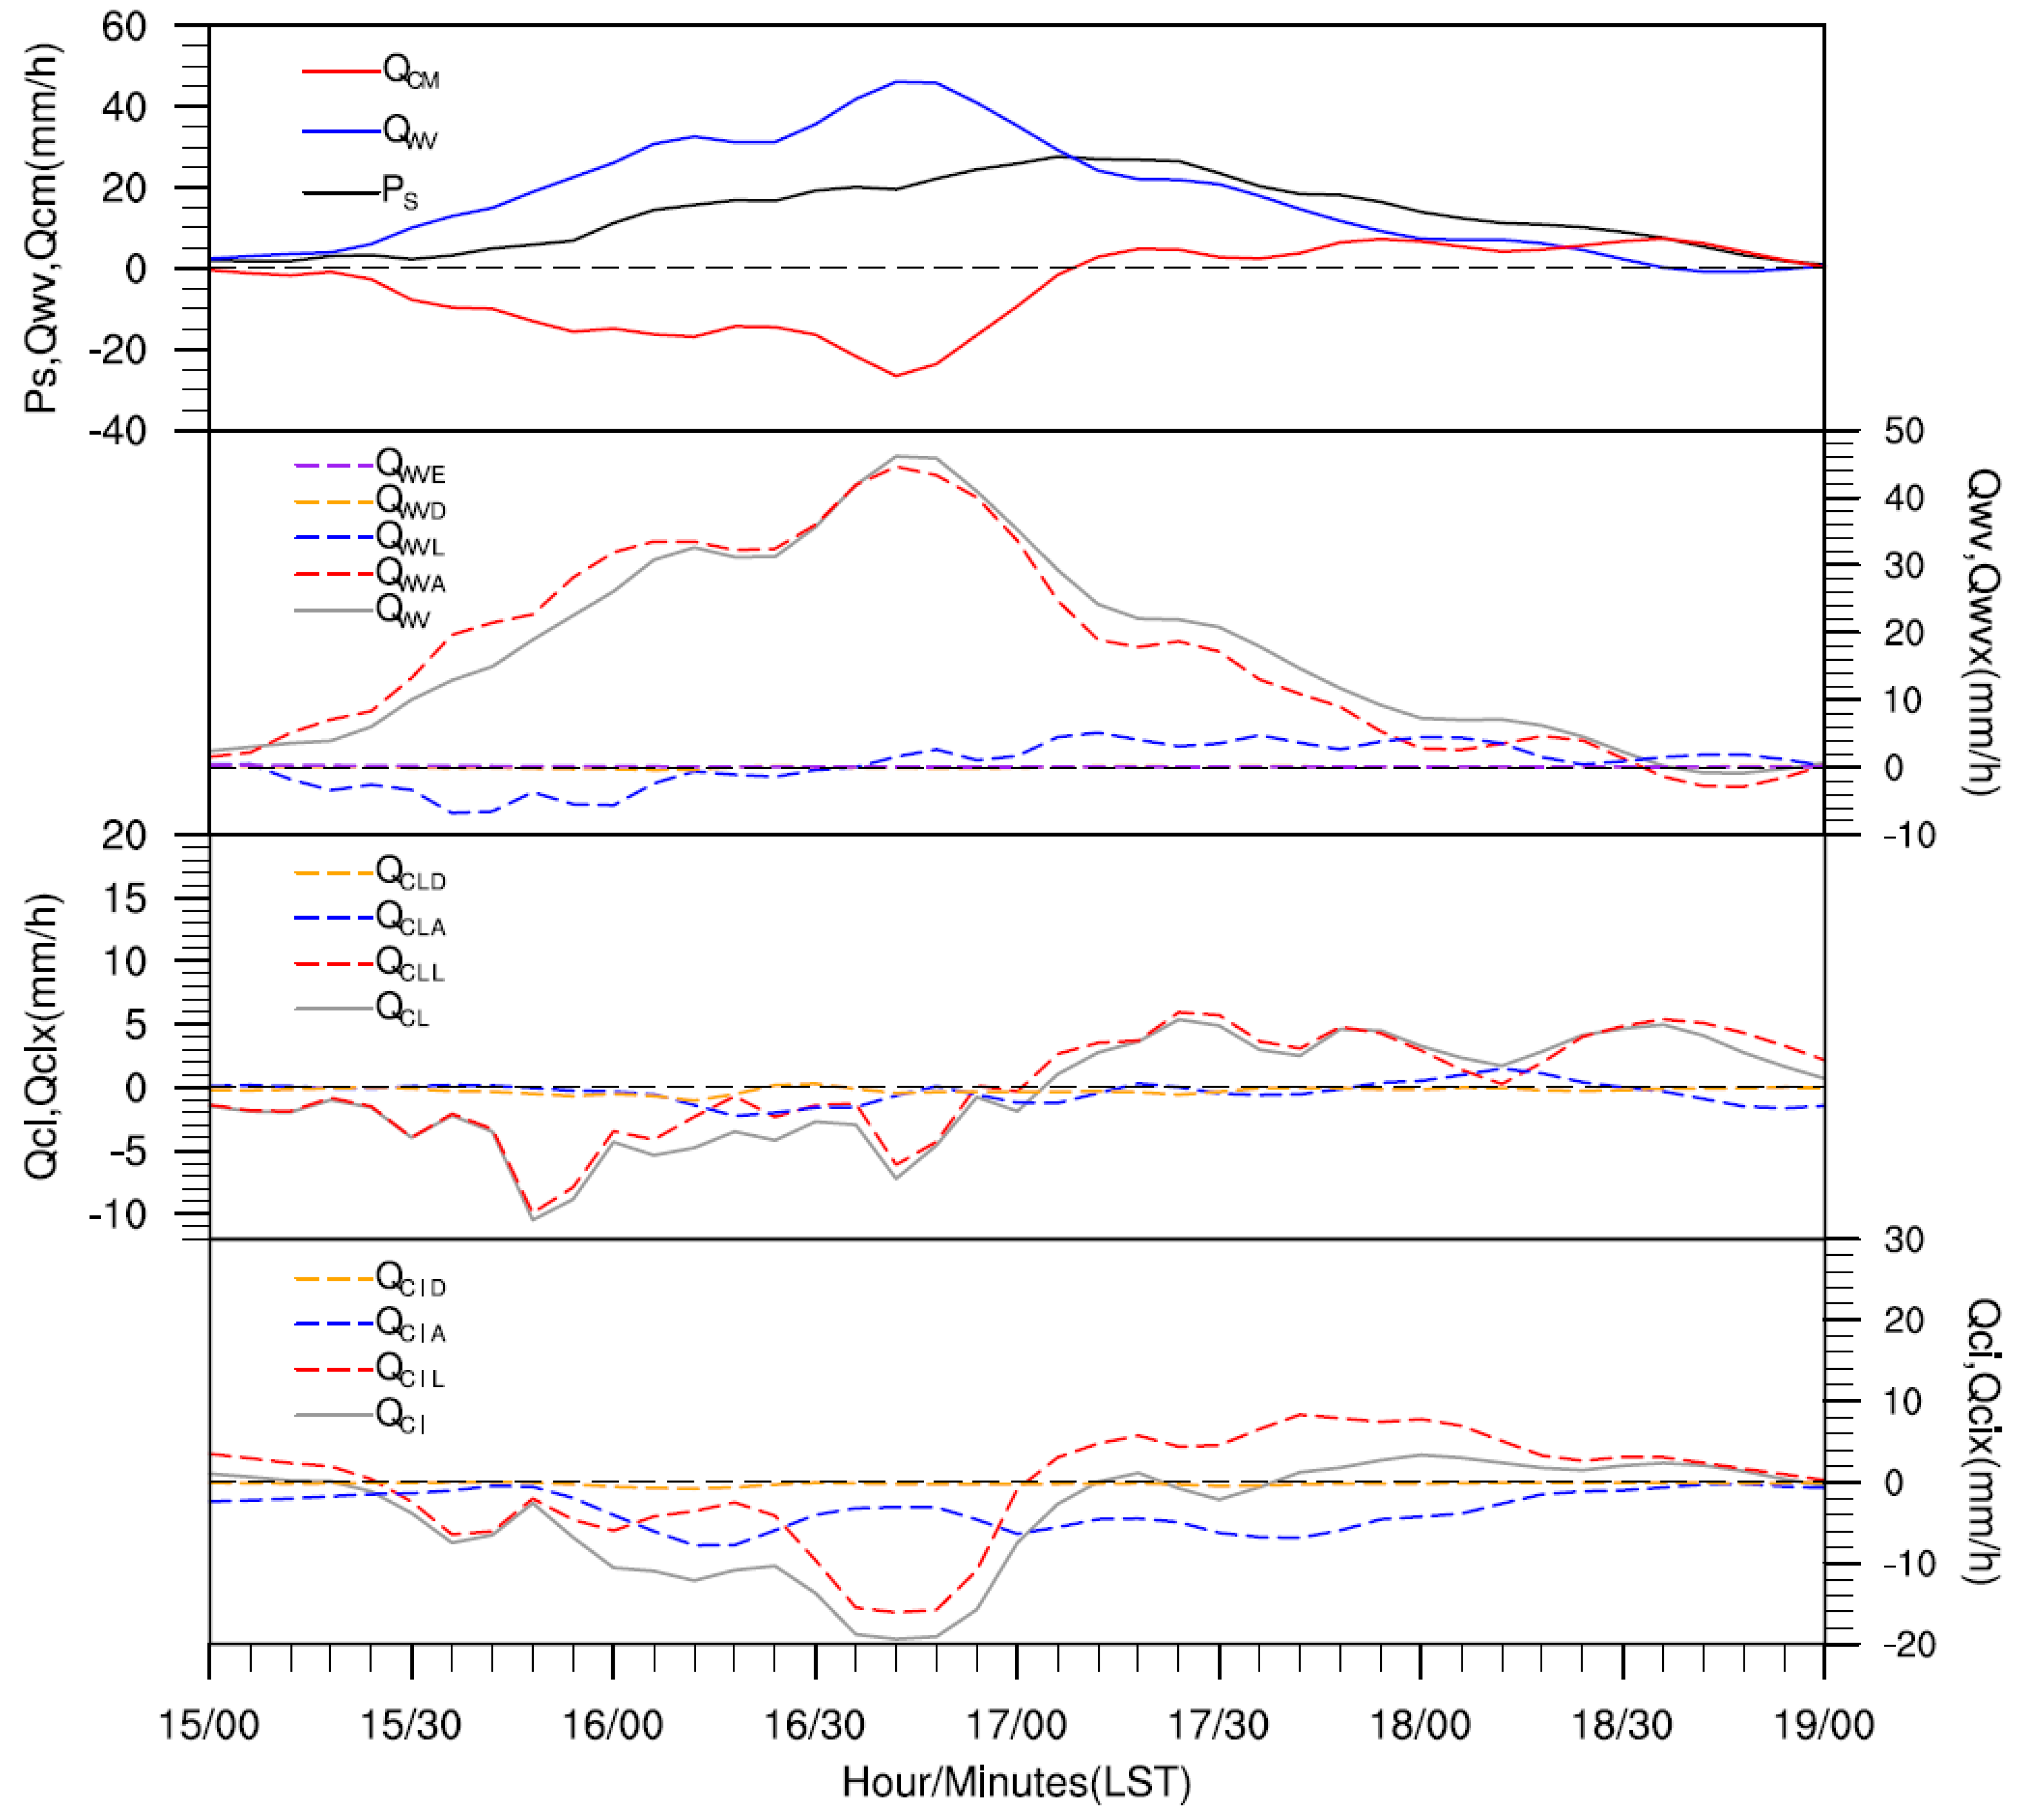
(2)
Before reaching the peak of precipitation intensity, the notable convergence of water vapor flux (QWVA) plays a dual role: facilitating precipitation formation and augmenting local atmospheric humidity. As the precipitation event progresses, the intensity of QWVA diminishes significantly, leading to a scenario where the convergence of water vapor no longer suffices to sustain the observed precipitation intensity, thus markedly reducing the moisture content in the local atmosphere. The dynamics of liquid-phase water condensates are predominantly influenced by local variances (QCLL), underscoring the pivotal role of cloud microphysical processes throughout the precipitation cycle. Furthermore, the budget of ice-phase water condensate is not only governed by local variances (QCIL) but also significantly by the processes of convergence/divergence (QCIA). The consistent negativity of QCIA suggests that the augmentation in ice-phase water condensate primarily stems from the conversion of liquid-phase water condensate. Concurrently, strong upward movements push the ice-phase water condensate towards the upper troposphere, from which it diffuses outward, illustrating the complex interactions that characterize the precipitation process.
(3)
During the main precipitation phase of the convective system’s development, both the intensity and the extent of vertical uplift notably intensify, culminating at the precipitation peak before gradually diminishing. Initially, in the primary phase, the modest peak of vertical uplift is situated near a height of approximately 4 km below the zero-degree isotherm, subsequently strengthening and expanding to reach a zenith of 12 km. However, in the later stages of this phase, the descent of raindrops introduces a negative center of vertical motion below the zero-degree level, positioned around 4 km. This dynamic vertical movement significantly influences the concentration of water condensates, although the extent of these changes varies. Notably, the augmentation of graupel particles and raindrops is most marked, attaining their highest concentration at the precipitation’s peak, followed by a gradual decline. The pronounced fluctuations in raindrop levels are intricately linked to variations in surface precipitation intensity (Ps), whereas the dynamics of graupel particles are primarily associated with the melting processes occurring beneath the zero-degree layer. While shifts in cloud water and snow are observed, these alterations are considerably less dramatic than those observed in raindrops and graupel particles.
In this study, we conducted a high-resolution numerical simulation of the July local severe convective rainstorm. Utilizing three-dimensional precipitation diagnostic equations, we delved into both the macro- and microphysical characteristics of the storm, uncovering new insights. The analyses are based on our simulation, which still has some discrepancies as compared with the observation, especially in the displacements of rainfall centers. In future simulations, we will try to continue to improve our simulation results to reproduce rainfall characteristics that are more similar to the observation. To this end, we will apply the data assimilation technology in the WRF simulation; for example, we will try to assimilate observed sounding data to adjust the initial atmospheric circulation and aim to address the issue of the northward displacement of the 500 hPa trough bottom; we will also try to assimilate the surface observations by automatic weather stations to improve the initial conditions at the surface. Unlike our previous understanding of typhoon rain, during this rainstorm, evaporation from the ground (or sea) surface is low; moreover, the activity of ice-phase particles is high. Our research also highlighted several unresolved questions. For instance, would adopting different cloud microphysical parameterization schemes replicate the precipitation process of the July rainstorm, and to what extent would these schemes impact the physical process of precipitation? Addressing these inquiries necessitates further research through the selection of diverse cloud microphysical parameterization schemes and the execution of sensitivity experiments. Additionally, the observed regional disparities in precipitation intensity raise questions about the differing precipitation physical processes that contribute to these variances. These topics merit in-depth exploration to enhance our understanding of severe convective rainstorm phenomena.

Author Contributions

Conceptualization, T.L.; methodology, T.L. and C.Z.; software, Y.F. and Z.L.; validation, T.L., Y.D. and G.X.; formal analysis, C.Z. and F.W.; investigation, Y.F. and G.X.; data curation, Z.L.; writing—original draft preparation, T.L.; writing—review and editing, T.L. and F.W. All authors have read and agreed to the published version of the manuscript.

Funding

This work was supported by Ningbo City Key Research and Development Plan and “Open Call for Commanders” Project (2023Z139), Ningbo Science and Technology Project (2021S190), and Zhejiang Provincial Meteorological Bureau Asian Games Special Project (2021YYZX14).

Institutional Review Board Statement

Not applicable.

Informed Consent Statement

Not applicable.

Data Availability Statement

The raw/processed data required to reproduce these findings cannot be shared at this time, as the data also form part of an ongoing study.

Acknowledgments

The authors would like to thank the other members of this study for their contributions.

Conflicts of Interest

The authors declare no conflicts of interest.

References

  1. Tao, S. Rainstorms in China; Science Press: Beijing, China, 1980; 225p. [Google Scholar]
  2. Xu, F.; Xu, X.; Cui, X.; Zhang, G. Torrential rainfall responses to radiation and ice clouds over Jiang–Huai valley, China in July 2007. Asia-Pac. J. Atmos. Sci. 2013, 49, 401–407. [Google Scholar] [CrossRef]
  3. Gao, S.; Tan, Z.; Zhao, S.; Luo, Z.; Lu, H.; Wang, D.; Cui, C.; Cui, X.; Sun, J. Mesoscale dynamics and its application in torrential rainfall systems in China. Adv. Atmos. Sci. 2015, 32, 192–205. [Google Scholar] [CrossRef]
  4. Wu, G.; Cai, Y.; Tang, X. Moist potential vorticity and slantwise vorticity development. Acta Meteorol. Sin. 1995, 53, 387–405. [Google Scholar]
  5. Cui, X.; Gao, S.; Wu, G. Up-sliding Slantwise Vorticity Development and the complete vorticity equation with mass forcing. Adv. Atmos. Sci. 2003, 20, 825–836. [Google Scholar] [CrossRef]
  6. Luo, Y.; Sun, J.; Li, Y.; Xia, R.; Du, Y.; Yang, S.; Zhang, Y.; Chen, J.; Dai, K.; Shen, X.; et al. Science and prediction of heavy rainfall over China: Research progress since the reform and opening-up of the People’s Republic of China. Acta Meteorol. Sin. 2020, 78, 419–450. [Google Scholar] [CrossRef]
  7. Li, Q.; Cui, X.; Cao, J. Observational analysis and numerical simulation of a heavy rainfall event in Sichuan Province. Chin. J. Atmos. Sci. 2014, 38, 1095–1108. [Google Scholar] [CrossRef]
  8. Huang, Y.; Cui, X. Moisture sources of an extreme precipitation event in Sichuan, China, based on the Lagrangian method. Atmos. Sci. Lett. 2015, 16, 177–183. [Google Scholar] [CrossRef]
  9. Li, H.; Cui, X.; Zhang, D. A statistical analysis of hourly heavy rainfall events over the Beijing metropolitan region during the warm seasons of 2007–2014. Int. J. Climatol. 2017, 37, 4027–4042. [Google Scholar] [CrossRef]
  10. Zhai, G.Q.; Li, X.F.; Zhu, P.J.; Shen, H.; Zhang, Y. Surface Rainfall and Cloud Budgets Associated with Mei-yu Torrential Rainfall over Eastern China during June 2011. Adv. Atmos. Sci. 2014, 31, 1435–1444. [Google Scholar] [CrossRef]
  11. Zhang, Y.; Meng, Z.Y.; Zhu, P.J.; Su, T.; Zhai, G. Mesoscale Modeling Study of Severe Convection over Complex Terrain. Adv. Atmos. Sci. 2016, 33, 1259–1270. [Google Scholar] [CrossRef]
  12. Song, X.; Zhang, J.; AghaKouchak, A.; Roy, S.S.; Xuan, Y.; Wang, G.; He, R.; Wang, X.; Liu, C. Rapid urbanization and changes in spatiotemporal characteristics of precipitation in Beijing metropolitan area. J. Geophys. Res. Atmos. 2014, 119, 11250–11271. [Google Scholar] [CrossRef]
  13. Wu, M.; Luo, Y.; Chen, F.; Wong, W.K. Observed link of extreme hourly precipitation changes to urbanization over coastal South China. J. Appl. Meteorol. Climatol. 2019, 58, 1799–1819. [Google Scholar] [CrossRef]
  14. Jiang, X.; Luo, Y.; Zhang, D.; Wu, M. Urbanization enhanced summertime extreme hourly precipitation over the Yangtze River delta. J. Clim. 2020, 33, 5809–5826. [Google Scholar] [CrossRef]
  15. Lenderink, G.; van Meijgaard, E. Increase in hourly precipitation extremes beyond expectation-ns from temperature changes. Nat. Geosci. 2008, 1, 511–514. [Google Scholar] [CrossRef]
  16. Pendergrass, A.; Knutti, R. The uneven nature of daily precipitation and its change. Geophys. Res. Lett. 2018, 45, 11980–11988. [Google Scholar] [CrossRef]
  17. Zhang, J.; Shen, J.; Jiang, L. Analysis on large-scale circulation characteristics of meiyu rainstorm and structure of meiyu front in Zhejiang province during 2008. Plateau Meteorol. 2009, 28, 1075–1084. [Google Scholar]
  18. Huang, Z.; Han, L.; Jin, R.; Huang, C. Analysis of characteristics and causes of typhoon rainstorms in Tianmu mountain area of Zhejiang. Meteorol. Sci. Technol. 2022, 50, 10. [Google Scholar] [CrossRef]
  19. Shen, X.; Pan, L.; Zuo, J.; Sang, M.; Zhang, L. Comparative analysis on two similar falling area rainstorms during Meiyu period in western Zhejiang province. J. Arid Meteorol. 2022, 40, 244–255. [Google Scholar] [CrossRef]
  20. Ma, C.; Li, Y.; Xu, B. Impact of Double Low-Level Jets on the Extreme Rainstormin Henan Province in July 2021. Chin. J. Atmos. Sci. 2023, 47, 1611–1625. (In Chinese) [Google Scholar] [CrossRef]
  21. Huang, Y.; Cui, X.; Li, X. A three-dimensional WRF-based precipitation equation and its application in the analysis of roles of surface evaporation in a torrential rainfall event. Atmos. Res. 2016, 169, 54–64. [Google Scholar] [CrossRef]
  22. Lu, T.; Cui, X. Simulation and Diagnosis of the Physical Process of the “7·20” Heavy Rainfall in Beijing in 2016. Chin. J. Atmos. Sci. 2022, 46, 359–379. (In Chinese) [Google Scholar] [CrossRef]
  23. Liu, S.; Cui, X. Diagnostic Analysis of Rate and Efficiency of Torrential Rainfall Associated with Bilis (2006). Chin. J. Atmos. Sci. 2018, 42, 192–208. [Google Scholar] [CrossRef]
  24. Wang, X.; Cui, X.; Hao, S. Diagnostic and Numerical Study on Surface Rainfall Processes Associated with Tropical Cyclone Soudelor (2015) over the Ocean. Chin. J. Atmos. Sci. 2019, 43, 417–436. [Google Scholar] [CrossRef]
  25. Wang, X.; Cui, X.; Hao, S. A Diagnostic and Numerical Study on Surface Rainfall Process of Tropical Cyclone Soudelor (2015) over the Ocean: Sensitivity Experiments on Precipitation Response to Sea Surface Temperature Change. Chin. J. Atmos. Sci. 2019, 43, 1125–1142. [Google Scholar] [CrossRef]
  26. Wang, Y.; Huang, Y.; Cui, X. Surface rainfall processes during the genesis period of tropical cyclone durian (2001). Adv. Atmos. Sci. 2019, 36, 451–464. [Google Scholar] [CrossRef]
  27. Xue, Y.; Cui, X. Diagnostic and Numerical Study on Physical Process of Strong Rainfall Associated with Rammasun (1409). Chin. J. Atmos. Sci. 2020, 44, 1320–1336. (In Chinese) [Google Scholar] [CrossRef]
  28. ETA-Interim Public Dataset of the ECMWF. 2018. Available online: http://apps.ecmwf.int/datasets/data/interim-full-daily/levtype=sfc/ (accessed on 1 August 2021).
  29. Final Operational Global Analysis. 2020. Available online: http://rda.ucar.edu/datasets/ds083.2/ (accessed on 1 August 2021).
  30. Skamarock, W.; Klemp, J.; Dudhia, J.; Gill, D.O.; Barker, D.M.; Duda, M.G.; Huang, X.Y.; Wang, W.; Powers, J.G. A description of the advanced research WRF version 3. NCAR Tech. Note 2008, 475, 113. [Google Scholar]
Figure 1. Model nested domains configuration.
Atmosphere 15 00658 g001
Figure 2. Distribution of the accumulated rainfall amount (shaded; unit: mm) during the rainstorm event for (a) observation from automatic weather stations and (b) simulated rainfall amount.
Atmosphere 15 00658 g002
Figure 3. The 500 hPa geopotential height (thick blue lines, unit: gpm) and 850 hPa wind fields (wind bar, unit: m s−1) at (a) 0800 BST 31 July, (b)1400 BST 31 July, (c) 2000 BST 31 July, and (d) 0200 BST 1 August 2021.
Atmosphere 15 00658 g003
Figure 4. The same as Figure 3, but for the simulations (ad).
Atmosphere 15 00658 g004
Figure 5. The combined radar reflectivity observed in Ningbo (shaded, unit: dBZ) from 1500 BST to 2230 BST 31 July in 2021.
Atmosphere 15 00658 g005
Figure 6. Same as Figure 5, but for the simulated radar reflectivity.
Atmosphere 15 00658 g006
Figure 7. Distribution of hourly rainfall in Ningbo (shaded, units: mm h−1) from 1500 BST 31 July to 1800 BST 31 July 2021. The left column shows the observations (a1d1) and the right column shows the simulations (a2d2).
Atmosphere 15 00658 g007
Figure 8. Temporal evolutions of the area-averaged (29.2°~29.5° N, 121.0°~121.4° E) P S , moisture-related processes ( Q W V ), change rates for hydrometeor-related processes ( Q C L ), and Q C I from 1500 BST to 1900 BST 31 July 2021.
Atmosphere 15 00658 g008
Figure 9. Area-averaged (29.2°~29.5° N, 121.0°~121.4° E) vertical profiles of hydrometeor mixing ratio ( Q g for graupel, Q s for snow, Q i for ice, Q r for raindrops, Q c for cloud water, units: 10−3 kg/kg; w for vertical speed, unit: m/s) from 1500 LST (notation in the sub-figures: 1500) to 1830 LST 31 July 2021.
Atmosphere 15 00658 g009
Table 1. List of observation and reanalysis data used in the paper.
No.Data TypeSpatiotemporal Resolution
1Observational data from Ningbo’s encrypted automatic stations5 min
2Doppler Radar Data6 min
3ERA5 Reanalysis DataA fine spatial resolution of 0.25 degrees and a temporal resolution of 6 h
4FNL Reanalysis DataA spatial resolution of 1 degree and a temporal resolution of 6 h
Table 2. Configurations of WRF model.
No.Mode OptionsParameter Settings
1Grid spacings12 km/4 km/1.33 km
2Grid settings328 × 331/478 × 478/448 × 469
3Vertical layers50
4ProjectionMercator
5Short wave radiation schemeDudhia
6Long wave radiation schemeRRTM
7Boundary layer parameterization schemeYSU
8Cumulus convection parameterization schemeKain-Fritsch (only in the outer layer)
9Microphysics parameterization schemeWDM6
10Surface planMonin-Obukhov
11Land surface parameterization schemeNoah
Table 3. Physical descriptions of the terms in the 3D WRF-based precipitation equation.
No.TermsPhysical Meaning
1 P S Rain rate
2 Q W V L Vertically integrated negative local change rate of water vapor
3 Q W V A Vertically integrated 3D moisture flux convergence/divergence rate
4 Q W V E Surface evaporation rate
5 Q W V D Vertically integrated 3D moisture diffusion rate
6 Q C L L Vertically integrated negative local change rate of liquid-phase
hydrometers
7 Q C L A Vertically integrated 3D flux convergence/divergence rate of liquid-phase hydrometers
8 Q C L D Vertically integrated 3D diffusion rate of liquid-phase hydrometers
9 Q C I L Vertically integrated negative local change rate of ice-phase hydrometers
10 Q C I A Vertically integrated 3D flux convergence/divergence rate of ice-phase
hydrometers
11 Q C I D Vertically integrated 3D diffusion rate of ice-phase hydrometers
Disclaimer/Publisher’s Note: The statements, opinions and data contained in all publications are solely those of the individual author(s) and contributor(s) and not of MDPI and/or the editor(s). MDPI and/or the editor(s) disclaim responsibility for any injury to people or property resulting from any ideas, methods, instructions or products referred to in the content.

