
Warm and Dry Compound Events in Poland

Department of Meteorology and Climatology, University of Lodz, 90-139 Lodz, Poland
*
Author to whom correspondence should be addressed.
Atmosphere 2024, 15(9), 1019; https://doi.org/10.3390/atmos15091019
Submission received: 23 July 2024
/
Revised: 19 August 2024
/
Accepted: 20 August 2024
/
Published: 23 August 2024
(This article belongs to the Section Climatology)
Abstract
:The aim of this paper was to characterize the warm and dry compound events (WD days) in Poland during the period of 1966–2023, focusing on assessing the frequency and intensity of such events and their spatial and temporal variability, as well as on the driving factors of warm and dry compound events. WD days are those days that have a maximum temperature equal to or higher than the 90th percentile and the precipitation on that day and the 14 preceding days are equal to or less than the 25 percentile. During 1966–2023, the frequency of WD days increased significantly, mainly in April, the summer months, and December. Higher temperatures favored the occurrence of WD days from March to November, but, in winter months, the heat did not favor the occurrence of WD days. The exception was December, when high temperatures in the first part of the analyzed period did not favor the occurrence of a dry day, whereas, in the second part, it did. The strongest influence on the frequency of WD days had the East Atlantic pattern, where air flowed over Poland from the southwest. Warm and humid air flowing from the Atlantic Ocean must overcome the mountain barrier; therefore, it flows to Poland as warm and dry air. From spring to autumn, the WD days were related to an increase in the geopotential height in central Eastern Europe, and, in the winter, they were related with blocking over the Balkans.
1. Introduction
The effects of extreme weather events are often magnified by the fact that these events do not occur in isolation. We call them compound weather and/or climate events. The effect of such a combination contributes to significant increases in societal or environmental risk. Although many climate-related disasters are caused by compound events, the understanding, analysis, quantification, and prediction of such events is still in its infancy [1]. Zscheischler et al. [1] distinguished four primary groups of compound extreme events, including multivariate extreme events, which occur when two or more weather extremes co-occur in the same place. Concurrent drought and heatwaves provide an example of such an event. In the short term, dry and heat events are attributable to stationary anticyclones or blocking situations [1,2]. They often result in extensive and difficult to control wildfires [3], like in southern Europe (Greece, Italy, and Spain) in the summer of 2023. This co-occurrence of heat waves with extreme drought is dangerous for all living systems, particularly for plants. There are many examples of their impact on plants [4], forests [5] and human health. It has long been known that the precipitation and temperature during summer are strongly negatively correlated [6,7,8]; the correlation coefficient between temperature and precipitation in the warm season was calculated worldwide, and it showed that Poland is located in an area of significant negative correlations.
Anthropogenic climate change has a strong potential to alter the frequency and/or intensity of weather extremes, increasing the likelihood of compound extreme events, thus posing a serious threat to people, the environment, and the economy [9].
Several studies on extreme weather events in Poland have been published, but they have only been concerned with the occurrence of single extremes (i.e., heat waves) [10,11,12,13]. All of these studies have emphasized an increase in the number of warm extremes and a decrease in cold extremes. Due to limited water resources, droughts are an important issue in Poland, and many authors have noticed an increase in their occurrence [14,15,16,17,18].
Despite a rich body of literature on extreme events, there is a lack of research on compound extreme weather events, their frequency, and their intensity in Poland, as well as information on which extreme events most often contribute to compound extreme events and whether they influence each other. This research aims to fill this gap and characterize the warm and dry compound events in Poland during 1966–2023, focusing on assessing the frequency and intensity of such events and their spatial and temporal variability. Additionally, an attempt was made to identify the factors favoring the occurrence of warm and dry compound events.
2. Materials and Methods
2.1. Warm and Dry Day Definition and Datasets
This study is based on the daily mean and maximum temperature and precipitation totals from 48 meteorological stations in Poland during 1966 to 2023. Their locations are given in Figure 1. The data were obtained from the Institute of Meteorology and Water Management—National Research Institute (IMWM-NRI).
In this study, warm days were defined as days with a maximum temperature equal to or higher than the 90th percentile of the maximum temperature on a given day of the year. The threshold value was determined separately for each station and for each day of the year in the reference period of 1971–2000 as the 90th percentile of the maximum temperature in a 15-day window centered on a given day of the year, i.e., a total of 450 values (30 years × 15 days). Thus, the threshold value for February 5 was calculated as the 90th percentile of the maximum temperature from January 29 to February 12 in 1971–2000. An example of one station is shown in Figure 2A.
In the case of dryness, the situation was more complicated. It is difficult to talk about a dry day as a day without precipitation because if it rained in the previous period, the soil is still wet. Therefore, in such cases, the daily totals were replaced by the precipitation totals of a fifteen-day period (a given day and the 14 preceding days). Then, as with the maximum temperature records, the values of the 25th percentile of the precipitation totals were calculated. A day was considered dry if the sum of precipitation on that day and the 14 preceding days was equal to or less than the 25 percentile for that day of the year. An example of a station is shown in Figure 2B.
Warm and dry (WD) days are days with a maximum temperature equal to or higher than the 90th percentile and the precipitation (the sum of the last 15 days) is equal to or lower than the 25th percentile.
In addition to the frequency of WD days at individual stations, three indicators were introduced to describe the occurrence and intensity of WD days throughout Poland:
- Frequency of WD days in Poland—the monthly number of days that were warm and dry on at least one of the 48 stations in Poland.
- Station number of WD days (stWD)—the number of stations on which the day was warm and dry summed over all days of the month.
- WD intensity (WDint)—the sum of the product of temperature surplus and precipitation deficit after all warm and dry stations are totaled and are additionally summed over all the days of the month.
2.2. Large-Scale Atmospheric Circulation Data
The large-scale atmospheric circulation in the Euro-Atlantic region, for the WD days in Poland, was analyzed based on geopotential heights at the 850 hPa level (GPH850) and their anomalies for 1966–2023 and the two subperiods of 1966–1990 and 1996–2020. The anomalies were calculated with regard to three selected periods. The GPH850 data were obtained from the ERA5 reanalysis north of 30° N with a resolution of 0.25° × 0.25° [19].
2.3. Large-Scale Circulation Indices
Seven circulation indices were used to investigate the influence of the atmospheric circulation on the WD-day frequency in Poland, as shown in Table 1. All the indices covered the period of 1966–2023, and the GBI record was only one year shorter (1966–2022). Monthly values of these indices were correlated with the monthly frequencies of the WD days. For this purpose, the Pearson correlation coefficient was used, and the statistical significance at the 95% level was assessed with the t-test.
2.4. Trends and Correlations
All trends were assessed using the Sen–Theil slope estimator [23,24]. This is an unbiased estimator that is more robust than the least-squares estimator because it is much less sensitive to outliers. The Mann–Kendall test with ties was used to assess the statistical significance of trends [25,26]. This non-parametric method does not require a normal distribution of the analyzed time series. It is much less affected by outliers and gives robust results for non-normally distributed series [25].
The relationships between the circulation indices and monthly values of the WD days, defined as days that were recorded as warm and dry on at least one station in Poland, were assessed using Pearson’s correlation coefficient. The statistical significance of all the tests was assessed at the 0.05% level. Maps were prepared in Surfer 20, using the kriging method, and in Panoply 4.12.11.
3. Results
3.1. Maximum Temperature and Its Trends
The air temperature in Poland is increasing. In the period of 1951–2023, the mean air temperature increased by 0.31 °C per decade [27] (CMB, 2024). The maximum temperature increased even more with an average of 0.41 °C per decade. However, this increase varied throughout the year (Figure 3). It was strongest in August, July, and April at 0.53 °C, 0.52 °C, and 0.52 °C per decade, respectively. It was the lowest in May and October at 0.19 °C and 0.27 °C per decade, respectively. The maximum temperature trend also varied spatially, being the strongest in the northern part of the country in winter and spring and in the southern part in summer (Figure 4).
3.2. Warm-Day Frequency and Trends
In this study, warm days were defined as days with a maximum temperature equal to or higher than the 90th percentile of the maximum temperature at a given station and given day of the year. Therefore, during the reference period (1971–2000), the average number of such days per month oscillated around three at each station and was evenly distributed across Poland. However, there were already apparent differences between the two 25-year periods. As can be observed in Figure 5A, the number of warm days increased significantly between the two subperiods. In absolute numbers, the increase was the largest in April (over three days), then in February and June (over two days), while the smallest was in September (less than half a day) and December, March, and May (slightly over one day). The most considerable relative increase was in August (more than twice as much), then July, November, and April (almost twice as much), and the smallest was in October, March, and May, when the increases amounted to just over 30%.
The spatial distribution of trends in the number of warm days in the four seasons is shown in Figure 6. The most significant increase was observed in summer, from one day per decade in northwestern Poland to four days in the southwest. A significant increase in the number of warm days also occurred in winter, from more than two days per decade in northern and central Poland to less than half a day per decade in the southeast. In spring, the increase was relatively small, with just over one day per decade in most of the country. Only in the north did it sometimes exceed one and a half days per decade; in the southeast, it dropped to half a day per decade. The slight increase was due to the fact that the increase was observed in April, and it was then negligible in the remaining spring months. In autumn, changes were statistically insignificant and fluctuated around zero. Only in the southeast did it exceed a quarter of a day per decade.
3.3. Precipitation and Dry Days Frequency Trends
From 1966 to 2023, the average annual precipitation in Poland, outside the mountain regions at altitudes above 1000 m a.s.l. (such an area represents less than 1% of the country’s surface), was 627 mm. The lowest totals were recorded in central Poland, with a minimum of 501 mm in Kalisz. Higher totals of 600–700 mm were in the south and the north, with over 800 mm in the foothills and 1000 mm at altitudes above 600 m (Figure 7A). Long-term changes in precipitation were small, with a slight increase in the western part of the country and a decrease in the eastern part (Figure 7B), but these changes were mostly statistically insignificant.
The annual course of rainfall totals in Poland was typical for the interior of the continent in the temperate zone, with the lowest precipitation in the winter months only slightly exceeding 30 mm and the highest precipitation in summer exceeding 70 mm monthly (Figure 5B). Long-term precipitation trends were generally small and insignificant, with increases alternating with decreases (Figure 8B).
In contrast to the warm days, the number of which increased significantly in the analyzed period, the annual frequency of dry days did not change significantly, but their distribution throughout the year did change (Figure 5B). They occurred much more often in April, December, and June, and then less often in March, October, July, and January.
3.4. Warm and Dry Days
Warm and dry days (henceforth referred to as WD days) are the days that are both warm and dry at the same time. More of them occur in the warm than in the cold season. Throughout the whole study period, the average number of such days at individual stations ranged from 0.35 per year in January to 2.06 in April, but it then varied between the two 25-year periods. In the initial 25-year subperiod, they were less frequent. Their number varied from 0.30 and 0.38 in January and December, respectively, to 1.46, 1.32, and 1.30 in July, April, and September, respectively. In the 25-year period of 1996–2020, their frequencies were much higher, varying from 0.40 in January to 3.03 in April (Figure 9A). There were 5012 WD days on at least one station, i.e., ~86 per year. More than 1200 of them were WD days on one station only. There were 1480 WD days recorded on at least ten stations at the same time (Figure 9B).
Figure 10 shows the spatial distribution of WD-day frequency in the two 25-year periods and their difference during the following four selected months: January, April, July, and October. In January, the WD days were slightly more frequent in the south and southwest, and the changes were small and statistically insignificant. On the coast, in the southeast and southwest, the frequency of WD days decreased slightly. In April, the spatial variation of the WD-day frequency was much larger, with most of them occurring in the south and west, and the least variation occurred in the east and on the coast. April was the month with the highest increase in WD days. This was most pronounced in the southwest, where it exceeded 2.75 days. In July, in the first period, the spatial distribution of the WD days was relatively even, with a slight advantage in the central part of the country. In the second period, the diversity increased significantly, with many WD days occurring in the southeastern half of Poland, whereas the lowest number was recorded in the west, where the frequency of WD days decreased slightly. In October, in the first period, the frequency of WD days increased from 0.5 per year in northern Poland to over 1.5 in the south. In the second period, the situation changed. The most minor frequency of WD days per year, approximately 0.5, was observed along the coast, while the highest frequency, over 1.5, was noticed in the eastern, and even northeastern part, of the country. The differences were small, wherein they were slightly negative in southwestern Poland and slightly positive in northeastern Poland.
3.5. WD-Day Trends
The changes in the frequency and intensity of WD days were examined by assessing the trends of the three indicators calculated for the whole of Poland. The first was the number of WD days recorded on at least one station—the frequency of such events were characterized. The second was the stWD characterization of both the frequency and the areal range of exceptionally warm and dry weather. The third one was the WDint index, which also considers the effect of temperature surplus and rainfall deficiency. All trends indicated an increase in the frequency, spatial range, and intensity of warm and dry events (in the case of intensity, the sign of values was negative due to rainfall deficiency, so the lower the value, the greater the intensity of warm and dry events). On a monthly scale, the trends were statistically significant in April, June, July, August, November, and December. They were also significant in all seasons and on an annual scale. The trend coefficients are summarized in Table 2.
3.6. Factors Contributing to WD-Day Occurrence
The analysis of factors contributing to the occurrence of WD days was divided into three parts. In the first part, it was examined whether the fact that a day is warm affects the probability that it will also be a dry day. In the second step, the influence of the geopotential field at the 850 hPa level on the occurrence of WD days was examined. In addition, the relationships between selected circulation indices and the frequency of WD days were analyzed.
3.6.1. Effect of Warm-Day Occurrences
Two types of WD-day probabilities were compared to analyze the effect of warm-day occurrences. The first was the simple dry-day probability assessed as a percentage of the WD days in each month. The second was a conditional probability assessed as the percentage of WD days among warm days only. If the share of WD days among warm days was greater than among all days, it means that higher temperatures favor the occurrence of dry days. If it is smaller, it means that warm days are less likely to be dry at the same time. A comparison for the entire analyzed period and the two subperiods is summarized in Table 3. Higher temperatures favored the occurrence of WD days from March to November. The effect was strongest in September, with twice as many dry days in warm periods than in all days. In the winter months, the heat did not favor the occurrence of WD days; on the contrary, their frequency decreased. The exception was December. In the second subperiod, the frequency of WD days increased significantly, and the increased temperature began to favor it.
3.6.2. Circulation Patterns during WD Days
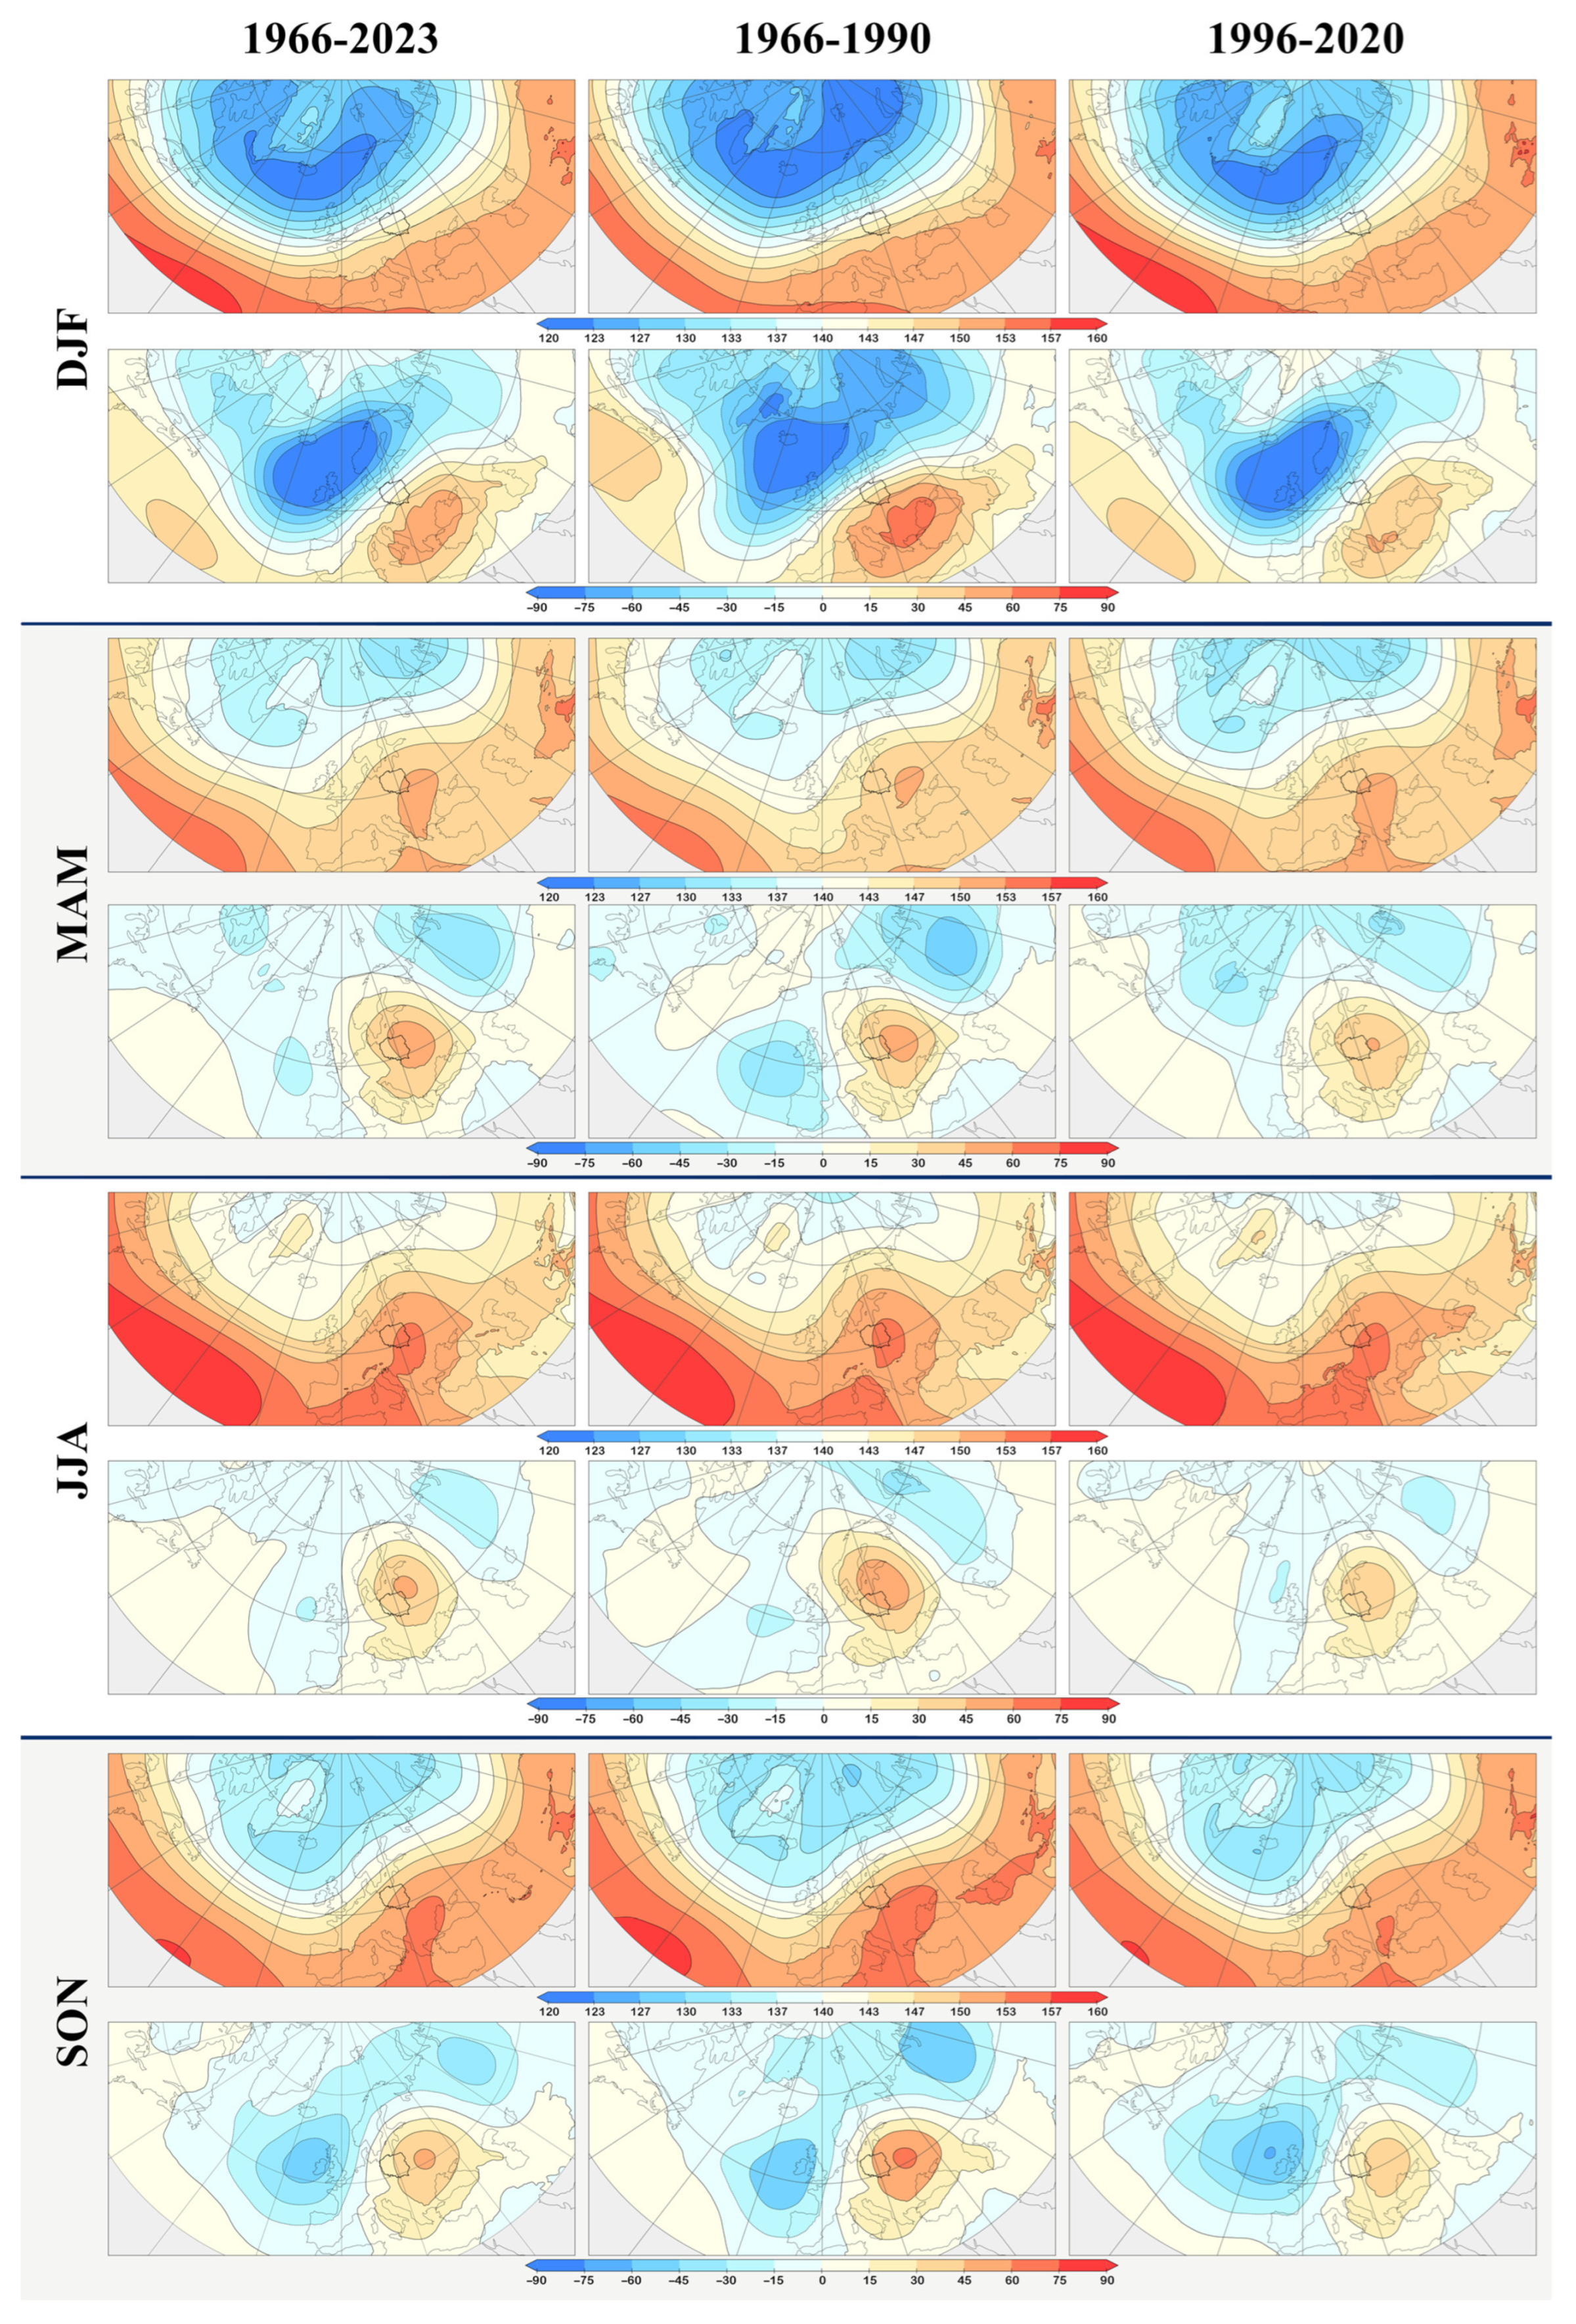
From spring to autumn, the WD days in Poland were associated with the above-normal GPH850 in central Eastern Europe (Figure 11). The center of the GPH anomaly (>45 m) was located in eastern Poland and the eastern bordering countries. In summer, it was a part of the strong, well-developed ridge of the Azores High, spanning toward Eastern Europe. During the transition seasons, it was more related to the high-pressure center over the Balkan Peninsula. During these seasons, the below-normal GPH was observed over the Atlantic and Ural Mountains (and this was especially apparent in Autumn at < −45 m). In the winter WD days, a very strong blocking situation, with a GPH850 anomaly of >45 m, was observed in southeastern Europe (over the Balkans and Black Sea). At the same time, a very deep low-pressure center (with a GPH anomaly of < −75 m) was created at the North Atlantic Ocean (i.e., the Norwegian Sea, British Isles, Iceland, and Norway). A considerably strong GPH gradient was observed between northwestern and southwestern Europe. In this case, the strong blocking from the Balkans shifted the track of the winter lows, which usually led through the Baltic countries and further toward the north, and it also brought the warmer and drier air masses in Poland from the southeast.
Comparing the initial and final subperiods, when the WD days occurred in Poland, a greater GPH850 was observed in the spring and summer of 2001–2020 in central and southeastern Europe (Figure 11). This was a consequence of the warmer climate. But, considering the GPH850 anomaly in the individual subperiods, the highest changes were observed during 1966–1985. From spring to autumn, the positive GPH anomaly in central Eastern Europe and the negative GPH in the Ural Mountains were more enhanced, and a similar situation was also apparent during wintertime in the Balkans region.
3.6.3. Effect of Large-Scale Circulation
The monthly frequencies of the WD days were correlated with the monthly values of the seven circulation indices, as shown in Table 1. As the monthly values of the WD days were not normally distributed, Spearman’s rank correlation was used. The results are summarized in Table 4. The strongest relationships occurred with the EA pattern. They were statistically significant in all months. The weakest relationships occurred in spring and early summer, and the strongest were in January and September (0.550 and 0.507, respectively). The AO and NAO patterns correlated significantly with WD-day frequencies in the cold season, the AO pattern correlated with December to March and August to September, and the NAO pattern correlated with November to February and also with June, August, and September. The AMO pattern influenced the increased occurrence of WD days in summer from June to August, but also in December. The strongest was in July, which is when the correlation coefficient reached the value of 0.346. In turn, the SCAND pattern affected the frequency of WD days in the transitional seasons and was statically significant in April and May in spring and October and November in autumn. High GBI values reduced the frequency of WD days in winter from January to March and in September. No influence of the EAWR pattern on the occurrence of WD days was observed.
4. Discussion and Conclusions
The maximum temperature in Poland during the period of 1966–2023 increased considerably. The strongest growth was observed in the summer months (JJA), i.e., in April and January. On average, it exceeded 0.5 °C per decade. The smallest increase was recorded in May, with an average of just below 0.2 °C per decade. Similar results were obtained by Ustrnul et al. [28] for the period of 1951–2018. The maximum temperature increased on average by 0.2–0.3 °C per decade annually throughout the country, 0.4–0.5 °C per decade in spring, 0.3–0.4 °C per decade in summer, about 0.2 °C per decade in winter, and there no trend found in autumn. The spatial distribution of trends indicates stronger growth in the north of Poland in the spring and in the south in summer. The increase in maximum temperature resulted in a significant increase in the frequency and intensity of heat waves, with the first hot days occurring in May and the last in September [29,30,31]. An increase in maximum temperature significantly affected the frequency of WD days directly because it increased the frequency of warm days, and it also indirectly influenced the occurrence of dry days. As is shown in the results, higher temperatures favored the occurrence of WD days from March to November and then reduced their frequency in winter.
The average annual precipitation total in Poland during the period of 1966–2023 was 627 mm; outside the mountain area, it ranged from just over 500 mm in the central part to almost 800 mm in the south. In northern Poland, they were slightly above 700 mm. Long-term changes were mainly insignificant. Drops dominated the southwestern part of the country, and increases were observed in the northeast. Similar results have been presented earlier [16,32,33,34,35]. However, as shown in many places, contemporary warming affects the rainfall patterns much more than the total rainfall [36,37,38,39]. Precipitation events have become less frequent and more intense, and the extremes have become higher. The frequency of dry days defined in this paper increased significantly in December, April, and June, whereas their number decreased in March, July, October, and January. Wibig examined the changes in dry days (defined as days without precipitation), and they have shown that their frequency increased considerably in November and December. Their findings are in general agreement with the results of this study.
On average, 14.6 days per year at each station were both warm and dry. In the annual cycle, they dominated in April and July (above two days per year). More than 1.5 WD days were in June, August, and September. They appeared least often in January, with only about 0.3 WD days per year. A comparison of the WD-day frequency in the two 25-year subperiods indicated a significant increase. This increase was the most pronounced in April, but also in all summer months and November and December. This increase resulted from temperature growth that led to a higher number of warm days but was also due to an indirect effect that was related to the fact that warm and dry day events are not independent. The probability of a dry day on a warm day is significantly higher than the average from March to November, and it is especially the case in July, September, and October. However, during the winter, the probability of a dry day if it is warm is lower than average.
At the turn of autumn and winter, November and December were the months of gloomy and rainy weather [18]. But, recently, they have become increasingly drier, and the weather has become more typical of October. The rainy season has moved to January. This effect can be observed in December. In the later 25-year period, the probability of a dry day on a warm day became significantly higher than on average, and the frequency of WD days increased significantly.
This pattern of changes is confirmed by the trends in the frequency and intensity of WD events in Poland. Here, the frequency of WD days was higher than at individual stations because a day is classified as warm and dry if it is observed on at least one station. Therefore, there were 86 such days recorded per year, with an average of only 14.6 at one station. The measure of the spatial extent of the WD events was achieved via the stWD index. However, the last WDint indicator also provides information on how warm and dry it was during the WD days. It was negative because one of the factors is the rainfall deficit. The trends in all these indicators were statistically significant in April, the summer months, and November and December. Additionally, it was significant in all seasons and throughout the year. No changes were observed in May and February. No decrease in the number and intensity of WD events was observed in any month.
The WD days in Poland were accompanied by increased GPH850 in central Eastern Europe from spring to autumn and in southeastern Europe in winter. In summer, this was related to a more extended ridge of the Azores High, which brings very warm air from southwestern Europe. From autumn to spring, but especially in winter, it was related to blocking over the Balkans, which shifted the low trajectory to the north and brought warm and dry weather from the south. The GPH850 anomalies were higher in the first 25-year subperiod of the study period. These anomalies were weaker in the 21st century, probably due to the warmer atmosphere.
The correlations of the monthly values of the WD-day index with circulation indices indicate that the EA type had the strongest influence on the frequency of WD days. In this type, there are two pressure systems in the North Atlantic Ocean: a low-pressure system in the north and a high-pressure system in the south. They were slightly shifted to the south compared to the NAO type. This pattern causes air masses to inflow to Poland from the southwest. Warm and humid air flowing from the Atlantic Ocean must overcome the mountain barrier; therefore, it flows to Poland as warm and dry air. In the winter months and at the turn of summer and autumn, the frequency of WD days slightly increased under the influence of AO and NAO types. During this period, the inflow of air from the west was associated with the inflow of warmer than normal air. In summer, the warm Atlantic Ocean air (positive AMO) favored high temperatures in Europe; hence, the positive and statistically significant correlations with the AMO index. In the transitional seasons of the year, the share of meridional circulation increased in Poland; hence, the positive correlations of the frequency of WD days with the SCAND type were associated with high pressure over Scandinavia. Dry air then flowed over Poland from the northeast. A positive value of the GBI index meant the occurrence of a high pressure over Greenland, and then there was a low pressure over northern Europe, which did not favor the occurrence of dry days in Poland. The effect was strongest in winter and in September.
Although a drought or a warm day, as defined in this paper, may not be considered extreme from a statistical perspective, their combination can have severe consequences. These include reduced agricultural productivity, threat to power plants, problems with water availability, and risks to natural ecosystems and human health [40]. Therefore, understanding and predicting such events is of great importance for the economy and human well-being.
Author Contributions
Conceptualization, J.W. and J.J.; methodology, J.W. and J.J.; software, J.W. and J.J.; validation, J.W. and J.J.; formal analysis, J.W. and J.J.; investigation J.W. and J.J.; resources, J.W. and J.J.; data curation, J.W. and J.J.; writing—original draft preparation, J.W. and J.J.; writing—review and editing, J.W. and J.J.; visualization, J.W. and J.J.; supervision, J.W. project administration, J.W. funding acquisition J.W. All authors have read and agreed to the published version of the manuscript.
Funding
This research was funded by the National Science Center (NCN) (grant numbers 2019/33/B/ST10/01136 and 2023/51/B/ST10/01926).
Informed Consent Statement
Not applicable.
Data Availability Statement
The Polish meteorological data were taken from IMWM-NRI. The Greenland Blocking Index was taken from https://psl.noaa.gov/gcos_wgsp/Timeseries/Data/gbi.mon.data (accessed on 10 July 2024). The Atlantic Multidecadal Oscillation Index was taken from https://www1.ncdc.noaa.gov/pub/data/cmb/ersst/v5/index/ersst.v5.amo.dat (accessed on 10 July 2023); the remaining indices were taken from https://ftp.cpc.ncep.noaa.gov/wd52dg/data/indices/tele_index.nh (accessed on 10 July 2024).
Acknowledgments
The authors would like to thank the authors of the data for providing them and two anonymous reviewers for their valuable comments.
Conflicts of Interest
The authors declare no conflicts of interest.
References
- Zscheischler, J.; Martius, O.; Westra, S.; Bevacqua, E.; Raymond, C.; Horton, R.M.; van den Hurk, B.; Agha Kouchak, A.; Jézéquel, A.; Mahecha, M.D.; et al. A typology of compound weather and climate events. Nat. Rev. Earth Environ. 2020, 1, 333–347. [Google Scholar] [CrossRef]
- Kautz, L.A.; Martius, O.; Pfahl, S.; Pinto, J.G.; Ramos, A.; Sousa, P.M.; Woolings, T. Atmospheric blocking and weather extremes in Euro-Atlantic sector—A review. WCD 2022, 3, 305–336. [Google Scholar] [CrossRef]
- Flanningan, M.; Stocks, B.; Turetsky, M.; Wotton, M. Impacts of climate change on fire activity and fire management in the circumboreal forest. Glob. Chang. Biol. 2009, 15, 549–560. [Google Scholar] [CrossRef]
- De Boeck, H.J.; Dreesen, F.E.; Janssens, I.A.; Nijs, I. Whole-system responses of experimental plant communities to climate extremes imposed in different seasons. New Phytol. 2011, 189, 806–817. [Google Scholar] [CrossRef] [PubMed]
- Allen, C.D.; Macalady, A.K.; Chenchouni, H.; Bachelet, D.; McDowell, N.; Vennetier, M.; Kitzberger, T.; Rigling, A.; Breshears, D.D.; Hogg, E.H.; et al. A global overview of drought and heat-induced tree mortality reveals emerging climate change risks for forests. For. Ecol. Manag. 2010, 259, 660–684. [Google Scholar] [CrossRef]
- Madden, R.A.; Williams, J. The correlation between temperature and precipitation in the United States and Europe. Mon. Weather Rev. 1978, 106, 142–147. [Google Scholar] [CrossRef]
- Trenberth, K.E.; Shea, D.J. Relationships between precipitation and surface temperature. Geophys. Res. Lett. 2005, 32, L14703. [Google Scholar] [CrossRef]
- Zscheischler, J.; Seneviratne, S.I. Dependence of drivers affects risks associated with compound events. Sci. Adv. 2017, 3, e1700263. [Google Scholar] [CrossRef]
- Baldwin, J.W.; Dessy, J.B.; Vecchi, G.A.; Oppenheimer, M. Temporally compound heat wave events and global warming: An emerging hazard. Earth’s Future 2019, 7, 411–427. [Google Scholar] [CrossRef]
- Wibig, J.; Podstawczyńska, A.; Rzepa, M.; Piotrowski, P. Heatwaves in Poland—Frequency trends and relationships with atmospheric circulation. Geogr. Pol. 2009, 82, 33–46. [Google Scholar] [CrossRef]
- Wibig, J. Heat waves in Poland in the period 1951–2015: Trends, patterns and driving factors. Meteorol. Hydrol. Water Manag. 2018, 6, 37–45. [Google Scholar] [CrossRef]
- Tomczyk, A.M.; Bednorz, E.; Półrolniczak, M.; Kolendowicz, L. Strong heat and cold waves in Poland in relation with the large-scale atmospheric circulation. Theor. Appl. Climatol. 2019, 137, 1909–1923. [Google Scholar] [CrossRef]
- Owczarek, M.; Tomczyk, A.M. Impact of atmospheric circulation on the occurrence of very strong and extreme cold stress in Poland. Quaest. Geogr. 2022, 41, 111–126. [Google Scholar] [CrossRef]
- Łabędzki, L. Actions and measures for mitigation drought and water scarcity in agriculture. J. Water Land Dev. 2016, 29, 3–10. [Google Scholar] [CrossRef]
- Somorowska, U. Changes in drought conditions in Poland over the past 60 years evaluated by the Standardized Precipitation-Evapotranspiration Index. Acta Geophys. 2016, 64, 2530–2549. [Google Scholar] [CrossRef]
- Pińskwar, I. Complex Changes of Extreme Precipitation in the Warming Climate of Poland. Int. J. Climatol. 2022, 42, 817–833. [Google Scholar] [CrossRef]
- Jaagus, J.; Aasa, A.; Aniskevich, S.; Boincean, B.; Bojariu, R.; Briede, A.; Danilovich, I.; Castro, R.D.; Dumitrescu, A.; Labuda, M.; et al. Long-term changes in drought indices in eastern and central Europe. Int. J. Climatol. 2022, 42, 225–249. [Google Scholar] [CrossRef]
- Wibig, J. Dry and Wet Spells in Poland in the Period 1966–2023. Water 2024, 16, 1344. [Google Scholar] [CrossRef]
- Hersbach, H.; Bell, B.; Berrisford, P.; Hirahara, S.; Horanyi, A.; Muñoz-Sabater, J.; Nicolas, J.; Peubey, C.; Radu, R.; Schepers, D.; et al. The ERA5 global reanalysis. Q. J. Roy. 2020, 146, 1999–2049. [Google Scholar] [CrossRef]
- Hanna, E.; Cropper, T.E.; Hall, R.J.; Cappelen, J. Greenland Blocking Index 1851–2015: A regional climate change signal. Int. J. Climatol. 2016, 36, 4847–4861. [Google Scholar] [CrossRef]
- Enfield, D.B.; Mestas-Nunez, A.M.; Trimble, P.J. The Atlantic Multidecadal Oscillation and its relationship to rainfall and river flows in the continental U.S. Geophys. Res. Lett. 2001, 28, 2077–2080. [Google Scholar] [CrossRef]
- Barnston, A.G.; Livezey, R.E. Classification, Seasonality and Persistence of Low-Frequency Atmospheric Circulation Patterns. Mon. Weather Rev. 1987, 115, 1083–1126. [Google Scholar] [CrossRef]
- Sen, P.K. Estimates of the regression coefficient based on Kendall’s tau. J. Am. Stat. Assoc. 1968, 63, 1379–1389. [Google Scholar] [CrossRef]
- Theil, H. A rank-invariant method of linear and polynomial regression analysis. In Henri Theil’s Contributions to Economics and Econometrics, Advanved Studies in Theoretical and Applied Econometrics; Raj, B., Koerts, J., Eds.; Springer: Dordrecht, The Netherlands, 1992; Volume 23, pp. 345–381. [Google Scholar]
- Mann, H.B. Nonparametric tests against trend. Econometrica 1945, 13, 245–259. [Google Scholar] [CrossRef]
- Kendall, M.G. The treatment of ties in ranking problems. Biometrika 1945, 33, 239–245. [Google Scholar] [CrossRef]
- Climate Monitoring Bulletin of Poland, Year 2023, IMWM-NRI. 2024. Available online: https://klimat.imgw.pl/img/biuletyn-monitoring/2023/monitoring_12_2023.pdf (accessed on 10 July 2024).
- Ustrunul, A.; Wypych, A.; Czekierda, D. Air Temperature Change. In Climate Change in Poland: Past, Present, Future; Falarz, M., Ed.; Springer Climate: Cham, Switzerland, 2021; pp. 331–348. [Google Scholar]
- Sulikowska, A.; Wypych, A. Seasonal variability of trends in regional hot and warm temperature extremes in Europe. Atmosphere 2021, 12, 612. [Google Scholar] [CrossRef]
- Tomczyk, A.M.; Piotrowski, P.; Bednorz, E. Warm spells in Northern Europe in relation to atmospheric circulation. Theor. Appl. Climatol. 2017, 128, 623–634. [Google Scholar] [CrossRef]
- Wibig, J. Hot days and heat waves in Poland in the period 1951-2019 and the circulation factors favoring the most extreme of them. Atmosphere 2021, 12, 340. [Google Scholar] [CrossRef]
- Łupikasza, E.B. Seasonal patterns and consistency of extreme precipitation trends in Europe, December 1950 to February 2008. Clim. Res. 2017, 72, 217–237. [Google Scholar] [CrossRef]
- Szwed, I. Variability of precipitation in Poland under climate change. Theor Appl Climatol. 2019, 135, 1003–1015. [Google Scholar] [CrossRef]
- Łupikasza, E.; Małarzewski, Ł. Precipitation Change. In Climate Change in Poland: Past, Present, Future; Falarz, M., Ed.; Springer Climate: Cham, Switzerland, 2021; pp. 349–373. [Google Scholar]
- Meehl, G.; Stocker, T.F.; Collins, W.D.; Friedlingstein, P.; Gaye, A.T.; Gregory, J.M.; Kitoh, A.; Knutti, R.; Murphy, J.M.; Noda, A.; et al. Global climate projections. In Climate Change 2007: The Physical Science Basis; Contribution of Working Group I to the Fourth Assessment Report of the Intergovernmental Panel on Climate Change; Solomon, S., Qin, D., Manning, M., Chen, Z., Marquis, M., Averyt, K.B., Tignor, M., Miller, H.L., Eds.; Cambridge University Press: Cambridge, UK; New York, NY, USA, 2007. [Google Scholar]
- Ye, H.C. Changes in frequency of precipitation types associated with surface air temperature over northern Eurasia during 1936–1990. J. Clim. 2008, 21, 5807–5819. [Google Scholar] [CrossRef]
- Ye, H.C.; Fetzer, E.J.; Behrangi, A.; Wong, S.; Lambrigtsen, B.H.; Wang, C.Y.; Cohen, J.; Gamelin, B.L. Increasing daily precipitation intensity associated with warmer air temperatures over Northern Eurasia. J. Clim. 2016, 29, 623–636. [Google Scholar] [CrossRef]
- Lenderink, G.; van Meijgaard, E. Increase in hourly precipitation extremes beyond expectations from temperature changes. Nat. Geosci. 2008, 1, 511–514. [Google Scholar] [CrossRef]
- Wibig, J.; Piotrowski, P. Impact of the air temperature and atmospheric circulation on extreme precipitation in Poland. Int. J. Climatol. 2018, 38, 4533–4549. [Google Scholar] [CrossRef]
- Bastos, A.; Sippel, S.; Frank, D.; Mahecha, M.D.; Zaehle, S.; Zscheischler, J.; Reichstein, M. A joint framework for studying compound ecoclimatic events. Nat. Rev. Earth Environ. 2023, 4, 333–350. [Google Scholar] [CrossRef]
Figure 1.
Location of meteorological stations.
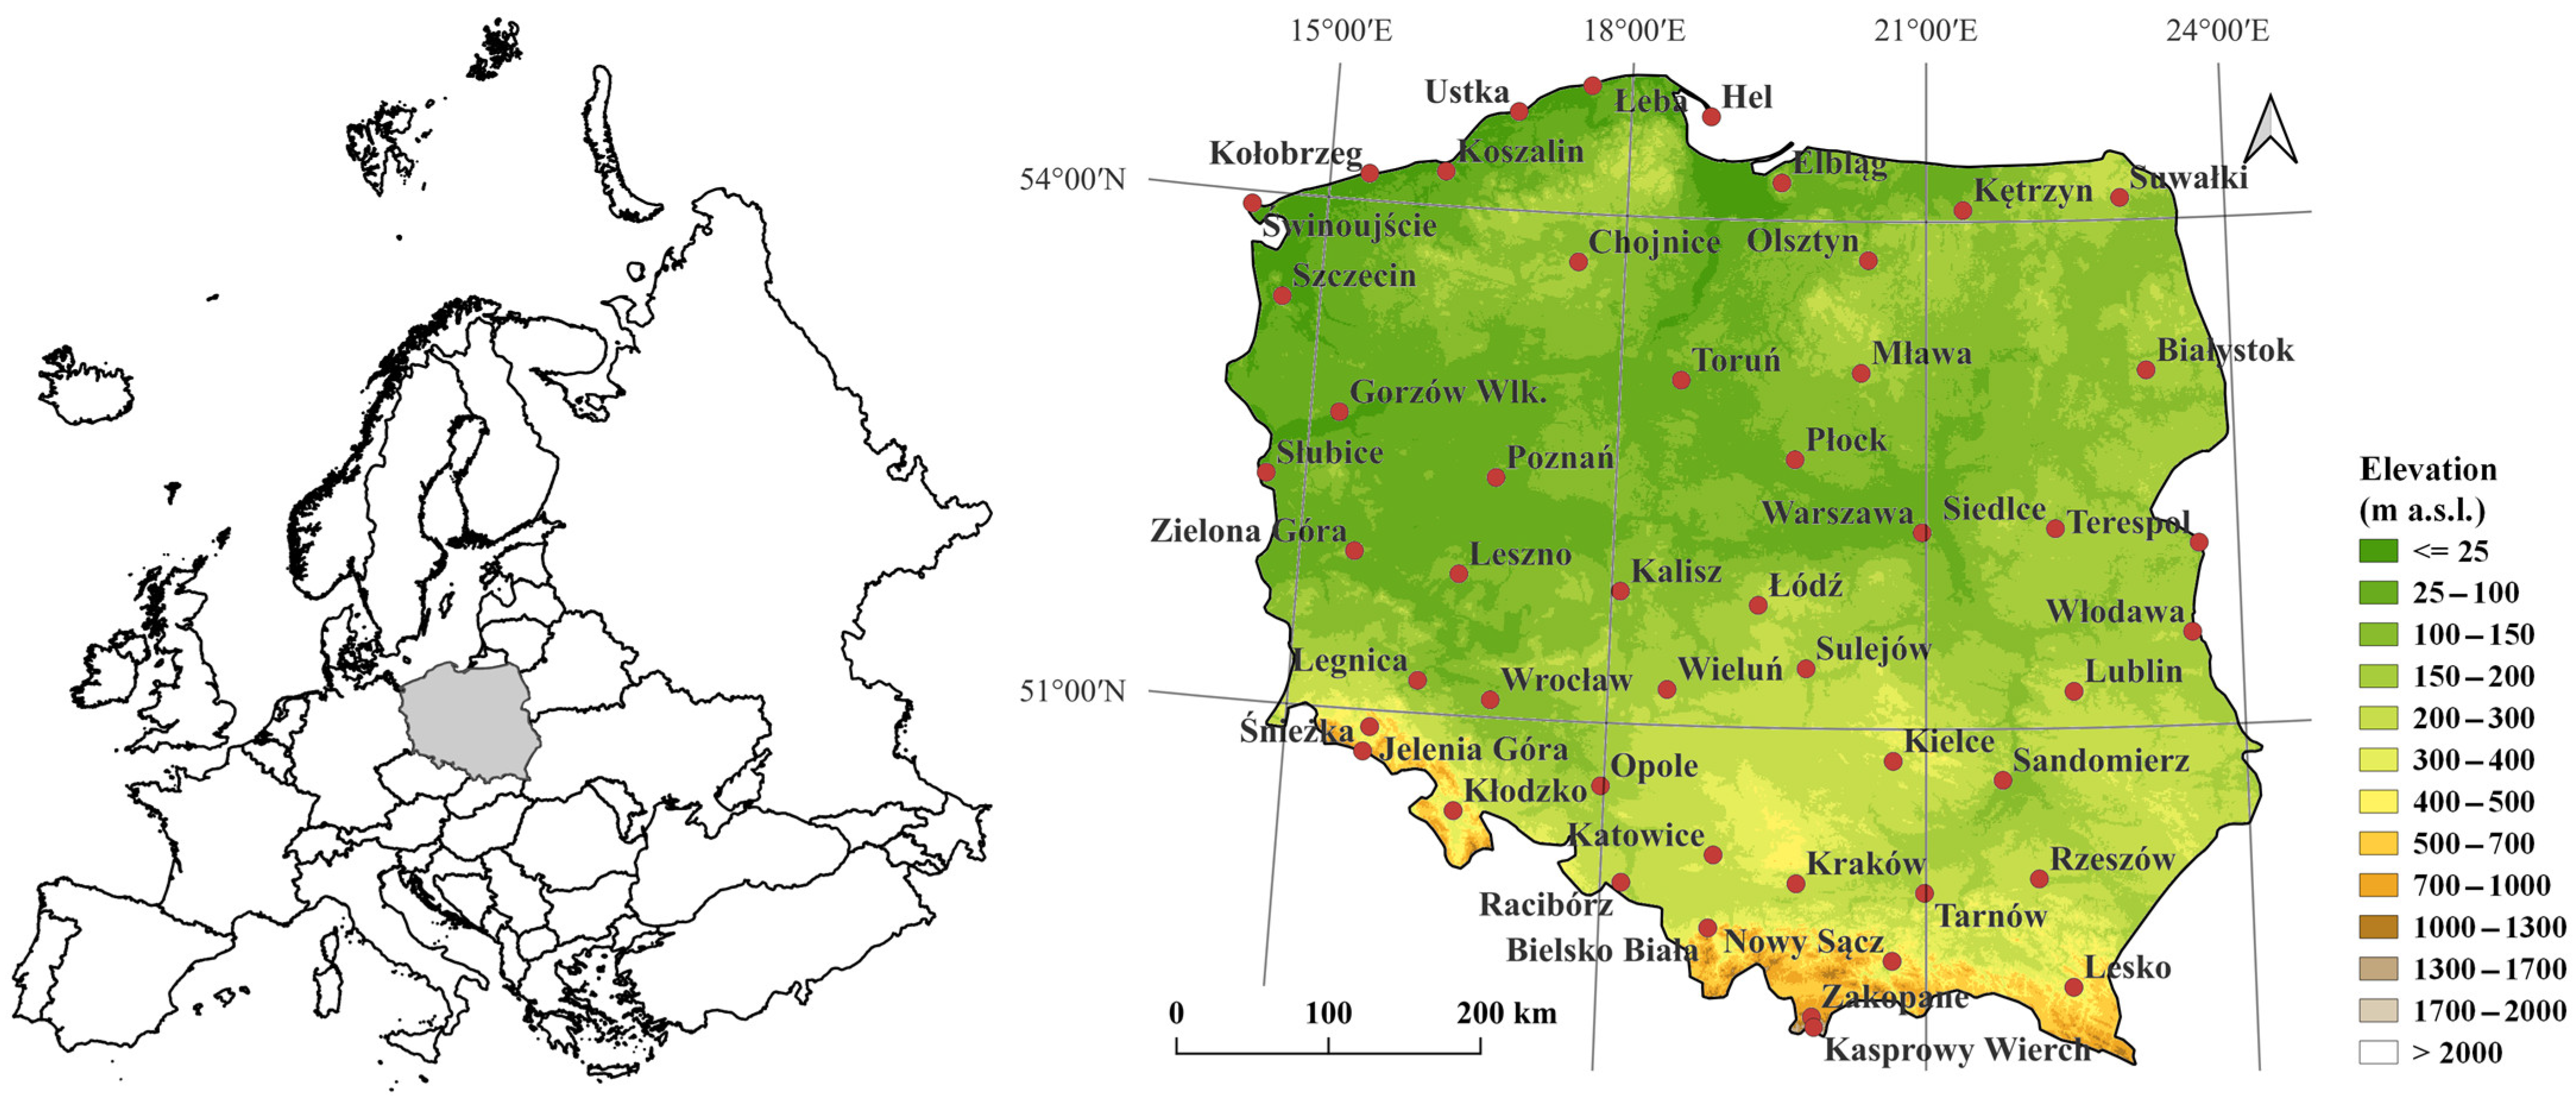
Figure 2.
Example threshold values for one of the stations: (A) temperature and (B) precipitation.
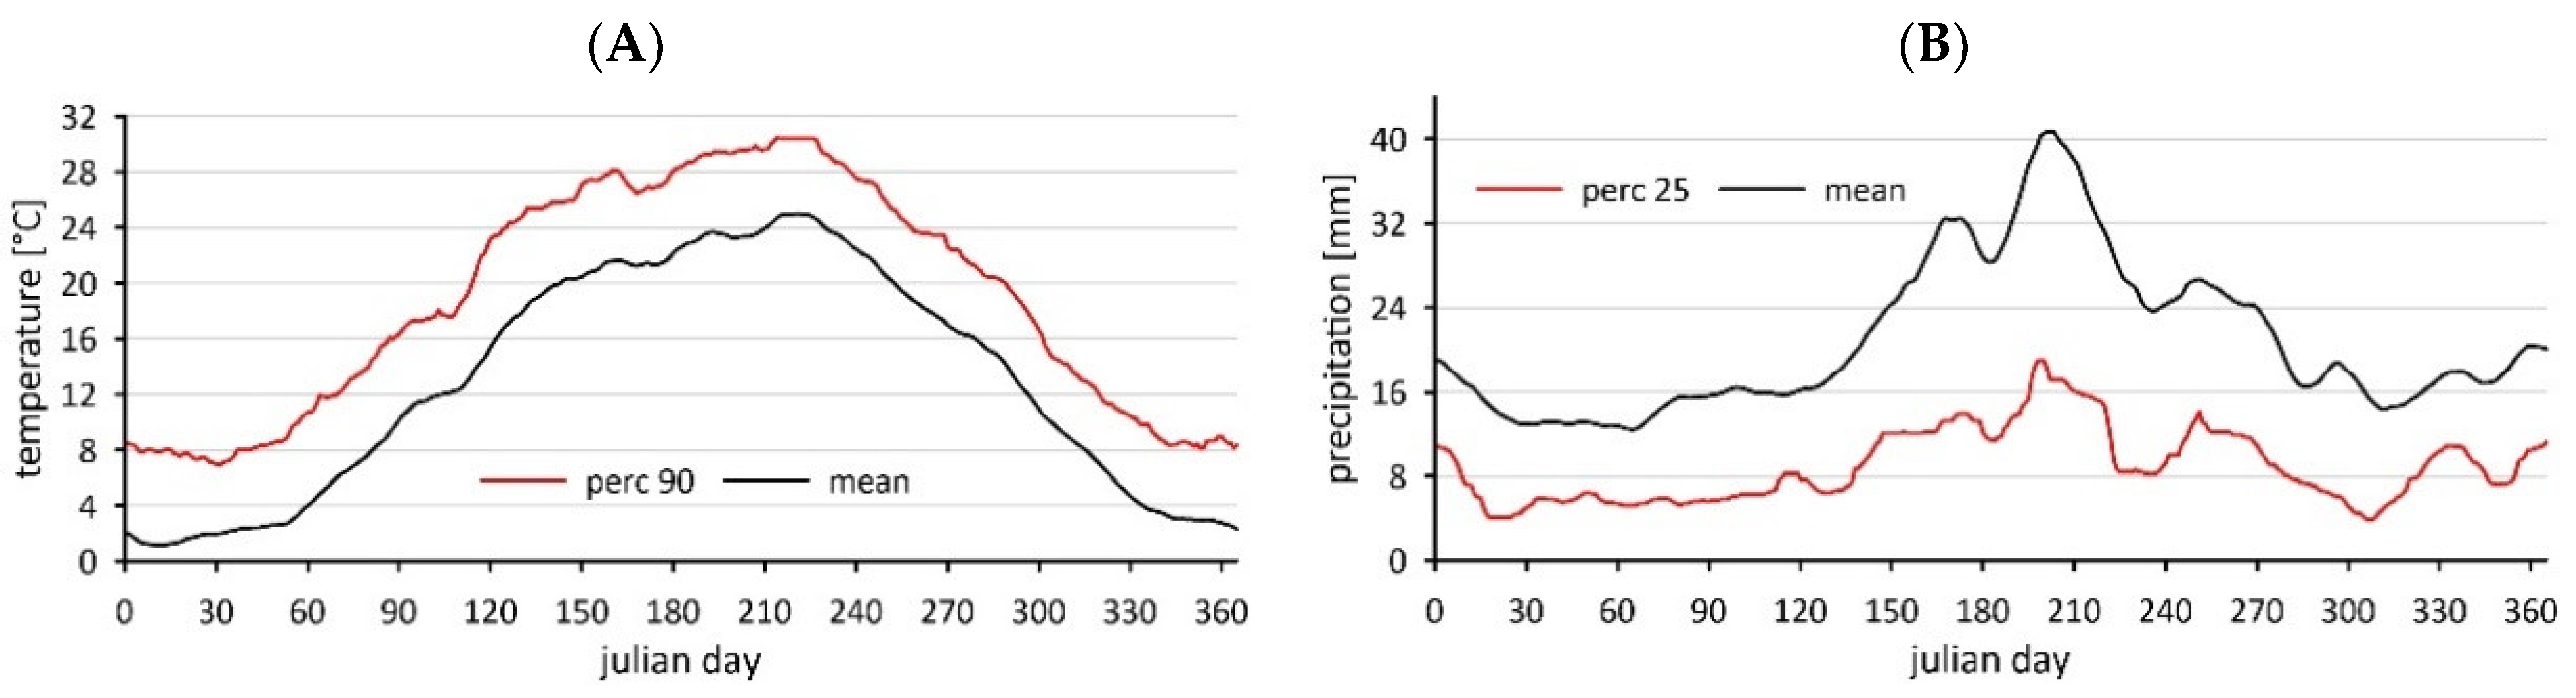
Figure 3.
Distribution of the maximum temperature trends in Poland during the period of 1966–2023. The boxes range from the 25th to 75th percentile, with the median value in the middle. The whiskers span the +/− 1.5·interquartile range.
Figure 3.
Distribution of the maximum temperature trends in Poland during the period of 1966–2023. The boxes range from the 25th to 75th percentile, with the median value in the middle. The whiskers span the +/− 1.5·interquartile range.

Figure 4.
Spatial distribution of the maximum temperature trends in Poland during the period of 1966–2023: (A) April, (B) July, (C) October, and (D) January. Areas with significant trends are hatched.
Figure 4.
Spatial distribution of the maximum temperature trends in Poland during the period of 1966–2023: (A) April, (B) July, (C) October, and (D) January. Areas with significant trends are hatched.

Figure 5.
The average number of warm (A) and dry (B) days in Poland throughout the analyzed period of 1966–2023 and the two 25-year subperiods.
Figure 5.
The average number of warm (A) and dry (B) days in Poland throughout the analyzed period of 1966–2023 and the two 25-year subperiods.

Figure 6.
Spatial distribution of the warm-day frequency trends in Poland in the period of 1966–2023: (A) spring, (B) summer, (C) autumn, and (D) winter. The areas with significant trends are hatched.
Figure 6.
Spatial distribution of the warm-day frequency trends in Poland in the period of 1966–2023: (A) spring, (B) summer, (C) autumn, and (D) winter. The areas with significant trends are hatched.

Figure 7.
Average annual precipitation totals in Poland during 1966–2023 (A) and their trends (B). The areas with statistically significant trends are dotted.
Figure 7.
Average annual precipitation totals in Poland during 1966–2023 (A) and their trends (B). The areas with statistically significant trends are dotted.

Figure 8.
(A) The spatial average monthly precipitation totals in Poland during the period of 1966–2023 and (B) the distributions of trends of the monthly totals at different stations.
Figure 8.
(A) The spatial average monthly precipitation totals in Poland during the period of 1966–2023 and (B) the distributions of trends of the monthly totals at different stations.
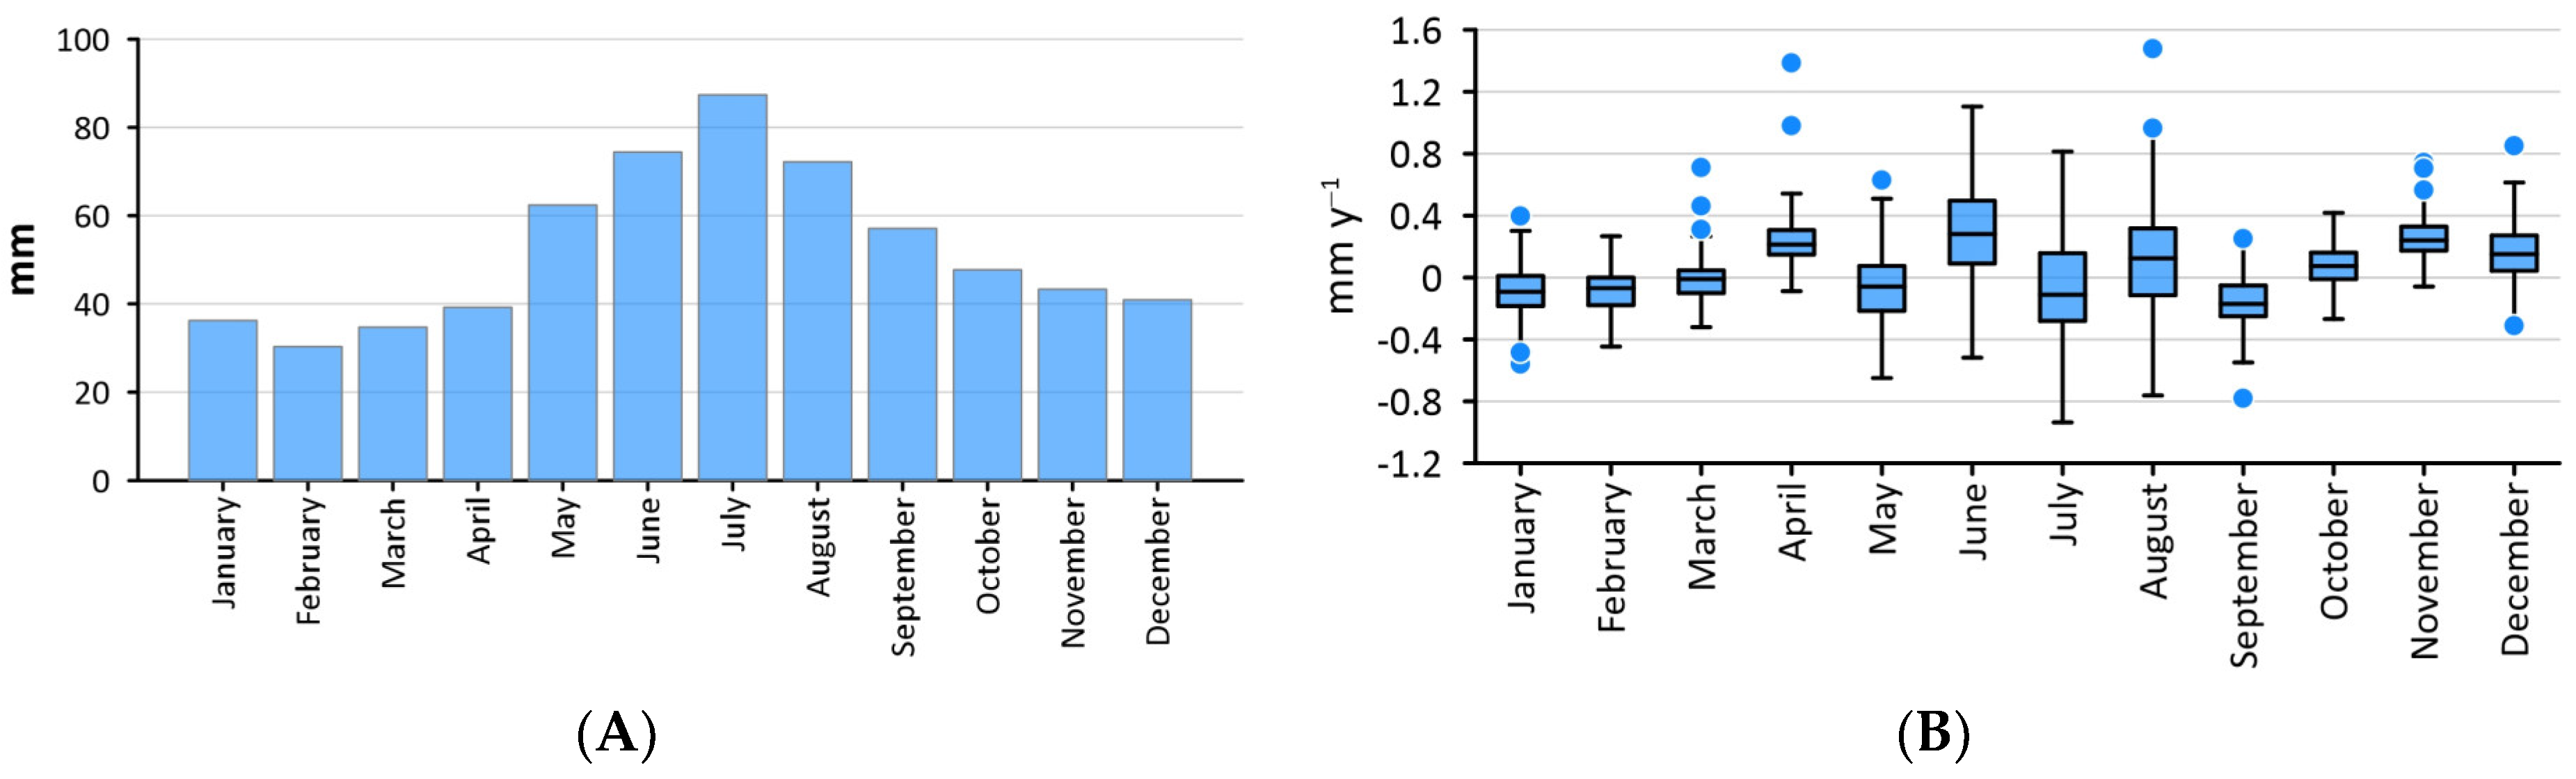
Figure 9.
The average number of WD days in Poland throughout the analyzed period of 1966–2023 and the two 25-year subperiods, and (A) the distribution of WD days depending on the number of stations in which they co-occurred (B).
Figure 9.
The average number of WD days in Poland throughout the analyzed period of 1966–2023 and the two 25-year subperiods, and (A) the distribution of WD days depending on the number of stations in which they co-occurred (B).
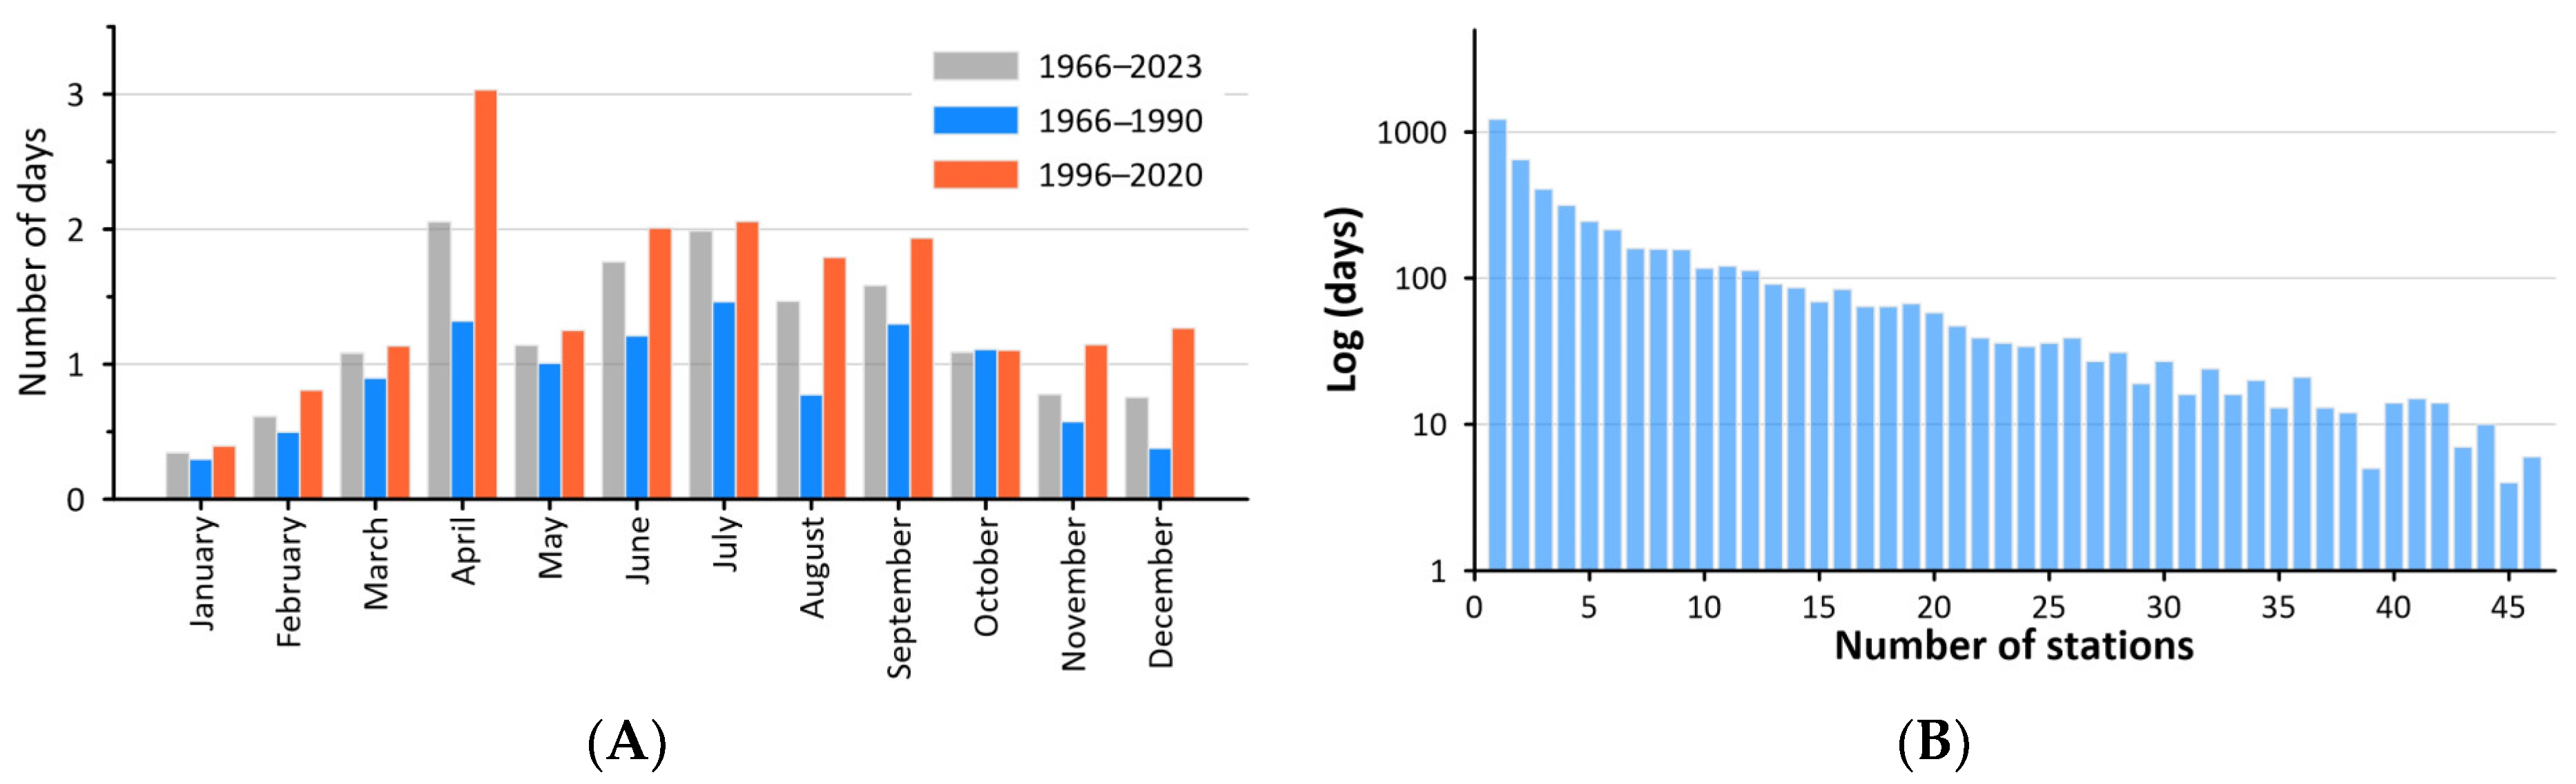
Figure 10.
The average frequency of the WD days in Poland in the period of 1966–1990 (left column), 1996–2020 (middle column), and the differences between 1996–2020 and 1966–1990 (right column).
Figure 10.
The average frequency of the WD days in Poland in the period of 1966–1990 (left column), 1996–2020 (middle column), and the differences between 1996–2020 and 1966–1990 (right column).
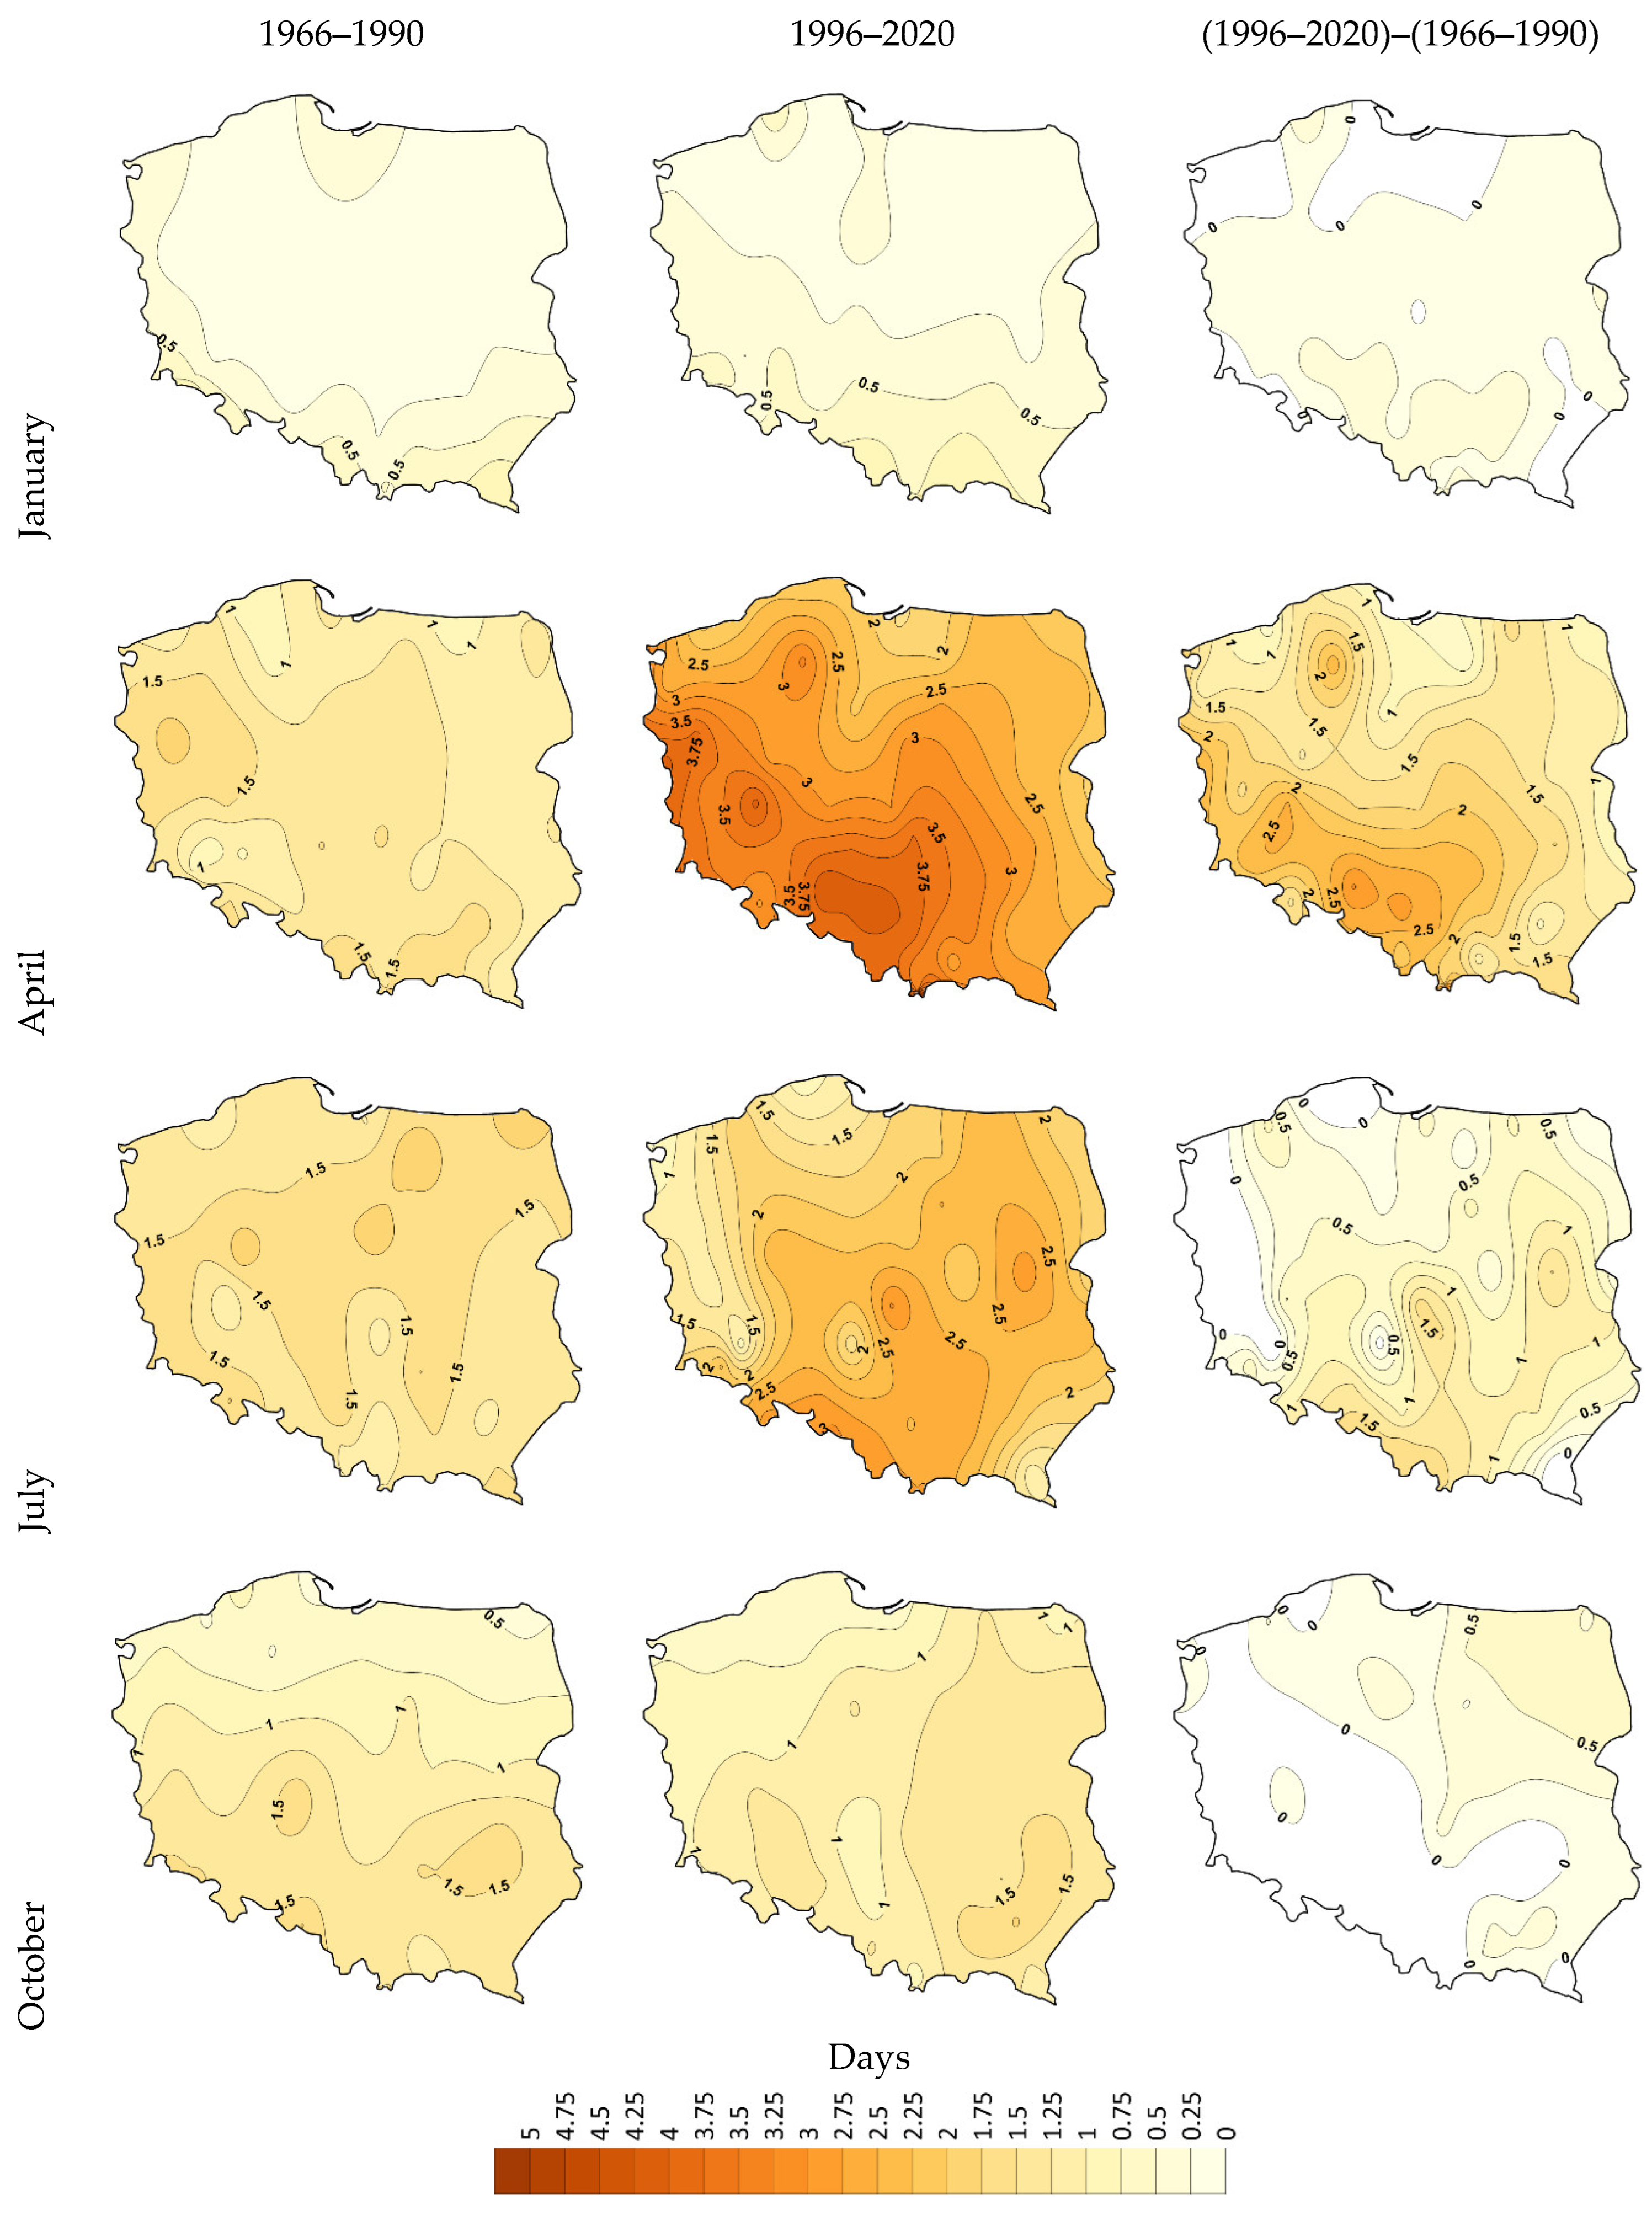
Figure 11.
Seasonal distribution of the geopotential height at the 850 hPa level [dam] and its anomalies [m] for warm and dry days during 1966–2023, 1966–1985, and 2001–2020.
Figure 11.
Seasonal distribution of the geopotential height at the 850 hPa level [dam] and its anomalies [m] for warm and dry days during 1966–2023, 1966–1985, and 2001–2020.

Table 1.
List of circulation indices.
| Full Name | Abbrev. | Source | Ref. |
|---|---|---|---|
| Greenland Blocking Index | GBI | psl.noaa.gov/gcos_wgsp/Timeseries/Data/gbi.mon.data (assessed on 10 July 2024) | [20] |
| Atlantic Multidecadal Oscillations | AMO | www1.ncdc.noaa.gov/pub/data/cmb/ersst/v5/index/ersst.v5.amo.dat (assessed on 10 July 2024) | [21] |
| Arctic Oscillation | AO | cpc.ncep.noaa.gov/products/precip/CWlink/daily_ao_index/monthly.ao.index.b50.current.ascii (assessed on 10 July 2024) | - |
| North Atlantic Oscillation | NAO | https://ftp.cpc.ncep.noaa.gov/wd52dg/data/indices/tele_index.nh (assessed on 10 July 2024) | [22] |
| Scandinavian Index | SCAND | https://ftp.cpc.ncep.noaa.gov/wd52dg/data/indices/tele_index.nh (assessed on 10 July 2024) | [22] |
| East Atlantic Index | EA | https://ftp.cpc.ncep.noaa.gov/wd52dg/data/indices/tele_index.nh (assessed on 10 July 2024) | [22] |
| Eastern Europe/Western Russia | EAWR | https://ftp.cpc.ncep.noaa.gov/wd52dg/data/indices/tele_index.nh (assessed on 10 July 2024) | [22] |
Table 2.
The trend coefficients of the WD characteristics in the period of 1966–2023. Values that were significant at the 95% level are bolded.
Table 2.
The trend coefficients of the WD characteristics in the period of 1966–2023. Values that were significant at the 95% level are bolded.
| Month/Season | Number of Days, Days dec−1 | Number of Station Days, Days dec−1 | Intensity, mm deg dec−1 |
|---|---|---|---|
| January | 0.23 | 0.59 | −0.75 |
| February | 0.00 | 0.40 | −4.24 |
| March | 0.49 | 2.00 | −3.79 |
| April | 1.35 | 12.08 | −105.36 |
| May | 0.00 | 0.83 | −4.38 |
| June | 1.05 | 10.00 | −236.09 |
| July | 1.29 | 6.13 | −105.80 |
| August | 1.62 | 7.50 | −95.12 |
| September | 0.73 | 4.00 | −57.55 |
| October | 0.44 | 1.67 | −10.00 |
| November | 0.93 | 4.72 | −27.98 |
| December | 1.00 | 4.44 | −22.95 |
| Spring | 2.11 | 25.68 | −240.04 |
| Summer | 3.85 | 29.14 | −716.76 |
| Autumn | 2.44 | 16.38 | −214.62 |
| Winter | 1.91 | 10.58 | −104.16 |
| Year | 10.00 | 97.04 | −1871.24 |
Table 3.
Relative frequency of WD-day occurrences among all days (Simpl.) provided that the day was warm (Cond.) during 1966–2023 and the two subperiods. Conditional probability higher (lower) than simple probability is marked in red (blue).
Table 3.
Relative frequency of WD-day occurrences among all days (Simpl.) provided that the day was warm (Cond.) during 1966–2023 and the two subperiods. Conditional probability higher (lower) than simple probability is marked in red (blue).
| Period | Probability | January | February | March | April | May | June | July | August | September | October | November | December |
|---|---|---|---|---|---|---|---|---|---|---|---|---|---|
| 1966–2023 | Simpl. | 21.6 | 20.2 | 22.5 | 26.5 | 20.8 | 25.9 | 25.0 | 24.0 | 27.5 | 25.5 | 24.0 | 27.3 |
| Cond. | 11.4 | 15.7 | 27.4 | 41.9 | 31.5 | 40.2 | 43.9 | 41.8 | 52.9 | 41.4 | 28.9 | 25.1 | |
| 1966–1990 | Simpl. | 24.4 | 21.1 | 24.9 | 25.1 | 20.1 | 21.4 | 25.4 | 22.5 | 27.2 | 27.3 | 22.9 | 22.4 |
| Cond. | 15.9 | 18.8 | 26.5 | 39.1 | 31.1 | 37.3 | 52.5 | 39.3 | 54.5 | 51.2 | 29.4 | 15.2 | |
| 1996–2020 | Simpl. | 21.4 | 21.4 | 19.1 | 31.4 | 19.5 | 27.2 | 21.8 | 23.2 | 29.6 | 22.6 | 26.6 | 32.1 |
| Cond. | 11.4 | 16.2 | 25.7 | 44.9 | 28.9 | 37.4 | 37.2 | 41.0 | 56.2 | 38.6 | 29.8 | 35.8 |
Table 4.
Correlation coefficients between the selected circulation indices and frequencies of WD days in the period of 1966–2023. Values that were significant at the 95% (90%) level are in bold (italic).
Table 4.
Correlation coefficients between the selected circulation indices and frequencies of WD days in the period of 1966–2023. Values that were significant at the 95% (90%) level are in bold (italic).
| Indices | AMO | AO | NAO | EA | EAWR | SCAND | GBI |
|---|---|---|---|---|---|---|---|
| January | 0.115 | 0.276 | 0.284 | 0.550 | −0.143 | 0.048 | −0.327 |
| February | 0.138 | 0.441 | 0.301 | 0.381 | 0.212 | −0.194 | −0.317 |
| March | −0.016 | 0.402 | 0.232 | 0.377 | 0.249 | 0.009 | −0.347 |
| April | 0.181 | 0.142 | 0.168 | 0.260 | 0.140 | 0.237 | 0.024 |
| May | 0.058 | 0.228 | 0.198 | 0.285 | 0.041 | 0.244 | −0.165 |
| June | 0.284 | 0.192 | 0.270 | 0.229 | −0.045 | −0.050 | −0.179 |
| July | 0.349 | 0.210 | 0.075 | 0.327 | 0.071 | −0.008 | 0.036 |
| August | 0.289 | 0324 | 0.252 | 0.414 | −0.006 | −0.210 | −0.187 |
| September | 0.198 | 0.520 | 0.264 | 0.507 | −0.145 | 0.010 | −0.249 |
| October | 0.177 | 0.130 | 0.056 | 0.333 | 0.015 | 0.302 | −0.103 |
| November | 0.185 | 0.123 | 0.220 | 0.346 | 0.131 | 0.284 | −0.146 |
| December | 0.259 | 0.314 | 0.482 | 0.369 | −0.040 | −0.068 | −0.289 |
Disclaimer/Publisher’s Note: The statements, opinions and data contained in all publications are solely those of the individual author(s) and contributor(s) and not of MDPI and/or the editor(s). MDPI and/or the editor(s) disclaim responsibility for any injury to people or property resulting from any ideas, methods, instructions or products referred to in the content. |
© 2024 by the authors. Licensee MDPI, Basel, Switzerland. This article is an open access article distributed under the terms and conditions of the Creative Commons Attribution (CC BY) license (https://creativecommons.org/licenses/by/4.0/).
Share and Cite
MDPI and ACS Style
Wibig, J.; Jędruszkiewicz, J. Warm and Dry Compound Events in Poland. Atmosphere 2024, 15, 1019. https://doi.org/10.3390/atmos15091019
AMA Style
Wibig J, Jędruszkiewicz J. Warm and Dry Compound Events in Poland. Atmosphere. 2024; 15(9):1019. https://doi.org/10.3390/atmos15091019
Chicago/Turabian StyleWibig, Joanna, and Joanna Jędruszkiewicz. 2024. "Warm and Dry Compound Events in Poland" Atmosphere 15, no. 9: 1019. https://doi.org/10.3390/atmos15091019
Note that from the first issue of 2016, this journal uses article numbers instead of page numbers. See further details here.