Article

Influence of Field Sampling Methods on Measuring Volatile Organic Compounds in a Swine Facility Using SUMMA Canisters

1
College of Biosystems Engineering and Food Science, Zhejiang University, Hangzhou 310058, China
2
Key Laboratory of Ecological and Environmental Monitoring, Forewarning and Quality Control of Zhejiang Province, Ecological and Environmental Monitoring Center of Zhejiang Province, Hangzhou 310012, China
*
Author to whom correspondence should be addressed.
These authors contributed equally to this work and should be considered co-first authors.
Atmosphere 2024, 15(9), 1021; https://doi.org/10.3390/atmos15091021
Submission received: 17 June 2024 / Revised: 8 August 2024 / Accepted: 14 August 2024 / Published: 23 August 2024
(This article belongs to the Collection Livestock Odor Issues and Air Quality)

Abstract

:
Volatile organic compounds (VOCs) play a crucial role in emission control, being one of the most important sources of odor while also serving as significant precursors to secondary organic aerosols and ozone formation. Appropriate sampling methods are essential for accurately assessing the concentration and composition of VOCs within swine barns. In this study, the effects of both passive air sampling and active air sampling on VOCs were evaluated, and the influence of storage time on the VOC stability in sampling canisters for both methods was investigated. SUMMA canisters, which are electropolished and passivated with silanization, offer excellent corrosion protection and resistance to high pressure and temperature and were used in this study. The predominant component categories prevailing within the pig house were found to be oxygenated VOCs (OVOCs) and volatile sulfur compounds (VSCs), with ethanol emerging as the most abundant component of VOCs detected. Notably, the statistical analysis results revealed no significant differences between passive and active sampling regarding the impact of storage time on substance concentration. Changes in canister pressure also did not significantly affect substance stability. The results showed that the C2–C3 compounds remained relatively stable, especially within 3 days, with recoveries above 80% within 20 days. Methyl sulfide, dimethyl disulfide, and ethanol were more stable within the first week, but their recoveries significantly dropped by day 20, with methyl sulfide and dimethyl disulfide at 62.3% and 65.3%, respectively. This study contributes to the development of a foundation for selecting appropriate VOC sampling methods in swine facilities for conducting a rational analysis of VOC samples.

Graphical Abstract

1. Introduction

Odor pollution has become a major challenge for ecological improvement [1]. Intensive swine feeding operations are notably associated with unpleasant odors, prompting numerous complaints from nearby residents [2,3,4,5]. The predominant constituents contributing to the malodorous nature of swine feeding operations encompass ammonia (NH3), hydrogen sulfide (H2S), and volatile organic compounds (VOCs). While the issues of odor pollution associated with H2S and NH3 have attracted considerable attention, the detection and mitigation of VOCs pose formidable challenges, characterized by their vast variety, low concentrations, and high associated costs, thus resulting in a paucity of investigations in this domain [6,7,8].
VOCs are a key contributor to these odors, not only polluting the air with unpleasant smells but also posing risks to human and animal health, such as headaches, allergic skin, nose and throat soreness, fatigue, nausea, dizziness, and other symptoms [9]. Moreover, some VOCs can interact with highly reactive components such as hydroxyl radicals to form secondary organic aerosols (SOAs), a major component of fine particulate matter (PM2.5), and ozone (O3), which possesses strong oxidizing properties, further jeopardizing human health [10,11].
Swine operations generate a diverse mix of VOCs. Presently, researchers have identified over 500 distinct VOCs emanating from swine farms, encompassing a wide spectrum of chemical classes such as alcohols, esters, ketones, alkenes, aromatics, phenols, volatile fatty acids (VFAs) [12], volatile sulfur compounds (VSCs), and various other compounds [9,13,14]. Interestingly, some of the VOCs released by swine farms have a low olfactory threshold, which means that scents can be generated even at low concentrations, significantly contributing to malodors [15,16]. Studies indicate that 1,3-butadiene, toluene, and benzene pose cancer risks [17], while alkenes and aromatics are primary contributors to the formation of O3 and SOAs, respectively [18]. Additionally, VSCs and p-cresols have the most significant impact on odor [19]. China’s emission standards for offensive odors, as stipulated in GB 14554-93, categorize specific volatile organic compounds (VOCs) as malodor-controlled substances. This includes compounds such as trimethylamine, methanethiol, methyl sulfide, dimethyl disulfide, carbon disulfide, and styrene [20]. Furthermore, in the “National Advanced Pollution Prevention and Control Technology Catalog” released by China’s Ministry of Environmental Protection in 2016, VOC pollution prevention and control is listed as one of the five major key emission reduction projects.
The detection of VOCs primarily involves three key steps: sample collection, sample pretreatment, and sample analysis [21]. Typically, VOCs are gathered through the utilization of sorbent tubes containing adsorbents or through the use of containers such as sampling bags and sampling canisters [22]. Sampling bags, such as Tedlar bags, Teflon bags, and Fluode bags, are cost-effective, versatile, and easy to use. However, they are prone to sample volatilization and contamination [23,24,25]. Sorbent tubes, typically made of glass or stainless steel, contain adsorbents such as activated carbon or molecular sieves. They offer high sensitivity for specific VOCs but have a short lifespan and are limited in their ability to detect a wide range of VOCs [26,27,28,29,30]. For effective VOC sampling, the use of SUMMA canisters has proven to be a reliable method. These canisters feature polished and inert surfaces and joints, minimizing the adsorption and chemical reactions of chemically active substances on the inner walls. This design ensures the accurate preservation of samples, guaranteeing the reliability of the collected data [31]. Despite its advantages, the SUMMA canister has several drawbacks. Firstly, it is expensive to manufacture and maintain, and its large size and weight make it cumbersome to transport and operate. Proper storage and transport are crucial to avoid contamination or damage, and the canister must be thoroughly cleaned and calibrated. Additionally, in low concentration environments, the detection sensitivity of the SUMMA canister may be inferior to other methods, leading to less accurate measurements [32,33,34].
SUMMA canister sampling is divided into two types: passive and active sampling [35,36,37]. Active sampling uses a sampling pump and flow controller to deliver the sample into the canister, allowing for the collection of large volumes of air, often up to twice the canister’s capacity. However, the sampling pump must be certified as free of analyte residues or losses to ensure sample integrity. Additionally, the need for a power supply can make active sampling challenging in remote areas. In contrast, passive sampling mainly involves transient sampling and constant flow sampling. Transient sampling utilizes the vacuum inside the canister to draw in an air sample over a short period. This method is simple to operate, requires no power supply, and is suitable for field sampling in various locations [38,39,40]. The composition of VOCs in pigsties is complex, and their stability within SUMMA canisters has not been studied. Therefore, it is crucial to comprehensively assess the feasibility and limitations of these two sampling methods in monitoring pig farm environments. Comparing and analyzing the storage stability of VOCs in SUMMA canisters is essential for ensuring the scientific accuracy and sustainability of VOC detection in pig farms.
Both SUMMA canister sampling methods utilize the same type of container, are suitable for ambient air sampling, and share an identical cleaning process. These methods do not alter the chemical properties of the samples collected. Stringent quality control is essential for both methods, involving the use of calibrated flow controllers, leak detection procedures, and the assurance of the cleanliness of the canisters. However, there are differences in the sample volume and sampling duration between the two methods. Active sampling typically collects larger sample volumes and requires more time compared to the instantaneous sampling associated with passive sampling.
VOCs are significant pollutants in pig farm environments, directly impacting both environmental quality and the health of humans and animals, and pose potential health risks to people. Choosing the appropriate sampling method is crucial for ensuring the effectiveness and accuracy of VOC detection. SUMMA canisters have unique characteristics and significant advantages in monitoring and analyzing environmental VOCs. They effectively prevent sample contamination and external interference, and samples stored in SUMMA canisters remain relatively stable. The complex VOC composition in pigsties has not yet been studied for its stability within SUMMA canisters. Therefore, comprehensively evaluating the feasibility and limitations of these two sampling methods in pig farm environment monitoring and comparing the storage stability of VOCs in SUMMA canisters are of great significance for the scientific and sustainable detection of VOCs in pig farms.
The primary objectives of this study are to comprehensively investigate variations in VOC concentrations, specifically focusing on the influence of different canister sampling methods employed during real time in a pig house, and to evaluate the impact of storage time on VOC component concentrations by analyzing various canister sampling methods. By examining these data, we aim to enhance the precision and robustness of VOC analysis in livestock environments and to provide guidelines to mitigate the impact of VOC emissions and foster sustainable practices in livestock production.

2. Materials and Methods

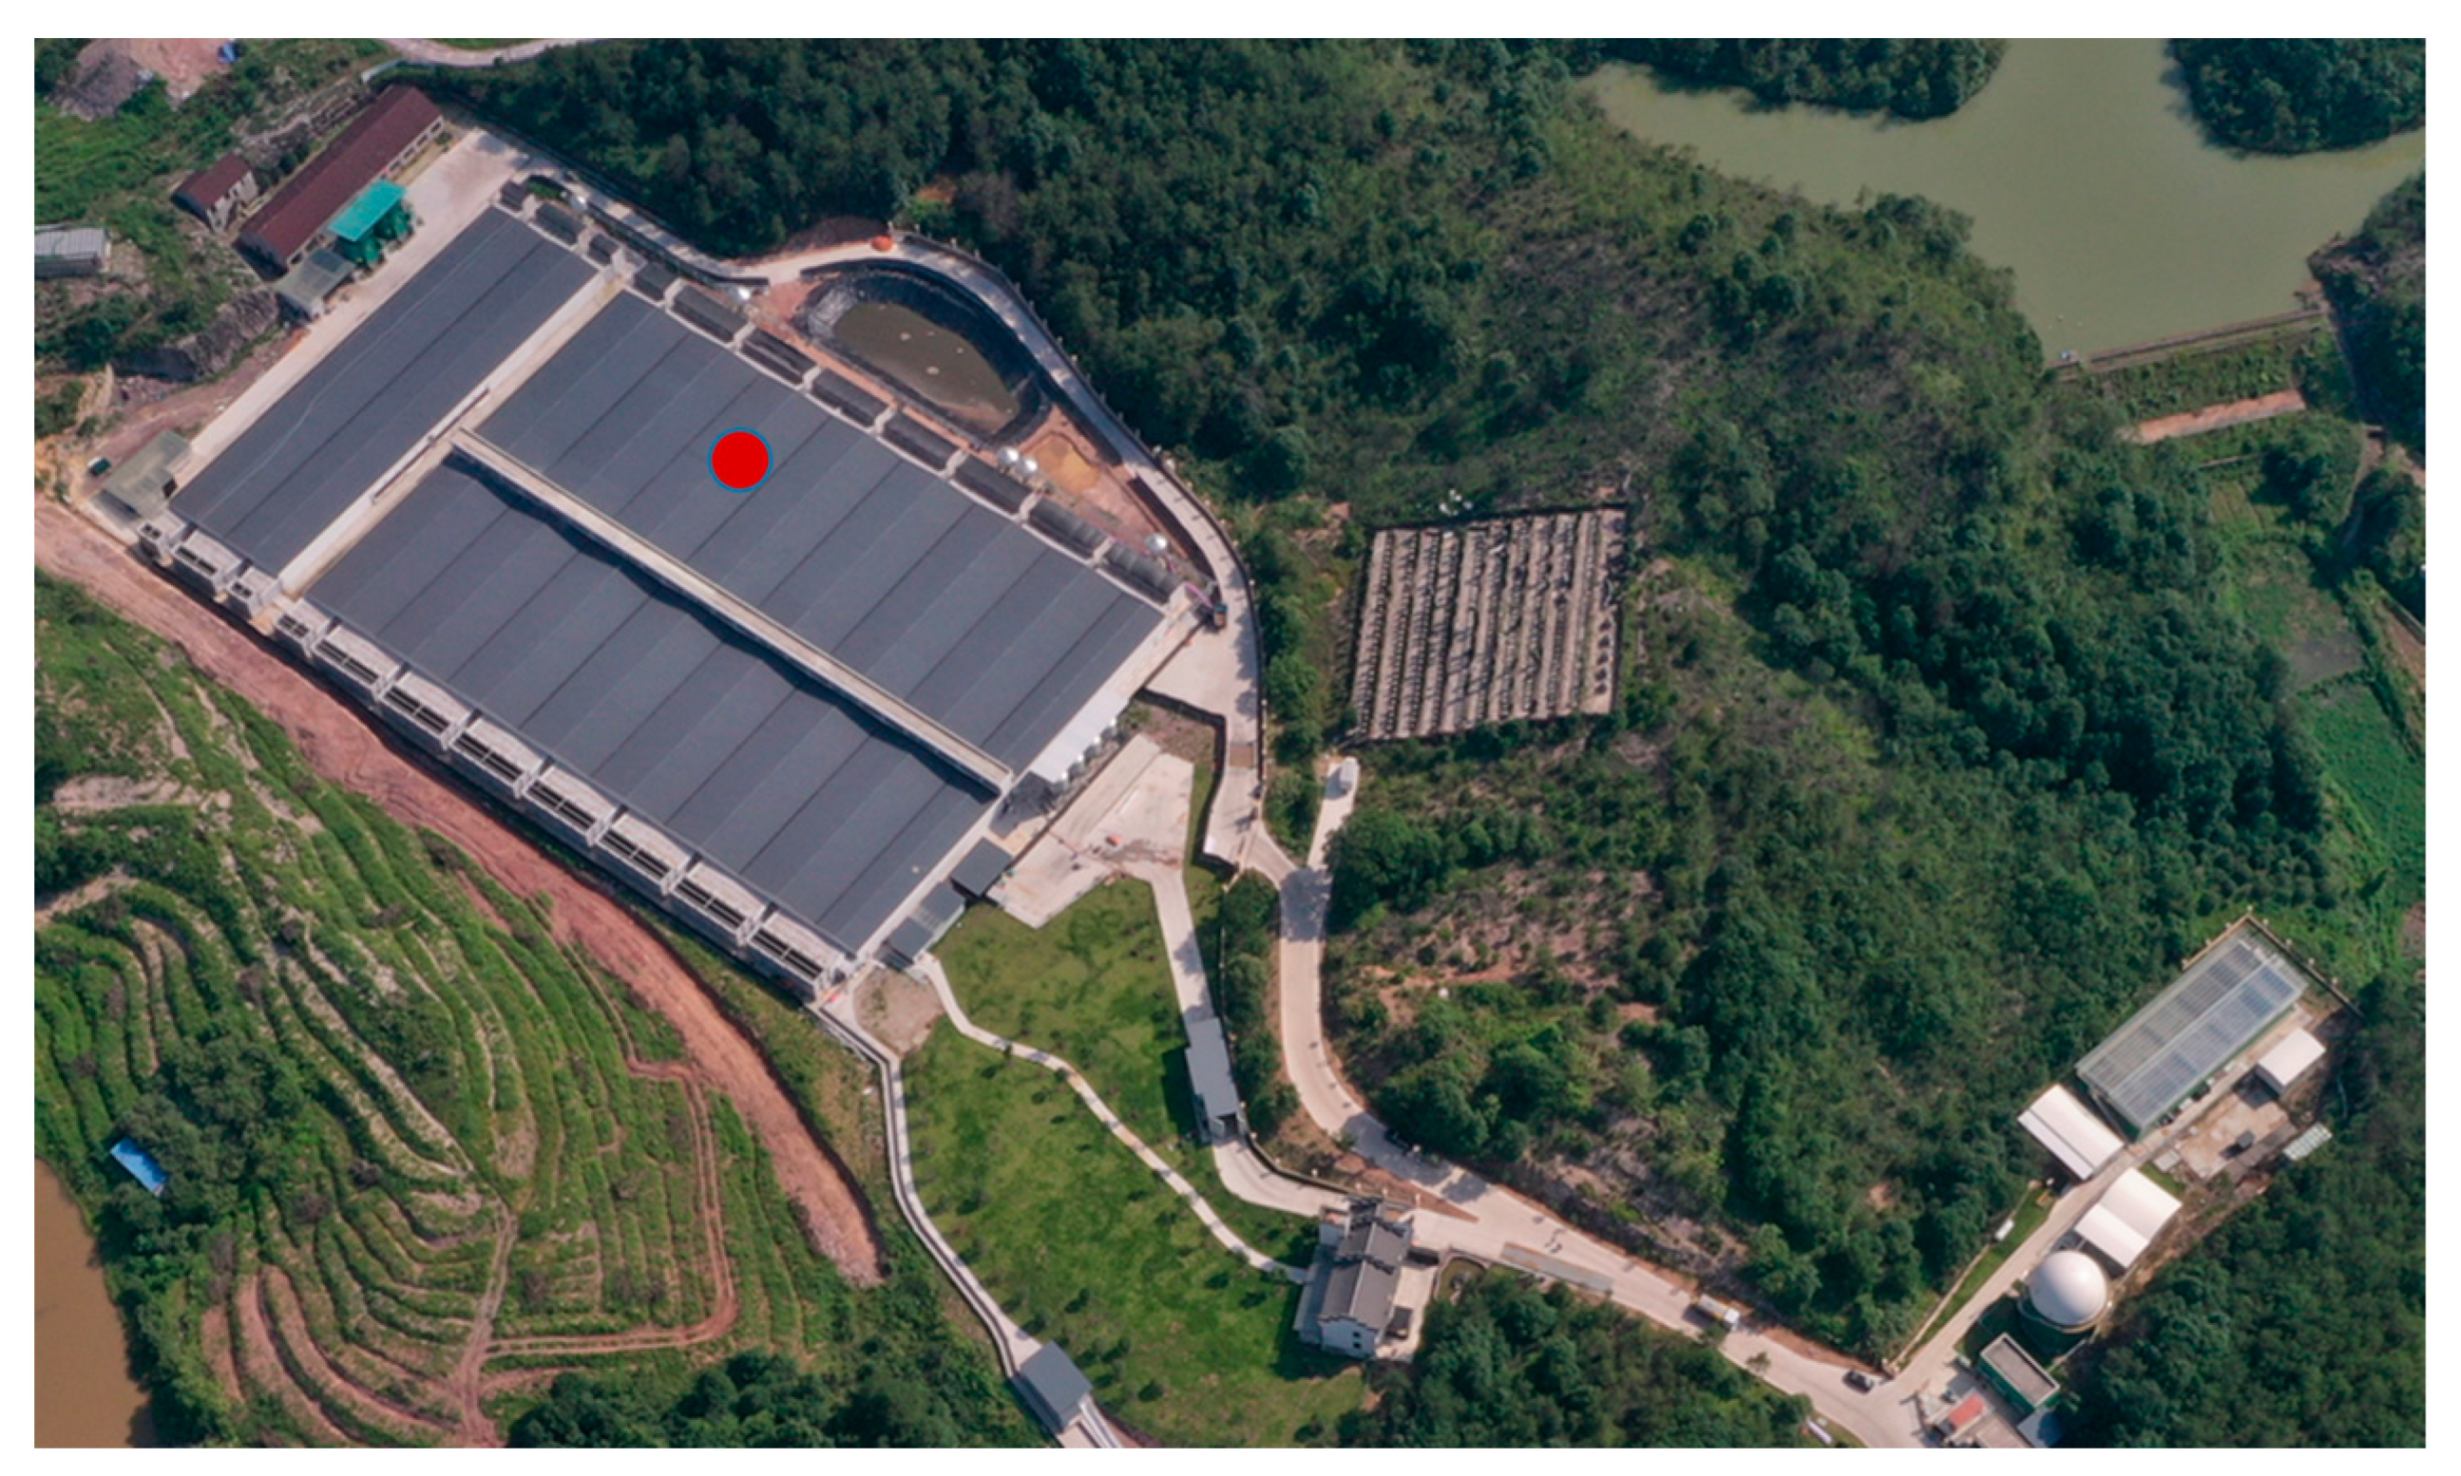
2.1. Study Site Description

The swine facility encompasses 16 fattening pig houses, 4 nursery houses, and a manure processing area (Figure 1). For this study, the focus was on a specific fattening barn (410 m × 160 m), housing approximately 600 pigs, and equipped with a total of 6 fans: 1 inverter fan and 5 temperature-controlled fans. During the experiment, only the inverter fan was operating, while the other fans remained inactive. The pigs received automatic feed and water delivery, and a mechanical manure removal system, featuring a flat-shape design, was employed to manage slurry on the floor. The selected sampling site was positioned in the middle of the fattening pig house, approximately 1.0 m above the floor.

2.2. Sampling Method

The samples were collected using 6 L SUMMA canisters (Entech, Simi Valley, CA, USA) with a maximum pressure capacity of 275 kPa. Following EPA Method TO-15, the canisters were cleaned to achieve a vacuum below 0.03 kPa and subsequently evacuated to a sub-ambient pressure lower than 0.006 kPa prior to sampling [41]. The cleaning process involved evacuating the canisters 3–6 times using an automated canister cleaning system (Entech 3100A, Simi Valley, CA, USA). This system efficiently loaded and pumped high-purity chromatographic nitrogen using both a rough pump and a molecular drag pump to remove any contaminants present in the canisters. After cleaning, the container valve was tightly closed and clearly labelled for sampling.
Air samples were collected using two methods: passive air sampling, which relies on the pressure differential, and active air sampling, which uses a positive pressure sampler (Figure 2). The passive sampling period was 10 min. Following the completion of sampling, the inside of the sampling canister was at atmospheric pressure, with a pressure of 100 kPa. The active air sampling period was 20 min, and the pressure of the gas collected in the canister could be 241 kPa. During sampling, the air temperature and relative humidity were monitored using a portable hot-wire anemometer (VelociCalc® Multi-Function Ventilation Meter 9565-A, TSI, Shoreview, MN, USA) in the pig house. Subsequently, the collected samples were transported back to the laboratory for further analysis.

2.3. Analysis Method

2.3.1. Standard Curve Creation

Before analyzing the samples, a standard curve was created to establish the relationship between the concentration of standard gases and the chromatographic peak area. The standard gases used in the analysis contained 112 compositions from US EPA PAMS, US EPA TO-15, and National Standard Gas in China for organic sulfur. The standard gas was diluted to 20 ppb and 2.0 ppb using a gas configurator (Entech 4700, Simi Valley, CA, USA), and six gradients (0.5 ppb, 1.0 ppb, 2.0 ppb, 5.0 ppb, 7.5 ppb, 10 ppb) of the standard samples were measured by the sample analyzing system. The retention time (RT), qualitative ions (Ion1, Ion2, Ion3), CAS NO., standard curve correlation factor (R2), and relative standard deviation (RSD) of the standards are shown in Table A1. To calibrate the system, four known VOC concentrations were used as internal standards for samples: bromochloromethane, 1,4-difluorobenzene, chlorobenzene-d5, and 4-bromofluorobenzene.

2.3.2. Instrument Analysis

The samples collected in pressurized canisters at the swine houses were transported back to the laboratory of the Zhejiang Ecological and Environmental Monitoring Center for GC-MS analysis. The canister samples were concentrated using a pre-concentrator (Entech 7200A Instruments Inc., Simi Valley, CA, USA) and then were analyzed on a gas chromatography-mass selective detector/flame ionization detector (GC-MS/FID, Agilent 7890B GC/5977B MS/FID, Wilmington, NC, USA). Flame ionization detector (FID) is used for C2–C3 target compounds, and mass selective detector (MS) is used for the rest of the target compounds [42,43,44,45].
The pre-concentrator has a three-stage trapping system to enhance the effect of separation that can remove the H2O, CO2, and other impurities. Firstly, 400 mL air samples in each canister and 40 mL of standard samples at 100 ppb concentration were injected into the cool trap Module 1 (M1) of the pre-concentrator through the autosampler. H2O and inert gases, such as O2 and N2, can be removed through M1. VOCs were then transferred to cool trap Module 2 (M2), which contains Tenax to capture VOCs as well as to remove CO2 and other air components. Lastly, VOCs were re-focused in the transfer line of cool trap Module 3 (M3) to make the chromatographic peak sharper. The operational procedures of the three-stage trapping system are presented in Table 1.
VOCs were transferred from M3 to the GC-MS/FID for identification and quantification. The samples were divided by GC, and then the divided portion was analyzed by MS, resulting in more precise detection. FID was used to quantify C2–C3 hydrocarbons containing ethylene, acetylene, ethane, propylene, and propane, while MS was used to quantify other compounds. In GC-MS analysis, different detectors are used for different compounds based on their sensitivity, selectivity, and applicability. Specifically, C2–C3 compounds typically use FID, while other substances are analyzed with MS. FID is highly sensitive to small hydrocarbon molecules such as C2–C3, producing strong signals with low detection limits, thus allowing the accurate and sensitive detection of these small hydrocarbons. Although MS has high sensitivity, it is less responsive to small hydrocarbons compared to FID. MS is better suited for analyzing complex mixtures and compounds with characteristic fragmentation patterns. By providing structural information through mass spectra, MS helps distinguish and identify components in complex mixtures. Both the calibrations of C2–C3 compounds detected by FID and other compounds detected by MS are performed using standards. MS calibration involves using standards of known mass and concentration to calibrate the mass axis and response factor of the mass spectrometer. FID typically uses a standard gas containing known concentrations of C2–C3 compounds for calibration. In both MS and FID, the signal intensity of the standards with known concentrations is measured to establish a linear relationship between the concentration and signal intensity for quantitative analysis.
The GC oven temperature was originally set to 25 °C for 12 min before increasing to 250 °C for 10 min and operating for 59 min. The inlet of GC was 150 °C, and the total flow rate was 34.5 mL min−1. The operating parameters for the FID are as follows: heater temperature of 250 °C, air flow of 400 mL min−1, hydrogen gas flow of 30 mL min−1, and tail gas flow by He of 25 mL min−1. The MS was run in full scan mode, and all scanned data was analyzed using MSD chemstation software. To assure continuous usage of the samples, the pressure in the tank was kept constant by utilizing high-purity nitrogen gas before each use, and the following formula was used to calibrate the dilution ratio.
C x = A x × I i s × V i s × M × f A i s × V x × R F ¯ × V m
Equation (1): Used to determine the target concentration of the sample, where Cx is the concentration of target sample x, μg m−3; Ax is the peak area of the target sample; Ais is the peak area of the standard sample; Iis is the mole fraction of the standard sample, nmol mol−1; Vis and Vx are the injection volume of the standard sample and target sample, respectively; M is the molar mass of the target sample, g mol−1; Vm is the molar volume of the gas, L mol−1; f is the dilution ratio of the target sample; and RF is the average relative response factor of the calibration curve.

3. Results and Discussion

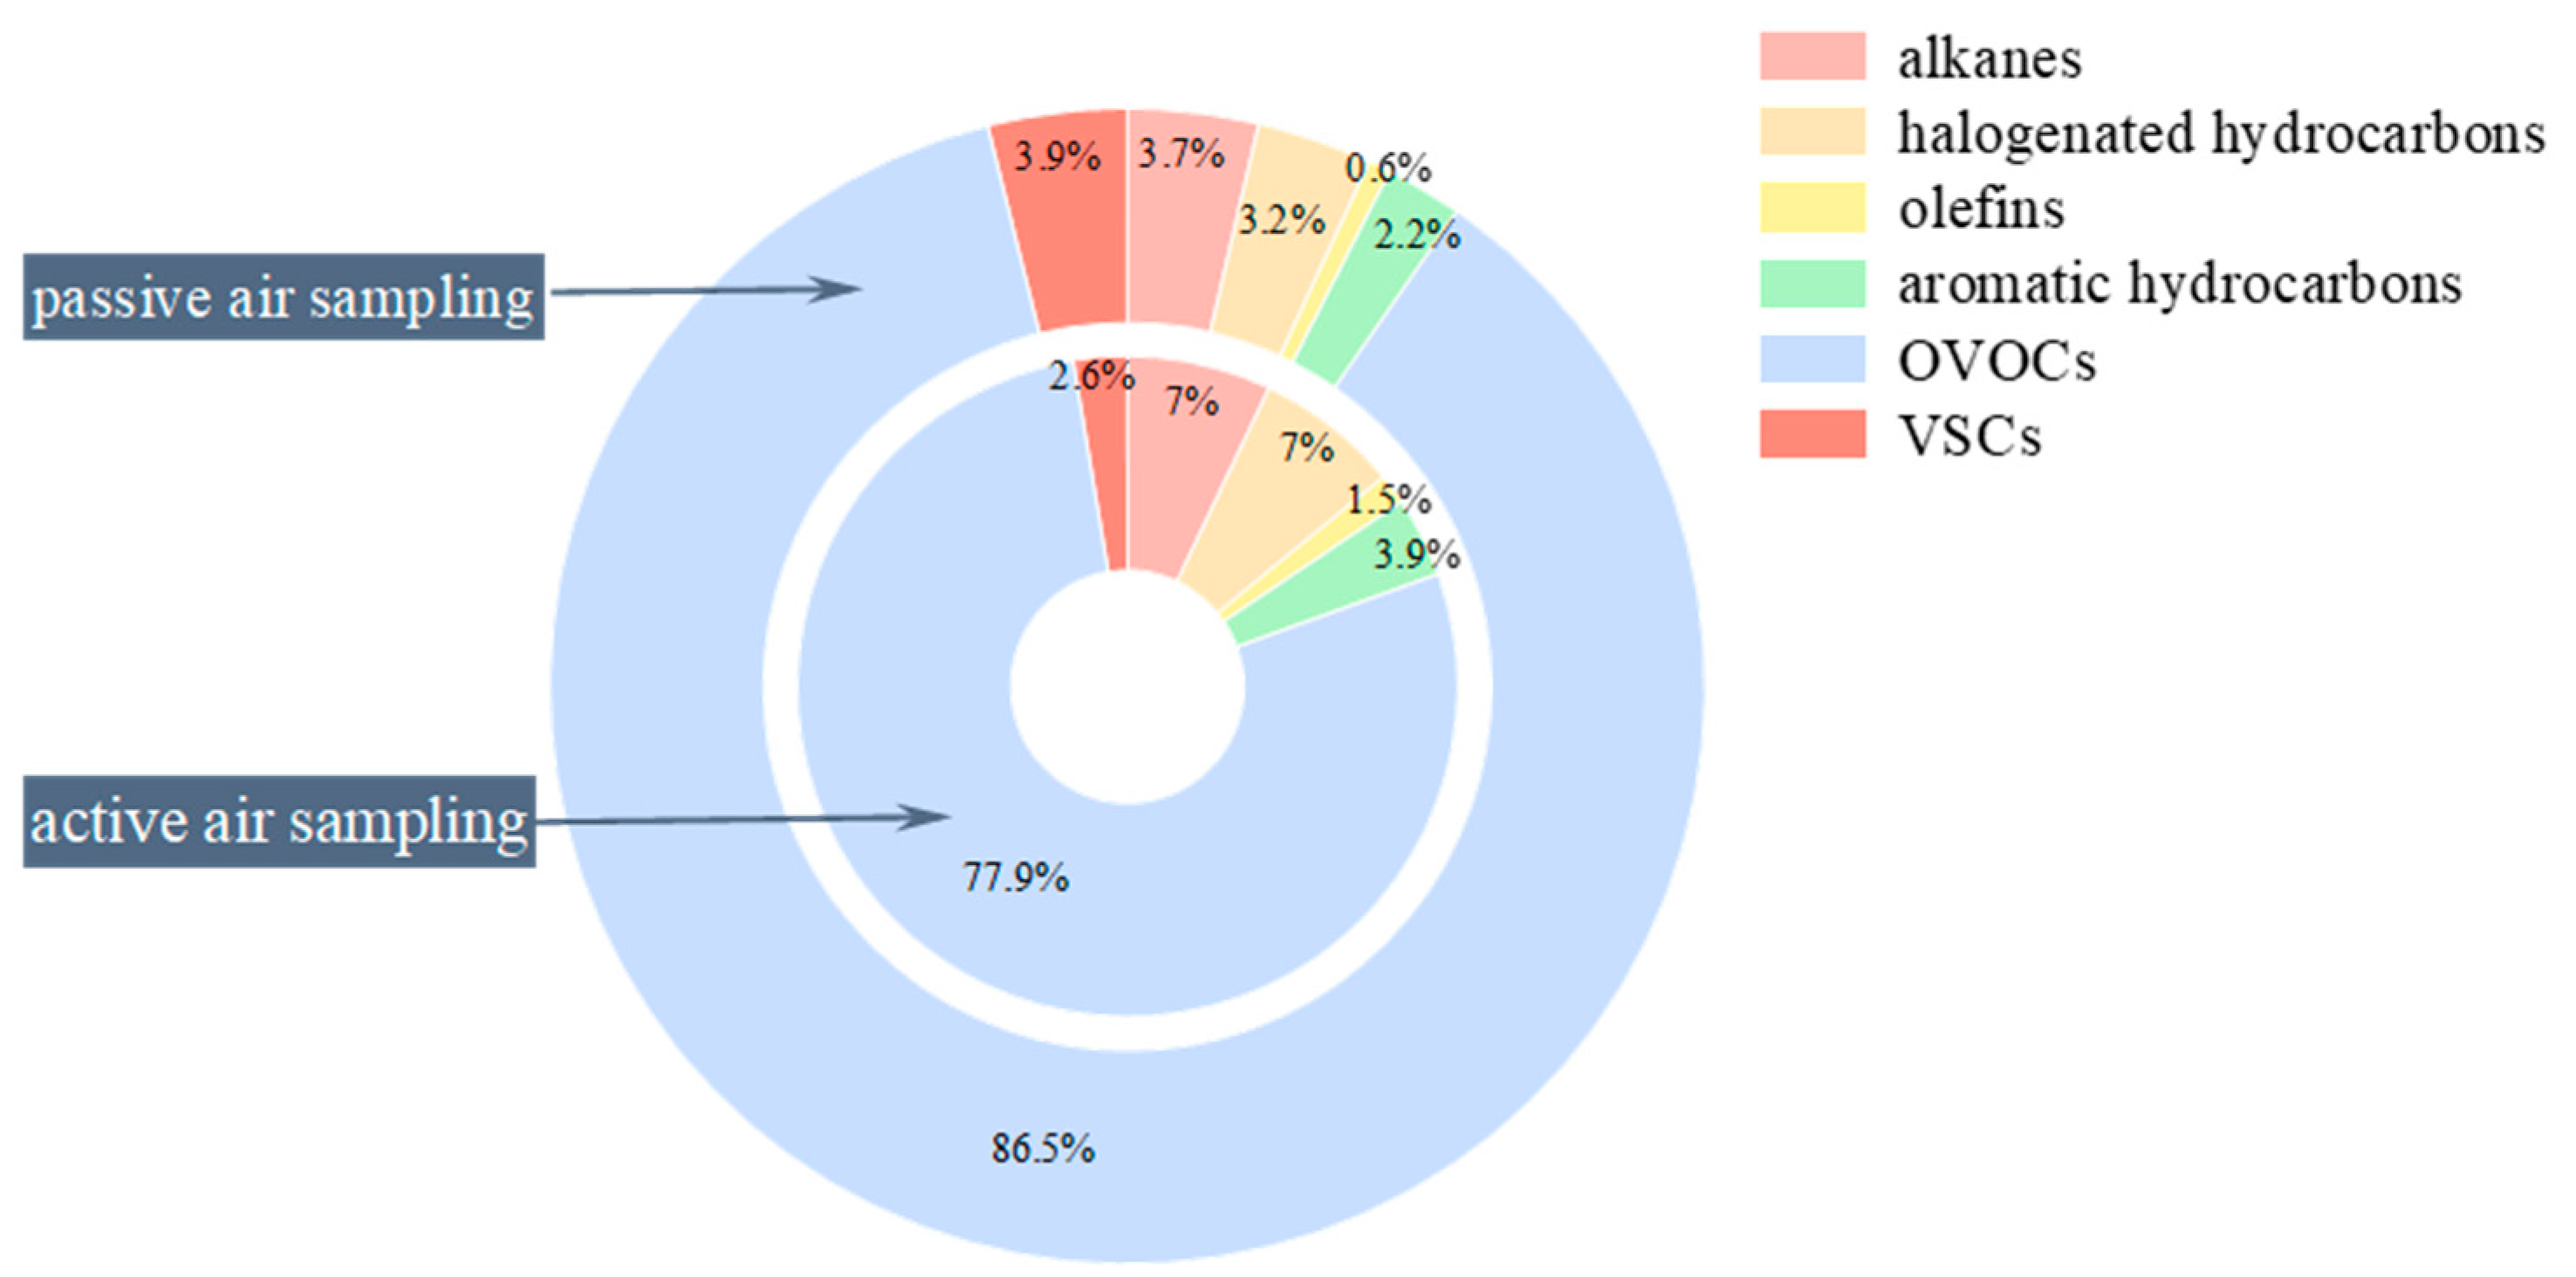
3.1. Main Compositions of VOCs at Swine House

In the experimental swine house, 62 VOCs were detected using quantification analysis, including 14 alkanes, 6 olefins, 17 halogenated hydrocarbons, 15 aromatic hydrocarbons, 7 oxygenated VOCs (OVOCs), and 3 volatile sulfur compounds (VSCs). All of these compounds were determined by retention time and fragment ions and were confirmed by GC-MS. The temperature and humidity in the swine house were 26.1 °C and 70%, respectively.
Both the passive air sampling and active air sampling methods revealed OVOCs as the most abundant compounds among all categories of VOCs, constituting 86.5% and 77.9% of the total VOC concentration, respectively. This finding aligns with Blunden’s observations, indicating that OVOCs are the predominant compounds in swine houses [41]. The primary cause of this condition is the high concentration of ethanol, which makes up more than 85% of OVOCs.
Figure 3 depicts the VOC concentration ranges observed in this study. In the active air sampling method, the main VOC categories collected were OVOCs, alkanes, and halogenated hydrocarbons. In the passive air sampling method, the main VOC categories collected were OVOCs, VSCs, and alkanes. Notably, the variation in sampling methods had a significant effect on the concentrations of OVOCs and VSCs, while it had no significant impact on other VOCs (Figure 4). This discrepancy primarily arises from variations in the ethanol concentration, constituting more than half of the total concentration. The variance in the VSC and OVOC concentrations between the sampling methods may be attributed to the wall effect adsorption of the sampling pump during positive pressure sampling, as well as the potential differences in flow rates between the two methods [46,47,48].
In this study, the results indicated that ethanol, acetone, methyl sulfide, dimethyl disulfide, isobutene, dichloromethane, 2-butanone, toluene, and vinyl acetate were the main compounds present in the swine house. Rumsey [49] conducted a similar study using GC-MS analysis with samples collected in SUMMA canisters, and they identified methanol, ethanol, acetaldehyde, acetone, 2,3-butanedione, and p-cresol as the primary VOCs in swine barns. It is noteworthy that all of these compounds, except methanol, were also found in our study.
In addition to the compounds mentioned above, eight VOCs were not included in the standard samples. These VOCs were identified through qualitative analysis of the chromatograms and compared with the NIST14 library, a standard reference database developed by the National Institute of Standards and Technology. The compound names and emissions of these VOCs are presented in Table 2.
Among the VOCs identified, dimethyl trisulfide and p-cresol, known as major sources of odor, exhibited different concentrations in the two sampling methods. The passive air sampling method was found to be more effective in capturing odor-causing compounds, including methanethiol, methyl sulfide, dimethyl disulfide, dimethyl trisulfide, and p-cresol. Passive sampling methods eliminate the need for mechanical pumps or other power equipment, reducing the potential for interference with the sampling process and loss of compounds. These findings highlight the suitability of the passive air sampling method for accurately assessing and quantifying odor-related compounds in the swine house environment.

3.2. Odorous VOC Emissions

VOCs with lower olfactory thresholds, which are sensory thresholds that detect the presence of odors, as well as recognition thresholds that determine the characteristics of odors, play a crucial role in the intensity of odors emanating from swine feeding operations. The primary odorous VOCs include VSCs, indoles, phenols, and VFAs [7].
In this study, the main odorous compounds identified were methyl sulfide, dimethyl disulfide, dimethyl trisulfide, trimethylamine, and p-cresol, with concentrations ranging from 0.87 μg m−3 to 35.38 μg m−3. Except for dimethyl trisulfide, for which no olfactory threshold was found, the remaining four substances all exceeded their respective olfactory thresholds. Among the odorous compounds, five odorous compounds (trimethylamine, carbon disulfide, methyl sulfide, dimethyl disulfide, and styrene) were determined to be under control in China, and seven odorous compounds (ethyl acetate, p-xylene, m-xylene, toluene, styrene, methyl sulfide, and dimethyl disulfide) were found to be under control in Japan. While the other controlled odorants do not individually exceed the olfactory threshold, they may still interact to produce odors. These findings underscore the importance of monitoring and controlling the emissions of odorous VOCs, particularly those with low olfactory thresholds, to mitigate the impact of odor nuisance from swine feeding operations on local communities.

3.3. The Influence of Storage Time on VOC Concentrations

3.3.1. Compounds Determined by FID

Pre-concentrated C2–C3 target compounds are separated by gas chromatography and detected by FID after being pre-concentrated to remove H2O and inert gas in a cold trap. The specific compounds measured in this analysis included ethylene, acetylene, ethane, propylene, and propane. Figure 5 illustrates the recovery of C2–C3 compounds. This study analyzed the sample alterations under both constant pressure and pressure fluctuations since the sample consumption in the container during the multiple injection analyses caused pressure changes inside the container. Constant pressure in the canister was kept by filling it with nitrogen.
We divided the experimental samples into three groups, which were (a) passive air sampling, (b) active air sampling with constant pressure in the canister, and (c) active air sampling with pressure changes in the canister. Three replicates were taken for each method. All three groups had excellent storage stability, with more than 95% recovery after four days of storage. However, the recovery was significantly less within a week, followed by gradual stability. Therefore, it is recommended to analyze the collected samples within a timeframe of four days. The storage stability of ethylene was the best among the samples obtained by passive air sampling, with 90% recovery after one week. The ethane and propylene recoveries were over 85%. Acetylene and propane were about 80%. Acetylene and propane had relatively poor storage stability under active air sampling. Positive air sampling can support repeat sample analysis since pressure variations inside the container have less impact on the overall recovery pattern.

3.3.2. Compounds Determined by MS

Quantification of VOCs was carried out using internal standard analytical methods on GCMS. This study revealed a noteworthy reduction in the recovery rate of several compounds, namely, ethanol, methyl sulfide, and dimethyl disulfide. Ethanol, on the other hand, exhibited the highest concentration of compounds found in swine barns and demonstrated the ability to dissolve a wide range of VOCs. Additionally, methyl sulfide and dimethyl disulfide, both malodorous compounds, were detected, which may cause discomfort in both humans and animals. The influence of storage time on the concentration of these three compounds is illustrated in Figure 6.
In this study, it was observed that all compounds showed higher recovery rates within the first week of storage. During the initial 12-day period, no significant differences were detected among the three storage strategies. The recovery of these compounds remained over 80% throughout this period. However, on Day 20, a more noticeable decline in recovery was observed, with the atmospheric pressure canister showing a recovery rate above 60% and the positive pressure canister showing a recovery rate above 70%. Specifically, methyl sulfide and dimethyl disulfide exhibited less stability by Day 20, with recovery rates of 62.3% and 65.3%, respectively, in the atmospheric pressure canister and 71.3% and 69.1%, respectively, in the positive pressure canister. On the other hand, the recovery rate of other compounds remained at 80% for the entire 20-day period. As a result, it is recommended that all compounds be analyzed within 1 week to ensure accurate results. Furthermore, the effect of storage time on the stability of compounds appeared to be consistent across both the passive air sampling and active air sampling methods, indicating that the storage behavior was independent of the sampling approach.

4. Conclusions

The aim of this study was twofold: to investigate the variations in VOC concentrations resulting from different canister sampling methods during real time in a pig house and to evaluate the impact of storage time on VOC component concentrations by analyzing various canister sampling methods. The study revealed that OVOCs and VSCs were the predominant classes of compounds found in the swine barn, with ethanol, acetone, methyl sulfide, and dimethyl disulfide being the major VOCs identified. Among these, OVOCs have the highest concentration in pig houses, while VSCs are the primary sources of odor.
Both passive air sampling and active air sampling showed no significant difference in the number of detected VOCs, while active air sampling demonstrated lower errors between parallel samples. Nevertheless, noteworthy differences were observed in the sampling of OVOCs and VSCs across the various methods, which needs further investigation. The qualitative analysis detected eight VOCs, with dimethyl trisulfide and p-cresol identified as major odor sources exhibiting varying concentrations among these two sampling methods. The storage time had minimal effects on the stability of compounds in the different sampling methods, and all compounds should be analyzed within four days and no later than one week at the maximum, especially for unstable compounds such as VSCs.

Author Contributions

Conceptualization, X.L., K.W., and X.W.; data curation, X.L. and Q.S.; formal analysis, X.L.; funding acquisition, K.W.; investigation, X.L.; methodology, X.L. and Q.S.; project administration, K.W., L.Y., and L.F.; resources, K.W., Q.S., L.Y., and L.F.; supervision, K.W., L.Y., X.W., and L.F.; validation, X.L., K.W., and X.W.; visualization, X.L. and Q.S.; writing—original draft, X.L.; writing—review and editing, X.L. and K.W.. All authors have read and agreed to the published version of the manuscript.

Funding

This research was funded by the National Key R&D Program of China, grant number 2021YFD2000801, and the Zhejiang Provincial Department of Agriculture and Rural Affairs, grant number 2023SNJF55.

Data Availability Statement

The original contributions presented in the study are included in the article, further inquiries can be directed to the corresponding author.

Acknowledgments

The authors appreciated the help provided by the employers in the experimental pig farm during the field experiments.

Conflicts of Interest

The authors declare no conflicts of interest.

Appendix A

Table A1. Standard curve-related parameters.
NumberStandard CompoundRTIon1Ion2Ion3CAS NO.R2RSD
1Ethylene12.45628272674-85-10.9990.052
2Acetylene12.71026252474-86-20.9990.053
3Ethane13.86428272974-84-00.9990.046
4Propylene21.325414239115-07-10.9990.051
5Propane21.98744433974-98-60.9990.050
6Bromochloromethane (is)28.7441301289374-97-5-0.090
7Dichlorodifluoromethane10.620858710175-71-80.9990.010
8Methyl chloride11.8175052-74-87-30.9990.020
9Isobutane12.76143424175-28-50.9990.049
101,2-Dichlorotetrafluoroethane12.6378513513776-14-20.9990.012
11Vinyl chloride13.43962646375-01-40.9980.021
121-Butylene14.179413956106-98-90.9970.004
131,3-Butadiene14.386545339106-99-00.9980.021
14n-Butane14.749584241106-97-80.9990.007
15trans-2-Butene15.388564150624-64-60.9970.036
16Bromomethane16.00994969374-83-90.9980.008
17cis-2-Butene16.344565541590-18-10.9970.026
18Chloroethane16.99564664975-00-30.9990.029
19Ethyl alcohol17.5054546-64-17-50.9870.075
20Acrolein19.147565538107-02-80.9850.013
21Isopentane19.93757434278-78-40.9970.004
22Acetone19.6494358-67-64-10.9990.103
23Trichlorofluoromethane20.504101103-75-69-40.9990.007
241-Pentene20.981425570109-67-10.9960.040
25Propan-2-ol20.5714543-67-63-00.9900.015
26n-Pentane21.821434241109-66-00.9970.019
272-Methyl-1,3-Butadiene22.18155703978-79-50.9960.077
28trans-2-Pentene22.338675339646-04-80.9970.041
29Vinylidene chloride22.76661969875-35-40.9990.055
30cis-2-Pentene22.920557042627-20-30.9960.078
31Dichloromethane23.10549868475-09-20.9990.029
32Carbon disulfide24.17076787775-15-00.9980.083
331,1,2-Trichlorotrifluoroethane23.921151101-76-13-10.9990.017
342,2-Dimethyl butane24.46057714375-83-20.9970.006
35trans-Dichloroethylene25.812969861156-60-50.9970.080
361,1-Dichloroethane26.33763659875-34-30.9990.018
37Methyl tert-Butyl Ether26.3607357-1634-04-40.9950.078
38Cyclopentane26.551425570287-92-30.9990.072
392,3-Dimethylbutane26.53542437179-29-80.9980.066
402-Methylpentane26.735437155107-83-50.9980.003
41Ethenyl ethanoate26.5124386-108-05-40.9950.027
422-Butanone27.13843725778-93-30.9950.057
433-Methylpentane27.71557564196-14-00.9950.036
441-Hexene28.032564184592-41-60.9970.029
451,2-cis-Dichloroethene28.336969861156-59-20.9960.096
46n-Hexane28.750574186110-54-30.9980.008
47Ethyl acetate28.563436145141-78-60.9960.093
48Trichloromethane28.9928385-67-66-30.9990.016
49Tetrahydrofuran29.855407172109-99-90.9960.116
50Methylcyclopentane30.69957438596-37-70.9980.066
512,4-Dimethylpentane30.665566941108-08-70.9970.100
521,2-Dichloroethane30.641626449107-06-20.9990.141
531,1,1-Trichloroethane31.233976111771-55-60.9990.073
541,4-Difluorobenzene (is)32.6901146388540-36-3-0.177
55Benzene32.21078775271-43-21.0000.141
56Carbontetrachloride32.52811711912156-23-50.9990.114
57Cyclohexane32.814566984110-82-71.0000.093
582-Methylhexane32.813435785591-76-40.9990.078
592,3-Dimethylpentane33.070564371565-59-31.0000.065
603-Methylhexane33.341574370589-34-41.0000.069
611,2-Dichloropropane33.82163627678-87-51.0000.067
622,2,4-Trimethylpentane34.231575641540-84-10.9990.085
631,4-Dioxane34.1088858-123-91-10.9980.084
64Bromodichloromethane34.190831294775-27-40.9990.061
65Trichloroethylene34.2571301329579-01-60.9990.086
66Methyl methacrylate34.26869413980-62-60.9980.011
67Heptane34.580435771142-82-50.9990.044
68Methyl isobutyl ketone35.756435885108-10-10.9990.072
69cis-1,3-Dichloropropylene35.86375110-10061-01-51.0000.012
70Methylcyclohexane36.270839855108-87-21.0000.065
71trans-1,3-Dichloropropene36.831751103910061-02-60.9980.051
721,1,2-Trichloroethane37.31697836179-00-50.9990.088
732,3,4-Trimethylpentane37.506437155565-75-31.0000.090
74Toluene37.931574370108-88-30.9990.005
752-Methylheptane37.9609192-592-27-80.9990.060
762-Hexanone38.09258100-591-78-60.9990.050
773-Methylheptane39.529855743589-81-11.0000.045
78Chlorodibromomethane38.896129127-124-48-11.0000.060
791,2-Dibromoethane39.453107109-106-93-40.9980.064
80Octane39.529857157111-65-91.0000.084
81Tetrachloroethene40.30216613194127-18-40.9980.081
82Chlorobenzene-d5 (is)41.652117821193114-55-4-0.100
83Chlorobenzene41.75311277114108-90-70.9990.033
84Ethylbenzene42.41391106-100-41-40.9980.042
85(o + p)-Xylene42.76191106104108-38-30.9980.101
86Tribromomethane43.24817317117575-25-20.9990.063
87Styrene43.6001047851100-42-50.9980.096
881,2-Dimethylbenzene43.8739110610495-47-60.9980.071
891,1,2,2-Tetrachloroethane43.832839513179-34-50.9990.043
90n-Nonane43.89191106-111-84-20.9990.063
914-Bromofluorobenzene (is)44.941174176-460-00-4-0.081
92Cumene45.144105120-98-82-81.0000.085
93n-Propylbenzene46.37691120-103-65-11.0000.046
943-Ethyltoluene46.579105120-620-14-41.0000.081
954-Ethyltoluene46.70610512091622-96-80.9980.096
96Mesitylene46.85110512077108-67-80.9990.019
972-Ethyltoluene47.451105120 611-14-31.0000.064
981,2,4-Trimethylbenzene47.9961051207795-63-60.9990.063
99Decane47.834105120-124-18-50.9980.055
100Benzyl chloride48.49291126-100-44-70.9990.045
1011,3-Dichlorbenzene48.621146111148541-73-10.9990.078
1021,4-Dichlorobenzene48.784146111148106-46-70.9990.071
1031,2,3-Trimethylbenzene49.249105120-526-73-80.9980.078
1041,2-Dichlorobenzene49.83014611114895-50-10.9990.003
1051,3-Diethylbenzene49.957119105134141-93-50.9990.039
106p-Diethyl benzene50.272119105134105-05-50.9990.057
107n-Hendecane51.59957711561120-21-40.9990.092
1081,2,4-Trichlorobenzene56.085180145182120-82-10.9980.052
109Dodecane55.7605771120112-40-30.9990.053
110Naphthalene56.73012864-465-73-60.9950.046
111Hexachloro-1,3-butadiene58.16922519011887-68-30.9990.051
112Methanethiol15.31447484574-93-10.9940.029
113Ethyl mercaptan21.35862474575-08-10.9890.042
114Dimethyl sulfide22.57162474575-18-30.9980.061
115Methylthioethane29.032617648624-89-50.9990.042
116Thiophene32.513845845110-02-11.0000.036
117Diethyl sulfide34.141759061352-93-20.9980.039
118Dimethyl Disulfide36.567947945624-92-00.9950.031

References

  1. Wang, Y.C.; Han, M.F.; Jia, T.P.; Hu, X.R.; Zhu, H.Q.; Tong, Z.; Lin, Y.T.; Wang, C.; Liu, D.Z.; Peng, Y.Z.; et al. Emissions, measurement, and control of odor in livestock farms: A review. Sci. Total Environ. 2021, 776, 145735. [Google Scholar] [CrossRef]
  2. Ubeda, Y.; Lopez-Jimenez, P.A.; Nicolas, J.; Calvet, S. Strategies to control odours in livestock facilities: A critical review. Span. J. Agric. Res. 2013, 11, 1004–1015. [Google Scholar] [CrossRef]
  3. Bibbiani, C.; Russo, C. Odour emission from intensive livestock production system: Approaches for emission abatement and evaluation of their effectiveness. Large Anim. Rev. 2012, 18, 135–138. [Google Scholar]
  4. Nimmermark, S. Odour influence on well-being and health with specific focus on animal production emissions. Ann. Agric. Environ. Med. 2004, 11, 163–173. [Google Scholar]
  5. Schiffman, S.S.; Miller, E.A.; Suggs, M.S.; Graham, B.G. The effect of environmental odors emanating from commercial swine operations on the mood of nearby residents. Brain Res. Bull. 1995, 37, 369–375. [Google Scholar] [CrossRef]
  6. Valdes Labrada, G.M.; Kumar, S.; Azar, R.; Predicala, B.; Nemati, M. Simultaneous capture of NH3 and H2S using TiO2 and ZnO nanoparticles—laboratory evaluation and application in a livestock facility. J. Environ. Chem. Eng. 2020, 8, 103615. [Google Scholar] [CrossRef]
  7. Yao, H.Q.; Choi, H.L.; Zhu, K.; Lee, J.H. Key volatile organic compounds emitted from swine nursery house. Atmos. Environ. 2011, 45, 2577–2584. [Google Scholar] [CrossRef]
  8. Cai, L.; Koziel, J.A.; Zhang, S. Odorous chemical emissions from livestock operations in United States. In Proceedings of the 2011 International Conference on Remote Sensing, Environment and Transportation Engineering, Nanjing, China, 24–26 June 2011; pp. 532–535. [Google Scholar]
  9. Ni, J.Q.; Robarge, W.P.; Xiao, C.; Heber, A.J. Volatile organic compounds at swine facilities: A critical review. Chemosphere 2012, 89, 769–788. [Google Scholar] [CrossRef]
  10. Li, J.; Deng, S.; Li, G.; Lu, Z.; Song, H.; Gao, J.; Sun, Z.; Xu, K. VOCs characteristics and their ozone and SOA formation potentials in autumn and winter at Weinan, China. Environ. Res. 2022, 203, 111821. [Google Scholar] [CrossRef]
  11. Mozaffar, A.; Zhang, Y.-L. Atmospheric Volatile Organic Compounds (VOCs) in China: A Review. Curr. Pollut. Rep. 2020, 6, 250–263. [Google Scholar] [CrossRef]
  12. Plachá, D.; Raclavská, H.; Kučerová, M.; Kuchařová, J. Volatile fatty acid evolution in biomass mixture composts prepared in open and closed bioreactors. Waste Manag. 2013, 33, 1104–1112. [Google Scholar] [CrossRef]
  13. Schiffman, S.S.; Bennett, J.L.; Raymer, J.H. Quantification of odors and odorants from swine operations in North Carolina. Agr For. Meteorol. 2001, 108, 213–240. [Google Scholar] [CrossRef]
  14. Mielcarek, P.; Rzeźnik, W. Odor Emission Factors from Livestock Production. Pol. J. Environ. Stud. 2015, 24, 27–35. [Google Scholar] [CrossRef]
  15. Hiroyuki, U. The Potential Contribution of VOCs on Ambient Air Odor. Asian J. Atmos. Environ. 2021, 15, 94–101. [Google Scholar] [CrossRef]
  16. Wang, K.Y.; Li, X.; Ying, Y.F. Research advances in characteristics and reduction technology of VOCs from swine production. Trans. Chin. Soc. Agric. Eng. (Trans. CSAE) 2023, 39, 168–179. [Google Scholar] [CrossRef]
  17. Jia, H.; Gao, S.; Duan, Y.; Fu, Q.; Che, X.; Xu, H.; Wang, Z.; Cheng, J. Investigation of health risk assessment and odor pollution of volatile organic compounds from industrial activities in the Yangtze River Delta region, China. Ecotoxicol. Environ. Saf. 2021, 208, 111474. [Google Scholar] [CrossRef]
  18. Gao, Y.; Li, M.; Wan, X.; Zhao, X.; Wu, Y.; Liu, X.; Li, X. Important contributions of alkenes and aromatics to VOCs emissions, chemistry and secondary pollutants formation at an industrial site of central eastern China. Atmos. Environ. 2021, 244, 117927. [Google Scholar] [CrossRef]
  19. Martel, M.C.; Lemay, S.P.; Predicala, B.Z.; Girard, M.; Belzile, M.; Feddes, J.; Hogue, R.; Godbout, S. Detailed Study of Odor from Pig Buildings to Improve Understanding of Biotrickling Filter Performance. Trans. ASABE 2017, 60, 2151–2162. [Google Scholar] [CrossRef]
  20. GB 14554-93; Emission Standards for Odor Pollutants. Standardization Administration of China: Beijing, China, 1993.
  21. Wang, M.; Zeng, L.; Lu, S.; Shao, M.; Liu, X.; Yu, X.; Chen, W.; Yuan, B.; Zhang, Q.; Hu, M.; et al. Development and validation of a cryogen-free automatic gas chromatograph system (GC-MS/FID) for online measurements of volatile organic compounds. Anal. Methods 2014, 6, 9424–9434. [Google Scholar] [CrossRef]
  22. Zhang, S.; Cai, L.; Koziel, J.A.; Hoff, S.J.; Schmidt, D.R.; Clanton, C.J.; Jacobson, L.D.; Parker, D.B.; Heber, A.J. Field air sampling and simultaneous chemical and sensory analysis of livestock odorants with sorbent tubes and GC–MS/olfactometry. Sens. Actuators B Chem. 2010, 146, 427–432. [Google Scholar] [CrossRef]
  23. Ras, M.R.; Borrull, F.; Marcé, R.M. Sampling and preconcentration techniques for determination of volatile organic compounds in air samples. Trac Trends Anal. Chem. 2009, 28, 347–361. [Google Scholar] [CrossRef]
  24. Mochalski, P.; Wzorek, B.; Śliwka, I.; Amann, A. Suitability of different polymer bags for storage of volatile sulphur compounds relevant to breath analysis. J. Chromatogr. B 2009, 877, 189–196. [Google Scholar] [CrossRef]
  25. Man, Z.; Dai, X.; Rong, L.; Kong, X.; Ying, S.; Xin, Y.; Liu, D. Evaluation of storage bags for odour sampling from intensive pig production measured by proton-transfer-reaction mass-spectrometry. Biosyst. Eng. 2020, 189, 48–59. [Google Scholar] [CrossRef]
  26. Hamon, L.; Andres, Y.; Dumont, E. Aerial pollutants in swine buildings: A review of their characterization and methods to reduce them. Environ. Sci. Technol. 2012, 46, 12287–12301. [Google Scholar] [CrossRef]
  27. Polvara, E.; Gallego, E.; Invernizzi, M.; Perales, J.F.; Sironi, S. Chemical characterization of odorous emissions: A comparative performance study of different sampling methods. Talanta 2023, 253, 124110. [Google Scholar] [CrossRef]
  28. Brown, V.M.; Crump, D.R.; Plant, N.T.; Pengelly, I. Evaluation of the stability of a mixture of volatile organic compounds on sorbents for the determination of emissions from indoor materials and products using thermal desorption/gas chromatography/mass spectrometry. J. Chromatogr. A 2014, 1350, 1–9. [Google Scholar] [CrossRef]
  29. Brown, V.M.; Crump, D.R. An investigation into the performance of a multi-sorbent sampling tube for the measurement of VVOC and VOC emissions from products used indoors. Anal. Methods 2013, 5, 2746–2756. [Google Scholar] [CrossRef]
  30. Arnts, R.R. Evaluation of adsorbent sampling tube materials and Tenax-TA for analysis of volatile biogenic organic compounds. Atmos. Environ. 2010, 44, 1579–1584. [Google Scholar] [CrossRef]
  31. Zhang, Y.; Zhu, Z.; Zheng, Y.; Chen, Y.; Yin, F.; Zhang, W.; Dong, H.; Xin, H. Characterization of Volatile Organic Compound (VOC) Emissions from Swine Manure Biogas Digestate Storage. Atmosphere 2019, 10, 411. [Google Scholar] [CrossRef]
  32. Mariné, S.; Pedrouzo, M.; Maria Marcé, R.; Fonseca, I.; Borrull, F. Comparison between sampling and analytical methods in characterization of pollutants in biogas. Talanta 2012, 100, 145–152. [Google Scholar] [CrossRef]
  33. Sin, D.W.M.; Wong, Y.C.; Sham, W.C.; Wang, D. Development of an analytical technique and stability evaluation of 143 C3-C12 volatile organic compounds in Summa® canisters by gas chromatography-mass spectrometry. Analyst 2001, 126, 310–321. [Google Scholar] [CrossRef]
  34. Ochiai, N.; Tsuji, A.; Nakamura, N.; Daishima, S.; Cardin, D.B. Stabilities of 58 volatile organic compounds in fused-silica-lined and SUMMA polished canisters under various humidified conditions. J. Environ. Monit. 2002, 4, 879–889. [Google Scholar] [CrossRef]
  35. Brymer, D.A.; Ogle, L.D.; Jones, C.J.; Lewis, D.L. Viability of Using SUMMA Polished Canisters for the Collection and Storage of Parts per Billion by Volume Level Volatile Organics. Environ. Sci. Technol. 1996, 30, 188–195. [Google Scholar] [CrossRef]
  36. Environmental Protection Agency. Determination Of VOCs in Ambient Air Using Specially Prepared Canisters with Subsequent Analysis By Gas Chromatography; U.S. Environmental Protection Agency: Washington, DC, USA, 1999.
  37. Environmental Protection Agency. Determination of VOCs in Air Collected in Specially Prepared Canisters and Analyzed by Gas Chromatography–Mass Spectrometry (GC-MS); U.S. Environmental Protection Agency: Washington, DC, USA, 2019.
  38. Cheng, L.; Wei, W.; Zhang, C.; Xu, X.; Sha, K.; Meng, Q.; Jiang, Y.; Cheng, S. Quantitation study on VOC emissions and their reduction potential for coking industry in China: Based on in-situ measurements on treated and untreated plants. Sci. Total Environ. 2022, 836, 155466. [Google Scholar] [CrossRef]
  39. Dai, L.; Meng, J.; Zhao, X.; Li, Q.; Shi, B.; Wu, M.; Zhang, Q.; Su, G.; Hu, J.; Shu, X. High-spatial-resolution VOCs emission from the petrochemical industries and its differential regional effect on soil in typical economic zones of China. Sci. Total Environ. 2022, 827, 154318. [Google Scholar] [CrossRef]
  40. Hong, Z.; Li, M.; Wang, H.; Xu, L.; Hong, Y.; Chen, J.; Chen, J.; Zhang, H.; Zhang, Y.; Wu, X.; et al. Characteristics of atmospheric volatile organic compounds (VOCs) at a mountainous forest site and two urban sites in the southeast of China. Sci. Total Environ. 2019, 657, 1491–1500. [Google Scholar] [CrossRef]
  41. Blunden, J.; Aneja, V.P.; Lonneman, W.A. Characterization of non-methane volatile organic compounds at swine facilities in eastern North Carolina. Atmos. Environ. 2005, 39, 6707–6718. [Google Scholar] [CrossRef]
  42. de Saint Laumer, J.-Y.; Cicchetti, E.; Merle, P.; Egger, J.; Chaintreau, A. Quantification in Gas Chromatography: Prediction of Flame Ionization Detector Response Factors from Combustion Enthalpies and Molecular Structures. Anal. Chem. 2010, 82, 6457–6462. [Google Scholar] [CrossRef]
  43. Pacchiarotta, T.; Nevedomskaya, E.; Carrasco-Pancorbo, A.; Deelder, A.M.; Mayboroda, O.A. Evaluation of GC-APCI/MS and GC-FID As a Complementary Platform. J. Biomol. Tech. 2010, 21, 205–213. [Google Scholar]
  44. Polvara, E.; Morosini, D.; Invernizzi, M.; Sironi, S. Analysis of Odorous VOCs using TD-GC-MS/FID/PFPD: Development and Applications to Real Samples. Chem. Eng. Trans. 2022, 95, 151–156. [Google Scholar]
  45. Walters, C.C.; Wang, F.C.; Higgins, M.B.; Madincea, M.E. Universal biomarker analysis using GC×GC with dual FID and ToF-MS (EI/FI) detection. Org. Geochem. 2018, 115, 57–66. [Google Scholar] [CrossRef]
  46. Evans, J.C.; Huckaby, J.L.; Mitroshkov, A.V.; Julya, J.L.; Hayes, J.C.; Edwards, J.A.; Sasaki, L.M. 32-Week Holding-Time Study of SUMMA Polished Canisters and Triple Sorbent Traps Used To Sample Organic Constituents in Radioactive Waste Tank Vapor Headspace. Environ. Sci. Technol. 1998, 32, 3410–3417. [Google Scholar] [CrossRef]
  47. Zhai, H.; Zhou, J.; Zhao, W.; Du, W.; Wei, N.; Liu, Q.; Wang, S.; Zhang, J.; Cui, W.; Zhang, W.; et al. Development of a UAV-borne sorbent tube sampler and its application on the vertical profile measurement of volatile organic compounds. J. Environ. Sci. 2025, 152, 276–286. [Google Scholar] [CrossRef]
  48. Seethapathy, S.; Górecki, T.; Li, X. Passive sampling in environmental analysis. J. Chromatogr. A 2008, 1184, 234–253. [Google Scholar] [CrossRef] [PubMed]
  49. Rumsey, I.C.; Aneja, V.P.; Lonneman, W.A. Characterizing non-methane volatile organic compounds emissions from a swine concentrated animal feeding operation. Atmos. Environ. 2012, 47, 348–357. [Google Scholar] [CrossRef]
Figure 1. Aerial view of the experimental swine facility.
Atmosphere 15 01021 g001
Figure 2. Sampling methods: (a) passive air sampling; (b) active air sampling.
Atmosphere 15 01021 g002
Figure 3. Percentage of VOC concentration under different sampling methods.
Atmosphere 15 01021 g003
Figure 4. Concentrations of six VOC categories under different sampling methods.
Atmosphere 15 01021 g004
Figure 5. Recovery of C2–C3 compounds with storage time: (a) passive air sampling; (b) active air sampling with constant pressure in the canister; (c) active air sampling with pressure changes in the canister.
Atmosphere 15 01021 g005
Figure 6. Recovery of characteristic compounds with storage time: (a) passive air sampling; (b) active air sampling with constant pressure in the canister; (c) active air sampling with pressure changes in the canister.
Atmosphere 15 01021 g006
Table 1. The operational procedures of the three-stage trapping system.
ZoneTrap Temperature (°C)Preheat (°C)Transfer (°C)Precool (°C)Inject (°C)Bakeout (°C)Transfer Line (°C)
M1→M2M2→M3
M1−401010 120
M2−100−40−40235 220
M3 −180−18570110
Sample 20
GC 110
Table 2. The compounds and concentrations of qualitatively evaluated VOCs.
CompoundConcentration (μg m−3)
PassiveActive
trimethylamine67.44 1 (9.76) 27.51 (1.32)
methyl acetate5.36 (0.31)4.85 (0.64)
2,3-butanedione5.34 (1.02)3.23 (0.27)
1-butanol5.13 (0.97)2.23 (0.46)
butyl acetate0.89 (0.04)0.79 (0.09)
benzaldehyde1.87 (0.05)1.39 (0.12)
dimethyl trisulfide7.73 (2.13)0.58 (0.09)
p-cresol6.65 (1.04)0.87 (0.23)
1 Mean value. 2 Standard deviation.
Disclaimer/Publisher’s Note: The statements, opinions and data contained in all publications are solely those of the individual author(s) and contributor(s) and not of MDPI and/or the editor(s). MDPI and/or the editor(s) disclaim responsibility for any injury to people or property resulting from any ideas, methods, instructions or products referred to in the content.

