Article

Dynamic Changes and Influencing Factors Analysis of Groundwater Icings in the Permafrost Region in Central Sakha (Yakutia) Republic under Modern Climatic Conditions

1
Melnikov Permafrost Institute of the Siberian Branch of the Russian Academy of Science, 677000 Yakutsk, Russia
2
School of Hydraulic & Electric-Power, Heilongjiang University, Harbin 150080, China
3
International Joint Laboratory of Hydrology and Hydraulic Engineering in Cold Regions of Heilongjiang Province, Harbin 150080, China
4
Faculty of Geology and Survey, M. K. Ammosov North-Eastern Federal University, 677000 Yakutsk, Russia
5
Lhasa Meteorological Bureau, Lhasa 850000, China
*
Author to whom correspondence should be addressed.
Atmosphere 2024, 15(9), 1022; https://doi.org/10.3390/atmos15091022
Submission received: 3 August 2024 / Revised: 15 August 2024 / Accepted: 21 August 2024 / Published: 23 August 2024

Abstract

:
In central Sakha (Yakutia) Republic, groundwater icings, primarily formed by intrapermafrost water, are less prone to contamination and serve as a stable freshwater resource. The periodic growth of icings threatens infrastructure such as roads, railways, and bridges in permafrost areas. Therefore, research in this field has become urgently necessary. This study aims to analyze the impacts of various factors on the scale of icing formation using Landsat satellite data, Gravity Recovery and Climate Experiment (GRACE)/GRACE Follow-On (GRACE-FO) data, Global Land Data Assimilation System (GLDAS) data, and field observation results. The results showed that the surface area of icings in the study area showed an overall increasing trend from 2002 to 2022, with an average growth rate of 0.06 km2/year. Suprapermafrost water and intrapermafrost water are the main sources of icings in the study area. The total Groundwater Storage Anomaly (GWSA) values from October to April showed a strong correlation with the maximum icing areas. Icings fed by suprapermafrost water were influenced by precipitation in early autumn, while those fed by intrapermafrost water were more affected by talik size and distribution. Climate warming contributed to the degradation of the continuous permafrost covering an area of 166 km2 to discontinuous permafrost, releasing additional groundwater. This may also be one of the reasons for the observed increasing trend in icing areas. This study can provide valuable insights into water resource management and infrastructure construction in permafrost regions.

1. Introduction

Groundwater icings, characteristic of permafrost hydrology, reflect the intricate hydrothermal dynamics between surface water, groundwater, and permafrost layers [1,2]. When the hydrostatic pressure rises to the ground or ice surface above the discharge point, overflow may occur through cracks, forming frozen, layered bodies of ice known as icings [3,4,5]. The “icings” mentioned in this paper, using a term provided by the International Permafrost Association, refer to the phenomenon of ice formation caused usually by groundwater [6]. “Aufeis”, another widely accepted term in the scientific community, has a broader scope, including icings and other forms of surface ice layers, such as river and lake ice formed by surface water sources [7].
Icings abound in Russia [2], Canada [8,9,10], the mid- to high-latitude mountainous regions of Alaska [11] and Northern China, and on the Qinghai-Tibet Plateau [12,13,14]. Research on icings can be traced back to the 1840s, when Wrangel observed icings on the arctic coast of Siberia [15]. In the late 19th century, hydrogeological phenomena, such as mounds and icing blisters, caused by icings began to attract attention [16], and icings were widely noticed in the early 20th century [17]. It was found that the formation of icings was mainly influenced by negative temperatures [9,11], water source conditions [18,19,20], the characteristics of rocks, and geological structures, along with snow thickness.
The formation of icings is primarily influenced by negative temperatures. Under negative temperature conditions in winter, the active layer begins to back freeze [8,21]. This results in a certain hydrostatic pressure in the suprapermafrost water aquifer, thereby enhancing discharge [22]. According to heat conduction theory, ground temperature lags behind surface temperature changes with increasing depth [3]. If there is a significant diurnal temperature difference, icings may experience diurnal alternation in development under the influence of climatic conditions [23]. The ratio of the length of cold seasons to warm seasons, along with the atmospheric freezing index in winter, are important climatic factors that also affect the scale of groundwater ice [3,24]. Additionally, the temperature waves that gradually attenuate with increasing depth into the strata indicate that over time, larger temperature changes may be needed to drive the movement of the freezing front of the active layer and changes in hydrostatic pressure [9]. All these factors can influence the final volumetric of icings [25].
Water sources are the material basis for the development of icings [8]. Suprapermafrost groundwater and intrapermafrost groundwater are important sources for icing formation [26,27]. Due to the limited thickness of the active layer and the fact that the water supply usually exists in winter when the layer is not completely frozen, suprapermafrost groundwater-formed icings are typically small [28]. In contrast, intrapermafrost groundwater is a more stable water supply source that replenishes icing development throughout the freezing period. Meanwhile, as intrapermafrost groundwater is buried deeper, its water quality is generally better thanks to less contamination [29].
In permafrost regions, lithology and geological structures play an important role in the formation of icings [30]. When suprapermafrost groundwater serves as the main water source for icings, the amount of groundwater supply is controlled by the distance from the recharge zone to the discharge zone and the porosity of loose rock layers in the active layer and significantly influenced by seasonal factors [5,31]. If intrapermafrost groundwater is the main supply source, taliks can be excellent pathways for water transport, continuously providing water for the formation of groundwater ice [32,33].
Due to its insulating effect, accumulated snow can also influence icing development [34]. In the early winter, the thin snow cover mixes with overflowing groundwater, promoting the freezing rate of icings [35]. The insulating characteristics of snow cover come into play as it grows thicker, slowing the development of ground ice under snow cover [36]. Icing acts as a means of water storage and delays water discharge in the melting season. The impact on highland basin water yield is mainly temporal. Ice persists for a long time after snow melts. In the absence of precipitation, the melting of this stored ice constitutes the primary supplement to highland stream baseflow after snowmelt [37].
Icings threaten infrastructure, such as roads, railways, and bridges, in permafrost regions [38,39]. In Northeastern Russia, icing frequently causes road damage and traffic disruptions, particularly in mountainous areas where icing is more likely to trigger landslides and roadbed subsidence [40]. This impact on transportation not only leads to economic losses but also disrupts the daily lives of local residents. Icing also presents challenges to water supply and drainage systems. Olenchenko et al. pointed out that the formation of icing obstructs the normal flow of rivers, leading to water accumulation in the upper reaches and thereby causing flooding [41]. This situation threatens the stability of water supply systems, especially during the spring thaw when a sudden influx of meltwater can overload drainage systems, further exacerbating flood risks. Additionally, the presence of icing negatively impacts power and communication lines. Ye et al. discussed the impact of icing on power transmission lines in the high mountain regions of Asia [42]. Due to the weight and volume changes of the ice, power poles can be compressed or tilted by the ice layers, leading to power outages. This situation is particularly severe in remote areas of Alaska, where infrastructure maintenance is challenging, and post-disaster repairs can take a long time. Moreover, under the influence of climate change, the distribution and intensity of icing may further increase [7].
Despite the challenges icings pose to infrastructure, they also have advantages. In Central Yakutia, intrapermafrost water serves as the main source of groundwater supply for icings, which is less susceptible to contamination and results in a long-term stable freshwater resource [43]. Therefore, research in this field has become an urgent need. Existing studies focus mainly on factors for influencing icings, such as temperature [3,24], precipitation, snow cover [37], and pore water pressure [4], in a specific region or the scale and quantity of icings in a region [2,44], their distribution and dynamic changes [7,9], as well as changes in icing volume [7,11]. However, how these factors affect the long-term dynamic changes of icings in a region is largely unknown. This study, based on Landsat satellite, GRACE/GRACE-FO data and Global Land Data Assimilation System (GLDAS) data, calculated the dynamic changes in the maximum surface area of icings and groundwater storage anomalies (GWSA) in Central Yakutia from 2002 to 2022. For the first time, the impact of dynamic changes in groundwater levels on icings was analyzed through GWSA, with the influences of factors, such as precipitation, temperature, permafrost, and landforms, on icings taken into account.

2. Materials and Methods

2.1. Study Area

The study area is located on the Bestyakh Terrace on the northeast side of the Lena River in Central Yakutia (129°00′ E~130°00′ E, 61°30′ N~61°58′ N), as shown in Figure 1. The low-lying part of the terrace is formed by alluvial sand and gravel. The main part is formed by periglacial alluvium, overlying aeolian formations [45]. The thickness of Quaternary sediments ranges from 20 to 86 m. The southern part of the Bestyakh Terrace is covered by Cambrian limestone, and the northern part, by Jurassic sandstone. The Cambrian limestone dips northward beneath the Jurassic sandstone [46].
Open (subaerial) and intrapermafrost talik aquifers are common in the upper part of the geological section of the Bestyakh Terrace. The aquifer system’s upper barrier consists of a frozen sandy Quaternary formation, ranging from 10 to 50 m in thickness. This overlying frozen layer has a high rock temperature of −0.2 °C Intrapermafrost waters move through both the sand–pebble deposits and the upper fractured zones of Cambrian carbonate rocks. The aquifers in the study area contain slightly saline water, with total dissolved solids (TDS) varying from 1.2 to 3.2 g/dm3. This water is predominantly composed of chloride–bicarbonate or chloride–sodium ions. Notably, the aquifers exhibit elevated concentrations of certain elements, including fluorine, with levels reaching up to 7 mg/dm3, lithium up to 2.4 mg/dm3, and hydrogen sulfide up to 25 mg/dm3 [20]. Numerous lakes in the Bestyakh Terrace are hydraulically connected to intrapermafrost waters. Groundwater in the study area is discharged through springs in the lower areas of the Bestyakh Terrace and springs in the valleys of tributaries of the Lena River. Some suprapermafrost and intrapermafrost water is discharged into lakes in the form of subaqueous springs.
In the study area, significant icings occur annually, primarily sourced from groundwater [19,43]. The accumulation of icings begins when temperatures consistently drop below freezing, which typically happens around late October in this region. The icing accumulation period lasts on average from 189 to 213 days, continuing until late April when temperatures rise above freezing, initiating the reduction in icing area and volume through thermal decay. Generally, the icings in the study area completely melt by the end of June. However, small patches of ice in the Buluus region may persist throughout the summer [18].

2.2. Data and Methods

Extraction of the Icings’ Surface Areas

As icing is characterized by a distinct spectral signature, its detection is possible using remote sensing approaches. We used Landsat 4–5 TM, Landsat 7 ETM+, Landsat 8 OLI, and Landsat 9 OLI at a 30-m resolution to map icing distribution and changes in maximum surface areas each April from 2002 to 2022 (https://www.usgs.gov/landsat-missions, accessed on 15 October 2023). For the investigation period from 2002 to 2022, we selected Level-2 Surface Reflectance Collection 1 Tier 1 images due to their superior data quality. These images, with a georegistration root mean square error of less than 12 m, are ideal for time-series analyses [44]. To ensure the maximum surface areas of the icings were captured, satellite images from every April were used. These images may show some snow cover, which needed to be distinguished from icings. Furthermore, surface water icing (including lakes and rivers) also needed to be distinguished. Scenes with cloud cover below 30% were selected. For the Landsat 8 OLI and Landsat 9 OLI datasets, when cloud cover ranged from 5% to 30%, it was effectively reduced to below 5% by employing the built-in cloud masking layers within Google Earth Engine (GEE) [47]. For the Landsat 4–5 TM and Landsat 7 ETM+ datasets, scenes from the closest time period were used to fill the regions covered by clouds [9]. The images used were Level 1 terrain corrected (LT1) products, with radiometric and geometric corrections completed. Some scene data were lost due to a scan line corrector (SLC) failure in June 2003, and the “fix Landsat 7 scan line error” tool in ArcGIS was employed for restoration. For icing data extraction, we utilized image algebra to devise a three-stage remote sensing method, which could make the extraction of icing surface areas more accurate and efficient. This approach works because of the significant differences in reflectance and emittance of electromagnetic radiation between liquid and solid water (Figure 2) [9].
We first used the Normalized Difference Snow Index (NDSI) to differentiate between snow/ice and soil, rocks, and clouds [48]. A threshold of 0.4 was selected for snow and ice [49,50,51].
N D S I = G r e e n S W I R 1 / G r e e n + S W I R 1 ,
where Green means green spectral band, and SWIR1 means near-infrared spectral band.
To further distinguish among ice, snow, and water, the new Maximum Difference Ice Index (MDII) was employed to calculate breakpoints in the distribution of ice, snow, and water. A threshold of 0.144 was selected [9].
M D I I = G r e e n S W I R 1 × G r e e n + S W I R 1 = G r e e n 2 S W I R 1 2 ,
where Green means green spectral band, and SWIR1 means near-infrared spectral band.
The area of ice obtained here also included ice formed by lakes and rivers, and we applied a water mask to remove this kind of ice. Landsat images from the October of each year were selected, and a water mask for the icings in the following late spring was obtained based on the Normalized Difference Water Index (NDWI) [52].
N D W I = G r e e n N I R / G r e e n + N I R ,
where Green—green spectral band, and NIR—near-infrared spectral band.
After the water mask processing, many fragmented icing pixels appeared near the Lena River. Since river icing is not in the scope of this study, the water mask datasets for its icing in late autumn from 2002 to 2022 were overlapped to remove the Lena River icings for each year [44]. Subsequently, after the water mask processing, many scattered grid pixels emerged, which could have resulted from the application of the water mask to rivers or lakes. These scattered grid pixels were manually removed. Based on years of observations from the Melnikov Permafrost Institute of the Russian Academy of Sciences, further screening was conducted, and only groundwater icings were retained. To calculate the area of icings, we kept the grid data up to the edge of each pixel. We calculated a buffer around each icing field to account for possible misalignments between the Landsat images. The maximum misregistration error for images was categorized at 12 m, and only one side could be affected by the shift. Therefore, the buffer size was set at ±6 m [53]. The standard deviation of the sum of the error term was used to calculate the error estimation.

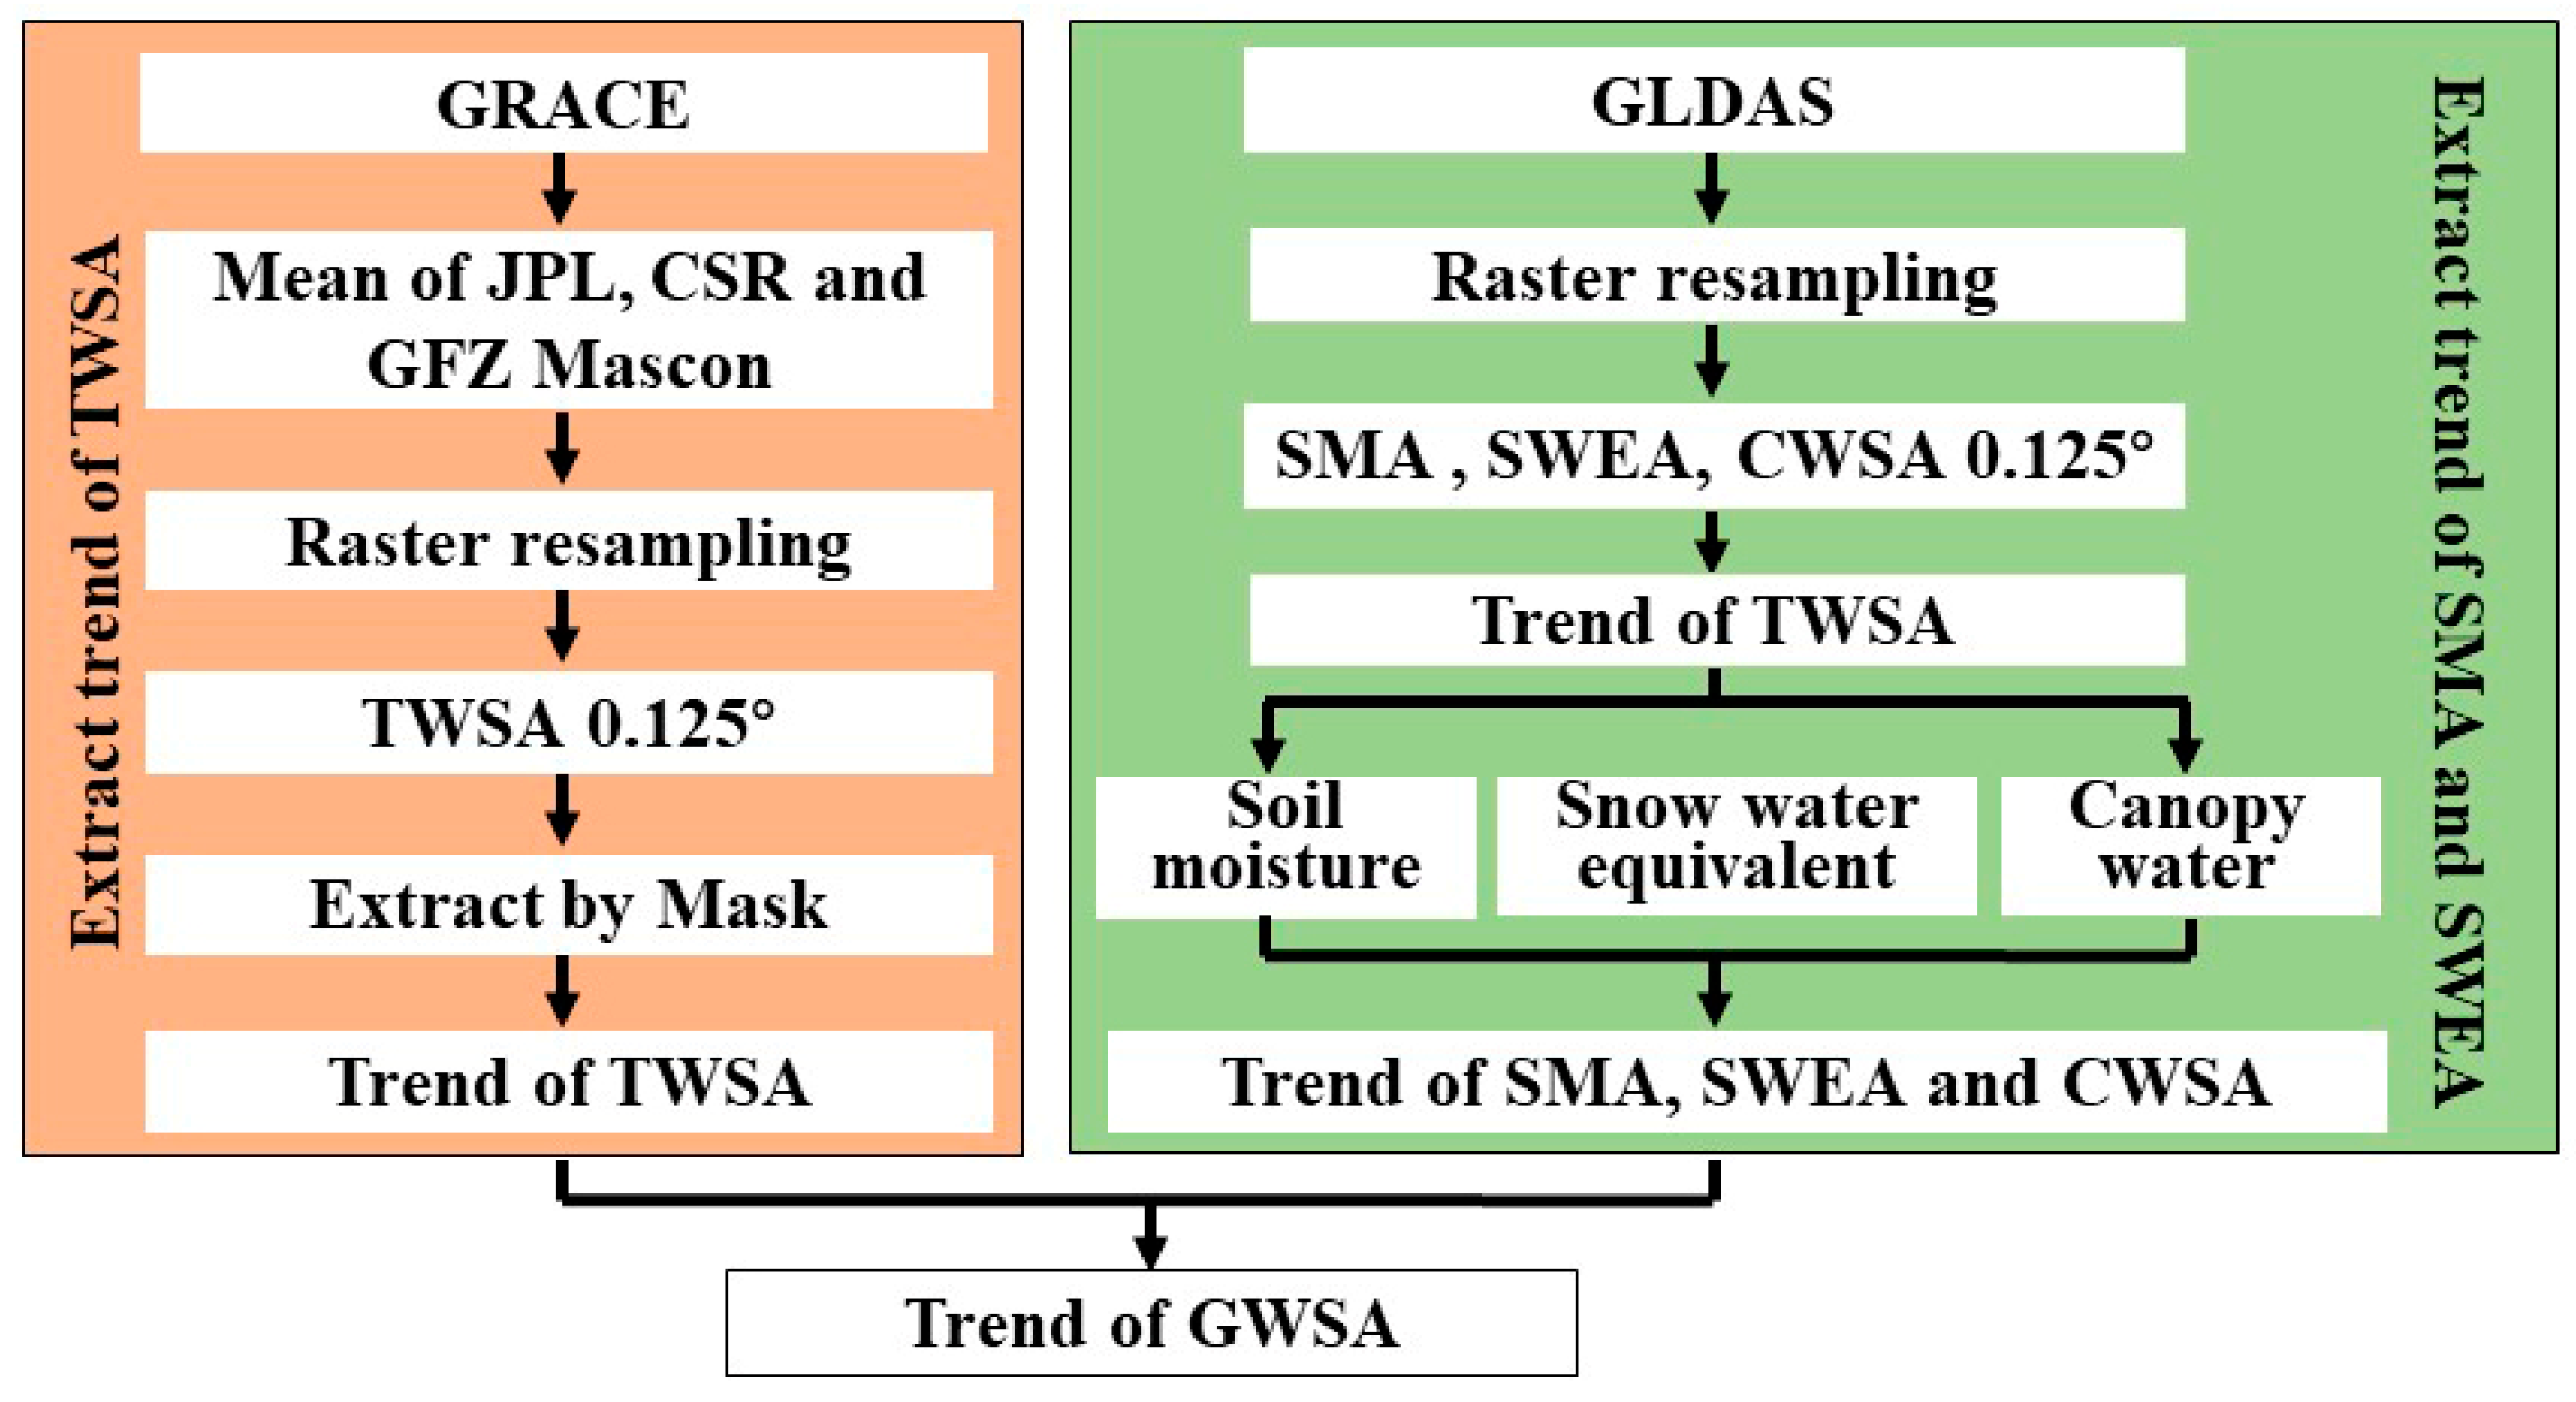
2.3. Groundwater Inversion Based on GRACE/GRACE-FO

2.3.1. GRACE/GRACE-FO Total Water Storage Anomalies Data Set

The GRACE/GRACE-FO dataset includes variations in terrestrial water storage as Total Water Storage Anomalies (TWSA). Monthly gravitational anomaly data, spanning from January 2003 to December 2022, were sourced from three institutions: The Jet Propulsion Laboratory (JPL), the Center for Space Research (CSR), and the Goddard Space Flight Center (GSFC), as shown in Table 1. After undergoing ellipsoid Earth calibration, first-degree term correction via the geocentric correction model, glacial isostatic adjustment (GIA), AOD1B ‘GAD’ field modification, and replacement of C20 and C30, an anomaly dataset of equivalent water thickness (EWT) in millimeters (mm), representing terrestrial water storage, was obtained. Since the different coefficients used by the three institutions led to slightly different results, this study adopted the mean value of the datasets from the three centers. The data resolution is 1 radian, with an estimated error of approximately 40 mm at the equator, gradually decreasing to 15 mm at the poles [54].

2.3.2. GLDAS Hydrological Model Data

GLDAS integrates three land models (CLM, NOAH, and Mosaic) with a hydrological model (VIC). This dataset provides extensive global coverage of various hydrological and meteorological variables, continuously updated since 1979. In this study, the NOAH_M.2.1 land surface model from GLDAS was employed to analyze changes in surface water storage. The analysis included four layers of soil water (0–2 m below the surface), snow water, and canopy water at a spatial resolution of 0.25° × 0.25°. The study area boundary was precisely delineated and adjusted in batch mode. Subsequently, changes in surface water storage were calculated by aggregating the contributions of the four soil water layers and snow water equivalents.

2.3.3. Calculation of GWSA

The growth period of icings in the study area typically spans from October to the next May. We used data from the GRACE/GRACE-FO satellite mission to obtain terrestrial water storage anomalies (TWSAs). TWSAs represent changes in the total amount of h, including components like soil moisture, snow water equivalent, and water stored in vegetation canopies [55]. To analyze the dynamic characteristics of groundwater in different icing regions, we isolated GWSAs from the total water storage, with a focus on the monthly GWSA during the icing growth period from October 2002 to May 2022 (Figure 3) [56]. The water balance equation for the study area is as follows:
Δ G W S A = Δ T W S A Δ S M A Δ S W E A Δ C W S A ,
where Δ G W S A is the anomaly of groundwater storage (mm). Δ T W S A is the anomaly of terrestrial water storage obtained by the GRACE/GRACE-FO satellite (mm), and Δ S M A and Δ S W E A are the anomalies of soil moisture (mm) and snow water equivalent (mm), obtained by GLDAS NOAH. Δ C W S A represents the anomaly of total canopy water storage (mm).

2.3.4. Permafrost Probability and Distribution Data

From 2002 to 2019, the permafrost probability and distribution data for the specified research area were obtained from the NERC EDS Centre for Environmental Data Analysis (CEDA) [57]. This dataset utilizes the TTOP (Temperature at the Top of Permafrost) model, which integrates remotely-sensed surface temperature measurements with ERA-Interim climate reanalysis data, to establish a permafrost distribution model for the Northern Hemisphere. It offers a spatial granularity of 1 km2 [58]. Permafrost zones within the dataset are categorized based on the International Permafrost Association (IPA) guidelines, which outline distinct categories: isolated permafrost with 0–10% coverage, sporadic permafrost covering 10–50%, discontinuous permafrost encompassing 50–90%, and continuous permafrost at 90–100% coverage.

3. Results

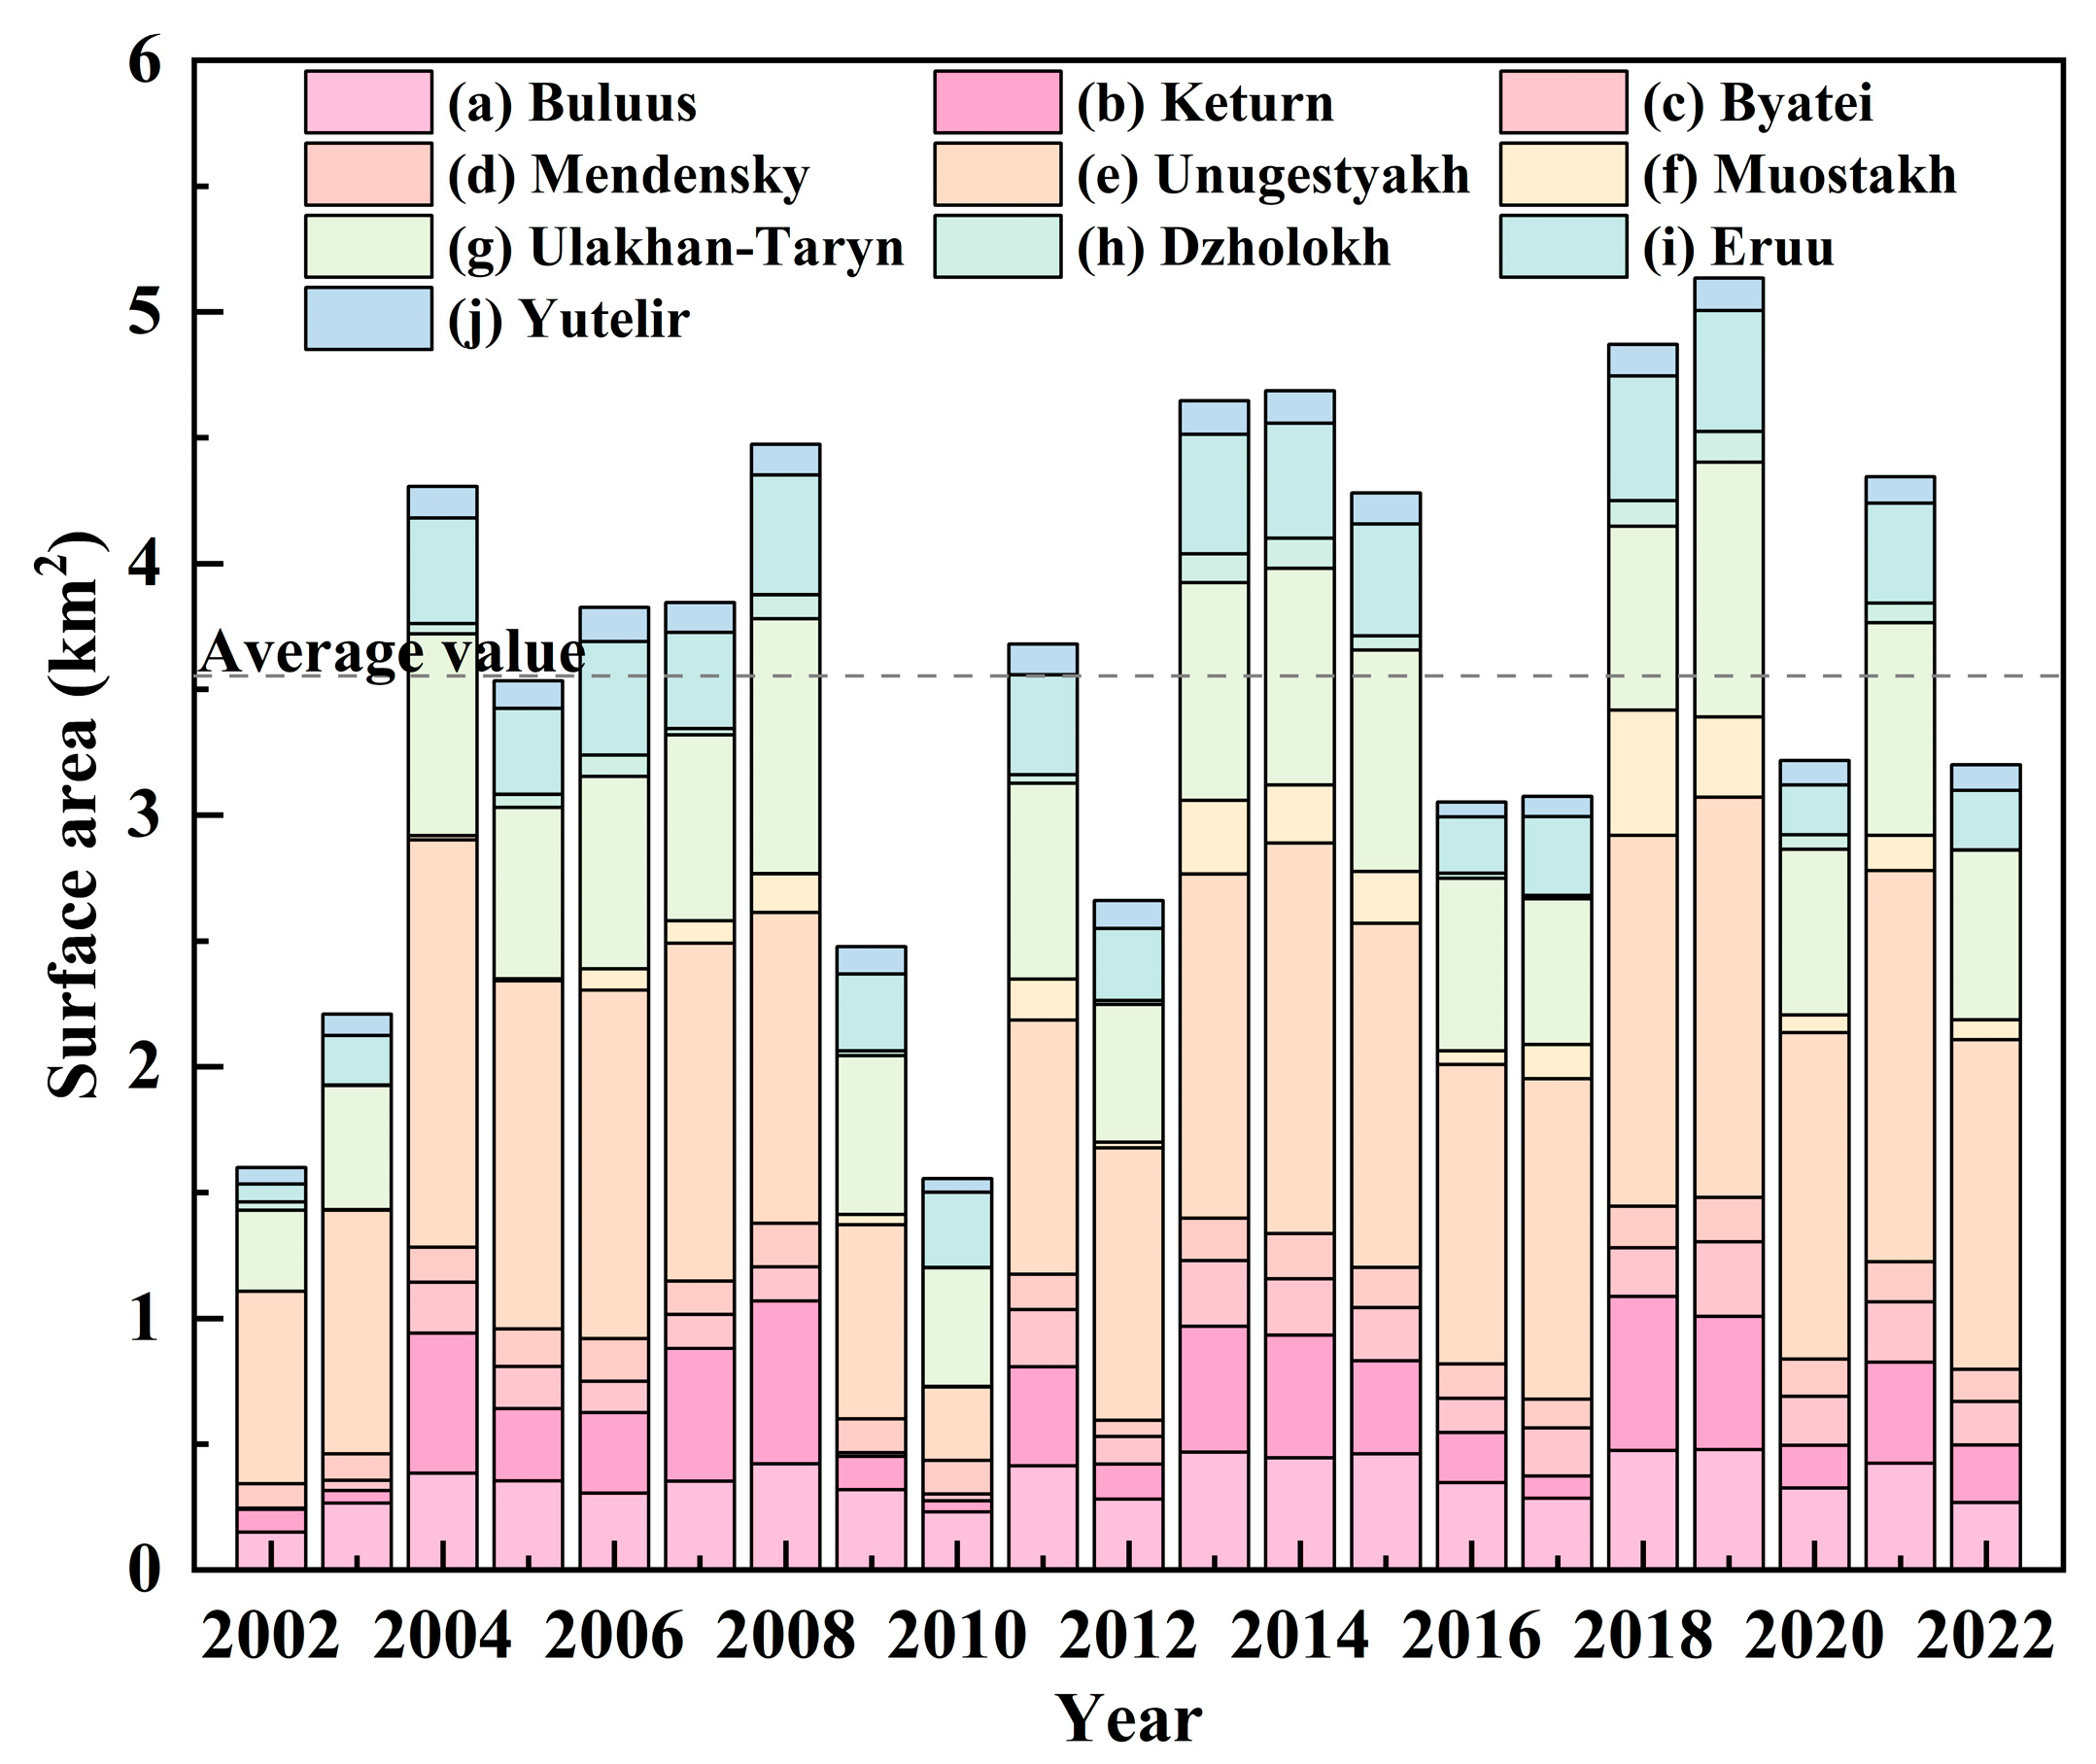
3.1. Icing Distribution and Dynamics

Icings are quite common in the study area and occur in different sizes. Between 2002 and 2022, a total of 210 icing events were recorded in the study area. The average surface area of the icings was 0.36 ± 0.04 km2. Among these events, 20 were large icings, with a surface area of over 0.90 km2, all of which were from Unugestyakh. There were 38 medium-sized icings, with surface areas ranging from 0.45 to 0.90 km2. These icings were largely from Keturen, Eruu, and Ulakhan-Taryn. The 152 small icing events, with surface areas smaller than 0.0036 km2, were found in other regions. Icings smaller than 0.0036 km2 were not identified due to the 30 m pixel resolution of Landsat images. As the data were constrained by the pixel resolution, smaller icings may not have been recognized.
The average surface area of icings in the study area from 2002 to 2022 was 3.55 ± 0.37 km2, showing an overall increasing trend. The average growth rate was 0.06 km2/year. The minimum surface area of icings in the study area (1.56 ± 0.16 km2) occurred in 2010, and the maximum (5.13 ± 0.53 km2) in 2019 (Figure 4).
Changes in the maximum extents of late spring icings in Central Yakutia from 2002 to 2022 are shown in Figure 5. The overlapping areas of icings in different regions of Central Yakutia are presented in Table 2. After overlapping, the icing areas in various regions ranged from 0.18 ± 0.01 to 2.18 ± 0.15 km2 over the years. In the case of large icings (>0.9 km2), the icing areas were not concentrated but typically comprised multiple clusters of smaller icings. The probability of repeated icing in a region gradually decreased from the center outward. Large icings with high icing rates covered a small proportion, ranging from 12.16% to 46.33% of the regional total area. The outer parts with low icing rates had larger icing areas, accounting for 35.71% to 61.52%, while the transition areas in the middle were relatively slow, ranging from 14.58% to 26.32%. In addition, we observed that large icings often developed near rivers. Among medium-sized icings (0.45 to 0.9 km2), those in the Buluus and Eruu regions were relatively intact, and those with high icing rates accounted for a large proportion of 41.61% to 48.55%. About 78% of the Muocmakh region experienced infrequent icings, with only 2.72% of the total area witnessing frequent icing. This is closely related to the uneven terrain and distribution of water outlets in the region. Among small icings (<0.45 km2), the distribution of icing frequencies was uneven. In the Byatei and Dzholokh regions, the areas with high frequencies of icing were small, accounting for only 2.72% and 3.71% of the total, respectively, while those in the Mendensky and Yutelir regions were bigger, reaching 52.46% and 50.98%, respectively.

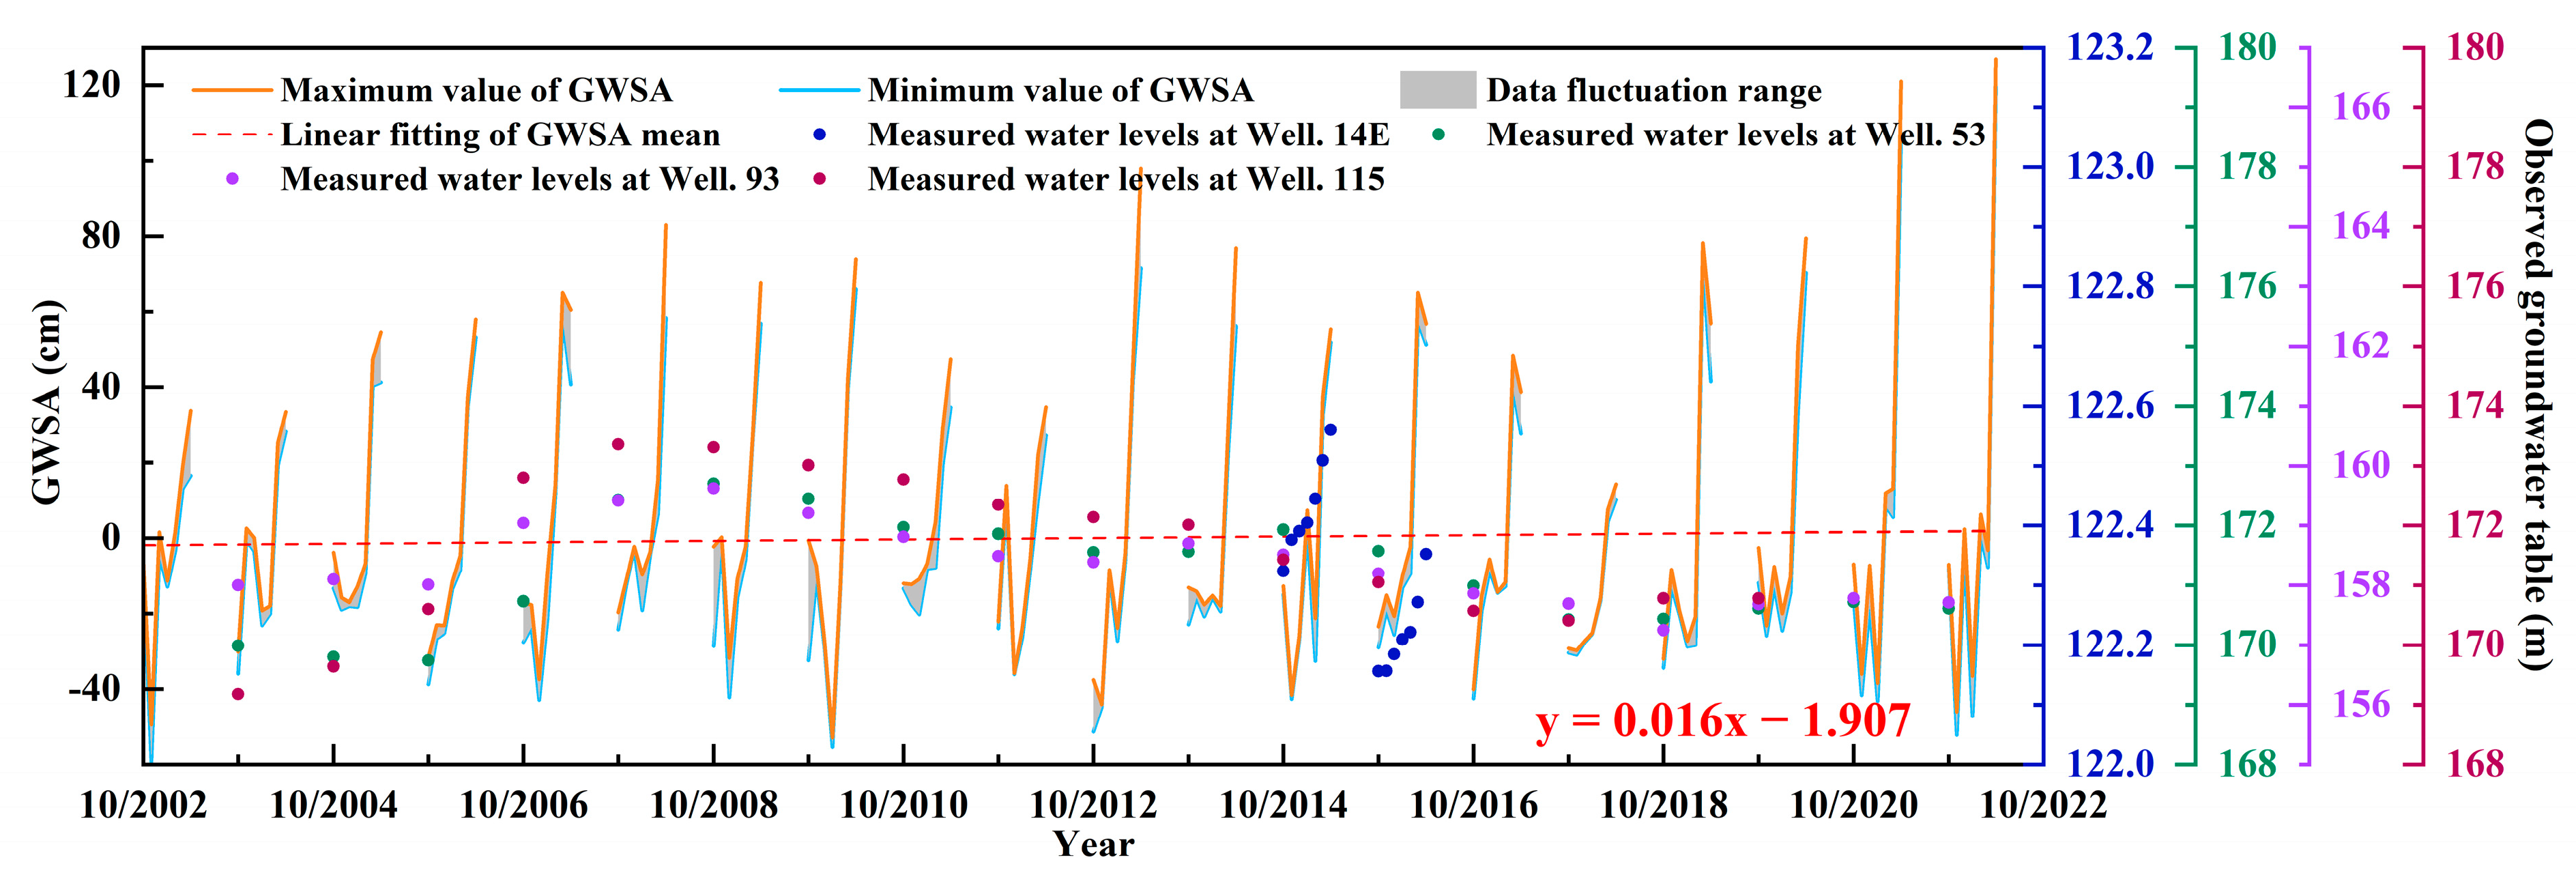
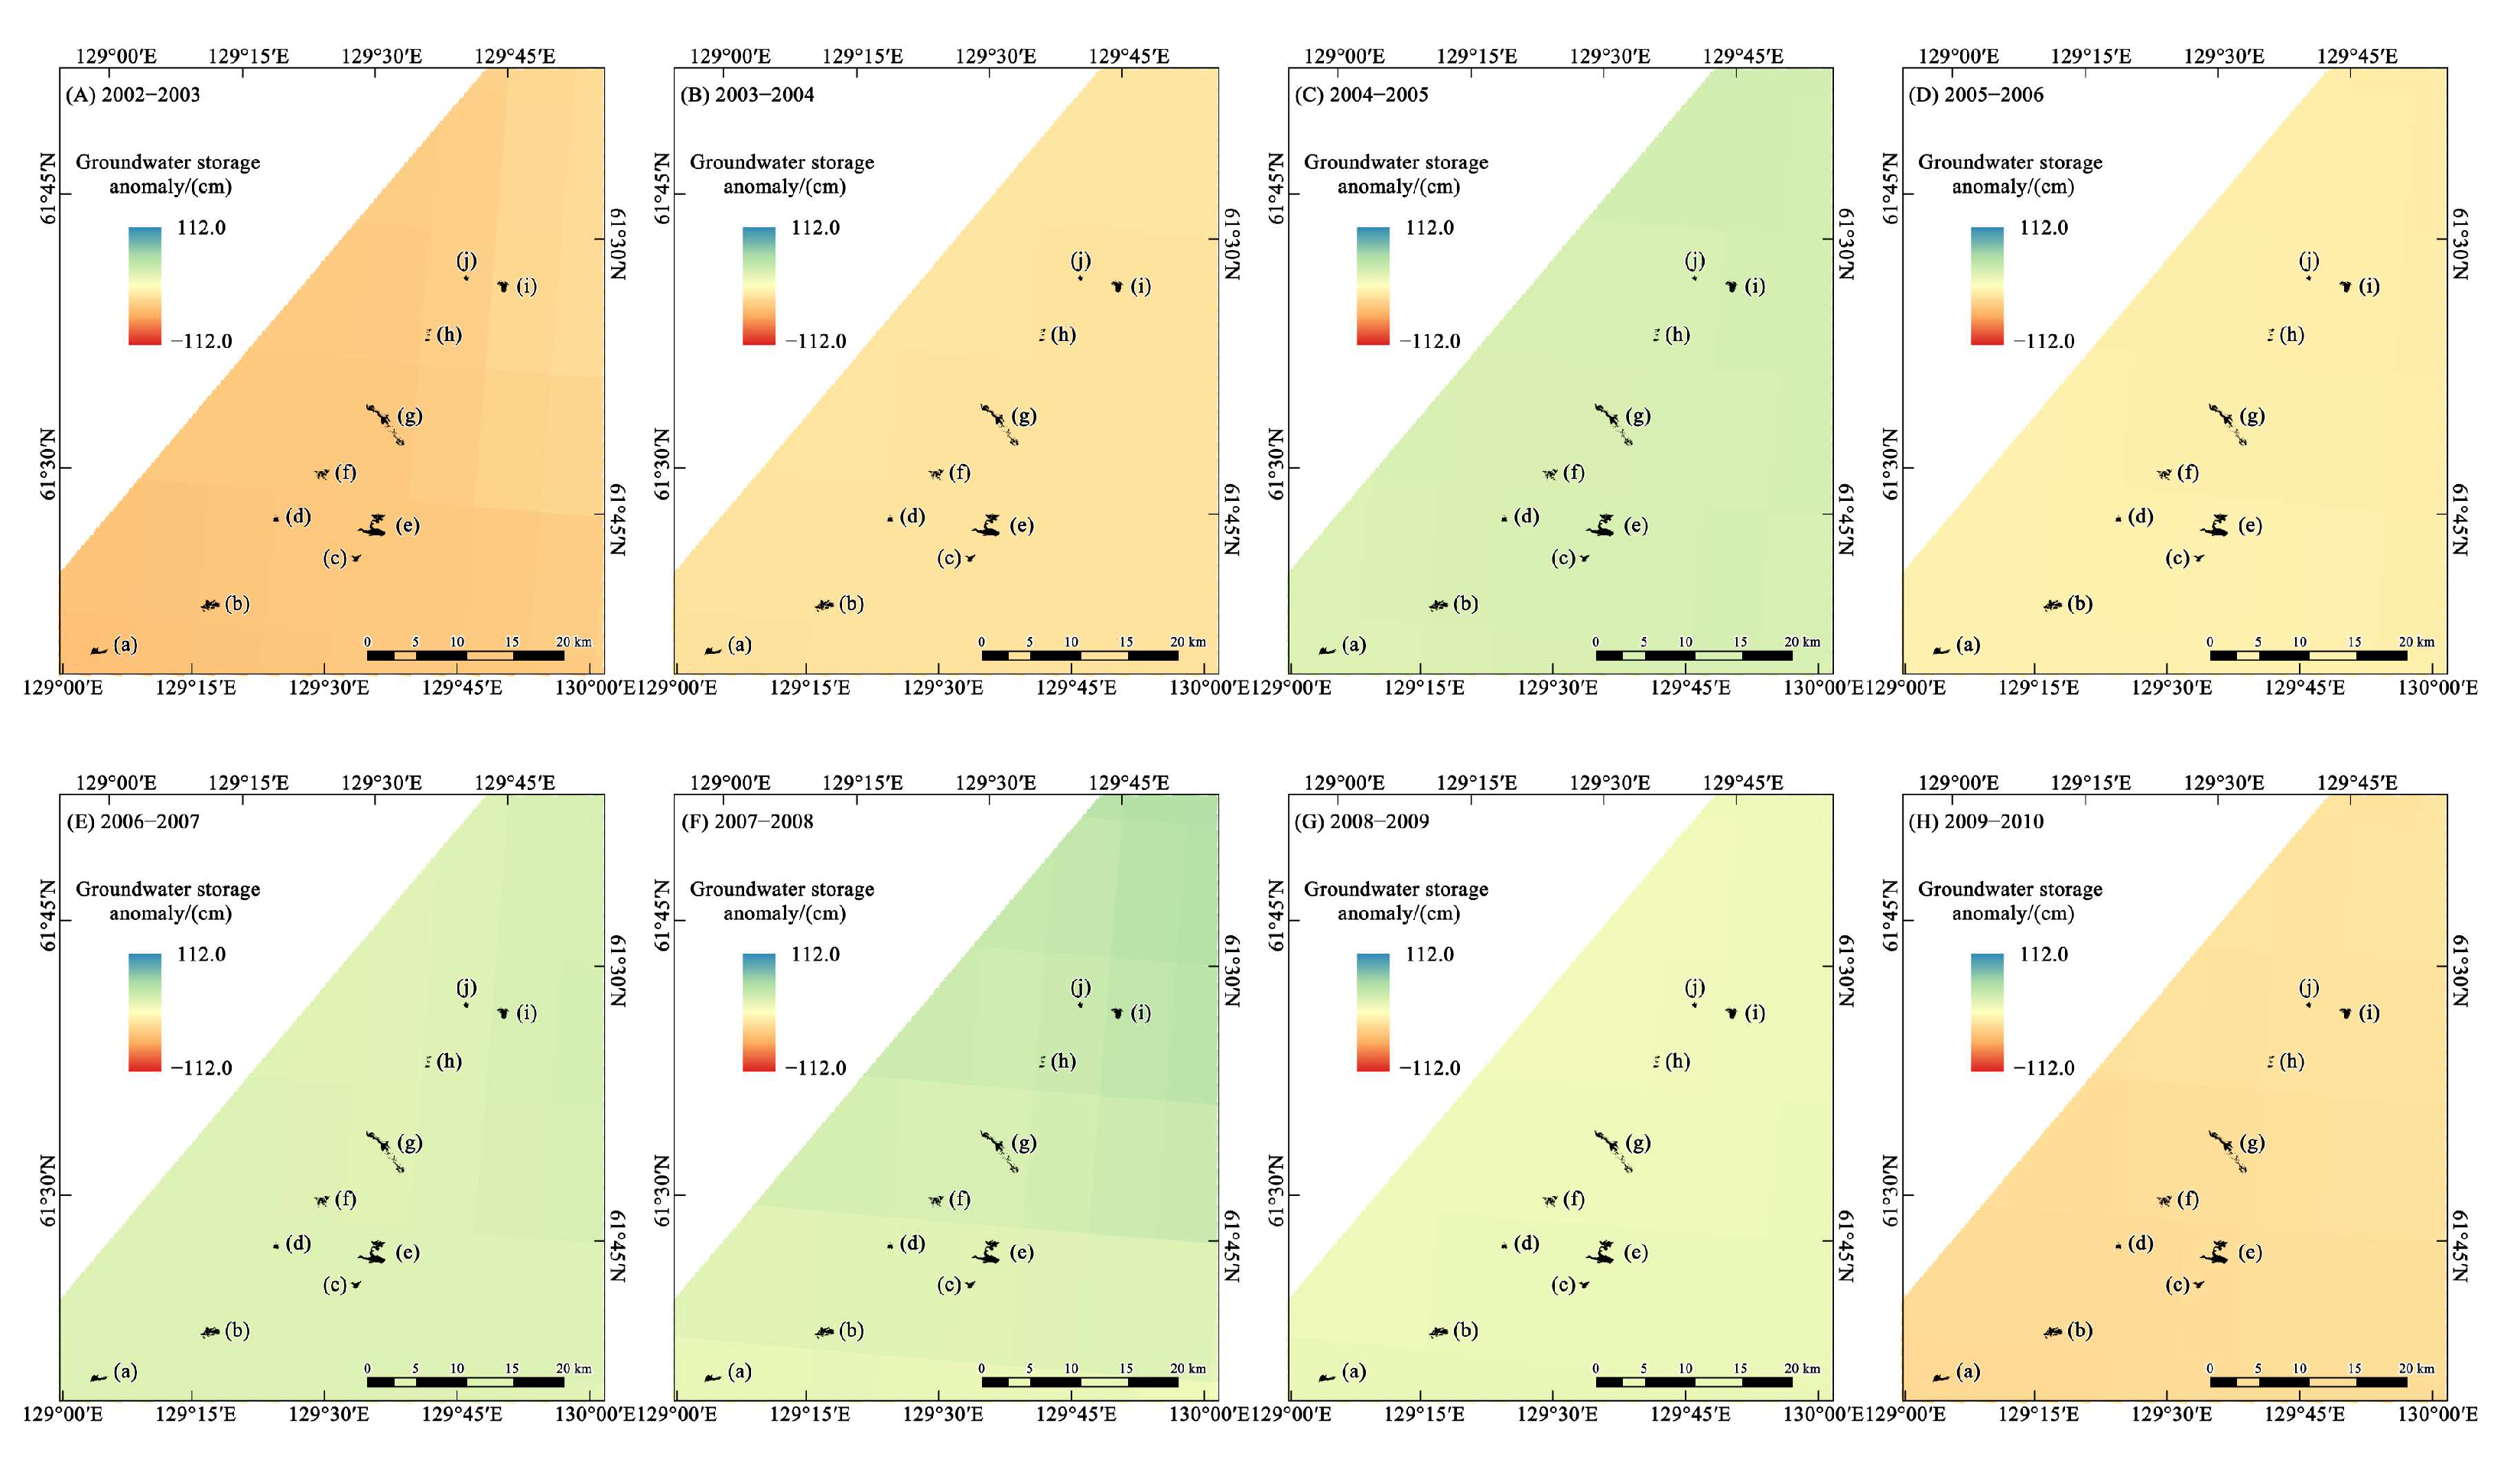
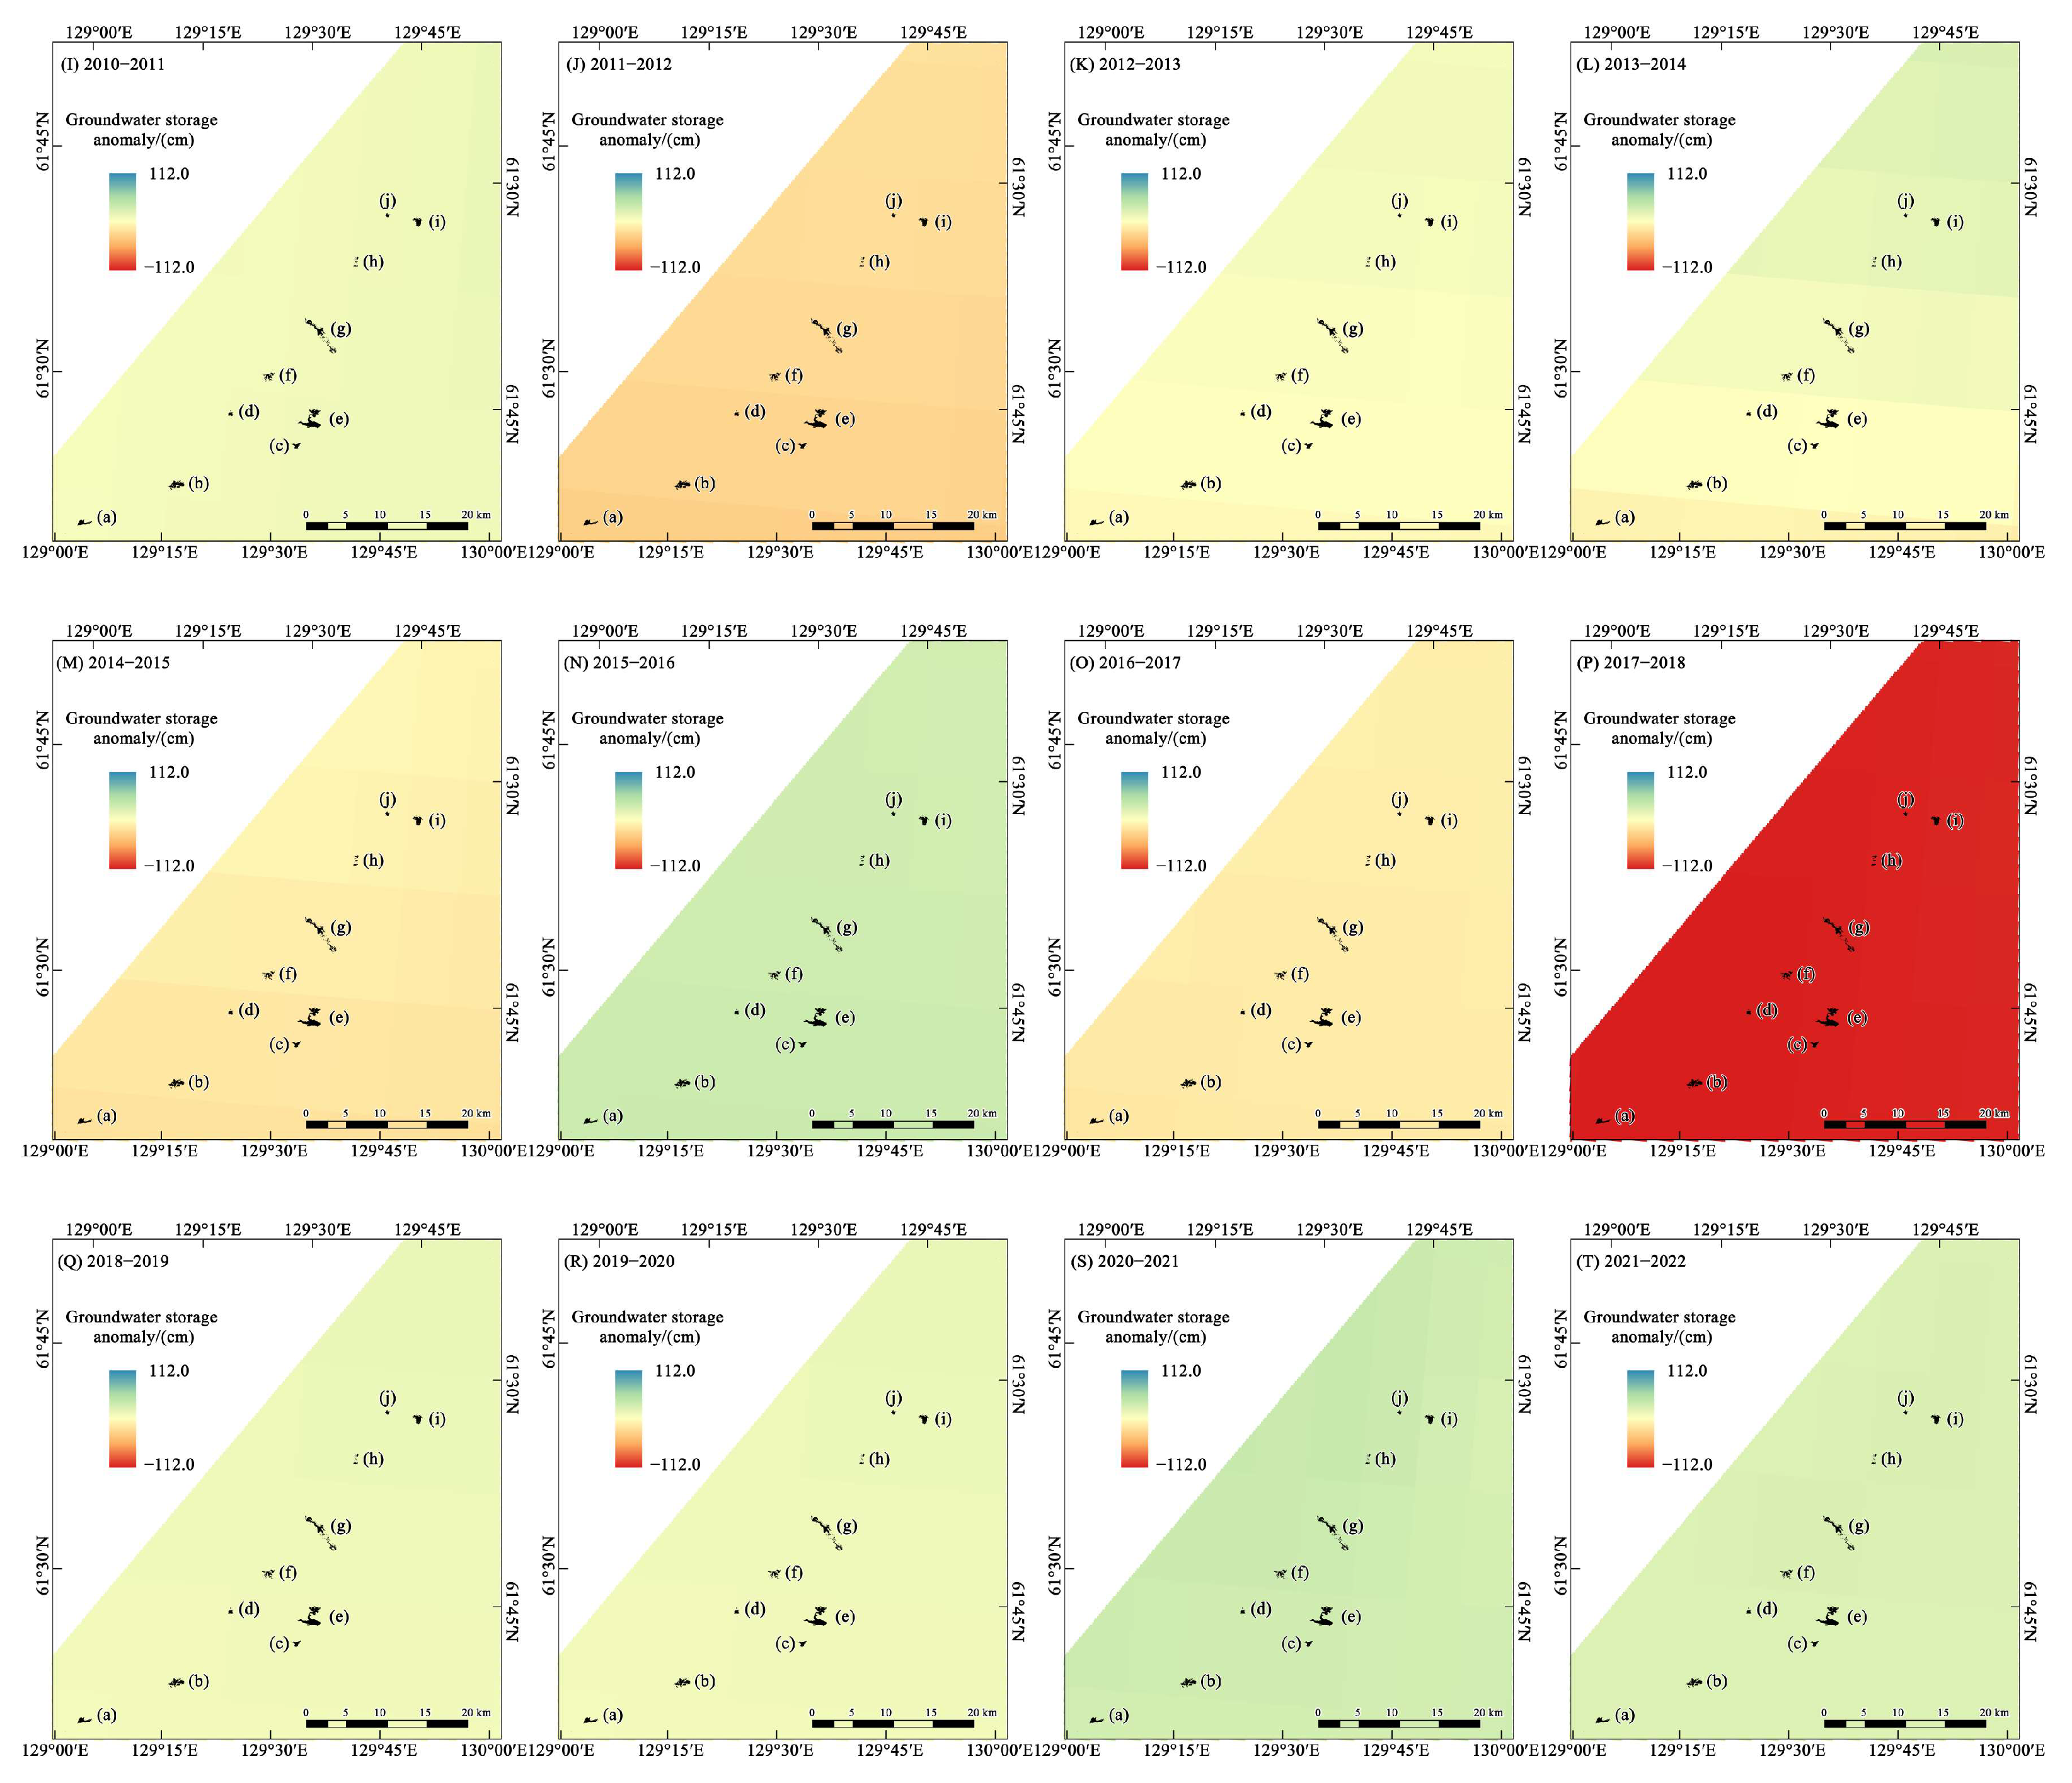
3.2. Temporal and Spatial Characteristics of Changes in the Groundwater Levels in the Study Area

To validate the accuracy of the GWSA data, we compared measured groundwater level data from groundwater observation wells in the study area with the GWSA data, as shown in Figure 6. Since the study area is located in a permafrost region, it is challenging to observe groundwater levels, resulting in a discontinuous record of monitoring data. Therefore, data from Well 14E (October 2014 to May 2015) and Wells 53, 93, and 115 (the October of each year from 2003 to 2021) with relatively complete data were selected for comparison. From October 2014 to May 2015 and from October 2014 to May 2016, both the GWSA and measured groundwater levels showed increases with good consistency. The difference in annual rise was only 0.44 to 0.61 m. During the icing growth period from 2002 to 2022 (from October to May of the following year), the GWSA grew slightly each month, with a rate of change of 0.02 cm/month. Each growth period saw a noticeable increasing trend. The largest amplitude (130.94 cm) occurred in the period from October 2021 to May 2022, while the smallest (42.05 cm) occurred between October 2017 to May 2018.
Over the icing growth period from 2002 to 2022, the GWSA in the study area generally showed an upward trend each year, with a rate of change of 0.7 cm/year. In the study area, a pattern of decreasing groundwater levels from north to south could be seen, as depicted in Figure 7. Particularly notable was the maximum north–south groundwater level difference in 2009–2010, which reached 31.1 cm. In contrast, the maximum difference was only 1.9 cm in 2003–2004. From 2003 to 2005, there was an upward trend in groundwater levels in the study area, but over the following 12 years, groundwater levels fluctuated between surplus and deficit. The period from 2017 to 2018 saw the most severe deficit in groundwater in nearly 20 years, with a total deficit of −109.0 cm compared to the multi-year average. For the following 4 years, groundwater levels remained in surplus, with the highest surplus level (42.5 cm) in 20 years occurring in the period from 2019 to 2020.

3.3. The Characteristics of Changes in Temperature and Precipitation in the Study Area

From 2002 to 2022, the study area got warmer, with a rate of temperature change of 0.08 °C/year and an annual average temperature of −8.27 °C, as shown in Figure 8. The highest annual average air temperature (−6.60 °C,) occurred in 2020, while the lowest (−9.77 °C) was in 2004. To further explore the impact of negative temperatures during the icing growth period, we calculated the changing trend of monthly minimum temperatures, which increased with a rate of change of 0.06 °C/year, 0.02 °C/year lower than the rate of temperature change for the entire year. The lowest temperature in the study area over the past 20 years was recorded on January 23, 2021, with a daily minimum temperature of −53.8625 °C. In the study area, the duration of the icing growth period ranged between 189 to 213 days, with the longest period (213 days) occurring in 2017–2018 and the shortest (189 days) in 2019–2020. Influenced by climate warming, the icing growth period in the study area showed a decreasing trend during the 20 years, with a rate of change of −0.26 days/year.
To further investigate the impact of air temperatures during the icing growth period, we calculated the changing trend of negative accumulated temperatures, as shown in Figure 9. Over the years, the annual atmospheric freezing index rose with a rate of change of 21.99 °C-day/year. The lowest atmospheric freezing index, measured at −5545.07 °C-day, was recorded in 2004–2005, while the highest, at −4497.32 °C-day, occurred in 2019–2020.
From 2002 to 2022, annual precipitation in the study area exhibited an overall decreasing trend, with a rate of change of −0.02 cm/year and an annual average precipitation of 320.6 cm. The highest monthly average precipitation (155.3 cm) occurred in August 2006, while the lowest (4.0 cm) was in April. Annually, precipitation in the study area showed periodical changes. Between 2002 and 2010, it increased to the highest point of the total annual precipitation (439.5 cm) in 2006 and then decreased. From 2010 to 2015, precipitation experienced another periodic change, with 2013 recording the highest in nearly 20 years, at 456.2 cm. After that, annual precipitation showed an overall decreasing trend.

4. Discussion

4.1. The Impact of Dynamic Changes in Groundwater Levels on Icings

Icings in the study area largely occur at the bottoms of valleys in permafrost regions. Restricted by the permafrost layer, it is seldom seen that subpermafrost water serves as a water source for icings. In winter, however, taliks facilitate the groundwater supply to icings because the supply of intrapermafrost water experiences smaller seasonal and interannual changes and can be consistently discharged to the surface throughout the year [18]. The seasonal freezing and thawing of the active layer, which is typically thin (around 2–3 m in the study area), results in a small amount of water storage. As a result, icings primarily sourced from suprapermafrost water are relatively small in size. In the study area, only Yutelir predominantly relies on suprapermafrost water as its water source for icings; its area is the smallest, and it has an average surface area 0.80 km2 smaller than those fed on intrapermafrost water.
To investigate the impact of dynamic groundwater changes on the size of icings, we conducted a correlation analysis between GWSAs for different month combinations from 2002 to 2022 and icing sizes (Figure 10). The correlation between the changes in icing surface areas and GWSAs in different time periods was strongly regular, which showed a noticeable rising trend over time. In the first month of icing appearance, all regions displayed extremely weak negative correlations (r = −0.09 to −0.07); however, from October to the following April, the correlations peaked (r = 0.55 to 0.59, p < 0.01). The abruptly increased correlation that was identified from October to December may be because of the peak period for groundwater replenishment. During the two months, the active layer gradually froze, and under the influence of hydraulic head gradients, intrapermafrost water continued to be discharged through the subaerial talik freezing from top down. The intrapermafrost water discharged rapidly froze and formed icings under the influence of negative temperatures.
These findings highlight the significant role that dynamic changes in groundwater storage play in influencing the size and extent of icings, particularly during the critical periods of early winter. The strong positive correlation observed from October to April suggests that groundwater inputs, particularly from intrapermafrost sources, are crucial for the sustained growth of icings. This pattern aligns with previous research by Crites et al., who noted the importance of continuous groundwater discharge in maintaining large icing structures in permafrost regions [8]. The seasonal variability in this correlation also points to the complexity of hydrothermal interactions in these environments [4].
Additionally, the weak negative correlation observed during the early stages of icing formation is comparable to the findings from Kane et al., who documented similar patterns in the Yukon River Basin [37]. Their research suggested that the initial phase of icing formation is primarily driven by surface water inputs, with groundwater contributions becoming more prominent as the freezing season progresses. This transition of dominance from surface to groundwater is evident in our data, in which the correlation between GWSA and icing size strengthens significantly from October to December.
The marked increase in correlation from October to April seen in our study area is also consistent with the seasonal patterns of groundwater recharge discussed by Woo [4]. Woo’s research in the Canadian Arctic emphasized that late autumn and early winter are critical periods for groundwater replenishment, as the active layers freeze from the top down, creating hydraulic gradients that drive intrapermafrost water to the surface. This mechanism parallels the processes observed in our study, where intrapermafrost water discharging through taliks significantly contributes to the growth of icings during this period.

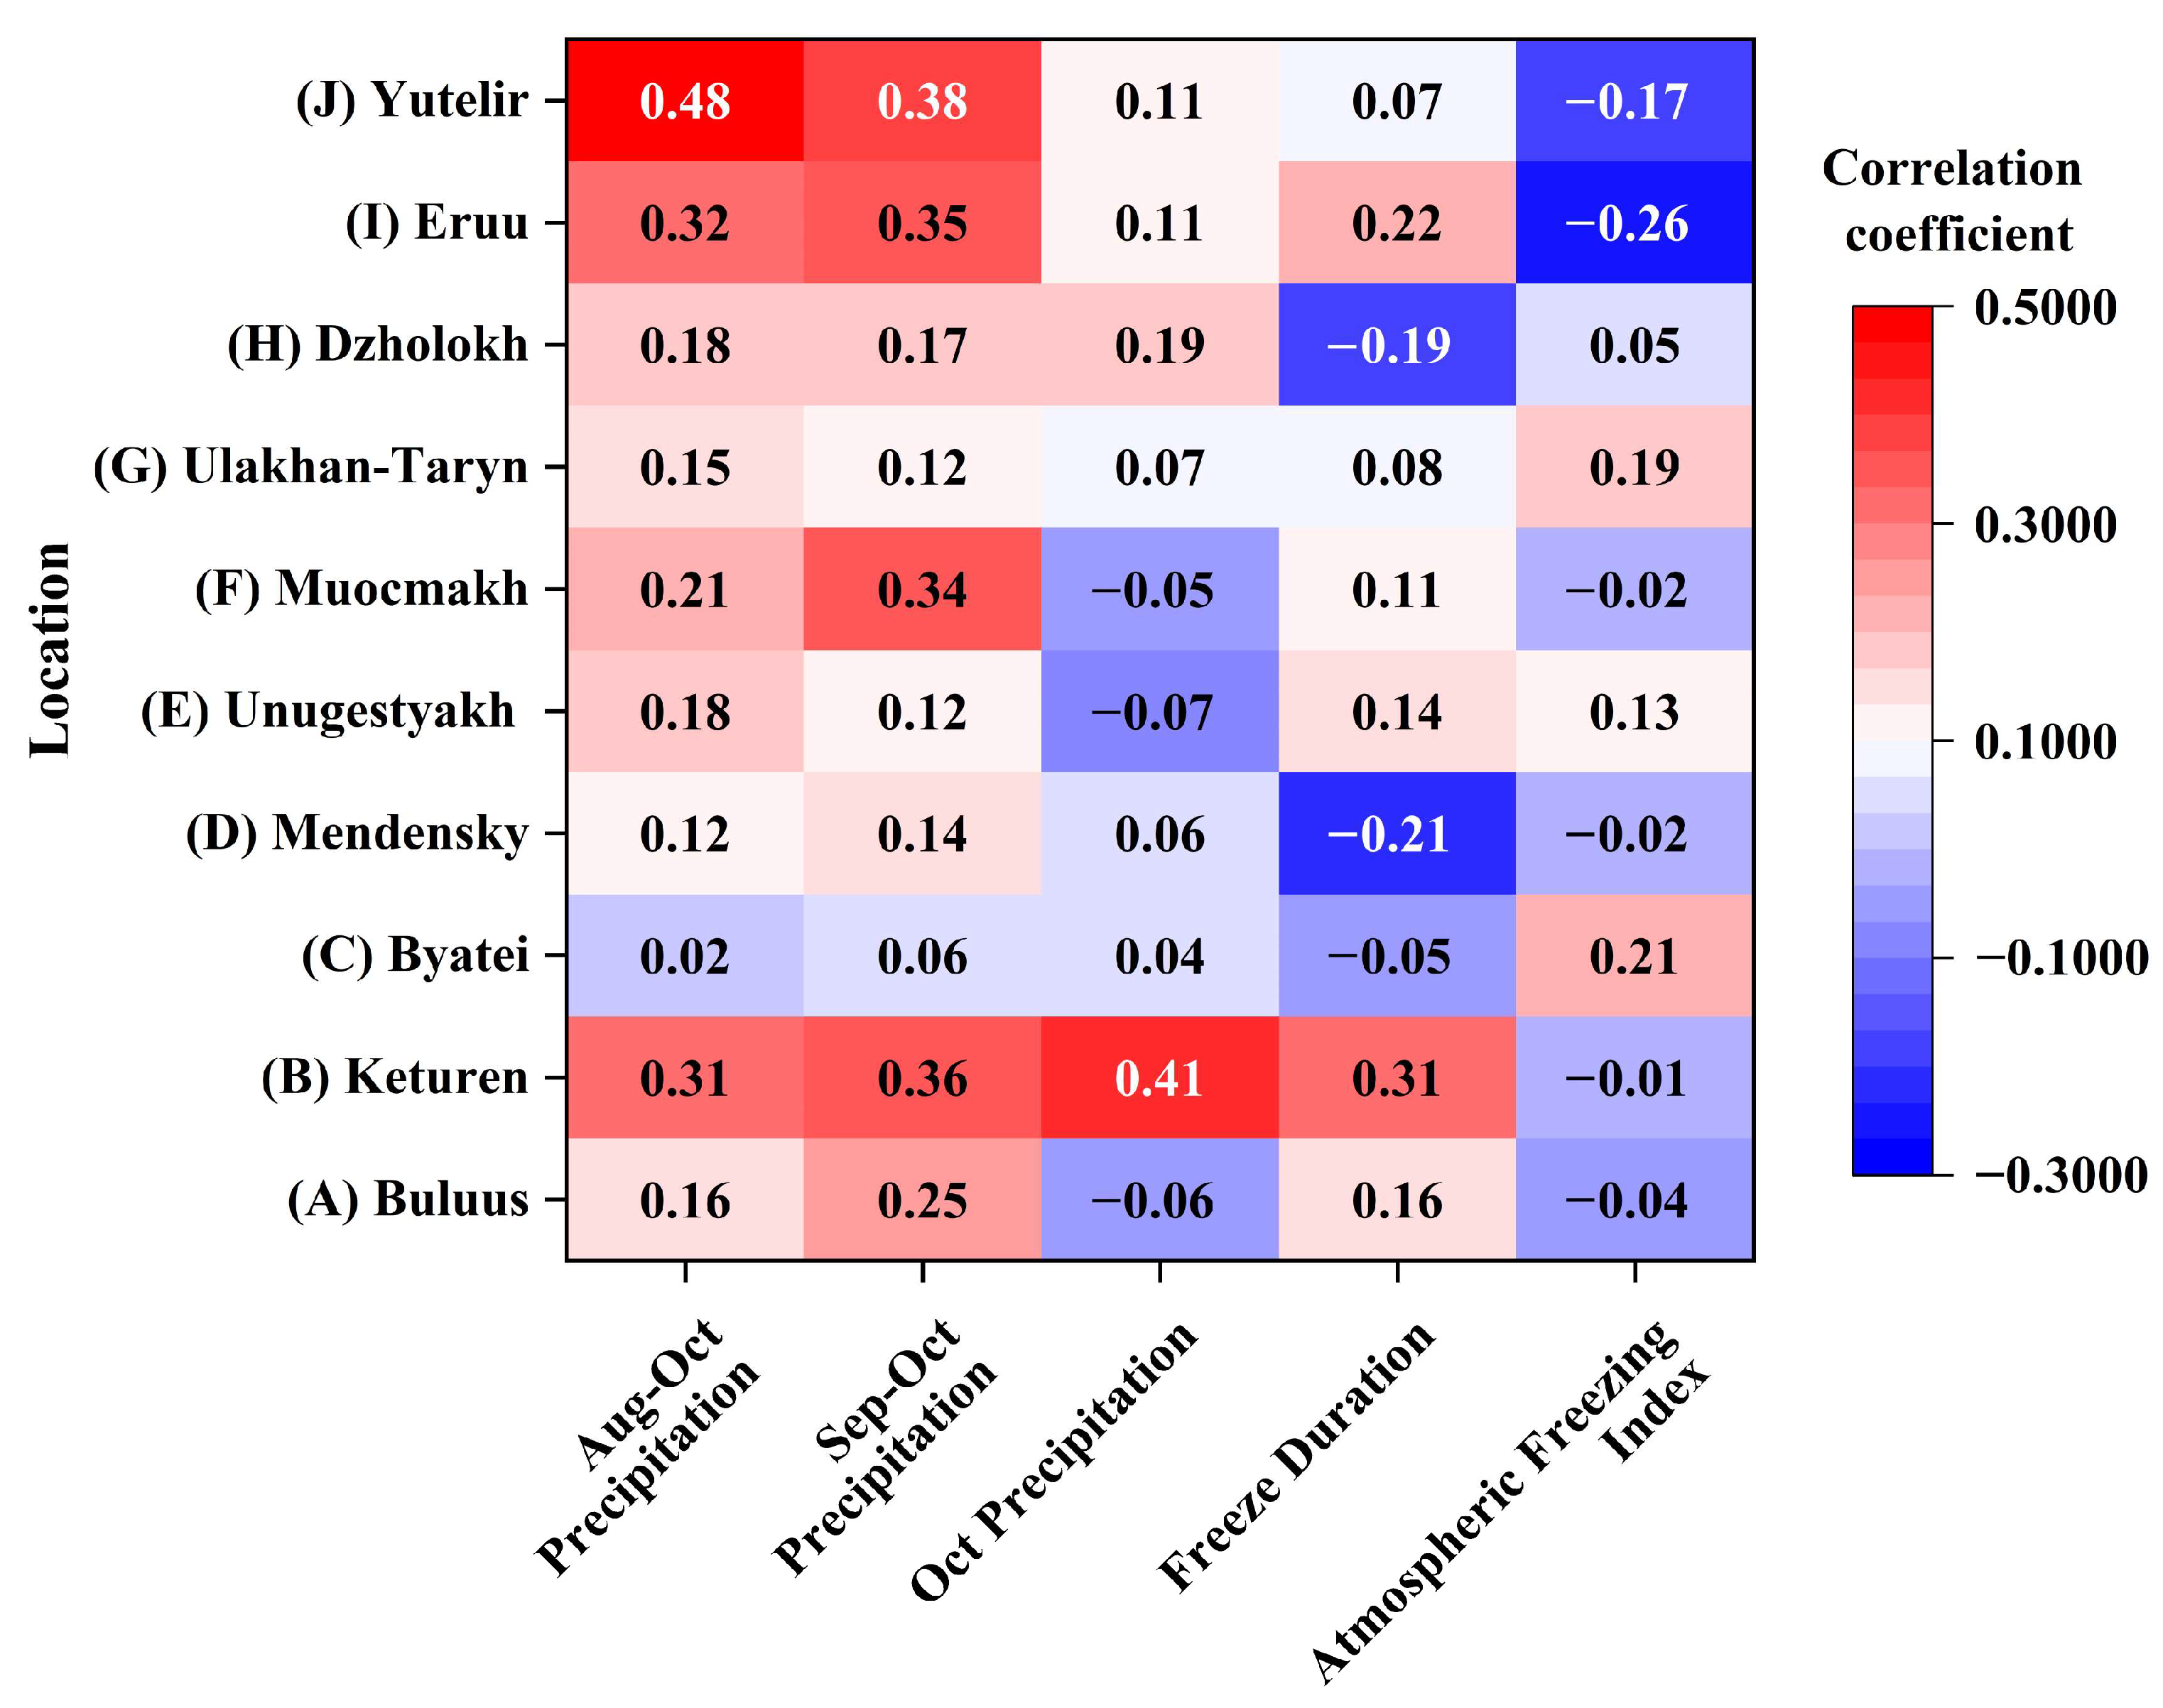
4.2. The Impact of Precipitation and Temperature on Icings

Previous studies have found a connection between icing development and early autumn precipitation [9]. To further reveal to what extent the size of icings is influenced by different months in autumn, we conducted a correlation analysis between autumn precipitation and icing surface areas for different month combinations in the study area from 2002 to 2022 (Figure 11). The results showed that the response of icing surface area in the Yutelir region from August to October was most sensitive to precipitation (r = 0.48, p < 0.01). This is because the main water source for icings in the region is suprapermafrost water, which is more susceptible to precipitation input. In contrast, other icings primarily rely on intrapermafrost water as their water source, resulting in a less sensitive response to precipitation and a weaker influence from precipitation.
Persistent negative temperatures not only freeze the groundwater overflowing from the ground, thereby expanding icing sizes, but also stop the increase in the surface area of icings by freezing the pathways of groundwater discharge. This dual effect results in a weak correlation between icing growth periods and the surface areas of icings and between negative accumulated temperatures and the surface areas of icings (r = −0.26~0.21).
The outcomes of the present study align well with earlier research investigating the effect of autumn precipitation on icing formation. Kane et al. highlighted how precipitation in early autumn plays a crucial role in the formation of icings in the Yukon River Basin, where suprapermafrost water sources are similarly sensitive to changes in precipitation [37]. The observed strong correlation in the Yutelir region reinforces the notion that regions relying mainly on suprapermafrost water are particularly vulnerable to fluctuations in precipitation, especially during the critical phases of icing development.
Conversely, the observed weaker correlation between precipitation in autumn and icing surface areas in regions that rely on intrapermafrost water is consistent with the findings of Woo [4]. Woo’s research demonstrated that intrapermafrost water sources typically moderate seasonal precipitation variability due to their relatively constant discharge rate. This phenomenon suggests that icings sustained by intrapermafrost water are less impacted by short-term meteorological fluctuations, potentially explaining the lower sensitivity detected in these areas.
Moreover, the dual influence of sustained negative temperatures in other permafrost regions, solidifying groundwater and further constraining icing expansion by freezing discharge pathways, has been recognized. Similar patterns were observed by Yoshikawa and Hinzman in Alaska, where severe cold temperatures effectively curtailed the growth of icings by freezing the subsurface channels through which groundwater moved [11]. This process elucidates the weak correlation between icing growth period and surface areas found in our study.

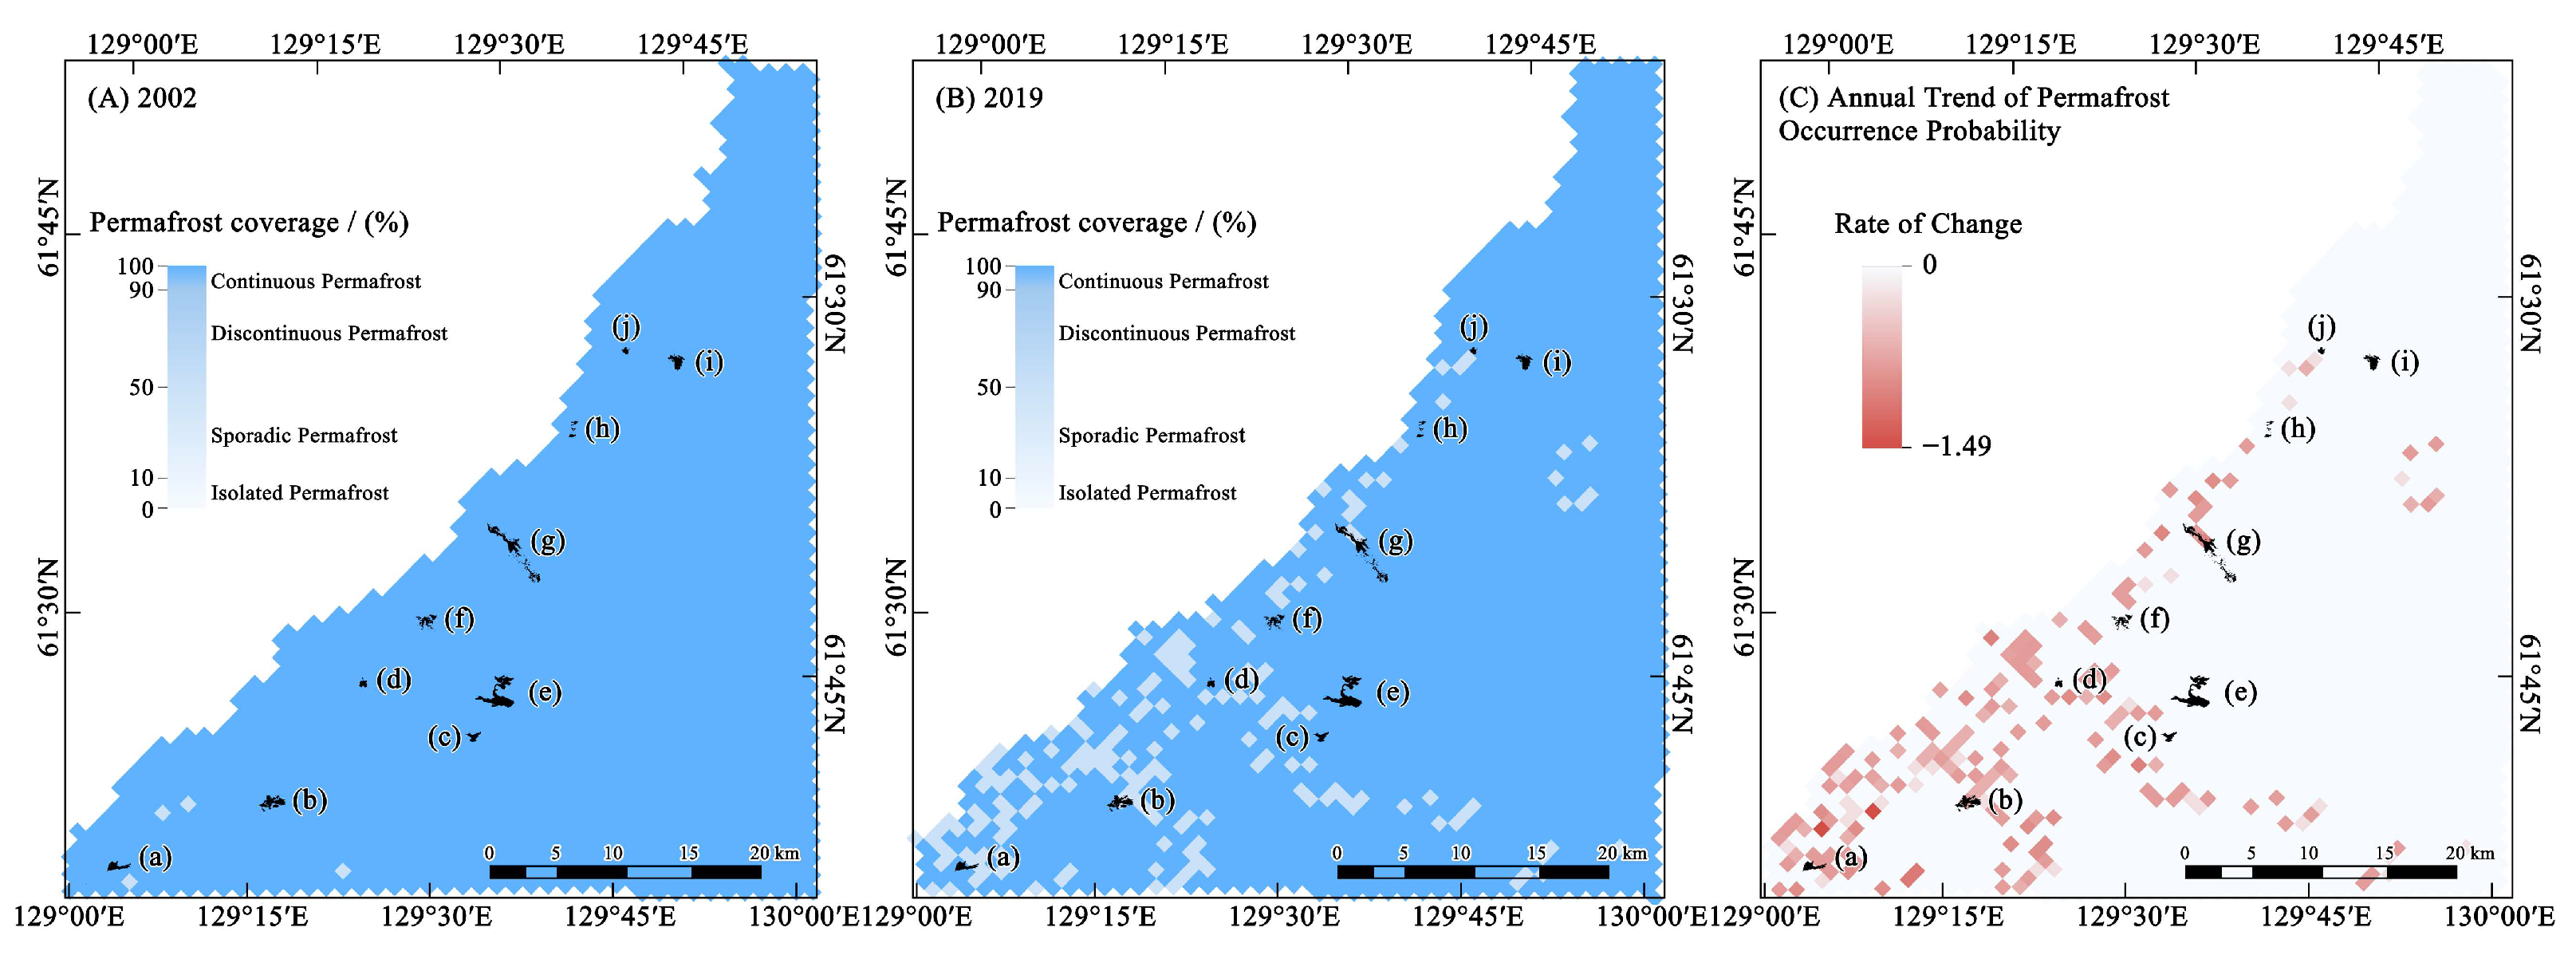
4.3. The Impact of Landforms and Permafrost on Icings

Icings in the study area mainly occur on the foot slopes of a terrace, where larger catchment areas facilitate the collection of overflowing groundwater [59]. The slope of the terraces generally exceeds 30°, with ice accumulations on shaded slopes being thicker and persisting longer compared to sunlit slopes under the same conditions [60]. Meanwhile, nearby mountains partially shield icings from solar radiation, promoting their growth [61]. The upper layers, often covered with sandy soil, show good permeability [62,63]. With vegetation cover, surface runoff is impeded, which facilitates the infiltration that replenishes suprapermafrost water [64]. Furthermore, due to the lower location of springs formed by suprapermafrost and subpermafrost water, the hydrostatic pressure provided by the water level difference drives groundwater discharge [65].
The permafrost environment represents a combination of meteorological and geological factors [66]. The thickness of the active layer influences the rate of the formation of icings primarily sourced from suprapermafrost water and their sizes, while the scale and quantity of taliks affect those relying on intrapermafrost water as their major water source. Under the influence of global warming, permafrost has been degrading annually [67]. From 2002 to 2019, 166 km2 of continuous permafrost in the study area degraded into discontinuous permafrost, as shown in Figure 12A,B. This degradation extends from the Lena River to the terrace areas. The rate of permafrost degradation is illustrated in Figure 12C, with higher degradation rates observed in the southern region compared to the northern region. In the regions of Buluus, Keturen, Ulakhan-Taryn, and Yutelir, which are within the degradation area, the expansion of discontinuous permafrost has promoted the development of taliks to some extent. This, in turn, has enhanced the connectivity between surface water and groundwater [68], significantly increasing the recharge of surface water to groundwater during the summer [19]. Additionally, the growth of discontinuous permafrost areas may release a certain amount of groundwater, which could be one of the reasons for the increasing trend in icing areas [54].
The observed relationship between permafrost degradation and icing development in the study area aligns with findings from other regions experiencing similar environmental changes. For instance, Romanovsky et al. documented widespread permafrost degradation across the Arctic, noting that such changes often lead to increased groundwater discharge due to the formation and expansion of taliks [66]. This is consistent with our findings, in which the degradation of continuous permafrost into discontinuous permafrost has facilitated the development of taliks, subsequently enhancing the connectivity between surface water and groundwater and promoting the growth of icings. Additionally, the increase in groundwater recharge caused by permafrost degradation observed in this study mirrors the patterns reported by Lamontagne-Hallé et al., who identified similar processes in the Canadian Arctic [69]. Their research highlighted how the expansion of taliks and the increased permeability of the active layer could lead to greater groundwater recharge during warmer seasons, which, in turn, supports the sustained growth of icings during the winter months.
As global warming continues to drive permafrost degradation, the formation and expansion of taliks are likely to become more prevalent, further impacting groundwater-surface water interactions and thus icing development.

4.4. Limitation and Constraints

The study of groundwater storage evolution and its influencing factors in the Lena River basin has been conducted using data from multiple satellites. The limitations and constraints of this investigation are primarily related to research methods, data accuracy, and the sensitivity of permafrost dynamics. It relies heavily on remote sensing data from the GRACE satellite and the GLDAS model. In terms of the GRACE data, accuracy may be affected by limitations in temporal and spatial resolution. Additionally, GRACE’s analysis of GWSA is indirect. Actual measurements of groundwater levels typically require in-situ observation wells, which are impractical for widespread implementation across the entire permafrost region. Consequently, the conclusions drawn are primarily based on model estimates and satellite data, which may fail to capture local subsurface heterogeneities and could overlook finer-scale spatial variations in groundwater storage. Additionally, the temporal resolution of the data may not adequately capture the full details of rapid changes or seasonal dynamics. The GLDAS model data also has potential uncertainties. The spatial resolution of the GLDAS model is 0.25° × 0.25°, potentially making it insufficient to capture local hydrological variations and small-scale processes specific to permafrost regions. In such areas, hydrological processes at the surface and subsurface are often highly heterogeneous, including localized soil freezing and thawing, as well as the formation and development of taliks. The relatively coarse resolution of the GLDAS model may result in the inaccurate estimation of localized groundwater storage changes, thereby affecting the precision of the overall GWSA calculations in this complex environment. Moreover, the study area encompasses permafrost regions with complex dynamics that are not yet fully understood. Warming-induced changes in permafrost may lead to variations in groundwater storage, but these interactions are multifaceted and difficult to quantify. Despite these limitations and biases, the data may contribute to an improved understanding of groundwater dynamics in permafrost regions through the integration of multisensor satellite data.

5. Conclusions

This study provides the dynamic changes in the surface area of icings and GWSA in the central region of the Sakha (Yakutia) Republic from 2002 to 2022. For the first time, the impact of dynamic changes in groundwater levels on icings was analyzed based on GWSA. From 2002 to 2022, the surface area of icings in the study area showed an overall increasing trend, with an average growth rate of 0.06 km2/year. Suprapermafrost water and intrapermafrost water are the main sources for the formation and growth of icings in the study area. The total GWSA values from October to the following April annually showed a high correlation with the changes in icing surface areas (r = 0.55 to 0.60, p < 0.01), indicating that icings primarily relying on intrapermafrost water continued to receive a supply throughout the growth period. We also investigated the differences between icings with suprapermafrost water as the major water source and those with intrapermafrost water as the major source. Changes in the areas of the former are largely influenced by early autumn precipitation (August to October), while the latter are less affected by precipitation and more influenced by the scale and number of taliks. The maximum area of icings in a permafrost region is less affected by the duration of growth periods and negative accumulated temperatures. Climate warming has resulted in an increase in both the scale and number of taliks. From 2002 to 2019, in the study area, 166 km2 of continuous permafrost transitioned to discontinuous permafrost. This process released a significant amount of groundwater, which may also be one of the reasons for the observed trend of increasing icing areas.
The study results have significant implications for infrastructure planning and water resource management in permafrost regions. As climate warming continues to accelerate permafrost degradation, resulting in the expansion of taliks and increased groundwater discharge, it is crucial to consider these changes in the context of regional development. The increased surface area of icings, driven by enhanced groundwater supply, poses potential risks to infrastructure, such as roads, pipelines, and buildings, brought by the increased weight and thermal insulation effects of icings. Engineers and planners must account for the changing hydrological dynamics in these regions to ensure the resilience and sustainability of infrastructure. Moreover, understanding the relationship between groundwater dynamics and icing formation is essential for effective water resource management. To enhance the predictive capabilities and management strategies for permafrost regions, future research should focus on integrating high-resolution climate models and field observations. This would enable a more detailed understanding of the spatial and temporal variability of icing formation and its impact on regional hydrology. Additionally, exploring the long-term implications of permafrost degradation on groundwater–surface water interactions across different permafrost landscapes can provide valuable insights into adapting to climate-induced changes in permafrost regions.

Author Contributions

Conceptualization, M.Y.; Data curation, J.Z.; Methodology, M.Y.; Software, M.Y.; Validation, N.P.; Writing—original draft, M.Y.; Writing—review & editing, N.P. and C.D. All authors have read and agreed to the published version of the manuscript.

Funding

This research was funded by the Program of Foundation Scientific Research at the Melnikov Permafrost Institute of SB RAS, grant number 122012400106-7; China Scholarship Council, grant number 202008230159; Study on Deepening Cooperation between Heilongjiang and Russian Far East in the Context of “One Belt, One Road”, grant number 23XZT044.

Data Availability Statement

The original data presented in our study are openly available as follows: GRACE/GRACE-FO data from the Jet Propulsion Laboratory can be accessed at https://grace.jpl.nasa.gov/data/get-data/jpl_global_mascons (accessed on 15 October 2023). GRACE/GRACE-FO data from CSR can be accessed at https://www2.csr.utexas.edu/grace/RL06_mascons.html (accessed on 15 October 2023). GRACE/GRACE-FO data from GSFC can be accessed at https://earth.gsfc.nasa.gov/geo/data/grace-mascons (accessed on 15 October 2023). Soil moisture, snow water equivalent, and water storage data can be accessed at https://disc.gsfc.nasa.gov/datasets?keywords=GLDAS (accessed on 18 September 2023). Permafrost Probability and Distribution Data can be accessed at https://catalogue.ceda.ac.uk (accessed on 10 May 2024).

Acknowledgments

The authors express their deep gratitude to the funding agency for supporting this research.

Conflicts of Interest

The authors declare no conflicts of interest.

Abbreviations

GRACEGravity Recovery and Climate Experiment
GRACE-FOGravity Recovery and Climate Experiment Follow-On
GLDASGlobal Land Data Assimilation System
GWSAGroundwater Storage Anomaly
TDSTotal Dissolved Solids
GEEGoogle Earth Engine
JPLJet Propulsion Laboratory
CSRCenter for Space Research
GSFCGoddard Space Flight Center
GIAGlacial Isostatic Adjustment
EWTEquivalent Water Thickness
TWSATotal Water Storage Anomalies
SMASoil Moisture Anomaly
SWEASnow Water Equivalent Anomaly
CWSAClimate Water Stress Anomaly
CEDACentre for Environmental Data Analysis
IPAInternational Permafrost Association

References

  1. Jin, H.; Huang, Y.; Bense, V.F.; Ma, Q.; Marchenko, S.S.; Shepelev, V.V.; Hu, Y.; Liang, S.; Spektor, V.V.; Jin, X. Permafrost degradation and its hydrogeological impacts. Water 2022, 14, 372. [Google Scholar] [CrossRef]
  2. Gagarin, L.; Wu, Q.; Melnikov, A.; Volgusheva, N.; Tananaev, N.; Jin, H.; Zhang, Z.; Zhizhin, V. Morphometric analysis of groundwater icings: Intercomparison of estimation techniques. Remote Sens. 2020, 12, 692. [Google Scholar] [CrossRef]
  3. Kane, D.L. Physical mechanics of aufeis growth. Can. J. Civ. Eng. 1981, 8, 186–195. [Google Scholar] [CrossRef]
  4. Woo, M.K. Permafrost Hydrology; Springer Science & Business Media: Ontario, CA, USA, 2012. [Google Scholar] [CrossRef]
  5. Ghias, M.S.; Therrien, R.; Molson, J.; Lemieux, J.M. Controls on permafrost thaw in a coupled groundwater-flow and heat-transport system: Iqaluit Airport, Nunavut, Canada. Hydrogeol. J. 2017, 25, 657–673. [Google Scholar] [CrossRef]
  6. Van Everdingen, R.O. Multi-Language Glossary of Permafrost and Related Ground-Ice Terms in Chinese, English, French, German, Icelandic, Italian, Norwegian, Polish, Romanian, Russian, Spanish, and Swedish; International Permafrost Association, Terminology Working Group: Ottawa, CA, USA, 2005. [Google Scholar]
  7. Ensom, T.; Makarieva, O.; Morse, P.; Kane, D.; Alekseev, V.; Marsh, P. The distribution and dynamics of aufeis in permafrost regions. Permafr. Periglac. Process. 2020, 31, 383–395. [Google Scholar] [CrossRef]
  8. Crites, H.; Kokelj, S.V.; Lacelle, D. Icings and groundwater conditions in permafrost catchments of northwestern Canada. Sci. Rep. 2020, 10, 3283. [Google Scholar] [CrossRef]
  9. Morse, P.D.; Wolfe, S.A. Geological and meteorological controls on icing (aufeis) dynamics (1985 to 2014) in subarctic Canada. J. Geophys. Res. Earth Surf. 2015, 120, 1670–1686. [Google Scholar] [CrossRef]
  10. Turcotte, B.; Dubnick, A.; McKillop, R.; Ensom, T. Icing and aufeis in cold regions I: The origin of overflow. Can. J. Civ. Eng. 2023, 51, 93–108. [Google Scholar] [CrossRef]
  11. Yoshikawa, K.; Hinzman, L.D.; Kane, D.L. Spring and aufeis (icing) hydrology in Brooks Range, Alaska. J. Geophys. Res. Biogeosci. 2007, 112, G04S43. [Google Scholar] [CrossRef]
  12. Cheng, G.; Jin, H. Permafrost and groundwater on the Qinghai-Tibet Plateau and in northeast China. Hydrogeol. J. 2013, 21, 5–23. [Google Scholar] [CrossRef]
  13. Guo, L.; You, Y.; Yu, Q.; Shi, Z.; Li, H.; Wang, X. Field investigation on the influence of periglacial processes on pile foundations on the Qinghai–Tibet plateau. Permafr. Periglac. Process. 2021, 32, 335–348. [Google Scholar] [CrossRef]
  14. Gagarin, L.; Wu, Q.; Cao, W.; Jiang, G. Icings of the Kunlun Mountains on the northern margin of the Qinghai-Tibet Plateau, Western China: Origins, hydrology and distribution. Water 2022, 14, 2396. [Google Scholar] [CrossRef]
  15. Wrangel, F.P. A Journey to the Northern Shores of Siberia and along the Arctic Ocean Made in 1820–1924; Harper & Brothers: St. Petersburg, Russia, 1841. [Google Scholar]
  16. Mayde, G. On Taryns in Yakutskaya Oblast:Travels through NE Part of Yakutskaya Oblast from 1868–1870. Empyeral Acad. Sci. 1987, 2, 21–49. [Google Scholar]
  17. Tolstikhin, O. Icings and Ground Waters of North-East of USSR; Science: Novosibirsk, Russia, 1974. [Google Scholar]
  18. Hiyama, T.; Asai, K.; Kolesnikov, A.B.; Gagarin, L.A.; Shepelev, V.V. Estimation of the residence time of permafrost groundwater in the middle of the Lena River basin, eastern Siberia. Environ. Res. Lett. 2013, 8, 035040. [Google Scholar] [CrossRef]
  19. Yu, M.; Pavlova, N.; Dai, C.; Guo, X.; Zhang, X.; Gao, S.; Wei, Y. Simulation and Analysis of the Dynamic Characteristics of Groundwater in Taliks in the Eruu Area, Central Yakutia. Sustainability 2023, 15, 9590. [Google Scholar] [CrossRef]
  20. Pavlova, N.A.; Shepelev, V.V.; Galanin, A.A.; Efremov, V.S. Groundwater Hydrochemistry of Suprapermafrost–Intrapermafrost Flow in Their Discharge Areas in Central Yakutia. Water Resour. 2020, 47, 581–590. [Google Scholar] [CrossRef]
  21. Chesnokova, A.; Baraër, M.; Bouchard, É. Proglacial icings as records of winter hydrological processes. Cryosphere 2020, 14, 4145–4164. [Google Scholar] [CrossRef]
  22. Pollard, W.H. Icing processes associated with high arctic perennial springs, Axel Heiberg Island, Nunavut, Canada. Permafr. Periglac. Process. 2005, 16, 51–68. [Google Scholar] [CrossRef]
  23. Hansen, J.; Sato, M.; Ruedy, R. Long-term changes of the diurnal temperature cycle: Implications about mechanisms of global climate change. Atmos. Res. 1995, 37, 175–209. [Google Scholar] [CrossRef]
  24. Hall, D.K.; Roswell, C. The origin of water feeding icings on the eastern North Slope of Alaska. Polar Rec. 1981, 20, 433–438. [Google Scholar] [CrossRef]
  25. Gruber, S.; Haeberli, W. Permafrost in steep bedrock slopes and its temperature-related destabilization following climate change. J. Geophys. Res. Earth Surf. 2007, 112, F02S18. [Google Scholar] [CrossRef]
  26. Pavlova, N.A.; Kolesnikov, A.B.; Efremov, V.S.; Shepelev, V.V. Groundwater chemistry in intrapermafrost taliks in Central Yakutia. Water Resour. 2016, 43, 353–363. [Google Scholar] [CrossRef]
  27. Yoshikawa, K.; Kane, D.L. Permafrost Features and Talik Geometry in Hydrologic System; Springer: Victoria, CA, USA, 2021; pp. 409–440. [Google Scholar] [CrossRef]
  28. Woo, M.K. Linking runoff to groundwater in permafrost terrain. In Aining Groundwater Resources: A Critical Element in the Global Water Crisis; Springer: Dordrecht, The Netherlands, 2011; pp. 119–129. [Google Scholar] [CrossRef]
  29. Alekseyev, V. Cryogenesis and geodynamics of icing valleys. Geodyn. Tectonophys. 2015, 6, 171–224. [Google Scholar] [CrossRef]
  30. Humlum, O.; Instanes, A.; Sollid, J.L. Permafrost in Svalbard: A review of research history, climatic background and engineering challenges. Polar Res. 2003, 22, 191–215. [Google Scholar] [CrossRef]
  31. Scanlon, B.R.; Mace, R.E.; Barrett, M.E.; Smith, B. Can we simulate regional groundwater flow in a karst system using equivalent porous media models? Case study, Barton Springs Edwards aquifer, USA. J. Hydrol. 2003, 276, 137–158. [Google Scholar] [CrossRef]
  32. Connon, R.; Devoie, É.; Hayashi, M.; Veness, T.; Quinton, W. The influence of shallow taliks on permafrost thaw and active layer dynamics in subarctic Canada. J. Geophys. Res. Earth Surf. 2018, 123, 281–297. [Google Scholar] [CrossRef]
  33. Farquharson, L.M.; Romanovsky, V.E.; Kholodov, A.; Nicolsky, D. Sub-aerial talik formation observed across the discontinuous permafrost zone of Alaska. Nat. Geosci. 2022, 15, 475–481. [Google Scholar] [CrossRef]
  34. Woo, M.K.; Marsh, P. Snow, frozen soils and permafrost hydrology in Canada, 1999–2002. Hydrol. Process. Int. J. 2005, 19, 215–229. [Google Scholar] [CrossRef]
  35. Qin, J.; Ding, Y.; Shi, F.; Cui, J.; Chang, Y.; Han, T.; Zhao, Q. Links between seasonal suprapermafrost groundwater, the hydrothermal change of the active layer, and river runoff in alpine permafrost watersheds. Hydrol. Earth Syst. Sci. 2024, 28, 973–987. [Google Scholar] [CrossRef]
  36. Harris, S.A.; Corte, A.E. Interactions and relations between mountain permafrost, glaciers, snow and water. Permafr. Periglac. Process. 1992, 3, 103–110. [Google Scholar] [CrossRef]
  37. Kane, D.L.; Yoshikawa, K.; McNamara, J.P. Regional groundwater flow in an area mapped as continuous permafrost, NE Alaska (USA). Hydrogeol. J. 2013, 21, 41–52. [Google Scholar] [CrossRef]
  38. Yu, W.B.; Guo, M.; Lai, Y.M.; Liu, Z.Q.; Li, Q.H. Icing Problems on Road and Mitigation Methods in China; American Society of Civil Engineers: Reston, VA, USA, 2006; pp. 1–11. [Google Scholar] [CrossRef]
  39. Alekseev, V.R. Aufeis areas in river valleys: Engineering development problems. Earth’s Cryosphere 2017, 21, 56–64. [Google Scholar] [CrossRef]
  40. Alekseev, V.; Makarieva, O.; Shikhov, A.; Nesterova, N.; Zemlyanskova, A.; Ostashov, A. Giant Taryn Aufeis in the Northeast of Russia. Geogr. Nat. Resour. 2023, 44, 253–259. [Google Scholar] [CrossRef]
  41. Olenchenko, V.; Makarieva, O.; Zemlianskova, A.; Ostashov, A.; Kalganov, A.; Chekryzhov, A. Geocryological Conditions of the Formation of Giant Spring Aufeis at the Anmangynda River (magadan Region) According to Geophysical Data. Geodyn. Tectonophys. 2024, 15, 0753. [Google Scholar] [CrossRef]
  42. Ye, Q.; Wang, Y.; Liu, L.; Guo, L.; Zhang, X.; Dai, L.; Zhai, L.; Hu, Y.; Ali, N.; Ji, X. Remote Sensing and Modeling of the Cryosphere in High Mountain Asia: A Multidisciplinary Review. Remote Sens. 2024, 16, 1709. [Google Scholar] [CrossRef]
  43. Semernya, A.A.; Gagarin, L.A.; Bazhin, K.I. Cryohydrogeological features of the site of intrapermafrost aquifer distribution at the Eruu spring area (central Yakutia). Cryos Earth 2018, 22, 29–38. [Google Scholar] [CrossRef]
  44. Brombierstäudl, D.; Schmidt, S.; Nüsser, M. Distribution and relevance of aufeis (icing) in the Upper Indus Basin. Sci. Total Environ. 2021, 780, 146604. [Google Scholar] [CrossRef]
  45. Galanin, A.A. Late quaternary sand covers of Central Yakutia (Eastern Siberia): Structure, facies composition and paleo-environment significance. Earth’s Cryosphere 2021, 25, 3–34. [Google Scholar] [CrossRef]
  46. Kut, A.; Woronko, B.; Spektor, V.; Klimova, I. Grain-surface microtextures in deposits affected by periglacial conditions (Abalakh High-Accumulation Plain, Central Yakutia, Russia). Micron 2021, 146, 103067. [Google Scholar] [CrossRef]
  47. Mateo-García, G.; Gómez-Chova, L.; Amorós-López, J.; Muñoz-Marí, J.; Camps-Valls, G. Multitemporal cloud masking in the Google Earth Engine. Remote Sens. 2018, 10, 1079. [Google Scholar] [CrossRef]
  48. Hendriks, J.P. Semi-automatic glacier delineation from Landsat imagery over Hintereisferner in the Austrian Alps. Z. Gletscherkd. Glazialgeol. 2007, 41, 55. [Google Scholar]
  49. Hall, D.K.; Riggs, G.A.; Salomonson, V.V. Development of methods for mapping global snow cover using moderate resolution imaging spectroradiometer data. Remote Sens. Environ. 1995, 54, 127–140. [Google Scholar] [CrossRef]
  50. Wang, Y.; Wang, J. Monitoring Snow Cover in Typical Forested Areas Using a Multi-Spectral Feature Fusion Approach. Atmosphere 2024, 15, 513. [Google Scholar] [CrossRef]
  51. Motiee, S.; Motiee, H.; Ahmadi, A. Analysis of rapid snow and ice cover loss in mountain glaciers of arid and semi-arid regions using remote sensing data. J. Arid. Environ. 2024, 222, 105153. [Google Scholar] [CrossRef]
  52. McFeeters, S.K. The use of the Normalized Difference Water Index (NDWI) in the delineation of open water features. Int. J. Remote Sens. 1996, 17, 1425–1432. [Google Scholar] [CrossRef]
  53. Bolch, T.; Kulkarni, A.; Kääb, A.; Huggel, C.; Paul, F.; Cogley, J.G.; Frey, H.; Kargel, J.S.; Fujita, K.; Scheel, M. The state and fate of Himalayan glaciers. Science 2012, 336, 310–314. [Google Scholar] [CrossRef]
  54. Ge, S.; McKenzie, J.; Voss, C.; Wu, Q. Exchange of groundwater and surface-water mediated by permafrost response to seasonal and long term air temperature variation. Geophys. Res. Lett. 2011, 38, L14402. [Google Scholar] [CrossRef]
  55. Katpatal, Y.B.; Rishma, C.; Singh, C.K. Sensitivity of the Gravity Recovery and Climate Experiment (GRACE) to the complexity of aquifer systems for monitoring of groundwater. Hydrogeol. J. 2018, 26, 933–943. [Google Scholar] [CrossRef]
  56. Huang, Z.; Pan, Y.; Gong, H.; Yeh, P.J.; Li, X.; Zhou, D.; Zhao, W. Subregional-scale groundwater depletion detected by GRACE for both shallow and deep aquifers in North China Plain. Geophys. Res. Lett. 2015, 42, 1791–1799. [Google Scholar] [CrossRef]
  57. Obu, J.; Westermann, S.; Barboux, C.; Bartsch, A.; Delaloye, R.; Grosse, G.; Heim, B.; Hugelius, G.; Irrgang, A.; Kääb, A. ESA Permafrost Climate Change Initiative (Permafrost_cci): Permafrost Extent for the Northern Hemisphere, v3.0; The Centre for Environmental Data Analysis, RAL Space: Didcot, UK, 2021. [Google Scholar] [CrossRef]
  58. Obu, J.; Westermann, S.; Bartsch, A.; Berdnikov, N.; Christiansen, H.H.; Dashtseren, A.; Delaloye, R.; Elberling, B.; Etzelmüller, B.; Kholodov, A. Northern Hemisphere permafrost map based on TTOP modelling for 2000–2016 at 1 km2 scale. Earth-Sci. Rev. 2019, 193, 299–316. [Google Scholar] [CrossRef]
  59. Romanovsky, V.; Osterkamp, T. Permafrost: Changes and impacts. In Permafrost Response on Economic Development, Environmental Security and Natural Resources; Springer: Dordrecht, The Netherlands, 2001; pp. 297–315. [Google Scholar] [CrossRef]
  60. Walvoord, M.A.; Kurylyk, B.L. Hydrologic impacts of thawing permafrost—A review. Vadose Zone J. 2016, 15, vzj2016.01.0010. [Google Scholar] [CrossRef]
  61. Shur, Y.L.; Jorgenson, M.T. Patterns of permafrost formation and degradation in relation to climate and ecosystems. Permafr. Periglac. Process. 2007, 18, 7–19. [Google Scholar] [CrossRef]
  62. St. Jacques, J.M.; Sauchyn, D.J. Increasing winter baseflow and mean annual streamflow from possible permafrost thawing in the Northwest Territories, Canada. Geophys. Res. Lett. 2009, 36, L01401. [Google Scholar] [CrossRef]
  63. Wright, N.; Hayashi, M.; Quinton, W.L. Spatial and temporal variations in active layer thawing and their implication on runoff generation in peat-covered permafrost terrain. Water Resour. Res. 2009, 45, W05414. [Google Scholar] [CrossRef]
  64. Jorgenson, M.T.; Shur, Y. Evolution of lakes and basins in northern Alaska and discussion of the thaw lake cycle. J. Geophys. Res. Earth Surf. 2007, 112, F02S17. [Google Scholar] [CrossRef]
  65. Frey, K.E.; McClelland, J.W. Impacts of permafrost degradation on arctic river biogeochemistry. Hydrol. Process. Int. J. 2009, 23, 169–182. [Google Scholar] [CrossRef]
  66. Romanovsky, V.E.; Drozdov, D.; Oberman, N.G.; Malkova, G.; Kholodov, A.L.; Marchenko, S.; Moskalenko, N.G.; Sergeev, D.; Ukraintseva, N.; Abramov, A. Thermal state of permafrost in Russia. Permafr. Periglac. Process. 2010, 21, 136–155. [Google Scholar] [CrossRef]
  67. Schuur, E.A.; Bockheim, J.; Canadell, J.G.; Euskirchen, E.; Field, C.B.; Goryachkin, S.V.; Hagemann, S.; Kuhry, P.; Lafleur, P.M.; Lee, H. Vulnerability of permafrost carbon to climate change: Implications for the global carbon cycle. BioScience 2008, 58, 701–714. [Google Scholar] [CrossRef]
  68. Muskett, R.R.; Romanovsky, V.E. Alaskan permafrost groundwater storage changes derived from GRACE and ground measurements. Remote Sens. 2011, 3, 378–397. [Google Scholar] [CrossRef]
  69. Lamontagne-Hallé, P.; McKenzie, J.M.; Kurylyk, B.L.; Zipper, S.C. Changing groundwater discharge dynamics in permafrost regions. Environ. Res. Lett. 2018, 13, 084017. [Google Scholar] [CrossRef]
Figure 1. Location of the study area.
Atmosphere 15 01022 g001
Figure 2. Icings identification process.
Atmosphere 15 01022 g002
Figure 3. GWSA calculation process for icings’ extents in Central Yakutia, Russia.
Atmosphere 15 01022 g003
Figure 4. Dynamic changes in the surface area of icings on the Bestyakh Terrace on the northeast side of the Lena River in Central Yakutia, Russia, from 2002 to 2022.
Atmosphere 15 01022 g004
Figure 5. Probability of the occurrence of icings in Central Yakutia from 2002 to 2022.
Atmosphere 15 01022 g005
Figure 6. Dynamic changes in GWSA on the Bestyakh Terrace on the northeast side of the Lena River in Central Yakutia, Russia, from 2002 to 2022.
Atmosphere 15 01022 g006
Figure 7. Spatial variation characteristics of interannual GWSA on the Bestyakh Terrace on the northeast side of the Lena River in Central Yakutia, Russia during the icing growth period (from the October of the current year to the May of the following year) from 2002 to 2022 (AT) (a. Buluus, b. Keturen, c. Byatei, d. Mendensky, e. Unugestyakh, f. Muocmakh, g. Ulakhan-Taryn, h. Dzholokh, i. Eruu, and j. Yutelir).
Atmosphere 15 01022 g007aAtmosphere 15 01022 g007b
Figure 8. Changes in monthly average and minimum air temperatures and the duration of icing growth on the Bestyakh Terrace on the northeast side of the Lena River in Central Yakutia, Russia, from 2002 to 2022 (the solid line represents monthly average temperatures, scattered points represent monthly minimum temperatures during the icing growth period, and shaded areas represent the icing growth period).
Atmosphere 15 01022 g008
Figure 9. Changes in the monthly precipitation and monthly average atmospheric freezing index on the Bestyakh Terrace on the northeast side of the Lena River in Central Yakutia, Russia, from 2002 to 2022 (the solid line represents monthly precipitation, scattered points represent monthly average atmospheric freezing index during the icing growth period, and shaded areas represent the icing growth period).
Atmosphere 15 01022 g009
Figure 10. Heatmap depicting the correlation between the maximum surface area of icings on the Bestyakh Terrace on the northeast side of the Lena River in Central Yakutia, Russia, from 2002 to 2022, and the mean GWSAs for different periods (redder shades indicate a higher correlation and bluer shades indicate a lower or even negative correlation).
Atmosphere 15 01022 g010
Figure 11. Heatmap depicting the correlation between the maximum surface area of icings and precipitation, freezing duration, and negative accumulated temperatures on the Bestyakh Terrace on the northeast side of the Lena River in Central Yakutia, Russia, from 2002 to 2022 (redder shades indicate a higher correlation and bluer shades indicate a lower or even negative correlation).
Atmosphere 15 01022 g011
Figure 12. Permafrost coverage (A,B) and annual trends in permafrost occurrence probability (C) from 2002 to 2019 on the Bestyakh Terrace on the northeast side of the Lena River in Central Yakutia, Russia (a. Buluus, b. Keturen, c. Byatei, d. Mendensky, e. Unugestyakh, f. Muocmakh, g. Ulakhan-Taryn, h. Dzholokh, i. Eruu, j. Yutelir).
Atmosphere 15 01022 g012
Table 1. Mascon Product Parameters.
JPLCSRGSFC
Data Sourcehttps://grace.jpl.nasa.gov/data/get-data/jpl_global_mascons (accessed on 15 October 2023)https://www2.csr.utexas.edu/grace/RL06_mascons.html (accessed on 15 October 2023)https://earth.gsfc.nasa.gov/geo/data/grace-mascons (accessed on 15 October 2023)
Grid ShapeCap-shapedHexagonalSquare
Spatial Resolution0.5° × 0.5°0.25° × 0.25°0.5° × 0.5°
Temporal Interval1 month1 month1 month
xternal Physical Model Prior ConstraintYesNoYes
Data TypeL1B inter-satellite distances and GPS dataLevel 2 spherical harmonic coefficients dataL1B inter-satellite distances and GPS data
Table 2. Proportions of different icing frequencies (“Infrequent” refers to areas with 1–7 icing events, “Intermittent” to 8–14 events, and “Frequent” to 15–21 events) in the study area from 2002 to 2022.
LocationArea (km2)Infrequent (%)Intermittent (%)Frequent (%)
Buluus0.60 ± 0.04 km233.2218.2348.55
Keturen1.00 ± 0.11 km261.5226.3212.16
Byatei0.35 ± 0.03 km244.8452.442.72
Mendensky0.23 ± 0.02 km231.1816.3652.46
Unugestyakh2.18 ± 0.15 km235.7117.9646.33
Muocmakh0.61 ± 0.12 km278.0219.262.72
Ulakhan-Taryn1.69 ± 0.23 km253.4914.5831.93
Dzholokh0.20 ± 0.04 km268.6727.623.71
Eruu0.66 ± 0.05 km236.4521.9441.61
Yutelir0.18 ± 0.01 km230.1618.8650.98
Disclaimer/Publisher’s Note: The statements, opinions and data contained in all publications are solely those of the individual author(s) and contributor(s) and not of MDPI and/or the editor(s). MDPI and/or the editor(s) disclaim responsibility for any injury to people or property resulting from any ideas, methods, instructions or products referred to in the content.

