Article

Qualitative and Quantitative Analyses of Automotive Exhaust Plumes for Remote Emission Sensing Application Using Gas Schlieren Imaging Sensor System

Institute of Electrical Measurement and Sensor Systems, Graz University of Technology, 8010 Graz, Austria
*
Author to whom correspondence should be addressed.
Atmosphere 2024, 15(9), 1023; https://doi.org/10.3390/atmos15091023
Submission received: 30 June 2024 / Revised: 5 August 2024 / Accepted: 9 August 2024 / Published: 23 August 2024
(This article belongs to the Special Issue Transport Emissions and Their Environmental Impacts)

Abstract

:
Remote emission sensing (RES) is a state-of-the-art technique for monitoring thousands of vehicles on the road every day to detect high emitters. Modern commercial RES systems use absorption spectroscopy to measure the ratio of pollutants to CO2 from vehicle exhaust gases. In this work, we present an approach to enable direct concentration measurements by spectroscopic techniques in RES through measurement of the absorption path length. Our gas schlieren imaging sensor (GSIS) system operates on the principle of background-oriented schlieren (BOS) imaging in combination with advanced image processing and deep learning techniques to calculate detected exhaust plume sizes. We performed a qualitative as well as a quantitative analysis of vehicle exhaust and plume dimensions with the GSIS system. We present the system details and results from the GSIS system in the lab in comparison to a BOS model based on flow simulations, the results from characterization measurements in the lab with defined gas mixtures and temperatures, and the results from measurements on the road from different vehicles.

1. Introduction

Air pollution is a serious long-term public health issue, and on-road traffic emissions contribute significantly to air pollution, especially in urban areas. Emissions per vehicle have been significantly reduced due to stricter emission limits in the vehicle homologation process. In addition, Europe (EU) is taking significant measures to limit the use of internal combustion engine (ICE) vehicles as passenger cars. Although stricter emission limits and the limited use of ICE passenger cars have reduced on-road emissions, there is still a large number of high-emitting vehicles that contribute significantly to air pollution. Approximately 90% of road pollution is caused by 15% of high-emitting vehicles [1], and ICE vehicles will be on the road for at least 30 years [2]. Thus, there is a need to monitor ICE vehicles in traffic for conformity in exhaust aftertreatment system operation and the identification of high emitters in order to maintain compliant ICE vehicles and further reduce on-road emissions and air pollution.
There are many commercial gas analyzers that can measure direct concentrations of pollutants in vehicle exhaust in ppm. However, these systems are either very expensive or cannot be used for remote emission measurements. Portable emissions measurement systems (PEMSs) have been used for years to measure gaseous pollutants directly from the tailpipes of vehicles. In 2017, Gastaldi et al. used a PEMS for the on-road measurement of CO2 vehicle emissions under complex traffic conditions [3]. In 2024, Zhao et al. evaluated CO2 and NOx emissions from container diesel trucks with a PEMS [4]. However, though PEMSs are highly accurate systems, they are expensive and can only be used after they have been installed on a vehicle. Another state-of-the-art technique used to screen real-world vehicle emissions is point sampling using gas analyzers. In this technique, gas analyzers are placed on the road side, and a sampling line/tube connected to the gas analyzers is placed on the road that sucks the exhaust of the passing vehicles for emissions measurement. In 2024, Knoll et al. evaluated the point sampling method for screening real-world car emissions [5]. They used ICAD from Airyx GmbH with an integrated non-dispersive infrared (NDIR) system to quantify CO2. The gas analyzers mostly used in point sampling are also expensive, and the sampling line should be positioned according to the height of the tailpipe of the passing vehicles.
Remote emission sensing (RES) is a state-of-the-art technique used to monitor thousands of passing vehicles under real-world conditions with roadside measurements with the aim of verifying compliant operation. In order to be able to compare the relevant pollutants in vehicle exhausts, e.g., CO, CO2, NO, NO2, NH3, and HC, from the RES measurements with the type approval data, emission factors are calculated for the individual vehicles. Modern RES systems use absorption spectroscopy to measure the ratio of pollutants to CO2 from the vehicle exhaust. The pollutant-to-CO2 ratios can be converted into fuel-specific and distance-specific emission factors in g/kg and g/km, respectively. These can then be checked against specific type approval data from a database to verify compliance with vehicle type limits.
In 1989, a team of researchers from the University of Denver reported the first operational RES system [6], and its usage for the remote sensing of carbon monoxide (CO) and three-way catalyst cars was reported in 1991 and 1994, respectively [7,8]. This system is also called FEAT (fuel efficiency automobile test). In 1992, remote sensing technology was used to develop a commercial RES device called RSD-1000, which was specified in a patent in 1998 [9]. The Hughes missile systems company also developed an RES sensor for comparison with an onboard vehicle emission sensing instrument in 1995 [10]. Several commercial RES devices were subsequently developed but failed to penetrate the market. Two commercialized RES devices are mostly used in most of the RES measurement campaigns around the world. The first device is RSD, developed by OPUS Group AB. It is the same device pioneered by Bishop and Stedman from the University of Denver. It was later commercialized by Accuscan, Envirotest and, currently, OPUS RSE. It is the latest RES system from OPUS RSE that uses non-dispersive IR spectroscopy and UV ultraviolet spectroscopy as the optical method [11,12,13,14]. The second most usable RES device of today is the emission detection and reporting (EDAR) system commercialized by Hager environment and atmospheric technologies (HEAT). This system uses differential absorption LiDAR spectroscopy to measure the concentration of pollutants in a vehicle’s smoke [14,15,16,17]. The state-of-the-art RES devices calculate only fuel-based and distance-based emission factors [18]. To the best of our knowledge, no RES devices have used gas imaging techniques to measure the size of the vehicle exhaust plume and to derive the absorption path length to calculate the concentration of pollutants.
Commercially available approaches used to visualize vehicle exhaust plumes include optical gas imaging (OGI) cameras. OGI cameras are limited to certain wavelength ranges and are based on quantum detectors. Such systems also require a cooling system to reduce noise, as these cameras operate in the mid-infrared range. The commercially available OGI systems are very expensive and complex to use in RES systems; furthermore, high-end spectroscopic techniques, which would benefit from this additional information, are already complex to implement.
In this work, we present a viable, robust, and cost-effective gas schlieren imaging sensor (GSIS) system based on background-oriented schlieren (BOS) imaging, which is a well-known method for analyzing fluid flows by using variations in the refractive index.
Schlieren are optical irregularities that cannot be observed with the human eye. The first observation record is from 1665 by Robert Hooke [19]. He observed the disturbance of thermal air against the light–dark boundary. After a decade, Christiaan Huygens proposed a reinvention of Hooke’s candle-illuminated schlieren technique [20]. August Toepler applied Foucault’s knife-edge test [21] to analyze fluid flows and shock waves in 1864 [22]. He named this technique “Schlieren photography”. In 1934, Hubert Schardin presented solid theoretical knowledge of schlieren imaging and the refraction measurement that causes the schlieren effect [23]. BOS imaging was presented simultaneously in 1999 by Sutherland et al. [24] and Gerd EA Meier [25], also called synthetic schlieren. In 2000, Raffel et al. presented the BOS principle using a random dot pattern to visualize the rotor wake of a helicopter [26]. In the same year, Richard et al. presented the calculation of the density field using 2D BOS and the Poisson equation [27]. In 2004, Elsinga et al. evaluated BOS and color schlieren and clarified the accuracy of the techniques [28]. Popova et al. investigated the accuracy of BOS in 2008 [29]. In 2009, Yevtikhiyeva et al. investigated errors in the BOS methodology [30]. Schröder et al. introduced an improved tomographic BOS technique for measuring density fields in nozzle plumes in the same year [31]. In 2011, M.J. Hargather and G.S. Settles used BOS techniques to visualize heating and ventilation flows [32], and in 2012, they presented a quantitative BOS technique for hot plates [33]. Mizukaki et al. presented BOS with a natural background for the quantitative visualization of outdoor explosions in 2012 [34]. M. Raffel presented a detailed analysis of BOS techniques in 2015 and highlighted the main components and essential parameters for the BOS setup [35]. The same year, Nicolas et al. presented a direct approach to the 3D density field reconstruction of a candle flame using BOS [36]. In 2017, M. Hargather and G.S. Settles reviewed recent developments in schlieren methods [37]. Aminfar et al. used BOS to visualize convection in spreading wildland fires in 2019 [38]. Direct BOS tomography of hot air flow using radial basis functions was introduced by Cai et al. in 2022 [39]. In 2013, Amjad et al. presented a 3D density measurement of heated jet laser speckle tomographic BOS [40]. Reconstruction of 3D turbulent flames using BOS was presented in 2023 by Gao et al. [41]. The state-of-the-art shows that the BOS technique has been used in various applications. Nevertheless, to our knowledge, RES devices have not been employed to measure the dimensions of vehicle exhaust plumes to calculate the concentration of pollutants.
Our GSIS system provides qualitative and quantitative analyses of vehicle exhaust and plume dimensions. Its performance and detection limit are investigated and characterized in the lab with defined gas mixtures, and the results are compared to a simulation model. Furthermore, results from on-road measurements are also shown.

2. Materials and Methods

2.1. GSIS System

The GSIS system comprises a 12.3 MP Raspberry Pi HQ camera with a Sony IMX-477R sensor. The HQ camera is manufactured by the Raspberry Pi Foundation, headquartered in Cambridge, England. The IMX-477R sensor is manufactured by Sony Semiconductor Solutions Corporation, located in Atsugi, Japan. The sensor has a maximum resolution of 4056 (H) × 3040 (V) and a single pixel size of 1.5 μm (H) × 1.5 μm (V). Its output format is 8/10/12 bit RAW. Its focus is adjustable. Affixing lenses of varying focal lengths to the C/CS mount is possible. The camera functions within the visible light wavelength range of from 350 to 750 nm. The device is equipped with a rolling shutter. It can read 840 million pixels per second, thereby enabling it to capture up to 15 to 240 frames per second, per resolution. The other components include a Raspberry Pi 4B as a control unit for the camera, a pattern board as a BOS background, and a PC with an external GeForce RTX-3080 GPU for fast implementation of image processing and exhaust detection algorithms. The Raspberry Pi 4B is also manufactured by the Raspberry Pi Foundation. The GPU GeForce RTX-3080 is manufactured by NVIDIA, which is located in Santa Clara, California, United States.
The camera is focused on the background; the actual distance between the background and the camera depends on the setup, as described below. An image of the background without disturbance is taken as the reference image, as indicated by the blue line in Figure 1. The light rays from the camera travel along the z-axis. A second image is captured when the object of interest, in our case, the exhaust plume, is present between the camera and the background, as indicated by the red line in Figure 1. The plume causes a deflection (εy), according to the refractive index of the plume (n), as shown in Equation (1), where n0 is the refractive index of air. This deflection angle causes a shift (∆y) in the image plane. The difference between the reference image and the second image gives the schlieren image and, thus, information about the object of interest.
ε y = 1 n 0 n y d z

2.2. On-Road Measurements

The GSIS system was installed horizontally on the road at the Graz University of Technology Inffelgasse campus, considering that the RES system should be implemented with a top-down setup. The RES system we refer to in this work, which is operated with the GSIS system presented here, was developed at Graz University of Technology and will be presented in another publication. It uses Tunable Diode Laser Absorption Spectroscopy (TDLAS) to measure pollutants. The GSIS on-road setup can be seen in Figure 2. A camera and a pattern were located on opposite sides of the road. Light barriers, consisting of an IR transmitter and receiver, were installed to detect passing cars and trigger the recording. Images were taken with 60 fps with 1920 × 1080 pixels. The pattern board used a random dot pattern with approximately 700,000 dots on a 1.5 m × 1.5 m wooden board. Thus, the camera resolution was about three times the number of dots on the pattern board [35]. The distance between the camera and the pattern board (DCB) was 5 m. The camera had a lens with a focal length (f) of 16 mm to focus on the pattern board. The distance between the camera and the vehicle is denoted as DCV, and the distance between the vehicle and the background pattern board is denoted as DVB, as shown in Figure 2 below. The displacement (∆y) in the image plane is contingent upon the deflection angle (depending on the refractive index of the medium) and the geometric and optical parameters of the setup. It increases by increasing f and decreasing DCV, as shown in Equation (4). [42]. The geometric and optical parameters can be presented as the sensitivity (S), as shown in Equation (5). In practice, DCV should be slightly greater than DVB because if the object moves closer to the camera, a more significant depth of field is required to focus on the background [43]. A LiDAR sensor (Garmin LIDAR-Lite V3) was used to measure the distance between the camera and the passing vehicle. The sensor is manufactured by Garmin Ltd., located in Olathe, KS, USA. All components were connected to one Raspberry Pi 4B as the central system control. The control unit was connected to the main server PC.
Assuming small deflection angles (εy ≈ tan εy) and paraxial measurements, the formula for the displacement in the image plane (∆y) can be derived [33]. Figure 1 illustrates the relationship between the deflection angle and the displacement on the pattern board in Equation (2).
εy = ∆y/M × DVB
M is the magnification factor of the background, which depends on the focal length (DI = f) and the distance to the pattern board, as expressed in Equation (3).
M = DI/DCB
The relationship between the deflection angle and displacement in the image plane can be rewritten, as illustrated in Equation (4).
∆y = f × (DVB/DVB + DCV-f) × εy
The geometric and optical parameters can be represented as S, which shows the setup’s sensitivity. The sensitivity of the GSIS setup can be optimized by selecting appropriate geometric and optical parameters. Hence, the displacement and deflection angle can be directly related to each other, with S as a proportional constant.
S = f × (DVB/DVB + DCV-f)
∆y = S × εy

2.3. Laboratory Characterization

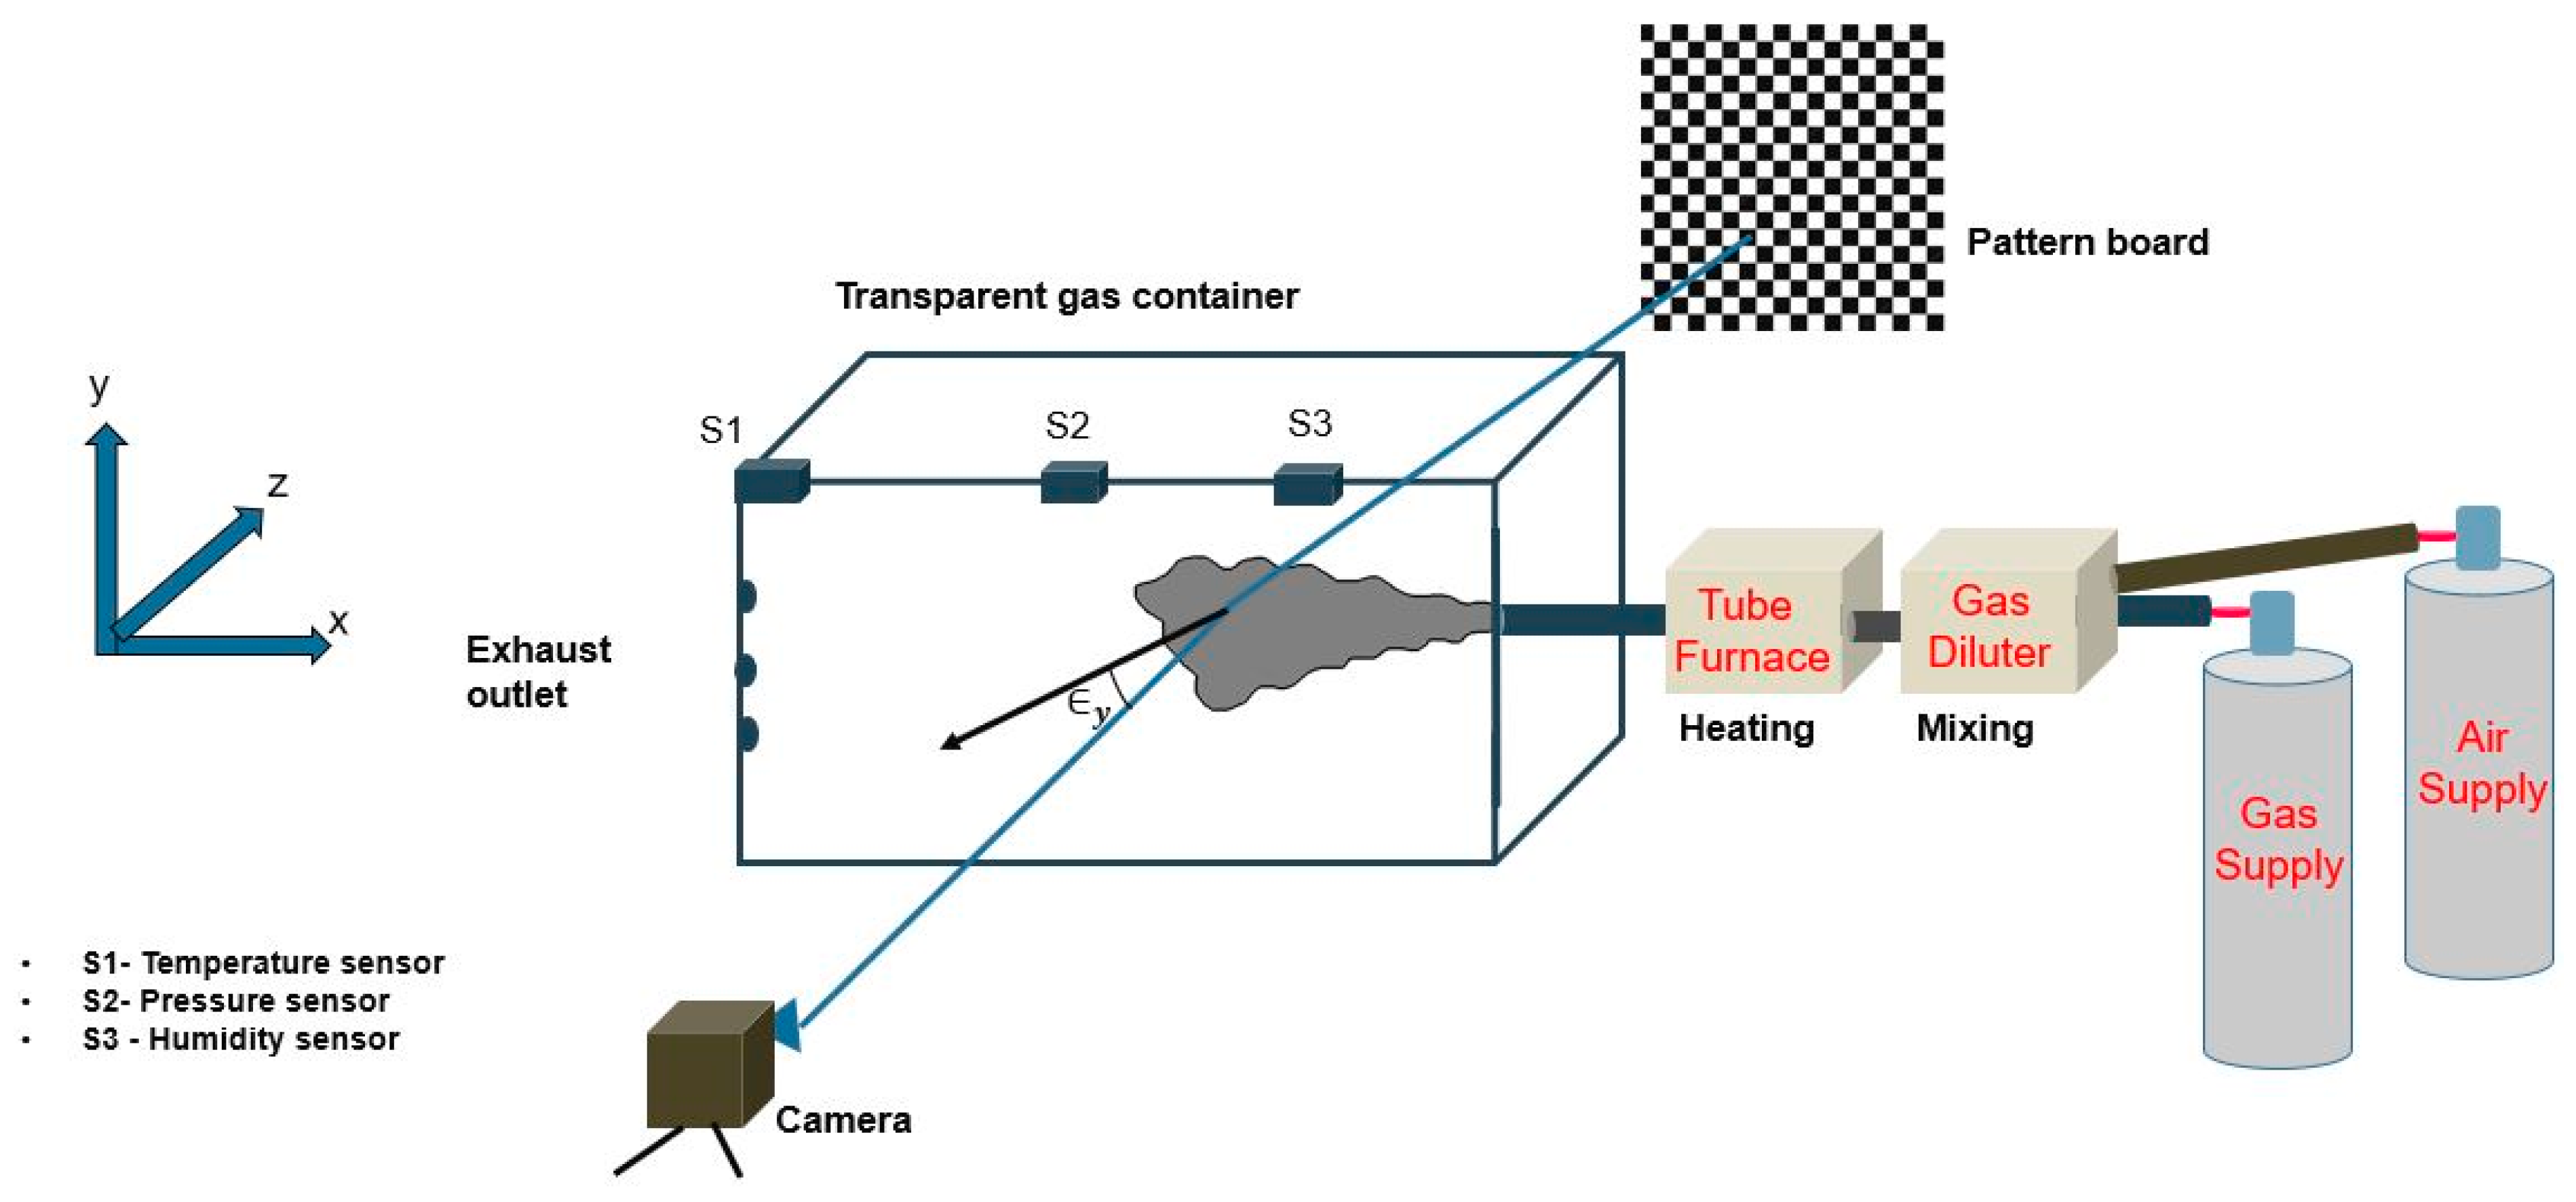
Figure 3 shows a schematic of the laboratory setup. The setup comprised a transparent cubic box measuring 100 × 60 × 60 cm (length × width × height), constructed from 5 mm thick acrylic plates. Gas was supplied from pressurized gas bottles and injected into the box at a rate of 6 L/min through the inlet. A tube furnace was used to vary the gas temperature for testing purposes, while a gas diluter was employed to control the concentrations. The tube furnace is manufactured by Carbolite Gero GmbH & Co. KG, headquartered in Neuhausen, Germany. Temperature, pressure, and humidity sensors were positioned inside the box near the outlet. The camera was located on one side of the box and the pattern board on the other, in such a way that the cameras focused on the pattern board. Images were taken with 90 fps with 640 × 480 pixels.
The lab setup employed the GSIS system to measure the carbon dioxide (CO2) detection limit. The test results were compared with the simulation results. The real lab setup is shown in Figure S1.

2.4. Image Processing and Exhaust Plume Detection

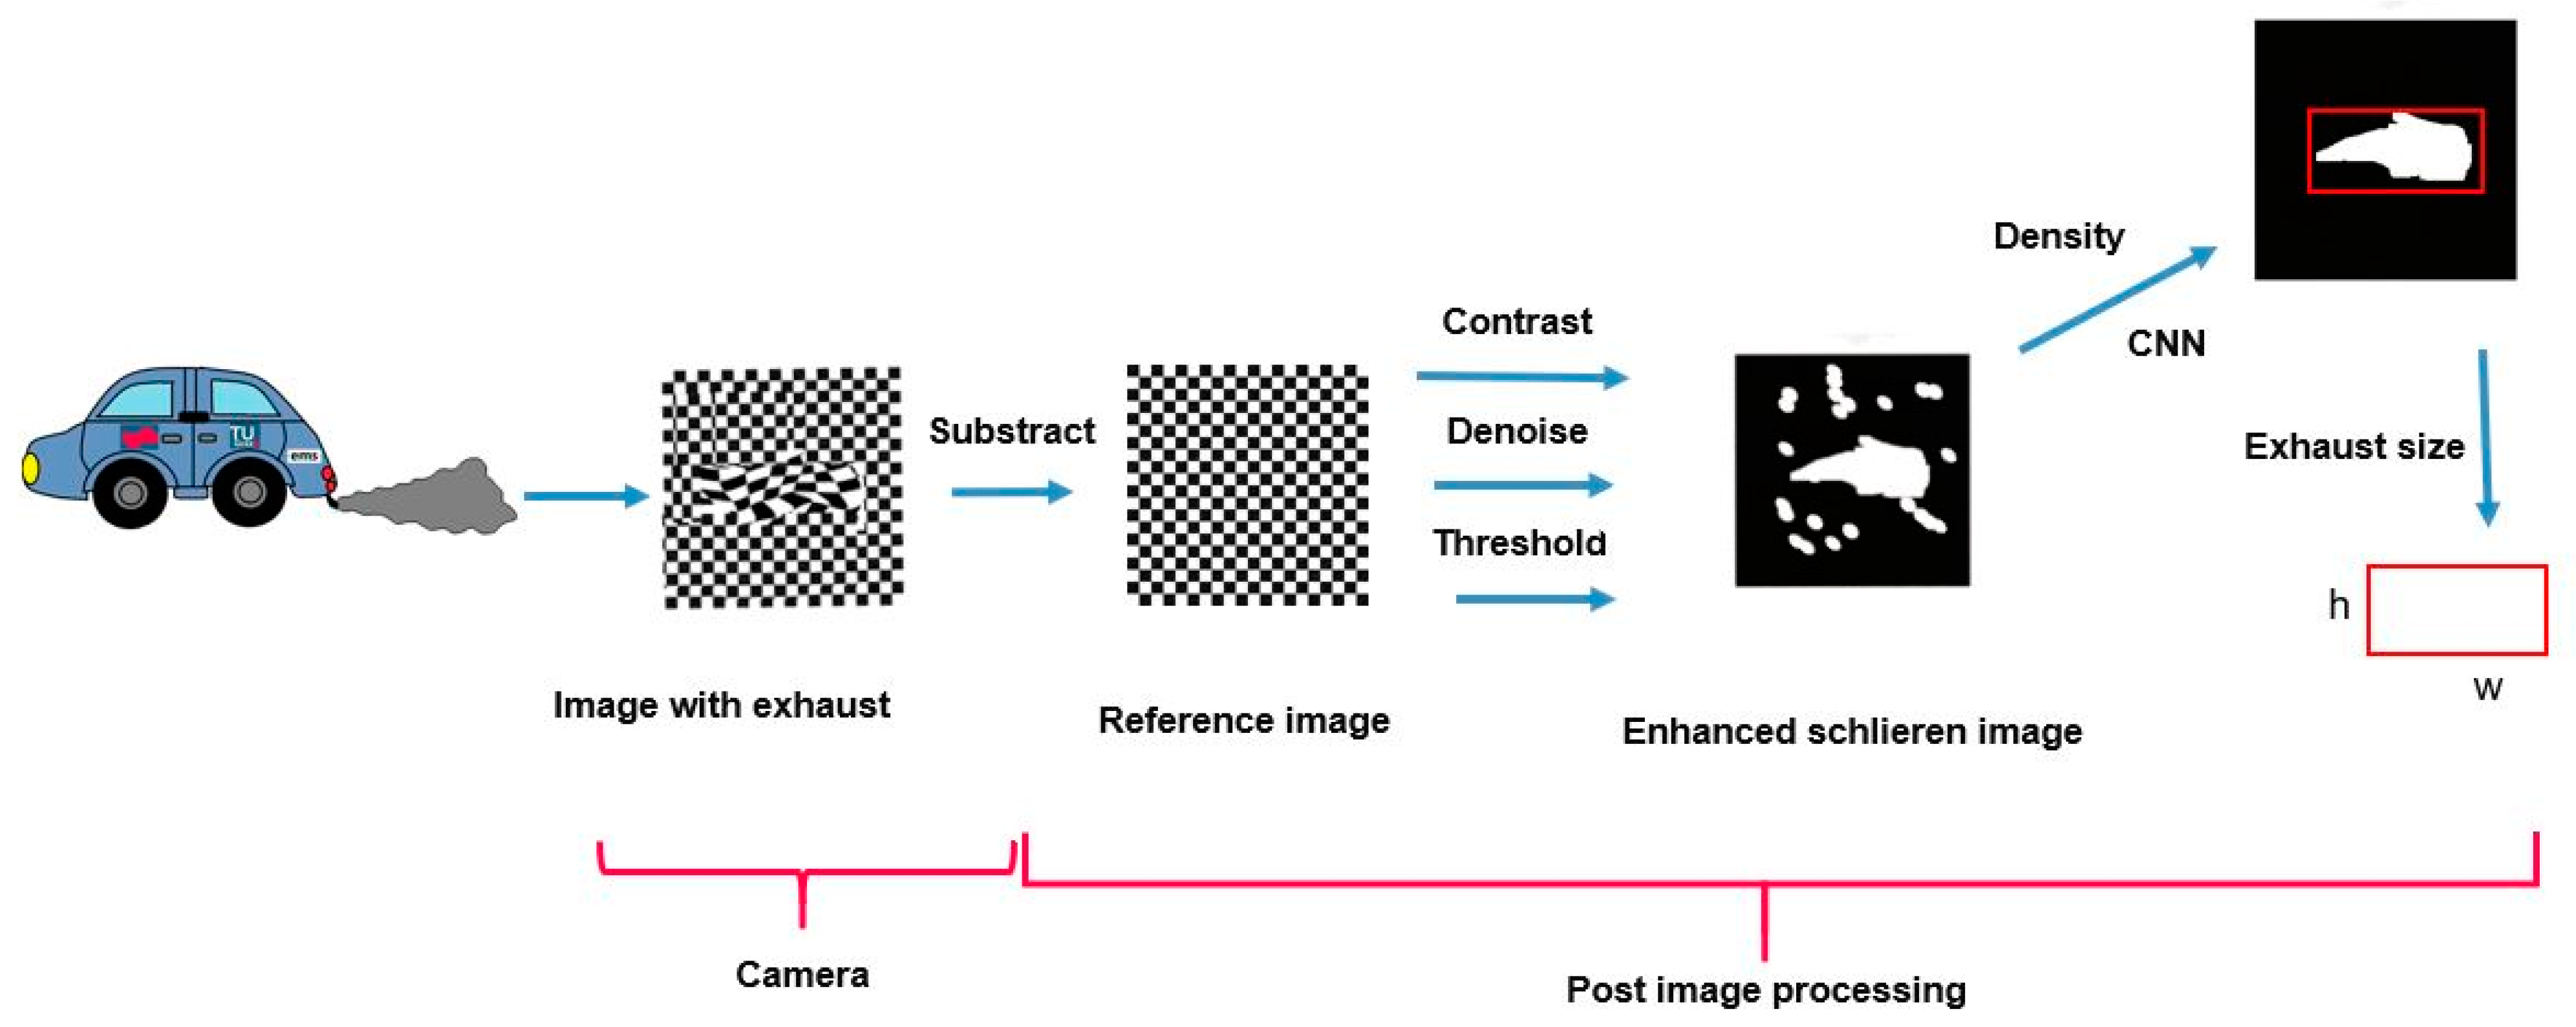
The reference and displaced images were sent to the main server via network file sharing. The central server executed the image processing and object detection steps. Firstly, the images were converted to greyscale. The schlieren images were produced by subtracting the reference images from the disturbed images and applying denoising filters to remove extra noise. For subtraction, each pixel in the distorted image was subtracted from the pixel at the same position in the reference image. Afterwards, the image was normalized to increase the image’s contrast and give maximum weight to the most shifted pixels. Then, blurring was applied to all pixels to remove noise. Finally, thresholding was used to assign white color to the shifted pixels and black color to the rest of the image, as shown in Figure 4. We call the generated images enhanced schlieren images. In the next step, bounding boxes were created around the exhaust plume by using the two methods described below.

2.4.1. Exhaust Plume Detection with Density

The density of pixels was used to detect the gas plume from the enhanced schlieren images. The white regions had fluctuations due to the exhaust and noise, while the remaining image was black. Thus, bounding boxes were created around all the white clusters, and regions with a small density of white pixels were eliminated. The region with the exhaust plume had the highest density, as shown in Figure 5.

2.4.2. Exhaust Plume Detection with CNN

The YOLO v4 object detection algorithm, based on the convolution neural network (CNN), was also used to detect the exhaust plume. It is regarded as one of the most significant versions of the YOLO family and has been subjected to rigorous testing in many applications. The model employs a spatial pyramid processing technique to extract features from the frames at varying scales and resolutions. The model can detect objects of varying sizes within a single frame. A detailed description of the approach can be found in reference [44]. The model is notable for its high processing speed, attributable to its single-stage design, rendering it an optimal choice for real-time detection applications.
Furthermore, it can train on relatively modest hardware, such as a single GPU. Compared to other models at the current state of the art, YOLO v4 can be considered the optimal choice for real-time and precise object detection, utilizing a single GPU and grayscale images as inputs. Our training data consisted of approximately 700 enhanced schlieren images of different exhaust plumes, with bounding boxes generated manually around them with the LabelImg (version 1.8.6) software tool. The GPU was used for training, and the trained weights were applied to the test images to identify exhaust plumes and generate bounding boxes around them, as shown in Figure 6.

2.4.3. Exhaust Plume Size Calculation

The size of the exhaust plume in the real world (SER) was calculated by using the distance between the vehicle and the camera (DCV), the focal length (f), and the size of the exhaust plume on the camera sensor (SEC) using Equation (4). SEC was calculated from the actual camera sensor size (SCR), the size of the exhaust in pixels (SEP), and the camera sensor size in pixels (SCP), as shown in Equation (7).
SER = (DCV × SEC)/f
SEC = (SCR × SEP)/SCP
After thresholding, the size of the exhaust in pixels was calculated by counting the number of white pixels in the enhanced schlieren images.

2.5. GSIS—Quantitative Analysis

The GSIS system enables the visualization and measurement of exhaust plume dimensions and the quantification of exhaust plumes based on displacement fields generated in the image plane due to the refractive index of the exhaust plume. As stated above, a change in the refractive index causes a deflection in the light beams, which in turn causes a displacement in the camera’s image plane. The magnitude of the displacement depends solely on the deflection angle and can be calculated directly using image processing techniques. We used two methodologies to calculate displacement in the image plane of the camera.
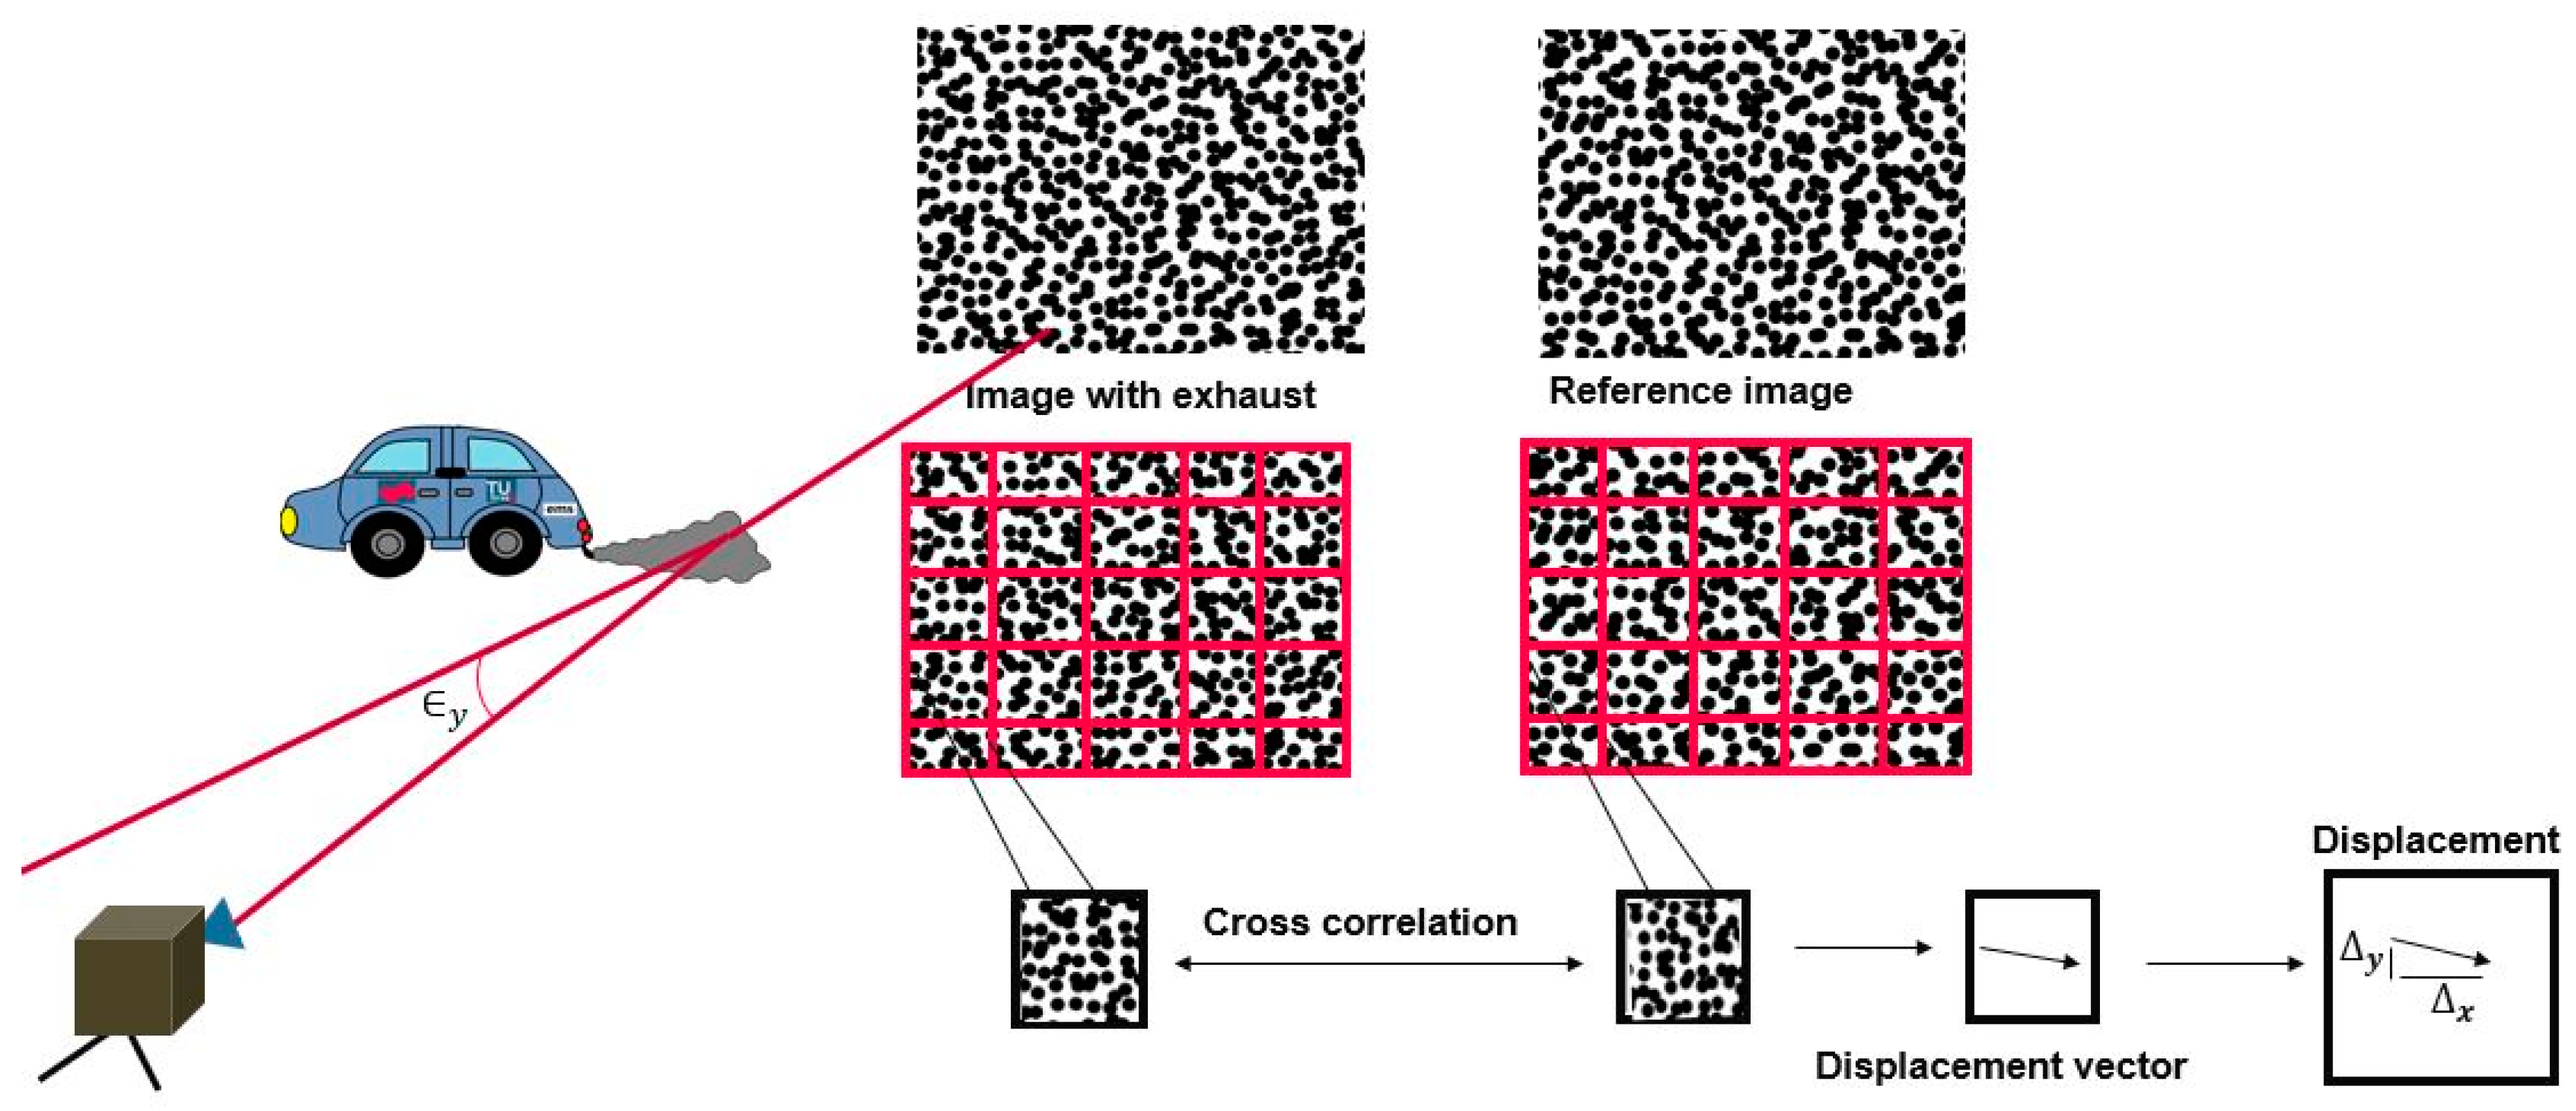
Cross-correlation method—The first method we used to calculate the displacement was the thorough and reliable cross-correlation method. In order to perform a quantitative analysis using the cross-correlation method, a random dot pattern is required to provide the maximum sensitivity as the background for BOS [45]. The images with exhaust and the reference images were divided into small interrogation windows. These windows from two images were meticulously correlated with each other, pixel by pixel, to identify any potential correlations [46]. The cross-correlation function was then employed to identify the signal peak corresponding to the standard displacement between the two frames, as shown in Figure 7. As a result, the displacement vector field was generated by calculating the displacements of the signal peaks due to the distortion in the image caused by the refractive index of the exhaust. The exhaust can be quantified with the displacement field, thus enabling air separation.
Gunner Farneback optical flow method—The second methodology was based on a two-frame motion estimation algorithm that employs polynomial expansion, as initially proposed by Gunner Farneback [47]. It is used to calculate the motion of objects by detecting the changes in pixel intensity after converting frames to HSV (hue, saturation, value) format. To implement this algorithm, the camera captured two consecutive frames of the background (regular or random pattern) with exhaust or gas flow. Then, the polynomial expansion transform was applied to both images, and quadratic polynomials were used to approximate each neighborhood of both images. After comparing the polynomial expansion coefficients at each point and in both images, the direction was visualized using the hue and flow strength using the HSV color representation value. As a result, the displacement vectors were created using the direction and strength values, and the displacement field was generated for the exhaust plume. Different exhausts can be compared and quantified by utilizing displacement fields.

2.6. Modeling GSIS System

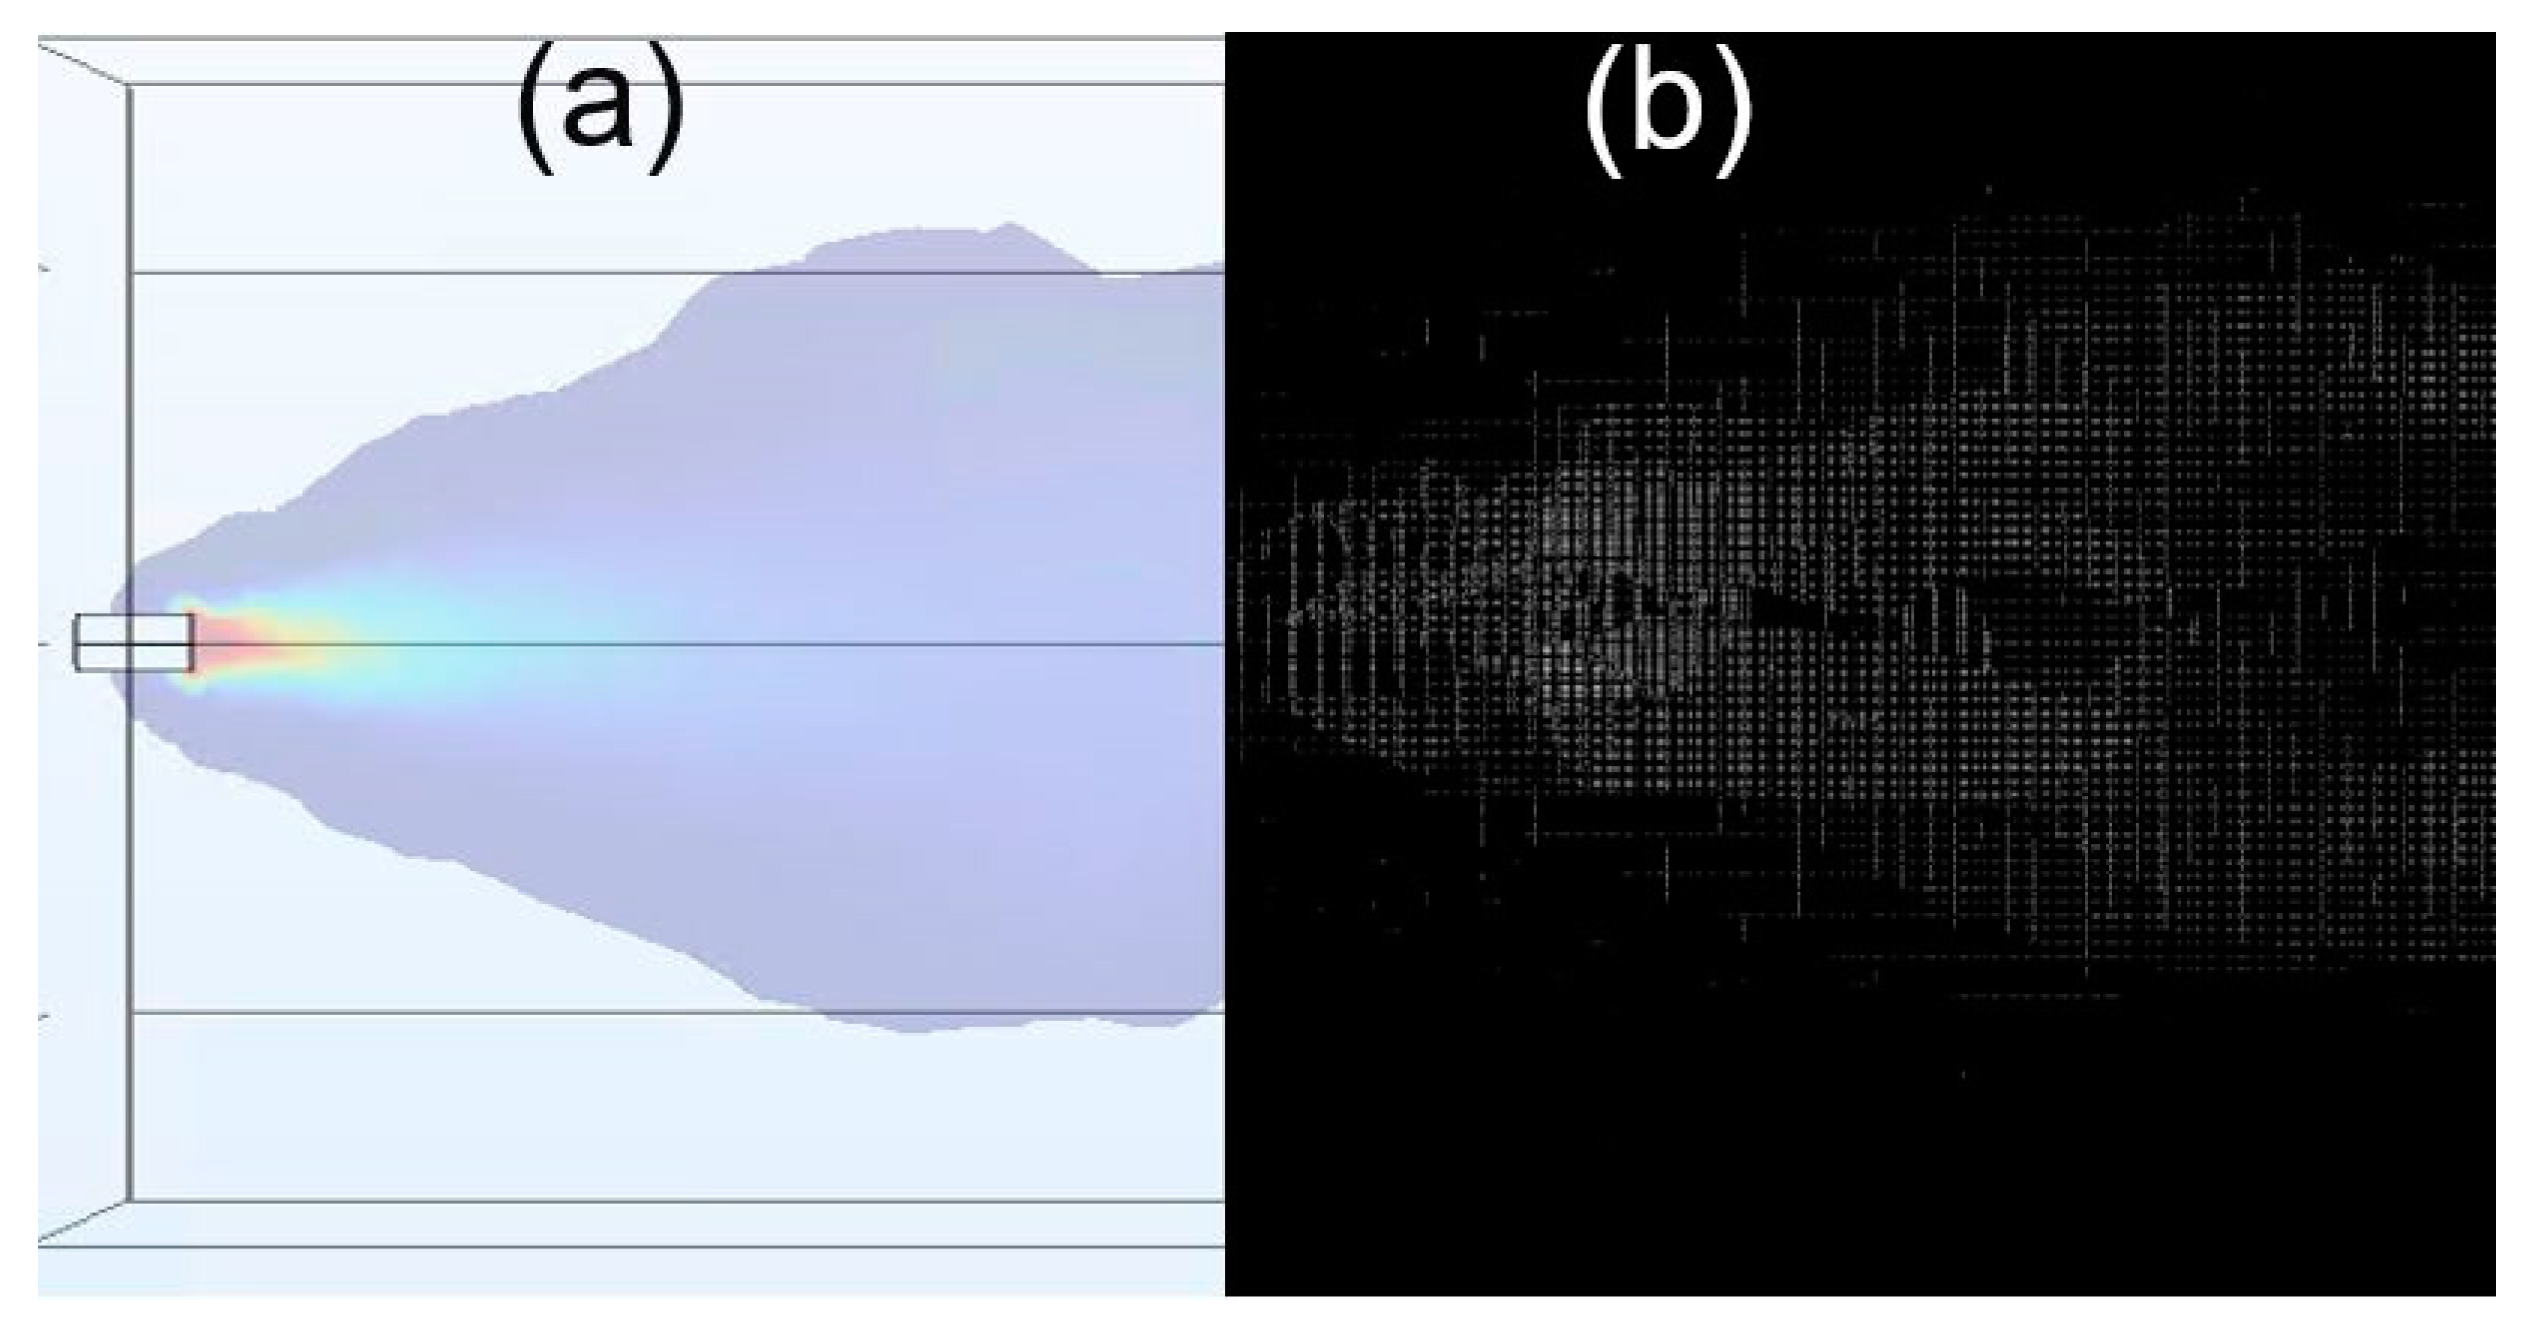
To verify the results, the COMSOL Multiphysics 6.2 software was employed to model the GSIS system. The modeling was based on two COMSOL models, which underwent post-processing in Python. The initial model comprised a flow simulation of CO2 injected into an acrylic box (100 × 60 × 60 cm) filled with air, as shown in Figure 8a. The distribution of the concentrations thus obtained was then imported into a secondary model that performed the actual ray tracing from a pinhole camera through the gas volume via inverse ray paths, as illustrated in Figure 8b. The degree of refraction of a ray of light depends on the gradient of concentration along its path. The ray tracing simulation was performed for different time instances of the flow simulation, corresponding to images taken at different times in the experiment.
The simulation results were the trajectories of the released rays, which depended on the refractive indexes of the mediums they passed through. COMSOL offers a visual representation of the trajectories; each ray’s start and end points were extracted from the simulation. This information was then used to discretize both the sensor and the background. The camera sensor’s discretization allowed for the creation of an artificial image through ray tracing simulation. It also enabled the comparison of simulation results for different parameter choices. The surface of the pinhole camera, from which the rays were released, can be interpreted as a camera sensor observing the background. This surface was discretized into individual pixels based on the desired resolution. The pixel values were initially set to zero and stored in an array. A textured background was required to enable schlieren imaging, and a black-and-white checkerboard pattern was used for this purpose. Upon parsing the simulation results to the Python script, each ray was assigned an additional property called ‘color’, which is a Boolean value indicating either ‘True’ for white or ‘False’ for black. The image’s color depended on the ray’s endpoint and the background pattern’s resolution. In order to create the image, it was necessary to iterate over each ray to determine which discretized pixel of the sensor corresponded to the ray’s starting point. If the background color for that ray was white/True, the pixel value was increased by one or decreased by one otherwise. As an image is essentially an array filled with values, the OpenCV library can display the simulation and postprocessing results as an image.
Figure 9a shows the COMSOL flow simulation of CO2 at a flow rate of 6 L/min. The simulation involved passing approximately one million rays through the gas flow and calculating their start and endpoints. The checker pattern’s artificial images were generated with and without gas flows through the ray tracing simulation using the start and endpoints. The schlieren image was generated by subtracting the image with and without gas flow in the container, as shown in Figure 9b.

2.7. Calculating Direct Concentration of Pollutants Using GSIS

Spectroscopic methods (e.g., TDLAS) commonly used in RES systems are based on the Beer–Lambert law [48].
I = I0exp(−χ(λ)cL)
where I0 is the emitted laser intensity, I is the received laser intensity after absorption, L is the length of the gaseous medium, χ(λ) is the absorption cross-section of the gas, and c is the number concentration of absorbing gas molecules. Our GSIS system captures a live image of the exhaust plume of passing vehicles. The extent of the exhaust plume along the line of sight of the TDLAS measurement can be determined using advanced image processing techniques, as described above. Merging this information of the absorption path length with the continuous monitoring of background gas concentrations using TDLAS allowed us to accurately calculate the target gas concentration in the exhaust plume.

3. Results and Discussion

3.1. Modeling vs. Laboratory Results

In order to compare the modeling and laboratory setups, a flow of CO2 was introduced into the acrylic box at a rate of 6 L/min at different temperatures. The schlieren images and displacement fields were generated through the comprehensive modeling and laboratory setup applications. As the temperature rose, the refractive index of CO2 declined, which led to a decrease in the displacement of pixels and also reduced the visibility of plumes in the schlieren images. The average and maximum displacements were calculated and compared at different temperatures. The experiments were repeated at least five times at each temperature.
The average displacements from all the pixels displaced due to the CO2 flow were calculated to calculate the average displacement in the images. Around 50,000 pixels were displaced in the images of both the model and lab setups, a direct result of the flow of CO2 present in the field of view of the setups. The relative standard errors (RSEs) were calculated using the average and the standard deviation from each measurement at the different temperatures. The average displacements with 95% confidence intervals (CIs) were also calculated. The results of the RSEs and average displacements with 95% CIs are shown in Table 1 and Table 2. The results indicate that 95% of the values displayed less than or close to just one percent deviation from the average displacements for both setups.
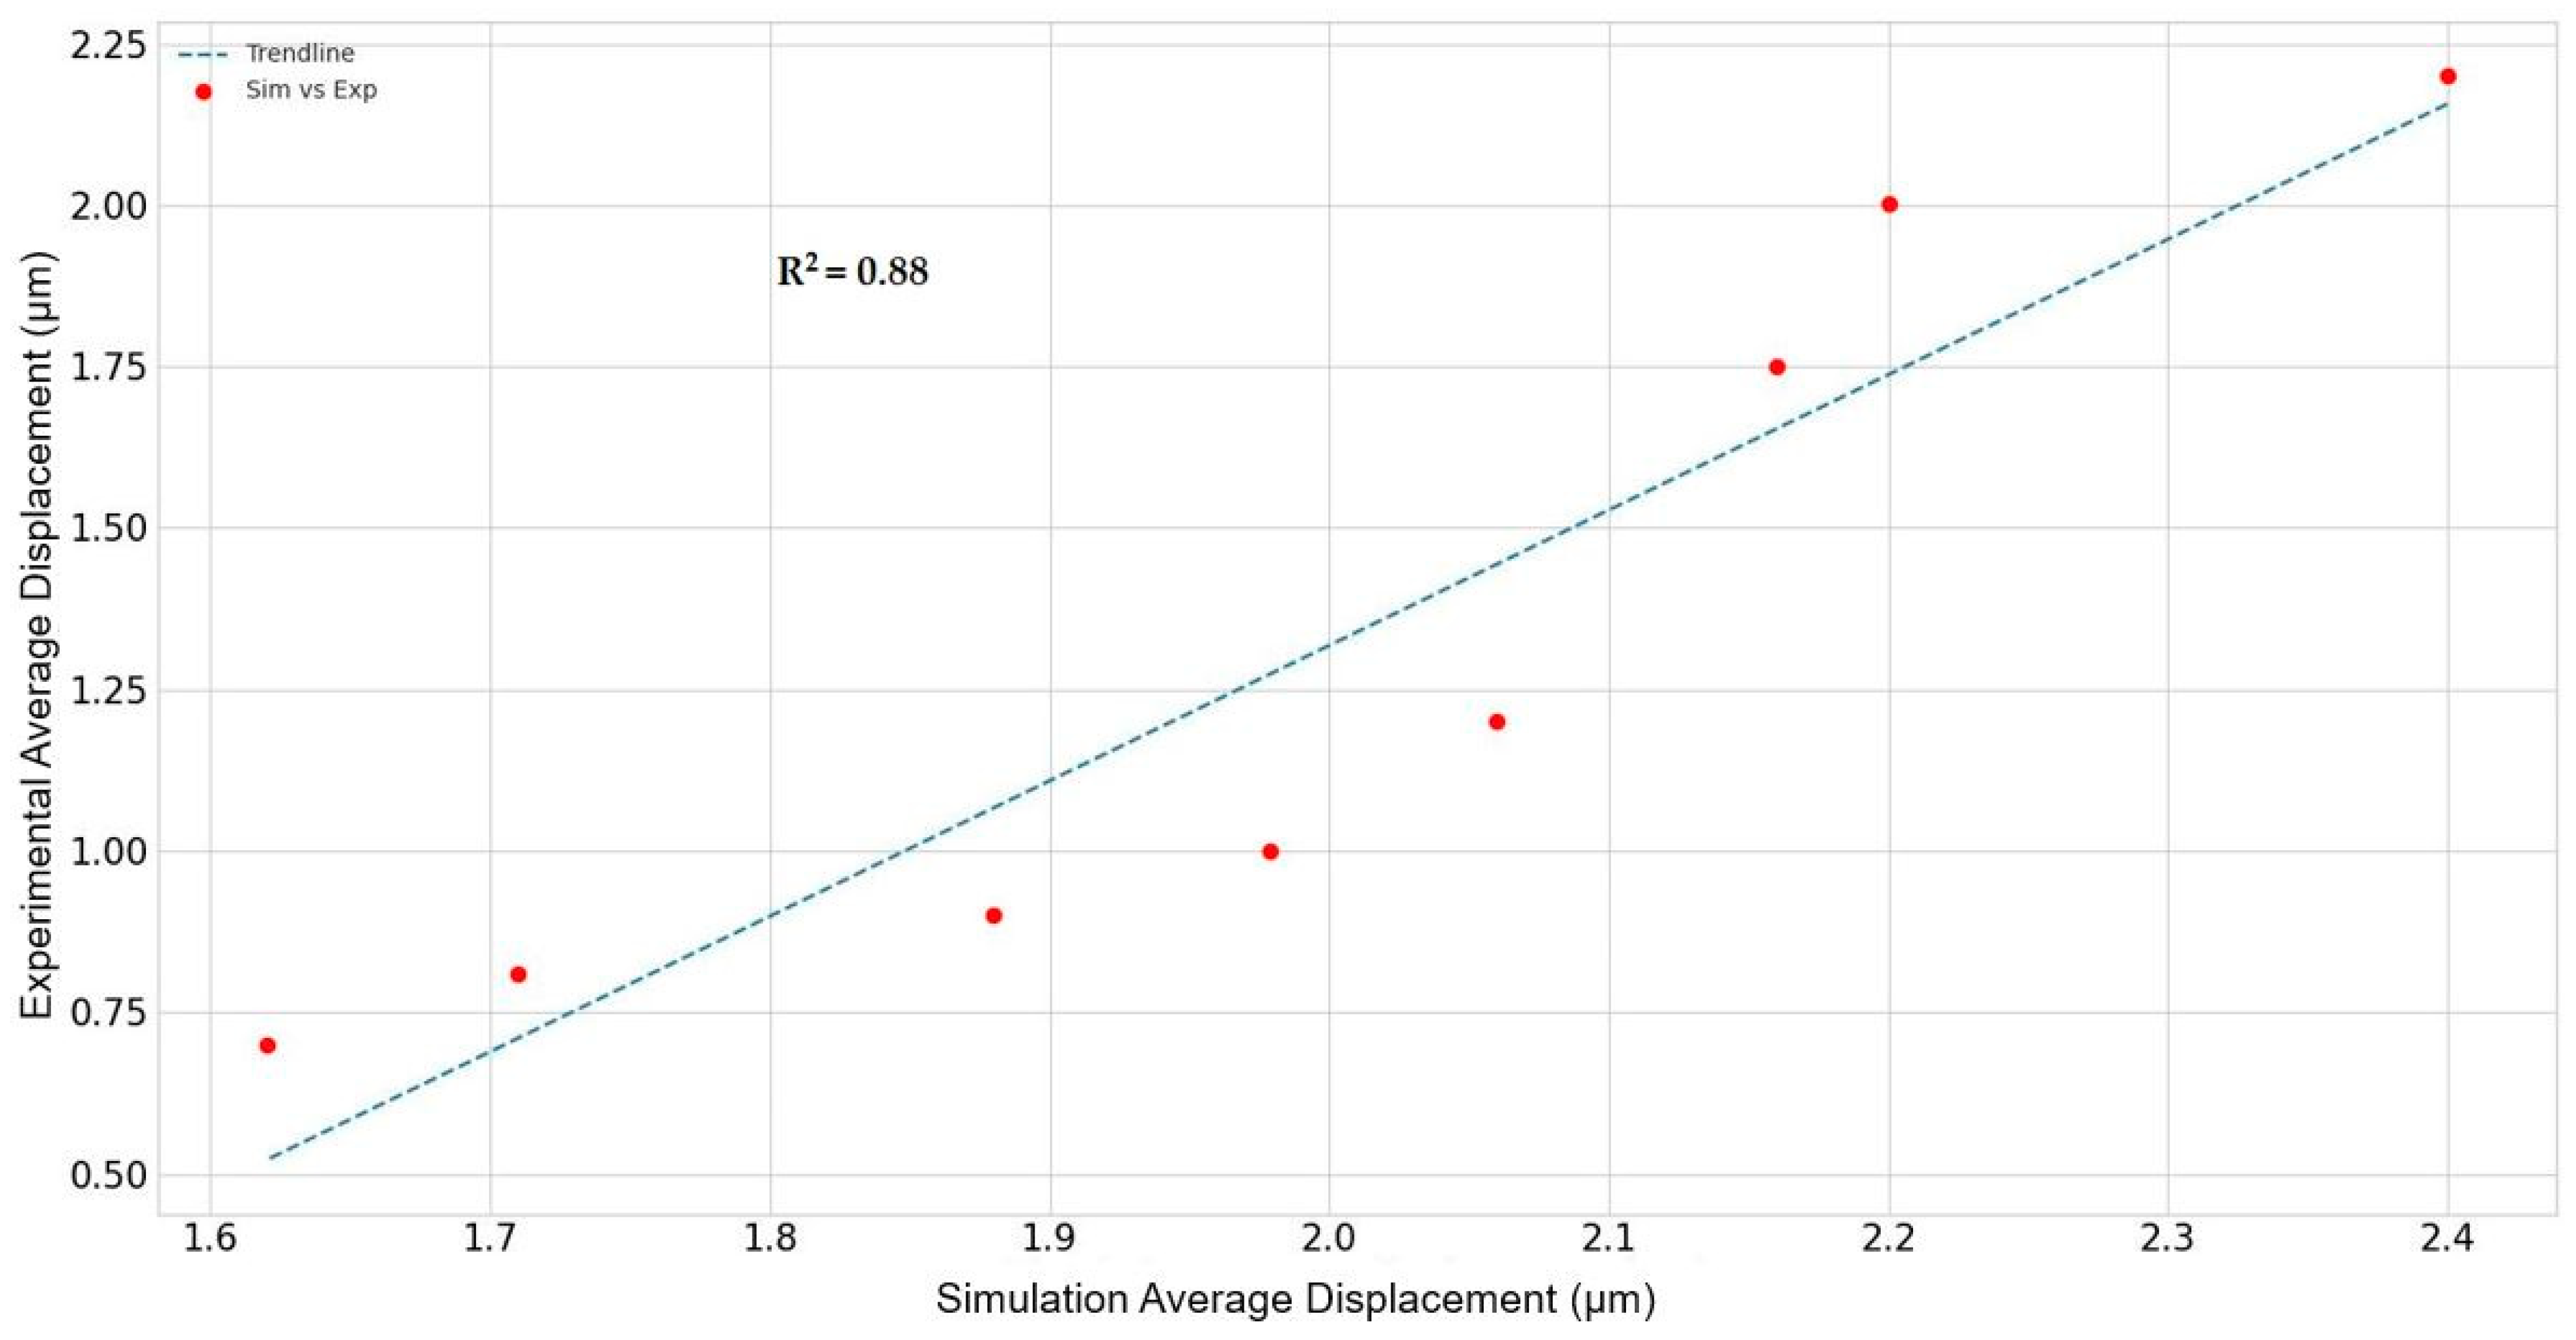
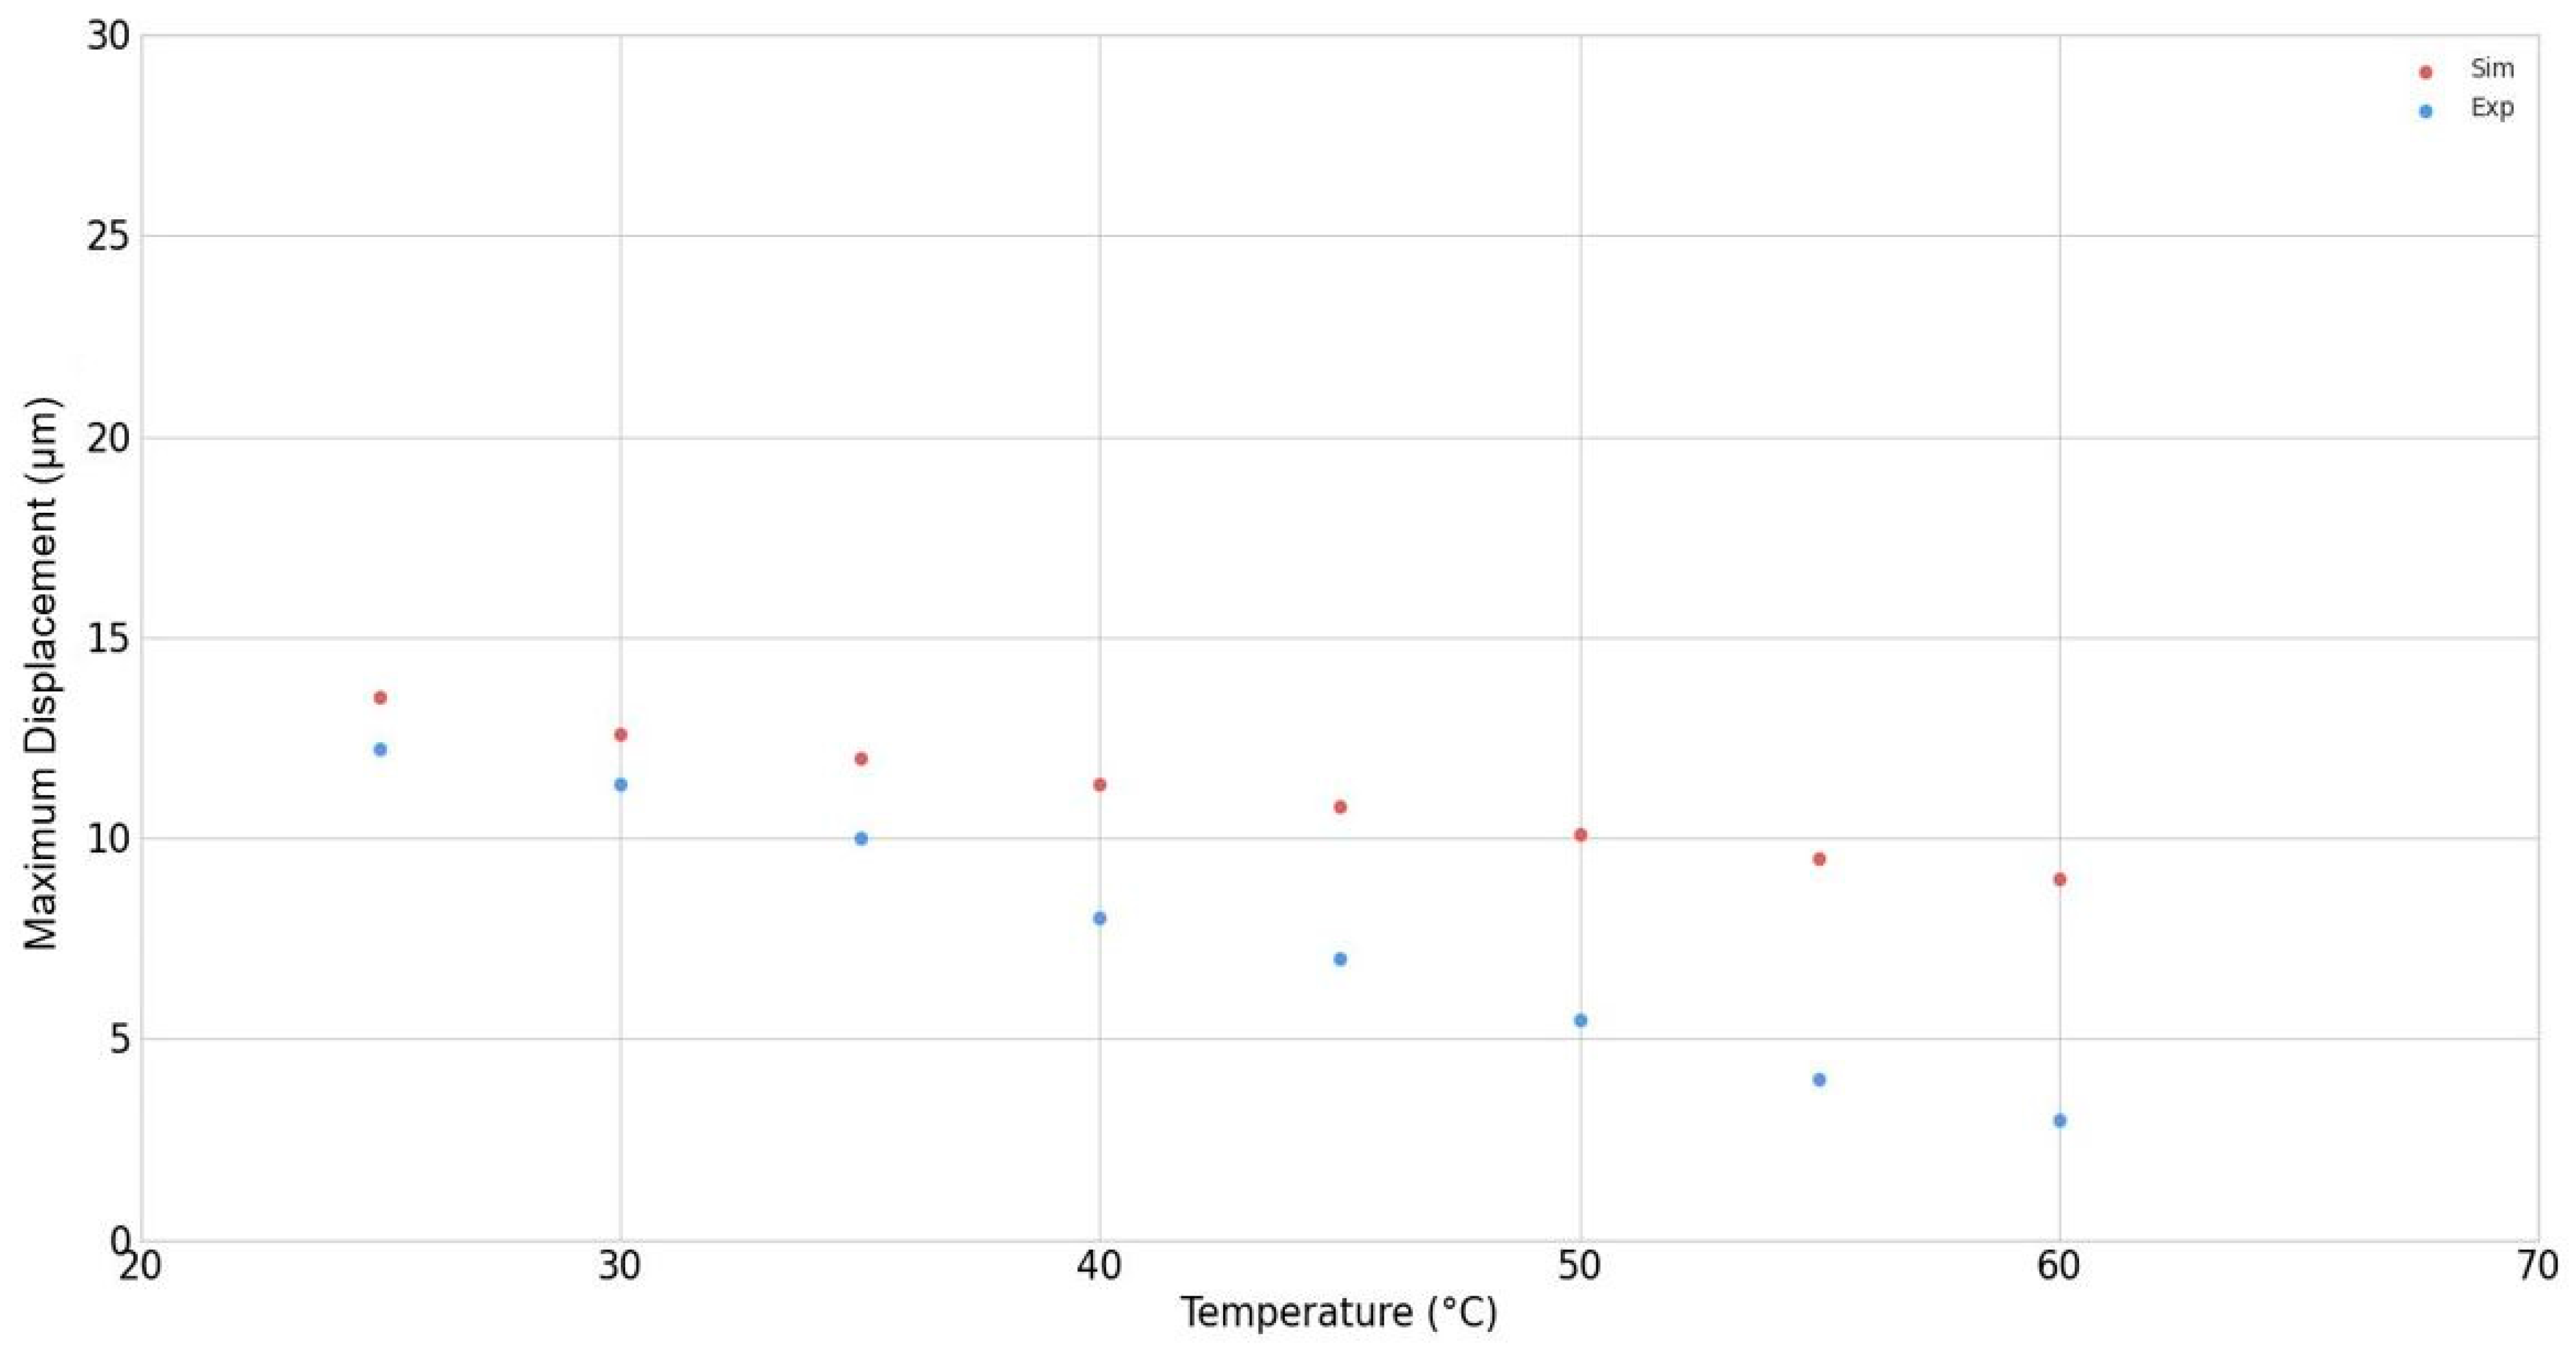
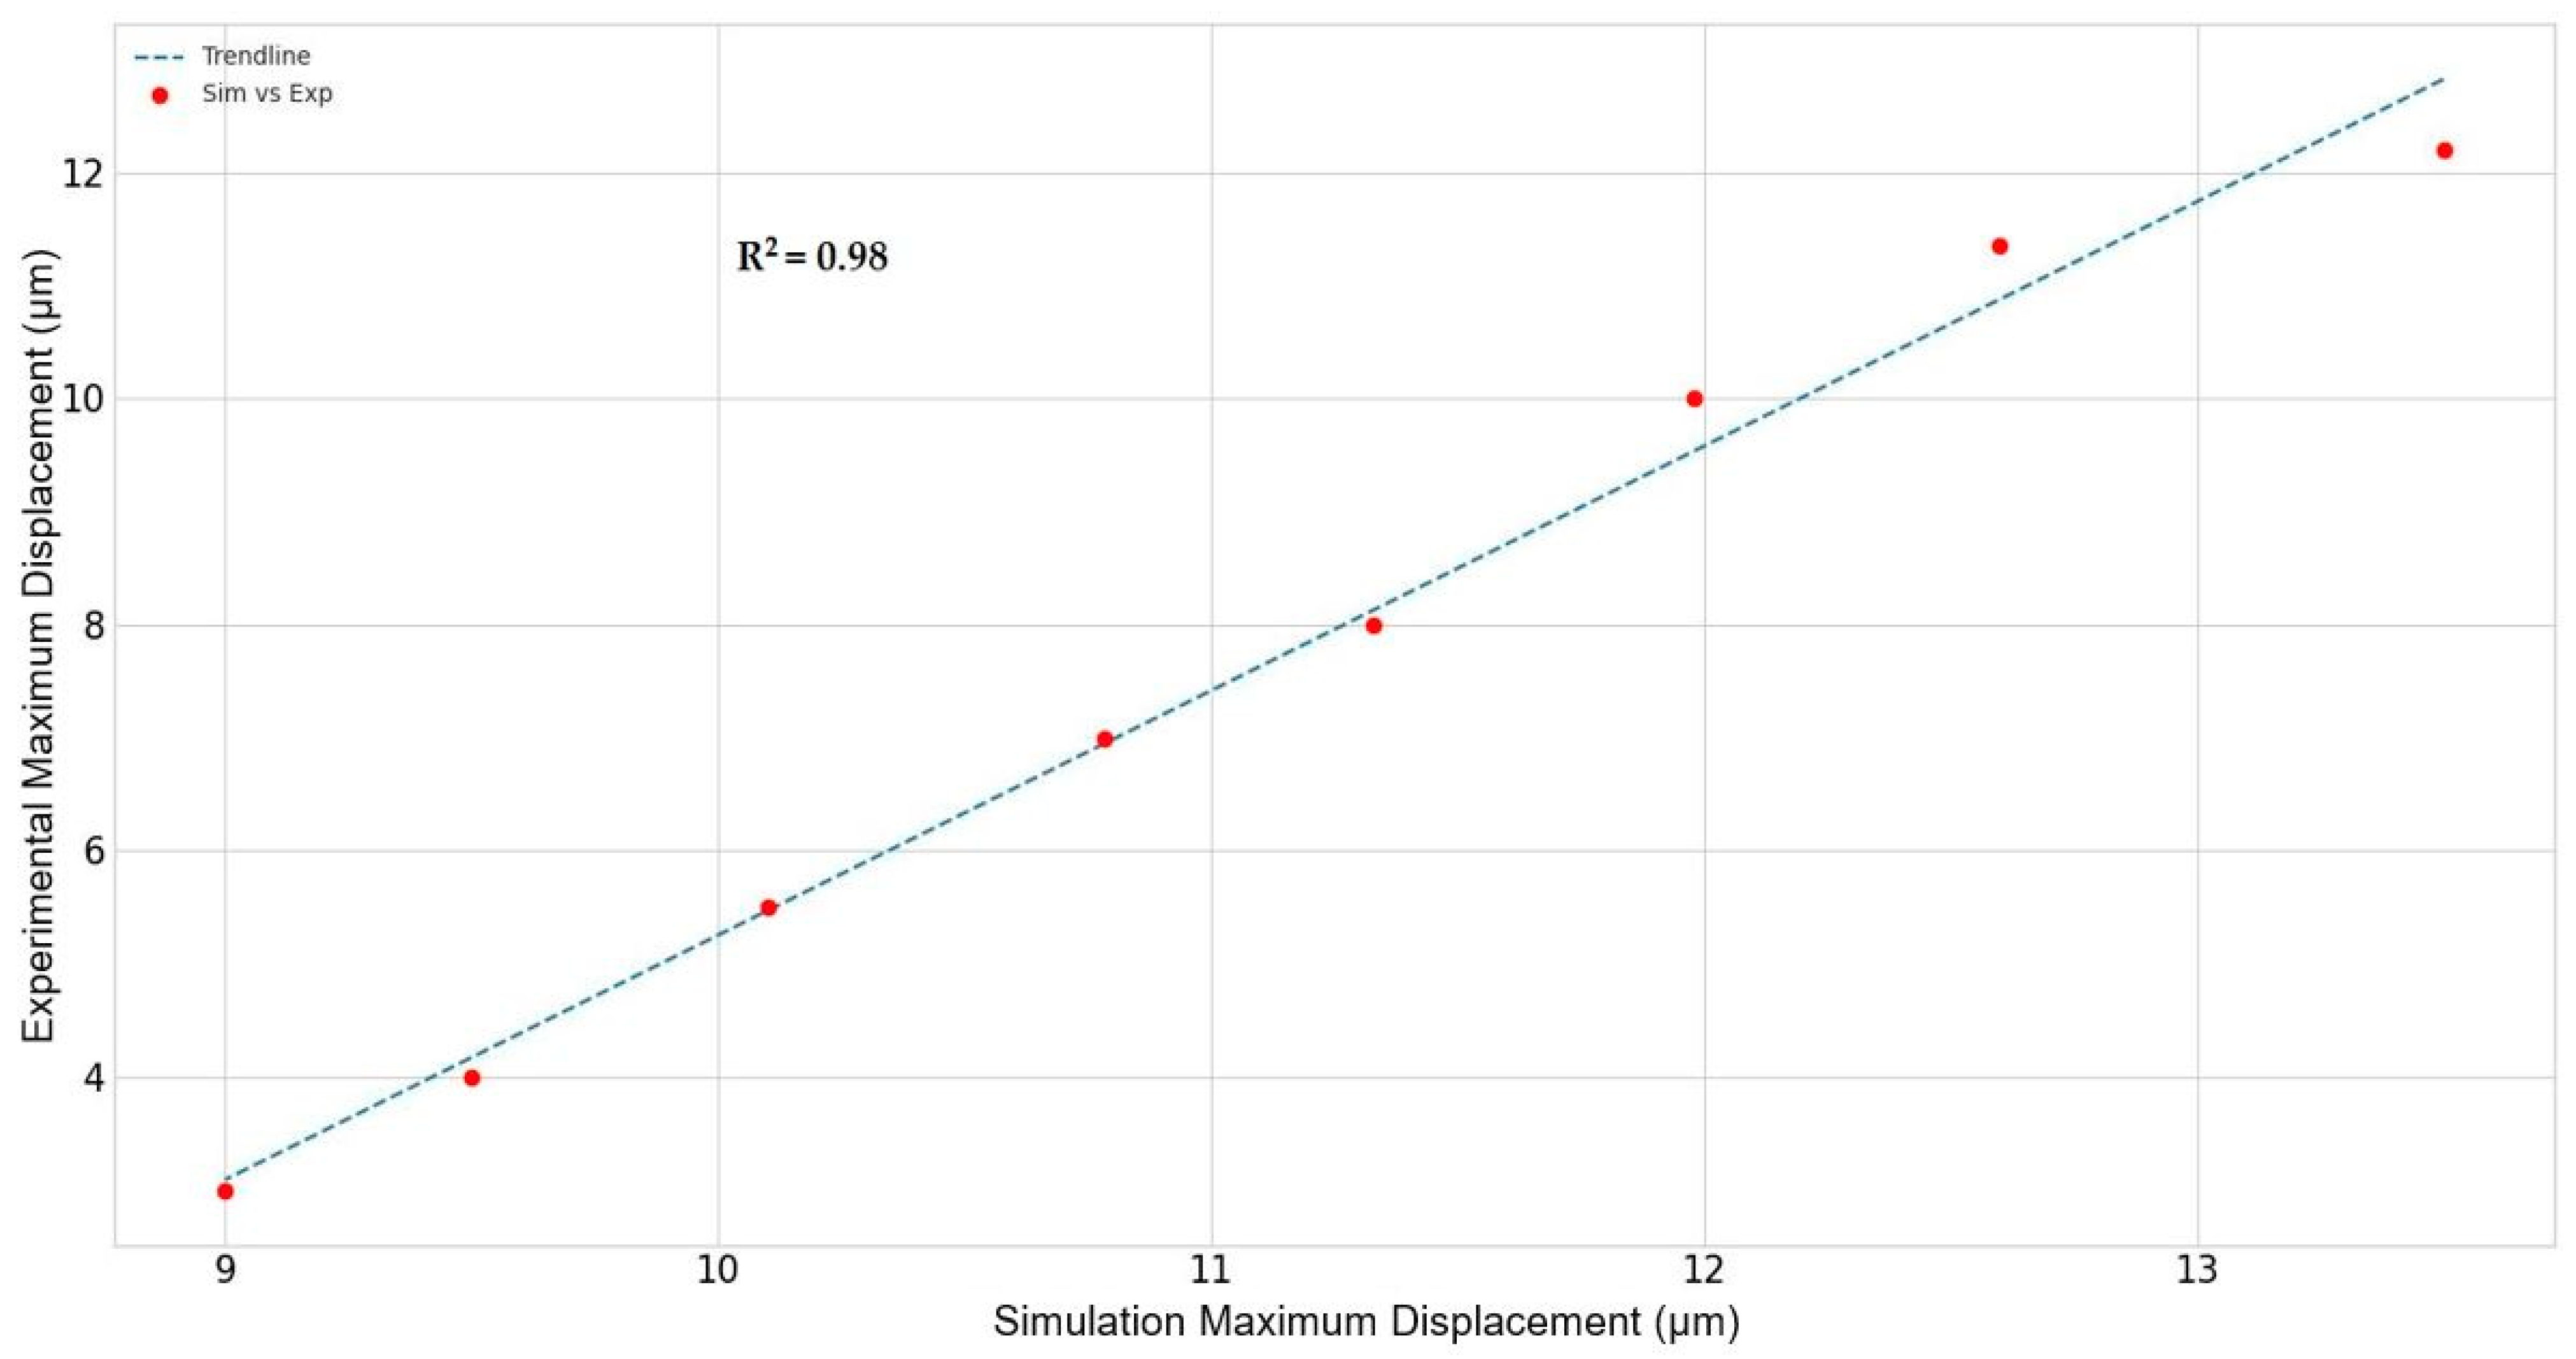
A temperature range of from 25 °C to 60 °C was selected for the experiments. The tests were conducted at an increase of 5 °C each time, commencing with 25 °C. Figure 10 illustrates the calculated average displacements at the selected temperature range. The red points represent the results obtained from the simulation, while the blue points depict the results obtained from the experimental setup. The results show that with the increase in temperature, the displacement of pixels in the image plane decreased. Both the simulation and experimental tests exhibited the same trend. The trendline and coefficient of determination (R2) between the simulation and experimental average displacements are shown in Figure 11. The values display an 88% correlation with each other. Similar to Figure 10, Figure 12 illustrates the calculated maximum displacements at the selected temperature range. A correlation of 98% was observed between the simulation and experimental maximum displacement values, as illustrated in Figure 13. Nevertheless, an identical trend was evident in simulation and experimental values, yet it was challenging to precisely align the values, particularly at higher temperatures. The simulation and experimental results were more similar at temperatures below 40 °C. From 40 °C, there was a notable decline in the experimental values, which persisted throughout the experiment. To the best of our knowledge, this decline can be attributed to the impact of higher temperatures on the air within the box. The density and refractive index of the air also decreased with the increase in temperature. As a result, the relative refractive index between the air and CO2 declined, further decreasing the image plane’s displacement. In the simulations, the temperature and refractive index of the air in the box were considered constant for each test run. It was challenging to accurately depict the impact of rising temperatures on the combination of CO2 and air concentrations in the model.

3.2. Exhaust Plume Size Meausrement of Passing Cars

The GSIS system was set up on the road in the Graz University of Technology Infeldgasse campus for validation measurements. Regarding the configuration, it was assumed that the TDLAS setup is top-down, whereby the laser is generated from the top and passes through the exhaust plume from the top toward the road. With this setup, the absorption path length could be estimated from the side view of the exhaust plumes, as shown in Figure 14 below. The system detected several cars. Figure 14 shows the visualization of exhaust plumes from four different cars, and their sizes are listed in Table 3. The calculation of the dimensions of the exhaust plume was contingent upon the size of the bounding boxes, the dimensions of the camera sensor, the focal length, and the distance of the camera from the exhaust, as outlined in Section 2.4.3. The dimensions of the camera sensor and the focal length were fixed. The distance from the camera to the car was subject to a margin of error of 2.5%, dependent on the precision of the LiDAR sensor employed. The generation of the bounding box was associated with an uncertainty of approximately 2%, while the conversion from the bounding box (pixels) to the original size (m) was subject to a further 2 to 2.5% margin of error. Consequently, the calculation of the size of the exhaust plumes from the images was subject to an overall uncertainty of approximately 7%.
We can see from Figure 14a–d that many small papers containing the pattern were combined to cover the whole pattern board. As a result, the pattern was not flat and had edges. We took two consecutive frames to make each schlieren image. If the paper edges and flatness were constant on both frames, they did not affect the results. However, if the edges of two papers were too separated and were responsible for reducing the resolution of pattern, they affected the sensitivity. The ideal case was to have a single big, flat paper without any edges. However, for testing at different locations with different road sizes, we often needed to change the pattern. That is why we preferred to use small papers that could be printed easily.

3.3. Displacement Fields of Vehicle Exhaust and Gas Flows

The displacement fields for the various gas flows were generated using the quantitative analysis technique described in Section 2.5. In particular, displacement fields were generated for air at 400 °C, CO2 at room temperature, and a vehicle’s exhaust outdoors.
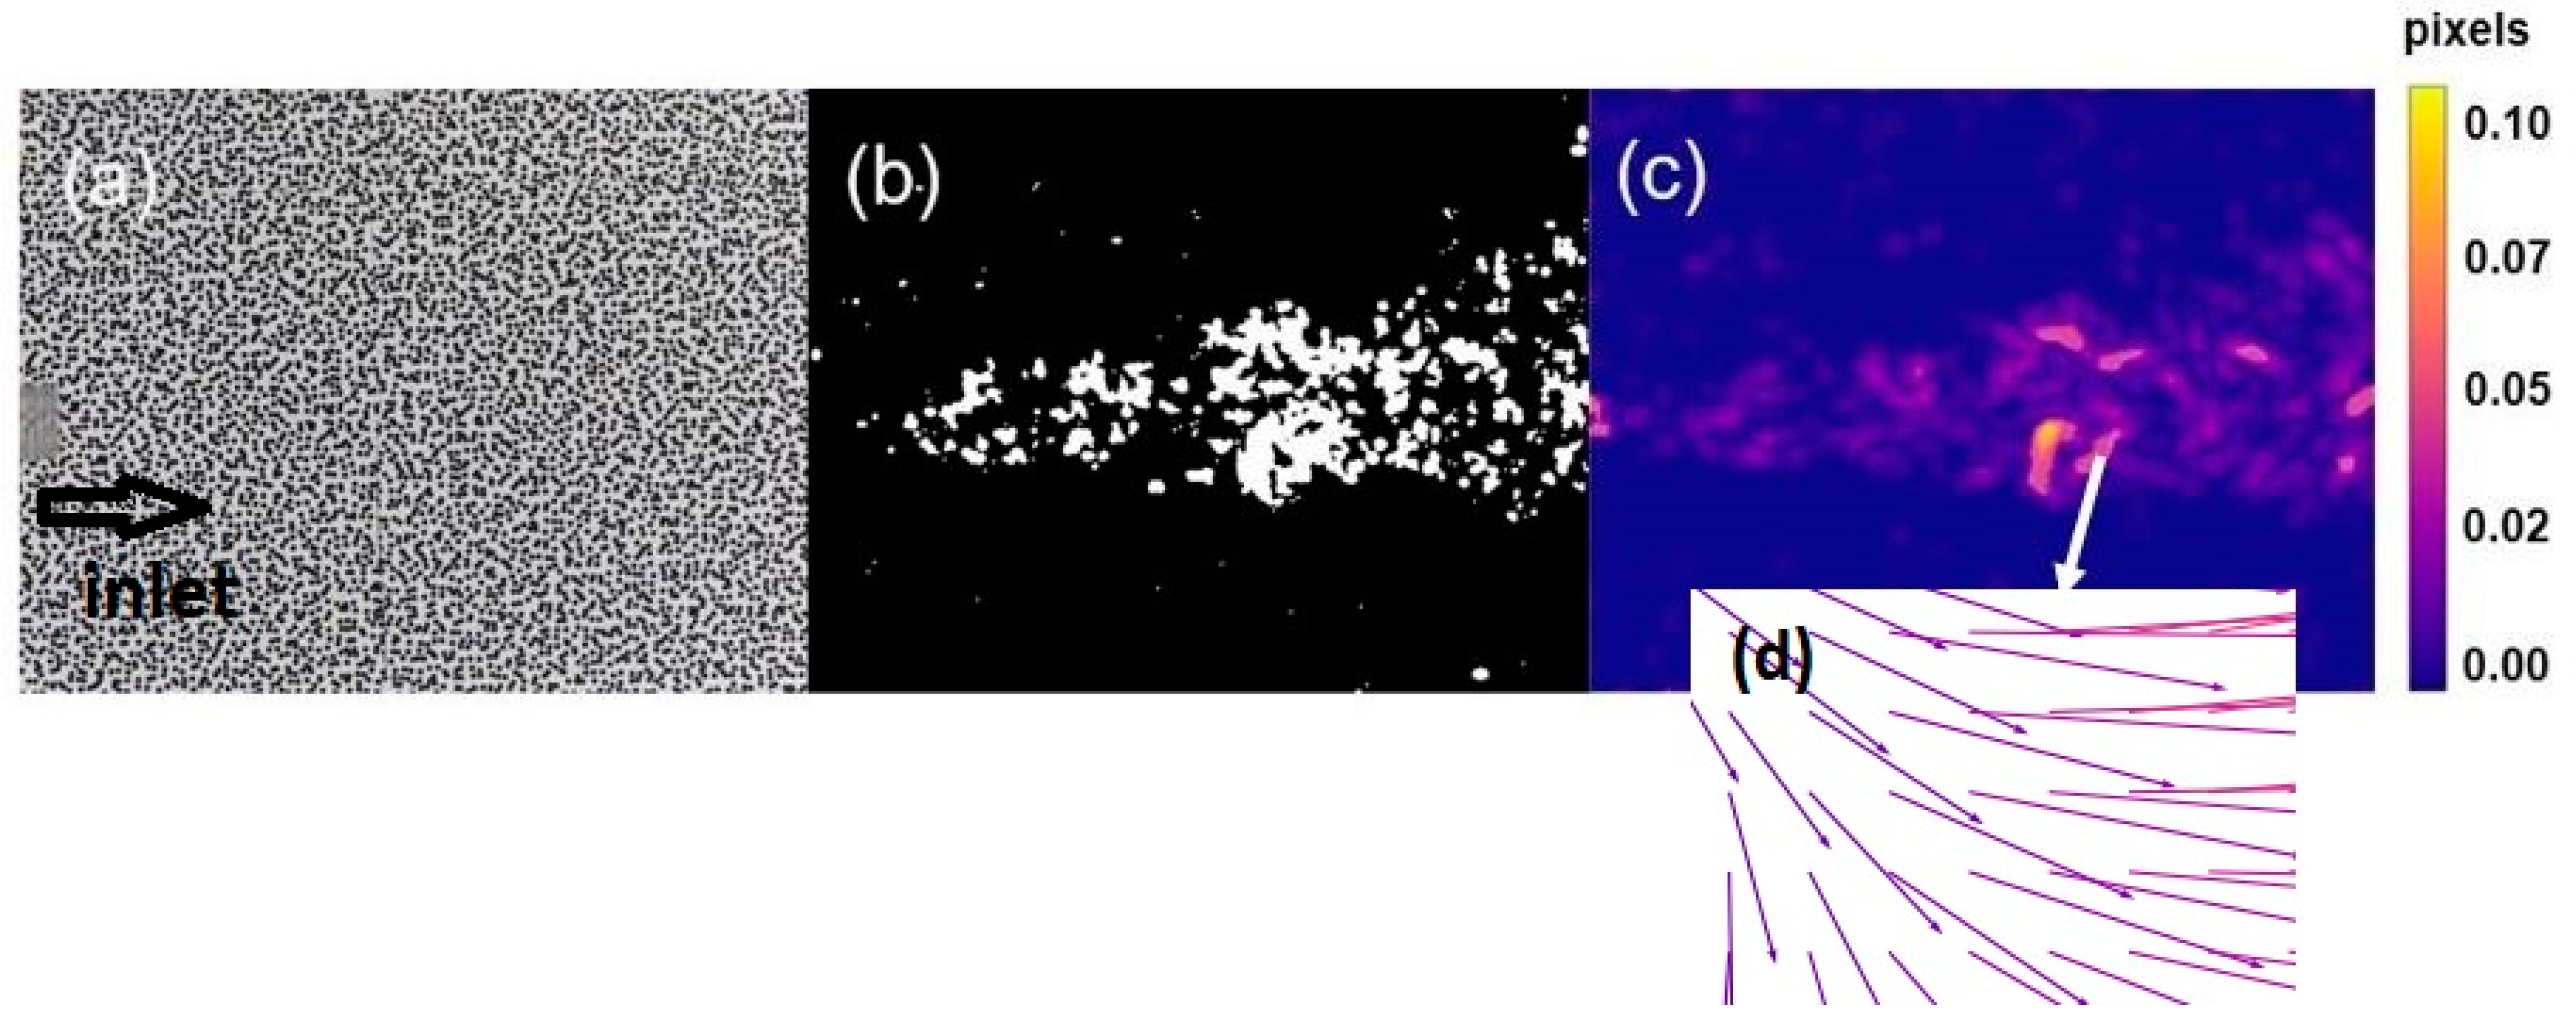
Figure 15a illustrates the inlet where the heated air was expelled before the pattern. The schlieren image for air at 400 °C is displayed in Figure 15b. The refractive index of air at 400 °C was very low compared to air at room temperature. The heated air from the inlet flowed into the cold air already present in the box. The displacement observed in the image plane can be attributed to a relative change in the refractive index. The displacement field for air at 400 °C is displayed in Figure 15c. The maximum displacement in the field reached 0.1 pixels. A closer view of the displacement vectors in the field is shown in Figure 15d.
The flow of CO2 at 25 °C in front of the pattern board is shown in Figure 16a. The schlieren image illustrating the visibility of CO2 at room temperature is expressed in Figure 16b. The refractive index of CO2 at 25 °C (~1.000396) was higher than that of air at 25 °C (~1.000267). Due to the change in the refractive index, the light rays from the camera were deflected, resulting in a displacement in the image plane. The displacement field of CO2 at 25 °C is displayed in Figure 16c, with the maximum displacement reaching 0.2 pixels.
The exhaust pipe of the moving car in front of the pattern board is shown in Figure 17a. For the test, an old diesel car was used. Figure 17b demonstrates the schlieren image containing the exhaust flow exiting the tailpipe. The refractive index of the car exhaust was higher than the ambient air. Also, the temperature of the exhaust did not affect the temperature and refractive index of the ambient air. The relative difference between the refractive index of the exhaust and ambient air remained constant. The displacement field produced due to the refractive index of the car exhaust is shown in Figure 17c. The maximum level of displacement reached 0.4 pixels for the car exhaust. This high level of displacement may be attributed to the dense exhaust system, which generated a considerable quantity of particulate matter. This phenomenon is a distinctive feature of older diesel-powered vehicles.
As we have seen, the displacement field allowed us to quantify the exhaust plume. The next step for us is to relate the displacements with the concentrations of gases in the exhaust plumes. We plan to first characterize and calibrate the GSIS system in the lab with gases as well as exhaust plumes. The modeling of vehicle exhaust plumes and BOS tomographic techniques may be required for that. After the characterization, the GSIS system will be tested along with PEMS and other state-of-the-art point sampling and remote sensing systems to correlate GSIS system results with concentration values. If a model establishes and describes the relationship between the displacement field extracted from the schlieren images and the concentration of CO2, the technique would also allow for the correlation of schlieren images of exhaust plumes with a carbon emission index. Such a technique would enable the monitoring of climate-changing emissions from traffic and the identification of emission hotspots.

4. Conclusions

Our GSIS system, a unique and cost-effective solution, was developed to image exhaust plumes of vehicles and gases for RES applications and to characterize the GSIS setup. It utilizes advanced image processing technologies to determine the extent of the exhaust plume along the line of sight of the TDLAS measurement. By combining the absorption path length information with the continuous monitoring of background gas concentrations using TDLAS, we can accurately calculate the target gas concentration in the exhaust plume. The exhaust plume is identified using object detection algorithms based on the density and CNN from the schlieren images. The GSIS system was installed on the Infeldgasse campus of Graz University of Technology to test multiple cars and their exhaust plumes using a top-down configuration of the TDLAS setup. The exhaust sizes of the vehicles were calculated and compared. The absorption path lengths (heights of exhaust plumes) of four different cars were estimated to be 0.25 m, 0.36 m, 0.45 m, and 0.45 m, respectively.
The lab characterization of the GSIS system used different gases to verify its performance. Gas flow simulations were conducted using COMSOL, and schlieren images were generated for the different gas flows using a ray tracing algorithm. The same gases and parameters were used in the flow simulations and lab characterization setup, and the results were compared. Qualitative analysis was performed on the schlieren images collected from the simulation and experimental tests to calculate the behavior of CO2 at different temperatures and its effect on the schlieren images. The visibility of CO2 was noted at different temperatures using simulation and experimental tests in the lab with the GSIS system.
A quantitative analysis was conducted to determine the maximum and average displacements at varying temperatures (25 °C to 60 °C) with both the simulation and experimental setups. As the temperature increased, the refractive index of CO2 decreased, which, in turn, reduced the displacement in the image plane. The same trend was observed in the results of the simulation and experimental tests. The correlation between the simulation and experimental results for the average displacement measurement was 88%. In the case of maximum displacement, the results demonstrated a correlation of 98%. At a temperature of 25 °C, the simulated average displacement was 2.4 µm, while the experimental average displacement was 2.2 µm. At 60 °C, the simulated average displacement was 1.6 µm, while the experimental average was 0.7 µm. The difference between the simulation and experimental values was less at lower temperatures (25 °C to 40 °C), while the difference increased with the increase in temperature. The observed decline at higher temperatures in the experimental values can be attributed to the reduction in the refractive index of CO2 as well as that of the air in the box. The relative difference between the refractive index of CO2 and air decreased with the increase in temperature, which further decreased the displacement. A similar trend was observed with the maximum displacement values.
Additionally, displacement fields of gases and vehicle exhausts were generated, and their variations were compared. The exhaust emissions from the older diesel vehicle exhibited the most significant displacement in the image plane, with a value of 0.4 pixels, compared to CO2, with a value of 0.2 pixels, and hot air, with a value of 0.1 pixels.
The GSIS system is versatile for qualitative and quantitative vehicle exhaust analyses. It can calculate the size of the vehicle exhaust for RES applications and generate the displacement field of the vehicle exhaust, demonstrating its practical applications in environmental and automotive engineering.
There are also limitations and disadvantages to using this technique for complex applications. First, we saw a 7% uncertainty in calculating the size of the vehicle exhaust from the images. The uncertainty was less than 1% when we calculated the size of the gas plumes in the lab and other objects with the GSIS system. Calculating the dimensions of a vehicle’s exhaust is challenging due to the difficulty in determining the precise distance from which the exhaust is observed. The distance to the exhaust plume is unknown in some instances due to the influence of wind. Also, there are traces of exhaust plumes that are very low in density, and it is hard to accommodate them in the bounding boxes during the exhaust detection algorithm, which could cause uncertainty in the calculations.
Moreover, it is very complex to model the same vehicle exhaust and compare it with the measurements of the GSIS system. The accurate modeling of gas flows is a challenging endeavor, necessitating a high degree of precision. We made a model of CO2 flowing into a box and took measurements with the GSIS system. At lower temperatures, the calculated displacement values from the model and GSIS system were closely aligned. However, the deviation increased with the increase in temperature in the box. We saw that modeling the impact of rising temperatures on the combination of CO2 and air concentrations was challenging due to the inherent complexities involved. Hence, developing a vehicle exhaust plume model and comparing the simulations and GSIS setup experiments with real vehicle exhausts represents a real challenge.
In the future, we plan to further characterize the GSIS system in the lab with vehicle exhaust plumes and other gases. This may involve employing BOS tomography and modeling vehicle exhaust plumes for characterization. After this, we aim to test the GSIS system in conjunction with PEMS and state-of-the-art point sampling and RES devices to correlate the GSIS system results with concentrations of pollutants in the vehicle exhaust plumes. Additionally, we plan to test the GSIS and TDLAS systems together on roads, enabling the direct calculation of pollutant concentrations in vehicle exhaust plumes. We also aim to calculate the refraction angle and, eventually, the refractive index field of the vehicle exhaust with the displacement field and BOS tomography.

Supplementary Materials

The following supporting information can be downloaded at: https://www.mdpi.com/article/10.3390/atmos15091023/s1, Figure S1. GSIS lab setup—(a) Lab setup components; (b) Pattern board image; (c) Schlieren image.

Author Contributions

Conceptualization, M.K., H.H.I. and P.S.; methodology, H.H.I. and P.S.; software, H.H.I., P.S., Y.L. and P.H.; validation, H.H.I., M.K. and A.B.; formal analysis, H.H.I., Y.L. and P.H.; investigation, H.H.I., Y.L. and P.H; resources, A.B.; data curation, H.H.I.; writing—original draft preparation, H.H.I.; writing—review and editing, H.H.I., M.K., A.B., P.S., Y.L. and P.H.; visualization, H.H.I.; supervision, M.K. and A.B. All authors have read and agreed to the published version of the manuscript.

Funding

This research was funded by the Austrian Research Promotion Agency (FFG): FFG Nr. 888105 (LASERS). This publication was supported by the TU Graz Open Access Publishing Fund.

Institutional Review Board Statement

Not applicable.

Informed Consent Statement

Not applicable.

Data Availability Statement

The data presented in this study are available on request from the corresponding author. The data are not publicly available due to privacy.

Acknowledgments

The authors would like to thank the whole LASERS project team at Graz University of Technology and AVL List GmbH for their invaluable support, the Austrian Research Promotion Agency (FFG) for funding, and the organizing team of the TAP conference in Gothenburg 2023 for providing the opportunity to submit manuscripts of accepted conference contributions to the Special Issue “Transport Emissions and Their Environmental Impacts” of MDPI’s Atmosphere. Furthermore, the authors would like to acknowledge the support of the TU Graz Open Access Publishing Fund.

Conflicts of Interest

The authors declare no conflicts of interest.

References

  1. Bainschab, M.; Schriefl, M.A.; Bergmann, A. Particle number measurements within periodic technical inspections: A first quantitative assessment of the influence of size distributions and the fleet emission reduction. Atmos. Environ. X 2020, 8, 100095. [Google Scholar] [CrossRef]
  2. Davison, J.; Bernard, Y.; Borken-Kleefeld, J.; Farren, N.J.; Hausberger, S.; Sjödin, Å.; Tate, J.E.; Vaughan, A.R.; Carslaw, D.C. Distance-based emission factors from vehicle emission remote sensing measurements. Sci. Total Environ. 2020, 739, 139688. [Google Scholar] [CrossRef]
  3. Bishop, G.A.; Starkey, J.R.; Ihlenfeldt, A.; Williams, W.J.; Stedman, D.H. IR long-path photometry: A remote sensing tool for automobile emissions. Anal. Chem. 1989, 61, 671A–677A. [Google Scholar] [CrossRef] [PubMed]
  4. Gastaldi, M.; Meneguzzer, C.; Giancristofaro, R.A.; Gecchele, G.; Lucia, L.D.; Prati, M.V. On-road measurement of CO2 vehicle emissions under alternative forms of intersection control. Transp. Res. Procedia 2017, 27, 476–483. [Google Scholar] [CrossRef]
  5. Zhao, H.; He, H.; Lu, D.; Zhou, D.; Lu, C.; Fang, X.; Peng, Z. Evaluation of CO2 and NOx emissions from container diesel trucks using a portable emissions measurement system. Build. Environ. 2024, 252, 111266. [Google Scholar] [CrossRef]
  6. Knoll, M.; Penz, M.; Schmidt, C.; Pöhler, D.; Rossi, T.; Casadei, S.; Bernard, Y.; Hallquist, Ǻ.M.; Sjödin, Ǻ.; Bergmann, A. Evaluation of the point sampling method and inter-comparison of remote emission sensing systems for screening real-world car emissions. Sci. Total Environ. 2024, 932, 171710. [Google Scholar] [CrossRef]
  7. Sjödin, Å. On-road emission performance of late-model TWC-cars as measured by remote sensing. Air Waste 1994, 44, 397–404. [Google Scholar] [CrossRef]
  8. Stephens, R.D.; Cadle, S.H. Remote sensing measurements of carbon monoxide emissions from on-road vehicles. J. Air Waste Manag. Assoc. 1991, 41, 39–46. [Google Scholar] [CrossRef]
  9. Peterson, J.; Nelson, D.R.; Bahan, T.P.; Polchin, G.C.; Jack, M.D. Unmanned integrated optical remote emissions sensor (RES) for motor vehicles. U.S. Patent 5,726,450, 10 March 1998. [Google Scholar]
  10. Jack, M.D.; Ahlgren, W.; Bahan, T.P.; Gray, M.N.; Hanson, J.L.; Heidt, T.L.; Huerta, F.A.; Kennedy, A.; Nelson, D.R.; Paneral, A.J.; et al. Remote and on-board instrumentation for Automotive Emissions Monitoring. SAE Tech. Pap. Ser. 1995, 104, 796–809. [Google Scholar]
  11. Schifter, I.; Díaz, L.; Durán, J.; Guzmán, E.; Chávez, O.; López-Salinas, E. Remote Sensing Study of emissions from motor vehicles in the metropolitan area of Mexico City. Environ. Sci. Technol. 2002, 37, 395–401. [Google Scholar] [CrossRef]
  12. Chan, T.L.; Ning, Z. On-road remote sensing of diesel vehicle emissions measurement and emission factors estimation in Hong Kong. Atmos. Environ. 2005, 39, 6843–6856. [Google Scholar] [CrossRef]
  13. Chen, Y.; Borken-Kleefeld, J. Real-driving emissions from cars and light commercial vehicles—Results from 13 years remote sensing at Zurich/CH. Atmos. Environ. 2014, 88, 157–164. [Google Scholar] [CrossRef]
  14. Borken-Kleefeld, J.; Dallmann, T. Remote Sensing of Motor Vehicle Exhaust Emissions; The International Council on Clean Transportation: Washington, DC, USA, 2018. [Google Scholar]
  15. Ropkins, K.; DeFries, T.H.; Pope, F.; Green, D.C.; Kemper, J.; Kishan, S.; Fuller, G.W.; Li, H.; Sidebottom, J.; Crilley, L.R.; et al. Evaluation of edar vehicle emissions remote sensing technology. Sci. Total Environ. 2017, 609, 1464–1474. [Google Scholar] [CrossRef]
  16. Gruening, C.; Bonnel, P.; Clairotte, M.; Giechaskiel, B.; Valverde Morales, V.; Zardini, A.; Carriero, M. Potential of Remote Sensing Devices (RSDs) to Screen Vehicle Emissions; Publications Office of the European Union: Luxembourg, 2019; ISBN 978-92-76-11820-6. [Google Scholar] [CrossRef]
  17. Hooftman, N.; Ligterink, N.; Bhoraskar, A. Analysis of the 2019 Flemish Remote Sensing Campaign; The Flemish Government—Flanders Environment Agency—Team Air Quality Policy: Aalst, Belgium, 2019. [Google Scholar]
  18. Aosaf, M.R.; Wang, Y.; Du, K. Comparison of the emission factors of air pollutants from gasoline, CNG, LPG and diesel fueled vehicles at Idle Speed. Environ. Pollut. 2022, 305, 119296. [Google Scholar] [CrossRef]
  19. Hooke, R.; Allestry, J.; Martyn, J. Micrographia, or, some physiological descriptions of minute bodies made by magnifying glasses: With observations and inquiries thereupon. 1665. Available online: https://www.biodiversitylibrary.org/item/15485#page/5/mode/thumb (accessed on 8 August 2024).
  20. Weinstein, L.M.; Settles, G.S. Schlieren. Opt. Metrol. Fluids Combust. Solids 2003, 1–36. [Google Scholar]
  21. Foucault, L. Memoire sur la construction des telescopes en verre argente. Ann. I’Observatoire Imp. Paris 1859, 5, 197–237. [Google Scholar]
  22. Toepler, A. Observations after a New Optical Method in Contribution to the Experimental Physics; M. Cohen & Son: Bonn, Germany, 1864. [Google Scholar]
  23. Schardin, H. Toepler’s Schlieren Method: Basic Principles for Its Use and Quantitative Evaluation; Navy Dept., David Taylor Model Basin: Washington, DC, USA, 1947. [Google Scholar]
  24. Sutherland, B.R.; Dalziel, S.B.; Hughes, G.O.; Linden, P.F. Visualization and measurement of internal waves by ‘synthetic schlieren’. Part 1. Vertically Oscillating Cylinder. J. Fluid Mech. 1999, 390, 93–126. [Google Scholar] [CrossRef]
  25. Meier, G.E.A. Hintergrund-Schlierenmeßverfahren. DE 199 42 856, 21 June 2000. [Google Scholar]
  26. Raffel, M.; Tung, C.; Richard, H.; Yu, Y.; Meier, G.E.A. Background oriented stereoscopic schlieren (BOSS) for full-scale helicopter vortex characterization. In Proceedings of the 9th International Symposium on Flow Visualization, Edinburgh, UK, 22–25 August 2000; Volume 450, pp. 1–11. [Google Scholar]
  27. Richard, H.; Raffel, M.; Rein, M.; Kompenhans, J.; Meier, G.E. Demonstration of the applicability of a background oriented Schlieren (BOS) method. Laser Tech. Fluid Mech. 2002, 145–156. [Google Scholar]
  28. Elsinga, G.E.; van Oudheusden, B.W.; Scarano, F.; Watt, D.W. Assessment and application of quantitative schlieren methods: Calibrated color Schlieren and background oriented schlieren. Exp. Fluids 2003, 36, 309–325. [Google Scholar] [CrossRef]
  29. Popova, E.; Kompenhans, J.; Skornyakova, N. Investigation of the Accuracy of the Background Oriented Schlieren Method. In Proceedings of the 13th International Symposium on Flow Visualization, Nice, France, 1–4 July 2008; pp. 1–8. [Google Scholar]
  30. Yevtikhiyeva, O.A.; Skornyakova, N.M.; Udalov, A.V. An investigation of the error of the background schlieren method. Meas. Tech. 2009, 52, 1300–1305. [Google Scholar] [CrossRef]
  31. Schröder, A.; Over, B.; Geisler, R.; Bulit, A.; Schwane, R.; Kompenhans, J. Measurements of Density Fields in Micro Nozzle Plumes in Vacuum by Using an Enhanced Tomographic Background Oriented Schlieren (BOS) Technique; Institute of Aerodynamics and Flow Technology: Gottingen, Germany, 2009; pp. 1–272. [Google Scholar]
  32. Hargather, M.J.; Settles, G.S. Background-oriented Schlieren visualization of heating and ventilation flows: HVAC-Bos. HVAC R Res. 2011, 17, 771–780. [Google Scholar] [CrossRef]
  33. Hargather, M.J.; Settles, G.S. A comparison of three quantitative Schlieren techniques. Opt. Lasers Eng. 2012, 50, 8–17. [Google Scholar] [CrossRef]
  34. Mizukaki, T.; Tsukada, H.; Wakabayashi, K.; Matsumura, T.; Nakayama, Y. Quantitative visualization of open-air explosions by using background-oriented schlieren with natural background. In 28th International Symposium on Shock Waves; Springer Science & Business Media: Berlin/Heidelberg, Germany, 2012; pp. 465–470. [Google Scholar]
  35. Raffel, M. Background-oriented schlieren (BOS) techniques. Exp. Fluids 2015, 56, 60. [Google Scholar] [CrossRef]
  36. Nicolas, F.; Todoroff, V.; Plyer, A.; Le Besnerais, G.; Donjat, D.; Micheli, F.; Champagnat, F.; Cornic, P.; Le Sant, Y. A direct approach for instantaneous 3D density field reconstruction from background-oriented schlieren (BOS) measurements. Exp. Fluids 2015, 57, 1–21. [Google Scholar] [CrossRef]
  37. Settles, G.S.; Hargather, M.J. A review of recent developments in Schlieren and Shadowgraph Techniques. Meas. Sci. Technol. 2017, 28, 042001. [Google Scholar] [CrossRef]
  38. Aminfar, A.; Cobian-Iñiguez, J.; Ghasemian, M.; Rosales Espitia, N.; Weise, D.R.; Princevac, M. Using background-oriented schlieren to visualize convection in a propagating wildland fire. Combust. Sci. Technol. 2019, 192, 2259–2279. [Google Scholar] [CrossRef]
  39. Cai, H.; Song, Y.; Ji, Y.; Li, Z.; He, A. Direct background-oriented schlieren tomography using radial basis functions. Opt. Express 2022, 30, 19100. [Google Scholar] [CrossRef]
  40. Amjad, S.; Soria, J.; Atkinson, C. Three-dimensional density measurements of a heated jet using laser-speckle tomographic background-oriented schlieren. Exp. Therm. Fluid Sci. 2023, 142, 110819. [Google Scholar] [CrossRef]
  41. Gao, P.; Zhang, Y.; Yu, X.; Dong, S.; Chen, Q.; Yuan, Y. Reconstruction method of 3D turbulent flames by background-oriented Schlieren Tomography and analysis of time asynchrony. Fire 2023, 6, 417. [Google Scholar] [CrossRef]
  42. Gojani, A.; Kamishi, B.; Obayashi, S. Measurement sensitivity and resolution for background oriented Schlieren during image recording. J. Vis. 2013, 16, 201–207. [Google Scholar] [CrossRef]
  43. Mier, F.A.; Hargather, M.J. Color gradient background-oriented Schlieren imaging. Exp. Fluids 2016, 57, 95. [Google Scholar] [CrossRef]
  44. Ning, M.; Lu, Y.; Hou, W.; Matskin, M. Yolov4-object: An efficient model and method for Object Discovery. In Proceedings of the 2021 IEEE 45th Annual Computers, Software, and Applications Conference (COMPSAC), Madrid, Spain, 12–16 July 2021. [Google Scholar]
  45. Vinnichenko, N.A.; Uvarov, A.V.; Plaksina, Y.Y. Accuracy of background oriented schlieren for different background patterns and means of refractive index reconstruction. In Proceedings of the 15th International Symposium on Flow Visualization, Minsk, Belarus, 25–28 June 2012. [Google Scholar]
  46. Choi, S.M.; Kim, W.H.; Côté, D.; Park, C.-W.; Lee, H. Blood cell assisted in vivo particle image velocimetry using the confocal laser scanning microscope. Opt. Express 2011, 19, 4357. [Google Scholar] [CrossRef] [PubMed]
  47. Farnebäck, G. Two-frame motion estimation based on polynomial expansion. Image Anal. 2003, 2749, 363–370. [Google Scholar]
  48. Popa, D.; Udrea, F. Towards integrated mid-infrared gas sensors. Sensors 2019, 19, 2076. [Google Scholar] [CrossRef] [PubMed]
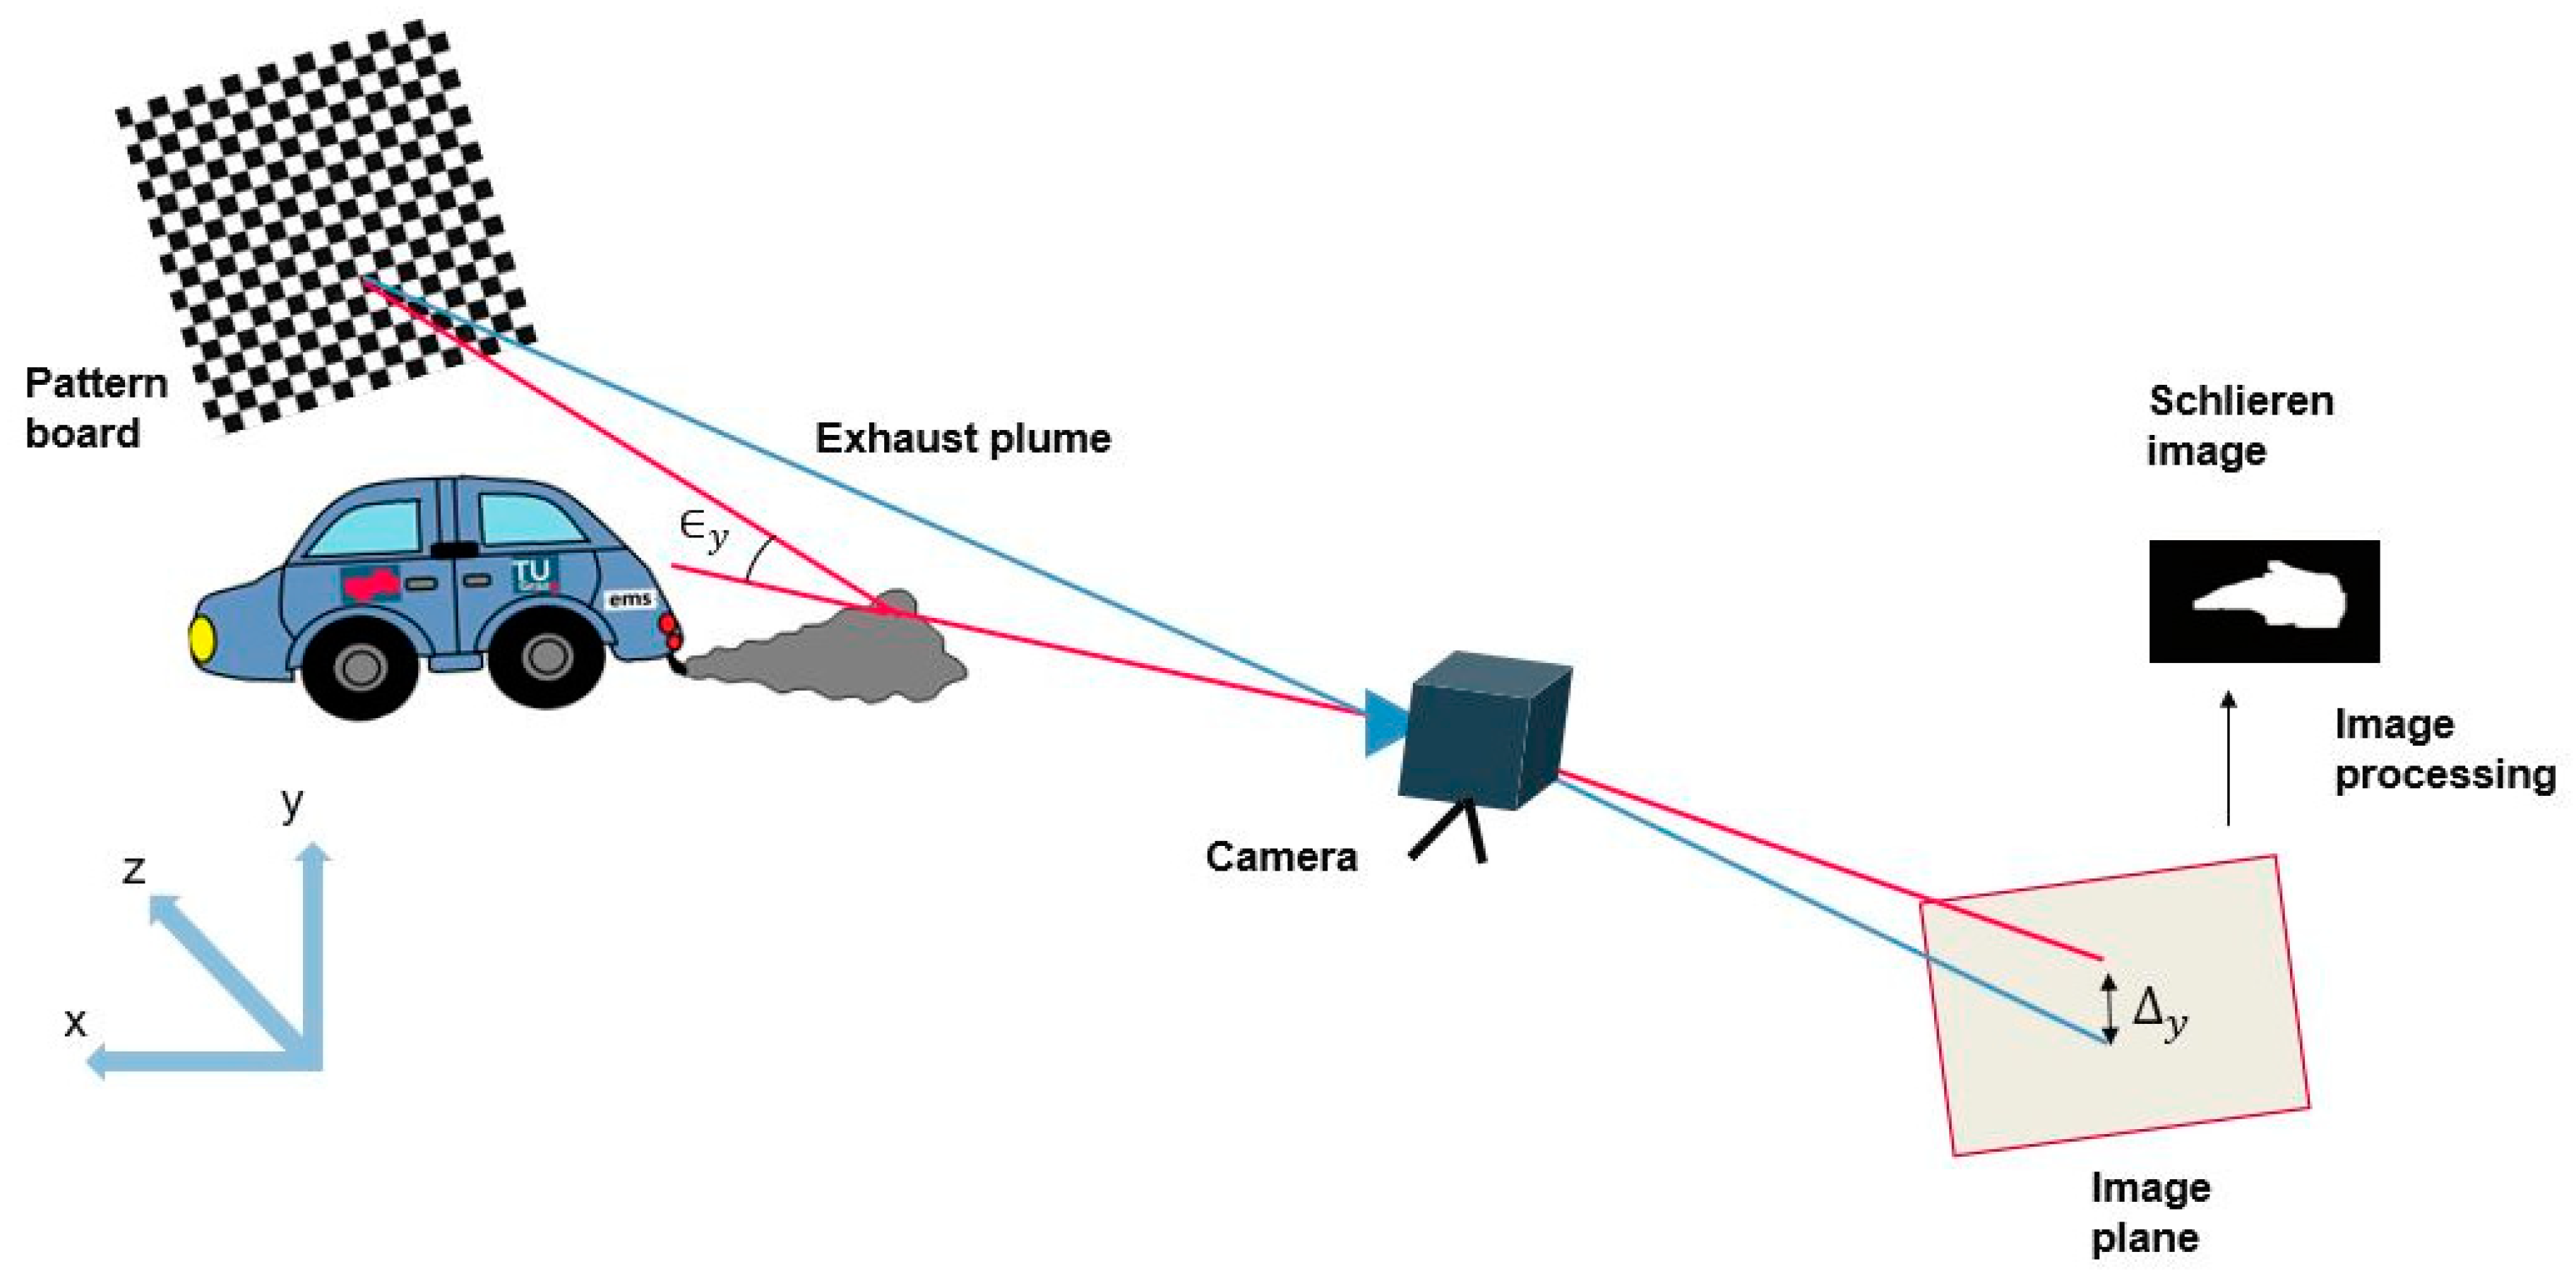
Figure 1. Schematic representation of the GSIS setup—The pattern board at one side and the camera is placed on the other side. The camera is focused on the pattern board and the vehicle passes in between them.
Atmosphere 15 01023 g001
Figure 2. GSIS road setup—The pattern board is on the left, and the camera is on the right side of the road. The light barriers work as a trigger to start the camera when the vehicle passes by. The distance between the vehicle and the pattern board (DVB) and between the camera and the vehicle (DCV) is adjusted to provide the maximum sensitivity of the BOS setup.
Atmosphere 15 01023 g002
Figure 3. Lab setup.
Atmosphere 15 01023 g003
Figure 4. Image processing and exhaust detection algorithm flow diagram—The procedure involved the subtraction of an image pair of a pattern board with and without an exhaust plume. Subsequently, contrasting, blurring, and thresholding were applied to generate an enhanced schlieren image. Finally, the exhaust was identified by applying object detection algorithms based on the density of pixels and convolutional neural networks (CNNs).
Atmosphere 15 01023 g004
Figure 5. Exhaust plume detection based on density of white and black pixels.
Atmosphere 15 01023 g005
Figure 6. Exhaust plume detection with CNN—The dataset was created by collecting images of different exhaust plumes and drawing bounding boxes around them. Subsequently, the images and bounding boxes were provided to the model, which generated the trained weights for the purpose of detecting exhaust from the test images.
Atmosphere 15 01023 g006
Figure 7. Cross correlation of images—Both the reference and exhaust images were divided into small interrogation windows, and the windows were correlated. For each correlation, the signal peak was generated. The shift in the signal peak caused by the distortion in the pattern due to the exhaust was estimated.
Atmosphere 15 01023 g007
Figure 8. Modeling GSIS system—(a) The first model comprised a flow simulation of CO2 injected through the inlet into the air-filled acrylic box. (b) The second model performed the ray tracing from the pinhole camera through the acrylic box containing CO2 and air.
Atmosphere 15 01023 g008
Figure 9. (a) CO2 flow simulation; (b) Generated schlieren image.
Atmosphere 15 01023 g009
Figure 10. Average displacements from simulation (Sim) and experimental (Exp) tests at different temperatures.
Atmosphere 15 01023 g010
Figure 11. Correlation between average displacements from simulation and experimental tests.
Atmosphere 15 01023 g011
Figure 12. Maximum displacements from simulation (Sim) and experimental (Exp) tests at different temperatures.
Atmosphere 15 01023 g012
Figure 13. Correlation between maximum displacements from simulation and experimental tests.
Atmosphere 15 01023 g013
Figure 14. Original image (left) and schlieren images with generated bounding boxes around exhaust plumes (right)—(a) Vehicle 1; (b) Vehicle 2; (c) Vehicle 3; (d) Vehicle 4 (the algorithm generated two bounding boxes, i.e., (1) and (2), according to the shape of the exhaust).
Atmosphere 15 01023 g014
Figure 15. Air at 400 °C—(a) Original frame; (b) Schlieren image; (c) Displacement field; (d) Closer view of displacement vectors in the field.
Atmosphere 15 01023 g015
Figure 16. CO2 at 25 °C—(a) Original frame; (b) Schlieren image; (c) Displacement field.
Atmosphere 15 01023 g016
Figure 17. Vehicle exhaust—(a) Original frame; (b) Schlieren image; (c) Displacement field.
Atmosphere 15 01023 g017
Table 1. Relative standard error (RSE) and 95% confidence interval of average displacement values from experiments.
Temperature (°C)Average Displacement (µm)
(~50,000 Displaced Pixels)
RSE (%), Average ± 95% Confidence Interval (µm)
252.2000.321, 2.213, 2.186
302.0020.321, 2.014, 1.989
351.7500.360, 1.762, 1.738
401.2000.350, 1.208, 1.192
451.0010.392, 1.008, 0.993
500.9010.201, 0.904, 0.897
550.8100.175, 0.813, 0.807
600.7000.180, 0.702, 0.698
Table 2. Relative standard error (RSE) and 95% confidence interval of average displacement values from model.
Temperature (°C)Average Displacement (µm)
(~50,000 Displaced Pixels)
RSE (%), Average ± 95% Confidence Interval (µm)
252.4000.540, 2.425, 2.374
302.2000.560, 2.224, 2.175
352.1600.550, 2.183, 2.136
402.0600.540, 2.081, 2.038
451.9790.550, 2.000, 1.957
501.8800.550, 1.900, 1.859
551.7100.580, 1.729, 1.690
601.6200.580, 1.638, 0.601
Table 3. Sizes of exhaust plumes of passing cars.
VehicleHeight of Plume (m) ± 7%Width of Plume (m) ± 7%
(a)0.250.41
(b)0.360.70
(c)0.450.67
(d-1)0.450.57
(d-2)0.350.43
Disclaimer/Publisher’s Note: The statements, opinions and data contained in all publications are solely those of the individual author(s) and contributor(s) and not of MDPI and/or the editor(s). MDPI and/or the editor(s) disclaim responsibility for any injury to people or property resulting from any ideas, methods, instructions or products referred to in the content.