Article

GNSS Real-Time ZTD/PWV Retrieval Based on PPP with Broadcast Ephemerides

1
School of Geomatics, Liaoning Technical University, Fuxin 123000, China
2
Satellite Laser Ranging National Observation and Research Station, Chinese Academy of Surveying and Mapping, Beijing 100094, China
3
German Research Centre for Geosciences, Helmholtz Centre Potsdam, Space Geodetic Techniques, 14473 Potsdam, Germany
4
Institut für Geodäsie und Geoinformationstechnik, Technische Universitat Berlin, 10553 Berlin, Germany
*
Author to whom correspondence should be addressed.
Atmosphere 2024, 15(9), 1030; https://doi.org/10.3390/atmos15091030
Submission received: 21 March 2024 / Revised: 3 August 2024 / Accepted: 23 August 2024 / Published: 25 August 2024
(This article belongs to the Section Atmospheric Techniques, Instruments, and Modeling)

Abstract

:
GNSS precise point positioning (PPP) plays an important role in retrieving atmospheric water vapor values and performing numerical weather prediction. However, traditional PPP relies on real-time orbits and clocks, which require continuous internet or satellite communication. Improved broadcast ephemerides of GNSSs offer new opportunities for PPP with broadcast ephemerides (BE-PPP) instead of using precise ephemeride products. Therefore, we investigated the feasibility of utilizing BE-PPP for retrieving zenith tropospheric delay (ZTD) and precipitable water vapor (PWV) data. We processed the GPS/Galileo observations from 80 IGS stations during a 30-day experiment to retrieve ZTD values using both real-time PPP (RT-PPP) and BE-PPP solutions. Then, we processed observations from 20 EUREF Permanent GNSS Network (EPN) stations to retrieve PWV data. The IGS final tropospheric products were used to validate the ZTD, and radiosonde (RDS) and ERA5 data were used to validate the PWV. The results show that the real-time ZTD from BE-PPP agrees well with that from RT-PPP: the standard deviation (STD) of the ZTD is 1.07 cm when using BE-PPP and 0.6 cm when using RT-PPP. Furthermore, the STD of the PWV is 1.69 mm when using BE-PPP, and 0.96 mm when using RT-PPP, compared to the ERA5-PWV. Compared to the RDS-PWV, the STD is 3.09 mm when using BE-PPP and 1.39 mm when using RT-PPP. In conclusion, the real-time ZTD/PWV products obtained using the BE-PPP solution are consistent with those of RT-PPP and meet the requirements of NWP, so this method can be used as an effective complement to RT-PPP to expand its application potential.

1. Introduction

Analyzing the temporal and spatial distribution of water vapor, the most important natural greenhouse gas in the atmosphere, is especially important in the investigation of climate change [1]. Besides radiosondes (RDSs) [2], numerical weather prediction models (NWPs) [3,4], and water vapor radiometers (WVRs) [5,6,7], the global navigation satellite system (GNSS) technique has been demonstrated to be a useful tool for measuring atmospheric water vapor [8,9,10]. Compared with these methods, precise point positioning (PPP) has the advantages of being usable in all weather conditions and in real time, has a high resolution, and is a widely adopted processing approach for achieving accurate zenith tropospheric delay (ZTD) as well as precipitable water vapor (PWV) measurements.
PPP post-processing can obtain high-precision zenith total delay (ZTD) measurements [11]. With the development of the PPP technique and the establishment of major GNSSs, many scholars have conducted several experiments on the retrieval of PWV values using PPP [12,13,14], the results of which confirm the high accuracy, as well as the temporal and spatial resolution characteristics, of such a method [15]. High-precision ZTD/PWV products can provide powerful supporting data for heavy rainfall forecasting [16] and drought monitoring [17]. Meanwhile, thanks to the real-time service (RTS) of the International GNSS Service (IGS) [18], PPP real-time atmospheric parameter retrieval can help meet the accuracy requirements of time-critical meteorological applications [19].
Based on PPP, high-accuracy real-time ZTD values can be obtained by applying high-accuracy real-time satellite clock and orbit products [20]. Hadas et al. retrieved the ZTD based on PPP float ambiguity solutions, and the accuracy varied from 5.4 mm to 10.1 mm across different stations [21]. ZTD accuracy is further improved under the fixed ambiguity solution, with a root mean square (RMS) value of 7 mm compared to the post-processed GPS ZTD product [13]. Zhao et al. proposed a real-time linear and nonlinear ZTD (RLNZ) model, and the accuracy of the ZTD estimated by directly using the models is better than that obtained with the Global Pressure and Temperature 3 (GPT3) model and also better than the positioning accuracy of real-time PPP (RT-PPP) [22]. RT-PPP also performs better when retrieving PWV data. The real-time GPS PPP method can obtain PWV data with a root mean square error (RMSE) of less than 3 mm [23]. Using the RDS PWV as a reference value, the RMS of the real-time PPP PWV is less than 2.4 mm [24], and using the fifth-generation ECMWF (European Center for Medium-Range Weather Forecasts) reanalysis (ERA5) PWV as a reference, the RMS is 2.63 mm [25]. However, the retrieval of real-time ZTD/PWV data requires the continuous communication of real-time orbits and clocks via internet links, which can be affected by signal outages.
To address this issue, Li et al. [26] developed a method to utilize IGS ultra-rapid orbits and establish clock corrections. Upon applying this method to the real-time retrieval of ZTD/PWV data, the RMS of only GPS, only Galileo, and only BDS-3 ZTDs are 2.20 cm, 3.07 cm, and 4.21 cm, while the PWVs are 3.42 mm, 4.57 mm, and 6.66 mm, respectively, for a 10 min interruption. This method effectively mitigates the impacts of communication interruptions and meets the accuracy requirements of general numerical weather forecasting, but it does not consider the case where the communication interruption time is more than 1 h. In addition, Yang et al. [27] and Xu et al. [28] proposed a real-time water vapor data retrieval method based on the BDS-3 PPP-B2b signal. This method yields a real-time ZTD product with an accuracy of 2.64 cm and a real-time PWV product of less than 4 mm. This method utilizes the high-precision RT-PPP service provided by the BDS-3 PPP-B2b signal without relying on internet communication for data reception, but the disadvantage is that global service is not possible. Notably, Carlin et al. [29] and Chen et al. [30] proposed a PPP with the broadcast ephemerides (BE-PPP) method, which provides a new opportunity for real-time PPP to cope with communication outages. In terms of positioning accuracy, BE-PPP performs well. The 3D direction positioning accuracy of the GPS + Galileo static BE-PPP solution is about 10 cm, while it is 8.6 cm for the BDS-3 + GPS + Galileo static BE-PPP solution.
To explore the potential of BE-PPP in the retrieval application services of ZTD/PWV, this study investigated water vapor inversion using the GPS/Galileo BE-PPP method to evaluate the bias and stability of real-time ZTD/PWV. The water vapor data from nearby RDS stations and the ERA5 were used in the PWV comparison. The processing strategy of BE-PPP and the ZTD/PWV retrieval algorithm are described in detail in Section 2. The results and a discussion of the ZTD/PWV retrieval experiments are presented in Section 3. The summary and conclusions are presented in Section 4.

2. Data and Methods

2.1. Datasets

The GPS/Galileo observations from 100 globally distributed stations (80 IGS stations and 20 EUREF Permanent GNSS Network (EPN) stations) were processed for 30 days (Figure 1) in 2022. The 20 EPN stations are close to the RDS stations [31,32]. The reference frame for the GPS broadcast ephemerides is WGS 84 [33], and the Galileo reference frame is GTRF [34].
The BE-PPP algorithm is implemented based on the open-source software GAMP [35], and the detailed processing strategies are shown in Table 1. In addition, the RT-PPP algorithm uses real-time orbit and clock products from the Wuhan University (WHU) analysis center in China, and the processing strategies are all the same as those used in BE-PPP, but a satellite antenna offset needs to be applied.

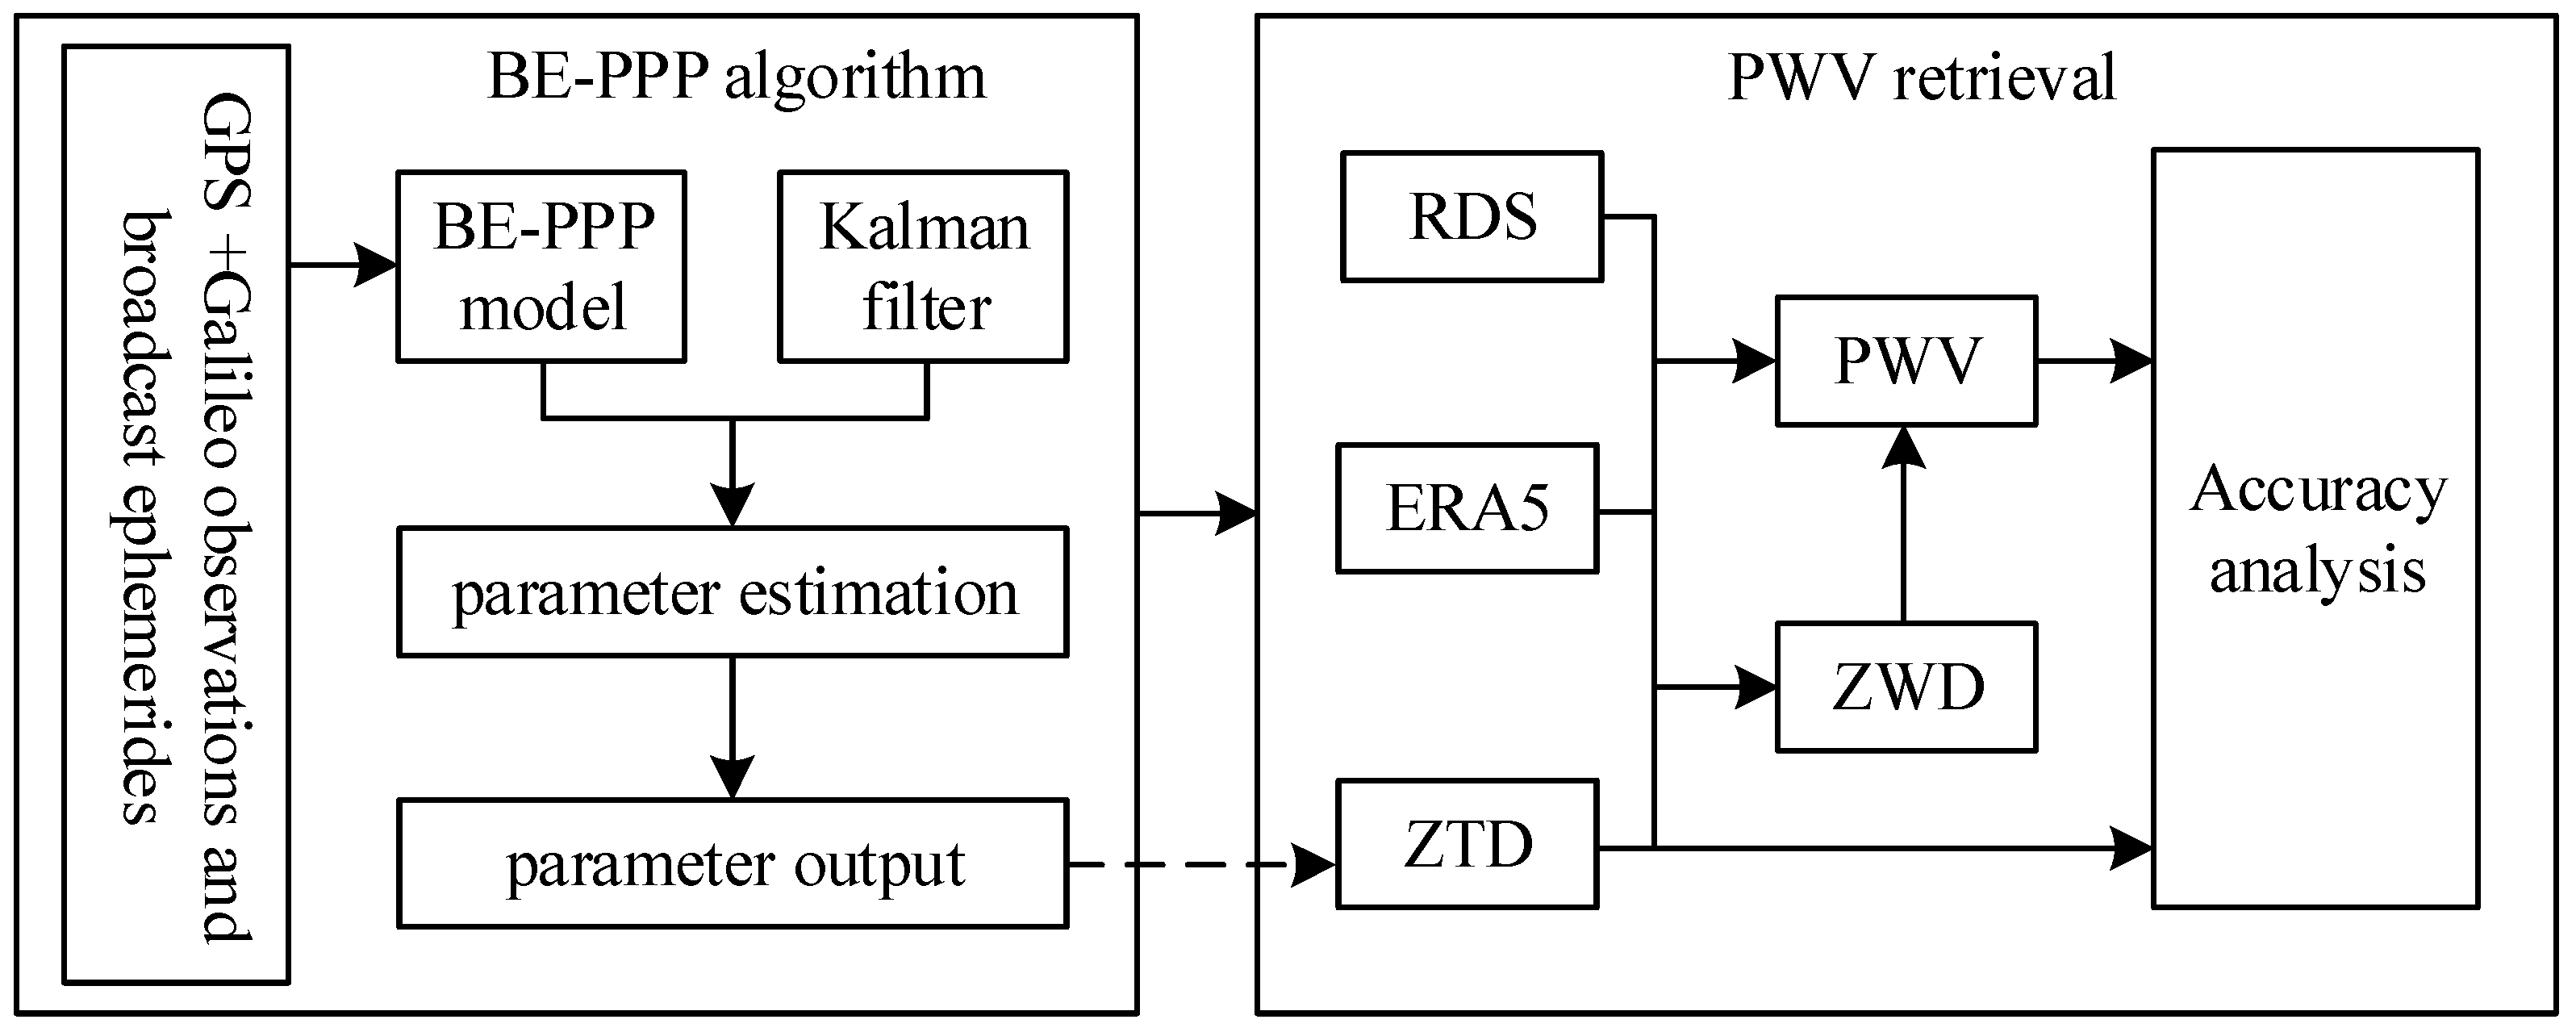
2.2. Technological Route

The flowchart for retrieving ZTD and PWV data using BE-PPP is shown in Figure 2. The whole process is divided into two parts. The first part is the BE-PPP algorithm for solving the ZTD, which first constructs the observation model based on the pseudorange and carrier observations of GPS and Galileo, corrects the errors, then estimates the parameters to be estimated using Kalman filtering, and finally outputs the ZTD. It is important to note that the use of broadcast ephemeris causes errors, which need to be modeled by a random wandering process as the parameters to be estimated. The second part is the PWV inversion. Due to the absence of real barometric pressure and temperature, the ZWD estimated in the first part is not directly used to invert the PWV, and we use the ZTD. With the barometric pressure and temperature provided by the ERA5 data, we interpolate to the station positions and compute an accurate ZHD value based on the Saastamoinen model, which in turn yields an accurate ZWD. Then, we compute the transformed parameters, and the PWV can be accurately retrieved. RDS and ERA5 are the external checks used to evaluate the accuracy of the PWV data, and the accuracy of the ZTD data is evaluated using the ZPD product of the IGS. Also, this method was compared with the conventional RT-PPP to assess the difference between the two.

2.3. GNSS ZTD/PWV Retrieval Based on BE-PPP

(1)
ZTD estimation: Based on the carrier and pseudorange raw observation equations, the ionosphere-free combined BE-PPP raw equation can be obtained in the following form [29]:
{ p I F = ρ + c d t + ϕ T + I S B + s i s e + ε φ I F = ρ + c d t + ϕ T + I S B + N + s i s e + ξ
where p I F and φ I F are the ionosphere-free pseudorange and carrier phase combinations; ρ is the geometric range including corrections, such as the relativistic effect in Table 1; c is the speed of light; d t is the receiver clock; ϕ is the tropospheric mapping function; T is the tropospheric delay; ISB is the inter-system bias; N is the ionosphere-free ambiguity; sise is the SISE of the broadcast ephemerides; and ε and ξ are the pseudorange and carrier-phase noise, respectively.
The formula for the ZTD is as follows:
ZTD = m f w ZWD + m f h ZHD
where ZWD and ZHD are the zenith wet delay (ZWD) estimated with Kalman and the zenith hydrostatic delay (ZHD), and m f w and m f h are their mapping functions. ZHD is calculated using the Saastamoinen model:
ZHD = 0.0022768 P s 1 0.00266 cos ( 2 φ ) 0.28 10 6 h 0
where P s is the atmospheric pressure at the measurement station obtained using the standard meteorological element method or the empirical global pressure and temperature (GPT) model; φ is the latitude of the measurement station; and h 0 is the elevation of the measurement station. P s is not the actual measured atmospheric pressure, so the obtained ZHD value is not accurate. Although using an inaccurate prior ZHD value cannot directly lead to obtaining an accurate ZWD value, it can obtain a relatively accurate ZTD value.
(2)
PWV retrieval:
After obtaining an accurate ZTD value, the wet delay is calculated as below:
ZWD = ZTD ZHD
where the ZHD is calculated using Equation (3), and the pressure is taken from ERA5. Then, the ZWD is converted into the PWV (unit: m) [36]:
PWV = κ × ZWD
where κ is the conversion factor, which can be expressed as
κ = 10 6 ρ l w R w ( k 2 + k 3 T m )
where ρ l w is the density of liquid water and takes the value 1000   kg / m 3 ; R w is the specific gas constant for water vapor, which takes the value of 461.495   J / ( k g K ) ; k 2 and k 3 are the atmospheric refractivity constants, taking the values of 0.1625   K / h P a and 0.03776 × 10 5   K 2 / h P a , respectively; and T m is the atmospheric weighted mean temperature (K). In this study, we used the Bevis formula improved by Yao et al. [37] based on 10 years of data from 135 global radiosonde stations:
T m = 0.8116 T s + 43.69
where T s is the observed surface temperature, which can be derived based on ERA5.
(3)
PWV retrieval based on ERA5: ERA5 is the fifth-generation atmospheric reanalysis dataset of the global climate from January 1940 to the present, produced by the ECMWF. The retrieval in this case utilized the relative humidity, air pressure, and temperature from the ERA5 hourly data on a pressure-level dataset to calculate the PWV. The formula is as follows:
PWV = 1 g P b o t t o m P t o p q d P
where q is the specific humidity ( % RH ); g is the gravity acceleration of Earth ( m / s 2 ); P is the pressure ( hPa ) between the bottom and top of a certain atmosphere layer; P b o t t o m is the atmospheric pressure ( hPa ) at the elevation of the measurement station; and P t o p is the pressure ( hPa ) at the top of the atmosphere.
(4)
PWV retrieval based on radiosondes: The University of Wyoming Atmospheric Science Radiosonde Archive (uwyo.edu) provides radiosonde data for global international exchange stations. The data files include atmospheric pressure, altitude, temperature, dew point temperature, relative humidity, wind direction, and water vapor mixing ratio for each layer. Using the water vapor mixing ratio m x , the specific humidity q can be calculated as follows:
q = m x 1 + m x .
The discrete form of Equation (9) can be used:
PWV = 1 ρ w i = 1 n q ¯ i g ¯ i Δ p i
In the equation, i = 1 , 2 , , n represents the ith atmospheric layer, q ¯ i represents the average specific humidity of the ith atmospheric layer, g ¯ i represents the average acceleration due to gravity of the ith atmospheric layer (m/s2), and Δ p i denotes the difference in pressure between the bottom and top of the ith atmospheric layer ( hPa ).

3. Results and Discussion

The experiments are divided into two parts in this section. In the first part, using GPS/Galileo observations, we processed 80 stations from the IGS for 30 days in 2022 to assess the performance of the real-time ZTD solution based on BE-PPP and RT-PPP. In the second part, we processed 20 stations’ GPS/Galileo observations from the EPN for 30 days in 2022 to assess the performance of the real-time PWV solution based on BE-PPP and RT-PPP. The EAR5 and RDS data were used to validate the PWV data. We used the mean bias and the standard deviation (STD) as the accuracy indexes. Compared with the mean bias, the STD, an indicator of the stability of the ZTD valuation, is more important, which is a measure of the suitability of the ZTD valuation for NWP forecasting [38].

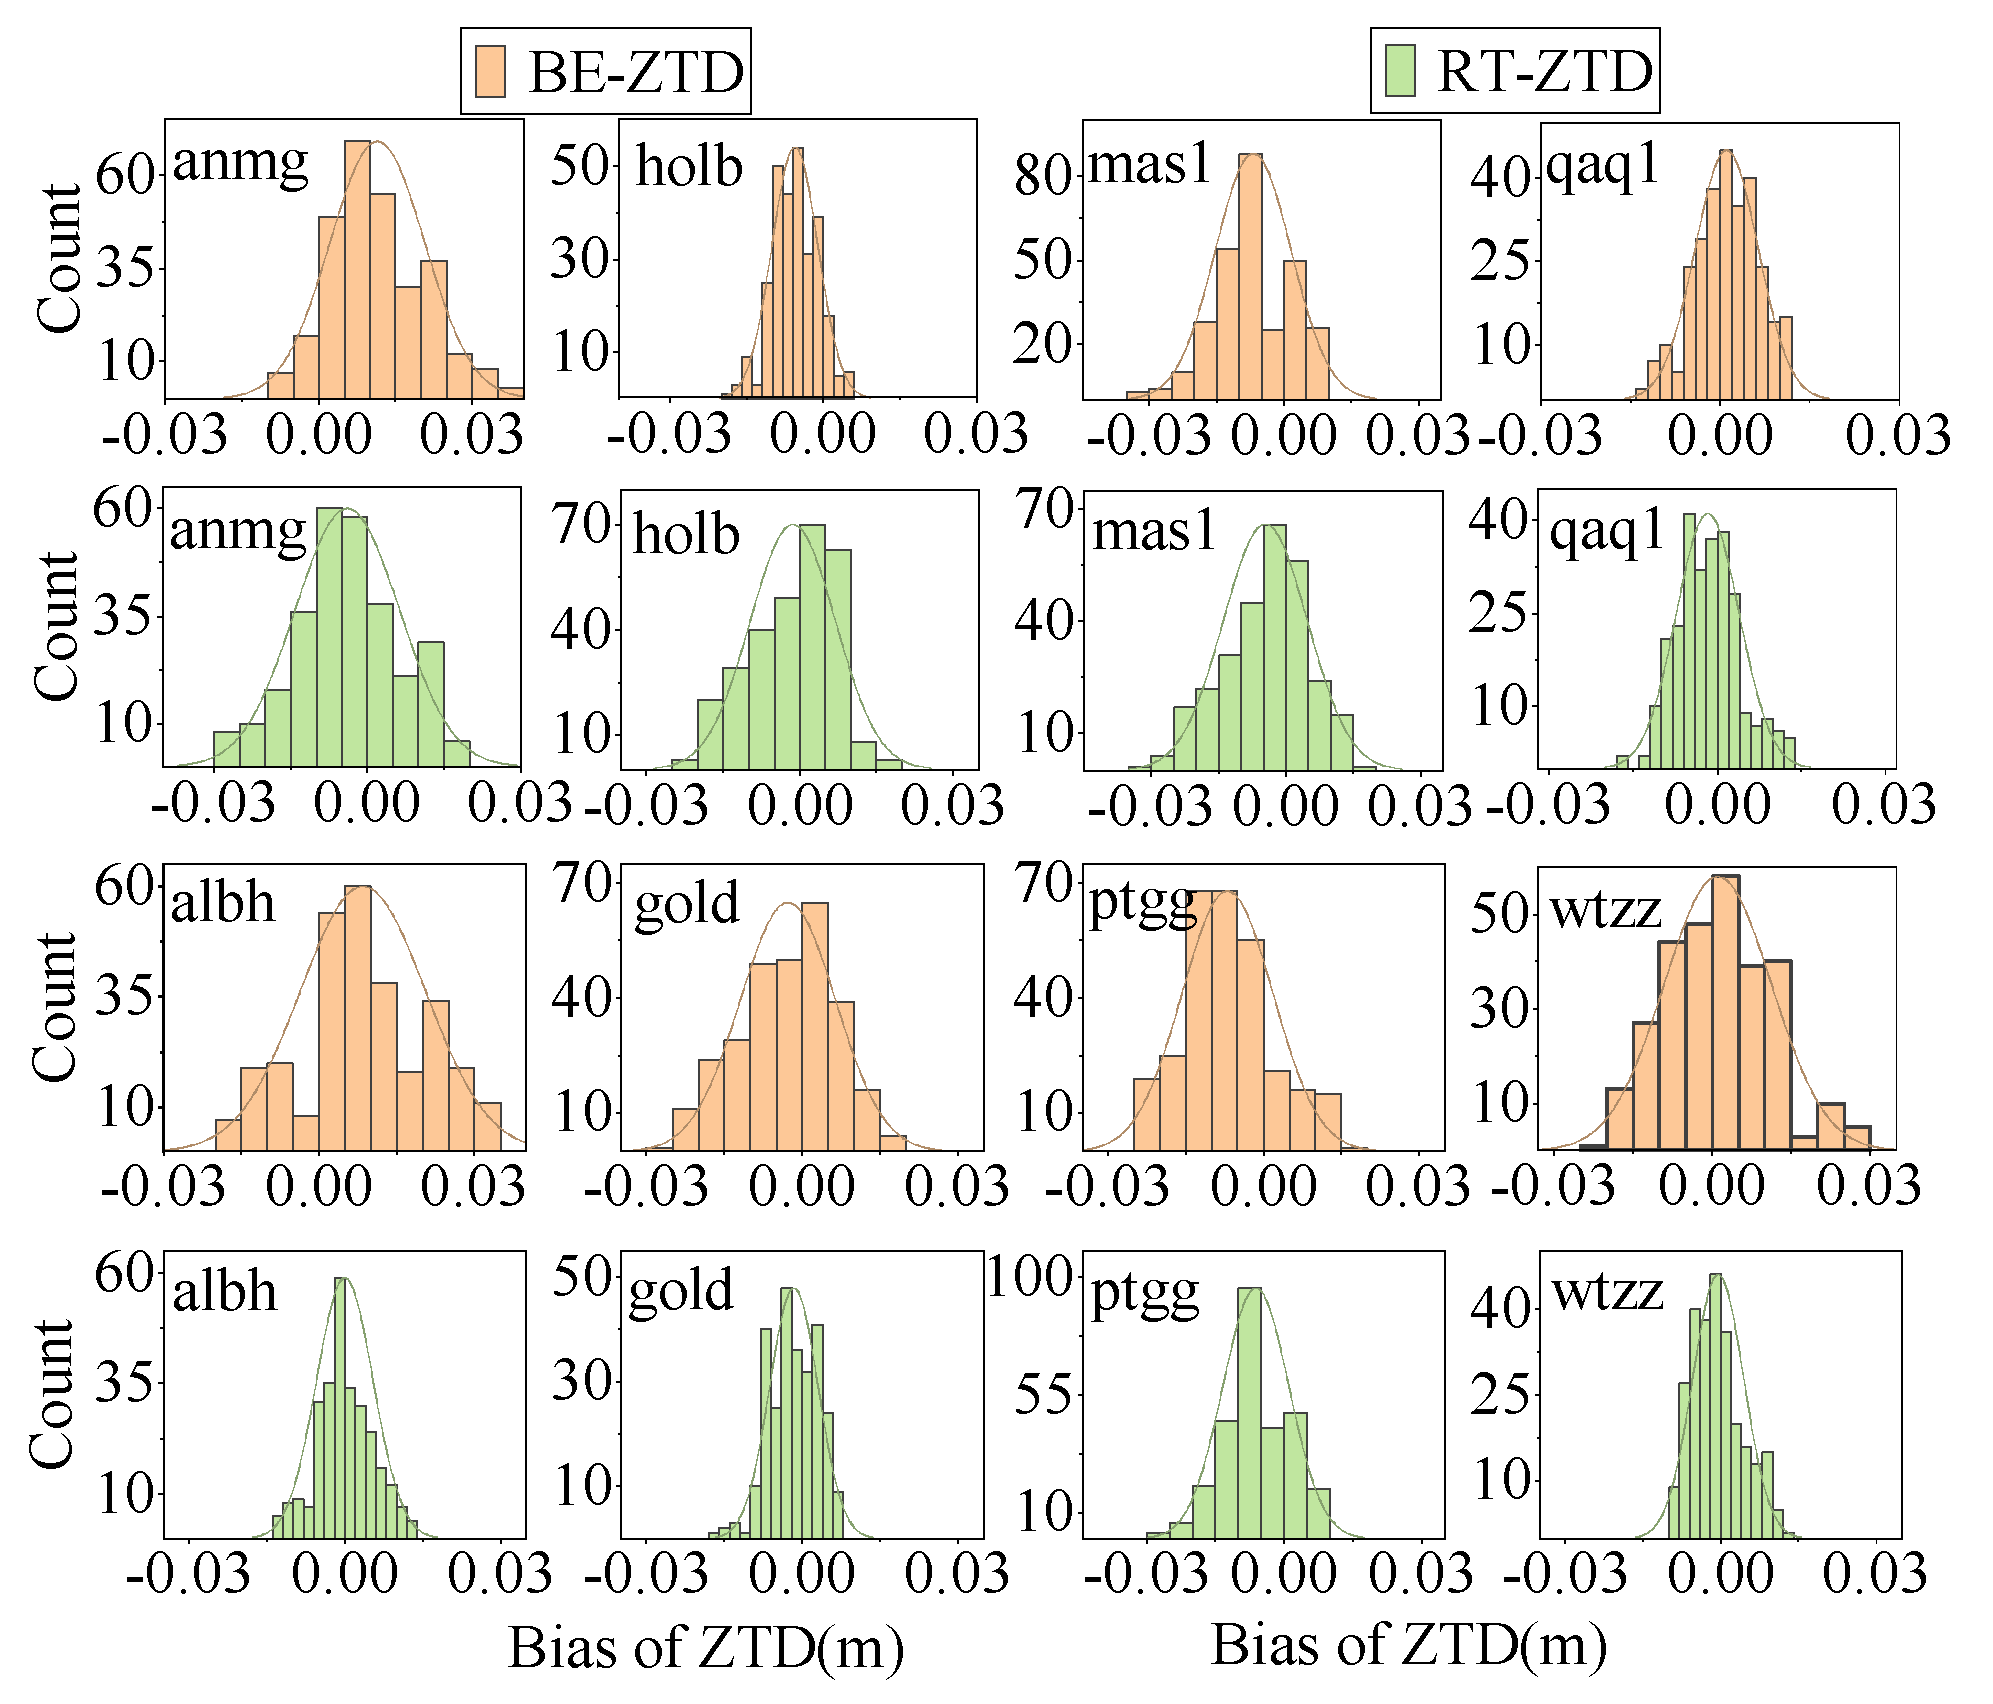
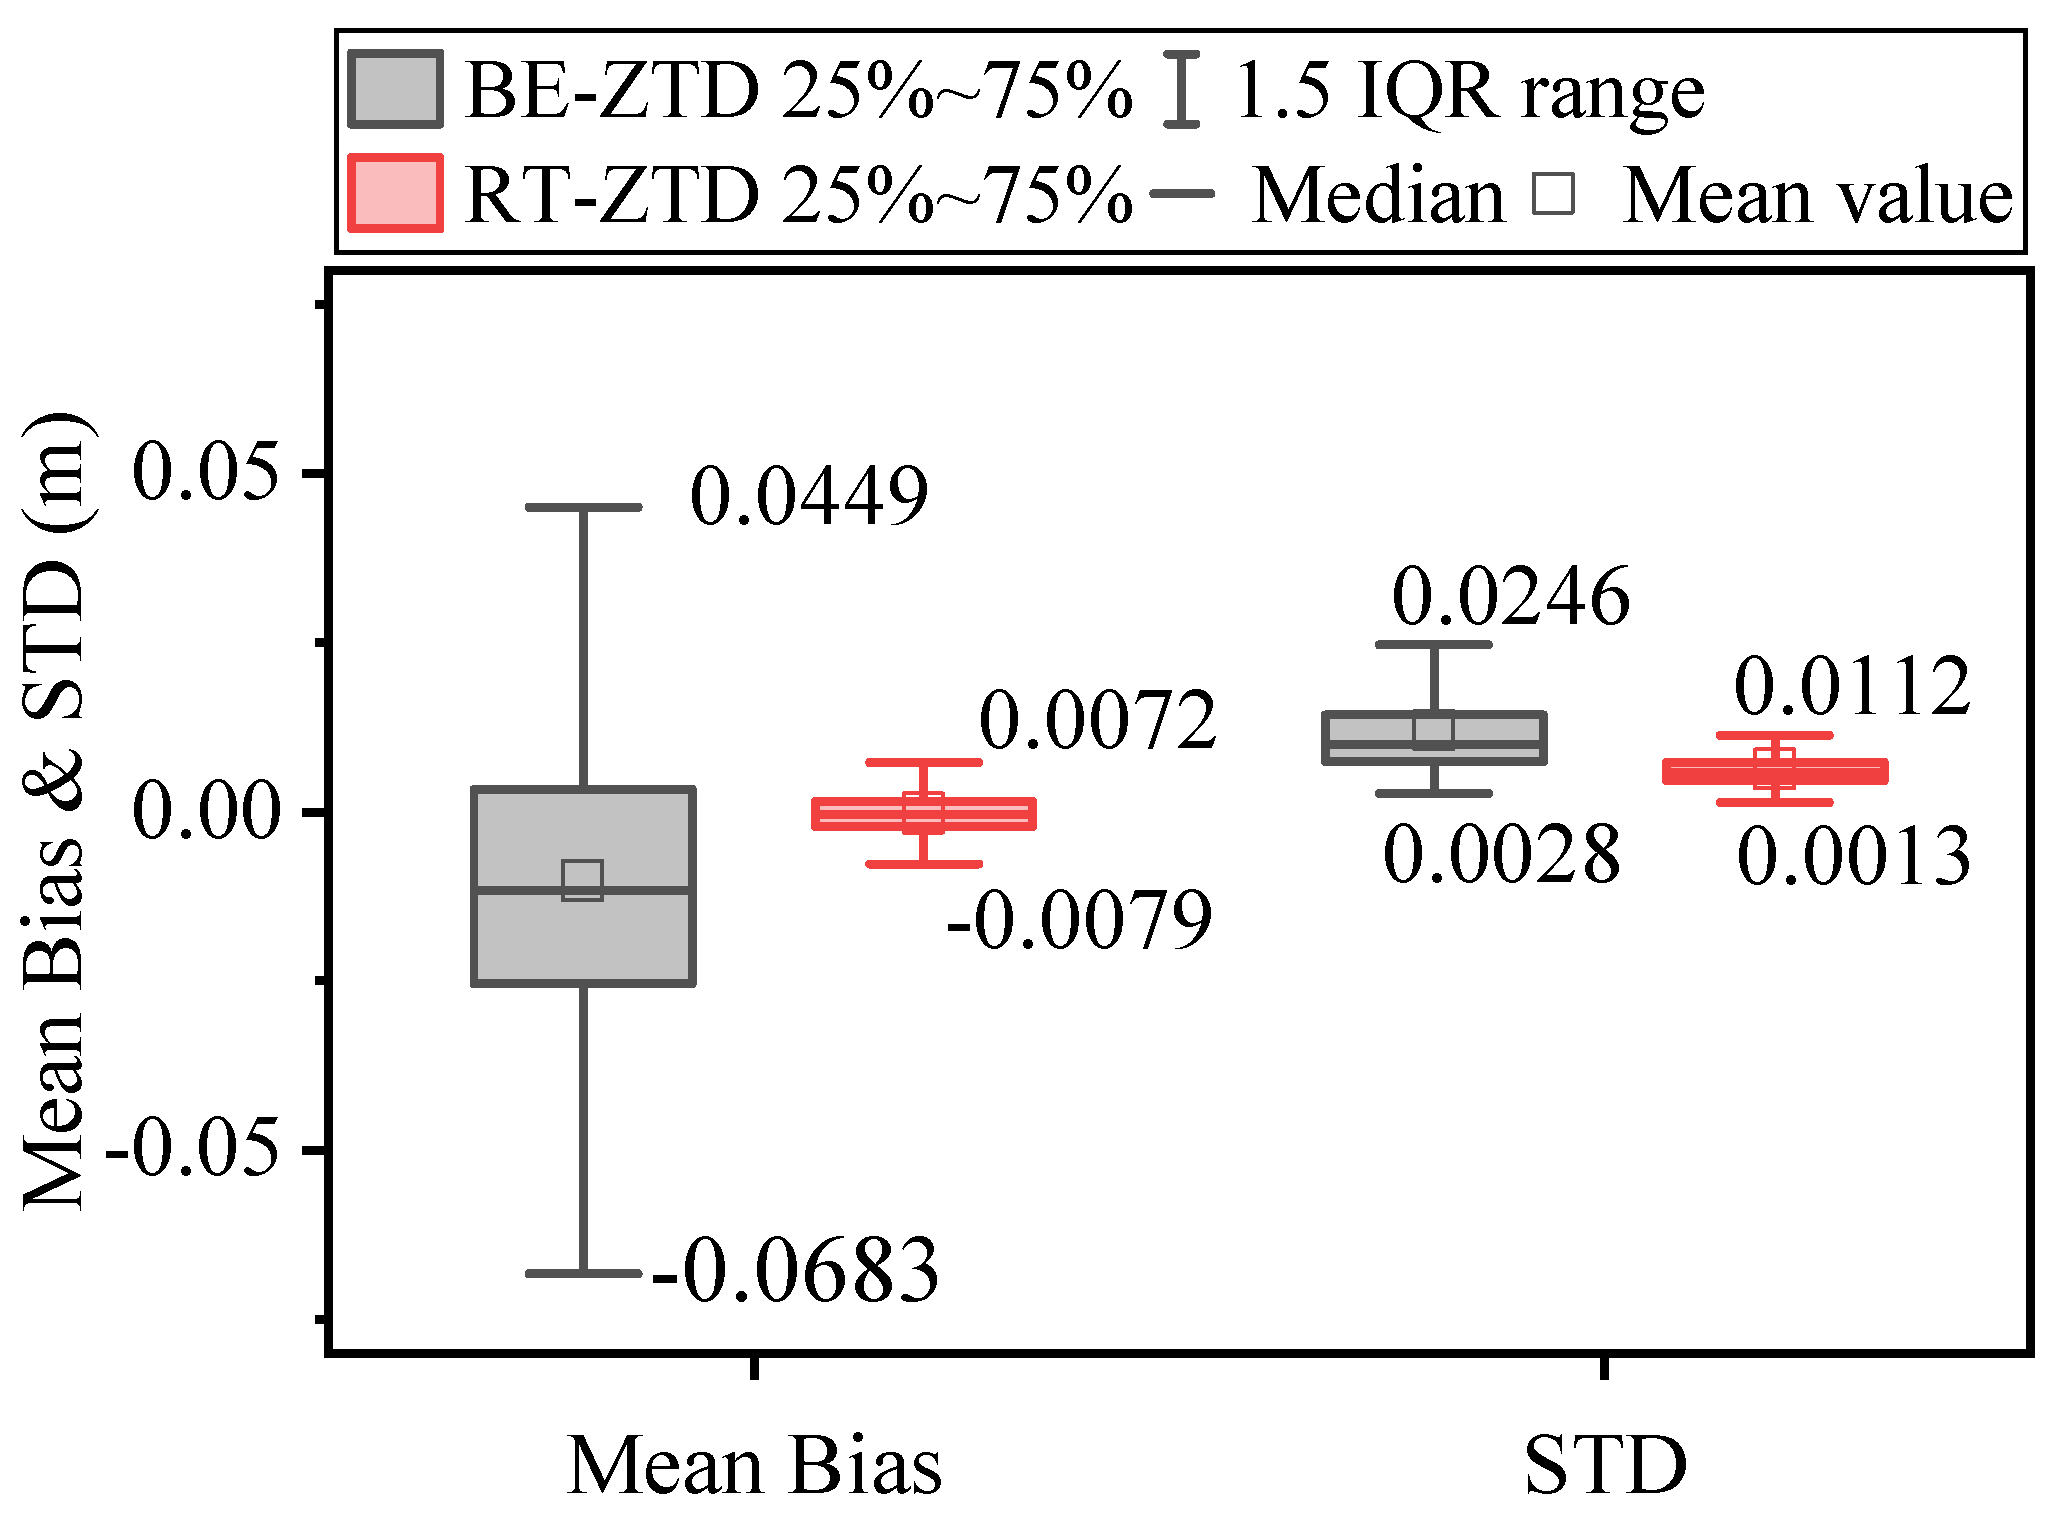
3.1. Evaluation of Real-Time ZTD

Two real-time ZTD products, denoted as BE-ZTD and RT-ZTD, were obtained using the BE-PPP and RT-PPP models, respectively, and the final tropospheric product (IGS-ZTD) from the IGS Analysis Center was used for validation to assess the accuracy of the ZTD. The time series of the BE-ZTD, RT-ZTD, and IGS-ZTD at the DYNG stations on December 21, 2022 (DOY 356), is shown in Figure 3. It can be seen that the BE-ZTD agrees better with the IGS-ZTD than the RT-ZTD does in the DYNG station. Statistically, the mean bias and STD of the RT-ZTD’s deviation are −5.7 mm and 6.3 mm, respectively, and the mean bias and STD of the BE-ZTD’s deviation are −2.6 mm and 7.1 mm, respectively. Undoubtedly, the mean bias of the BE-ZTD is less than that of the RT-ZTD, but the difference in the STD between the two models is small, specifically 0.8 mm. In addition, we analyzed the bias distribution of the RT-ZTD and BE-ZTD at eight stations in the same period. As can be easily seen in Figure 4, the largest departures of both BE-ZTD and RT-ZTD are no more than 3 cm. The mean STDs of the BE-ZTD and RT-ZTD at the eight stations are 8.6 mm and 7.0 mm, respectively, showing agreement at the millimeter level, which indicates that the BE-PPP and RT-PPP solutions show comparable accuracy in the real-time estimation of the ZTD. The mean values of the ZTD biases from the eight stations are −0.1 mm for the BE-ZTD and −0.25 mm for the RT-ZTD. No obvious systematic biases can be seen between RT-ZTD and BE-ZTD.
To further validate the above conclusions, we analyzed the results of 80 IGS stations. For real-time ZTD products applied to NWP forecasting, the accuracy requirements of a 0.6 cm target and 3 cm threshold value need to be met [38]. Figure 5 depicts the mean bias and STD of the BE-ZTD and RT-ZTD from 80 IGS stations on 21 December 2022 (DOY 356). The bias of the RT-ZTD is −1.0–1.2 cm, and the bias of the BE-ZTD is −5.3–5.4 cm, as shown in subgraph (a). The STD of the ZTD differences is 0.4–1.4 cm for the RT-ZTD and 0.4–2.9 cm for the BE-ZTD, as shown in subgraph (b). It can be seen that the stability of the RT-ZTD is significantly better than that of the BE-ZTD. The performance is consistent among the stations for the RT-ZTD, whereas the BE-ZTD varies greatly among the different stations, with the more stable ones being consistent with the RT-ZTD, but the STDs of the stations all meet the threshold requirement.
To comprehensively compare the differences between the real-time ZTD estimated using RT-PPP and BE-PPP, the mean bias and STD of the 30-day RT-ZTD and BE-ZTD were determined and are plotted in Figure 6. Following the principle of 1.5 × I Q R (interquartile range), after excluding the outliers, the data availability was 95.8% for both BE-ZTD and RT-ZTD. Figure 5 shows that the mean bias of the RT-ZTD is −0.79–0.72 cm, while that of BE-PPP is −6.83 cm to 4.49 cm. The STD of the RT-ZTD is 0.13–1.12 cm, and that of BE-PPP is 0.28–2.46 cm. The average bias value is −0.04 cm for the RT-ZTD, and the average STD value is 0.6 cm, while the average bias value is -1.11 cm for the BE-ZTD, and the average STD value is 1.07 cm. In summary, the ZTD products with real-time estimation of RT-PPP are characterized by their high accuracy and stability; however, the difference in the average STD between the BE-ZTD and RT-ZTD is only 4.7 mm, which indicates that it is feasible to use real-time BE-ZTD estimation to compute NWPs when the network link is outage. This is also consistent with the study of Pan et al., which reported a standard deviation of 15.7 mm for the inverted ZTD with real-time PPP based on the Galileo broadcast ephemeris [39].

3.2. Evaluation of the PWVs Derived from BE-PPP

(1)
Validation with ERA5: For the validation of the PWV derived from BE-PPP, the PWV series retrieved from RT-PPP and BE-PPP processing were compared with the series from ERA5. The temporal resolution of the RT-PPP and BE-PPP PWV solutions was 30 s, while the PWV derived from ERA5 was 1 h. To avoid additional interpolation, only PWV retrieval at common epochs of each PWV series was taken into account for the comparison. Figure 7 shows the PWV comparisons of BE-PPP, RT-PPP, and ERA5 for 720 consecutive hours at the EPN station SAS2.
The PWV retrieved with RT-PPP (blue) and BE-PPP (red) both exhibit excellent agreement with the ERA5 PWV (black), while the RT-PWV outperforms the BE-PWV. The mean bias is −1.41 mm for the RT-PWV and −2.41 mm for the BE-PWV. The STD values of the RT-PWV and BE-PWV are 1.02 mm and 2.53 mm, respectively. The difference in the STD values between the RT-PWV and BE-PWV is at the millimeter level. To further compare the differences between BE-PWV and RT-PWV, data from 20 EPN stations were used for a statistical analysis in this paper. As shown in Figure 8, the mean bias of the BE-PWV is −2.14–6.01 mm, while the mean bias of the RT-PWV is −3.98–3.11 mm. The majority of the stations exhibit a higher mean bias for the BE-PWV compared to that of the RT-ZTD, although there are a few stations where the BE-PWV outperforms the RT-PWV. Subgraph (b) shows the variation in the STD among the stations. For the BE-PWV, the STD ranges from 1.39 to 2.53 mm, while for the RT-PWV, it ranges from 0.85 to 1.25 mm. The stability of the RT-PWV is observed to be higher compared to that of the BE-PWV. The mean biases for the RT-PWV and BE-PWV from the 20 stations are −0.14 mm and 1.84 mm, respectively. Additionally, the STDs for the RT-PWV and BE-PWV are 0.96 mm and 1.69 mm, respectively. These findings further support the aforementioned conclusion that the disparity between RT-PWV and BE-PWV is negligible. Both RT-PPP and BE-PPP meet the accuracy requirements of a 1 mm target and 5 mm threshold value for real-time PWV products applied to NWP forecasting [40]. The results indicate that the difference in PWV derived from the BE-PPP and RT-PPP solutions is small, while BE-PPP demonstrates an accuracy and stability sufficient enough to serve as a viable alternative solution to RT-PPP.
(2)
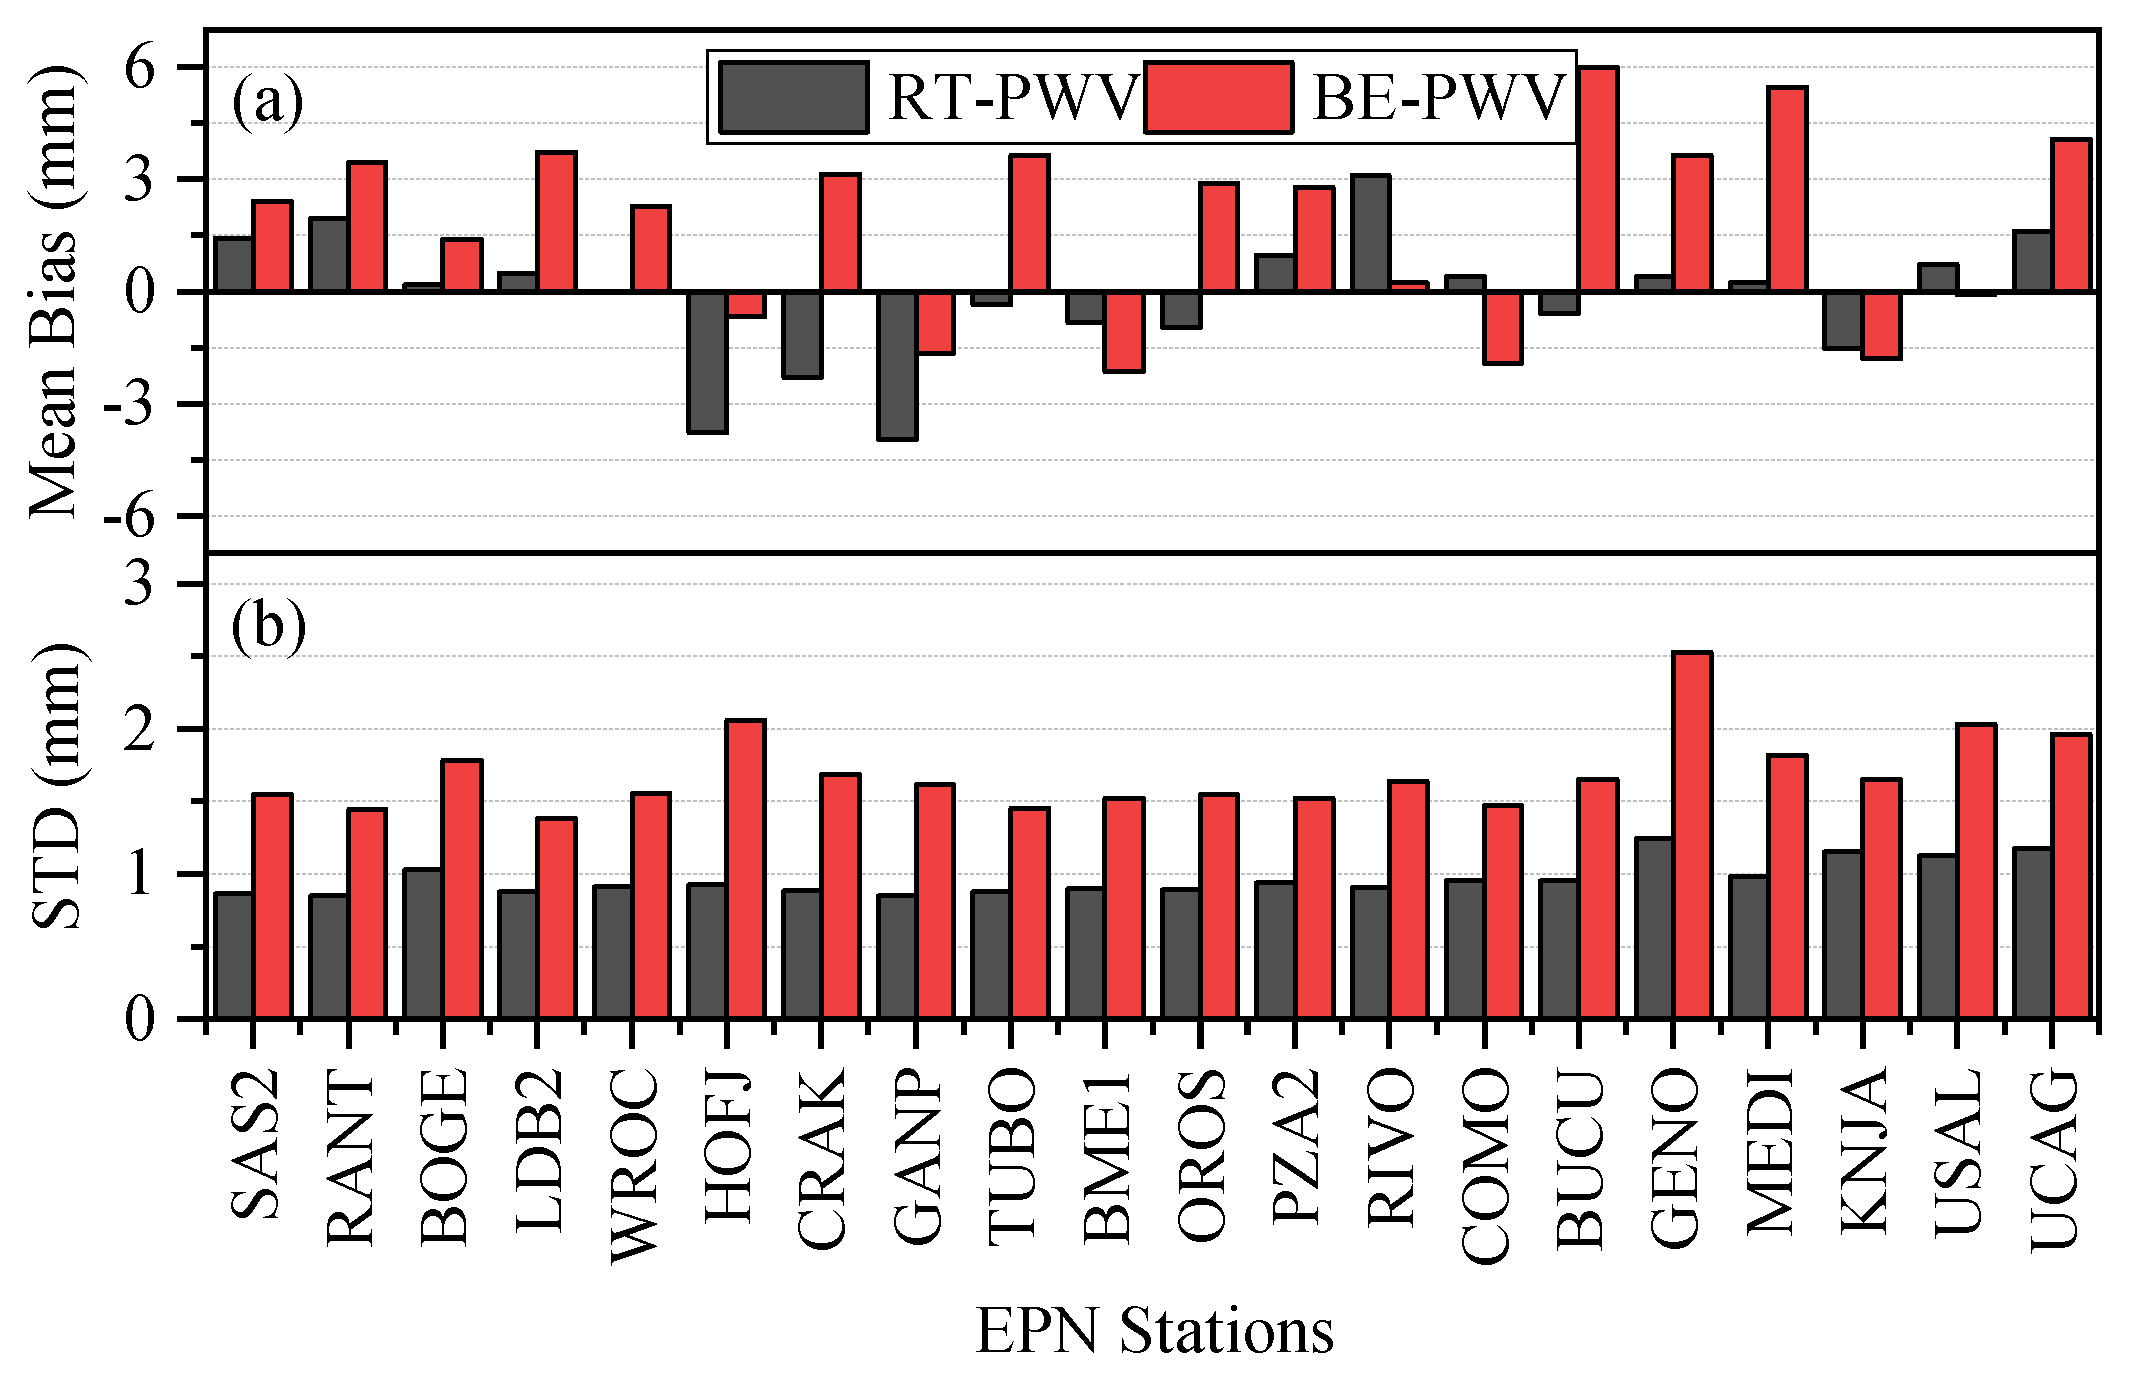
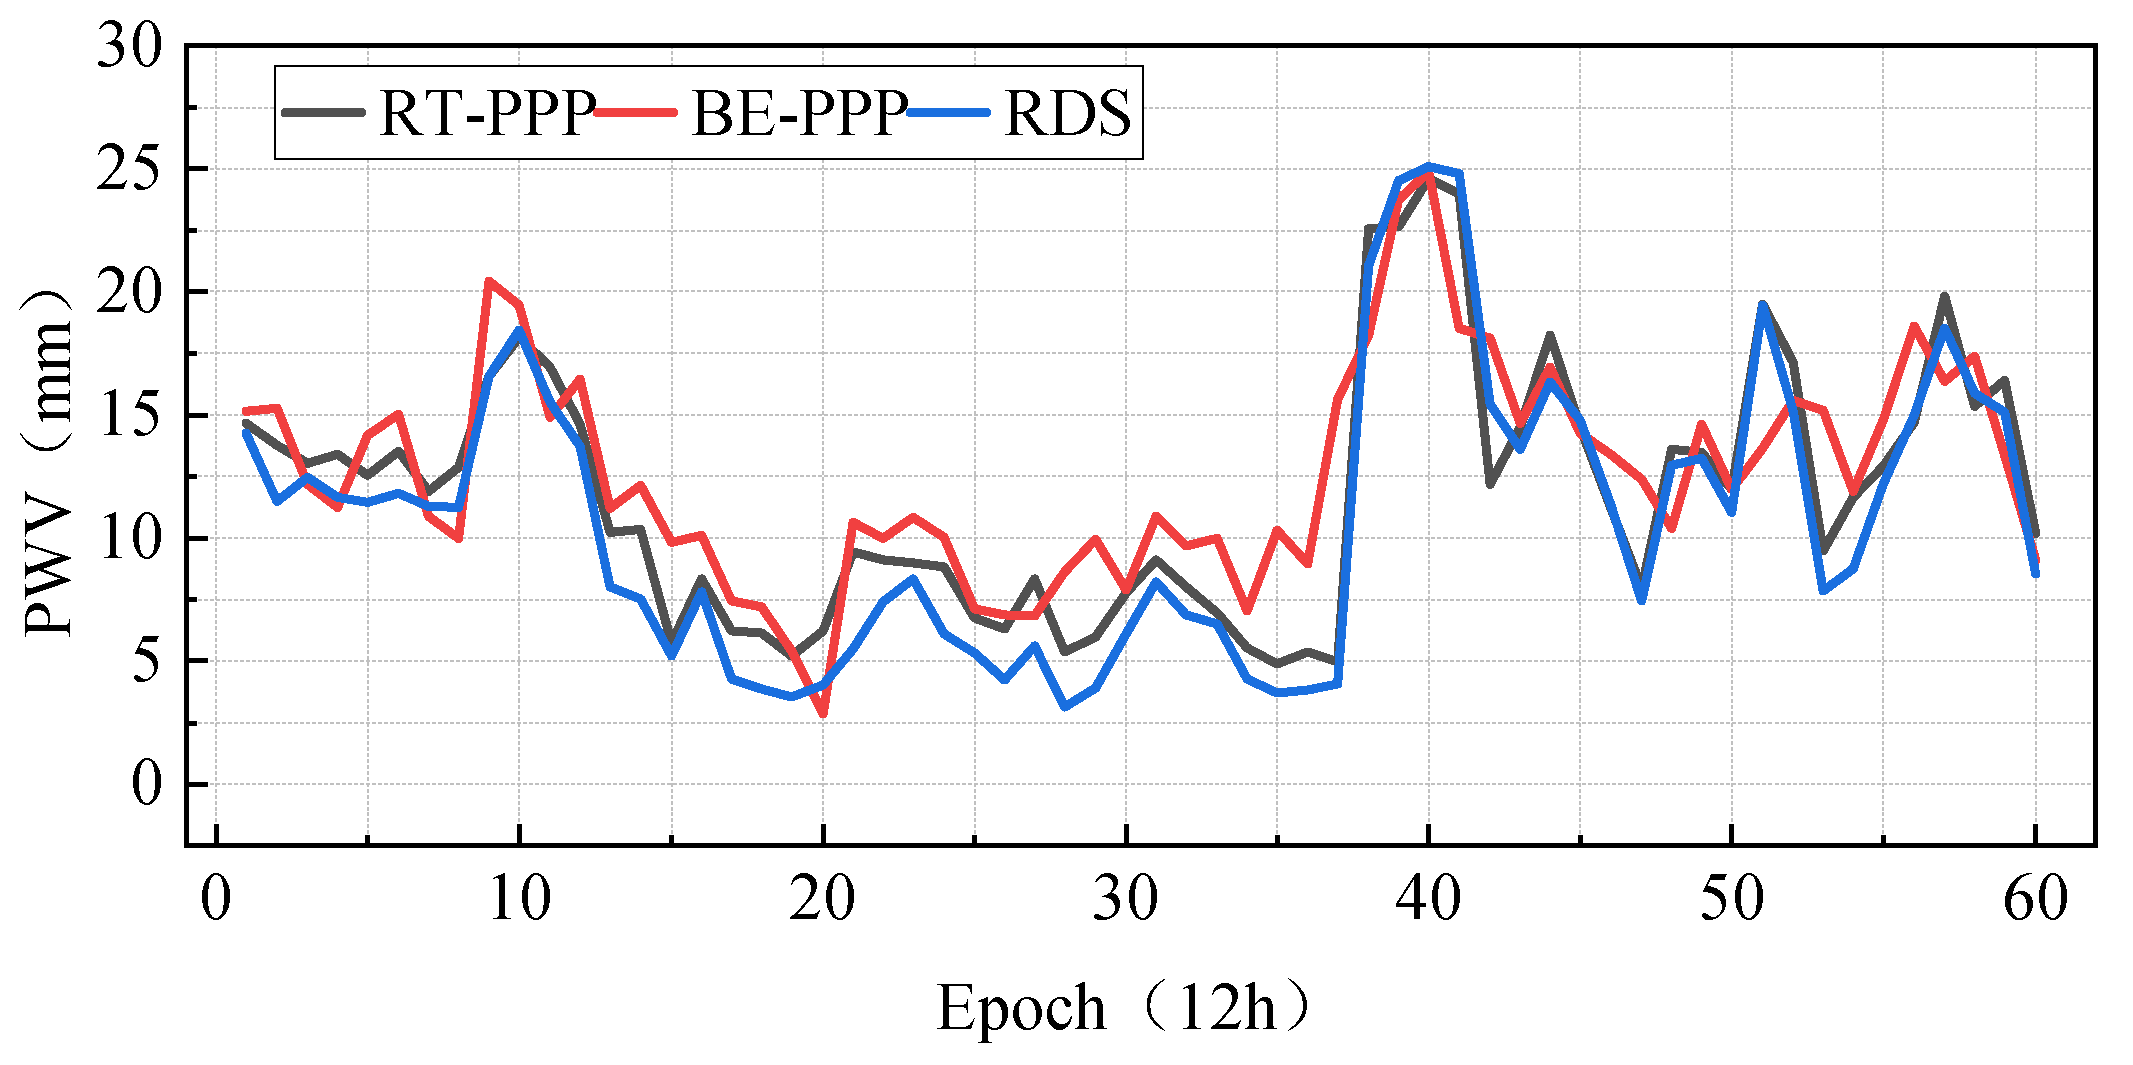
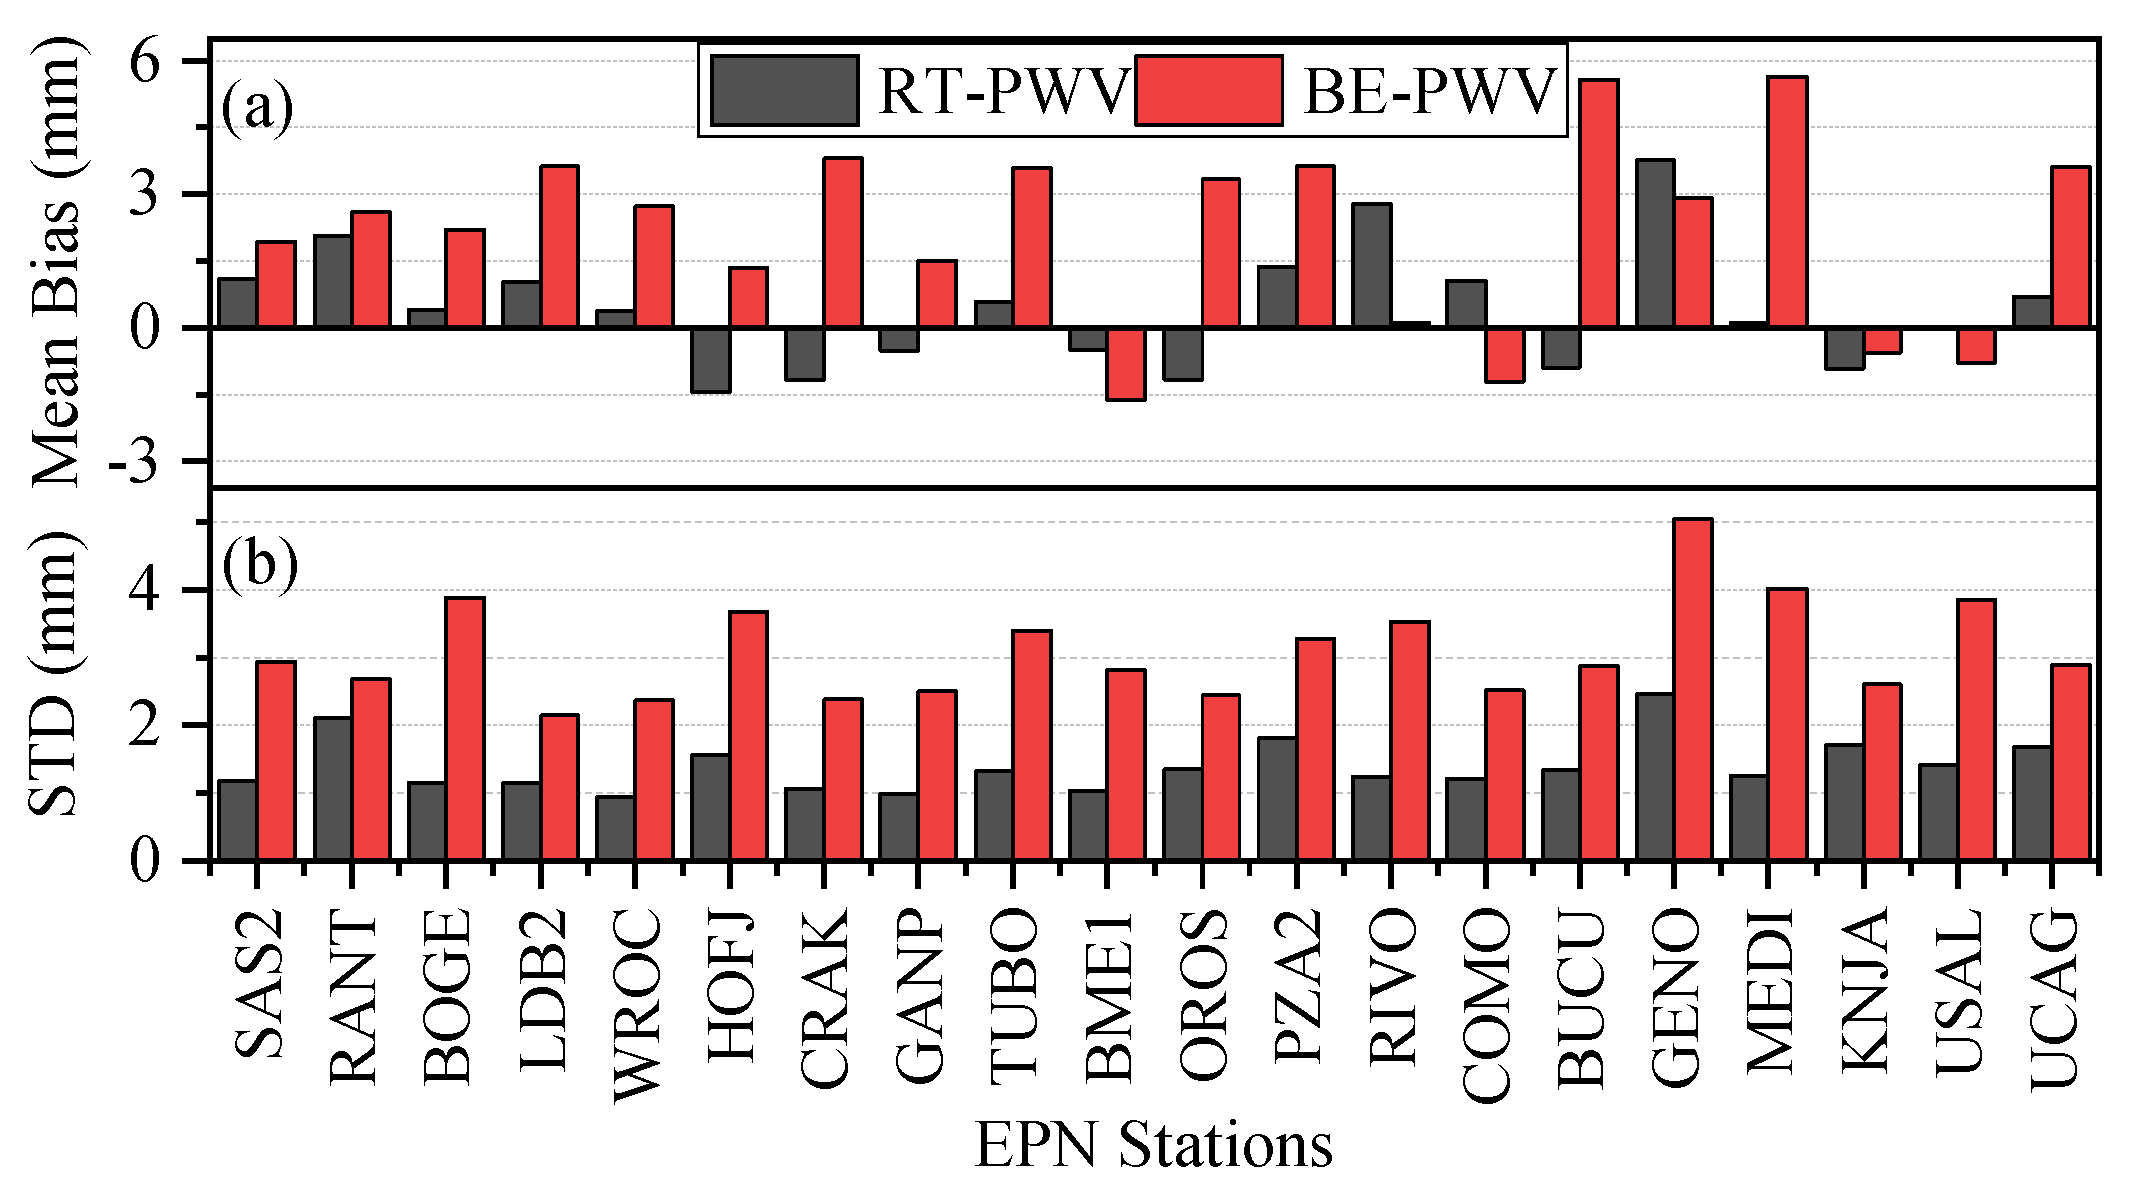
Validation with radiosondes: The PWV values derived from the BE-PPP and RT-PPP analysis compared to the RDS PWV were also validated. Figure 9 presents the PWV results obtained from the BE-PPP, RT-PPP, and RDS solutions at station SAS2. Since the RDS provides PWV data every 12 or 24 h, the comparison of the BE-PWV, RT-PWV, and RDS-PWV is performed at common time intervals. It can be observed that both BE-PPP and RT-PPP accurately estimate the PWV, with differences within a few millimeters compared to the RDS-PWV. Additionally, the STD of the PWV differences between these two methods is approximately 0.56 mm. The mean value and STD of the PWV differences for the BE-PPP and RT-PPP solutions with respect to the RDS solution from 20 EPN stations in Europe with nearby RDS launch sites are presented in Figure 10. In subgraph (a), it can be observed that the mean bias of the BE-PWV ranges from −1.61 mm to 6.57 mm, while the mean bias of the RT-PWV ranges from −1.17 mm to 3.77 mm. At most stations, the mean bias of the RT-PWV is smaller than that of the BE-PWV. Subgraph (b) illustrates the variation in the STD among the stations, with a range of 2.15 mm to 4.96 mm for the BE-PWV and 0.93 mm to 2.45 mm for the RT-PWV. It is noteworthy that the stability of the RT-PWV surpasses that of the BE-PWV, as indicated by the lower STD values across all the stations examined. The average biases across all 20 stations were found to be 0.43 mm for the RT-PWV and 2.55 mm for the BE-PWV, while the average STD values were determined to be 1.39 mm for the RT-PWV and 3.09 mm for the BE-PWV, which satisfy the accuracy requirements. This is consistent with the mean bias of 2 mm and STD of 2.5 mm [39].

4. Conclusions

This paper presents a real-time ZTD/PWV processing solution using the BE-PPP method. Data from 80 IGS stations and 20 EPN stations were processed consecutively for 30 days, employing both the BE-PPP and RT-PPP methods. The feasibility and accuracy of real-time ZTD/PWV data retrieval using the BE-PPP method were thoroughly analyzed and assessed, while the disparities between the BE-PPP and RT-PPP methods were also investigated.
The results demonstrate the stability of the ZTD estimation obtained from BE-PPP. The mean difference between BE-ZTD and IGS-ZTD was −1.03 cm, with an average STD of 1.07 cm. On the other hand, RT-PPP yielded a mean bias of −0.02 cm for ZTD retrieval, accompanied by an average STD of 0.6 cm. Notably, the discrepancy between RT-PPP and BE-PPP is smaller, with only a 4.7 mm STD value.
In terms of PWV retrieval, the PWVs obtained from both the BE-PPP and RT-PPP solutions exhibited excellent agreement with the ERA5-PWV and RDS-PWV solutions, displaying differences of a magnitude of only a few millimeters. When validated against the ERA5-PWV, the STD for the BE-PWV was 1.69 mm, while for the RT-PWV, it was 0.96 mm. The disparity in the STD between RT-PPP and BE-PPP amounts to merely 0.73 mm. Upon validation with the RDS-PWV, the STD values were determined to be 3.09 mm for the BE-PWV and 1.39 mm for the RT-PWV, indicating an approximate difference of around 2 mm, which satisfies the accuracy requirements.
Therefore, we can conclude that the real-time retrieval of ZTD/PWV values using the BE-PPP solution is feasible and meets the accuracy requirements. Moreover, the discrepancy between BE-PPP and RT-PPP is minimal, making BE-PPP an effective supplement to the GNSS RT-PPP ZTD/PWV retrieval solution.

Author Contributions

Conceptualization: Z.X. and L.T.; data curation: S.L.; funding acquisition: Z.X.; methodology: Y.X.; resources: Y.X. and G.Z.; software: S.L.; validation: L.T.; writing—original draft: S.L., N.Y. and G.Z.; writing—review and editing: Z.X. All authors have read and agreed to the published version of the manuscript.

Funding

This research was funded by National Natural Science Foundation of China under Grant 42030109, and Liaoning Revitalization Talents Program under Grant XLYC2203162.

Institutional Review Board Statement

Not applicable.

Informed Consent Statement

Not applicable.

Data Availability Statement

The data presented in this study are openly available in The International GNSS Service (IGS) for observation files, broadcast ephemeris, and final products. Wuhan University (WHU) for real-time orbit and clock products. The European Centre for Medium-Range Weather Forecasts (ECMWF) for the ERA5 data. Additionally, the University of Wyoming for the radiosonde data.

Acknowledgments

F. Zhou is acknowledged for the open-sourcing of the GAMP GNSS data processing software. The International GNSS Service (IGS) is appreciated for supplying the observation files, broadcast ephemeris, and final products. Wuhan University (WHU) is acknowledged for providing real-time orbit and clock products. The European Centre for Medium-Range Weather Forecasts (ECMWF) is recognized for supplying the ERA5 data. Additionally, the University of Wyoming is thanked for providing the radiosonde data.

Conflicts of Interest

The authors declare no conflict of interest.

References

  1. Heffernan, O. Water vapour warming. Nat. Rep. Clim. Change 2010, 1003, 24. [Google Scholar] [CrossRef]
  2. Absolute Accuracy of Water Vapor Measurements from Six Operational Radiosonde Types Launched during AWEX-G and Implications for AIRS Validation-Miloshevich-2006-Journal of Geophysical Research: Atmospheres-Wiley Online Library [WWW Document]. Available online: https://agupubs.onlinelibrary.wiley.com/doi/full/10.1029/2005JD006083 (accessed on 3 August 2024).
  3. Mattar, C.; Sobrino, J.A.; Julien, Y.; Morales, L. Trends in column integrated water vapour over Europe from 1973 to 2003. Int. J. Climatol. 2011, 31, 1749–1757. [Google Scholar] [CrossRef]
  4. Iwabuchi, T.; Naito, I.; Mannoji, N. A comparison of Global Positioning System retrieved precipitable water vapor with the numerical weather prediction analysis data over the Japanese Islands. J. Geophys. Res. 2000, 105, 4573–4585. [Google Scholar] [CrossRef]
  5. Beckman, B. A water-vapor radiometer error model. IEEE Trans. Geosci. Remote Sens. 1985, GE-23, 474–478. [Google Scholar] [CrossRef]
  6. Elgered, G.; Davis, J.L.; Herring, T.A.; Shapiro, I.I. Geodesy by radio interferometry: Water vapor radiometry for estimation of the wet delay. J. Geophys. Res. 1991, 96, 6541–6555. [Google Scholar] [CrossRef]
  7. Straub, C.; Murk, A.; Kämpfer, N. MIAWARA-C, a new ground based water vapor radiometer for measurement campaigns. Atmos. Meas. Tech. 2010, 3, 1271–1285. [Google Scholar] [CrossRef]
  8. Bevis, M.; Businger, S.; Herring, T.A.; Rocken, C.; Anthes, R.A.; Ware, R.H. GPS meteorology: Remote sensing of atmospheric water vapor using the global positioning system. J. Geophys. Res. 1992, 97, 15787–15801. [Google Scholar] [CrossRef]
  9. Li, X.; Zus, F.; Lu, C.; Dick, G.; Ning, T.; Ge, M.; Wickert, J.; Schuh, H. Retrieving of atmospheric parameters from multi-GNSS in real time: Validation with water vapor radiometer and numerical weather model. JGR Atmos. 2015, 120, 7189–7204. [Google Scholar] [CrossRef]
  10. Vaquero-Martínez, J.; Anton, M.; Román, R.; Cachorro, V.E.; Wang, H.; Abad, G.G.; Ritter, C. Water vapor satellite products in the European Arctic: An inter-comparison against GNSS data. Sci. Total Environ. 2020, 741, 140335. [Google Scholar] [CrossRef] [PubMed]
  11. He, S.; Becker, D.; Hobiger, T. The impact of GNSS multipath errors on ZTD estimates based on PPP. In Proceedings of the Copernicus Meetings, Potsdam, Germany, 5–8 September 2022. [Google Scholar]
  12. Lu, C.; Li, X.; Ge, M.; Heinkelmann, R.; Nilsson, T.; Soja, B.; Dick, G.; Schuh, H. Estimation and evaluation of real-time precipitable water vapor from GLONASS and GPS. GPS Solut. 2016, 20, 703–713. [Google Scholar] [CrossRef]
  13. Lu, C.; Feng, G.; Zheng, Y.; Zhang, K.; Tan, H.; Dick, G.; Wickert, J. Real-time retrieval of precipitable water vapor from Galileo observations by using the MGEX network. IEEE Trans. Geosci. Remote Sens. 2020, 58, 4743–4753. [Google Scholar] [CrossRef]
  14. Jiang, N.; Gao, Z.; Wu, Y.; Xu, Y.; Xu, T.; Li, S.; Guo, A. PWV Retrieval Performance Evaluation for the Fresh BDS-3 With Multisource Data. Earth Space Sci. 2023, 10, e2023EA002923. [Google Scholar] [CrossRef]
  15. Nykiel, G.; Wolak, P.; Figurski, M. Atmospheric opacity estimation based on IWV derived from GNSS observations for VLBI applications. GPS Solut. 2018, 22, 9. [Google Scholar] [CrossRef]
  16. Li, H.; Choy, S.; Wang, X.; Liang, H.; Purwar, S.; Zhang, K. Investigating the Optimal Spatial Resolution for Assimilating GNSS PWV into an NWP System to Improve the Accuracy of Humidity Field. IEEE J. Sel. Top. Appl. Earth Obs. Remote Sens. 2023, 16, 6876–6888. [Google Scholar] [CrossRef]
  17. Zhao, Q.; Liu, K.; Sun, T.; Yao, Y.; Li, Z. A novel regional drought monitoring method using GNSS-derived ZTD and precipitation. Remote Sens. Environ. 2023, 297, 113778. [Google Scholar] [CrossRef]
  18. Elsobeiey, M.; Al-Harbi, S. Performance of real-time Precise Point Positioning using IGS real-time service. GPS Solut. 2016, 20, 565–571. [Google Scholar] [CrossRef]
  19. Lu, C.; Chen, X.; Liu, G.; Dick, G.; Wickert, J.; Jiang, X.; Zheng, K.; Schuh, H. Real-time tropospheric delays retrieved from multi-GNSS observations and IGS real-time product streams. Remote Sens. 2017, 9, 1317. [Google Scholar] [CrossRef]
  20. Shi, J.; Xu, C.; Li, Y.; Gao, Y. Impacts of real-time satellite clock errors on GPS precise point positioning-based troposphere zenith delay estimation. J. Geod. 2015, 89, 747–756. [Google Scholar] [CrossRef]
  21. Hadas, T.; Hobiger, T.; Hordyniec, P. Considering different recent advancements in GNSS on real-time zenith troposphere estimates. GPS Solut. 2020, 24, 99. [Google Scholar] [CrossRef]
  22. Zhao, Q.; Wang, W.; Yin, J.; Wu, K.; Zhou, L.; Yao, Y.; Wang, P.; Su, J.; Wang, X.; Wang, H.; et al. Real-time retrieval of high-precision ZTD maps using GNSS observation. Geod. Geodyn. 2024, 15, 1–12. [Google Scholar] [CrossRef]
  23. Yuan, Y.; Zhang, K.; Rohm, W.; Choy, S.; Norman, R.; Wang, C. Real-time retrieval of precipitable water vapor from GPS precise point positioning. JGR Atmos. 2014, 119, 10044–10057. [Google Scholar] [CrossRef]
  24. Tunalı, E. Water vapor monitoring with IGS RTS and GPT3/VMF3 functions over Turkey. Adv. Space Res. 2022, 69, 2376–2390. [Google Scholar] [CrossRef]
  25. Liu, W.; Zhang, L.; Xiong, S.; Huang, L.; Xie, S.; Liu, L. Investigating the ERA5-Based PWV Products and Identifying the Monsoon Active and Break Spells with Dense GNSS Sites in Guangxi, China. Remote Sens. 2023, 15, 4710. [Google Scholar] [CrossRef]
  26. Li, H.; Li, X.; Kang, Q. Handling method for outages of IGS real-time service (RTS) in GNSS real-time sensing of atmospheric water vapor. IEEE J. Sel. Top. Appl. Earth Obs. Remote Sens. 2023, 16, 8310–8318. [Google Scholar] [CrossRef]
  27. Yang, H.; He, X.; Ferreira, V.; Ji, S.; Xu, Y.; Song, S. Assessment of precipitable water vapor retrieved from precise point positioning with PPP-B2b service. Earth Sci. Inf. 2023, 16, 315–328. [Google Scholar] [CrossRef]
  28. Xu, Y.; Zhao, P.; Wang, J.; Meng, X. Performance Assess of BDS-3 PPP-B2b Signal Service and Its Application in Precipitable Water Vapor Retrieval. In China Satellite Navigation Conference (CSNC 2024) Proceedings, Lecture Notes in Electrical Engineering; Yang, C., Xie, J., Eds.; Springer Nature: Singapore, 2024; pp. 118–131. [Google Scholar] [CrossRef]
  29. Carlin, L.; Hauschild, A.; Montenbruck, O. Precise point positioning with GPS and Galileo broadcast ephemerides. GPS Solut. 2021, 25, 77. [Google Scholar] [CrossRef]
  30. Chen, G.; Wei, N.; Li, M.; Zhao, Q.; Zhang, J. BDS-3 and GPS/Galileo integrated PPP using broadcast ephemerides. GPS Solut. 2022, 26, 129. [Google Scholar] [CrossRef]
  31. Haase, J.; Ge, M.; Vedel, H.; Calais, E. Accuracy and variability of GPS tropospheric delay measurements of water vapor in the western Mediterranean. J. Appl. Meteorol. 2003, 42, 1547–1568. [Google Scholar] [CrossRef]
  32. Wang, J.; Zhang, L.; Dai, A.; Van Hove, T.; Van Baelen, J. A near-global, 2-hourly data set of atmospheric precipitable water from ground-based GPS measurements. J. Geophys. Res. 2007, 112, 1–17. [Google Scholar] [CrossRef]
  33. GPS.GOV. Interface Control Documents: IS-GPS-200[DB/OL] (2022-08-22). Available online: https://www.gps.gov/technical/icwg/IS-GPS-200N.pdf (accessed on 8 July 2024).
  34. European GNSS Service Centre. Galileo-Open Service-Signal In-Space Interface Control Document (OS SIS ICD v2.1) [DB/OL]. (2023-11). Available online: https://www.gsc-europa.eu/sites/default/files/sites/all/files/Galileo_OS_SIS_ICD_v2.1.pdf (accessed on 8 July 2024).
  35. Zhou, F.; Dong, D.; Li, W.; Jiang, X.; Wickert, J.; Schuh, H. GAMP: An open-source software of multi-GNSS precise point positioning using undifferenced and uncombined observations. GPS Solut. 2018, 22, 33. [Google Scholar] [CrossRef]
  36. Bevis, M.; Businger, S.; Chiswell, S.; Herring, T.A.; Anthes, R.A.; Rocken, C.; Ware, R.H. GPS meteorology: Mapping zenith wet delays onto precipitable water. J. Appl. Meteorol. 1994, 33, 379–386. [Google Scholar] [CrossRef]
  37. Yao, Y.; Zhang, B.; Xu, C.; Yan, F. Improved one/multi-parameter models that consider seasonal and geographic variations for estimating weighted mean temperature in ground-based GPS meteorology. J. Geod. 2014, 88, 273–282. [Google Scholar] [CrossRef]
  38. Ahmed, F.; Václavovic, P.; Teferle, F.N.; Douša, J.; Bingley, R.; Laurichesse, D. Comparative analysis of real-time precise point positioning zenith total delay estimates. GPS Solut. 2016, 20, 187–199. [Google Scholar] [CrossRef]
  39. Pan, L.; Deng, M.; Chen, B. Real-time GNSS meteorology: A promising alternative using real-time PPP technique based on broadcast ephemerides and the open service of Galileo. GPS Solut. 2024, 28, 113. [Google Scholar] [CrossRef]
  40. De Haan, S.; Pottiaux, E.; Sánchez-Arriola, J.; Bender, M.; Berckmans, J.; Brenot, H.; Bruyninx, C.; De Cruz, L.; Dick, G.; Dymarska, N.; et al. Use of GNSS Tropospheric Products for High-Resolution, Rapid-Update NWP and Severe Weather Forecasting (Working Group 2). In Advanced GNSS Tropospheric Products for Monitoring Severe Weather Events and Climate; Jones, J., Guerova, G., Douša, J., Dick, G., De Haan, S., Pottiaux, E., Bock, O., Pacione, R., Van Malderen, R., Eds.; Springer International Publishing: Cham, Switzerland, 2020; pp. 203–265. [Google Scholar] [CrossRef]
Figure 1. Distribution of selected IGS stations (red dots) around the world, EPN stations (blue triangles), and RDS stations (black pentagons) in Europe.
Atmosphere 15 01030 g001
Figure 2. The flowchart of ZTD/PWV data retrieval based on BE-PPP.
Atmosphere 15 01030 g002
Figure 3. RT-ZTD, BE-ZTD, and IGS-ZTD at the DYNG station on DOY (day of year) 356, 2022.
Atmosphere 15 01030 g003
Figure 4. Distribution of ZTD differences between RT-ZTD and BE-ZTD from 8 stations.
Atmosphere 15 01030 g004
Figure 5. Mean bias (a) and STD (b) of BE-ZTD and RT-ZTD (DOY 356) from 80 IGS stations.
Atmosphere 15 01030 g005
Figure 6. The boxplot of mean bias and STD for RT-ZTD and BE-ZTD.
Atmosphere 15 01030 g006
Figure 7. The time series of PWV derived from BE-PPP, RT-PPP, and ERA5 at station SAS2 during DOY 335-364 of 2022.
Atmosphere 15 01030 g007
Figure 8. Mean value (a) and STD (b) of the PWV differences for BE-PPP and RT-PPP with respect to ERA5 at 20 EPN stations during DOY 335–364 of 2022.
Atmosphere 15 01030 g008
Figure 9. The time series of PWV derived from BE-PPP, RT-PPP, and RDS at station SAS2 during DOY 335–364 of 2022.
Atmosphere 15 01030 g009
Figure 10. Mean value (a) and STD (b) of the PWV differences for BE-PPP and RT-PPP with respect to RDS at 20 EPN stations during DOY 335–364 of 2022.
Atmosphere 15 01030 g010
Table 1. Details of the implementation of the BE-PPP procedure.
ItemsDescription
ObservationsIonospheric-free combinations of GPS/Galileo carrier phase and pseudorange, 30 s sampling, 7-degree cutoff elevation
Satellite orbits and clocks Only broadcast ephemerides
Pseudorange noiseG: 5 mm; E: 5 mm
Phase noiseG: 1 m; E: 0.5 m
FilterBackward–forward KF
Tropospheric delayPrior value from Saastamoinen and the global mapping function (GMF), and remaining errors estimated as random walk noise;   σ 0   of   0.6   m ,   σ p of 6 mm, τ of 3600 s
Ionospheric delayFirst order was eliminated by ionospheric-free combination, and higher orders ignored
Receiver clockEstimated as white noise with σ 0   and   σ p of 60 m
Inter-system biasEstimated as white noise with σ 0   and   σ p of 60 m
AmbiguityFloat ambiguity is estimated as a time constant with a σ 0 of 10 m
Signal-in-space error (SISE)Priori constraint of 0.5 m, estimated as random walk noise; σ 0 : GPS of 0.5 m, Galileo of 0.2 m; σ p : GPS of 10 mm, Galileo of 3 mm, τ of 30 s [30]
Tide modelsSolid earth tide, polar tide model (IERS Conversion 2010), ocean tide model (i.e., FES2004)
Receiver antenna phase centerIGS absolute phase center calibration (i.e., igs20.atx)
Satellite antenna phase centerNone [29]
Other correctionsRelativistic effect, Sagnac effect, satellite antenna phase wind-up corrections
The initial standard deviation σ 0 , standard deviation σ p , and time constant τ are listed for both processing strategies.
Disclaimer/Publisher’s Note: The statements, opinions and data contained in all publications are solely those of the individual author(s) and contributor(s) and not of MDPI and/or the editor(s). MDPI and/or the editor(s) disclaim responsibility for any injury to people or property resulting from any ideas, methods, instructions or products referred to in the content.

