Article

Study on the Response Mechanism of Climate and Land Use Change to Evapotranspiration in Aksu River Basin

1
Xinjiang Tarim River Basin Authority, Korla 841000, China
2
College of Hydraulic and Civil Engineering, Xinjiang Agricultural University, Urumqi 830052, China
3
Xinjiang Key Laboratory of Hydraulic Engineering Security and Water Disasters Prevention, Urumqi 830052, China
*
Authors to whom correspondence should be addressed.
Atmosphere 2024, 15(9), 1055; https://doi.org/10.3390/atmos15091055
Submission received: 15 July 2024 / Revised: 9 August 2024 / Accepted: 26 August 2024 / Published: 1 September 2024
(This article belongs to the Section Biosphere/Hydrosphere/Land–Atmosphere Interactions)

Abstract

:
Research on evapotranspiration and its drivers in the Aksu River Basin from the perspectives of climate change and land use is of great significance for promoting the efficient use and precise allocation of its water resources. Theil-Sen median trend analysis (T-S) and the Mann–Kendall nonparametric test (M-K), in addition to correlation analysis, partial correlation analysis, complex correlation analysis, and driving-factor zoning principles, were used to examine the characteristics of the spatiotemporal changes in evapotranspiration and to explore the driving mechanism of the changes in evapotranspiration. The results indicated that the range of fluctuations in the multiyear average evapotranspiration in the Aksu River Basin from 2001 to 2020 was between 481.58 and 772.37 mm/a, which showed the spatial distribution characteristics of being high in the west and central part of the basin, and low in the north and south of the basin. The positive correlation between evapotranspiration and precipitation was stronger, and the negative correlations with temperature and relative humidity were stronger. The change in evapotranspiration in cultivated land is mainly driven by precipitation and relative humidity × precipitation; for grassland, the main drivers were relative humidity and precipitation × relative humidity; for woodland, the main drivers were relative humidity and other climatic factors; and for other land types, the main drivers were other climatic factors.

1. Introduction

Evapotranspiration is the total water vapour flux transported from the Earth’s surface to the lower atmosphere, and it is a key component of the land–air–water cycle and surface energy balance [1,2,3]. Approximately 60% of global precipitation eventually returns to the atmosphere via evapotranspiration, and this proportion is increasing because of climate change [4]. In addition, anthropogenic land use changes (e.g., ecological restoration and urbanisation) can alter the processes of evapotranspiration and, thus affect the allocation of water [5], exacerbating the imbalance between water supply and demand [6,7]. Accurately assessing the characteristics of the spatial and temporal distribution and changes in evapotranspiration, and exploring the impacts of climate change and changes in the land use type on evapotranspiration have important practical value for the scientific management and efficient use of water resources in a basin/region [8].
Evapotranspiration data are mainly acquired by the following three methods: ground observations, model simulations, and remote sensing inversion [9]. Traditional evapotranspiration monitoring methods cannot meet the requirements of studies on large-scale regional evapotranspiration [10], especially in the northwest arid zone, where observation stations are sparse or lacking. Evapotranspiration inversion data combined with remote sensing technology can reflect the spatial heterogeneity of evapotranspiration and satisfy the requirements of global and regional-scale studies, and this has become an effective way to monitor large-scale regional evapotranspiration, as well as to assess the spatial and temporal heterogeneous changes in evapotranspiration [11,12]. In 2011, the US NASA team released the global terrestrial evapotranspiration dataset (MOD16) based on the Penman–Monteith remote sensing model and MODIS data [13]. The MOD16 product has been widely used globally, and it has reached an accuracy of 86% [14]. Zhang et al. [15] evaluated the performance of MOD16 at multiple spatial scales (i.e., site, basin, and global) and showed that the results of simulating evapotranspiration were relatively consistent and reliable. Sebinasi Dzikiti et al. [16] tested evapotranspiration from South African forests based on the Penman–Monteith MOD16 and modified Priestley–Taylor (PT-JPL) models, and showed that the MOD16 evapotranspiration model was more accurate. Chen et al. [17] evaluated the evapotranspiration (ET) of the MOD16 product using eddy correlation data from 10 stations in the tropical area of the Lammas Basin in 2007, and the results showed that the product can be used to analyse the changes of ET in the basin. Domestic scholars have made use of the MOD16 evapotranspiration dataset in their analyses of spatial and temporal changes in evapotranspiration in typical regions. Cheng et al. [18] used a pass-through analytical method based on the MODIS evapotranspiration product to analyse the impacts of changes in climate and vegetation types on evapotranspiration in China. Wang et al. [19] analysed the spatial and temporal variations in evapotranspiration in the main stem of the Tarim River on the basis of the MODIS evapotranspiration data with the help of nonparametric tests, R/S persistence analysis, and spatial analysis techniques. Adilai et al. [20] quantitatively analysed the spatial and temporal changes in surface evapotranspiration in the Ili River Valley on the basis of the MOD16 evapotranspiration product using a statistical method for analyses of the spatial data and trend.
The Aksu River Basin is an important element in the “four sources and one trunk” water system of the Tarim River Basin of Xinjiang, contributing, on average, more than 70% of the water that flows into the Tarim River annually. Changes in the hydrological cycle and water resources of the Aksu River Basin are directly related to the ecological and regional security of the Tarim River Basin and the entire southern region of Xinjiang. Evapotranspiration is a key item of expenditure in the basin’s water cycle, especially in recent decades, along with the increasing development and utilisation of the basin’s soil and water resources. Artificial oases in desert areas, represented by irrigated areas of farmland, are the most frequent type of land use conversion, which causes changes in the basin’s water cycle and allocation of water resources. It is of great significance to assess the spatial and temporal characteristics of evapotranspiration and analyse its driving factors to protect and restore the fragile ecological environment in the Aksu River Basin and ensure the efficient use of water resources and the high-quality development of the national economy. Currently, there is a lack of studies on evapotranspiration in the Aksu River Basin, especially concerning the influence on evapotranspiration due to changes in climatic factors and land use types, as well as the application of MOD16 evapotranspiration data of the basin. Most studies have only used two climatic factors, precipitation and temperature, to correlate with evapotranspiration. In this study, we added relative humidity as a climatic factor and used MOD16 evapotranspiration data, meteorological data, and three periods of land use data from 2001 to 2020 to explore the spatial and temporal characteristics of evapotranspiration in the Aksu River Basin, as well as the driving mechanisms of its responses to changes in climatic factors and land use, to provide scientific guidance for the efficient use of water resources and their precise allocation in the basin.

2. Materials and Methods
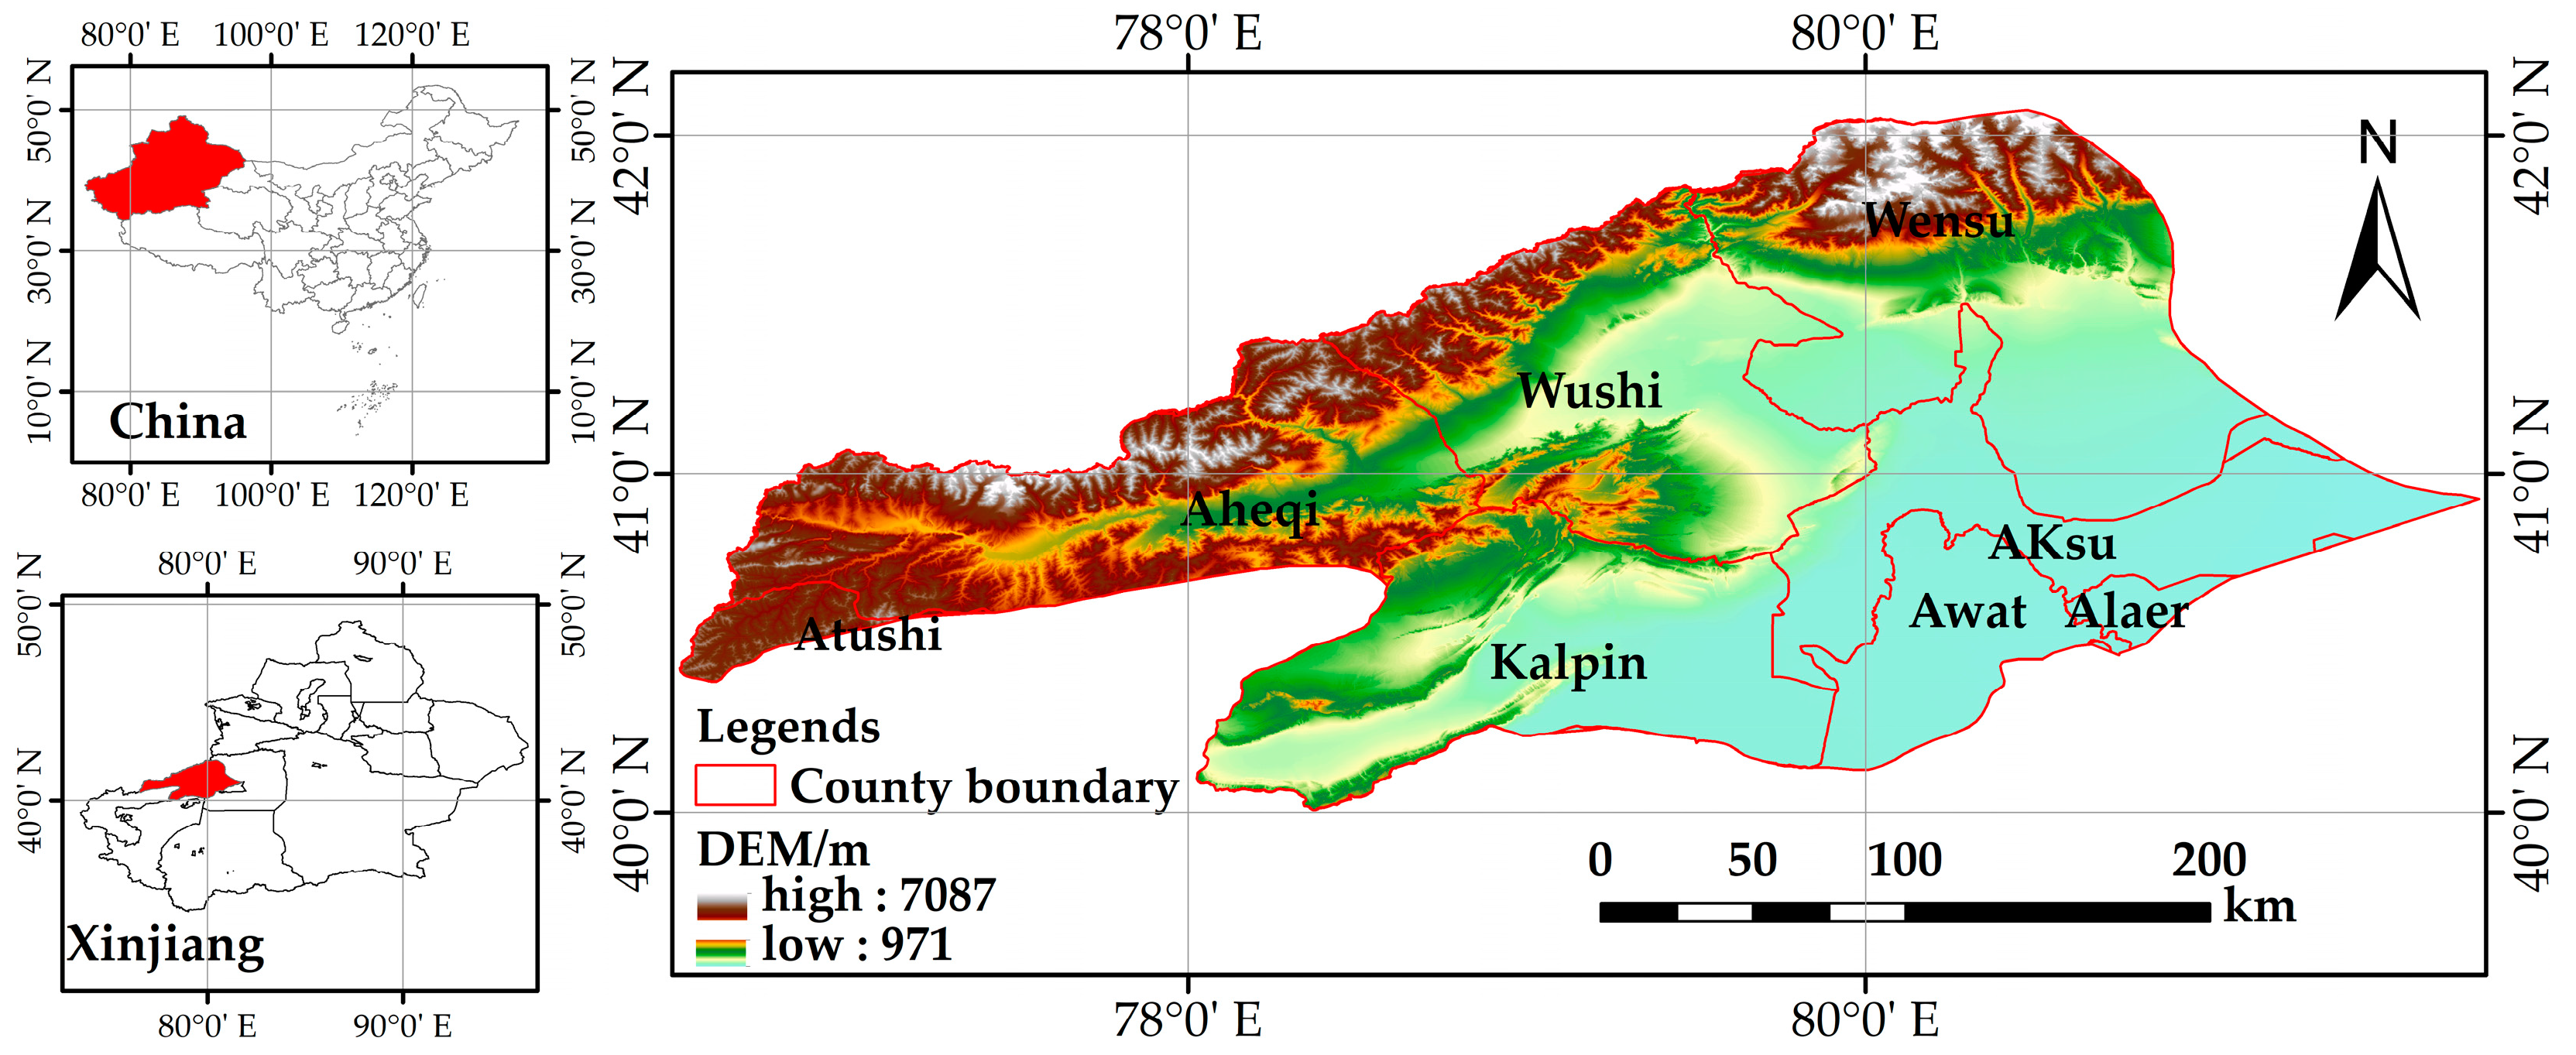
2.1. Study Area

The Aksu River Basin is located in the western part of the central southern foothills of the Tianshan Mountains, on the northwestern edge of the Tarim Basin, at latitude 40°00′–42°27′ N and longitude 75°35′–82°00′ E, with a total basin area of approximately 4.6 × 10⁴ km2 (Figure 1). The basin’s topographical characteristics reveal that it gradually decreases from north to south and from west to east, and it has an elevation ranging from 971 to 7087 m. The runoff in the Aksu River Basin mainly comes from atmospheric precipitation and glacial meltwater in the mountainous areas, and it has a continental temperate arid climate [21]. Climate change is drastic during the year, with January being the coldest month and July being the hottest month, with cold winters and hot summers and a large temperature difference between day and night, with a multi-year average temperature of 10.7 °C. Precipitation in the Aksu River Basin shows a spatial trend of decreasing from northwest to southeast, and the annual and seasonal changes are large, with the most precipitation in June–August and less precipitation in winter, and the average precipitation for many years is 137.7 mm. The runoff of the Aksu River Basin has an obvious seasonal distribution, with the largest runoff in July and the smallest runoff in February, featuring spring drought and summer flooding, and little fall and winter dryness, and the average annual runoff in many years is 148.21 × 10⁸ m3. The land use type is mainly dominated by unutilized land and grassland.

2.2. Data

2.2.1. MOD16 Evapotranspiration Data

The MOD16 evapotranspiration data were downloaded from NASA (https://search.earthdata.nasa.gov/ (accessed on 20 February 2024)). In this study, MOD16A2 product data with a temporal resolution of 8 days and a spatial resolution of 500 m were downloaded for a total of 20 periods from 2001 to 2020. The raw data were processed using MRT 3.3 (MODIS Reprojection Tool) to convert their format from HDF4 to TIFF, and then they were projected, transformed, spliced, and cropped using ArcGIS 10.5 to extract the evapotranspiration values for each month in the study area.

2.2.2. Meteorological Data

Meteorological data were downloaded from the National Earth System Science Data Centre (http://www.geodata.cn (accessed on 20 February 2024)) [22], and monthly average meteorological data from 2001 to 2020 were selected for the Aksu River Basin (the data had a 1 km spatial resolution), including monthly precipitation (data in units of mm), monthly average temperature (data in units of 0.1 °C), and monthly average relative humidity (data in units of %). The meteorological data were spatially interpolated using ArcGIS 10.5 to obtain raster data with the same spatial resolution and projection as the MOD16 evapotranspiration data.

2.2.3. Land Use Data

Land use data were adopted from MODIS Land Cover (MCD12Q1), a land cover product developed by NASA (Washington, USA), and three phases of the product were downloaded for the years 2001, 2010, and 2020, with a spatial resolution of 500 m. In this study, they were reclassified into the following six categories: arable land, forest land, grassland, watersheds, built-up land, and unused land. The 17 land cover types in the watershed were combined into six land cover types on the basis of amendments to the land cover products. We combined evergreen needleleaf forests, evergreen broadleaf forests, deciduous needleleaf forests, deciduous broadleaf forests, mixed forests, closed shrublands, and open shrublands into forest land; woody savannas, savannas, and grasslands into grassland; permanent wetlands and barren land into unused land; croplands and cropland/natural vegetation mosaics into arable land; permanent snow and ice, and water bodies into watersheds; and urban and built-up lands to built-up land.

2.3. Methods

2.3.1. Analysis of the Trend and Mann–Kendal Test

The Theil–Sen median trend analysis is a robust nonparametric statistical approach to calculating trends. The method is computationally efficient, insensitive to measurement errors and sharp data, and suitable for analysing the trend of long-time series data [23]. The Theil–Sen median trend analysis method was calculated using the following formula
β = M e d i a n ( E T j E T i j i ) , 1 i < j 20
where i and j denote the time series; ETi and ETj denote the evapotranspiration values of each raster in year i and year j, respectively; and β is the change trend. If β > 0, this indicates an upward trend; if β < 0, this indicates a downward trend.
The Mann–Kendal test is a nonparametric test for the trend of time series, which does not require the measurements to follow a positive distribution, is not affected by missing values and outliers, and is suitable for testing the significance of the trend of long time series data [24]. The Mann–Kendall trend test’s parameters are calculated as follows
S = i = 1 n 1 j = i + 1 n sgn ( E T j E T i )
where sgn() is the sign function, calculated as:
sgn ( E T j E T i ) = { 1 , E T j E T i > 0 0 , E T j E T i = 0 1 , E T j E T i < 0
Trend tests were performed using the test statistic Z. The Z value was calculated as follows
Z = { S 1 V a r ( S ) , S > 0 0 , S = 0 S + 1 V a r ( S ) , S < 0
V a r ( S ) = n ( n 1 ) ( 2 n + 5 ) 18
where n is the number of data points in the sequence (n = 20), and the test statistic Z characterises the trend in the data series. The larger the value of Z, the more obvious the trend. If Z > 0, this indicates a tendency to increase, and if Z < 0, this indicates a tendency to decrease. In this study, given a significance level of α = 0.05, which is a critical value of Z1−α/2 = ±1.96, when the absolute values of Z were greater than 1.65, 1.96, and 2.58, this meant that the trend passed the significance test with confidence levels of 90%, 95%, and 99%, respectively.

2.3.2. Simple Correlation Analysis

A simple correlation analysis reveals the results of interactions and influences among geographic elements by calculating the degree of association between two geographic elements [15]. In this study, a spatial correlation analysis based on image elements was used to conduct a simple correlation analysis between the interannual evapotranspiration of the Aksu River Basin and climatic factors (i.e., temperature, precipitation, and relative humidity) for the same period of time, from 2001 to 2020, and to reflect the degree of spatial correlation between each climatic factor and evapotranspiration by testing the simple correlation coefficients. The calculation formula is as follows
R x y = i = 1 n [ ( x i x ¯ ) × ( y i y ¯ ) ] i = 1 n ( x i x ¯ ) 2 i = 1 n ( y i y ¯ ) 2
where n is the number of years (n = 20); Rxy is the simple correlation coefficient between evapotranspiration and the climatic factors, which is a statistical indicator of the degree of correlation between evapotranspiration and the climatic factors, the value of which was from (−1, 1); xi and yi are the distributions of the values of evapotranspiration and the climatic factors in the year i (for the years 2001, 2002, ……, 2020); and x ¯ and y ¯ are the averages of evapotranspiration and the climatic factors for the year n, respectively.
The results of the simple correlation analysis were tested using the critical value of α = 0.444 (p > 0.05) (i.e., Rxy ≥ 0.444), which indicated that the two influencing factors were significantly correlated and the interaction between them was obvious, whereas for Rxy < 0.444, there was no significant correlation between the two influencing factors and the interaction between them was not obvious.

2.3.3. Partial Correlation Analysis

A partial correlation analysis is used to calculate the correlation coefficient between two influencing factors on the basis of a simple correlation analysis, excluding the interference of other influencing factors. It allows for one of the three influencing factors to be fixed to explore the correlation between the other two factors [25]. Its calculation formula is as follows
R x y , z = R x y R x z R y z ( 1 R x z 2 ) ( 1 R y z 2 )
where x represents the dependent variable (i.e., evapotranspiration), y and z represent the independent variables (i.e., climatic factors), and Rxy,z is the bias correlation coefficient between the dependent variable and an independent variable; its value is from (−1, 1). If Rxy,z ≥ 0, this indicates a positive correlation (i.e., evapotranspiration is homoscedastic with respect to the independent variable y); if Rxy,z < 0, this indicates a negative correlation (i.e., evapotranspiration is anisotropic with respect to the independent variable y). A higher bias correlation coefficient indicates a stronger correlation between the dependent variable and an independent variable.
The significance tests of the partial correlation coefficients were conducted using t-tests, which were calculated as follows
t = R x y , z 1 R x y , z 2 n m 1
where t is the test statistic of the partial correlation coefficient, the value of which is from (−∞, +∞); n is the number of samples (n = 20 in this study); and m is the number of independent variables (m = 2 in this study).
In this research, the significance test of the partial correlation coefficient between evapotranspiration and each climatic factor was carried out on the basis of the t-test’s critical value, using the following two confidence levels: α = 2.898 (p < 0.01) and α = 2.110 (p < 0.05).

2.3.4. Complex Correlation Analysis

The compound correlation analysis method can reflect the combined effects of the factors, and it was calculated using the following formula
R x , y z = 1 ( 1 R x y 2 ) ( 1 R x z , y 2 )
where Rx,yz denotes the complex correlation coefficients between the dependent variable x (evapotranspiration) and the independent variables y and z (each climatic factor), with values of (0, 1); Rxy denotes the simple correlation coefficient between x and y; and Rxz,y denotes the partial correlation coefficient between the dependent variable x and the independent variable z.
The complex correlation coefficients were tested for significance using the F-test, and the statistic was calculated using the following formula
F = R x , y z 2 1 R x , y z 2 × n k 1 k
where F is the test statistic of the complex correlation coefficient, with a value of (0, +∞); n is the number of samples (n = 20); and k is the number of independent variables (k = 2).
In this study, on the basis of the F-test’s critical value table, two confidence levels, α = 6.110 (p < 0.01) and α = 3.592 (p < 0.05), were used to conduct significance tests on the results of the complex correlation analysis.

2.3.5. Guidelines for Driving Zoning

Referring to the results of research by scholars both domestically and abroad [26,27], the rules of climatic-factor-driven zoning for interannual evapotranspiration were formulated on the basis of the results of the partial and compound correlation analyses of interannual evapotranspiration with two climatic factors, namely, relative humidity and precipitation, using t-tests and F-tests (Table 1).

3. Results

3.1. Characteristics of Spatial and Temporal Changes in Evapotranspiration

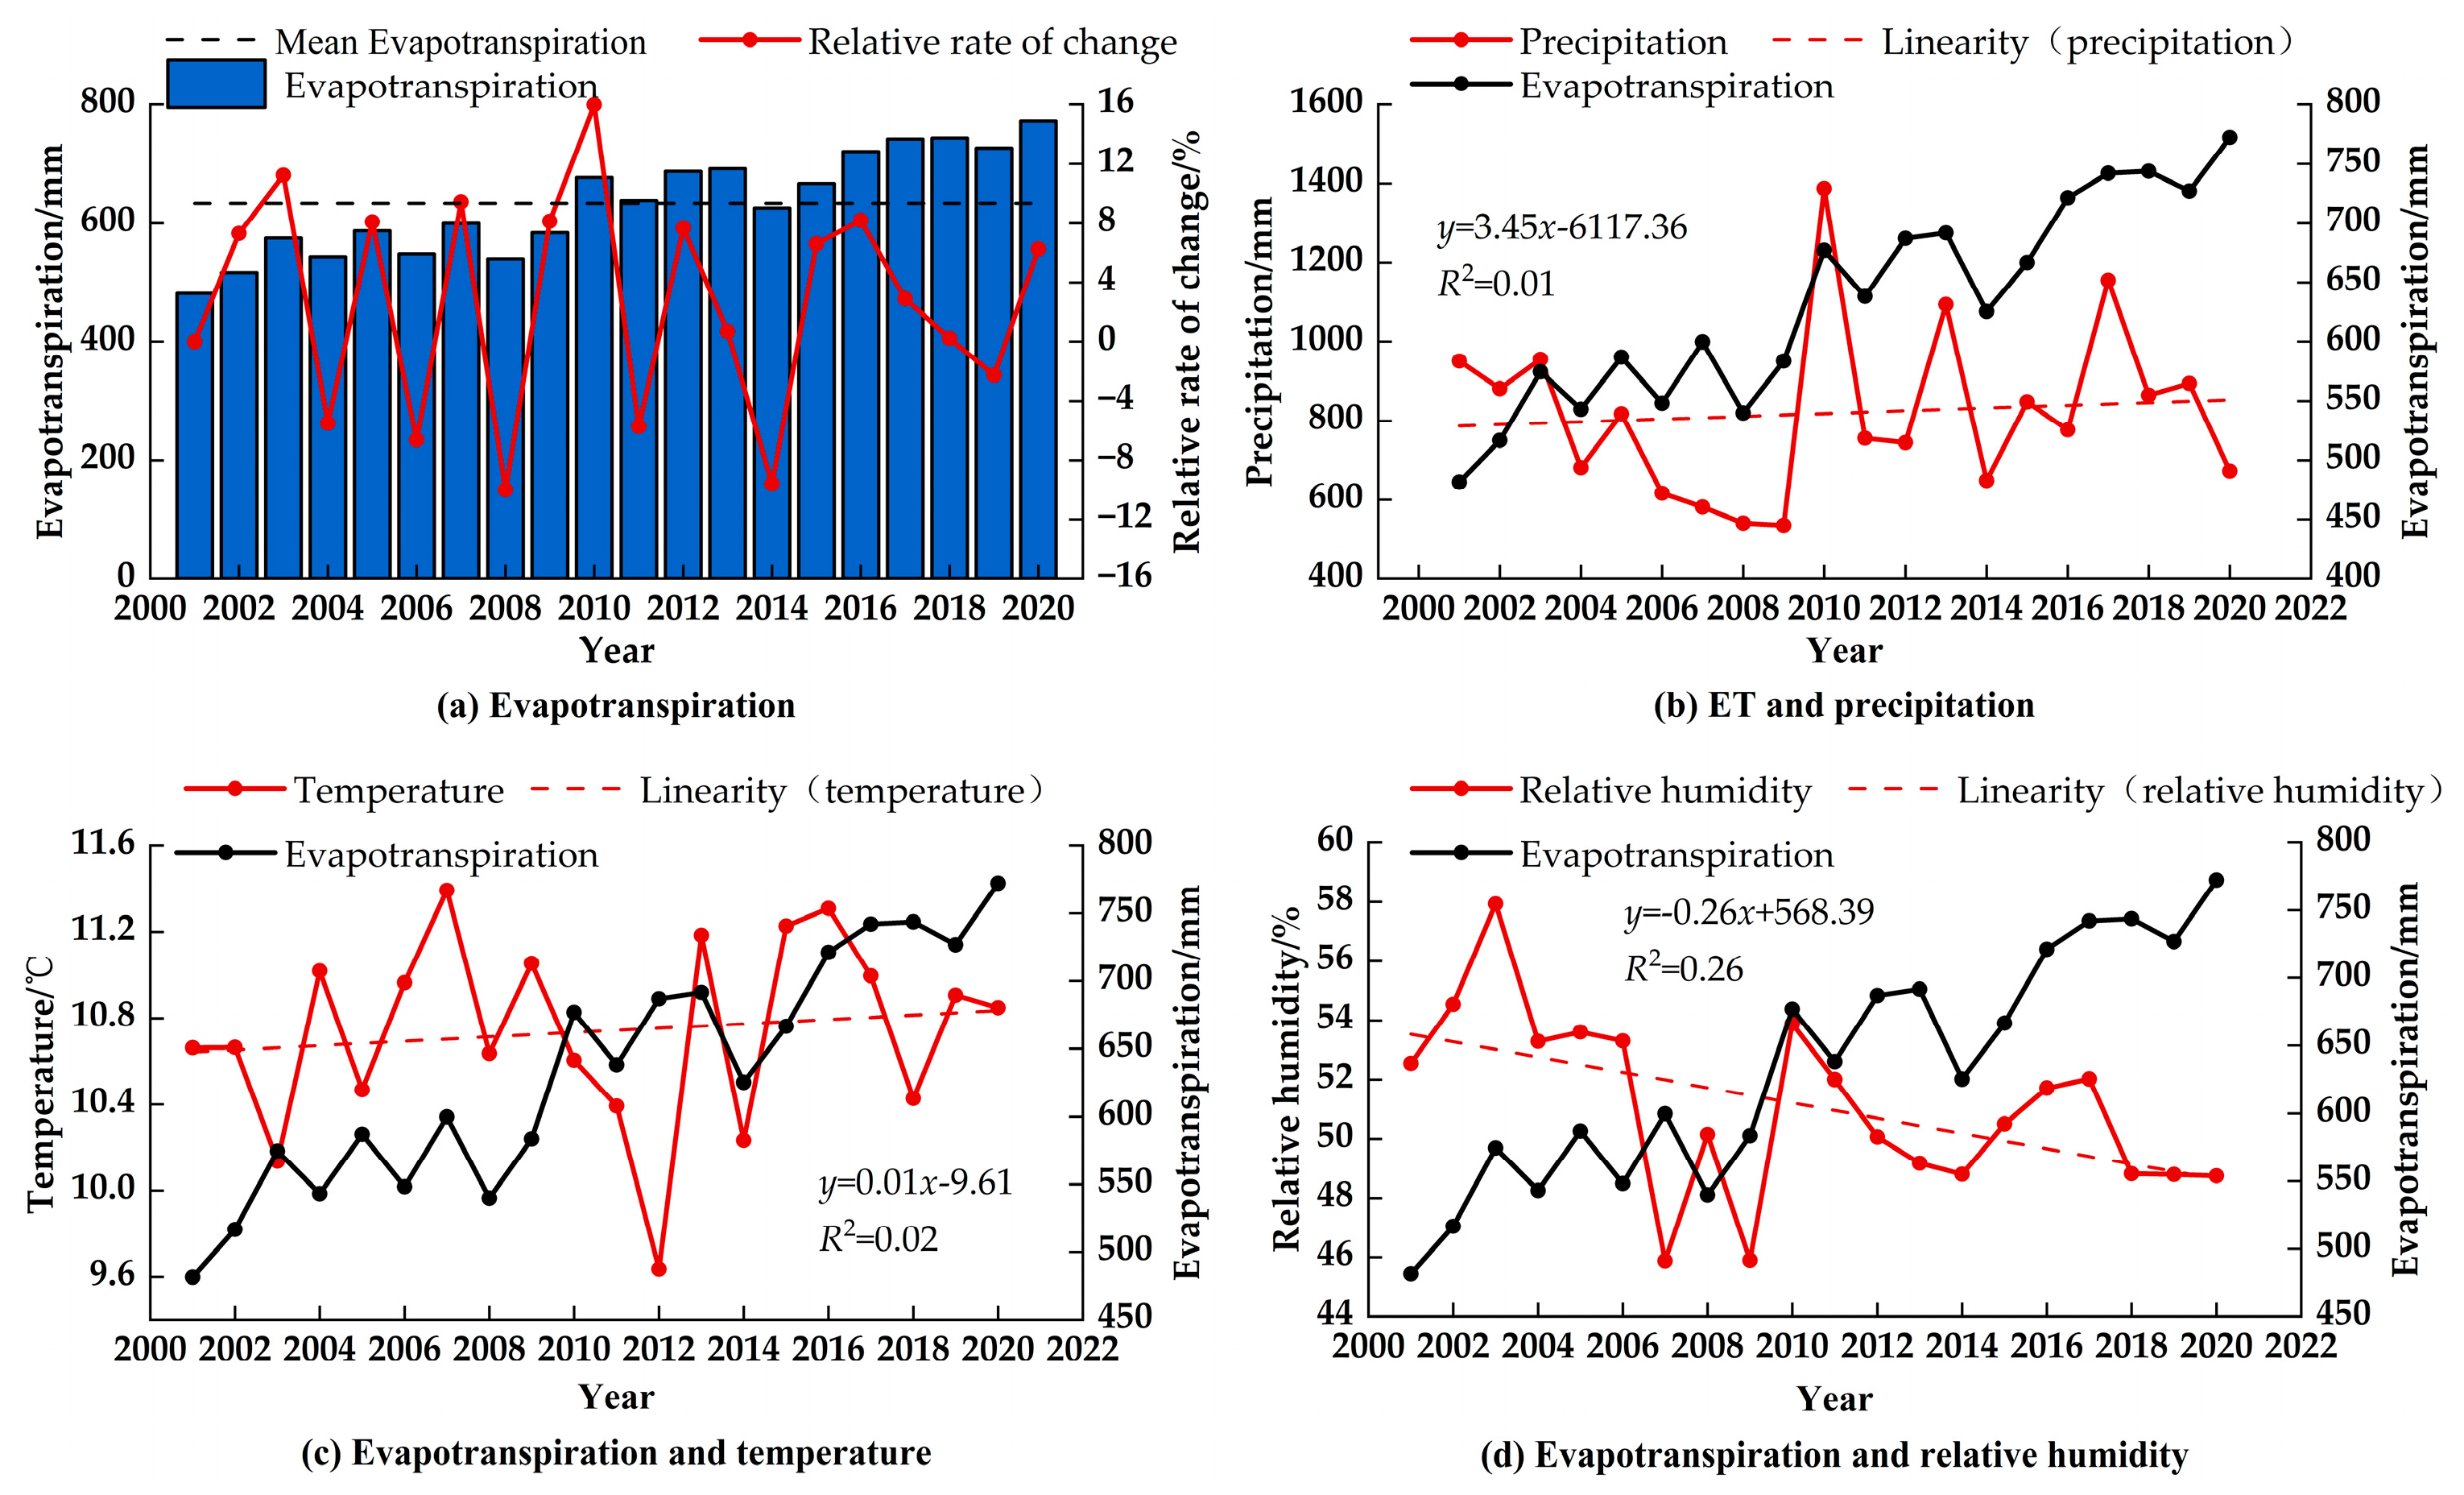
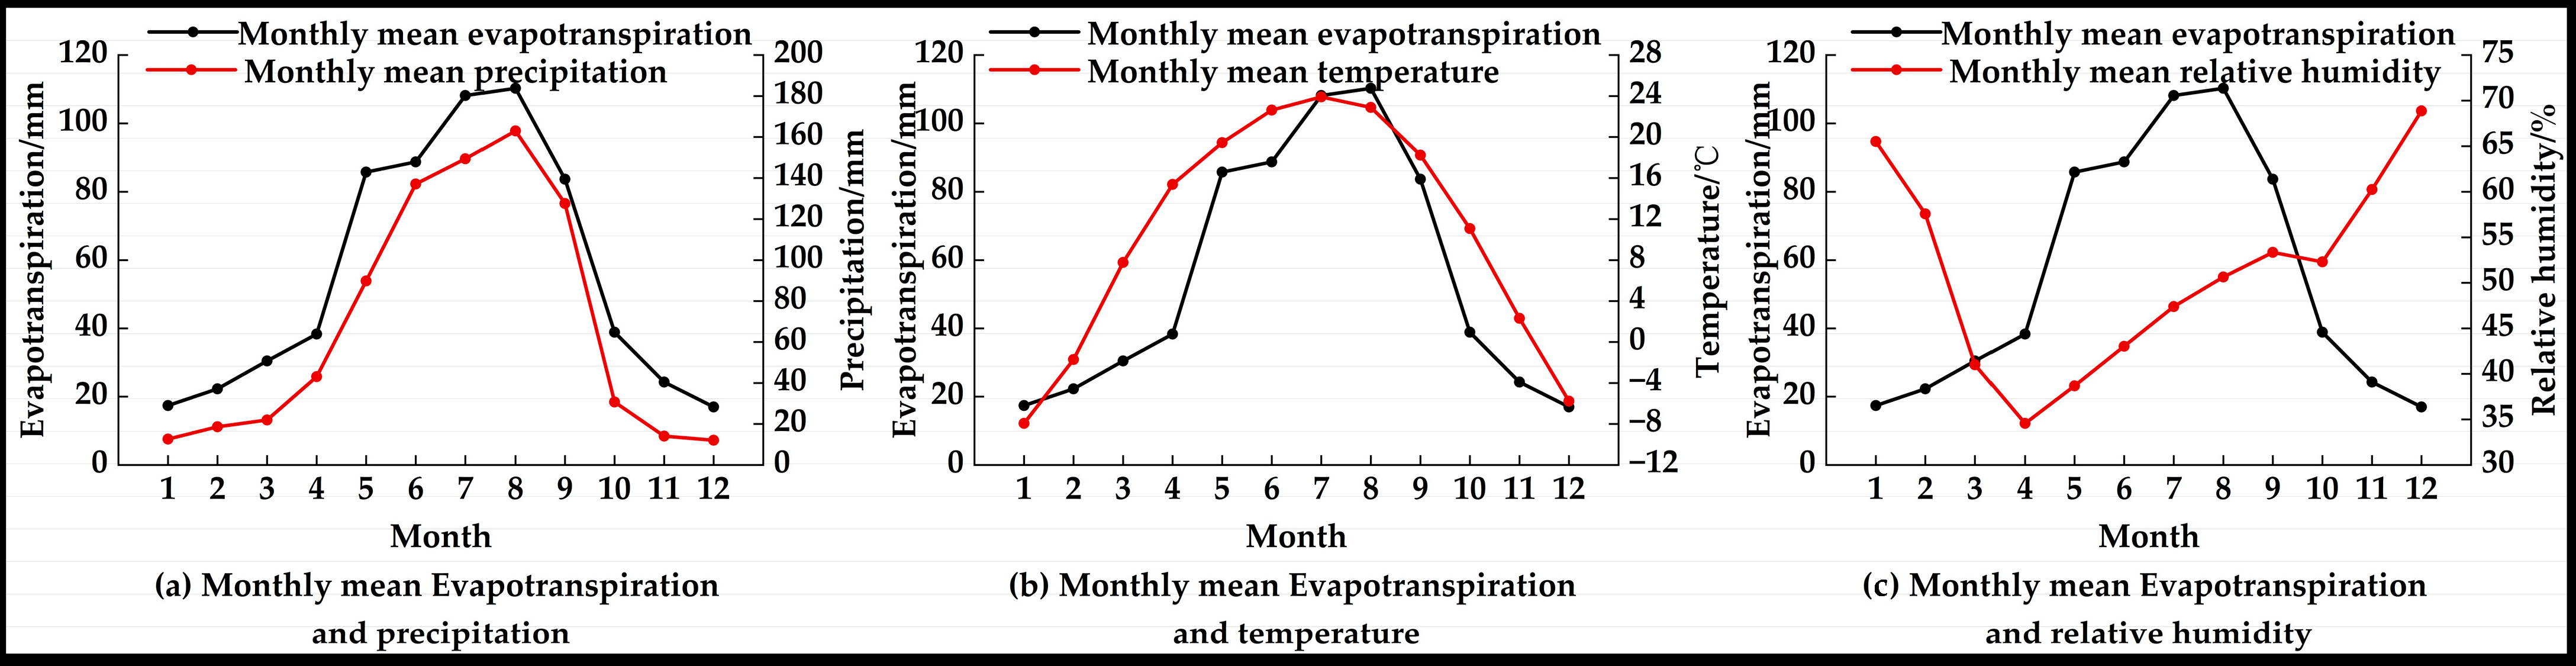
3.1.1. Analysis of Temporal Changes in Evapotranspiration

The results of calculating the process of interannual changes in evapotranspiration and relative rate of change in the Aksu River Basin from 2001 to 2020 are shown in Figure 2a. It can be seen that the average annual evapotranspiration in the Aksu River Basin from 2001 to 2020 ranged from 481.58 to 772.37 mm/a, and the average value of multiyear evapotranspiration was 633.33 mm/a. From 2001 to 2020, there were 10 years in which the interannual evapotranspiration was more significant than the average evapotranspiration value, which were the years 2010–2013 and 2015–2020. Combined with the changes in meteorological factors, such as interannual precipitation, temperature, and relative humidity, over the same period (see Figure 2), the multiyear average precipitation and temperature showed a slight upward trend, and the multiyear average relative humidity exhibited a slight downward trend. The annual average precipitation and temperature coincided with the direction of the average yearly evapotranspiration (Figure 2b,c). In contrast, the annual average relative humidity exhibited a trend opposite to that of the average yearly evapotranspiration (Figure 2d), which indicated that the studied trends of evapotranspiration in the area were related to precipitation, temperature, and relative humidity.
The changes in the monthly average evapotranspiration and in the precipitation, temperature, and relative humidity from 2001 to 2020 in the Aksu River Basin are shown in Figure 3, and they indicated that evapotranspiration exhibited a slowly increasing trend in January–April and a significant upward trend in April, peaking in August (110.25 mm) before significantly decreasing in August–October until October–December, when it slowed down to a minimum value in December (16.97 mm). The characteristics of the variations in the precipitation and temperature were generally consistent with the trend in the changes of evapotranspiration. The average precipitation in the basin from January to April was lower (24.06 mm), as well as the average temperature (3.38 °C), both of which are currently on the rise. From April to June, both the precipitation and temperature in the basin gradually increased. There is a close relationship between temperature and relative humidity. Generally, the higher the temperature, the greater the water vapor content in the air and the lower the relative humidity. Conversely, the lower the temperature, the smaller the amount of water vapor in the air and the higher the relative humidity. The trend in the changes in relative humidity was opposite to that of evapotranspiration. The average relative humidity (49.66%) from January to April showed a downward trend, and the growth rate of vegetation in the basin was slow. From June to August, the precipitation (163.02 mm) and temperature (23.91 °C) peaked for the year. The adequate water supply and long-term sunshine led to the rapid growth in vegetation, and the vegetation’s water evaporation was obvious, with evapotranspiration reaching the maximum value. From August to October, the precipitation and temperature gradually decreased, and the relative humidity in December reached the peak for the year (68.87%). The vegetation gradually entered the withering period, and the transpiration decreased and, therefore, the evapotranspiration gradually decreased.

3.1.2. Analysis of Spatial Variation in Evapotranspiration

The spatial distribution characteristics of the mean values of multiyear evapotranspiration in the study area from 2001 to 2020 are shown in Figure 4. The evapotranspiration in the Aksu River Basin generally had the spatial distribution characteristics of being high in the west and central part and low in the north and south, which was closely related to the uneven distribution of vegetation in the basin (Figure 4a). The areas with high values of evapotranspiration (150–300 mm) were mainly grassland and cropland, whereas the areas with low values of evapotranspiration (0–50 mm) were mainly unused land and sparse scrub and low-cover grassland. On the basis of the Theil–Sen median slope estimation and the Mann–Kendall trend analysis, the trends in evapotranspiration were classified into nine categories (Table 2). In Table 2 and Figure 4b, it can be seen that the areas with highly significant increases, significant increases, and slightly significant increases in annual evapotranspiration were mainly distributed in the southcentral part of Aheqi, the south-central part of Wushi, the northeastern part of Awat, and the south-central part of Wensu, where grassland and cultivated land are distributed and the vegetation cover is high; thus, evapotranspiration exhibited a highly significant increasing trend in general, and the spatial distribution of this growing trend had a band distribution. The areas with highly significant decreases, significant decreases, and slightly significant decreases in annual evapotranspiration were the densely populated areas of Aksu and Wensu, which are mainly affected by population density and urbanisation. Most of the remaining areas with no change in evapotranspiration were primarily located in the northern, southern, and eastern parts of the watersheds, and they were mostly bare lands, with relatively stable interannual variations in evapotranspiration, being mainly affected by climate change and less by anthropogenic disturbances. Overall, the 20-year rate of change in average annual evapotranspiration in the Aksu River Basin was 0.53%, with the general trend of a nonsignificant increase.

3.2. Impact of Climate Change on Spatial and Temporal Changes in Evapotranspiration

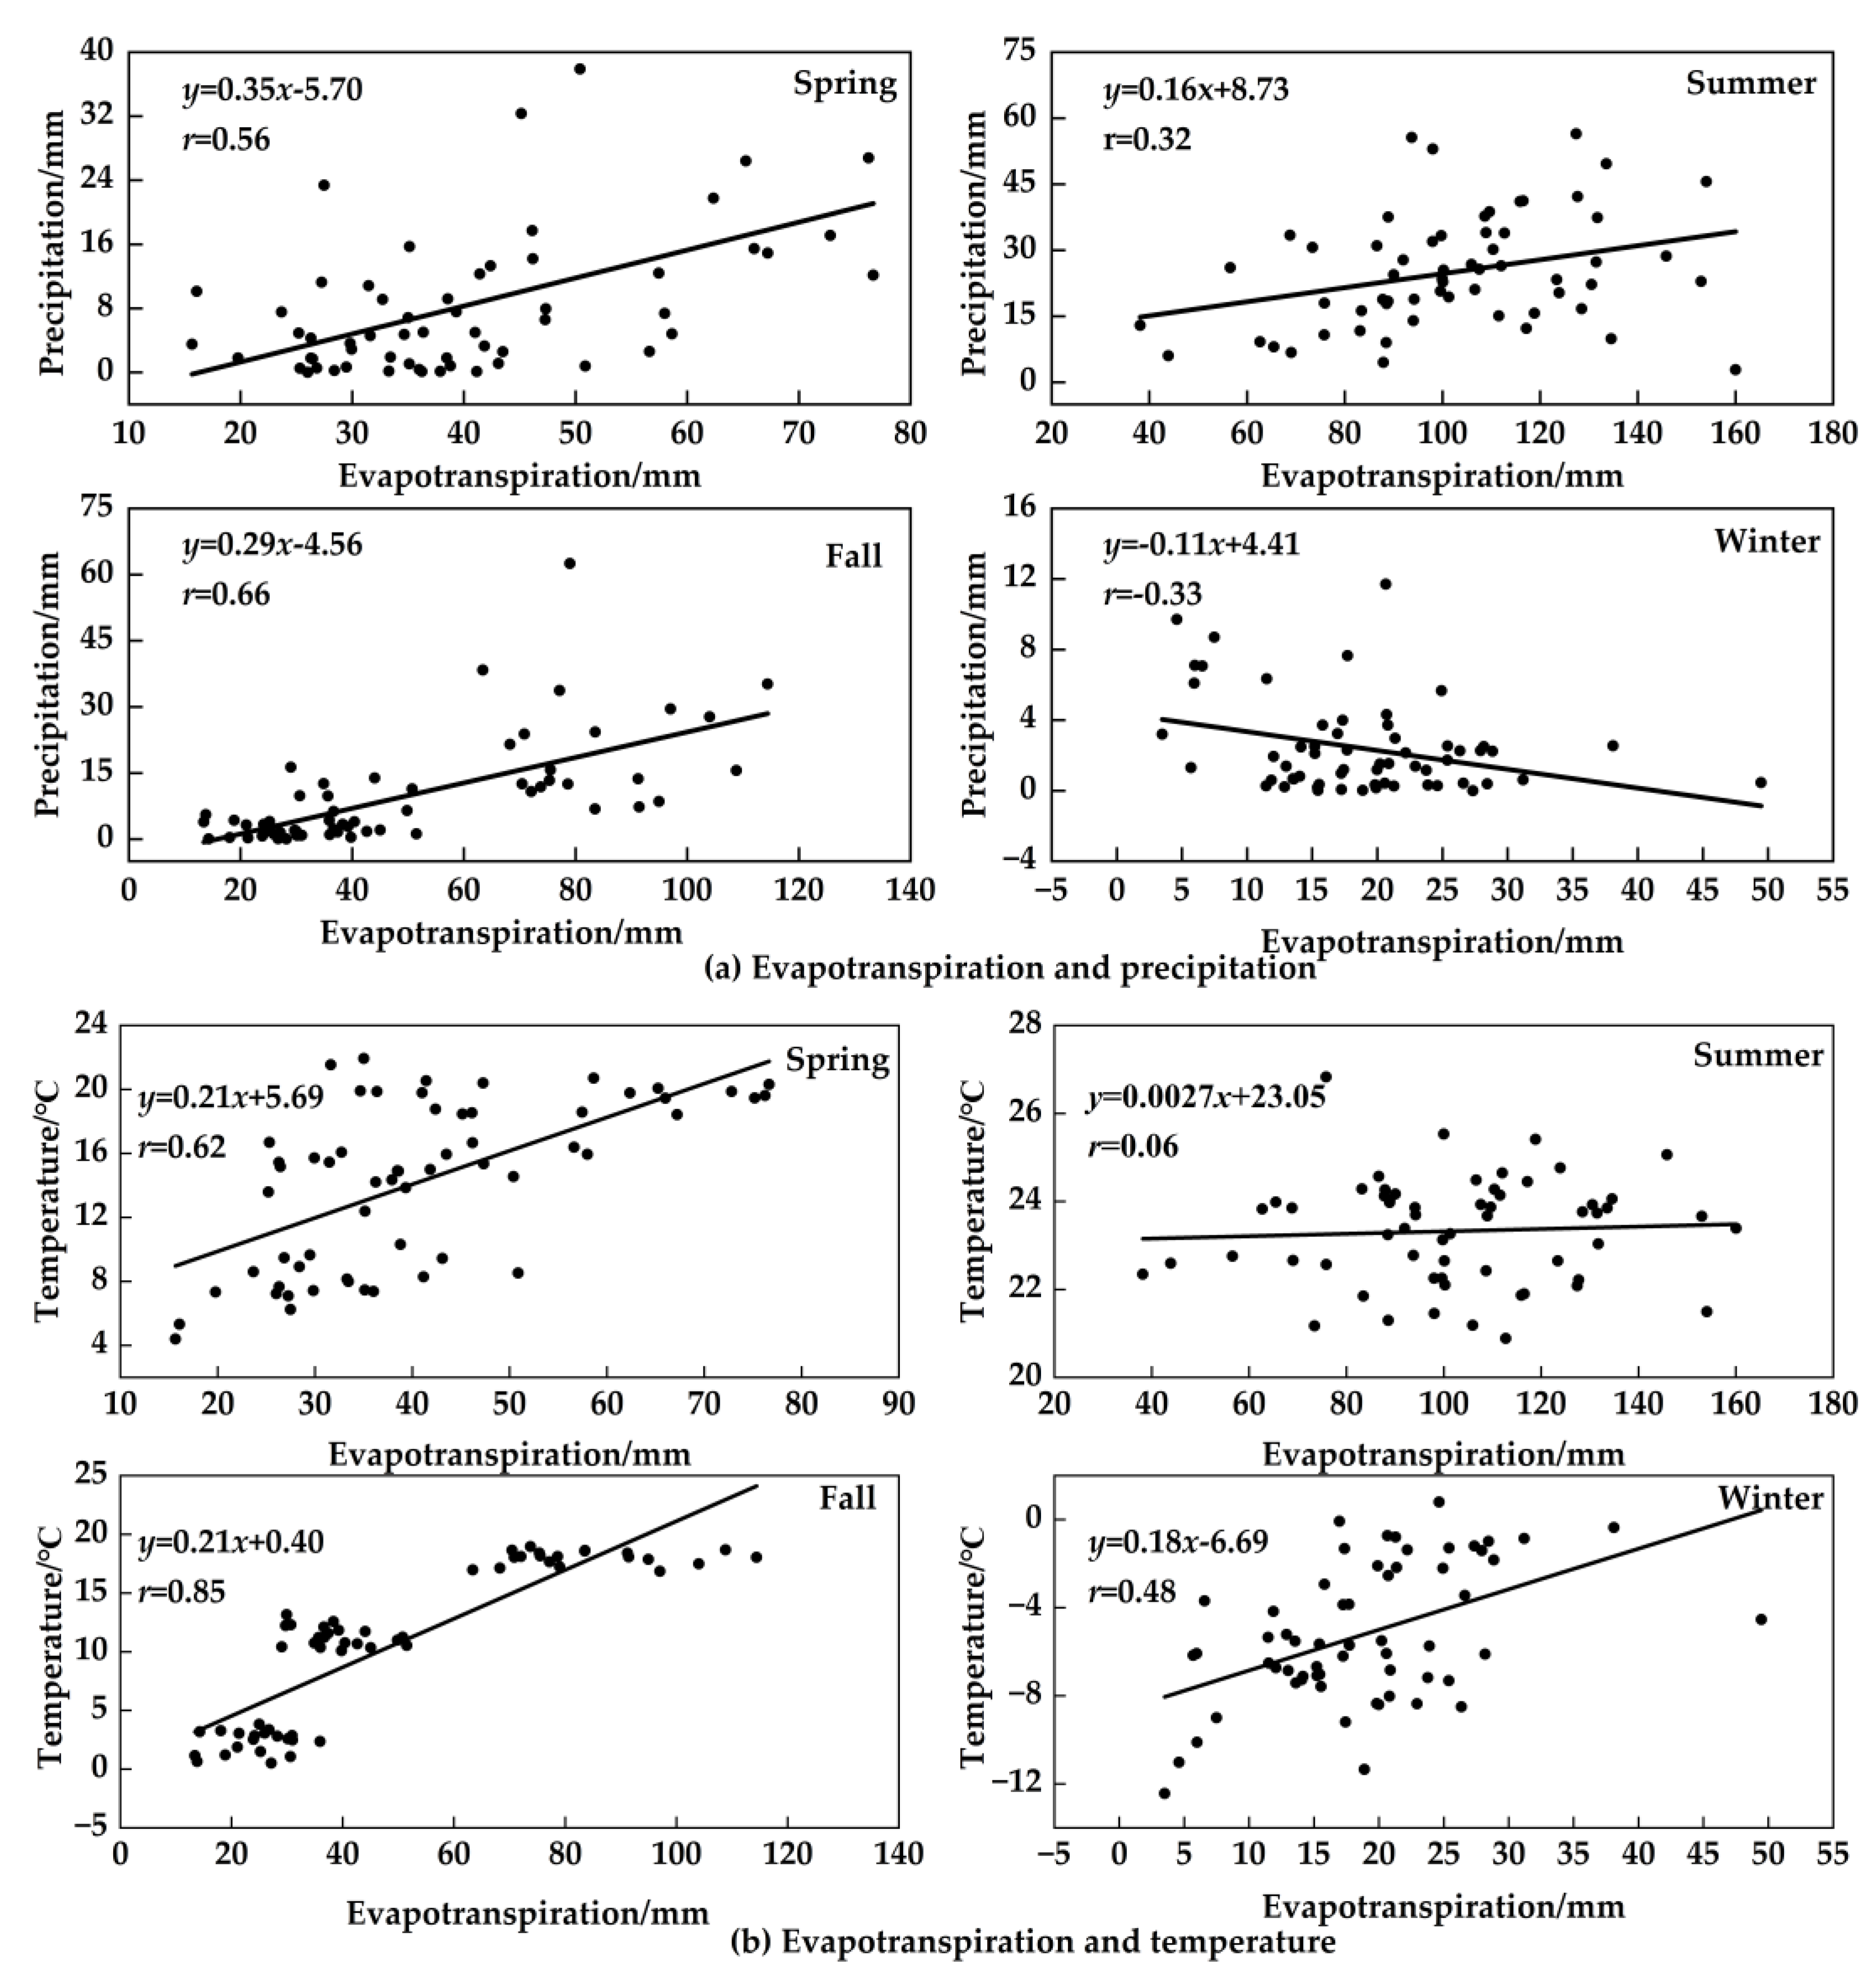
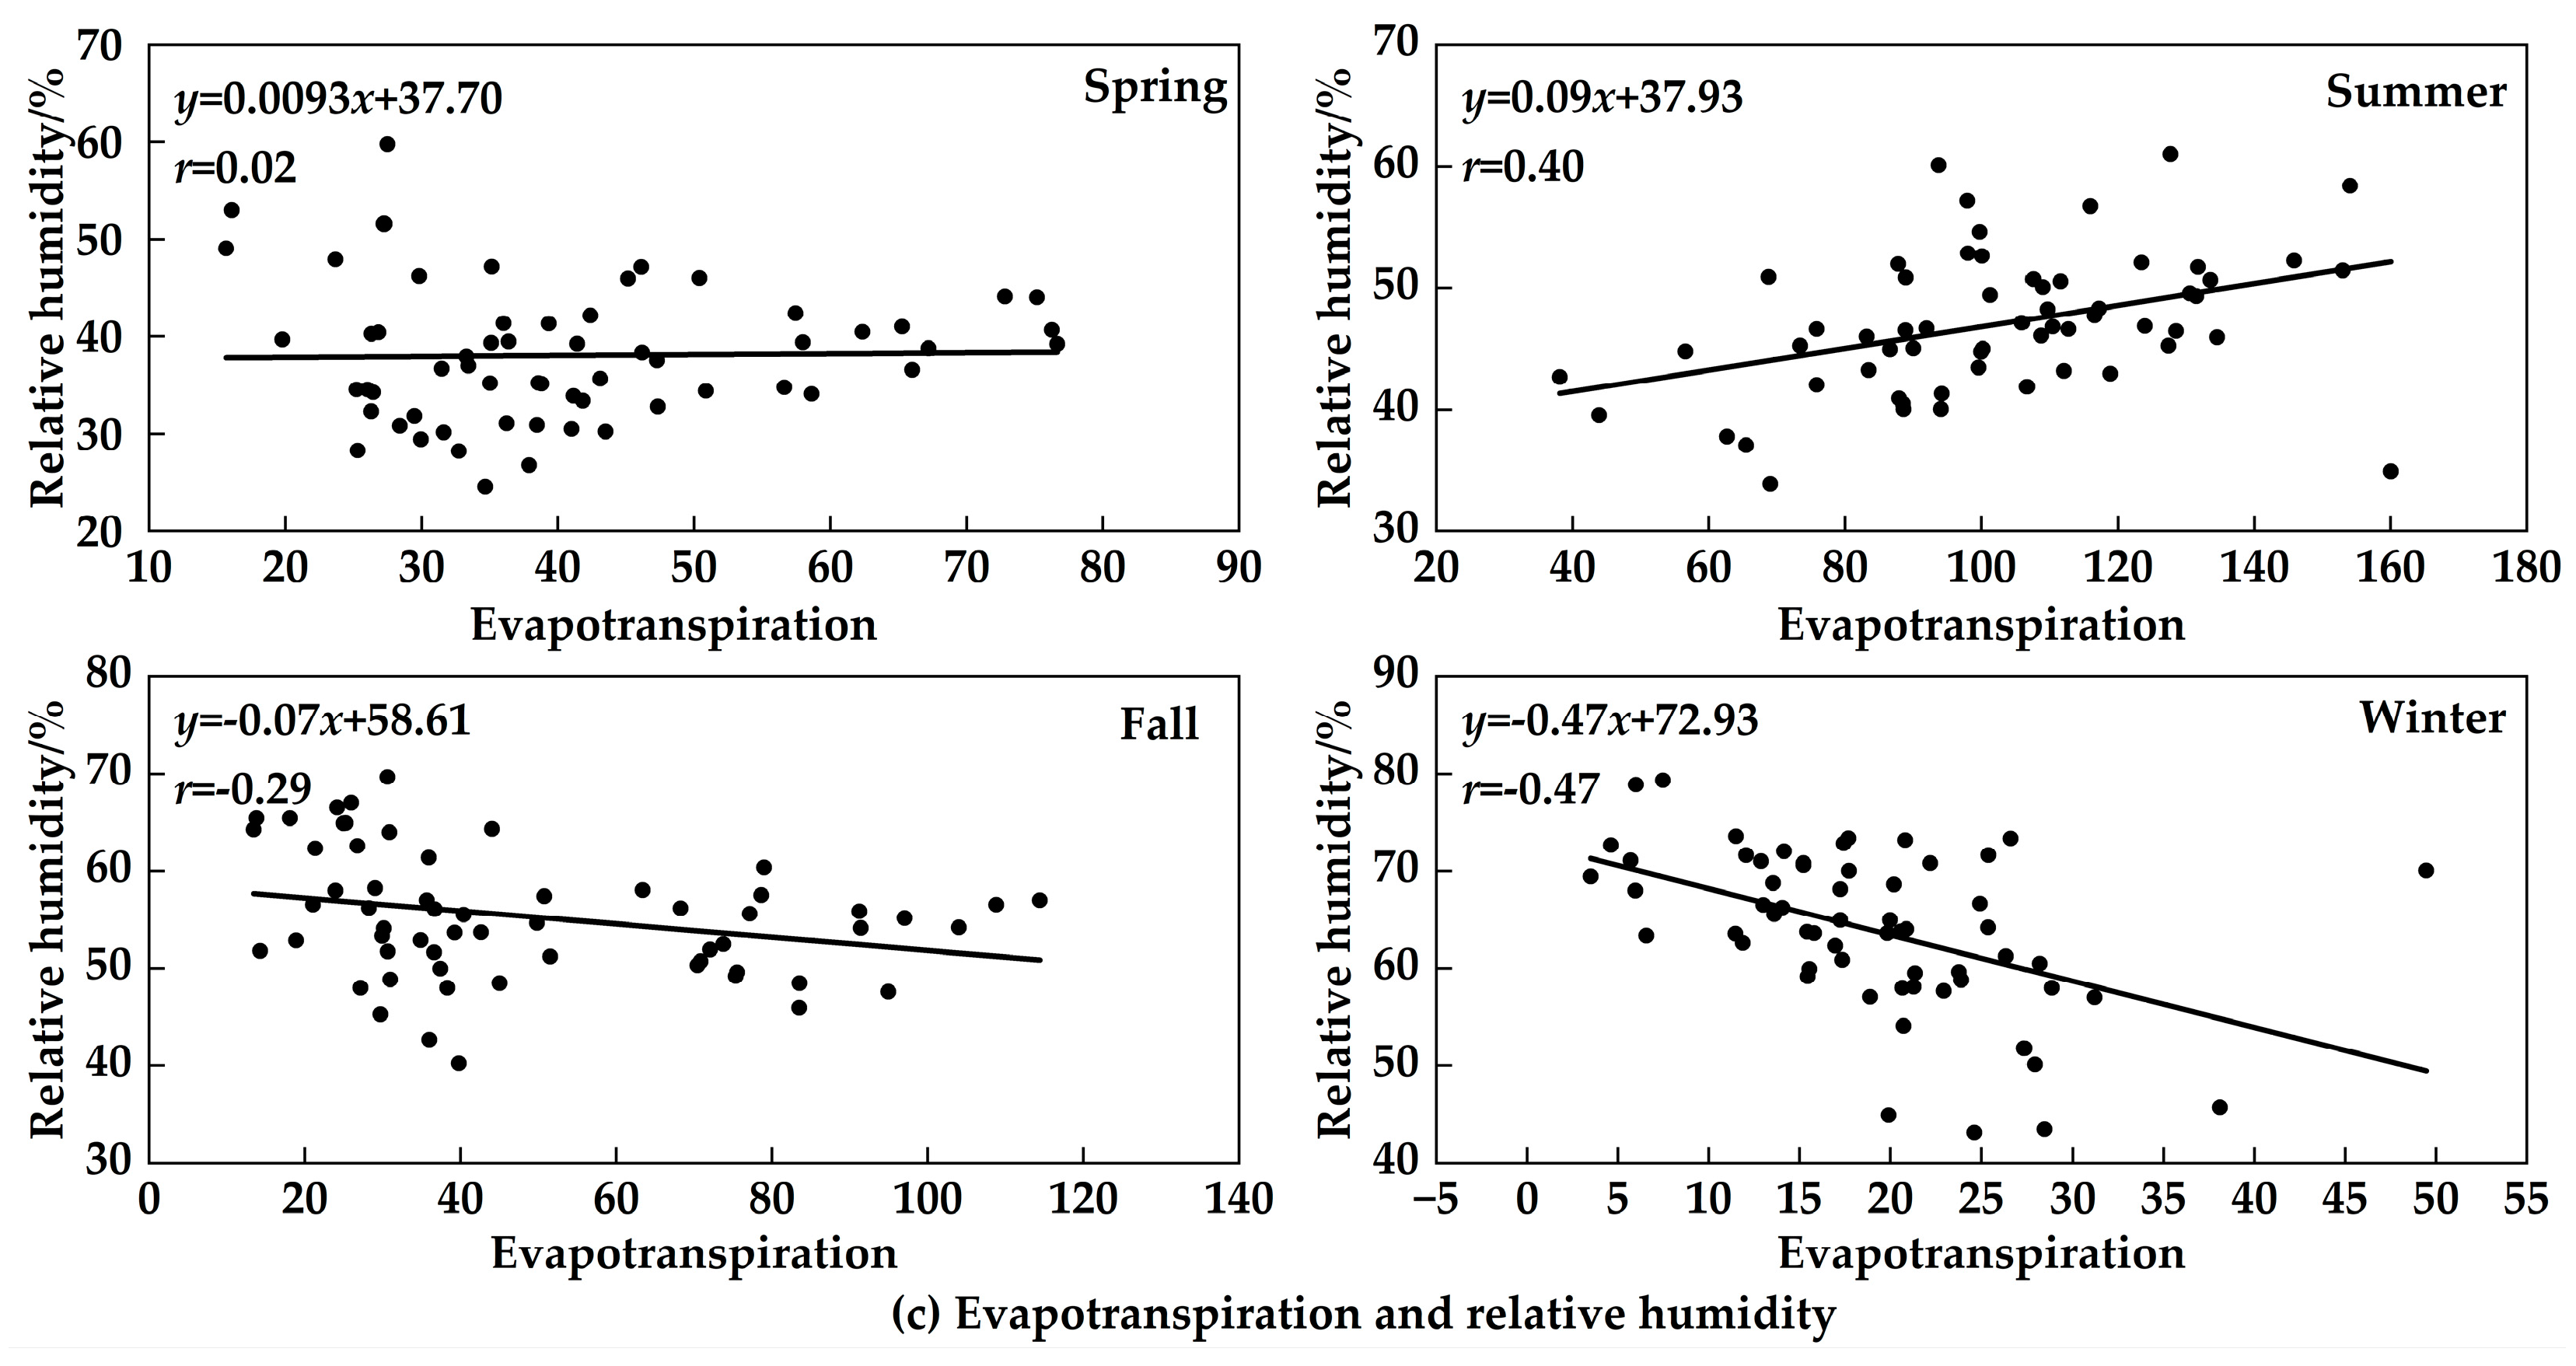
3.2.1. Analysis of the Correlation between Evapotranspiration and Climatic Factors

The correlations of the quarterly evapotranspiration with precipitation, temperature, and relative humidity in the study area from 2001 to 2020 were obtained using simple correlation analysis, and the results are shown in Figure 5. It can be seen that evapotranspiration showed significantly different correlations with precipitation, temperature, and relative humidity at the significance level of P = 0.05. The order of magnitude of the correlations between quarterly evapotranspiration and precipitation was as follows: fall (0.66) > spring (0.56) > winter (−0.33) > summer (0.32). The order of magnitude of the correlations with air temperature was as follows: fall (0.85) > spring (0.62) > winter (0.48) > summer (0.06). The order of magnitude of the correlations with relative humidity was as follows: winter (−0.47) > summer (0.40) > fall (−0.29) > spring (0.02).
The correlation between evapotranspiration and temperature was slightly higher than the correlations between evapotranspiration and both precipitation and relative humidity in spring, and the correlation between evapotranspiration and relative humidity was slightly higher than the correlations between evapotranspiration and both precipitation and air temperature in summer, indicating that the main factor governing the magnitude of the watershed’s evapotranspiration in spring was heat in the hydrothermal balance, and the main factor governing the magnitude of the watershed’s evapotranspiration in summer was water in the hydrothermal balance. The correlations between evapotranspiration and both precipitation and air temperature were significantly higher in fall than in the other three seasons, and the correlation with relative humidity was negative and low, indicating that evapotranspiration was mainly influenced by precipitation and air temperature in that season. The correlation coefficients of evapotranspiration with precipitation, air temperature, and relative humidity were all lower in winter, and the correlations with precipitation and relative humidity were all negative, mainly due to the high snowfall in winter in the Aksu River Basin, which covers the vegetation, resulting in low evapotranspiration in spite of the increase in precipitation; and a positive correlation with air temperature was found.
The spatial distributions of the correlation between evapotranspiration and various meteorological factors in the Aksu River Basin from 2001 to 2020 is shown in Figure 6. The spatial average correlation coefficient between evapotranspiration and precipitation was 0.15; with temperature, it was −0.01; and with relative humidity, it was 0.03, which was positively correlated overall. The areas with positive correlations between evapotranspiration and precipitation, temperature, and relative humidity accounted for 70.08%, 51.64%, and 52.52% of the total area of the basin, respectively, whereas the areas with negative correlations accounted for 29.92%, 48.31%, and 47.48% of the total area of the basin, respectively. The positive correlation between evapotranspiration and precipitation was stronger, and there were positive correlations between evapotranspiration and precipitation in most areas of the study area, indicating that precipitation was the main factor affecting evapotranspiration in the Aksu River Basin. The negative correlations between evapotranspiration and both temperature and relative humidity were stronger. In addition, the areas with consistent positive correlations with precipitation and relative humidity were mainly distributed in the northern region, and the areas with consistent negative correlations with temperature and relative humidity were mainly distributed in the central and southern regions, which further indicated that precipitation and relative humidity were the main climatic factors affecting changes in evapotranspiration in the study area.

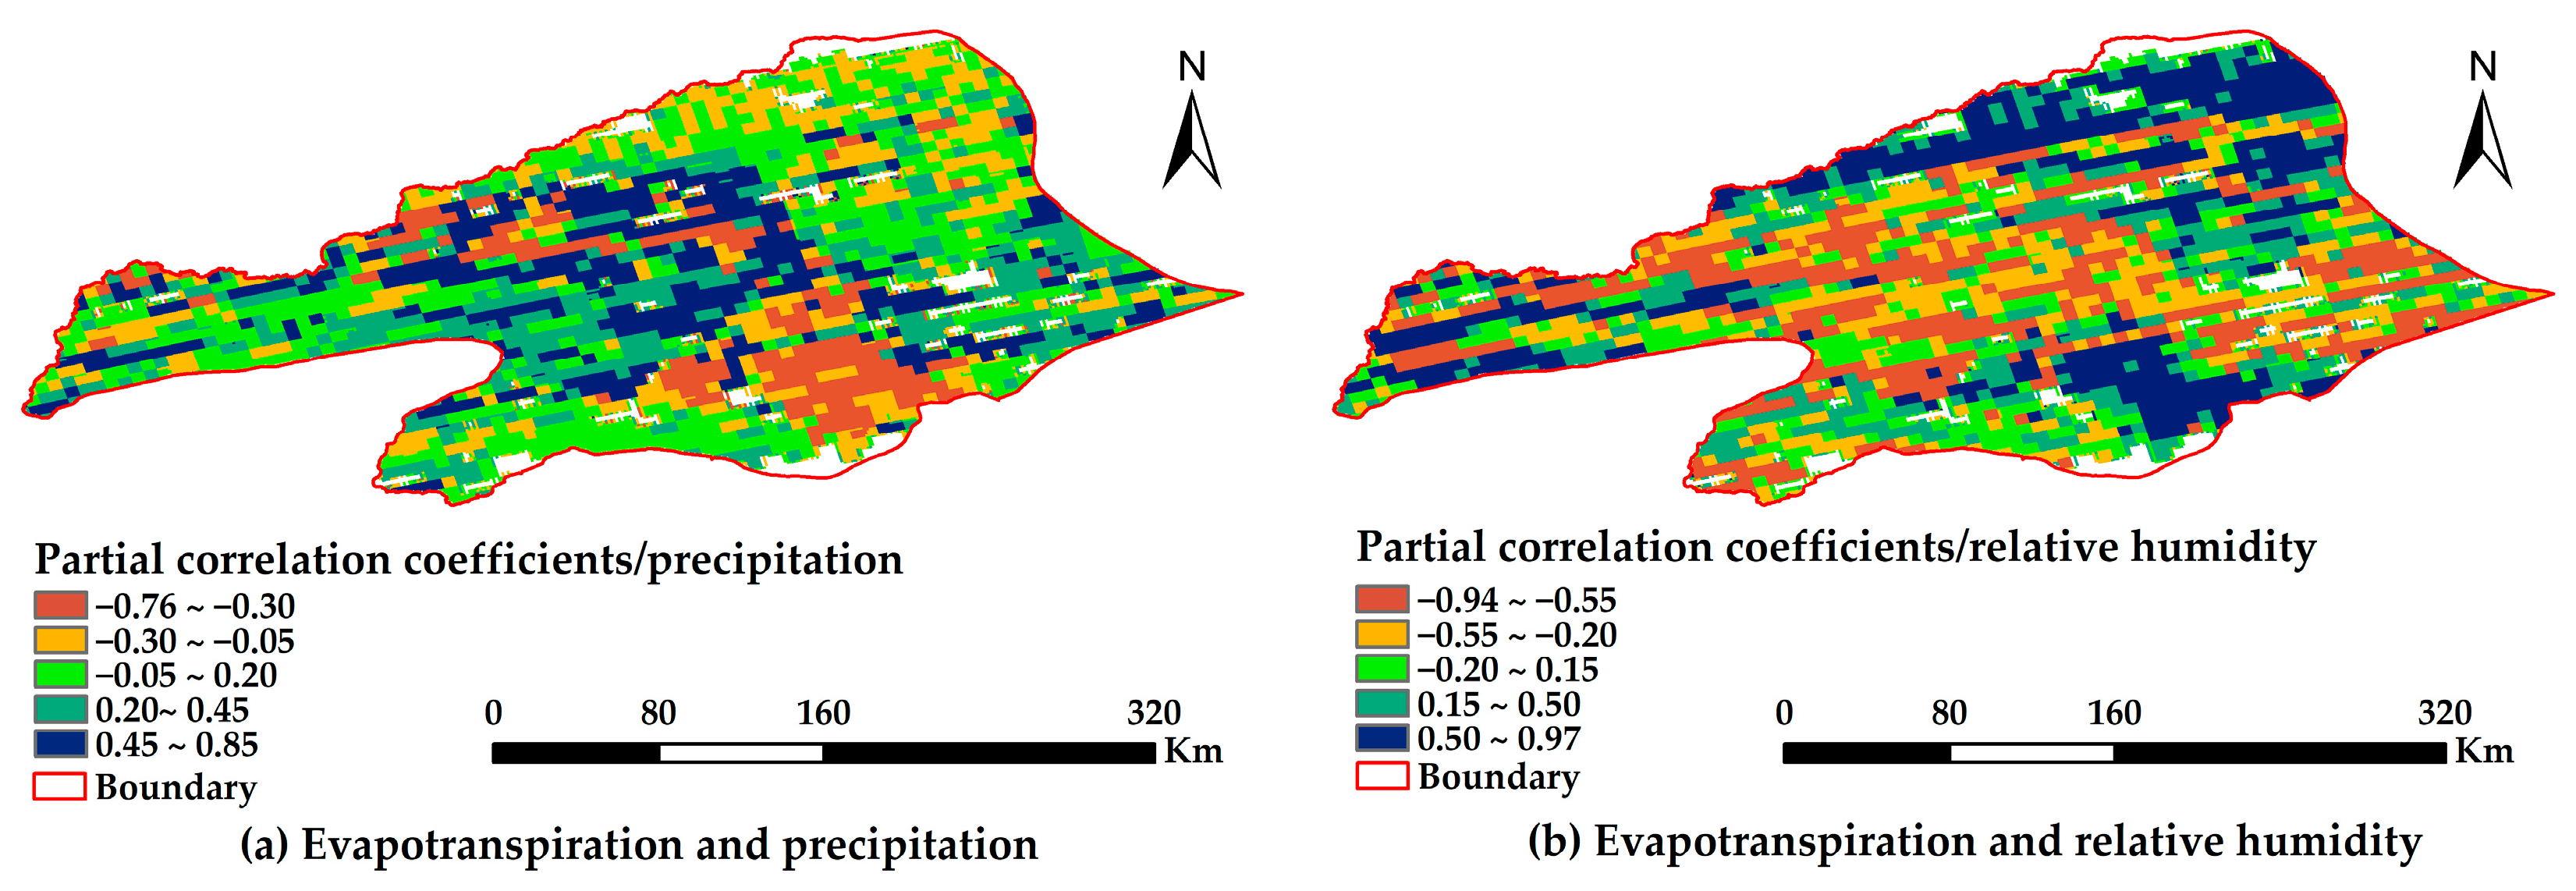
3.2.2. Bicorrelation and Complex Correlation Analysis between Evapotranspiration and Climatic Factors

Relative humidity and precipitation were selected for the partial correlation analysis and compound correlation analysis with evapotranspiration. As can be seen in Figure 7, the partial correlation coefficients for evapotranspiration and relative humidity were −0.95~0.97, with a mean value of −0.02, and the overall correlation was negative. The negatively correlated areas were Wushi, Aksu, and the northern part of Kalping, which have a total area of 23,637 km2, accounting for 51.35% of the total area of the watershed. With the two-sided t-test, Awat, northern Wushi, and northern Wensu passed the significance test at the level of 0.05. They have an area of 11,681 km2, accounting for 52.15% of the positively correlated areas of the bicorrelation coefficient of RH. Awat, northern Wushi, and northern Wensu passed the test of significance at the level of 0.01, and with an area of 8733 km2, they account for about 38.99% of the positively correlated area.
The bicorrelation coefficients for evapotranspiration and precipitation were −0.76~0.85, with a mean value of 0.13 and an overall positive correlation. The positively correlated areas were Aheqi, Wushi, the eastern part of Aksu, and the western part of Kalpin, which have an area of 30,196 km2, accounting for 65.59% of the total area of the watershed. With the two-sided t-test, Wushi and the eastern part of Aheqi passed the test of significance at the 0.05 level, and with an area of 9088 km2, they account for approximately 30.01% of the area, with a positive bicorrelation coefficient for precipitation. Wushi and the eastern part of Aheqi passed the test of significance at the 0.01 level, and with an area of 4811 km2, they account for approximately 15.93% of the positively correlated area. Overall, the significance of the bicorrelation between evapotranspiration and precipitation in the Aksu River Basin was stronger than that for relative humidity.
Figure 8 shows the spatial distribution of the complex correlation coefficients between evapotranspiration and climatic factors in the Aksu River Basin, with the complex correlation coefficients ranging from 0 to 0.98 and a mean value of 0.58. The areas with significant complex correlations were distributed in the east and west, whereas the areas with low complex correlations were distributed in north and south. The F-test results showed that approximately 60.03% of the areas passed the significance test at the 0.05 level and approximately 47.62% of the regions passed the significance test at the 0.01 level.

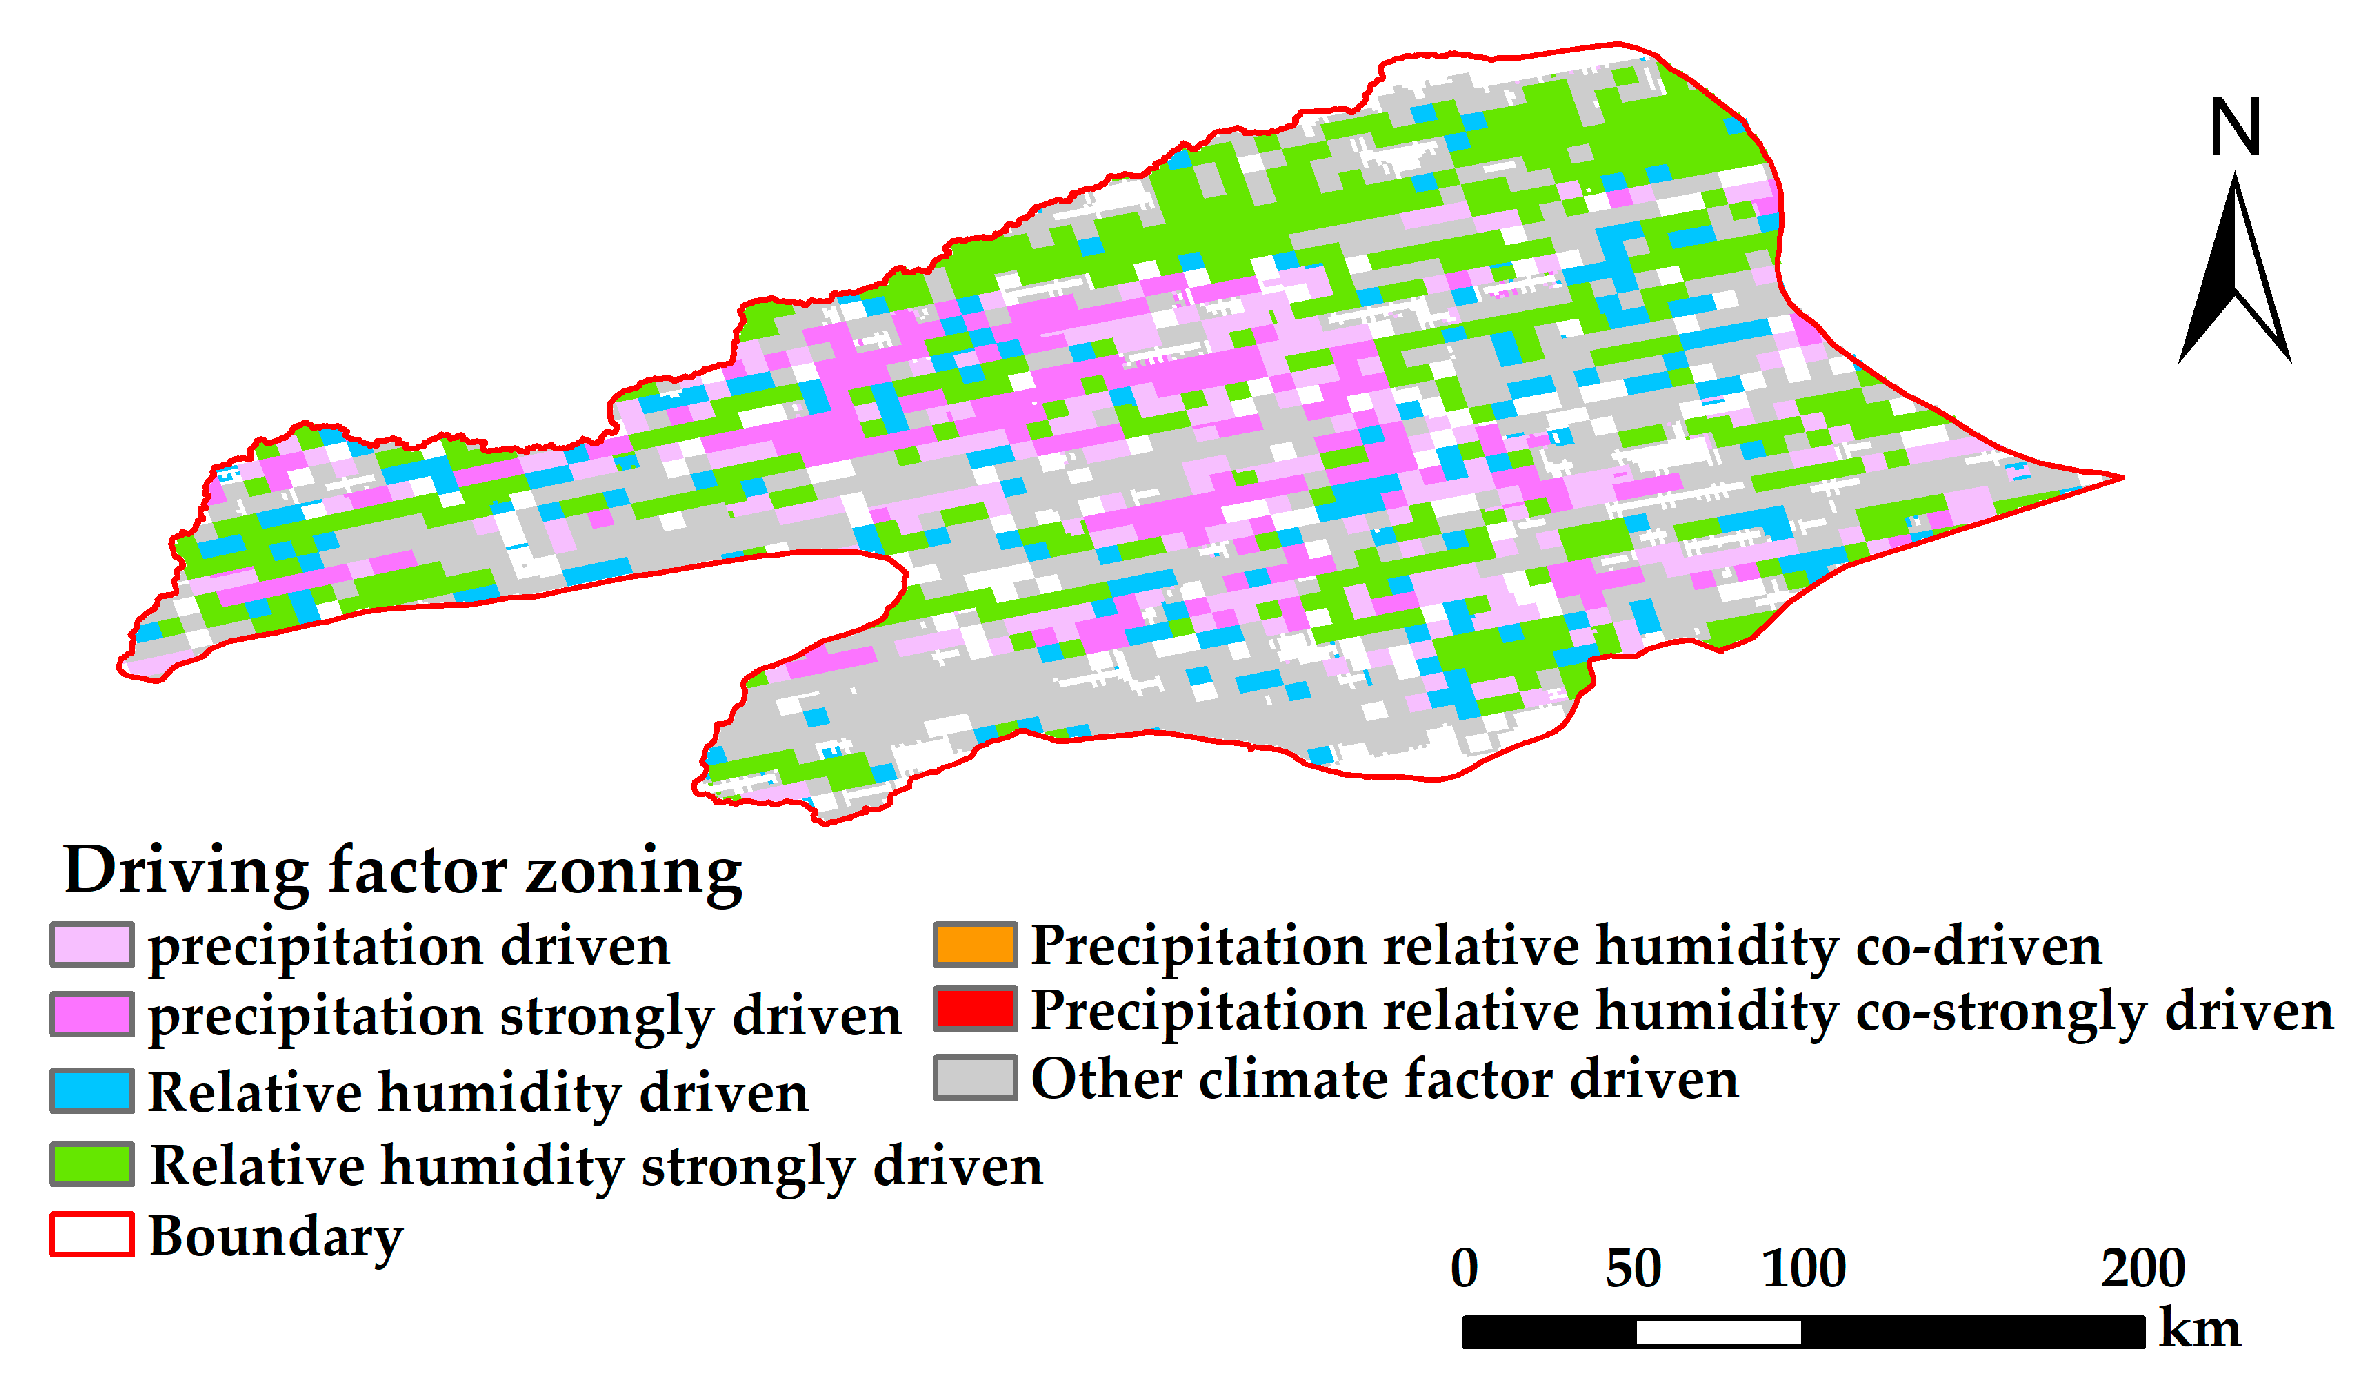
3.2.3. Analysis of the Drivers of Evapotranspiration and Climatic Factors

The results of the zoning of driving factors for evapotranspiration in the Aksu River Basin from 2001 to 2020 (Figure 9) indicated that areas with precipitation as a driving factor and strong precipitation as a driving factor in the basin totaled 10,675 km2, mainly Awat and Wushi. The area with strong precipitation as a driving factor was 5013 km2, accounting for approximately 46.96% of the total area in which precipitation was a driving force. The RH-driven areas were Wensu, Wushi, Awat, Aheqi, Kalpin, and Aksu, with a total area of 23,225 km2, of which the area strongly driven by RH as a factor occupied approximately 72.93% of the total RH-driven area. The areas in which precipitation and RH were codriving factors were the southcentral part of Wushi, the northern part of Awat, and the eastern part of Aheqi, for a total area of 7192 km2. The area in which RH and precipitation were strong codriving factors was approximately 32.56% of the total area in which precipitation and RH were codrivers. Overall, the mechanisms driving evapotranspiration in the Aksu River Basin from 2001 to 2020 were precipitation and relative humidity.

3.3. Impacts of Land Use Change on Spatial and Temporal Changes in Evapotranspiration

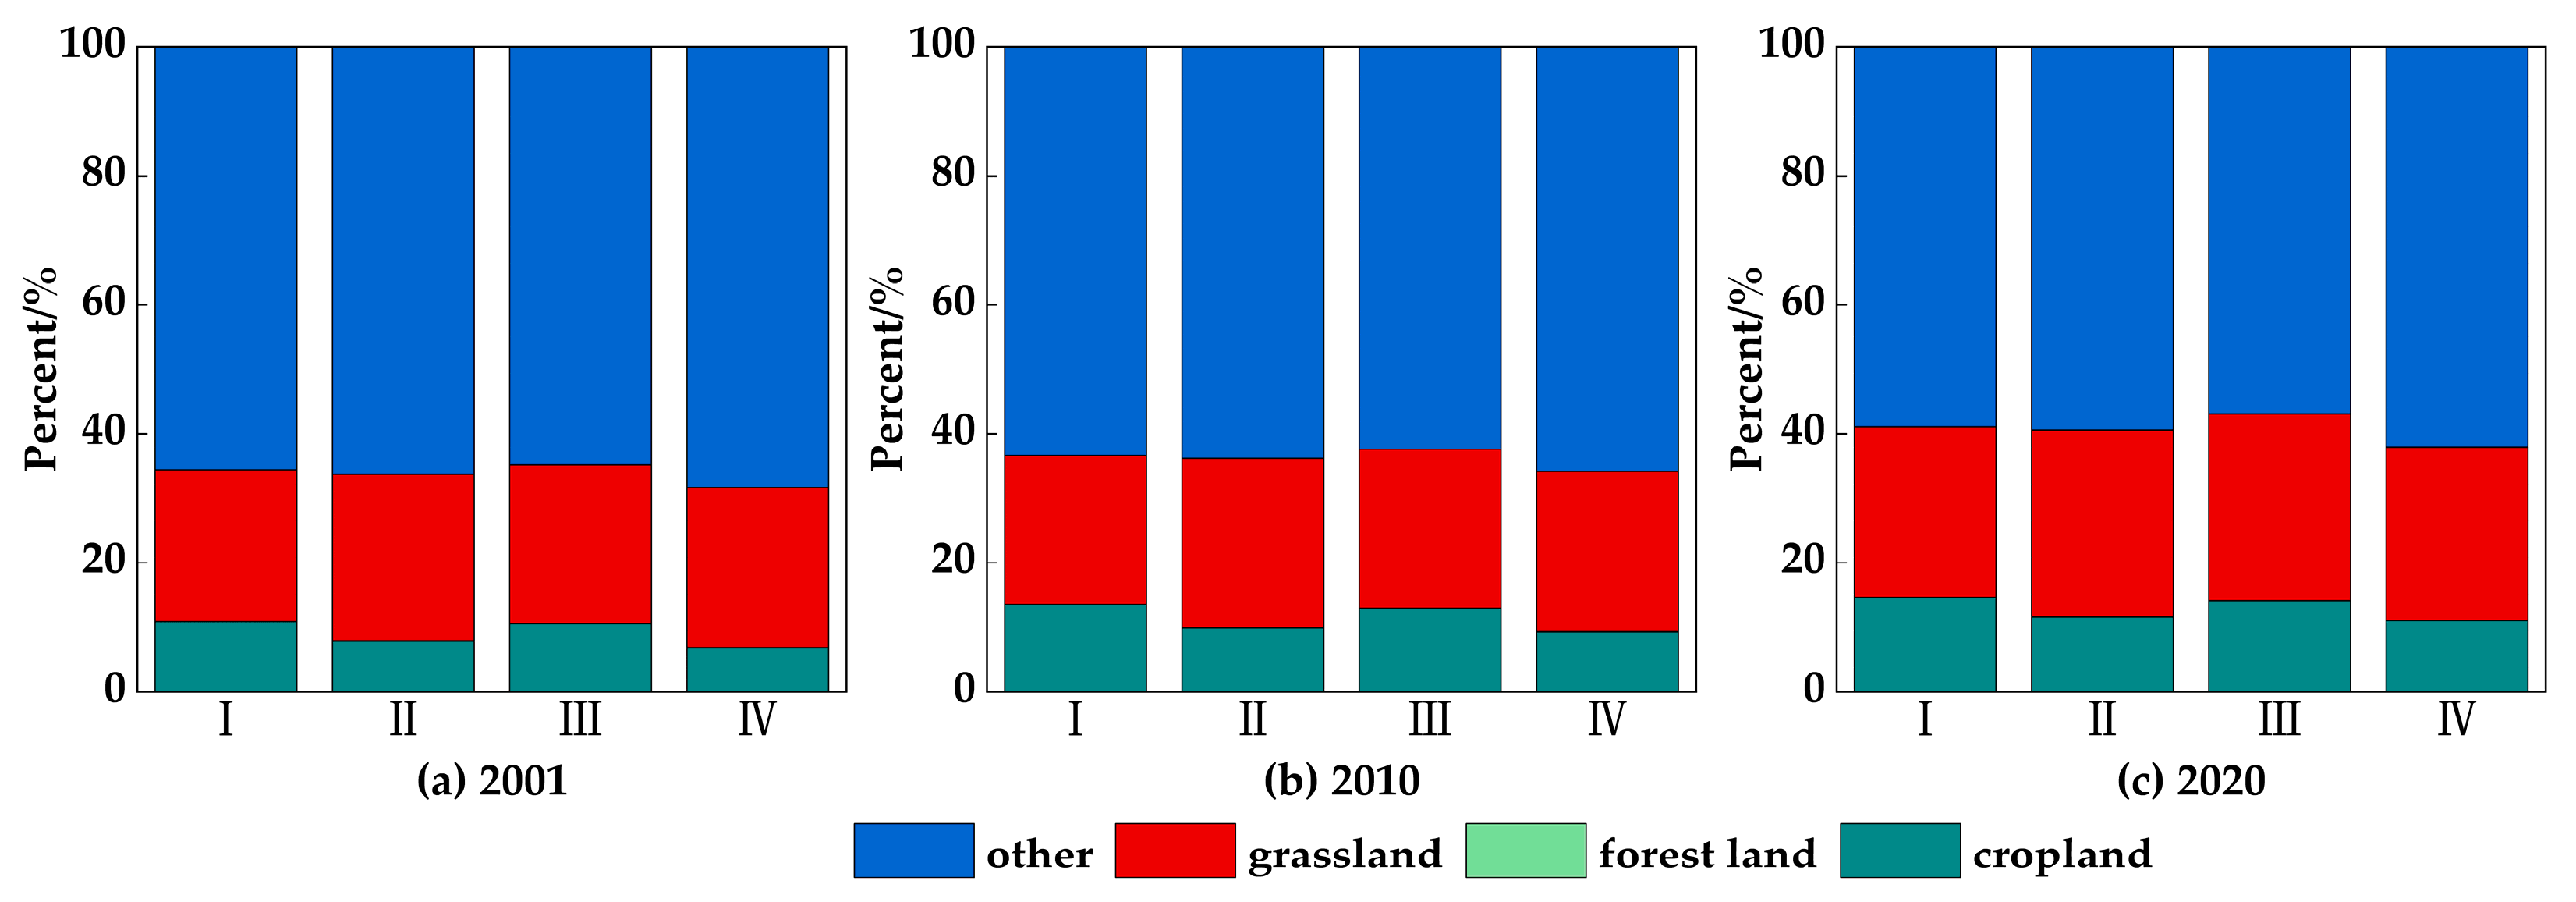
3.3.1. Characteristics of Spatiotemporal Changes in Evapotranspiration for Different Types of Land Use

As can be seen in Figure 10, the sizes of the areas of the different types of land use were in the following order: other land types > grassland > cropland > forest land. The sizes of the corresponding areas of annual average evapotranspiration were in the following order: cropland (137.48 mm/a) > grassland (114.84 mm/a) > other land types (61.34 mm/a) > forest land (46.44 mm/a). Cultivated land accounted for approximately 11.65% of the total area of the Aksu River Basin, which is equivalent to 18.95% of the total area of the other land types, whereas the multiyear average evapotranspiration for cultivated land was approximately 76.14 mm/a higher than the multiyear average evapotranspiration for other land types. This was due to the physiological characteristics of crop root systems, which absorb water for evapotranspiration. During the study period, the areas of cropland and grassland exhibited increasing trends, corresponding to an increasing trend in the mean evapotranspiration. Forest land and other land types exhibited decreasing trends in area, corresponding to an increasing trend in the values of evapotranspiration, which was due to increases in temperature and precipitation in the Aksu River Basin during the study period.

3.3.2. Zoning of the Drivers of Evapotranspiration in the Context of Land Use and Climate Change

The percentages of the types of land use for the various driving factors of the watershed’s evapotranspiration in 2001, 2010, and 2020 are shown in Figure 11. It can be seen that the percentages of cropland in I (driven by precipitation) were 14.67%, 13.46%, and 10.86%, in that order; the percentages of forest land in II (driven by relative humidity) were 0.03%, 0.05%, and 0.07%, in that order; and the percentages of grassland in III (codriven by precipitation and relative humidity) were 28.86%, 24.71%, and 24.58%, in that order. Overall, other land types accounted for the largest proportion for the types of drivers, with an average annual proportion of 63.17% across types of drivers and the largest proportion for IV (driven by other climatic factors). Therefore, the mode of the climatic factor-driven change in evapotranspiration for other land types in the Aksu River Basin was mainly IV. The annual average proportions of the modes of change in climatic factor-driven types of evapotranspiration for grassland were 27.01% and 26.05% for II and III, respectively, indicating that the main climatic factor-driven modes for grassland were II and III. The annual average percentages of the modes of change in evapotranspiration of climatic factor-driven Types I and III for cropland were 13.00% and 12.52%, respectively, indicating that the main climatic factor-driven modes for cropland were I and III. The annual average percentages of the changes in evapotranspiration of the climatic factor-driven Types II and IV for forest land were 0.05% and 0.01%, respectively, indicating that the main climatic factor-driven modes for forest land were II and IV.

4. Discussion

The spatial and temporal characteristics of evapotranspiration in the Aksu River Basin showed some spatial and temporal regularity, and the high values of evapotranspiration over the years were mainly distributed in the western part of Aheqi, which are at relatively high elevations, indicating that the spatial strength of evapotranspiration in the Aksu River Basin has a certain linkage with elevation [11]. With the increase in precipitation and temperature and the decrease in relative humidity, the multiyear average evapotranspiration in the Aksu River Basin is generally increasing, showing a spatial pattern of low–high–low distribution from northeast to southwest. The correlations of each climatic factor on evapotranspiration showed spatial heterogeneity, and the results of the analysis of the correlations between evapotranspiration and climatic factors showed that the positive correlation between evapotranspiration and precipitation was significantly stronger than those of air temperature and relative humidity, and that precipitation and the associated humidity were the main climatic factors influencing the spatiotemporal distribution of variability in regional evapotranspiration. However, the climatic factors are not completely independent from each other, and their interactions may also play some roles in the variations in evapotranspiration [28]. Also, the surface topography may cause different regions to exhibit different correlations between evapotranspiration and each climatic factor [29]. Future studies should consider this issue to better determine the effect of each climatic factor on evapotranspiration. The annual mean values of evapotranspiration of different types of land use in the watershed showed an increasing trend, with an increasing trend in the area of cultivated land and grassland, corresponding to an increasing trend in the mean value of evapotranspiration, which is inextricably linked to the work of the high-standard projects of basic farmland improvement and land consolidation in the Aksu River Basin.
The results of the study can provide a scientific reference basis for the rational development, utilization, and management of water resources in the Aksu River Basin and regional regulation of the climate. However, there are still the following shortcomings. The spatial resolution of the MOD16 evapotranspiration product data used in this paper was 500 m, and the data were affected by factors such as the distribution of clouds and mountain shadows, and there were no values for some pixels. Future studies should combine energy balance, inter-element interpolation, and other algorithms to obtain evapotranspiration data with a higher resolution and better quality for research.

5. Conclusions

On the basis of the MOD16 evapotranspiration product’s data, the characteristics of spatial and temporal changes in evapotranspiration were analysed using Theil–Sen median trend and the M–K test, and the mechanisms driving changes in evapotranspiration were explored using correlation analysis. The conclusions are as follows.
(1) The multiyear average value of evapotranspiration was 633.33 mm/a in the Aksu River Basin from 2001 to 2020, with a spatial distribution that was high in the west and central parts, and low in the north and south.
(2) The positive correlation between evapotranspiration and precipitation and the negative correlations between evapotranspiration and both air temperature and relative humidity were stronger in the Aksu River Basin. The significance of the bicorrelation between evapotranspiration and precipitation was stronger than that of relative humidity. The complex correlations between evapotranspiration and climatic factors were significant in most regions.
(3) The annual average values of evapotranspiration for the different types of land use were in the following order: cropland > grassland > other land types > forest land. The main factors influencing evapotranspiration in the Aksu River Basin were precipitation and relative humidity.

Author Contributions

G.Z. performed the data analyses and wrote the manuscript; G.W. and F.G. contributed to the conception of the study and the acquisition of funds; Y.C. contributed to the collection and processing of data; F.H. helped perform the analyses via constructive discussions. All authors have read and agreed to the published version of the manuscript.

Funding

This research was supported by the National Scientific Foundation of China (NSFC) (no. U2003204), the State’s Key Project of Research and Development Plan (2023YFC3206804), the Ministry of Water Resources’ special funds for major scientific research (SKS-2022155), and the Scientific Research Project of the Tarim River Basin Management Bureau (TGJAKSJJG-2022KYXM0003; TGJGLJJG-2024KYXM0003). We thank the editors and anonymous reviewers for their useful suggestions and comments for improving this article.

Institutional Review Board Statement

Not applicable.

Informed Consent Statement

Not applicable.

Data Availability Statement

The MOD16 evapotranspiration data can be accessed from NASA (https://search.earthdata.nasa.gov/, accessed on 20 February 2024). The meteorological data can be accessed from the National Earth System Science Data Center, National Science & Technology Infra-structure of China (http://www.geodata.cn, accessed on 20 February 2024), the MCD12Q1 MODIS/Terra + Aqua Land Cover Type Yearly L3 Global 500m SIN Grid V006 dataset, and NASA’s EOSDIS Land Processes Distributed Active Archive Center (accessed 20 February 2024 from https://doi.org/10.5067/MODIS/MCD12Q1.006).

Conflicts of Interest

The authors declare no conflict of interest.

References

  1. Ding, L.; Yu, Y.; Zhang, S. Trend Projections of Potential Evapotranspiration in Yangtze River Delta and the Uncertainty. Atmosphere 2024, 15, 357. [Google Scholar] [CrossRef]
  2. Fisher, J.B.; Meiton, F.; Middleton, E.; Hain, C.; Anderson, M.; Allen, R.; McCabe, M.F.; Hook, S.; Baldocchi, D.; Wood, E.F.; et al. The future of evapotranspiration: Global requirements for ecosystem functioning, carbon and climate feedbacks, agricultural management, and water resources. Water Resour. Res. 2017, 53, 2618–2626. [Google Scholar] [CrossRef]
  3. Li, X.; Zou, L.; Xia, J.; Dou, M.; Li, H.; Song, Z. Untangling the effects of climate change and land use/cover change on spatiotemporal variation of evapotranspiration over China. J. Hydrol. 2022, 612, 128189. [Google Scholar] [CrossRef]
  4. Jasechko, S.; Sharp, Z.D.; Gibson, J.J.; Birks, S.J.; Yi, Y.; Fawcett, P.J. Terrestrial water fluxes dominated by transpiration. Nature 2013, 496, 347–350. [Google Scholar] [CrossRef]
  5. Prvlie, R.; Piticar, A.; Roca, B.; Sfîcă, L.; Bandoc, G.; Tiscovschi, A.; Patriche, C. Spatio-temporal changes of the climatic water balance in Romania as a response to precipitation and reference evapotranspiration trends during 1961–2013. Catena 2019, 172, 295–312. [Google Scholar] [CrossRef]
  6. Dey, P.; Mishra, A. Separating the impacts of climate change and human activities on streamflow: A review of methodologies and critical assumptions. J. Hydrol. 2017, 548, 278–290. [Google Scholar] [CrossRef]
  7. Wang, Q.; Cheng, L.; Zhang, L.; Liu, P.; Qin, S.; Liu, L.; Jing, Z. Quantifying the impacts of land-cover changes on global evapotranspiration based on the continuous remote sensing observations during 1982–2016. J. Hydrol. 2021, 598, 126231. [Google Scholar] [CrossRef]
  8. Li, X.; Pang, Z.; Xue, F.; Ding, J.; Wang, J.; Xu, T.; Xu, Z.; Ma, Y.; Zhang, Y.; Shi, J. Analysis of Spatial and Temporal Variations in Evapotranspiration and Its Driving Factors Based on Multi-Source Remote Sensing Data: A Case Study of the Heihe River Basin. Remote Sens. 2024, 16, 2696. [Google Scholar] [CrossRef]
  9. Dunne, K.A.; Millly, P.C.D. Potential evapotranspiration and continental drying. Nat. Clim. Chang. 2016, 6, 946–949. [Google Scholar] [CrossRef]
  10. Zhang, S.; Zhang, P.; Zhang, R.; Liu, T. Estimation of growing season evapotranspiration and its variation in a typical area of Horqin Sandy Land. Adv. Water Sci. 2018, 29, 768–778. (In Chinese) [Google Scholar] [CrossRef]
  11. Huang, K.; Lu, Y.; Wei, Z.; Chen, H.; Zhang, B.; Ma, W. Effects of Land Use and Climate Change on Spatiotemporal Changes of Evapotranspiration in Haihe River Basin. J. Geo-Inf. Sci. 2019, 21, 1888–1902. (In Chinese) [Google Scholar]
  12. Zhang, Z.; Li, R.; Wang, X.; Wang, Y.; Jia, B. Spatio-temporal variation of evapotranspiration in Hetao lrrigated Area and its driving force analysis. Ecol. Sci. 2023, 42, 9–17. (In Chinese) [Google Scholar]
  13. Mu, Q.; Heinsch, F.A.; Zhao, M.; Running, S.W. Development of a global evapotranspiration algorithm based on MODIS and global meteorology data. Remote Sens. Environ. 2007, 111, 519–536. [Google Scholar] [CrossRef]
  14. Yang, J.; Zhou, X.; Cheng, D.; Zhang, J.; Niu, Q. Spatiotemporal Change Characteristics of MOD16 Evapotranspiration in Different Geomorphic Types of Guizhou Province. Res. Soil Water Conserv. 2019, 26, 216–222. (In Chinese) [Google Scholar]
  15. Zhang, K.; Zhu, G.; Ma, J.; Ma, J.; Yang, Y.; Shang, S.; Gu, C. Parameter analysis and estimates for the modis evapotranspiration algorithm and multiscale verification. Water Resour. Res. 2019, 55, 2211–2231. [Google Scholar] [CrossRef]
  16. Dzikiti, S.; Jovanovic, N.Z.; Bugan, R.D.; Ramoelo, A.; Majozi, N.P.; Nickless, A.; Cho, M.A.; Maitre, D.C.L.; Ntshidi, Z.; Pienaar, H.H. Comparison of two remote sensing models for estimating evapotranspiration: Algorithm evaluation and application in seasonally arid ecosystems in South Africa. J. Arid. Land 2019, 11, 495–512. [Google Scholar] [CrossRef]
  17. Chen, H.; Chen, Y.; Song, H.; Montri, S.; Nuttapon, K.; Zhang, J. Effects of land cover change on evapotranspiration in the tropical Lancang-Mekong River Basin from 2001 to 2020. Trans. Chin. Soc. Agric. Eng. 2022, 38, 113–122. (In Chinese) [Google Scholar]
  18. Cheng, M.; Jiao, X.; Jin, X.; Li, B.; Liu, K.; Shi, L. Satellite time series data reveal interannual and seasonal spatiotemporal evapotranspiration patterns in China in response to effect factors. Agric. Water Manag. 2021, 255, 107046. [Google Scholar] [CrossRef]
  19. Wang, C.; Cui, D.; Cong, Z.; Xie, H. Analysis of the Terrestrial Evapotranspiration in the Mainstream of the Tarim River Based on MODIS ET Data. J. Yili Norm. Univ. 2018, 12, 50–56. (In Chinese) [Google Scholar]
  20. Adilal, W.; Yusufujiang, R.; Reyilal, K.; Jiang, H. Spatiotemporal Distribution and Variation Trend of Evapotranspiration in lli River Valley. J. Geo-Inf. Sci. 2018, 20, 217–227. (In Chinese) [Google Scholar]
  21. Amannisa, K.; Mansuer, S.; Aikedan, Y.; Asiya, A.; Kunbike, B. Spatiotemporal evolution of arable land use in Aksu River Basin, Xinjiang in recent 19 years. Sci. Soil Water Conserv. 2022, 20, 72–80. (In Chinese) [Google Scholar]
  22. National Earth System Science Data Center, National Science & Technology Infrastructure of China. Available online: http://www.geodata.cn (accessed on 20 February 2024).
  23. Ye, H. Spatio-Temporal Characteristics of ET and Its Relationship between Climate Factors in the Source Region of the Yangtze and Yellow River in Recent 17 Years; Chengdu University of Technology: Chengdu, China, 2019. (In Chinese) [Google Scholar]
  24. Deng, X.Y.; Liu, Y.; Liu, Z.H.; Yao, J.Q. Temporal-spatial dynamic change characteristics of evapotranspiration in arid region of Northwest China. Acta Ecol. Sin. 2017, 37, 2994–3008. (In Chinese) [Google Scholar]
  25. Wang, G.; Sun, G.; Wei, Y.; Wang, L.; Zhao, R.; Mo, C. Spatiotemporal Variation of NDVI and lts Driving Factors Analysis in Chengbihe Basin from 1990 to 2019. Res. Soil Water Conserv. 2022, 29, 207–214. (In Chinese) [Google Scholar]
  26. Liu, X.; Zheng, H.; Zhang, M.; Liu, C. Identification of dominant climate factor for pan evaporation trend in the Tibetan Plateau. J. Geogr. Sci. 2011, 21, 594–608. (In Chinese) [Google Scholar] [CrossRef]
  27. Zhao, A.; Zhang, A.; Feng, L.; Dongli, W. Spatio-temporal characteristics of water-use efficiency and its relationship with climatic factors in the Haihe River basin. Acta Ecol. Sin. 2019, 39, 1452–1462. (In Chinese) [Google Scholar]
  28. She, D.; Xia, J.; Zhang, Y. Changes in reference evapotranspiration and its driving factors in the middle reaches of Yellow River Basin, China. Sci. Total Environ. 2017, 607–608, 1151–1162. [Google Scholar] [CrossRef]
  29. Lian, R.; Zeng, Q. Existence of a strong solution and trajectory attractor for a climate dynamics model with topography effects. J. Math. Anal. Appl. 2018, 458, 628–675. [Google Scholar] [CrossRef]
Figure 1. Map of the Aksu River Basin, China.
Atmosphere 15 01055 g001
Figure 2. Interannual variability in evapotranspiration and climatic factors from 2001 to 2020 in the Aksu River Basin.
Atmosphere 15 01055 g002
Figure 3. Changes in the monthly mean evapotranspiration and in the precipitation, temperature, and relative humidity from 2001 to 2020 in the Aksu River Basin.
Atmosphere 15 01055 g003
Figure 4. Spatial analysis of the mean evapotranspiration and the trends in the changes in evapotranspiration from 2001 to 2020 in the Aksu River Basin.
Atmosphere 15 01055 g004
Figure 5. Correlation analysis of seasonal evapotranspiration with precipitation, temperature, and relative humidity from 2001 to 2020 in the Aksu River Basin.
Atmosphere 15 01055 g005aAtmosphere 15 01055 g005b
Figure 6. Spatial distributions of the correlation coefficients between evapotranspiration and climatic factors from 2001 to 2020 in the Aksu River Basin.
Atmosphere 15 01055 g006
Figure 7. Spatial distributions of the partial correlation coefficients between evapotranspiration and (a) precipitation and (b) relative humidity from 2001 to 2020 in the Aksu River Basin.
Atmosphere 15 01055 g007
Figure 8. Distribution of the compound correlation coefficients between evapotranspiration and climatic factors from 2001 to 2020 in the Aksu River Basin.
Atmosphere 15 01055 g008
Figure 9. Spatial distribution of the drivers of evapotranspiration and climatic factors from 2001 to 2020 in the Aksu River Basin.
Atmosphere 15 01055 g009
Figure 10. Changes in the areas and evapotranspiration according to different types of land use in the Aksu River Basin from 2001 to 2020.
Atmosphere 15 01055 g010
Figure 11. The proportions of the types of land use for the drivers of evapotranspiration in 2001, 2010, and 2020 in the Aksu River Basin.
Atmosphere 15 01055 g011
Table 1. Rules of climate-factor-driven zoning for interannual evapotranspiration in the Aksu River Basin.
Types of Drivers of Evapotranspiration t-Test (Precipitation)t-Test (Relative Humidity)F-Test
α = 0.05α = 0.01α = 0.05α = 0.01α = 0.05α = 0.01
Precipitation |T| ≥ t0.05\\\F ≥ f0.05\
Precipitation intensity\|T| ≥ t0.01\\\F ≥ f0.01
Relative humidity \\|T| ≥ t0.05\F ≥ f0.05\
Relative humidity (strong) \\\|T| ≥ t0.01\F ≥ f0.01
Precipitation and relative humidity|T| ≥ t0.05\|T| ≥ t0.05\F ≥ f0.05\
Precipitation and relative humidity (strongly codriven)\|T| ≥ t0.01\|T| ≥ t0.01\F ≥ f0.01
Other climatic factors|T| < t0.05\|T| < t0.05\F < f0.05\
Table 2. Mann–Kendall test categories of trend.
ββ > 0β = 0β < 0
Z2.58 < Z1.96 < Z ≤ 2.581.65 < Z ≤ 1.96Z ≤ 1.65ZZ ≤ 1.651.65 < Z ≤ 1.961.96 < Z ≤ 2.582.58 < Z
Trend categories43210−1−2−3−4
Trend characterisationsHighly significant increaseSignificant increase Slightly significant increaseNo significant increaseNo changeNo
significant decrease
Slightly significant decreaseSignificant decreaseHighly significant decrease
Disclaimer/Publisher’s Note: The statements, opinions and data contained in all publications are solely those of the individual author(s) and contributor(s) and not of MDPI and/or the editor(s). MDPI and/or the editor(s) disclaim responsibility for any injury to people or property resulting from any ideas, methods, instructions or products referred to in the content.

