Abstract
This study investigates the dust aerosol optical depth (DAOD) variability over the Arabian Peninsula (AP) in the spring season, a region profoundly affected by dust activity due to its desert terrain. Employing the MERRA-2 DAOD reanalysis dataset for the period 1981–2022, a significant trend in DAOD is noted in the spring season compared to the other seasons. The leading Empirical Orthogonal Function (EOF) explains 67% of the total DAOD variance during the spring season, particularly over the central and northeastern parts of AP. The analysis reveals the strengthening of upper-level divergence over the western Pacific, favoring mid-tropospheric positive geopotential height anomalies over the AP, leading to warm and drier surface conditions and increased DAOD. A statistically significant negative relationship (correlation = −0.32, at 95% confidence level) is noted between DAOD over AP and the El Niño-Southern Oscillation (ENSO), suggesting that La Niña conditions may favor higher dust concentrations over the AP region and vice versa during El Niño phase. The high (low) DAOD over the region corresponds to mid-tropospheric positive (negative) geopotential height anomalies through strengthening (weakening) of the upper-level divergence (convergence) over the western Pacific during the La Niña (El Niño) phase. This study shows that ENSO could be a possible precursor to predicting dust variability on a seasonal time scale.
1. Introduction
The Arabian Peninsula (AP) is considered a hotspot for dust activity because of its desert climate characteristics [1]. The region is also known as the global dust source and is ranked as the world’s second-largest contributor to dust emissions [2,3]. The northeastern and central parts of the AP experience significant spatiotemporal variability in dust aerosols, particularly during the spring season [4,5,6]. Understanding the regional dynamics of dust aerosol variability in the spring season is crucial for various socioeconomic sectors such as environmental, health, tourism, and agriculture. Dust aerosol emission and transport are influenced both by large-scale atmospheric circulations and the local underlying surface conditions. The influential natural factor that modifies the regional climate patterns is the El Niño-Southern Oscillation (ENSO) phenomenon [7,8]. Despite the recognized importance of ENSO in driving AP seasonal temperature and precipitation variability [9,10,11,12,13,14,15,16,17], a detailed investigation of its influence on dust aerosol variability during the spring season is lacking for the region. This study aims to fill the gap by exploring the relationships between ENSO and dust aerosol variability, thereby contributing to a comprehensive understanding of the interannual variability of dust aerosol over the AP region during the spring season.
Dust aerosol optical depth (DAOD) is a measure of the extinction of solar radiation by dust. It indicates how much direct sunlight is prevented by dust aerosols from reaching the ground. It is related to the amount of aerosol in the vertical column of the atmosphere over the observation location. Dust aerosols across the AP are linked to various source regions, including Tigris and Euphrates River valleys, the alluvial plain in Iraq and Kuwait, the low-lying flat lands in the east of the Peninsula along the Arabian Gulf, as well as the desert of ad-Dahna and Rub Al Khali [18,19,20], as in Figure 1 (red dots), which shows strong seasonality. Dust emission, transportation, and deposition are influenced by surface wind speed and precipitation [21,22,23].
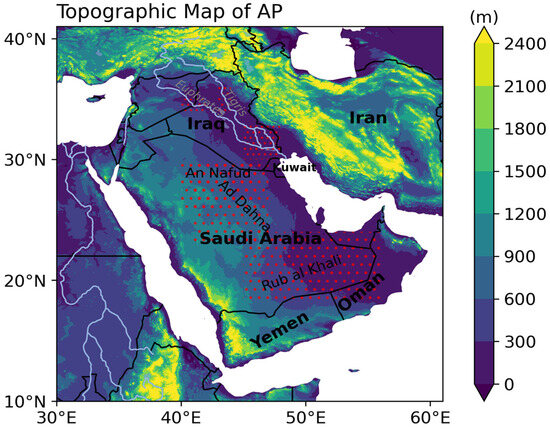
Figure 1.
Topographic map of the study region (red dots indicate the dust source regions within AP).
Annually, AP receives approximately ~90 mm [24] of precipitation, which occurs mainly in the boreal winter and spring months in the central and northeastern regions. According to the annual cycle of the dust activity over AP, it reaches its peak during the spring and early summer months [20,25]. In the spring season, dust activity over AP is primarily triggered by cold fronts associated with Mediterranean cyclones [26], while the north-westerly wind is the main triggering mechanism for dust activity over the region during the summer season [21,27]. Additionally, long-range dust aerosols from the Sahara Desert also contribute significantly to shaping the regional dust activity over the AP region [20,21,28,29,30,31]. In recent decades, satellite and ground-based data have revealed a pronounced increase in aerosol loadings over the region due to anthropogenic activities [32,33,34,35]. This increase could be attributed to the prolonged drought conditions over the AP [36,37], which tend to enhance the conditions for dust activity in the region [38].
The Pacific Decadal Oscillation (PDO) and El Niño-Southern Oscillation (ENSO) modulate the interannual variability of dust activity over the AP region [23,39,40,41,42] as well as globally [43]. Various studies examine the role of ENSO on dust activity in the region spanning from North Africa to Central Asia. Huang et al. [43] and Yin et al. [42] examine the relationship between ENSO and dust activity across an extended domain, where they suggest the impacts of ENSO on dust activity through modifications in precipitation, humidity, wind, vegetation, and soil moisture. Yu et al. [44] focus on the Arabian Peninsula and suggest that La Niña events enhance dust activity by reducing rainfall in the Rub’al Khali desert. Labban and Butt [23] analyze the interannual variability of dust storms over Saudi Arabia, suggesting a moderate correlation with ENSO, with El Niño being more dominant in earlier decades and La Niña in recent years. In addition, the dust storm activity over AP during the wet season (October–May) is more frequent during La Niña and less frequent during El Niño [45]. However, none of the previous studies specifically addressed the primary mode of dust variability and provided a detailed mechanism for the impact of ENSO on AP dust variability during the spring season, which is discussed in the present study.
In the present study, we discussed the dust aerosol variability during the spring (March to May; MAM) season and its association with the ENSO using the reanalysis dataset. The remainder of the manuscript is structured as follows: Section 2 covers the discussion of data and methodology; Section 3 presents the dust aerosol variability and its ENSO teleconnections; and Section 4 provides the summary and conclusions.
2. Data and Methods
2.1. The MERRA-2 Dataset
The MERRA-2 reanalysis dataset is generated by the Goddard Earth Observing System Model, Version 5 (GEOS-5) [46]. MERRA-2 uniquely incorporates both meteorology and aerosol observations, aiming to facilitate comprehensive Earth system analyses. The MERRA-2 dataset offers a spatial resolution of 0.5° × 0.625° and encompasses 72 vertical model levels from the surface up to approximately 80 km. In this study, we utilize the monthly average dust aerosol component column concentration data product (MERRA2_***.tavgM_2d_aer_Nx***). The monthly dust aerosol optical depth (DAOD) was obtained from NASA. The data were converted into seasonal means for further analysis on a common grid of 1° × 1°.
The DAOD at a wavelength of 550 nanometers (550 nm) was acquired for the current study. It determines the dust aerosol content, which is the vertical integral of solar beam extinction by scattering and absorption over an atmospheric column.
2.2. ERA5 Reanalysis
The fifth-generation European Reanalysis (ERA5) product was developed by the European Centre for Medium-Range Weather Forecasts (ECMWF, Reading, UK) [47]. Employing the 4D-var data assimilation technique within the Integrated Forecasting System (IFS) Cy41r2, ERA-5 provides atmospheric data across multiple pressure levels and comprises 137 hybrid sigma/pressure vertical levels, with the highest level at 0.01 hPa. The ERA5 monthly data for sea level pressure (SLP), sea surface temperatures (SSTs), 500 hPa geopotential height (gph), zonal and meridional winds, vertical velocity (omega field), net surface radiation, and surface air temperature (SAT)—also known as 2 m air temperature at 0.25° × 0.25° spatial resolution—were downloaded from Copernicus. The data are further converted into seasonal means for further analysis on a common 1° × 1° grid for the period 1981 to 2022.
2.3. Methods
The trends in the DAOD time series were determined utilizing the Sen’s Slope estimator. The significance of the trend in the DAOD time series was assessed using the modified non-parametric Mann–Kendall (m-MK) test. The Sen’s slope estimator, introduced by Sen in 1968, is a non-parametric approach for estimating the slope of a linear trend [48,49]. This method calculates the median slope among all possible point-pair slopes in a dataset, making it robust against the influence of outliers. In the context of time series analysis, Sen’s statistic provides a measure of the change per unit time. If a linear trend is present in the time series data, the slope or rate of change over time can be determined using this method. The m-MK test is employed to assess the significance of trends in a time series. This test, based on ranks, does not assume a specific data distribution, remains resilient to the influence of outliers and non-normality in short records, and has been widely used [50,51,52,53]. It is important to mention that the presence of autocorrelation can impact trend results, necessitating its removal before applying the m-MK test. One method for addressing autocorrelation is the pre-whitening scheme proposed by [54]. Alternatively, a m-MK test, introduced by [49], can be employed to mitigate the effects of autocorrelation before assessing statistical significance. The modified test demonstrates comparable accuracy to the original Mann–Kendall trend test and exhibits robustness in the presence of autocorrelation in the time series. Therefore, this study opts for the m-MK over the original Mann–Kendall test. The statistical significance of the DAOD annual and seasonal trends at a 95% confidence level is determined using the m-MK test.
Linear regression is used to analyze the teleconnections, which is defined as the covariance of the standardized anomaly index with the required global anomaly field [55,56]. We employ Empirical Orthogonal Function (EOF) analysis using the covariance matrix and apply weights based on the cosine of the latitude to examine the primary modes of interannual variability and the temporal evolution of the DAOD over the study region. The EOF method helps to decompose the data into dominant and orthogonal (independent) modes of variability and is widely used in climate research [57,58,59,60,61].
The DAOD index (referred to as DAODI) is defined over the domain (42–55° E; 20–32° N). The anomalies are calculated based on the 1981–2022 reference period. The Niño3.4 SST index is determined for the central–eastern equatorial Pacific region (170° W–120° W, 5° S–5° N) during the spring season, utilizing SST anomalies from 1981 to the 2022 period. El Niño and La Niña composites are established using the Niño3.4 SST index. An El Niño year is identified when the Niño3.4 SST index exceeds 0.5 °C, whereas a La Niña year is characterized by a Niño3.4 SST index lower than −0.5 °C.
Further, we also defined high and low DAOD based on the 1-sigma standard deviation (STD) of DAOD. The values with ≥1-sigma STD are referred to as high, and the values with ≤1-sigma STD are referred to as low DAOD. A Student’s t-test is used to test the statistical significance of the regression and correlation maps at a 95% confidence level, while a 90% confidence level is used for composites [62].
The probability distribution function (PDF) of DAODI is analyzed using the kernel density estimation (KDE) binned against El Niño and La Niña [63,64]. The spatiotemporal distribution of DAOD and SAT was analyzed with the PDF using KDE over the region (42–55° E; 20–32° N), where the PDF is constructed over all the data points in space and time (longitude × latitude × time).
3. Results and Discussion
3.1. DAOD Seasonal Mean, Variability, and Trends over AP
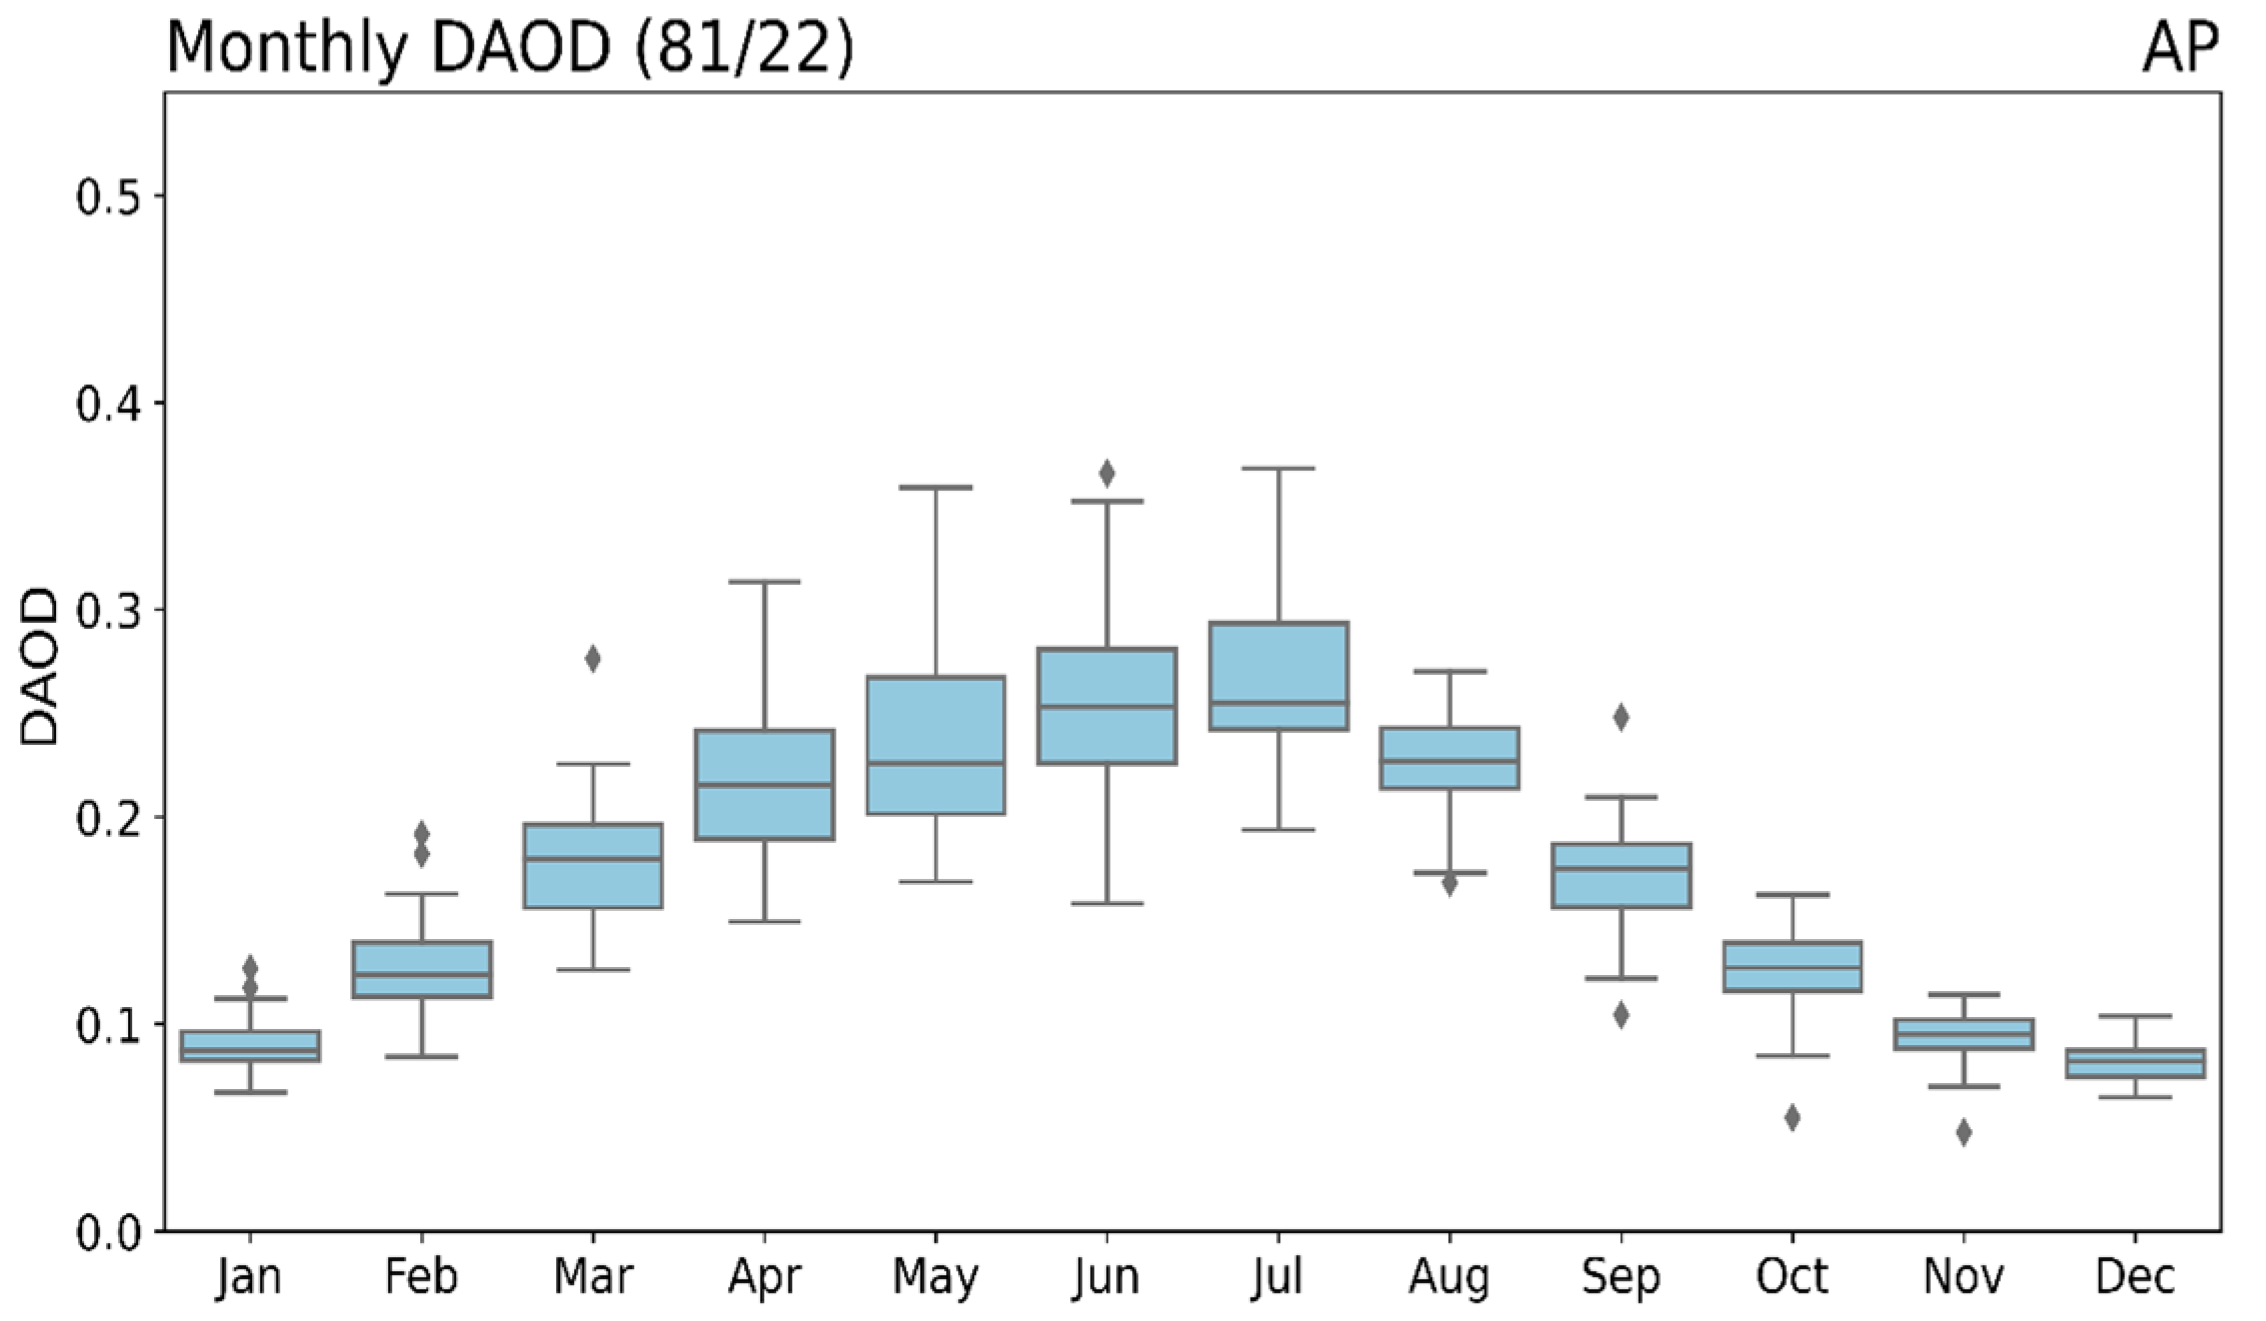
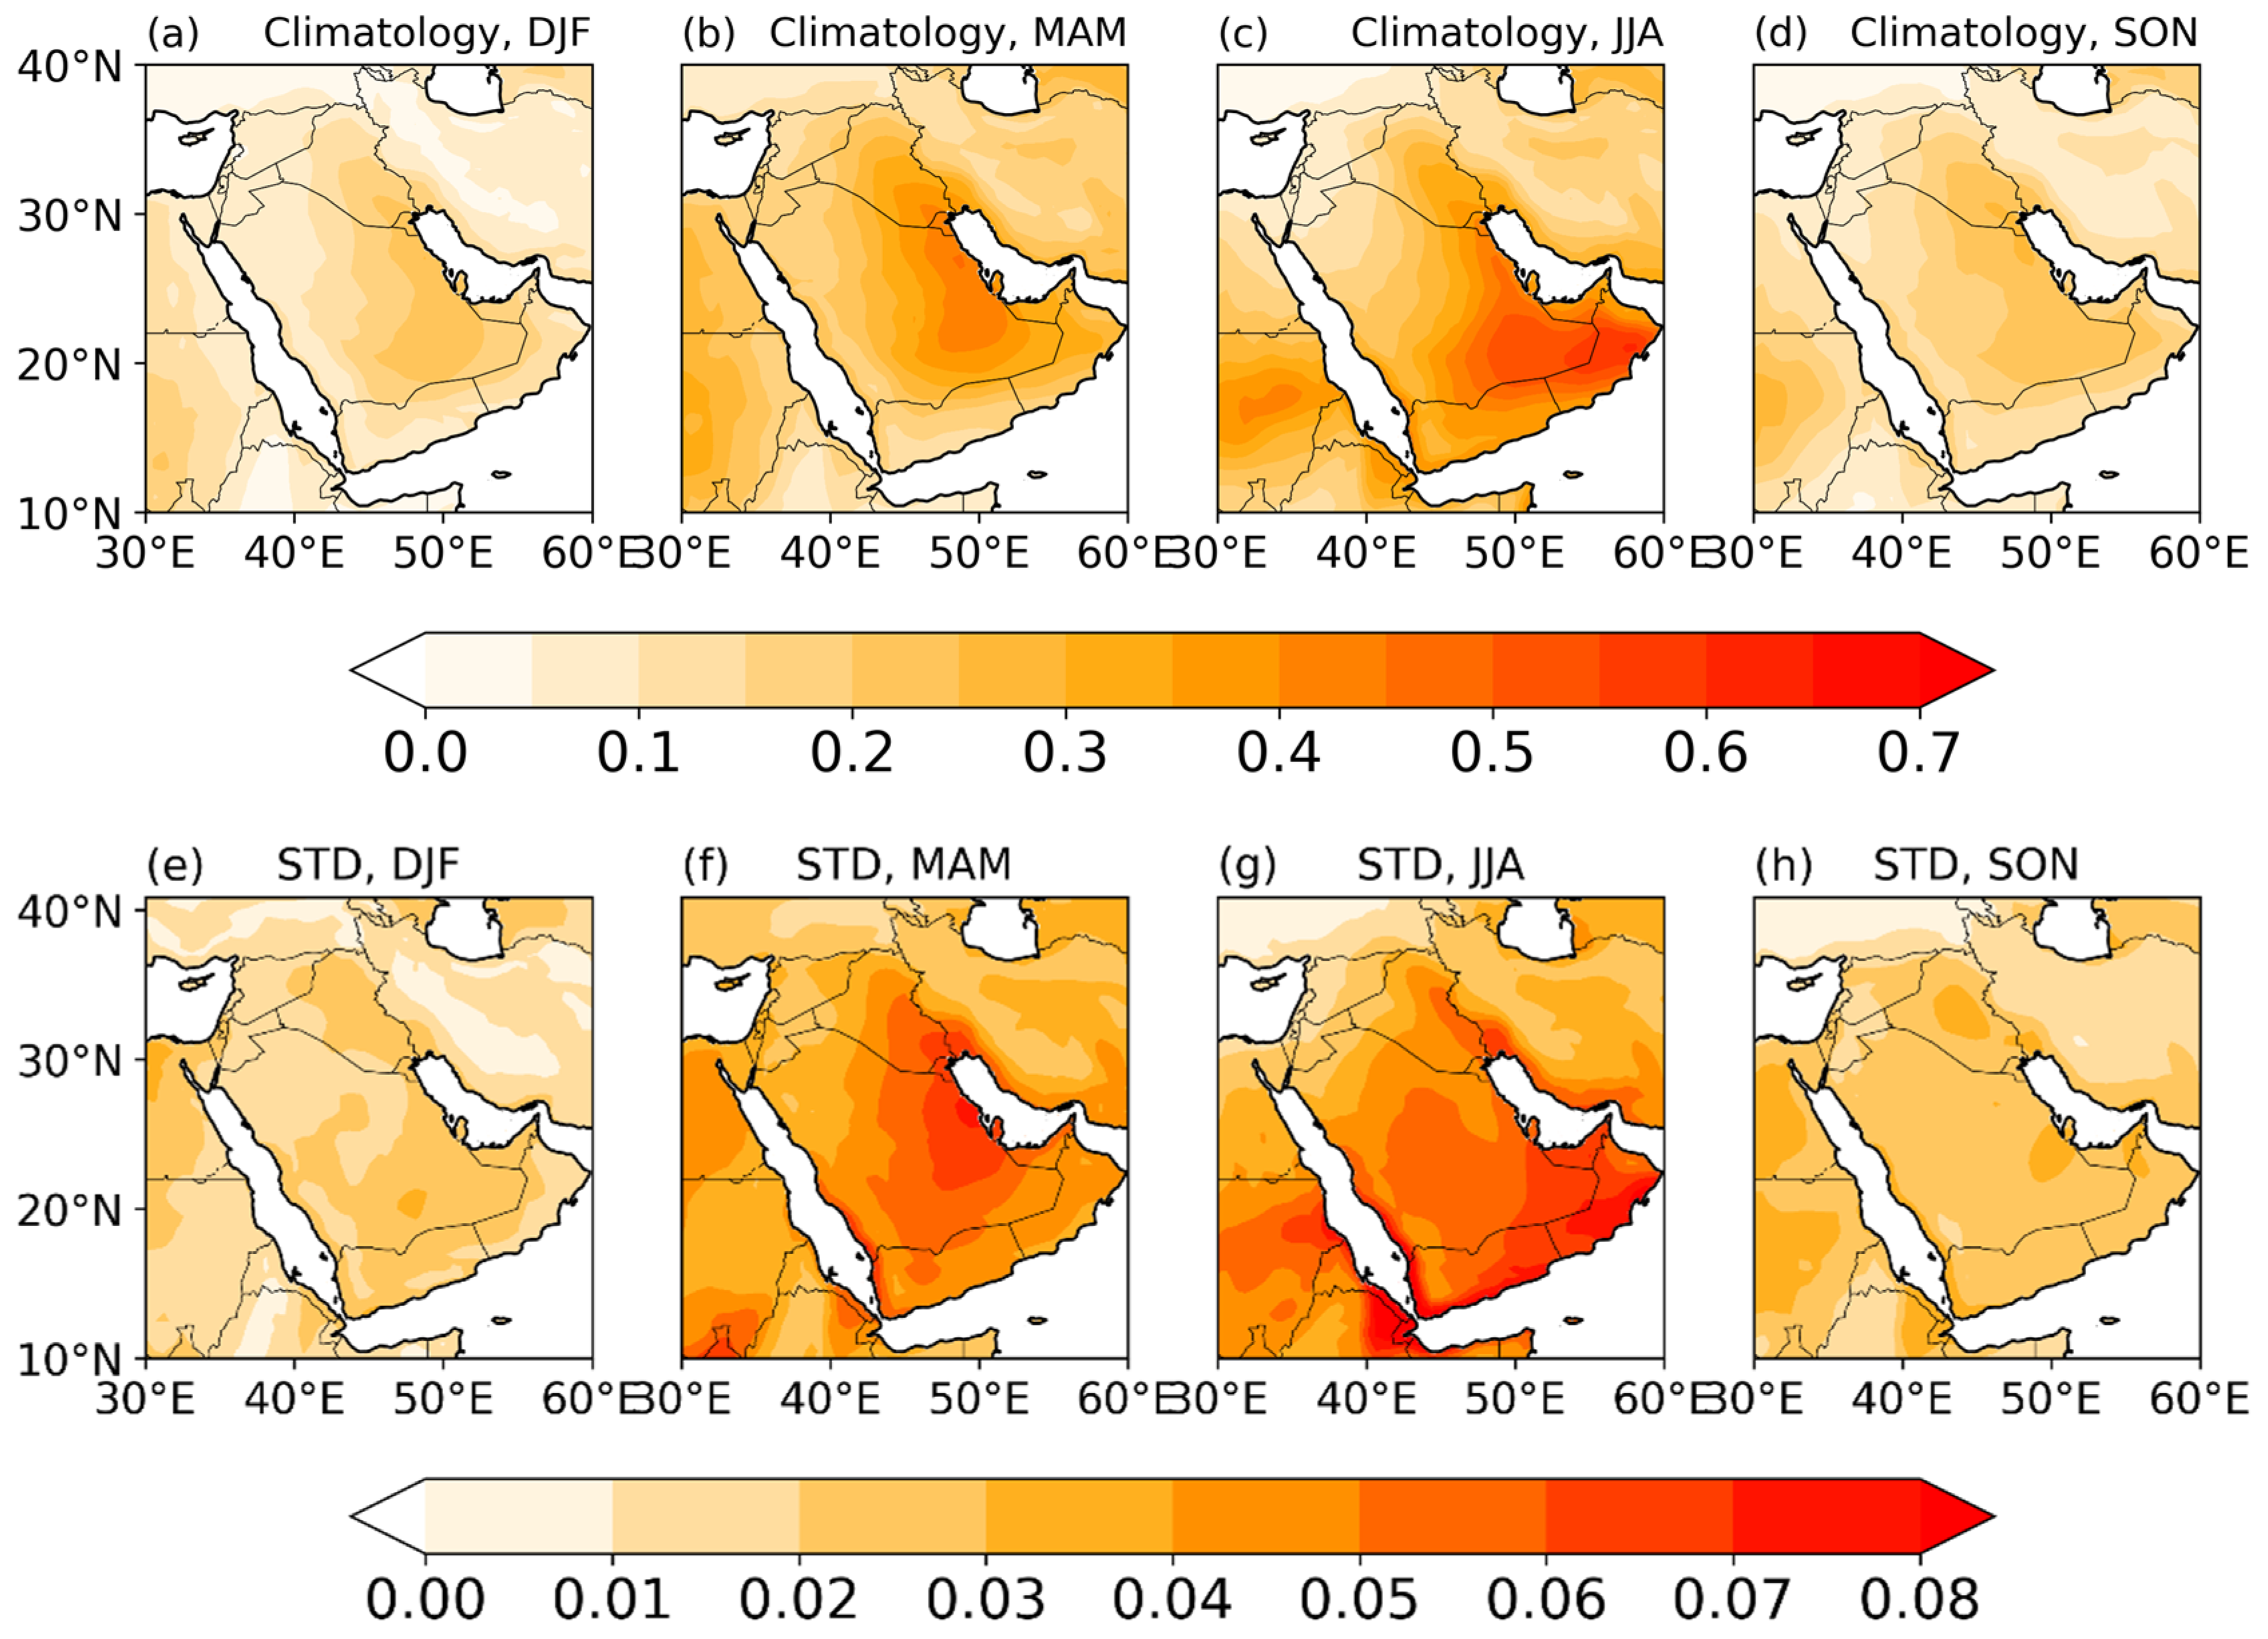
Figure 2 shows the monthly distribution of the dust activity over the AP region, where each month’s distribution is based on 42 years. Each month’s box-and-whisker plot represents the median as the middle line, while the upper half of the box shows the 75th percentile, and the lower half represents the 25th percentile of the dust activity. The higher dust activity is noted during the March–August period (Figure 2). Figure 3a–d show the spatial seasonal mean DAOD, where the maximum dust activity is noted in boreal spring and summer seasons. During the spring season, the maximum of DAOD appears over the central and northeastern AP, particularly over densely populated regions of Saudi Arabia. In the summer season, this maximum shifts to the south and southeastern AP, especially over the Rub Al Khali and Oman regions.

Figure 2.
Monthly mean dust aerosol optical depth (DAOD) box-and-whisker plot over the Arabian Peninsula (AP) for the period 1981–2022. The rhomboids indicate the outliers.

Figure 3.
(a–d) Seasonal mean and (e–h) standard deviation (STD) of dust aerosol optical depth (DAOD) for the period 1981–2022.
The spatial seasonal variability patterns are represented through the standard deviation (STD) estimated at each grid point, as shown in Figure 3e–h. Large DAOD spatial variability appears during the boreal spring season (Figure 3f) over the central and northeastern AP regions, compared to the other seasons. This higher variability in the spring season (Figure 3f) also coincides well with the mean pattern (Figure 3b).
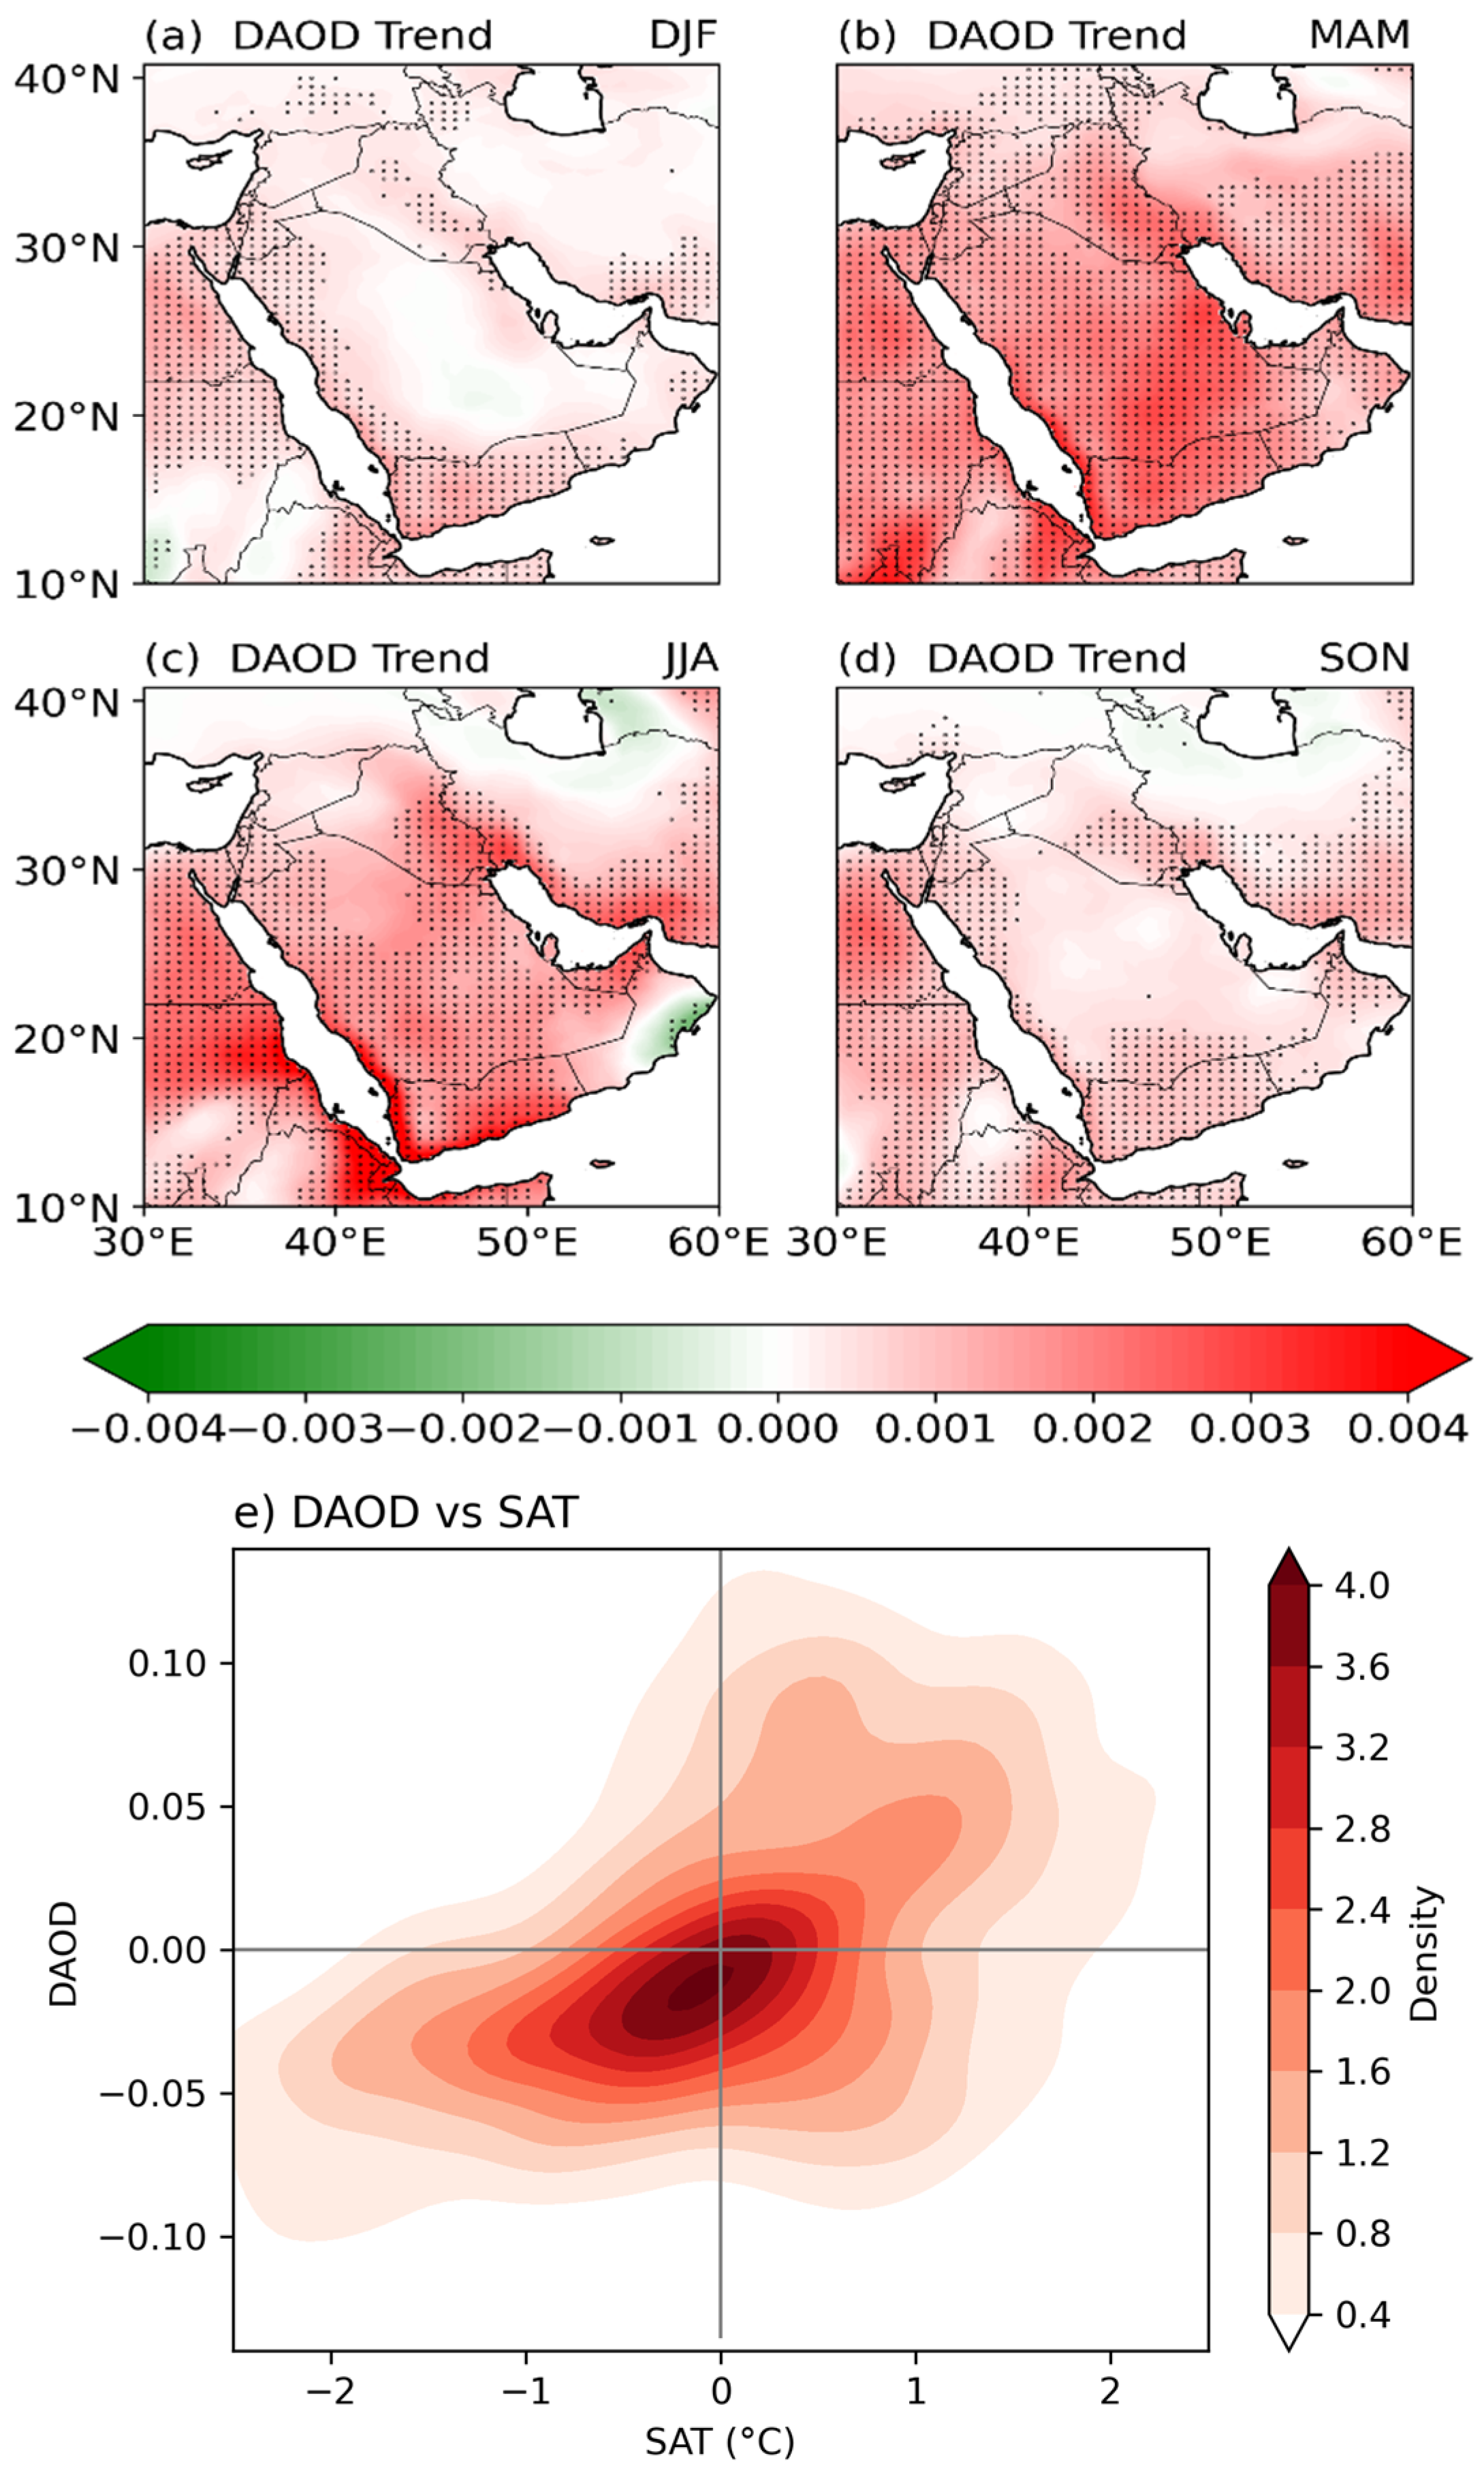
Further, the seasonal trends of the DAOD over the AP region are estimated using the Sen’s slope (SS) shown in Figure 4a–d for the period 1981–2022 [48,65,66,67]. Stippling indicates the statistical significance of the trends on each grid estimated through the m-MK test. The increasing trends in dust activity are evident during the spring season (Figure 4b) all over AP, with a prominent signal over the central and northeastern regions compared to the other seasons. Moreover, in boreal summer (JJA), increasing trends in dust activity are also noted over Saudi Arabia, while decreasingly significant trends are noted along the south coast of Oman (Figure 4c). It is pertinent to mention that not many trends are noted during the boreal winter and autumn seasons. The increasing dust trends during boreal spring over central and northeastern AP are consistent with the large mean (Figure 3b) and variability in spring seasons (Figure 3f). We noted the positive relationship between the DAOD and the SAT with correlation (CC = 0.54, statistically significant at 95% confidence level). The positive relationship shows higher temperatures may correspond to more dust activity, and this could possibly be the increase in dust activity during the spring season over AP [68].
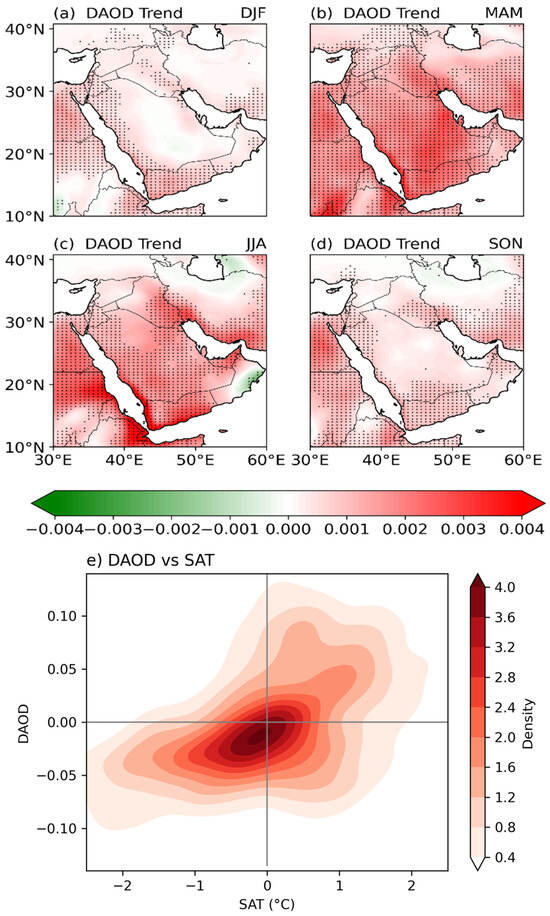
Figure 4.
(a–d) Seasonal mean trend using MK trend for (a) winter (DJF), spring (MAM), summer (JJA), and autumn (SON) of DAOD and (e) kernel density (2d) plot for DAOD and SAT over the domain (42–55° E; 20–32° N) during the spring season for the period 1981–2022.
To further understand, we estimated the 2d kernel density plots between the SAT and the DAOD over the central and eastern AP regions, as shown in Figure 4e. The PDF is constructed based on a total of 14 × 13 × 42 = 7644 data points. On the x-axis, the SAT distribution over the given domain is shown, while the y-axis represents the DAOD distribution. Figure 4e shows the higher temperature may favor more dust activity over the central and northeastern AP regions. Therefore, the recent warming has contributed to the increase in the DAOD during the spring season over AP. The mean, variability, and trend analyses show that boreal spring is one of the main seasons for significant dust (DAOD) activity in the AP region. Therefore, in the rest of the manuscript, we focused only on understanding the boreal spring seasonal dust (DAOD) activity variability.
3.2. DAOD Interannual Variability and Its ENSO Teleconnections over AP during Spring Season
We utilized the EOF method to analyze the DAOD variability over the AP during the spring season. The first EOF (EOF1) explains the maximum variability over the region (Figure 5a). EOF1 of DAOD over AP accounts for 67% of the total variance, indicating that EOF1 captures the most significant mode of DAOD variability over the central and northeastern regions, where the maximum variability signal is noted during the spring season, as shown in Figure 5a. The EOF1 is consistent with the dust mean and the variability spatial pattern noted in Figure 3b and Figure 3f, respectively. The temporal variability of EOF1 is shown as the first principal component (PC1) (Figure 5b, red line). To further analyze the dust variability in the central and northeastern AP, where the maximum variability is noted, we defined the DAOD index over the domain (42–55° E; 20–32° N). This index is useful for capturing the prominent dust variability over central and northeastern AP [9,56,69], and the index over this region is hereafter referred to as the DAOD index (DAODI). The correlation coefficient (CC) between PC1 (associated with EOF1) and DAODI is 0.95. This shows that the DAODI is closely related to the PC1 and can be used as a proxy for the PC1 over the region. In order to investigate the ENSO response to the DAOD over AP, the temporal evolution of DAODI and ENSO is analyzed (Figure 5c). The CC between DAODI and ENSO is −0.32 (significant at a 95% confidence level). This negative relationship suggests that the cold phase of ENSO (i.e., La Niña) increases DAODI anomalies over the region, while the opposite may happen during the warm phase of ENSO (i.e., El Niño). Furthermore, the regression of global SST onto the DAODI reveals a significant negative association, particularly over the central and eastern equatorial Pacific regions (Figure 5d). However, DAOD teleconnection is also noted over the Atlantic and northern Arabian Seas. However, in this study, we only focused on ENSO teleconnections, which are the dominant source of global climate variability and predictability [70,71].
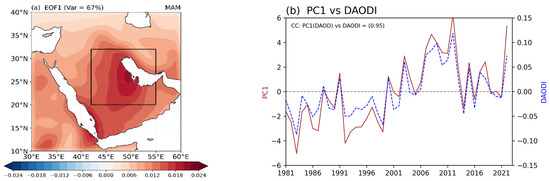
Figure 5.
(a) Leading mode of EOF of seasonal DAOD, (b) PC1 associated with leading (first) EOF of spring season DAOD (red line) and DAOD index (DAODI, highlighted as box in (a); black line) averaged over the domain (42–55° E; 20–32° N), (c) temporal evolution of Niño3.4 SST index (blue dashed line) and the DAODI (red line), and (d) Regression maps of global SST onto the standardized DAODI for the period 1981–2022. Stippling represents the statistical significance at a 95% confidence level.
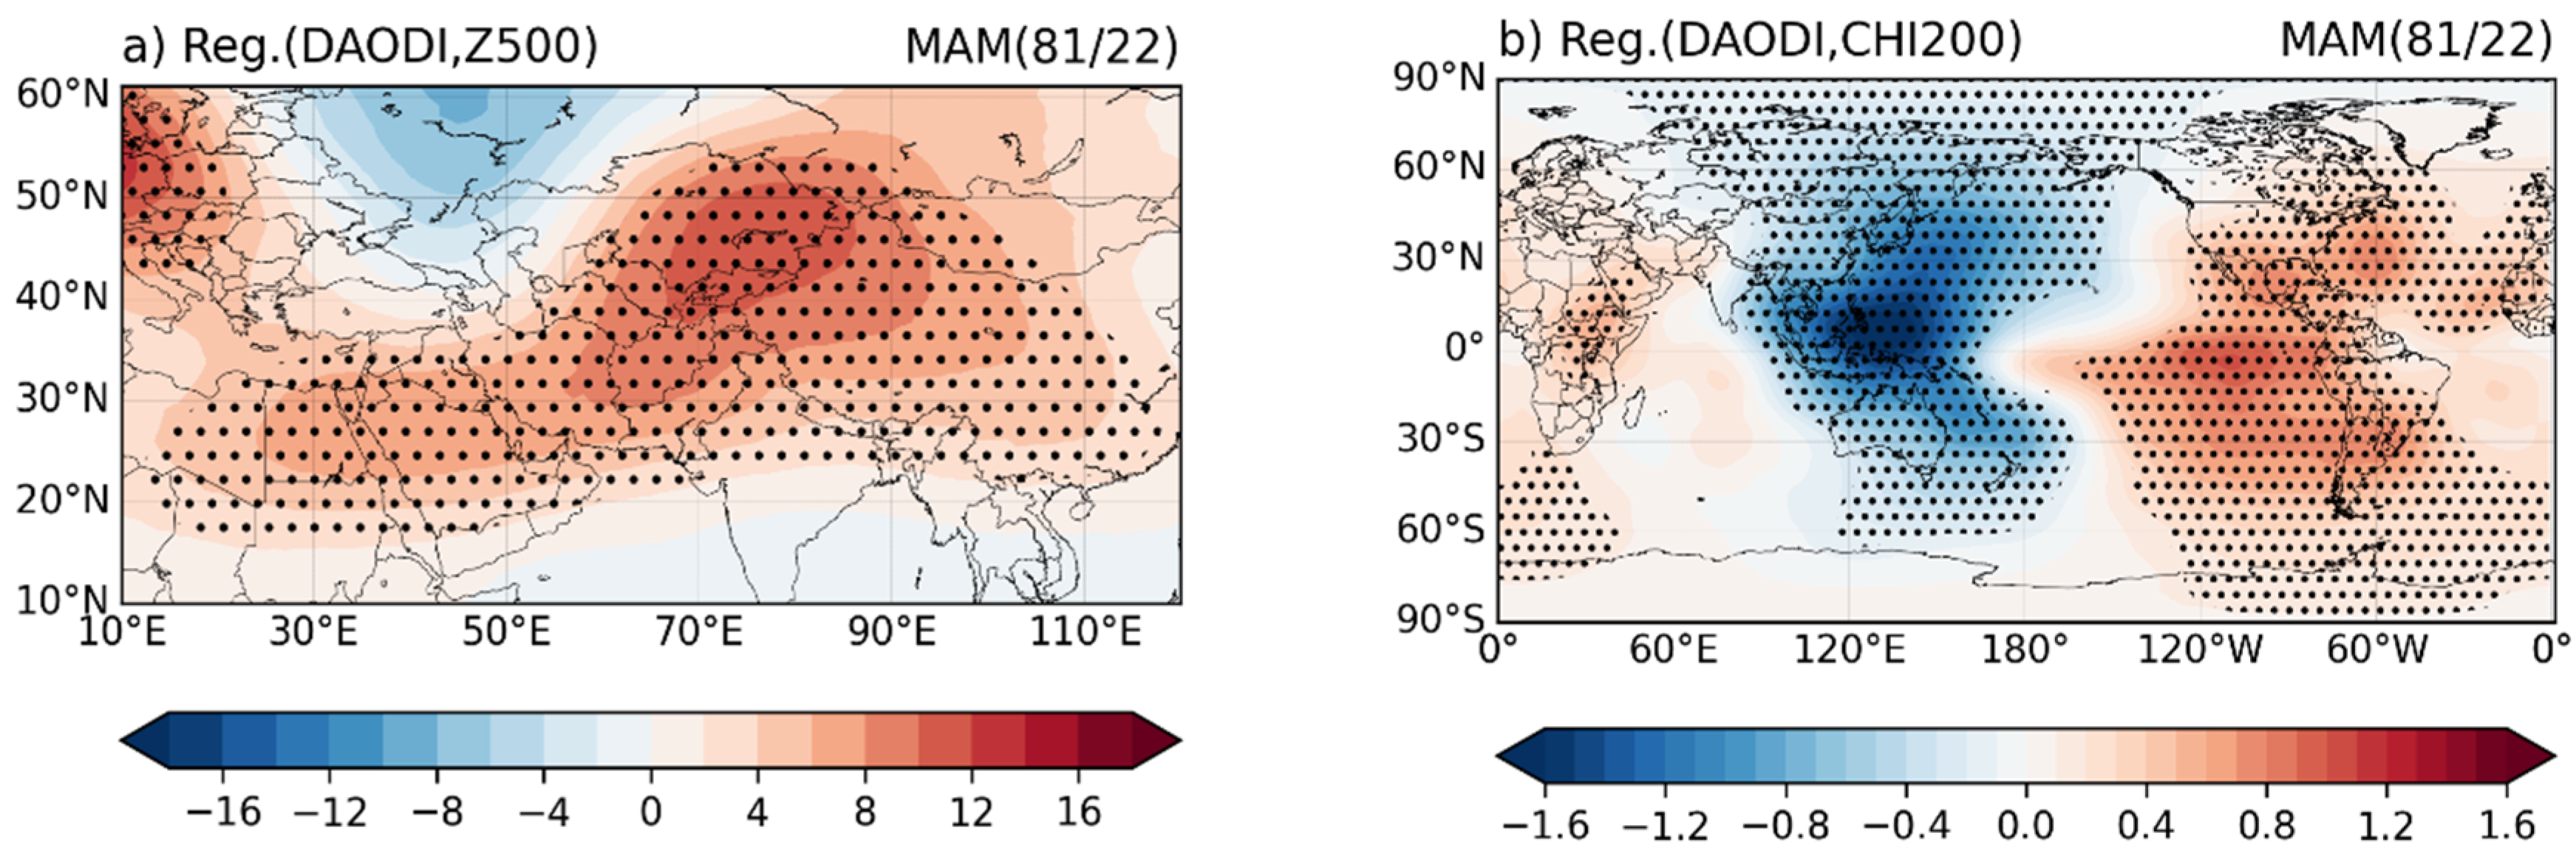
To analyze the DAODI-associated circulation anomalies, the middle tropospheric 500 hPa geopotential height anomalies are regressed onto the DAODI, as shown in Figure 6a. The DAODI-associated significant (stippling represents 95% confidence level) middle tropospheric positive geopotential height circulation anomalies are noted over the AP, further extended eastward towards the South and East Asia regions (Figure 6a). Further, the regression of 200 hPa velocity potential onto DAODI shows upper-level divergence over the western Pacific while convergence over the eastern Pacific region, suggesting a significant association of DAODI with the global Walker Circulation anomalies (Figure 6b). The strengthening of upper-level divergence anomalies over the western Pacific favors the mid-tropospheric positive geopotential height anomalies, as noted in Figure 6a, consistent with the findings of Kucharski and Abid [72]. To further enhance our understanding, we regressed the 500 hPa omega anomalies onto the DAODI, where positive anomalies appear, which show tropospheric warming and sinking motion (Figure 6c), resulting in a cloud-free atmosphere and more incoming solar radiation (Figure 6d), and negative surface pressure anomalies (Figure 6e), leading to warm and drier surface conditions over the AP region.
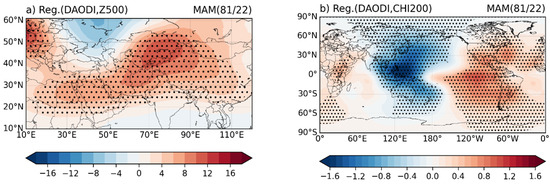
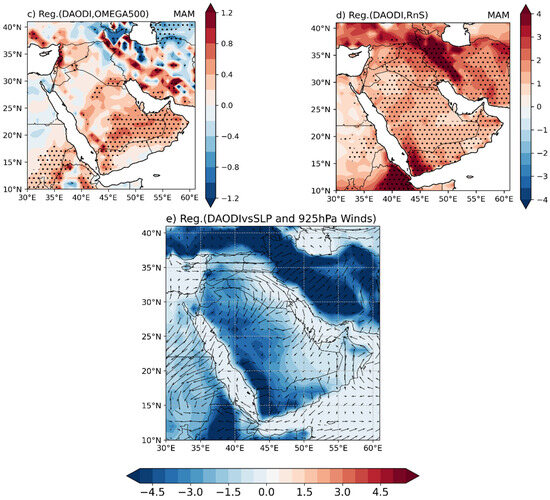
Figure 6.
Regression maps of (a) 500 hPa geopotential height anomalies, (b) 200 hPa velocity potential (units: 10+6 m2/s), (c) 500 hPa omega (units: hPa·s−1), (d) net shortwave radiation (units: W·m−2), (e) SLP (shaded) and 925 hPa winds (arrows) onto standardized DAODI during the spring season for the period 1981–2022. Stippling represents the statistical significance at a 95% confidence level.
The northeasterly (Figure 6e) winds through the Tigris and Euphrates River valleys, the alluvial plain in Iraq and Kuwait, as well as the desert of ad-Dahna (shown as red dots in Figure 1), carry the dust-laden particles that converge around the central parts of the AP and result in increased dust (DAOD) over the region [18,19,20].
In addition, to analyze the ENSO response to the circulation anomalies, the 500 hPa geopotential height anomalies are regressed onto the Niño3.4 SST index anomaly index, as shown in Figure 7a. The negative geopotential height anomalies that appear over AP show the southward shift of the sub-tropical jet that brings western disturbances over the region, causing rainfall in the positive phase of ENSO [9,10,12,17], which may favor less dust activity in the region. The 200 hPa velocity potential regression onto the ENSO shows the weakening of Walker Circulation (Figure 7b), opposite to that noted in Figure 6b.
Figure 7.
Regression maps of (a) 500 hPa geopotential height anomalies, (b) 200 hPa velocity potential (units: 10+6 m2/s), (c) 500 hPa omega (units: hPa·s−1), (d) net shortwave radiation (units: W·m−2), (e) SLP (shaded) and 925 hPa winds (arrows) onto standardized Niño3.4 SST index during the spring season for the period 1981–2022. Stippling represents the statistical significance at a 95% confidence level.
The convergence anomalies over the western Pacific during the warm ENSO phase (i.e., El Niño) favor the negative geopotential height anomalies (Figure 7a) through the Sverdrup balance [73], favoring the rising motion over the AP region (Figure 7c). Moreover, the surface cooling over the AP region (Figure 7d) and the moisture transport from the Arabian Sea (Figure 7e) may lead to more cloud formation over the AP region and, thus, precipitation [56,74,75]. These conditions are less conducive to the dust activity over AP in the warm ENSO phase, while the opposite may happen during the cold ENSO phase (i.e., La Niña). This may favor dry conditions and higher dust activity in the La Nina phase over AP in the spring season.
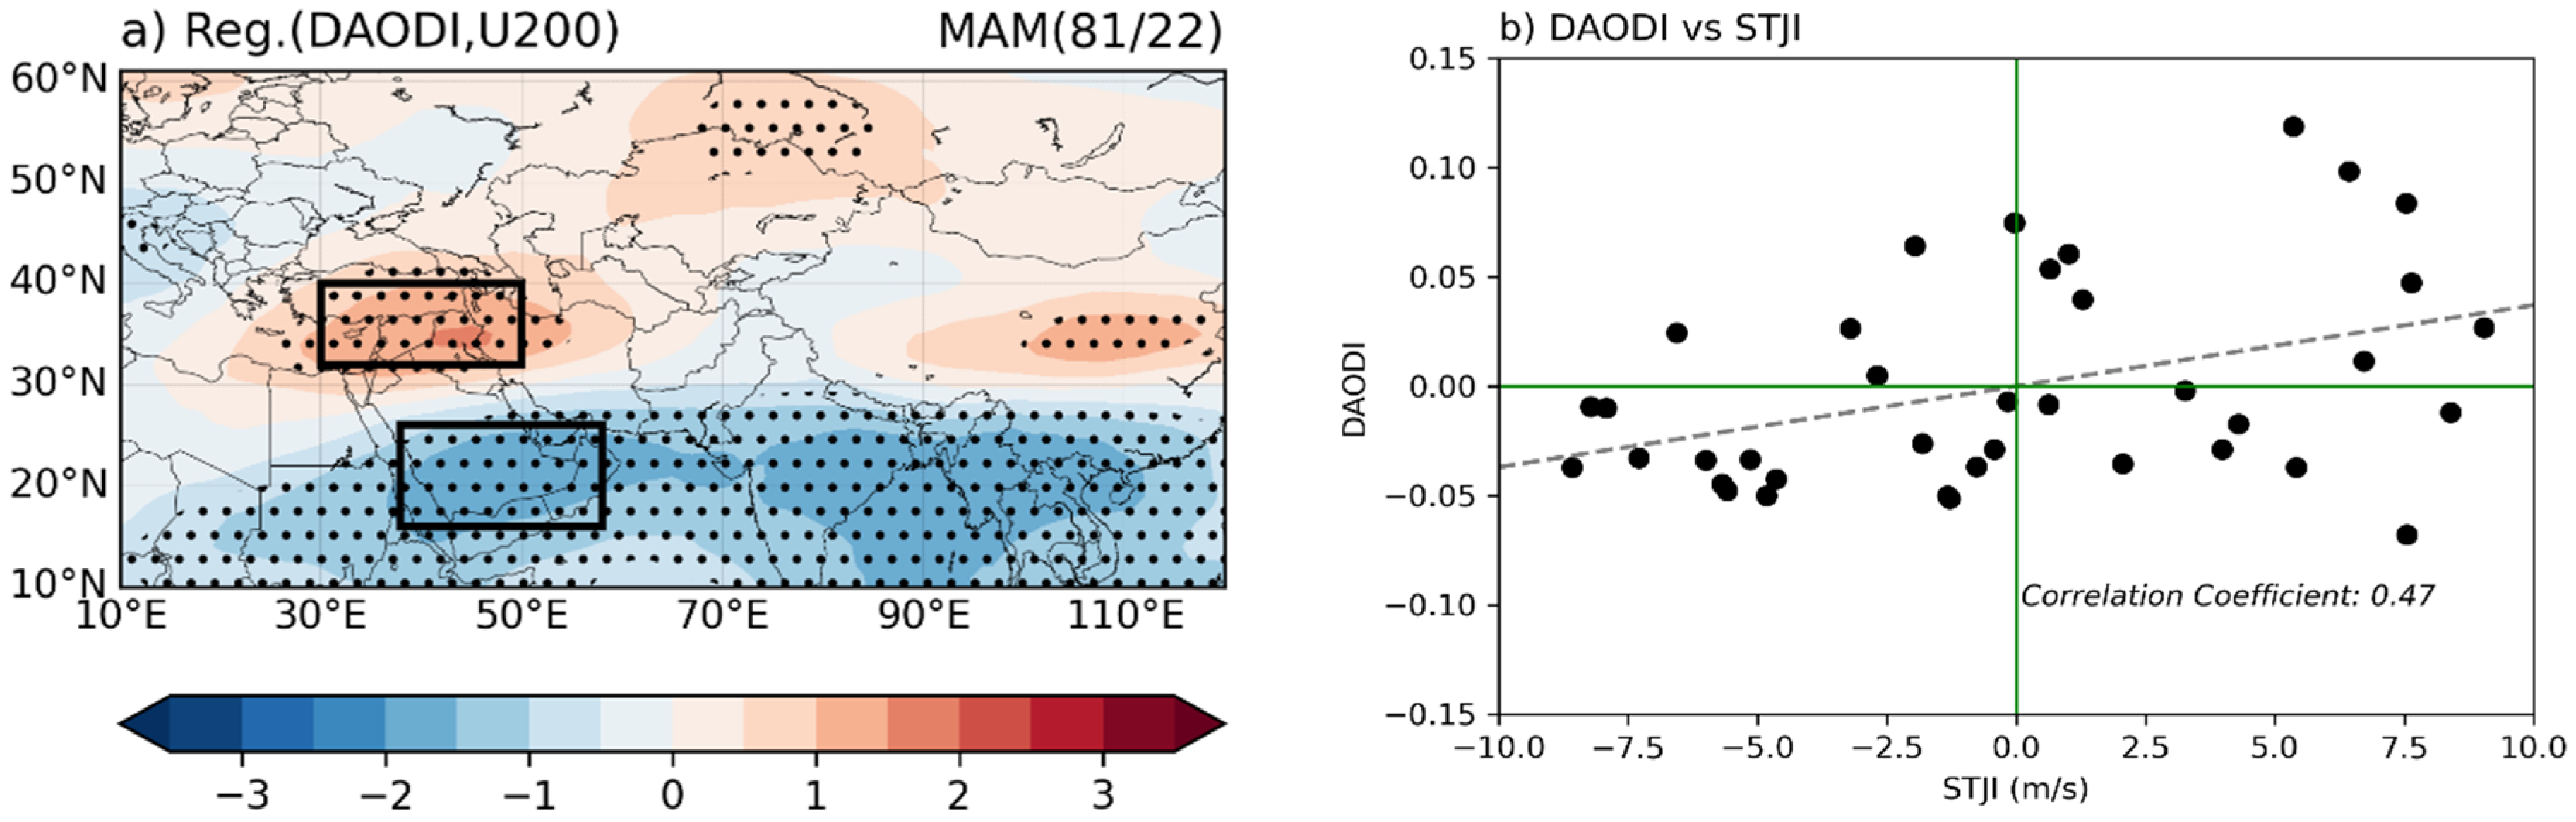
The increase in dust activity is related to the north–south dipole of the jet, where weakening is noted over the southern AP region while strengthening is noted to its north (Figure 8a). We defined the 200 hPa zonal wind (U, U200) based index, the difference between the north (30–50° E; 32–40° N) and south (38–48° E; 16–26° N) box over the AP region, to analyze the impact of the meridional shift of the subtropical jet (referred to as STJI) on the dust activity [76], as shown in Figure 8a. The scatter plot (Figure 8b) shows the positive relationship (CC = 0.47, significant at 95% confidence level) between STJI and DAODI. Figure 8b reveals that the negative jet (weakening) corresponds to low dust activity, while the opposite (strengthening) happens for the positive jet index.

Figure 8.
(a) Regression maps of 200 hPa zonal wind anomalies onto DAODI and (b) scatter plot between DAODI and subtropical jet index (STJI) for the period 1981–2022. The STJI is defined as the difference between the north (30–50° E; 32–40° N) and south (38–48° E; 16–26° N) boxes. Stippling represents the statistical significance at a 95% confidence level.
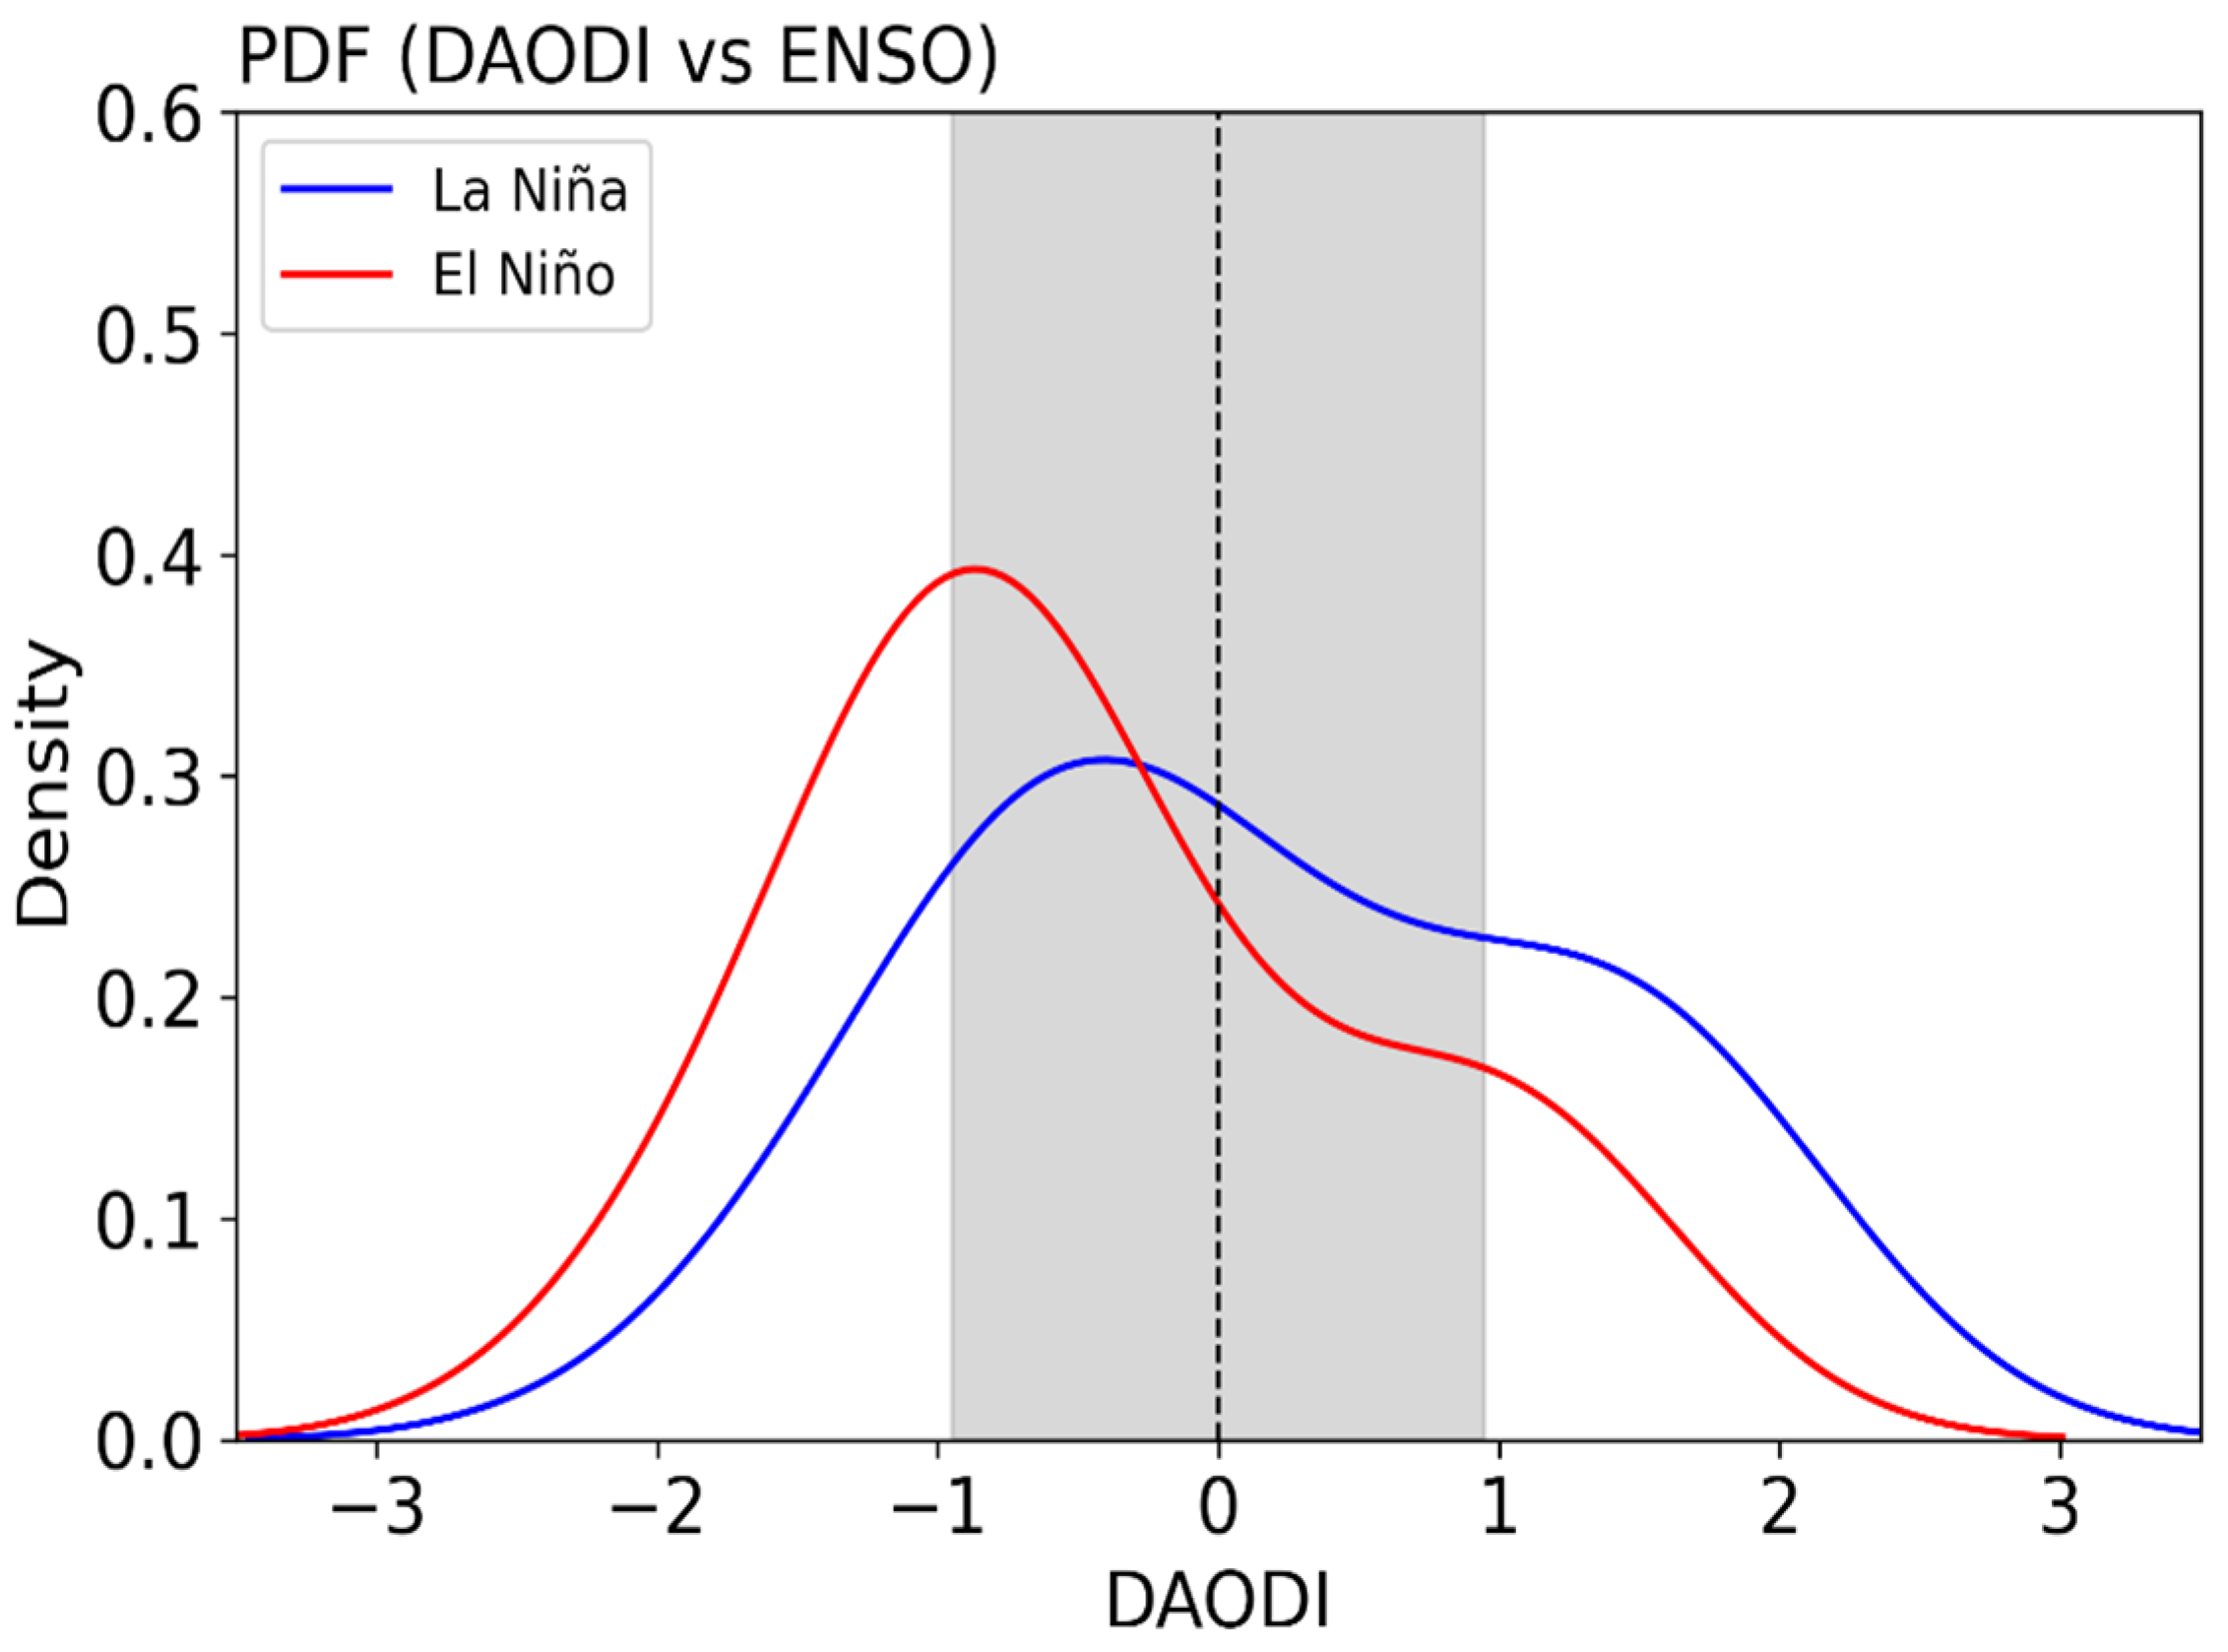
To understand the above hypothesis, we binned the DAODI against the Niño3.4 SST index. Out of the total 42 years, nine (9) DAODI years are noted during El Nino (i.e., Nino3.4 index ≥ +0.5 °C) and ten (10) during La Nina (i.e., Nino3.4 index ≤ −0.5 °C). Figure 9 shows a PDF for El Niño and La Niña years (see Section 2 for details), suggesting that more frequent and higher dust activity over the region may occur during La Niña (about 25% probability) compared to El Niño years, where less dust activity peaks with 40% probability. This is consistent with Figure 4 and Figure 7, where a negative relationship between ENSO and dust activity is noted over AP.

Figure 9.
Probability distribution function (PDF) of DAODI during El Niño and La Niña for the period 1981–2022. Shading indicates the ±1-sigma standard deviation of DAOD.
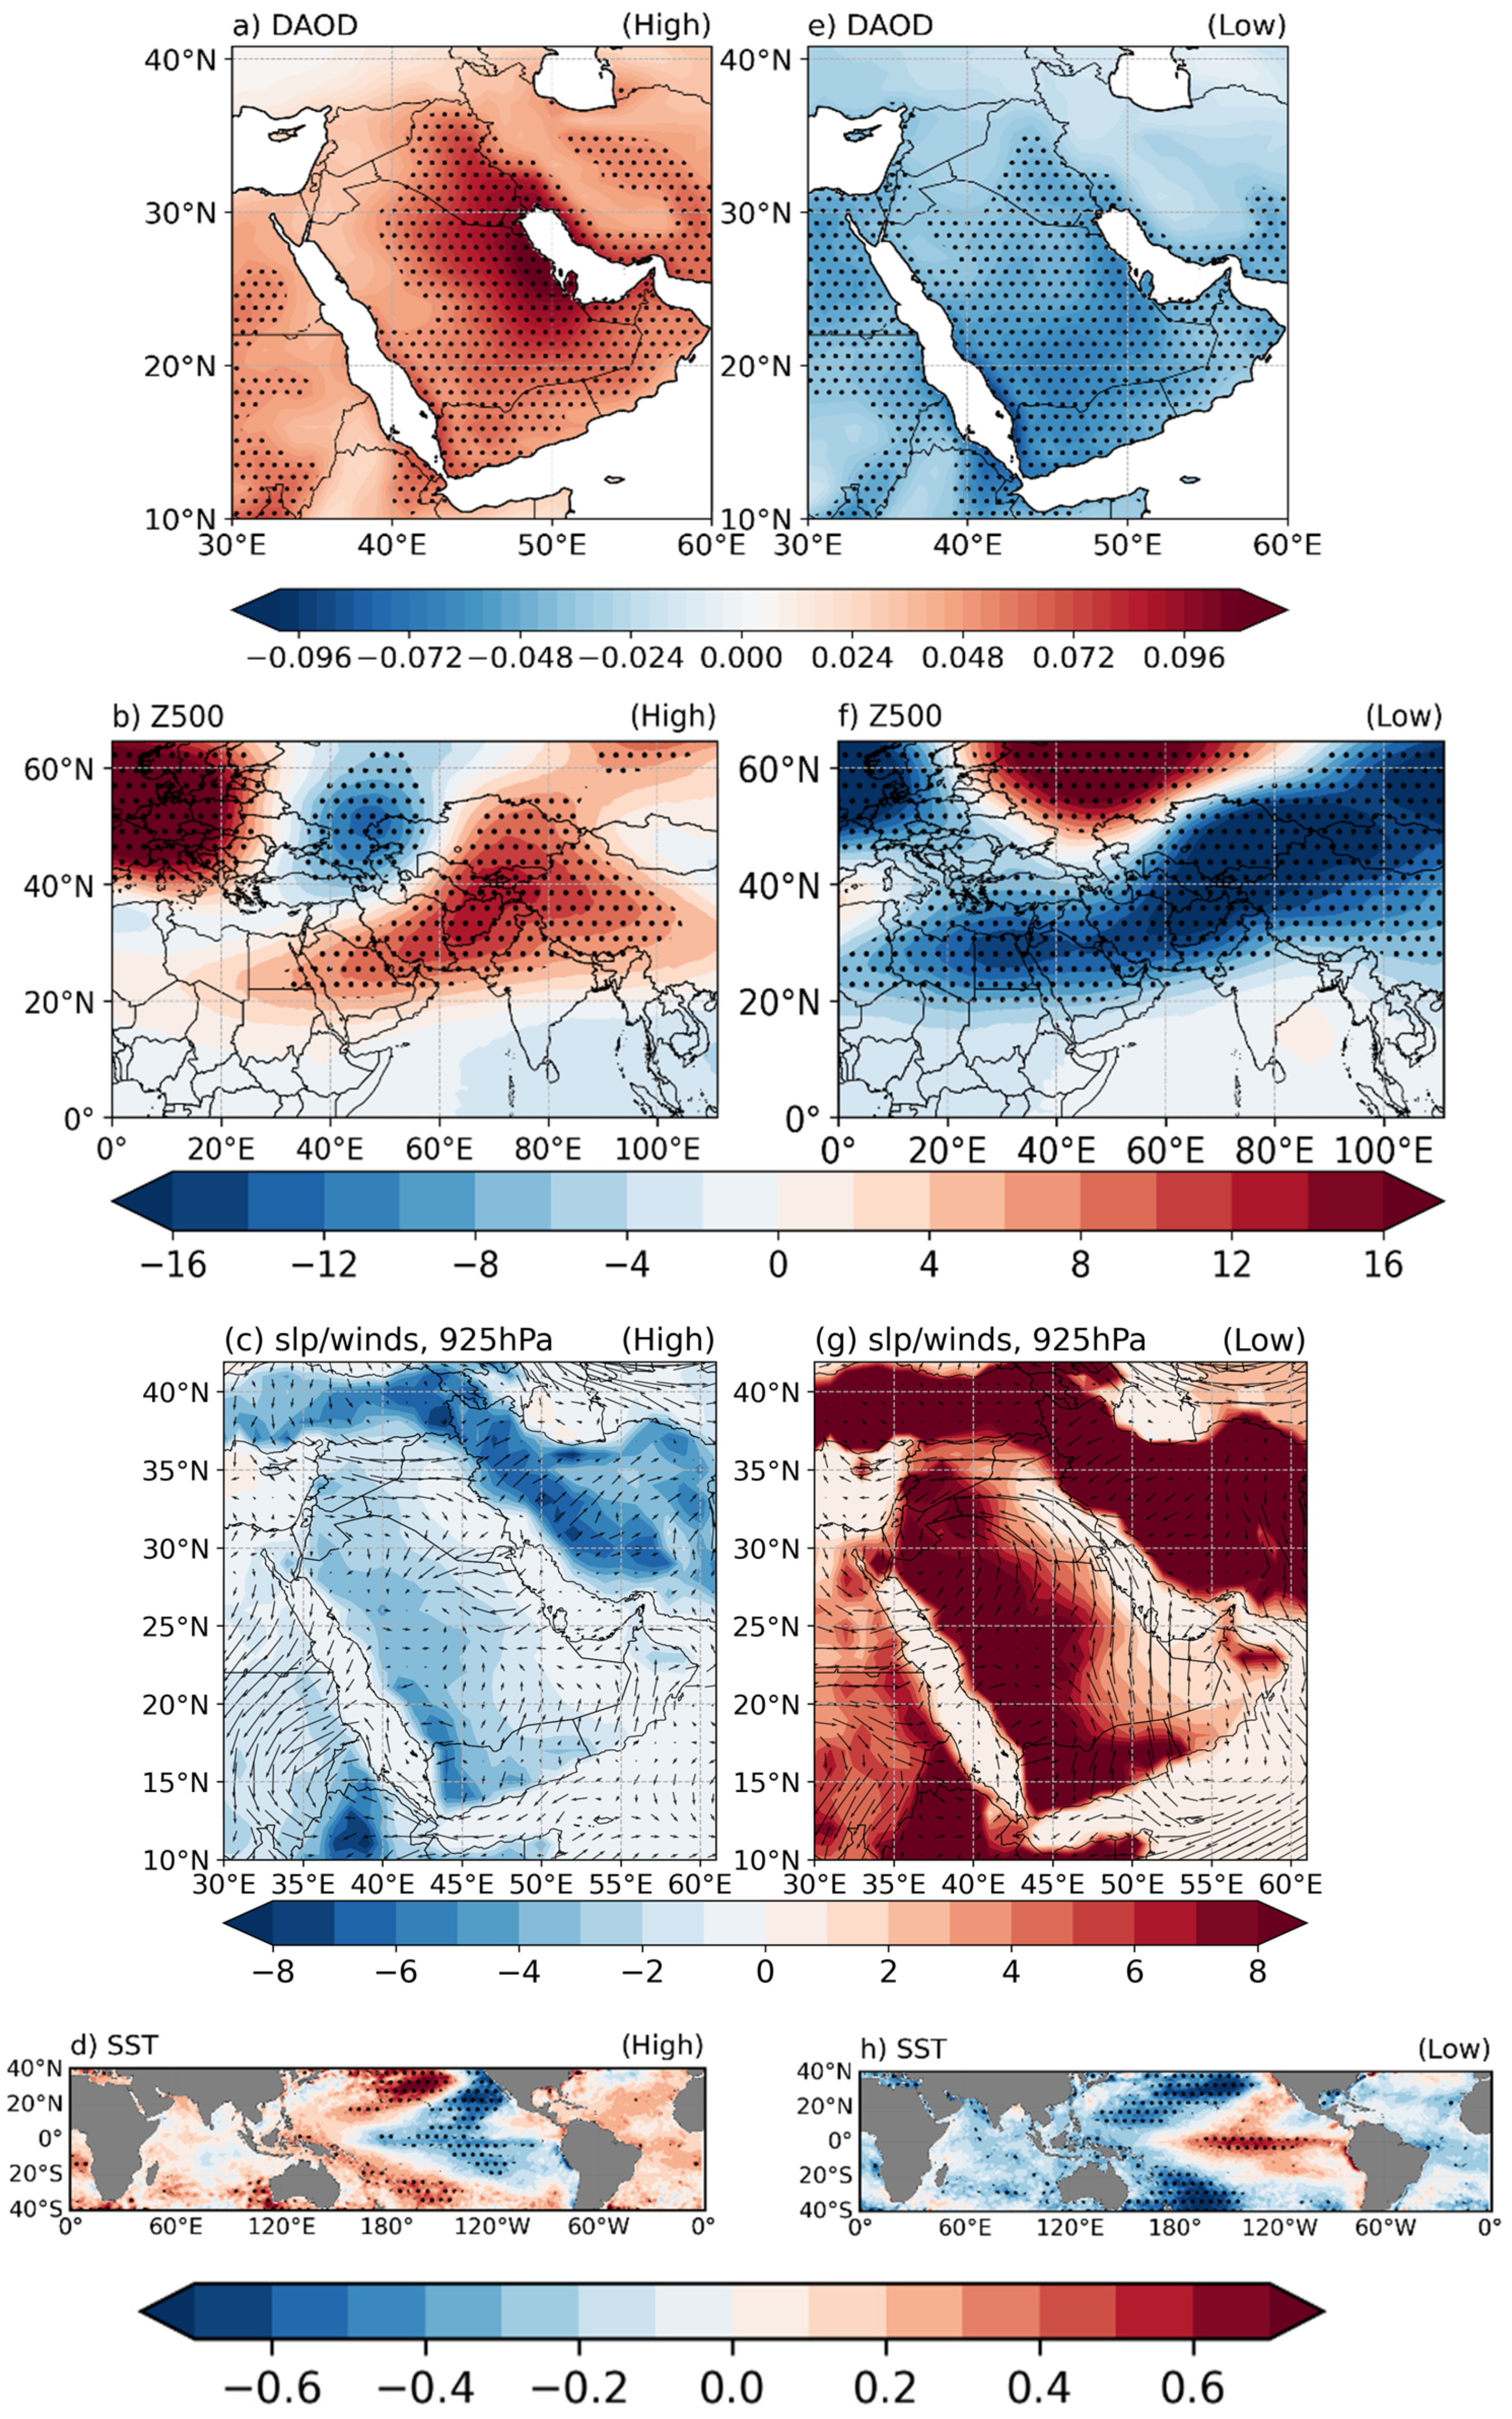
We also analyzed the spatial distribution of middle tropospheric and surface circulation composite anomalies based on the ±1-sigma STD threshold of the DAOD index. The values with ≥1-sigma STD are referred to as high, and the values with ≤1-sigma STD are referred to as low DAOD (see Section 2 for details).
The high DAOD over the region corresponds to the above-normal DAOD over the AP region (Figure 10a). The high DAOD is associated with positive 500 hPa geopotential height anomalies (Figure 10b) and surface lows (Figure 10c), which corresponds well with the significant negative SST anomalies over the central and eastern Pacific region known as La Niña (Figure 10d) conditions, while the opposite is noted for the lower DAOD composites (Figure 10e–h). This is consistent with the findings noted in Figure 5, Figure 7, Figure 8 and Figure 9.
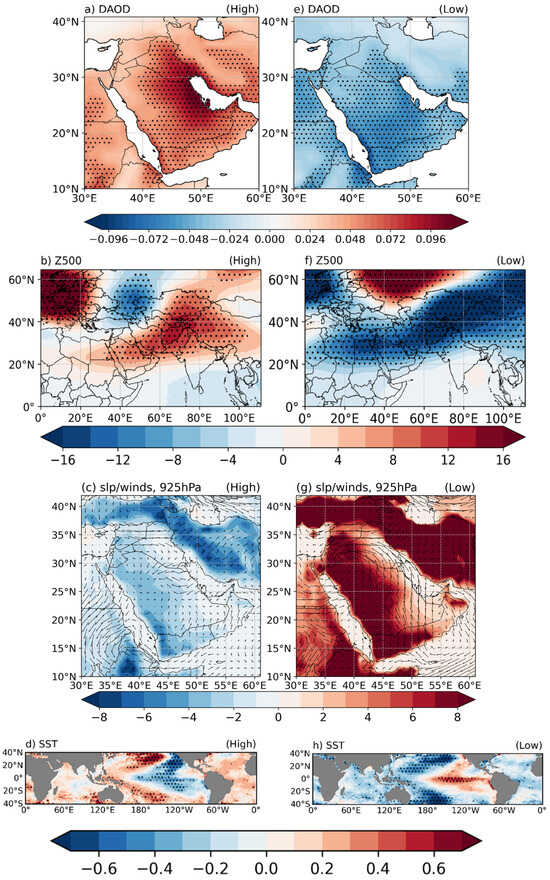
Figure 10.
High and low DAOD composites for (a,e) DAOD, (b,f) 500 hPa geopotential height (Z500) anomalies (units: m), (c,g) SLP (units: hPa) and 925 hPa wind vectors (units: m/s), and (d,h) SST (units: °C) during the spring season for the period 1981–2022. Stippling represents the statistical significance at a 95% confidence level. The DAOD index ≥1-sigma corresponds to high and ≤1-sigma to low DAOD.
4. Conclusions
This study focuses on the spring seasonal interannual variability of DAOD and its relationship with ENSO. The maximum DAOD is observed during the boreal spring (March–May; MAM) season, particularly over central and northeastern AP, while in summer, it shifts to western and southwestern parts of the Peninsula. We also noted the significantly increasing trends in dust activity in the spring season, which are higher than in other seasons. This increasing trend in the dust is related to the recent warming over the AP region during the spring season, which is consistent with the positive relationship (CC = 0.54) noted between DAOD and SAT. The large mean, variability, and increasing trends of dust in the spring season compared to the other seasons are the main reasons to focus our analysis on the spring season.
The first EOF (EOF1) accounts for 67% of the total variance of DAOD during the spring season, which is prominently noted over central and northeastern AP and coincides well with the regional mean and variability patterns. This shows most of the dust activity mainly happens over the central and northeastern AP region during the spring season. We further defined an index over the region where maximum DAOD variability is noted over the domain (42–55° E; 20–32° N) and referred to it as the DAOD index (DAODI). This DAODI is correlated strongly (0.95) with PC1 (associated with EOF1), making it a useful proxy for PC1. The result further indicates the DAODI over the AP is significantly associated with ENSO anomalies. The negative relationship (CC = −0.32, significant at 95% confidence level) is noted between ENSO and DAOD. It shows that the negative ENSO phase (La Nina) favors the mid-tropospheric positive geopotential height anomalies, leading to upper–middle tropospheric warming and sinking motion, a cloud-free atmosphere, and drier surface conditions through the strengthening of the Walker Circulation, while the opposite happens in the warm ENSO phase. The resulting drier surface conditions and associated surface low-pressure anomalies favor cyclonic circulation and northeasterly winds, which carry dust-laden particles from the Tigris and Euphrates River valleys, the alluvial plain in Iraq and Kuwait, as well as the desert of ad-Dahna (shown as red dots in Figure 1), favoring more dust activity during the La Nina phase. The higher DAOD composites confirm that La Niña corresponds to an increase in the dust concentration, while El Niño corresponds to less dust concentration over the region. Furthermore, the northward (southward) shift of the subtropical jet index (STJI) during La Niña (El Niño) can favor more (less) dust activity and can be a reasonable precursor to forecasting the dust activity over the AP region. Several studies have discussed the ENSO influence on regional and global dust variability, where they discussed the influence of the modification in Walker Circulation on dust variability [42,43]. However, in this study, we focused on AP dust variability during the spring season and have shown that ENSO also modifies the net surface radiation in the AP region, which plays a major role in modifying the local climatic conditions favorable for the higher dust activity in its negative phase (La Niña), while the opposite may happen in the positive phase of ENSO (El Niño). Therefore, both local and remote forcing co-occurrences are important for the dust activity in the AP region during the boreal spring season.
This study provides valuable insights into the complex interactions between ENSO, atmospheric dynamics, and DAOD variability over the Arabian Peninsula, which have not been addressed in the past. The findings of this study reveal that ENSO, being the dominant mode of variability, provides a window of opportunity for a better understanding of dust variability during the spring season, which may have strong impacts on visibility, health, agriculture, and socioeconomic activities in the region.
Author Contributions
Conceptualization, Y.A. and G.A.; methodology, Y.A.; software, G.A.; validation, Y.A. and G.A.; formal analysis, G.A.; investigation, Y.A.; resources, Y.A.; data curation, G.A.; writing—original draft preparation, Y.A.; writing—review and editing, G.A.; visualization, G.A.; supervision, Y.A.; project administration, Y.A. All authors have read and agreed to the published version of the manuscript.
Funding
This research received no external funding.
Institutional Review Board Statement
Not applicable.
Informed Consent Statement
Not applicable.
Data Availability Statement
The dust aerosol optical depth (DAOD) was obtained from (https://giovanni.gsfc.nasa.gov/giovanni, accessed on 10 September 2023), while the European Reanalysis (ERA5) was obtained from (https://cds.climate.copernicus.eu, accessed on 10 September 2023).
Acknowledgments
The authors would like to thank the Global Modeling and Assimilation Office (GMAO) for the MERRA reanalysis and Giovanni for the dissemination of MERRA-2 data. The authors also owe their sincere thanks to ECMWF and the Climate Data Store (CDS) for providing the ERA5 data. The author acknowledges the Centre of Excellence for Climate Change Research (CECCR) and the Deanship of Graduate Studies (DGS) for supporting this work.
Conflicts of Interest
The authors declare no conflicts of interest.
References
- Edgell, H.S. Arabian Deserts: Nature, Origin, and Evolution; Springer: Berlin/Heidelberg, Germany, 2006; ISBN 1402039697. [Google Scholar]
- Goudie, A.S. Desert Dust and Human Health Disorders. Environ. Int. 2014, 63, 101–113. [Google Scholar] [CrossRef]
- Alsubhi, Y.; Qureshi, S.; Assiri, M.E.; Siddiqui, M.H. Quantifying the Impact of Dust Sources on Urban Physical Growth and Vegetation Status: A Case Study of Saudi Arabia. Remote Sens. 2022, 14, 5701. [Google Scholar] [CrossRef]
- Al-Abbasi, K.A.; Labban, A.H.; Awad, A.M. Synoptic Characteristics of the Spatial Variability of Spring Dust Storms over Saudi Arabia. Atmosfera 2023, 37, 401–424. [Google Scholar] [CrossRef]
- Awad, A.M.; Mashat, A.W.S. Synoptic Characteristics of Spring Dust Days over Northern Saudi Arabia. Air Qual. Atmos. Health 2016, 9, 41–50. [Google Scholar] [CrossRef]
- Mashat, A.-W.S.; Awad, A.M.; Assiri, M.E.; Labban, A.H. Dynamic and Synoptic Study of Spring Dust Storms over Northern Saudi Arabia. Theor. Appl. Climatol. 2020, 140, 619–634. [Google Scholar] [CrossRef]
- Rayner, N.A.; Parker, D.E.; Horton, E.B.; Folland, C.K.; Alexander, L.V.; Rowell, D.P.; Kent, E.C.; Kaplan, A. Global Analyses of SST, Sea Ice and Night Marine Air Temperature since the Late 19th Century. J. Geophys. Res. 2003, 108, 4407. [Google Scholar] [CrossRef]
- Trenberth, K.E.; Caron, J.M.; Stepaniak, D.P.; Worley, S. Evolution of El Niño–Southern Oscillation and Global Atmospheric Surface Temperatures. J. Geophys. Res. Atmos. 2002, 107, AAC-5. [Google Scholar] [CrossRef]
- Abid, M.A.; Kucharski, F.; Almazroui, M.; Kang, I.S. Interannual Rainfall Variability and ECMWF-Sys4-Based Predictability over the Arabian Peninsula Winter Monsoon Region. Q. J. R. Meteorol. Soc. 2016, 142, 233–242. [Google Scholar] [CrossRef]
- Almazroui, M.; Khalid, S.; Kamil, S.; Ismail, M.; Islam, M.N.; Saeed, S.; Abid, M.A.; Ehsan, M.A.; Hantoush, A.S. Skill Assessment of Saudi-KAU and C3S Models in Prediction of Spring Season Rainfall over the Arabian Peninsula. Atmos. Res. 2022, 280, 106461. [Google Scholar] [CrossRef]
- Attada, R.; Dasari, H.P.; Chowdary, J.S.; Yadav, R.K.; Knio, O.; Hoteit, I. Surface Air Temperature Variability over the Arabian Peninsula and Its Links to Circulation Patterns. Int. J. Climatol. 2019, 39, 445–464. [Google Scholar] [CrossRef]
- Kang, I.S.; Rashid, I.U.; Kucharski, F.; Almazroui, M.; Alkhalaf, A.K. Multidecadal Changes in the Relationship between ENSO and Wet-Season Precipitation in the Arabian Peninsula. J. Clim. 2015, 28, 4743–4752. [Google Scholar] [CrossRef]
- Ehsan, M.A.; Kucharski, F.; Almazroui, M.; Ismail, M.; Tippett, M.K. Potential Predictability of Arabian Peninsula Summer Surface Air Temperature in the North American Multimodel Ensemble. Clim. Dyn. 2019, 53, 4249–4266. [Google Scholar] [CrossRef]
- Almazroui, M.; Abid, M.A.; Athar, H.; Islam, M.N.; Ehsan, M.A. Interannual Variability of Rainfall over the Arabian Peninsula Using the IPCC AR4 Global Climate Models. Int. J. Climatol. 2013, 33, 2328–2340. [Google Scholar] [CrossRef]
- Ehsan, M.A.; Tippett, M.K.; Almazroui, M.; Ismail, M.; Yousef, A.; Kucharski, F.; Omar, M.; Hussein, M.; Alkhalaf, A.A. Skill and Predictability in Multimodel Ensemble Forecasts for Northern Hemisphere Regions with Dominant Winter Precipitation. Clim. Dyn. 2017, 48, 3309–3324. [Google Scholar] [CrossRef]
- Dasari, H.P.; Langodan, S.; Viswanadhapalli, Y.; Vadlamudi, B.R.; Papadopoulos, V.P.; Hoteit, I. ENSO Influence on the Interannual Variability of the Red Sea Convergence Zone and Associated Rainfall. Int. J. Climatol. 2018, 38, 761–775. [Google Scholar] [CrossRef]
- Niranjan Kumar, K.; Ouarda, T. Precipitation Variability over UAE and Global SST Teleconnections. J. Geophys. Res. Atmos. 2014, 119, 10–313. [Google Scholar] [CrossRef]
- Ackerman, S.A.; Cox, S.K. Surface Weather Observations of Atmospheric Dust over the Southwest Summer Monsoon Region. Meteorol. Atmos. Phys. 1989, 41, 19–34. [Google Scholar] [CrossRef]
- Kutiel, H.; Furman, H. Dust Storms in the Middle East: Sources of Origin and Their Temporal Characteristics. Indoor Built Environ. 2003, 12, 419–426. [Google Scholar] [CrossRef]
- Notaro, M.; Alkolibi, F.; Fadda, E.; Bakhrjy, F. Trajectory Analysis of Saudi Arabian Dust Storms. J. Geophys. Res. Atmos. 2013, 118, 6028–6043. [Google Scholar] [CrossRef]
- Shao, Y. A Model for Mineral Dust Emission. J. Geophys. Res. 2001, 106, 20239–20254. [Google Scholar] [CrossRef]
- Shao, Y. Physics and Modelling of Wind Erosion; Springer: Berlin/Heidelberg, Germany, 2008; ISBN 2013206534. [Google Scholar]
- Labban, A.H.; Butt, M.J. Analysis of Sand and Dust Storm Events over Saudi Arabia in Relation with Meteorological Parameters and ENSO. Arab. J. Geosci. 2021, 14, 22. [Google Scholar] [CrossRef]
- Almazroui, M. Calibration of TRMM Rainfall Climatology over Saudi Arabia during 1998-2009. Atmos. Res. 2011, 99, 400–414. [Google Scholar] [CrossRef]
- Yu, Y.; Notaro, M.; Liu, Z.; Kalashnikova, O.; Alkolibi, F.; Fadda, E.; Bakhrjy, F. Assessing Temporal and Spatial Variations in Atmospheric Dust over Saudi Arabia through Satellite, Radiometric, and Station Data. J. Geophys. Res. Atmos. 2013, 118, 13253–13264. [Google Scholar] [CrossRef]
- Hannachi, A.; Awad, A.; Ammar, K. Climatology and Classification of Spring Saharan Cyclone Tracks. Clim. Dyn. 2011, 37, 473–491. [Google Scholar] [CrossRef]
- Israelevich, P.L.; Ganor, E.; Levin, Z.; Joseph, J.H. Annual Variations of Physical Properties of Desert Dust over Israel. J. Geophys. Res. Atmos. 2003, 108, 1–9. [Google Scholar] [CrossRef]
- Pozzer, A.; De Meij, A.; Yoon, J.; Tost, H.; Georgoulias, A.K.; Astitha, M. AOD Trends during 2001–2010 from Observations and Model Simulations. Atmos. Chem. Phys. 2015, 15, 5521–5535. [Google Scholar] [CrossRef]
- Kalenderski, S.; Stenchikov, G. High-Resolution Regional Modeling of Summertime Transport and Impact of African Dust over the Red Sea and Arabian Peninsula. J. Geophys. Res. Atmos. 2016, 121, 6435–6458. [Google Scholar] [CrossRef]
- Hsu, N.C.; Gautam, R.; Sayer, A.M.; Bettenhausen, C.; Li, C.; Jeong, M.J.; Tsay, S.C.; Holben, B.N. Global and Regional Trends of Aerosol Optical Depth over Land and Ocean Using SeaWiFS Measurements from 1997 to 2010. Atmos. Chem. Phys. 2012, 12, 8037–8053. [Google Scholar] [CrossRef]
- De Meij, A.; Pozzer, A.; Lelieveld, J. Trend Analysis in Aerosol Optical Depths and Pollutant Emission Estimates between 2000 and 2009. Atmos. Environ. 2012, 51, 75–85. [Google Scholar] [CrossRef]
- Farahat, A.; El-Askary, H.; Adetokunbo, P.; Fuad, A.T. Analysis of Aerosol Absorption Properties and Transport over North Africa and the Middle East Using AERONET Data. Ann. Geophys. 2016, 34, 1031–1044. [Google Scholar] [CrossRef]
- Al Otaibi, M.; Farahat, A.; Tawabini, B.; Omar, M.H.; Ramadan, E.; Abuelgasim, A.; Singh, R.P. Long-Term Aerosol Trends and Variability over Central Saudi Arabia Using Optical Characteristics from Solar Village AERONET Measurements. Atmosphere 2019, 10, 752. [Google Scholar] [CrossRef]
- Farahat, A.; El-Askary, H.; Al-Shaibani, A. Study of Aerosols’ Characteristics and Dynamics over the Kingdom of Saudi Arabia Using a Multisensor Approach Combined with Ground Observations. Adv. Meteorol. 2015, 2015, 247531. [Google Scholar] [CrossRef]
- Farahat, A. Comparative Analysis of MODIS, MISR and AERONET Climatology over the Middle East and North Africa. Ann. Geophys. 2018, 37, 1–46. [Google Scholar] [CrossRef]
- Syed, F.S.; Adnan, S.; Zamreeq, A.; Ghulam, A. Identification of Droughts over Saudi Arabia and Global Teleconnections. Nat. Hazards 2022, 112, 2717–2737. [Google Scholar] [CrossRef]
- Saharwardi, M.S.; Dasari, H.P.; Aggarwal, V.; Ashok, K.; Hoteit, I. Long-Term Variability in the Arabian Peninsula Droughts Driven by the Atlantic Multidecadal Oscillation. Earth’s Future 2023, 11, e2023EF003549. [Google Scholar] [CrossRef]
- Gandham, H.; Dasari, H.P.; Langodan, S.; Karumuri, R.K.; Hoteit, I. Major Changes in Extreme Dust Events Dynamics over the Arabian Peninsula during 2003–2017 Driven by Atmospheric Conditions. J. Geophys. Res. Atmos. 2020, 125, e2020JD032931. [Google Scholar] [CrossRef]
- Kumar, K.R.; Attada, R.; Dasari, H.P.; Vellore, R.K.; Langodan, S.; Abualnaja, Y.O.; Hoteit, I. Aerosol Optical Depth Variability over the Arabian Peninsula as Inferred from Satellite Measurements. Atmos. Environ. 2018, 187, 346–357. [Google Scholar] [CrossRef]
- Maghrabi, A.H.; Al-Dosari, A.F. Effects on Surface Meteorological Parameters and Radiation Levels of a Heavy Dust Storm Occurred in Central Arabian Peninsula. Atmos. Res. 2016, 182, 30–35. [Google Scholar] [CrossRef]
- Pu, B.; Ginoux, P. The Impact of the Pacific Decadal Oscillation on Springtime Dust Activity in Syria. Atmos. Chem. Phys. 2016, 16, 13431–13448. [Google Scholar] [CrossRef]
- Yin, Z.Y.; Maytubby, A.; Liu, X. Variation Patterns of the ENSO’s Effects on Dust Activity in North Africa, Arabian Peninsula, and Central Asia of the Dust Belt. Climate 2022, 10, 150. [Google Scholar] [CrossRef]
- Huang, Y.; Liu, X.; Yin, Z.Y.; An, Z. Global Impact of ENSO on Dust Activities with Emphasis on the Key Region from the Arabian Peninsula to Central Asia. J. Geophys. Res. Atmos. 2021, 126, e2020JD034068. [Google Scholar] [CrossRef]
- Yu, Y.; Notaro, M.; Liu, Z.; Wang, F.; Alkolibi, F.; Fadda, E.; Bakhrjy, F. Climatic Controls on the Interannual to Decadal Variability in Saudi Arabian Dust Activity: Toward the Development of a Seasonal Dust Prediction Model. J. Geophys. Res. Atmos. 2015, 120, 1739–1758. [Google Scholar] [CrossRef]
- Almazroui, M.; Alobaidi, M.; Saeed, S.; Mashat, A.; Assiri, M. The Possible Impact of the Circumglobal Wave Train on the Wet Season Dust Storm Activity over the Northern Arabian Peninsula. Clim. Dyn. 2017, 50, 2257–2268. [Google Scholar] [CrossRef]
- Randles, C.A.; da Silva, A.M.; Buchard, V.; Colarco, P.R.; Darmenov, A.; Govindaraju, R.; Smirnov, A.; Holben, B.; Ferrare, R.; Hair, J.; et al. The MERRA-2 Aerosol Reanalysis, 1980 Onward. Part I: System Description and Data Assimilation Evaluation. J. Clim. 2017, 30, 6823–6850. [Google Scholar] [CrossRef] [PubMed]
- Hersbach, H.; Bell, B.; Berrisford, P.; Hirahara, S.; Horányi, A.; Muñoz-Sabater, J.; Nicolas, J.; Peubey, C.; Radu, R.; Schepers, D.; et al. The ERA5 Global Reanalysis. Q. J. R. Meteorol. Soc. 2020, 146, 1999–2049. [Google Scholar] [CrossRef]
- Sen, P.K. Estimates of the Regression Coefficient Based on Kendall’s Tau. J. Am. Stat. Assoc. 1968, 63, 1379–1389. [Google Scholar] [CrossRef]
- Hamed, K.H.; Ramachandra, R. A Modified Mann-Kendall Trend Test for Autocorrelated Data. J. Hydrol. 1998, 204, 182–196. [Google Scholar] [CrossRef]
- Li, J.; Carlson, B.E.; Dubovik, O.; Lacis, A.A. Recent Trends in Aerosol Optical Properties Derived from AERONET Measurements. Atmos. Chem. Phys. 2014, 14, 12271–12289. [Google Scholar] [CrossRef]
- Srivastava, A.; Saran, S. Comprehensive Study on AOD Trends over the Indian Subcontinent: A Statistical Approach. Int. J. Remote Sens. 2017, 38, 5127–5149. [Google Scholar] [CrossRef]
- Zhao, B.; Jiang, J.H.; Gu, Y.; Diner, D.; Worden, J.; Liou, K.-N.; Su, H.; Xing, J.; Garay, M.; Huang, L. Decadal-Scale Trends in Regional Aerosol Particle Properties and Their Linkage to Emission Changes. Environ. Res. Lett. 2017, 12, 54021. [Google Scholar] [CrossRef]
- Maghrabi, A.H.; Alotaibi, R.N. Long-Term Variations of AOD from an AERONET Station in the Central Arabian Peninsula. Theor. Appl. Climatol. 2018, 134, 1015–1026. [Google Scholar] [CrossRef]
- Yue, S.; Pilon, P.; Phinney, B.; Cavadias, G. The Influence of Autocorrelation on the Ability to Detect Trend in Hydrological Series. Hydrol. Process. 2002, 16, 1807–1829. [Google Scholar] [CrossRef]
- Molteni, F.; Stockdale, T.N.; Vitart, F. Understanding and Modelling Extra-Tropical Teleconnections with the Indo-Pacific Region during the Northern Winter. Clim. Dyn. 2015, 45, 3119–3140. [Google Scholar] [CrossRef]
- Rashid, I.U.; Abid, M.A.; Almazroui, M.; Kucharski, F.; Hanif, M.; Ali, S.; Ismail, M. Early Summer Surface Air Temperature Variability over Pakistan and the Role of El Niño–Southern Oscillation Teleconnections. Int. J. Climatol. 2022, 42, 5768–5784. [Google Scholar] [CrossRef]
- Yadav, R.K. Midlatitude Rossby Wave Modulation of the Indian Summer Monsoon. Q. J. R. Meteorol. Soc. 2017, 143, 2260–2271. [Google Scholar] [CrossRef]
- Hamal, K.; Sharma, S.; Baniya, B.; Khadka, N.; Zhou, X. Inter-Annual Variability of Winter Precipitation Over Nepal Coupled with Ocean-Atmospheric Patterns During 1987–2015. Front. Earth Sci. 2020, 8, 161. [Google Scholar] [CrossRef]
- Ullah, W.; Wang, G.; Lou, D.; Ullah, S.; Bhatti, A.S.; Ullah, S.; Karim, A.; Hagan, D.F.T.; Ali, G. Large-Scale Atmospheric Circulation Patterns Associated with Extreme Monsoon Precipitation in Pakistan during 1981–2018. Atmos. Res. 2021, 253, 105489. [Google Scholar] [CrossRef]
- Shen, L.; Jacob, D.J.; Mickley, L.J.; Wang, Y.; Zhang, Q. Insignificant Effect of Climate Change on Winter Haze Pollution in Beijing. Atmos. Chem. Phys. 2018, 18, 17489–17496. [Google Scholar] [CrossRef]
- Monahan, A.H.; Fyfe, J.C.; Ambaum, M.H.P.; Stephenson, D.B.; North, G.R. Empirical Orthogonal Functions: The Medium Is the Message. J. Clim. 2009, 22, 6501–6514. [Google Scholar] [CrossRef]
- Wilks, D.S. Statistical Methods in the Atmospheric Sciences, 2nd ed.; International Geophysics Series; Academic Press: Cambridge, MA, USA, 2006; Volume 91, ISBN 9780127519661. [Google Scholar]
- Panda, D.K.; AghaKouchak, A.; Ambast, S.K. Increasing Heat Waves and Warm Spells in India, Observed from a Multiaspect Framework. J. Geophys. Res. 2017, 122, 3837–3858. [Google Scholar] [CrossRef]
- Kumar, A.; Chen, M. What Is the Variability in US West Coast Winter Precipitation during Strong El Niño Events? Clim. Dyn. 2017, 49, 2789–2802. [Google Scholar] [CrossRef]
- Kendall, M.G. Rank Correlation Methods, 4th ed.; Griffin, C., Ed.; Griffin: London, UK, 1975. [Google Scholar]
- Ali, G.; Bao, Y.; Ullah, W.; Ullah, S.; Guan, Q.; Liu, X.; Li, L.; Lei, Y.; Li, G.; Ma, J. Spatiotemporal Trends of Aerosols over Urban Regions in Pakistan and Their Possible Links to Meteorological Parameters. Atmosphere 2020, 11, 306. [Google Scholar] [CrossRef]
- Mann, H.B. Nonparametric Tests Against Trend. Econometrica 1945, 13, 245–259. [Google Scholar] [CrossRef]
- Alghamdi, A.S. Climatology and Changes in Temperature Seasonality in the Arabian Peninsula. Atmosphere 2023, 15, 26. [Google Scholar] [CrossRef]
- Almazroui, M.; Rashid, I.U.; Saeed, S.; Islam, M.N. ENSO Influence on Summer Temperature over Arabian Peninsula: Role of Mid-Latitude Circulation. Clim. Dyn. 2019, 53, 5047–5062. [Google Scholar] [CrossRef]
- McPhaden, M.J.; Santoso, A.; Cai, W. El Niño Southern Oscillation in a Changing Climate; John Wiley & Sons: Hoboken, NJ, USA, 2020; Volume 253, ISBN 1119548128. [Google Scholar]
- Taschetto, A.S.; Ummenhofer, C.C.; Stuecker, M.F.; Dommenget, D.; Ashok, K.; Rodrigues, R.R.; Yeh, S. ENSO Atmospheric Teleconnections. In El Niño Southern Oscillation in a Changing Climate; Wiley Online Library: Hoboken, NJ, USA, 2020; pp. 309–335. [Google Scholar]
- Kucharski, F.; Abid, M.A. Interannual Variability of the Indian Monsoon and Its Link to ENSO. Oxf. Res. Encycl. Clim. Sci. 2017, 1–24. [Google Scholar] [CrossRef]
- Rodwell, M.J.; Hoskins, B.J. Subtropical Anticyclones and Summer Monsoons. J. Clim. 2001, 14, 3192–3211. [Google Scholar] [CrossRef]
- Nelli, N.R.; Francis, D.; Fonseca, R.; Abida, R.; Weston, M.; Wehbe, Y.; Al Hosary, T. The Atmospheric Controls of Extreme Convective Events over the Southern Arabian Peninsula during the Spring Season. Atmos. Res. 2021, 262, 105788. [Google Scholar] [CrossRef]
- Horan, M.F.; Batibeniz, F.; Kucharski, F.; Almazroui, M.; Abid, M.A.; Fu, J.S.; Ashfaq, M. Moisture Sources for Precipitation Variability over the Arabian Peninsula. Clim. Dyn. 2023, 61, 4793–4807. [Google Scholar] [CrossRef]
- Hong, X.; Lu, R. The Meridional Displacement of the Summer Asian Jet, Silk Road Pattern, and Tropical SST Anomalies. J. Clim. 2016, 29, 3753–3766. [Google Scholar] [CrossRef]


Disclaimer/Publisher’s Note: The statements, opinions and data contained in all publications are solely those of the individual author(s) and contributor(s) and not of MDPI and/or the editor(s). MDPI and/or the editor(s) disclaim responsibility for any injury to people or property resulting from any ideas, methods, instructions or products referred to in the content. |
© 2024 by the authors. Licensee MDPI, Basel, Switzerland. This article is an open access article distributed under the terms and conditions of the Creative Commons Attribution (CC BY) license (https://creativecommons.org/licenses/by/4.0/).