Article

Climate Classification in the Canadian Prairie Provinces Using Day-to-Day Thermal Variability Metrics

Department of Physical and Environmental Sciences, University of Toronto Scarborough, Toronto, ON M1C 1A4, Canada
*
Author to whom correspondence should be addressed.
Atmosphere 2024, 15(9), 1111; https://doi.org/10.3390/atmos15091111
Submission received: 29 August 2024 / Revised: 10 September 2024 / Accepted: 10 September 2024 / Published: 13 September 2024
(This article belongs to the Section Atmospheric Techniques, Instruments, and Modeling)

Abstract

:
The data from thirty-one climate stations in the Canadian Prairie provinces of Alberta, Saskatchewan, and Manitoba are analyzed using a number of day-to-day thermal variability metrics. These are used to classify each climate station location using a decision tree developed previously. This is the first application of the decision tree to identify stations as having rural, urban, peri-urban, marine, island, airport, or mountain climates. Of the thirty-one, eighteen were identified as peri-urban, with fourteen of these being airports; six were identified as marine or island; four were identified as rural; one as urban was identified; and two were identified as mountain. The two climate stations at Churchill, Manitoba, located near the shores of Hudson Bay, were initially identified as peri-urban. This was re-assessed after adjusting the number of “winter” months used in the metric for identifying marine and island climates (which, for all other analyses, excluded only December, January, and February). For Churchill, to match the sea ice season, the months of November, March, April, and May were also excluded. Then, a strong marine signal was found for both stations. There is a potential to use these thermal metrics to create a sea ice climatology in Hudson Bay, particularly for pre-satellite reconnaissance (1971). Lake Louise and Banff, Alberta, are the first mountain stations to be identified as such outside of British Columbia. Five airport/non-airport pairs are examined to explore the difference between an airport site and a local site uninfluenced by the airport. In two cases, the expected outcome was not realized through the decision tree analysis. Both Jasper and Edmonton Stony Plain were classified as peri-urban. These two locations illustrated the influence of proximity to large highways. In both cases the expected outcome was replaced by peri-urban, reflective of the localized impact of the major highway. This was illustrated in both cases using a time series of the peri-urban metric before and after major highway development, which had statistically significant differences. This speaks to the importance of setting climate stations appropriately away from confounding influences. It also suggests additional metrics to assess the environmental consistency of climate time series.

1. Introduction

A day-to-day temperature variability framework [DTD] developed by [1], based on [2], has been found to be a useful metric for detecting thermal variations that are reflective of local environments, such as urban, rural, peri-urban, marine, island, airport, and mountain settings [3,4,5,6,7,8,9,10,11,12,13,14,15,16,17,18,19]. The absolute difference between a day’s surface mean temperature with the previous day’s surface mean temperature (DTD) was introduced as a measure of thermal variability [1]. This was found to be a better measure of thermal variability than standard deviation, a result also confirmed by [19]. In addition, day-to-day thermal metrics have been applied to high-frequency temperature variation [12,15,16,17,19]. It has also been applied to other sectors, such as health outcomes [20,21,22,23,24,25] and economics [26,27].
An additional metric, ΔDTD, was also introduced by [3]. This is the difference between the DTD calculated from the maximum temperature of the day (DTDTmax) and that calculated from the minimum temperature (DTDTmin) of the day. This metric has been shown to be adept at detecting the difference between urban and rural environments [3,4]. For urban landscapes, insolation is partitioned into sensible heat, subsurface heat, and, to a lesser extent, latent heat (evaporation of surface water). The response is typically a substantial increase in temperature (sensible heat) for a given radiative input. Rural environments and marine (coastal) environments, with the same radiative input as an urban setting, partition substantially more energy into latent heat, thus evaporating surface water and fueling the potential for fog and clouds. This mitigates the day-to-day variability, as demonstrated in [9] for locations along East China’s coast. They examined annually averaged day-to-day temperature variability, comparing coastal areas to those inland from the coast. The day-to-day variability of the minimum temperature of the day was found to be a clear indicator of coastalization. In addition, this metric was found to be better and more nuanced than traditional measures of continentality/coastalization. This measure has been used to detect the influence of the Adriatic Sea on coastal locations in Croatia [14], the South China coast [16], two Canadian coasts [10], and islands in large Canadian lakes [11]. For the Canadian studies, due to the presence of sea and lake ice in winter, an ADTDTmin was used that omitted the winter months of December, January, and February [10,11]. A latitude weighting was applied to the East China coast study [9], but this was not applied in the Canadian context [10,11] due to the much more limited range of station latitudes.
Building on the work of [10,11], we used a day-to-day temperature variability metric to detect island climates in the Great Lakes of North America and two other large water bodies in the Canadian province of Ontario. These locations exhibited marine characteristics using the metric developed by [9,10] for ocean coastal locations, ADTDTmin. Comparisons with neighbouring stations (non-island) for six focal areas in the Great Lakes showed a distinct marine effect on the corresponding island climate stations. Those displaying marine characteristics were all island climate stations, and the marine influence, as measured by day-to-day temperature variability, dropped off rapidly with distance from the local water body.
Ref. [5] proposed another thermal metric, RΔTmin, that clearly identifies peri-urban environments. The term “peri-urban” is used in other disciplines, e.g., [28,29]. Following this, peri-urban climates are defined as those that occur at transition zones between urban and rural environments. An unambiguous signal was found for climate stations on the peri-urban fringe of six urban areas in Canada. Most of the peri-urban sites were airports, and a follow-up study, [8], showed that airports generate a localized peri-urban climate. They [8] examined sixty-four airport climate records in Canada. In total, 86% of the airports were assessed as peri-urban, reflective of either their location at the edge of the urban centers or the generation of a peri-urban climate by the airport itself. The remaining nine stations were identified as marine, as introduced above, or “mountain”, a new category identified in that study. The mountain climate is characterized by low day-to-day variability, likely the result of localized diurnal circulation (katabatic and anabatic winds) that tends to erase the climate memory, including the peri-urban signal.
The analysis [8] included a decision tree to identify the nature of the local environment based on day-to-day thermal variability (Figure 1), enabling the identification of urban, rural, peri-urban/airport, marine (island), and mountain climates, using ADTDTmin, RΔTmin, ΔDTD, and DTDTmin.
In this work, we use the decision tree developed in [8] and apply this tree to 31 climate stations in the Canadian Prairie provinces of Alberta, Saskatchewan, and Manitoba to determine the effectiveness of this decision tree in identifying the climate station’s environment.

2. Materials and Methods

2.1. Data

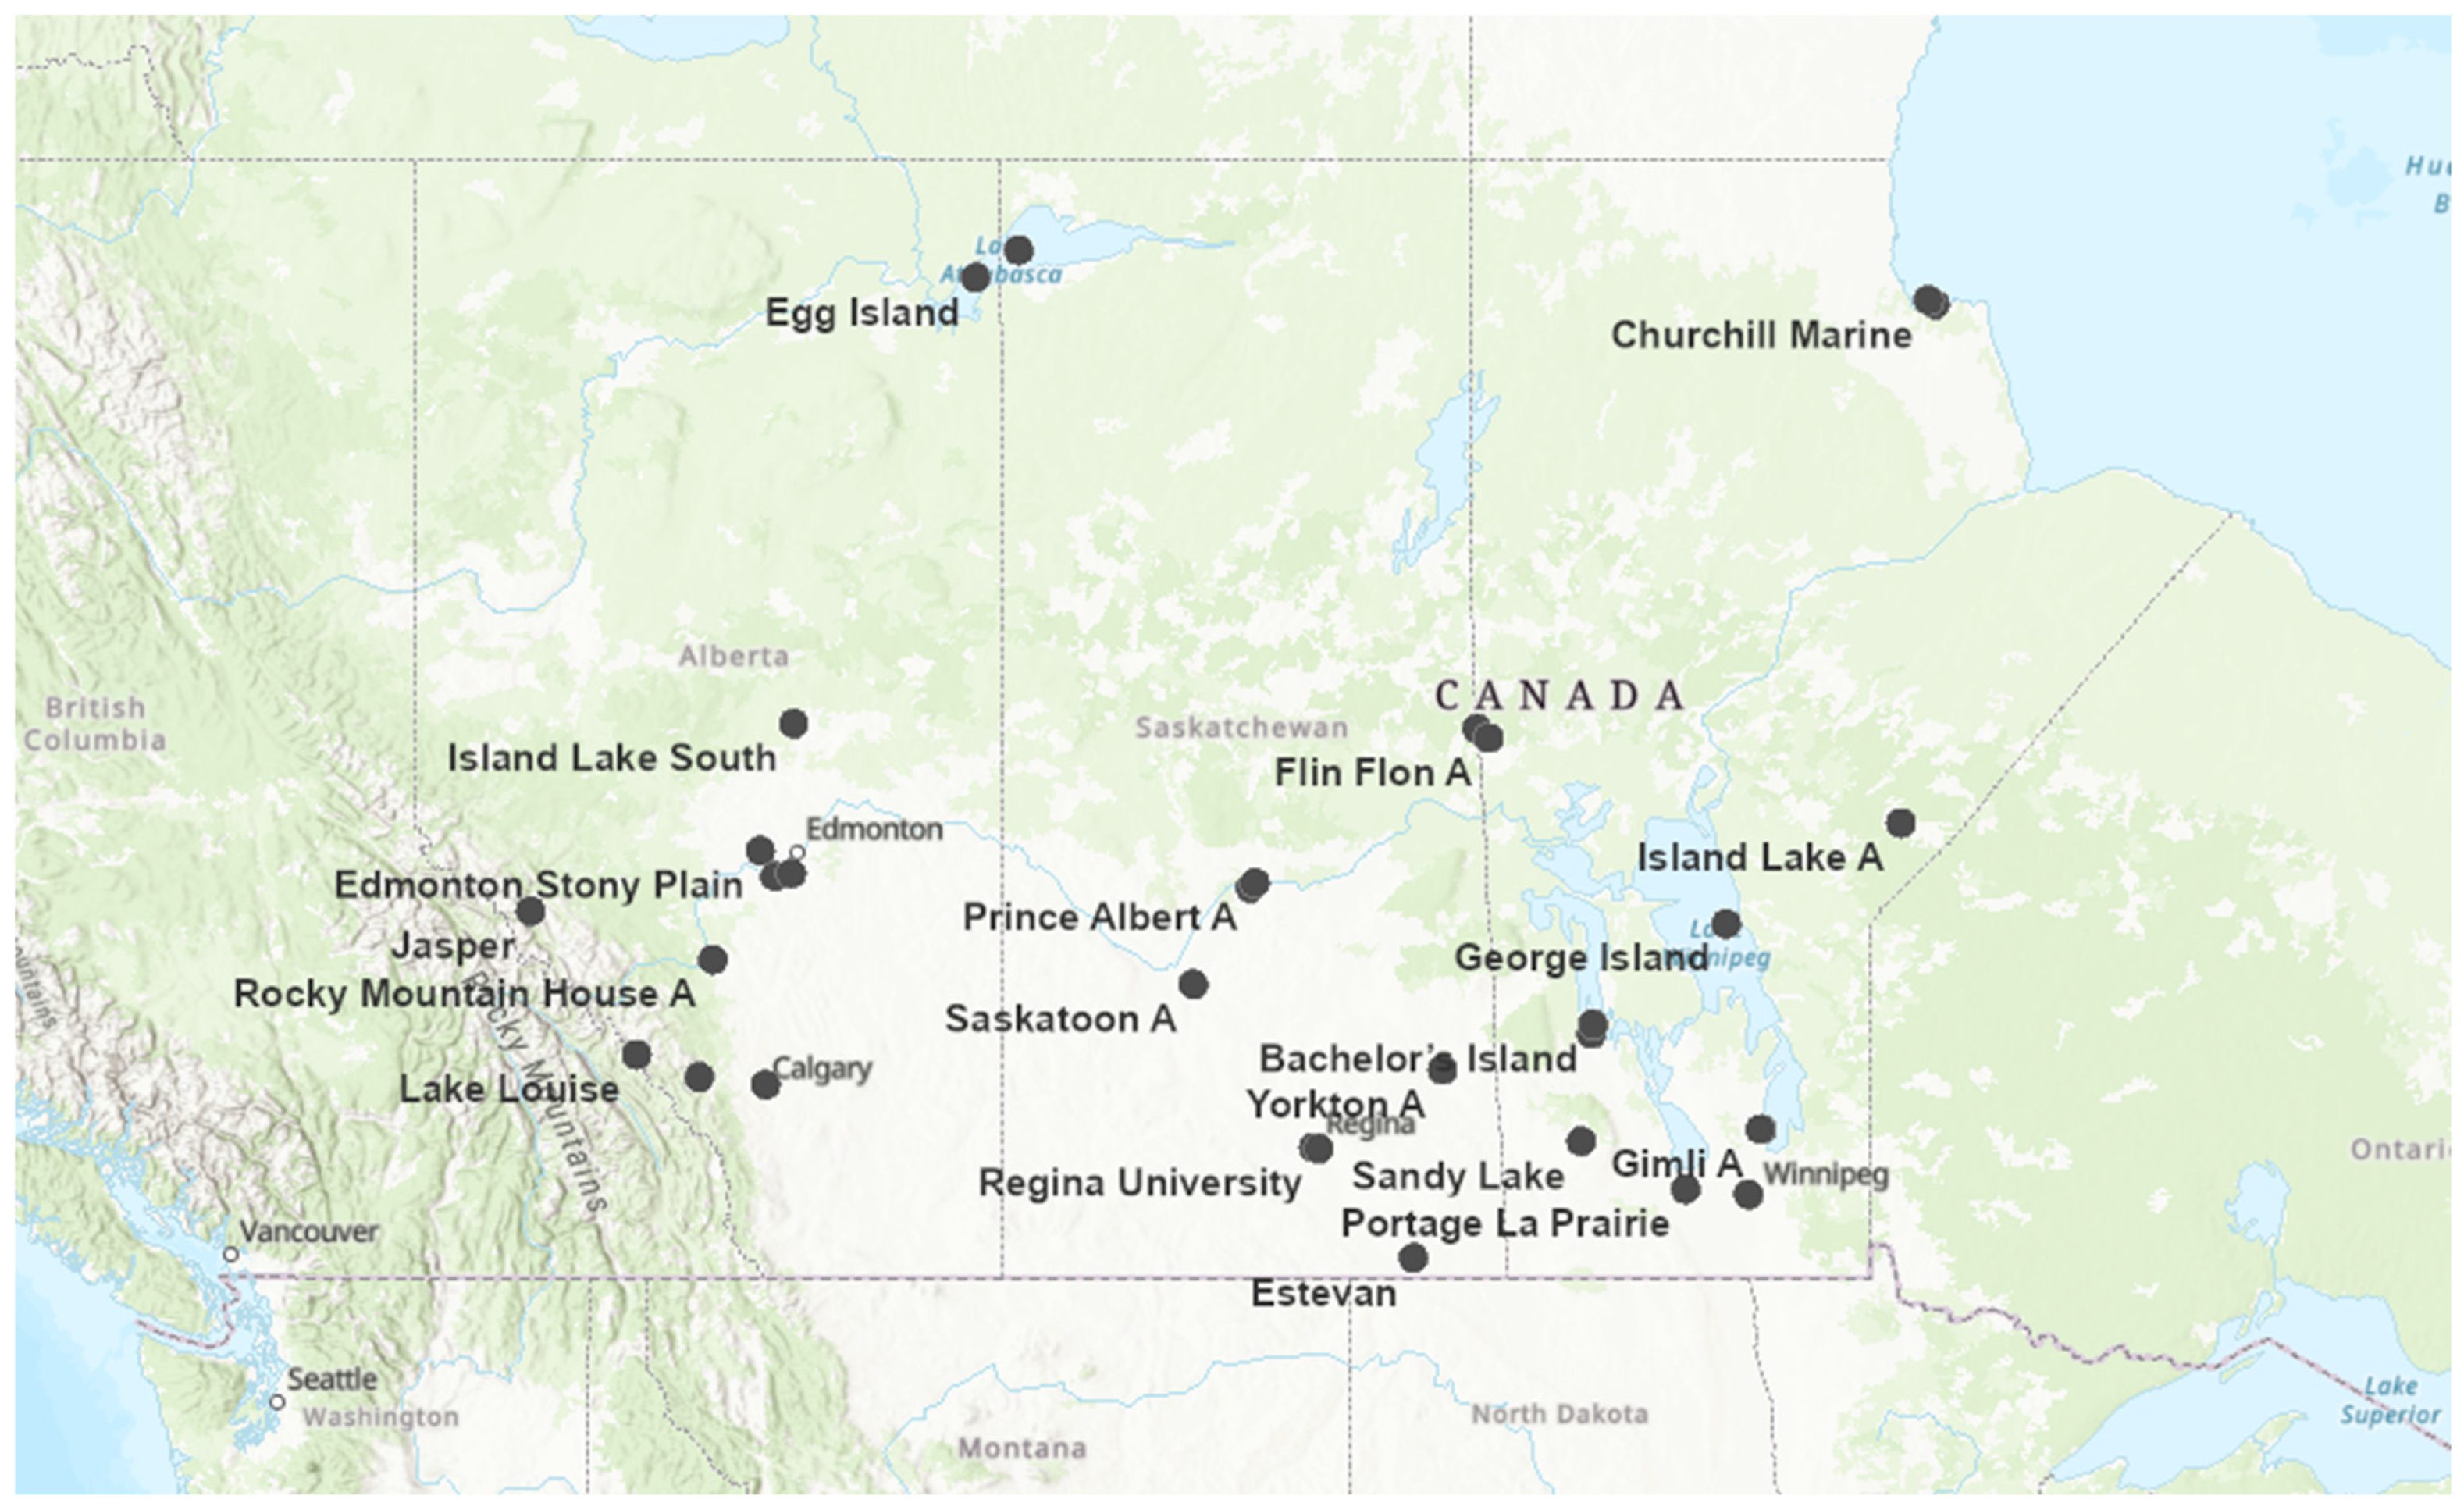
Surface temperature data (maximum and minimum daily temperature) for a total of 31 stations were accessed from the Canadian Historical Climate data archived by Environment and Climate Change Canada, (https://climate.weather.gc.ca/historical_data/search_historic_data_e.html (accessed on 10 May 2024). All stations are in the Canadian Prairie provinces (Alberta, Saskatchewan, Manitoba) (Table 1, Figure 2). The stations cover a diverse geography and a range of landforms and proximities to water bodies. While a homogenized time period is desirable for comparisons among the stations, this would have severely limited the availability of stations for analysis. Ref. [11] demonstrated the relative consistency of the measures used temporally, provided the local environment was not changing with time (such as urbanization). Six airport/non-airport pairs were included as a follow-up to the observation that airports, away from large water bodies and mountains, generate a detectable peri-urban climate [8]. These pairs occur at Churchill, Manitoba; Gimli, Manitoba; Flin Flon, Manitoba; Regina, Saskatchewan; Prince Albert, Saskatchewan; and Edmonton, Alberta. Building on [11], all stations in the three provinces that ended with the word “island” were examined, thus enabling the inclusion of the following stations with sufficient data: Bachelor’s Island, Manitoba; George Island, Manitoba; Beartooth Island, Saskatchewan; and Egg Island, Alberta. Of the 31 stations, 14 are airports (12 with the “A” designator plus Island Lake South, Alberta and Estevan, Saskatchewan). To explore if mountain climates identified in British Columbia in [8] are present in the Prairie provinces, stations in the Rocky Mountains were included. These include the following high-elevation stations: Banff, Jasper, Rocky Mountain House A, and Lake Louise, all in Alberta.

2.2. Analysis

To facilitate the decision tree analysis, a number of metrics, as indicated in Figure 1, are calculated. These include ADTDTmin, RΔTmin, ΔDTD, and DTDTmin.
All metrics arise from a day-to-day temperature variability framework. The formulation for DTD temperature variability metrics, DTD, ΔDTD, and RΔT, are taken from [1,3,5], respectively:
DTD = Σi (Ti − Ti−1)/(N − 1)
where i is the daily counter over the time period of interest and a total of N − 1 pairs of values are used.
ΔDTD = DTDTmax − DTDTmin
ΔT+ = [(Σi=1n−1|Ti+1 − Ti|)]/N+     if (Ti+1 − Ti) > 0
     0             if (Ti+1 − Ti) < 0
ΔT− = [(Σi=1n−1|Ti+1 − Ti|)]/N−     if (Ti+1 − Ti) < 0
     0             if (Ti+1 − Ti) > 0
RΔT = ΔT+/ΔT− = N−/N+
where N− is the number of cold transitions and N+ is the number of warm transitions.
Ref. [10] found that DTD should be adjusted in cold climates by excluding December, January, and February data when examining marine climates in Canada, ADTDTmin.

3. Results

3.1. Decision Tree Analysis

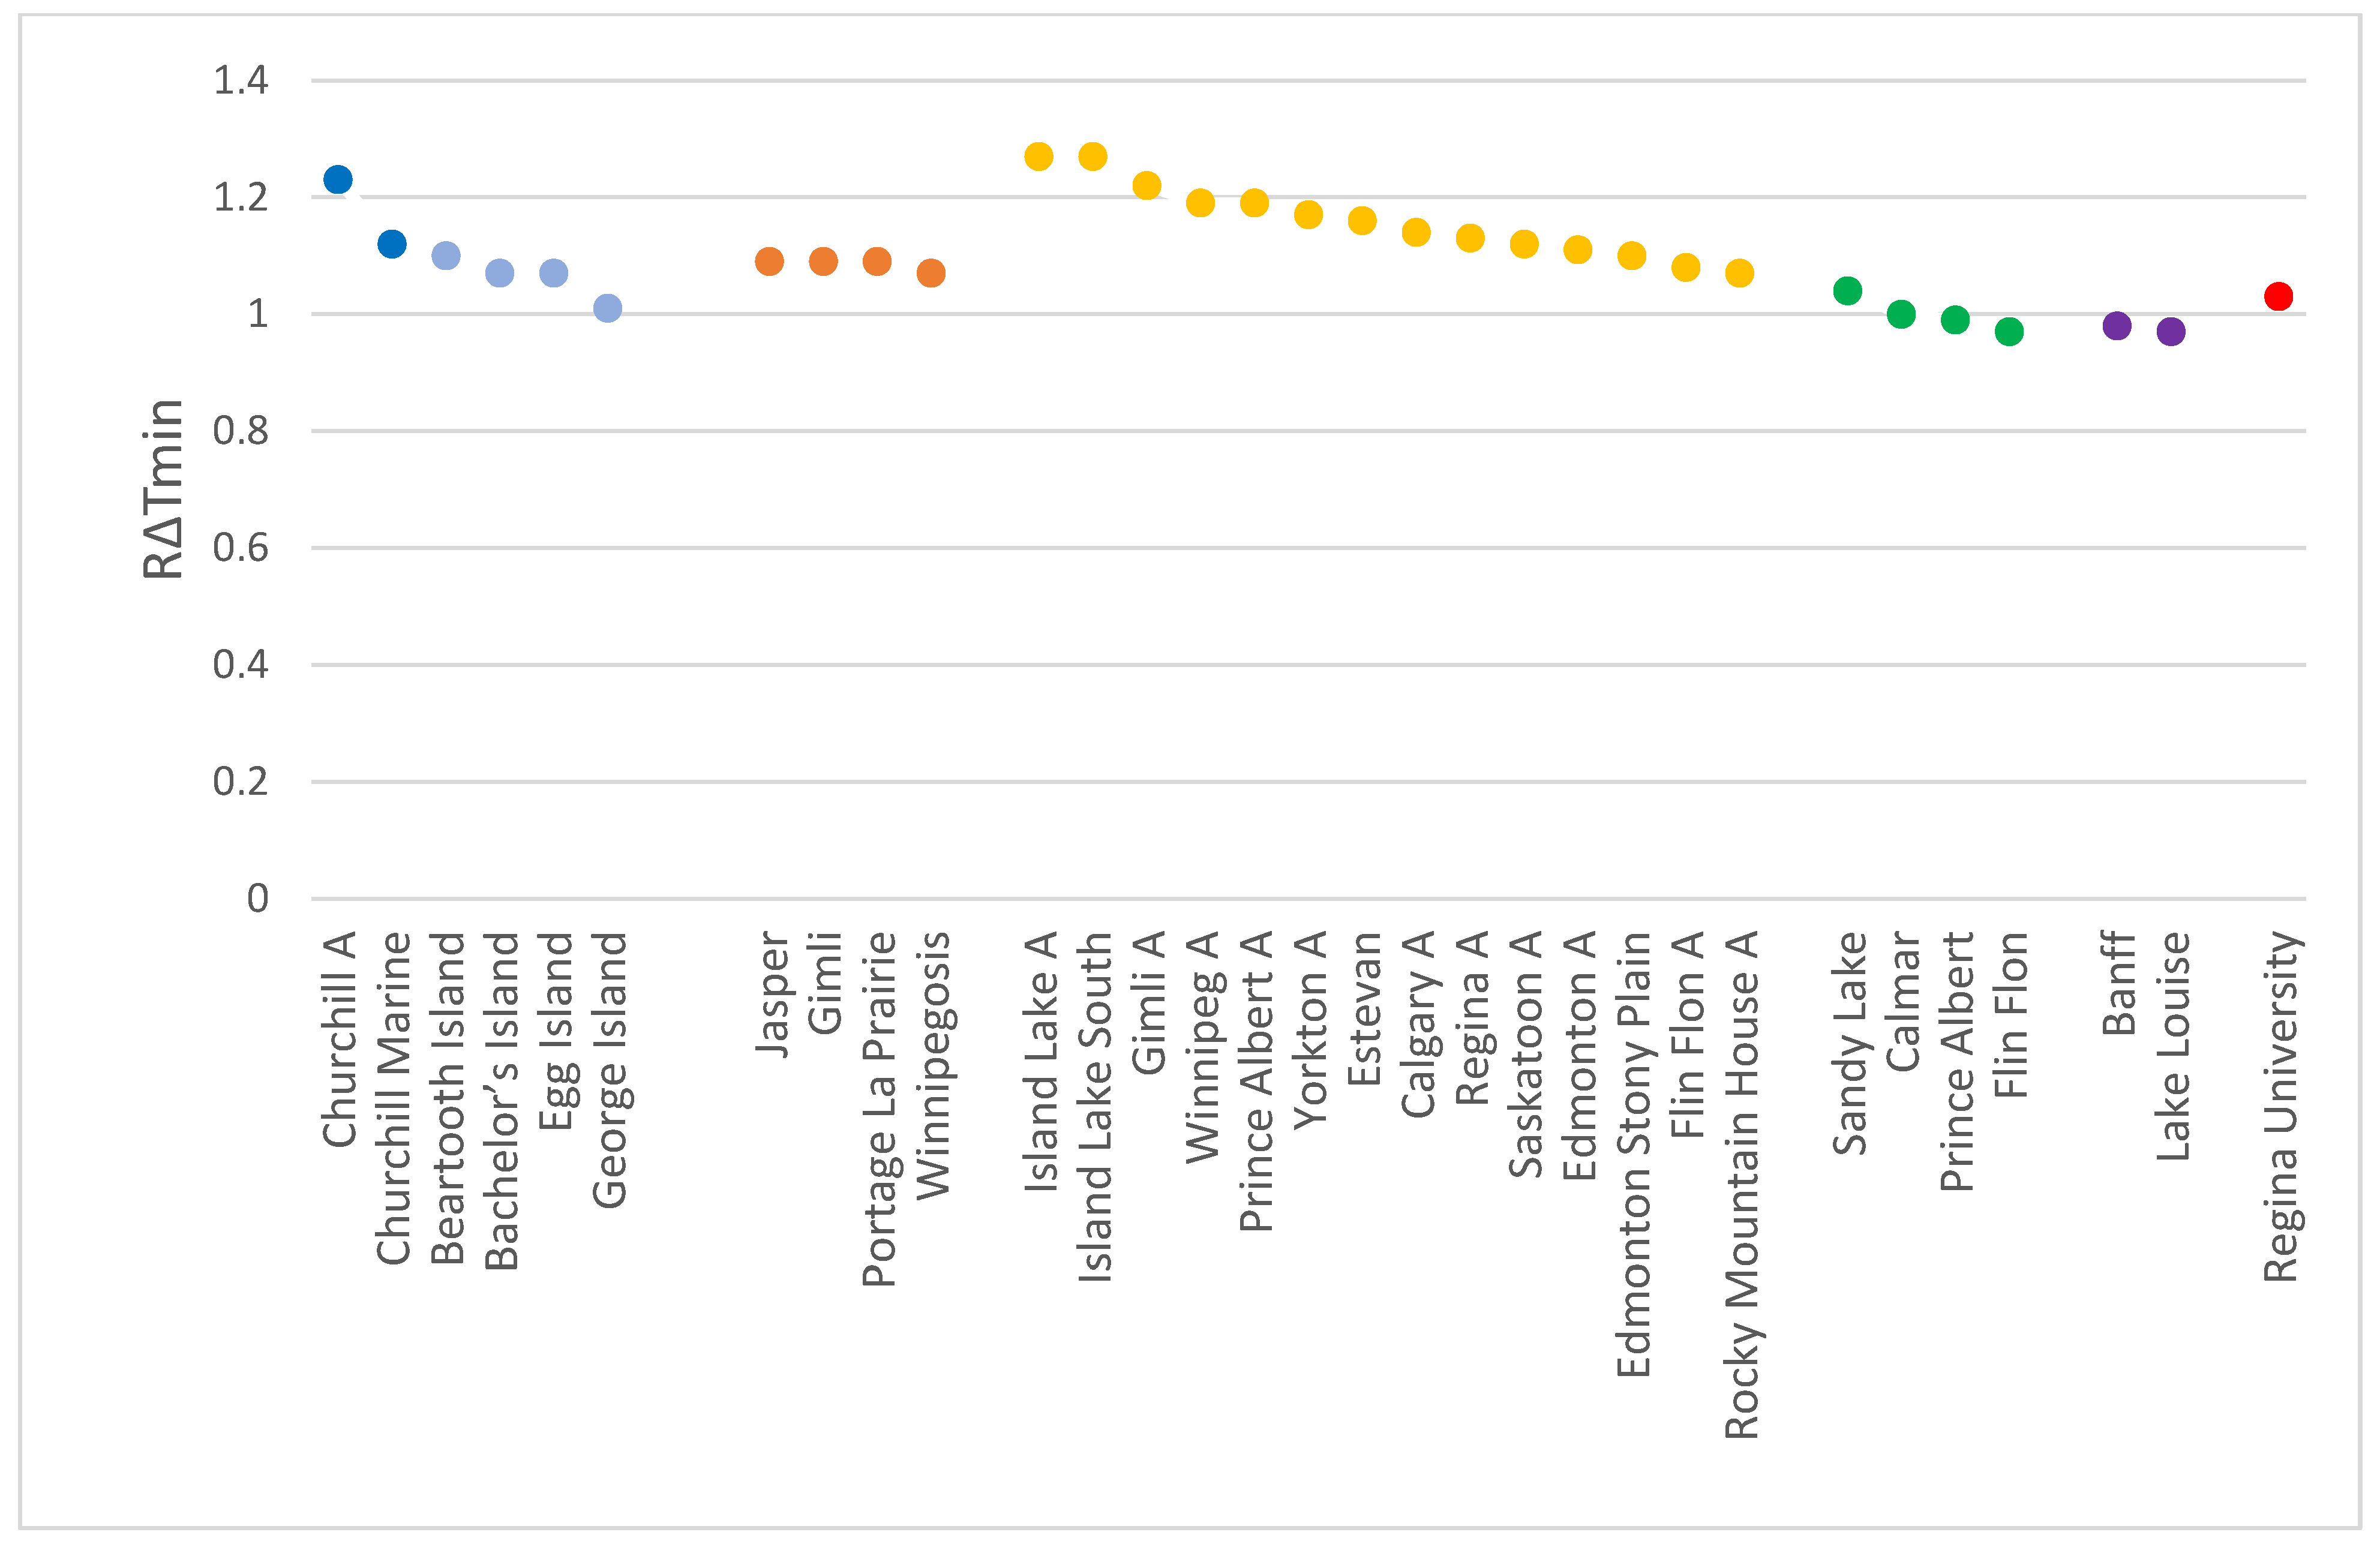
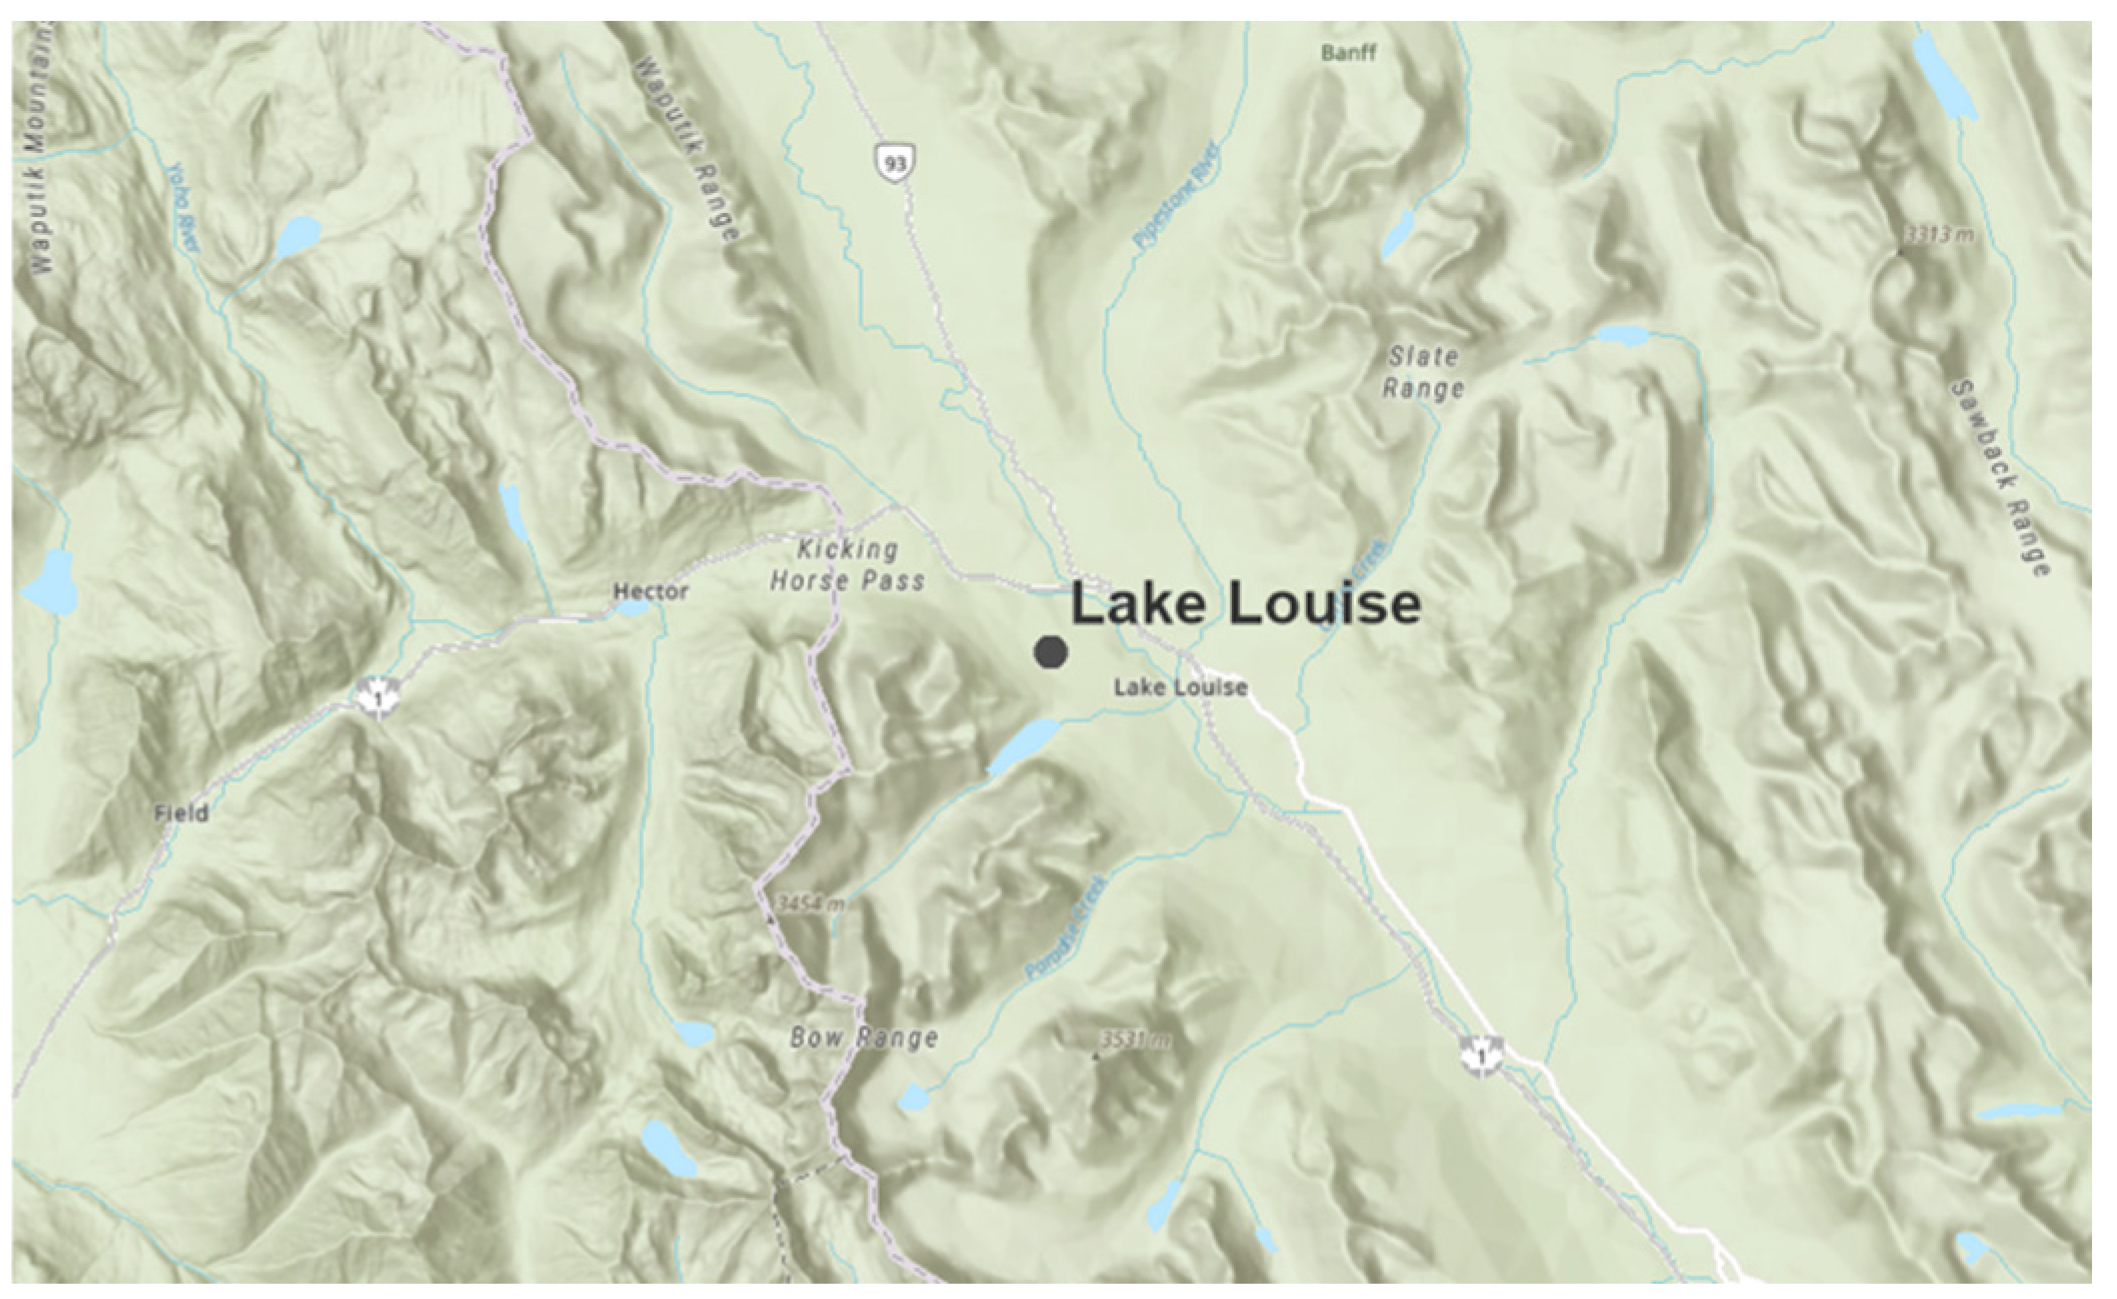
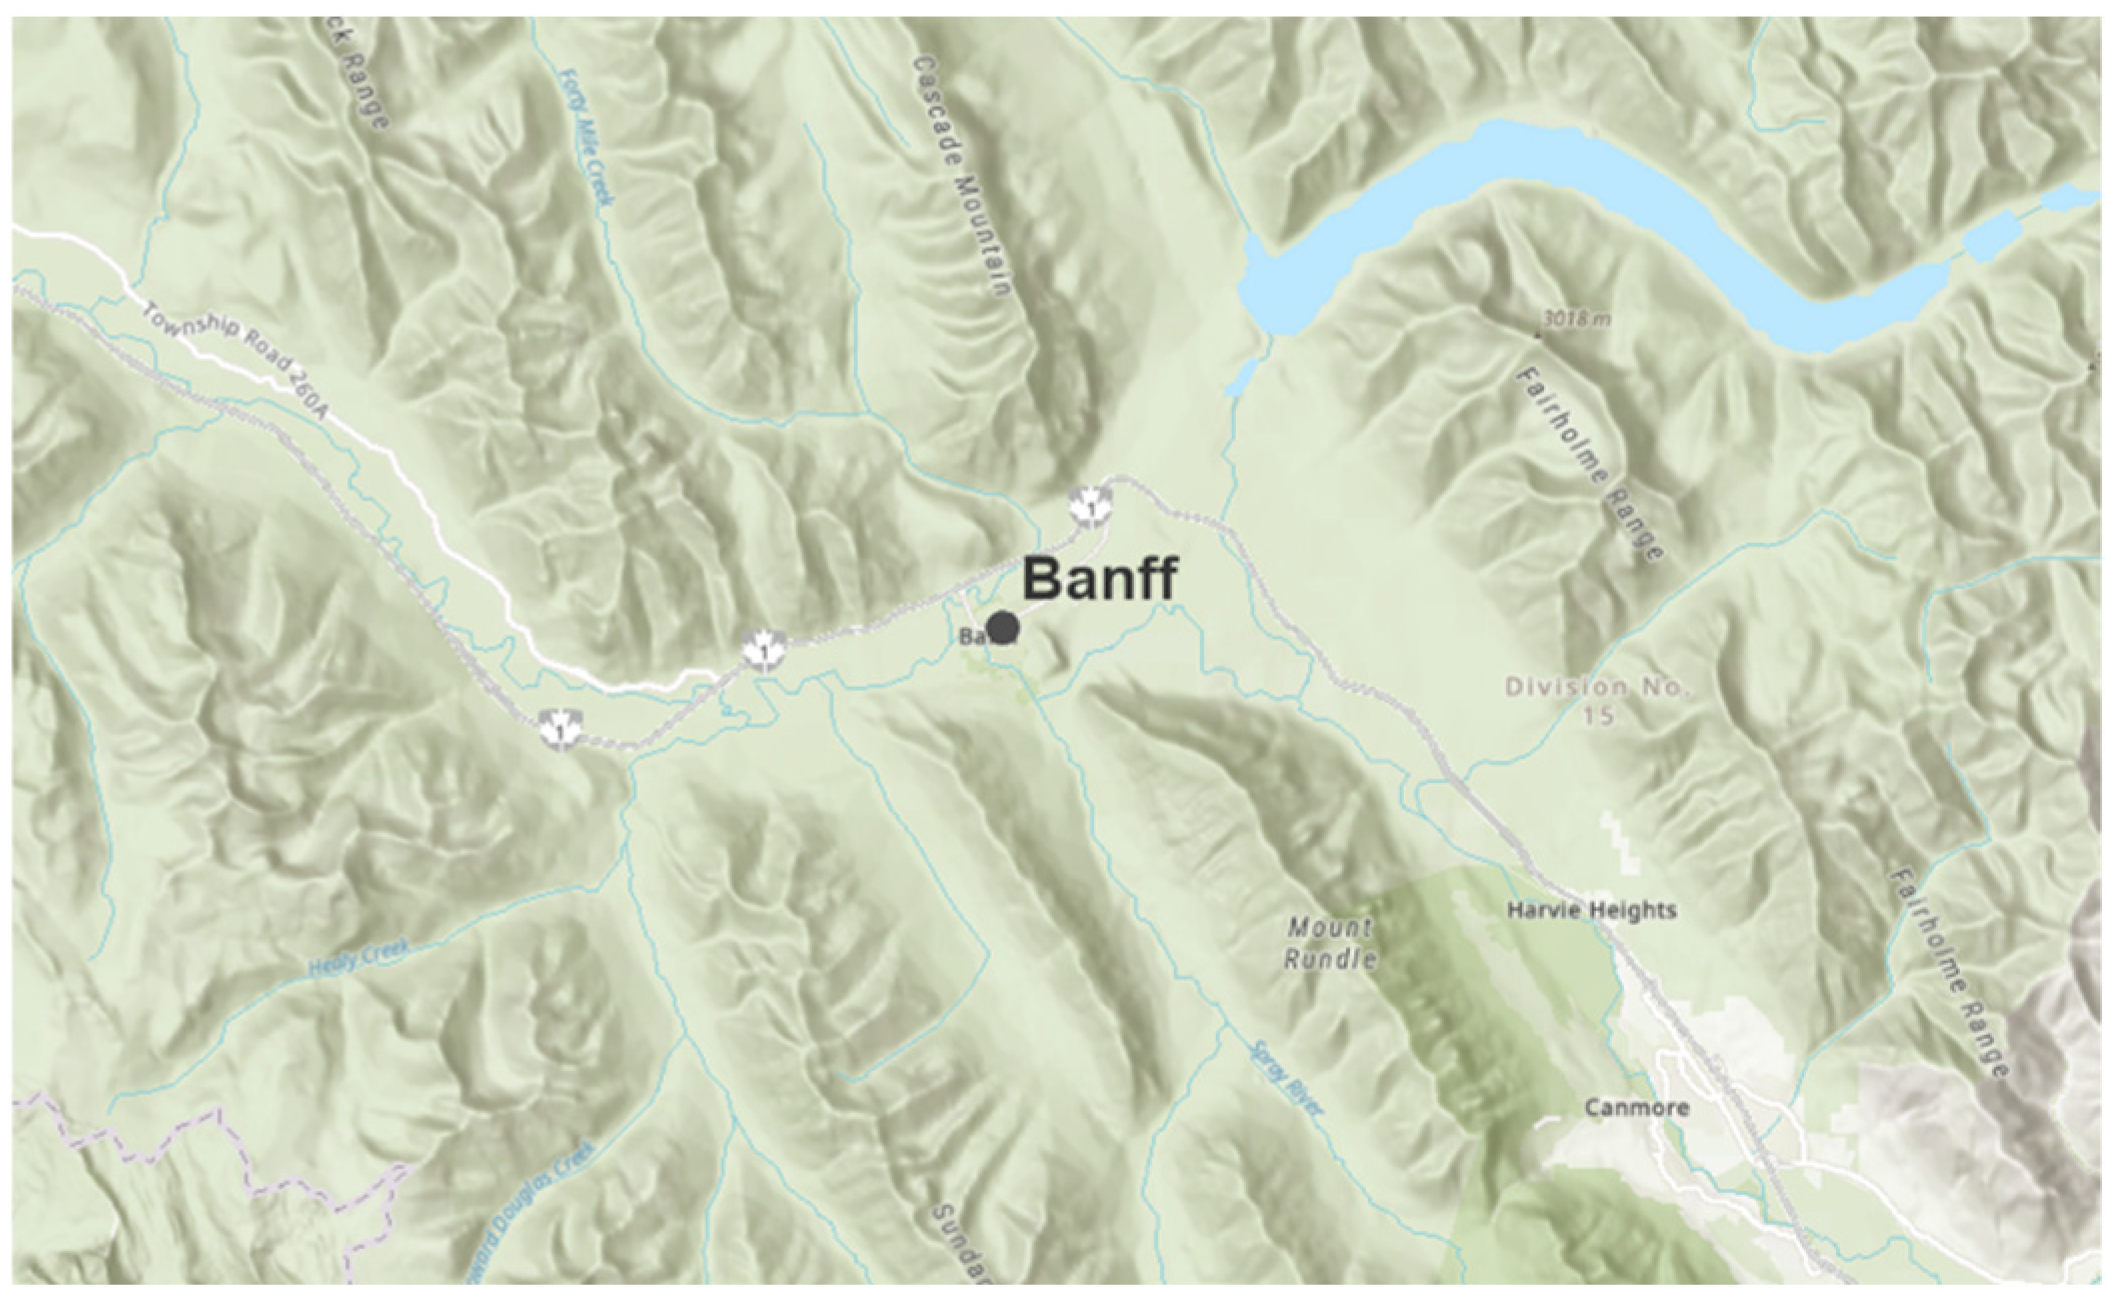
All categories (urban, rural, peri-urban, marine, mountain) were represented in the Prairie provinces (Figure 3). The largest group was peri-urban, including both airport and non-airport stations. Marine was largely islands [11], plus the modified Churchill stations with longer “winters”, discussed below. The first two mountain climate stations outside of British Columbia [8] were identified at Lake Louise and Banff (Table 2, Figure 3). The following sections will explore the success of the classification system, the five locations with paired airport/non-airport stations, island and marine climates, and mountain climates in more detail.

3.2. Climate Classification

The decision tree analysis (“Classification” column) did well in identifying the various landscapes (Figure 3). Of the twenty-seven that were predicted, twenty-four were classified as expected. The three that were not classified as expected included Churchill A, which, due to the proximity to Hudson Bay, had marine characteristics that dominated the peri-urban signal typically found at airports and also observed in [10]. This station only exhibited marine characteristics when the ADTDTmin metric excluded more winter months than December, January, and February but broadened the “winter” months to include November, March, April, and May, consistent with local ice behaviour [30]. One of the stations in the Rocky Mountains, Jasper, was classified as peri-urban rather than mountain, even though it is not an airport station. This will be explored fully in the mountain climate section below.
The third and final one was Edmonton Stony Plain. It was expected to be urban due to this classification in [5]. However, a different time period was selected from 2011 to 2020 in the present study rather than 1991–2000 in [5]. The Edmonton Stony Plain climate record allows for a five-decade analysis, and this is presented in Figure 4. For the 1970s, 1980s, and 1990s, RΔTmin fell below the 1.05 peri-urban threshold but was above the threshold for the 2000s and 2010s. The station is located within 100 m of a major highway (16A), the Yellowknife Highway, that connects Edmonton to the Rocky Mountains. It is a divided highway with at least two lanes in each direction. Highway 16A is part of Highway 16, which was built in 1997. This coincides with the change in climate classification to peri-urban. The new, wider highway was closer to the climate station (the station did not move) and the thermal characteristics of the highway, not unlike that of an airport, are reflected in the change of classification. This illustrates the efficacy of the day-to-day temperature variability framework in detecting changing environments at climate stations.
In Table 2, four locations, Winnipegosis, Gimli, Portage La Prairie, and Prince Albert, were designated as “?”. Two of these, Gimli and Prince Albert, will be discussed in the next section when we examine airport/non-airport pairs. The other two were classified as peri-urban, although neither is located at an airport. For Portage La Prairie, the climate station is located on the northwest fringe of the city, and the local airport is south of the city. For Winnipegosis, the town is located on the southwestern shore of Lake Winnipegosis. The climate station is located on the western fringe of the town. The relevant locations of both Portage La Prairie and Winnipegosis climate stations are consistent with the peri-urban classification.

3.3. Paired Airport/Non-Airport Locations

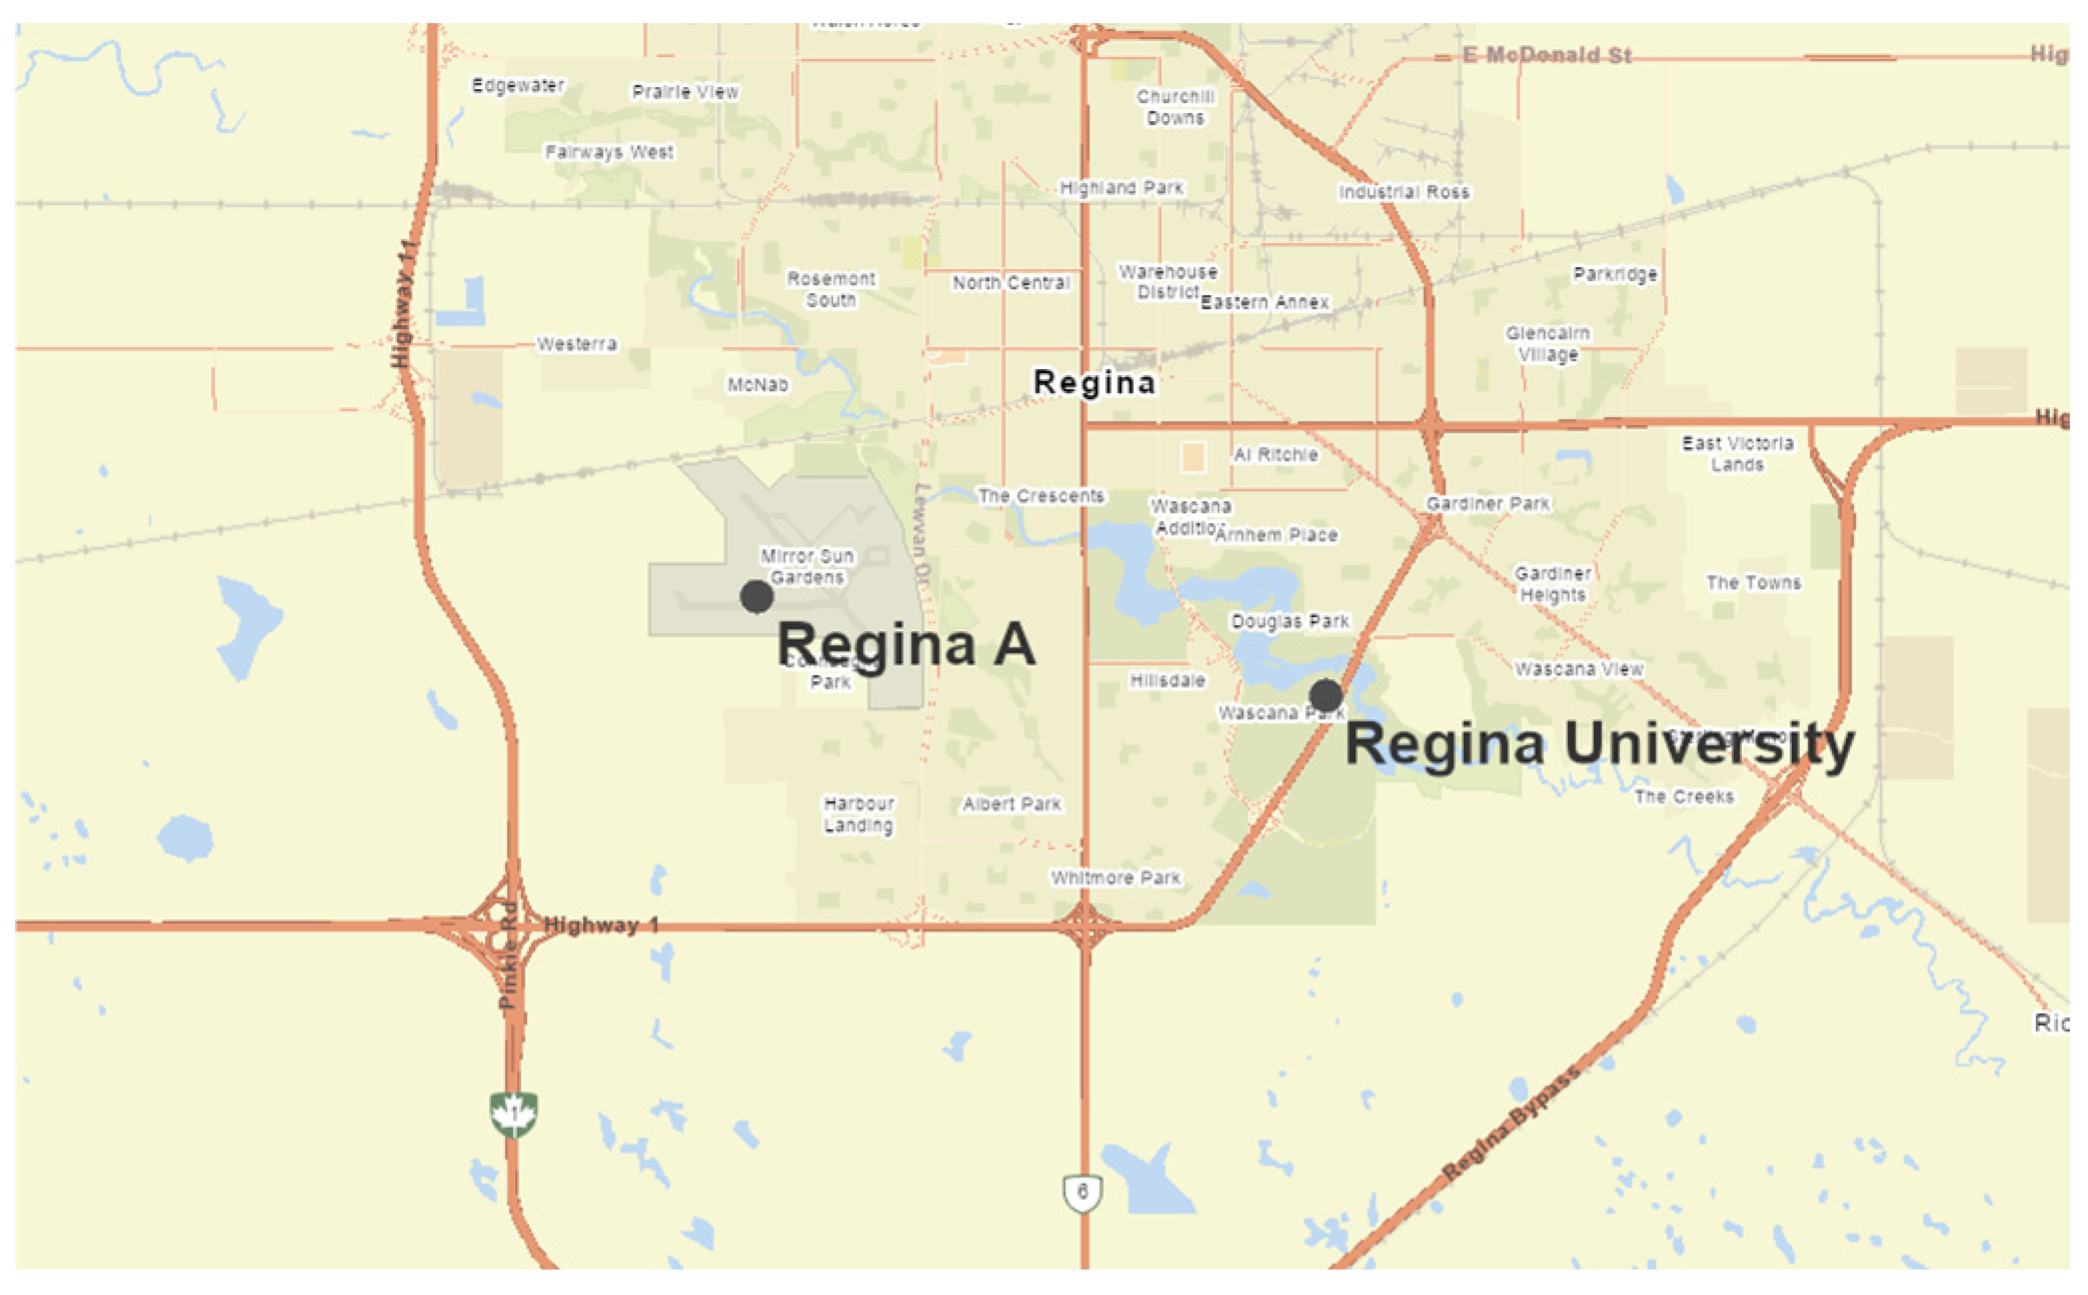
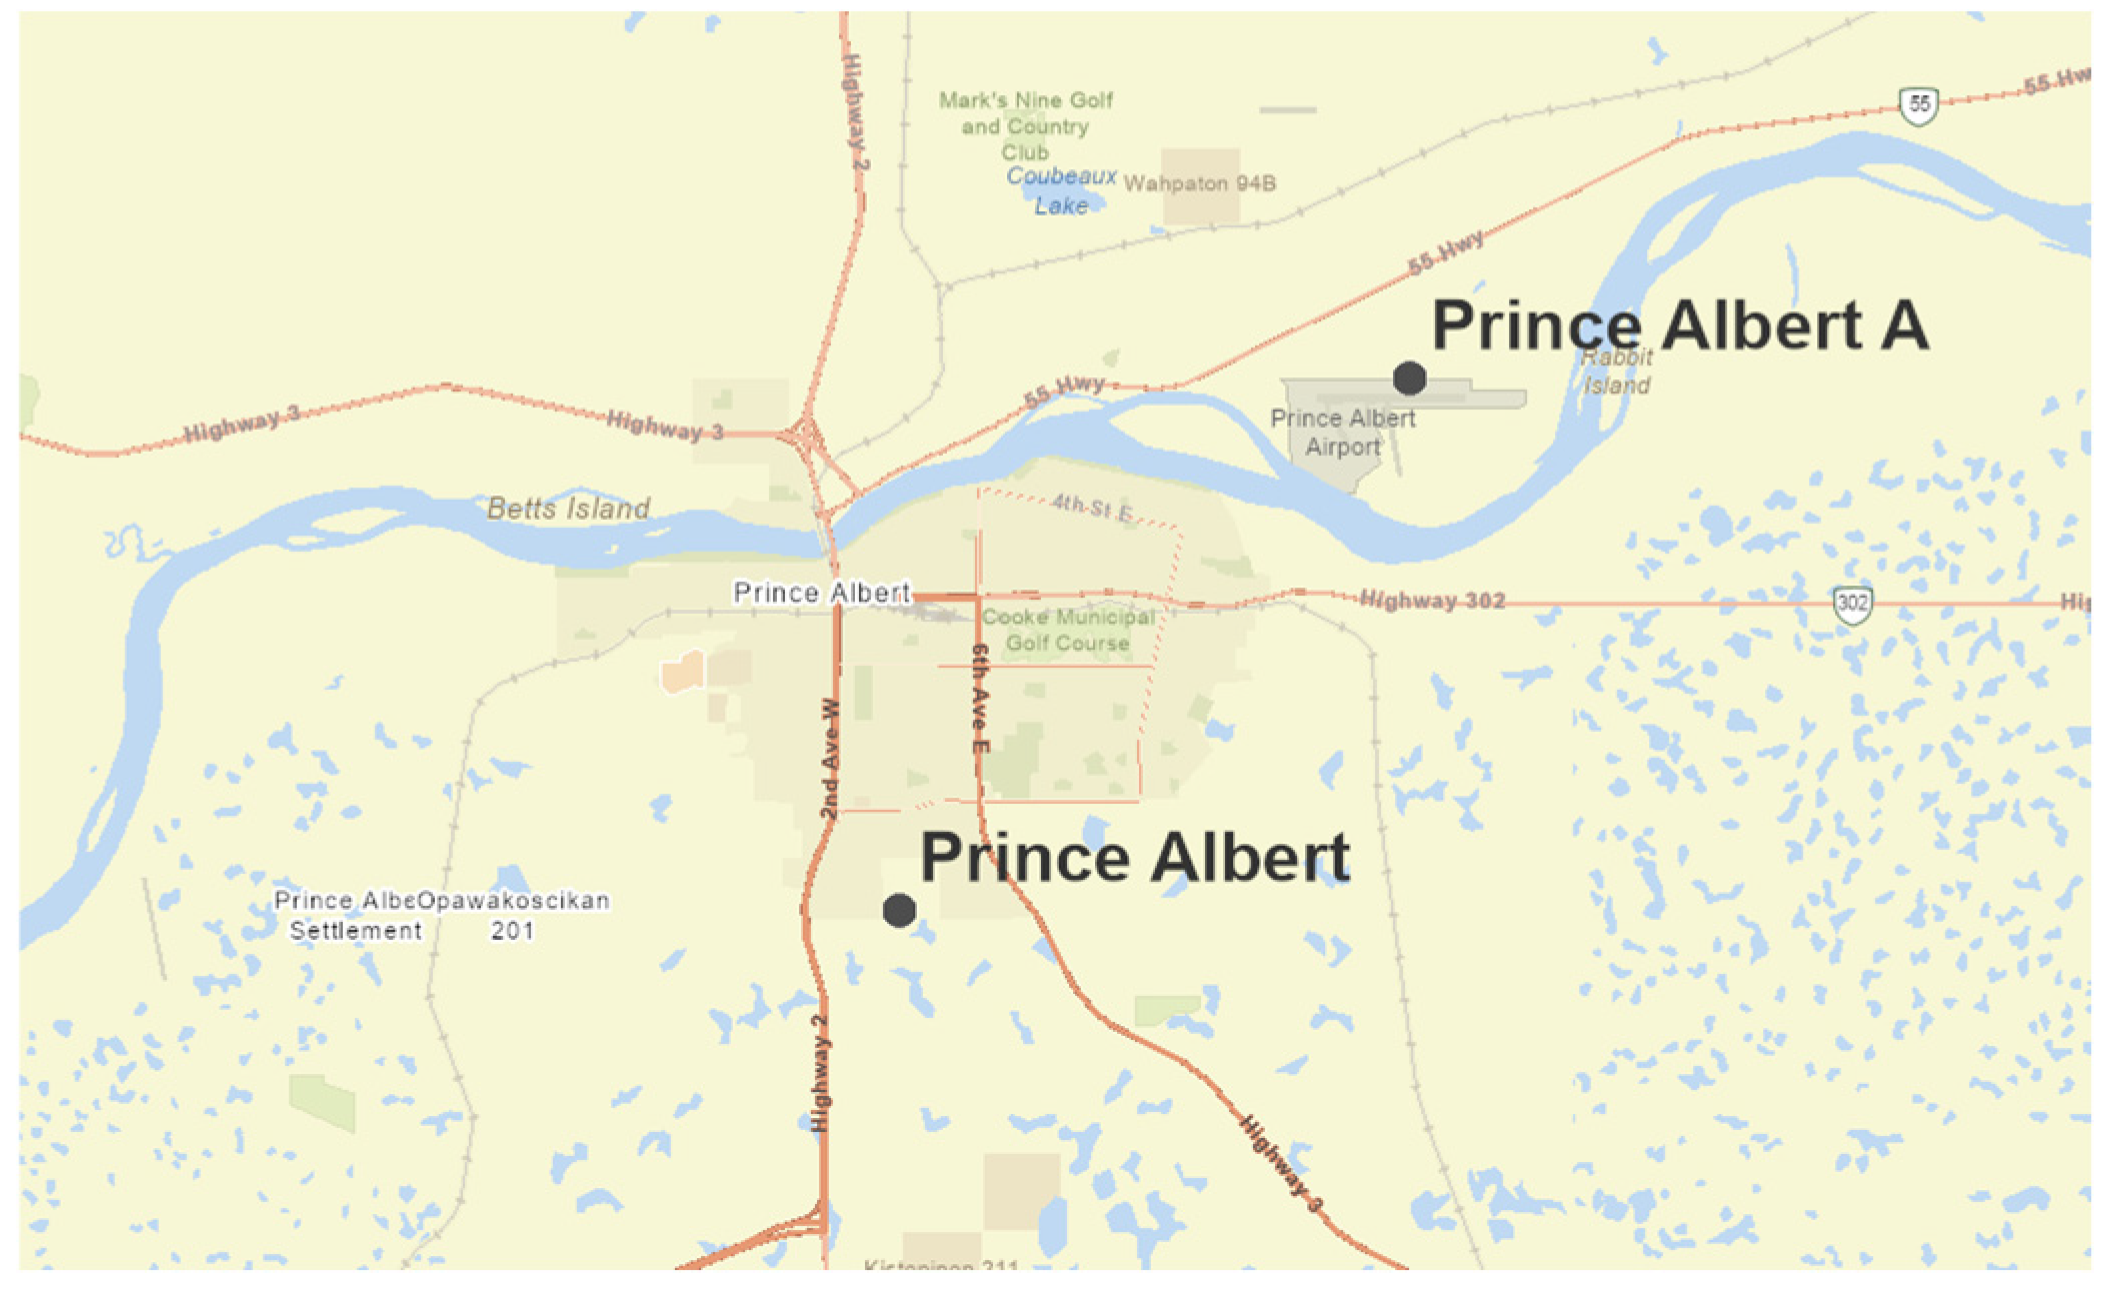
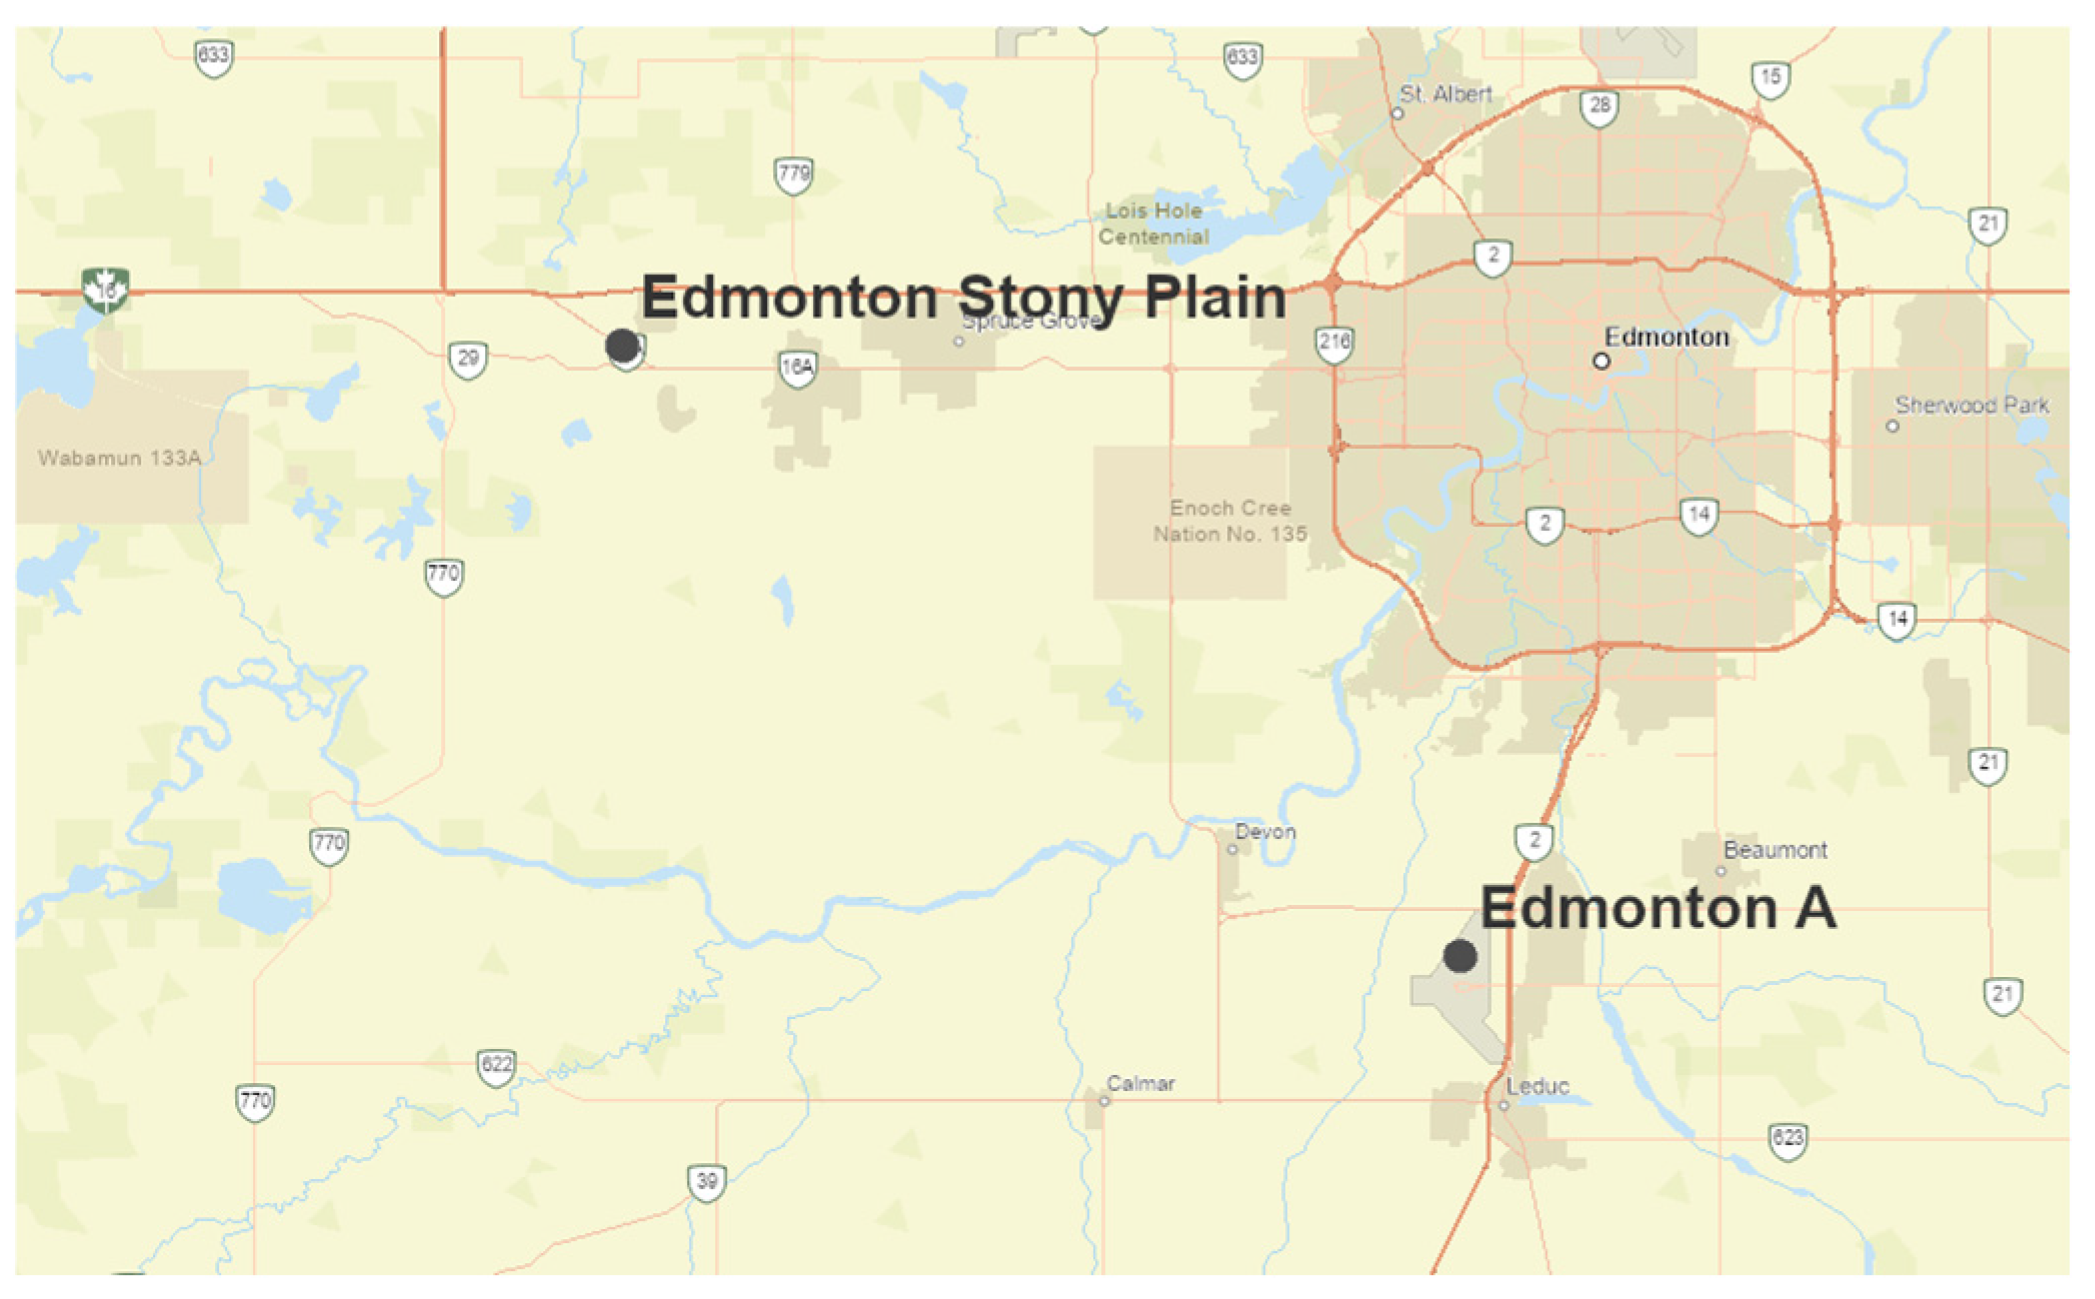
For five locations, we can make a direct comparison of the airport and non-airport locations (Gimli, Flin Flon, Regina, Prince Albert, Edmonton). This provides an opportunity to examine further the nature of airport climates that were first identified in [8] using day-to-day thermal metrics. In Table 3, we report the aggregated airport/non-airport averages and the results of the t-test. Only RΔTmin showed a statistically significant difference between the airports and non-airports consistent with [8]. Of the pairs, Gimli and Edmonton were both peri-urban. The other three non-airport stations were either urban (Regina) or rural (Flin Flon, Prince Albert), so it is understandable that ΔDTD and DTDTmin, which are used to sort between urban and rural, were not statistically different between the two groups. The peri-urban nature of the airport locations is clear across three landform types: rural, urban, and peri-urban. For both locations in which both airport and non-airport are peri-urban, the airport had a stronger peri-urban signal (RΔTmin). Other than this, the analysis does not provide any definitive insight into differences, if any, between peri-urban climates produced at airports and those not produced at non-airports. As noted above, the Edmonton case was strongly influenced by the proximity of a major highway and its expansion. We explore the pairs of locations further by providing higher-resolution maps of these specific locations (Figure 5, Figure 6, Figure 7, Figure 8 and Figure 9).
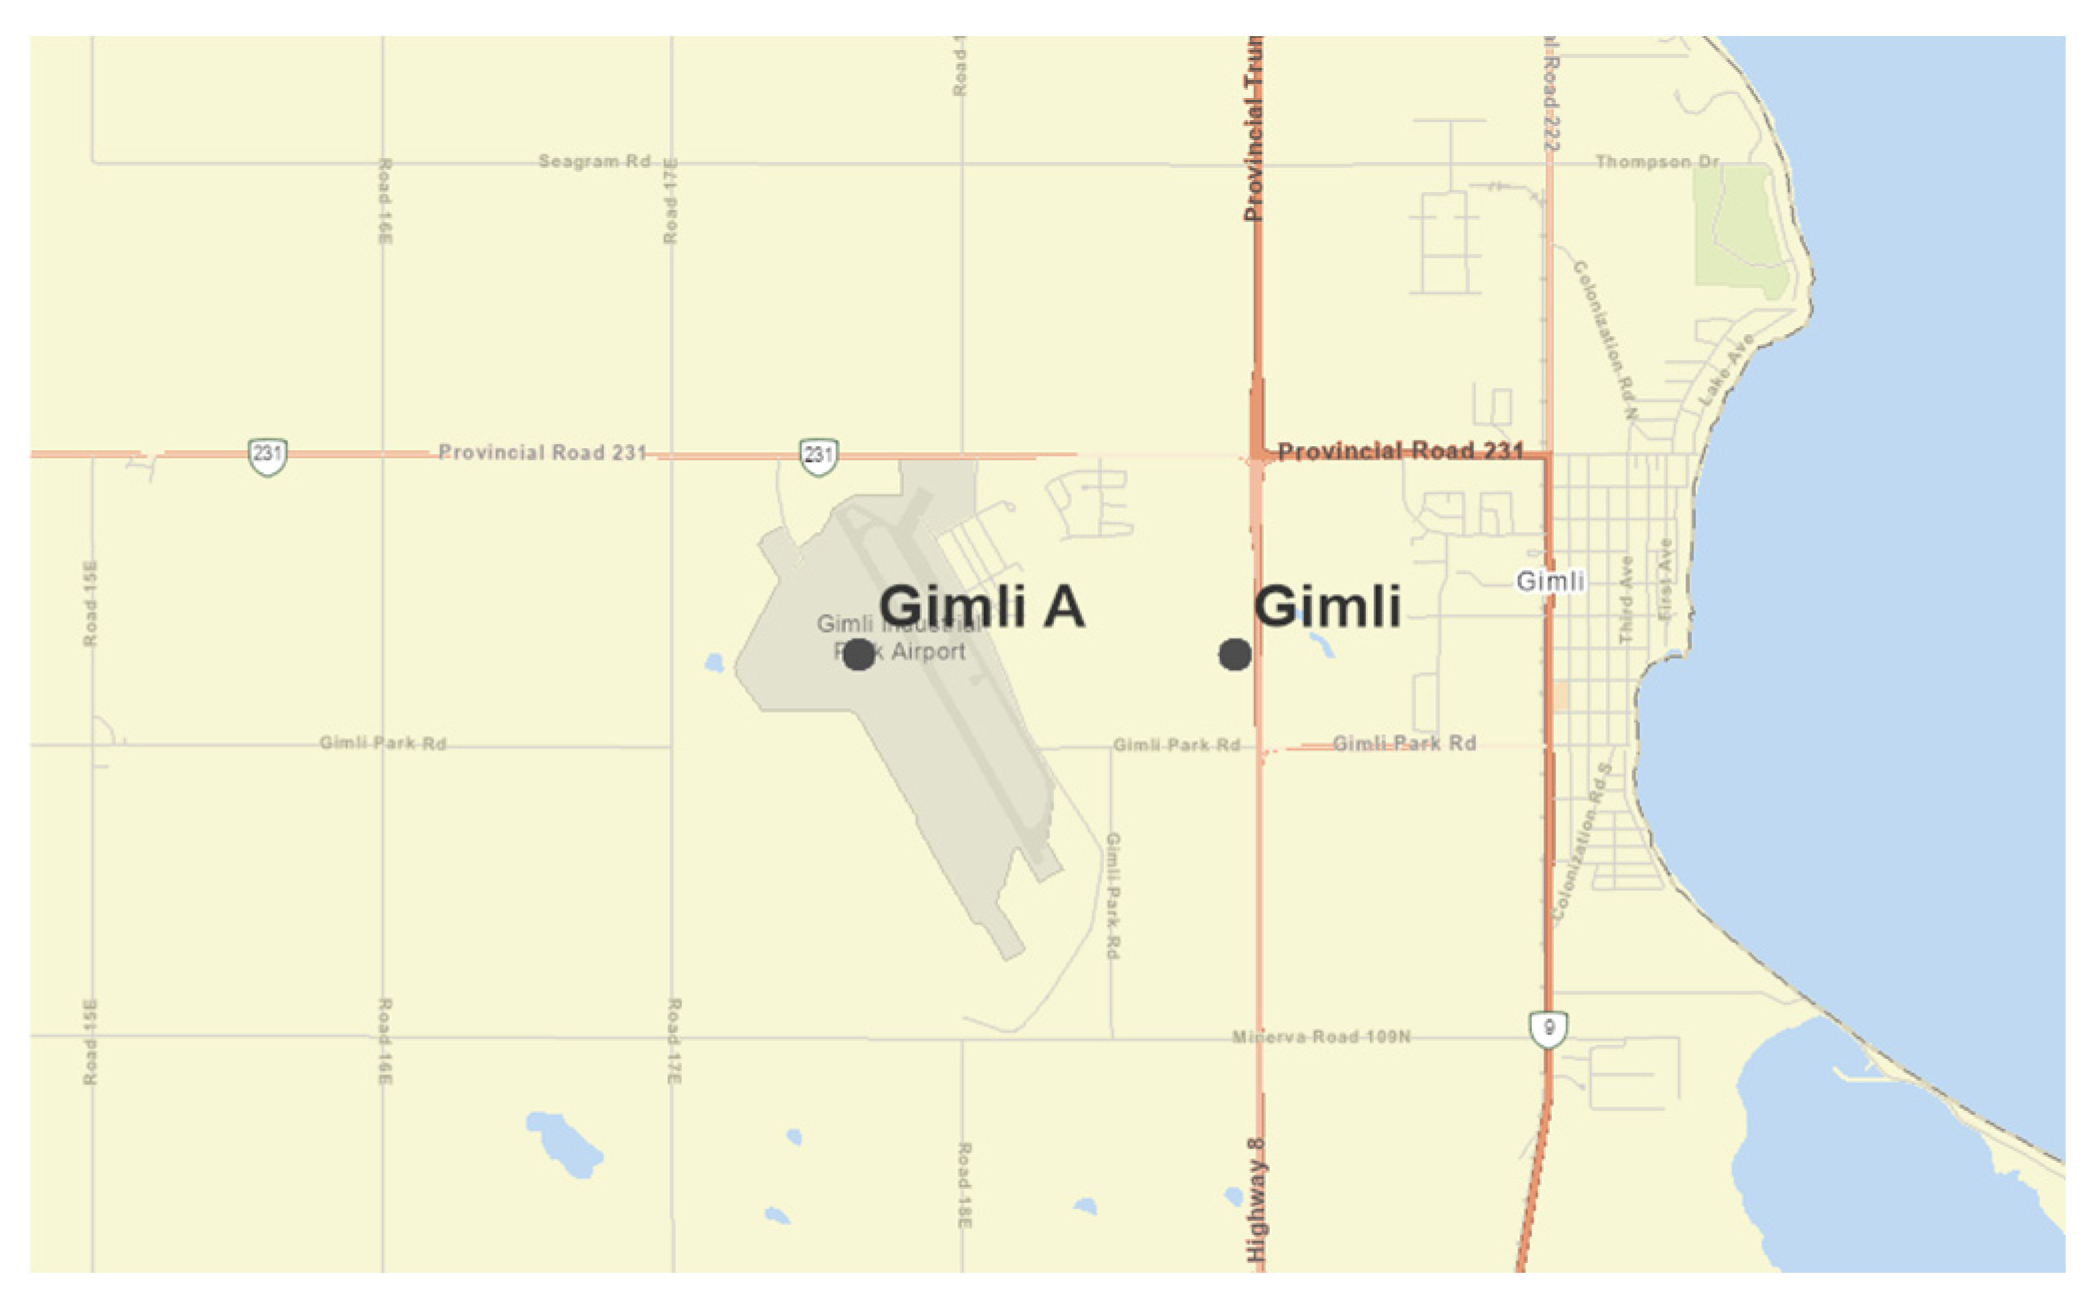
Figure 5 shows the two Gimli stations. The town of Gimli (population: 6600) is located on the western shore of Lake Winnipeg in Manitoba. The two stations are located west of the town of Gimli, 2 km from the shore, and Gimli A, 4 km from the shore. The marine influence was found to fall off rapidly with distance from the shore in [11], and this is the case with Gimli with ADTDTmin well above the threshold of 2.35. The Gimli station is located at the western edge of the town, consistent with the peri-urban classification. As indicated in the diagram, the station is close to a provincial highway and this was found to contribute to a peri-urban classification for Edmonton Stony Plain (see above).
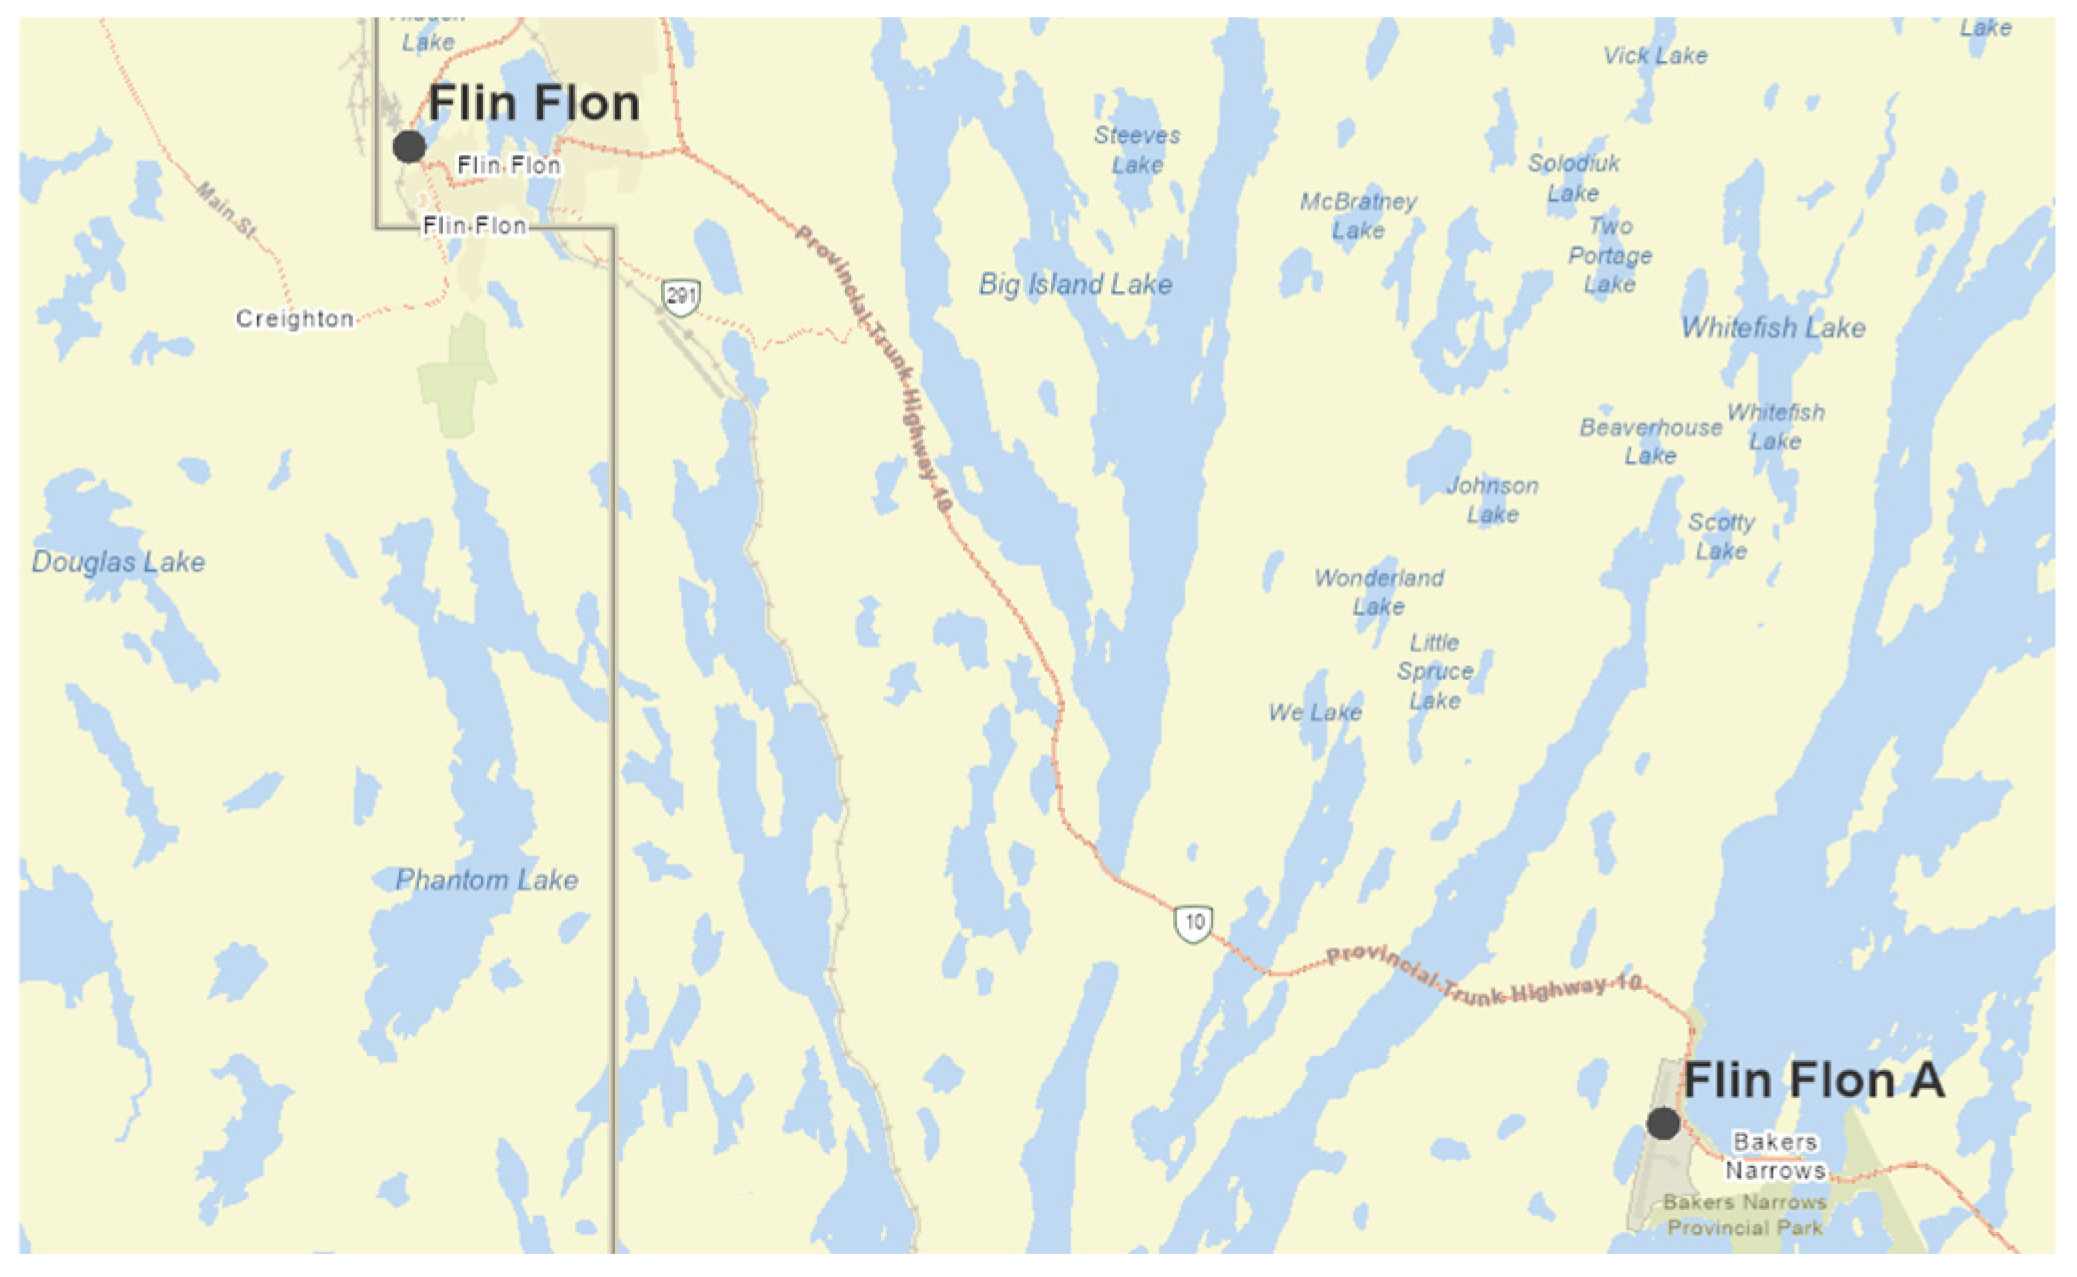
The Flin Flon Airport (Flin Flon A) is located 15 km (Figure 6) southeast of the town of Flin Flon (population: 5200). The Flin Flon climate station is located at the north end of the town, consistent with the rural climate classification. Although the Flin Flon A is near a lake, Lake Athapapuskow, the marine influence was not detected, with ADTDTmin well above the 2.35 threshold (3.28).
Figure 7 shows the two Regina stations. The stations are approximately 6 km apart. The airport is located to the southwest of the city. The University of Regina (Regina University) is located in the southeast part of the city (population: 226,000). This station is classified as urban with ΔDTD above the 0.2 threshold (0.29) and the RΔTmin below the peri-urban threshold of 1.05 (1.03). In contrast, the Regina (Regina A) has an RΔTmin of 1.13, well above the peri-urban threshold.
The two Prince Albert stations are shown in Figure 8. The two stations are about 8 km apart, with Prince Albert A (the airport) located northwest of Prince Albert (population: 38,000) and the Prince Albert climate station located south of the city. This station has a ΔDTD of −0.19, well below the urban threshold of 0.20 and, thus, is classified as a rural station.
Figure 9 displays the Edmonton pair of stations, Edmonton Stony Plain and Edmonton A (airport). Both are classified as peri-urban, and both are located some distance from the city of Edmonton. Edmonton Stony Plain is 40 km to the west of Edmonton and Edmonton A, about 25 km south of the city. The evolution of the climate at Edmonton Stony Plain was explored above (Figure 4) and linked to the proximity of a major highway, 16A, which clearly contributes to the peri-urban nature of the climate. Edmonton A is located well south of the city and not in the urban fringe as was the case for Regina and Prince Albert. It is an unambiguous case of an airport generating a peri-urban climate (similar to Flin Flon and Gimli).

3.4. Marine/Island

Island climates were identified using these metrics for the first time outside of Ontario [11]. These were Bachelor’s Island (MB), George Island (MB), Egg Island (AB), and Beartooth Island (SK). These four are located on large bodies of water: Lake Winnipegosis for Bachelor’s Island, Lake Winnipeg for George Island, and Lake Athabasca for both Egg Island and Beartooth Island (Figure 2). Of these, with the exception of Bachelor’s Island, there were no pairings with local shore stations. Winnipegosis was the nearest shore climate station to Bachelor’s Island. While Bachelor’s Island was identified as having an island climate, this was not the case for Winnipegosis (peri-urban), located about 1 km from the Lake. This is consistent with the focal area analysis for the Great Lakes examined in [11] that showed the marine influence dropping off rapidly with distance from the water body.
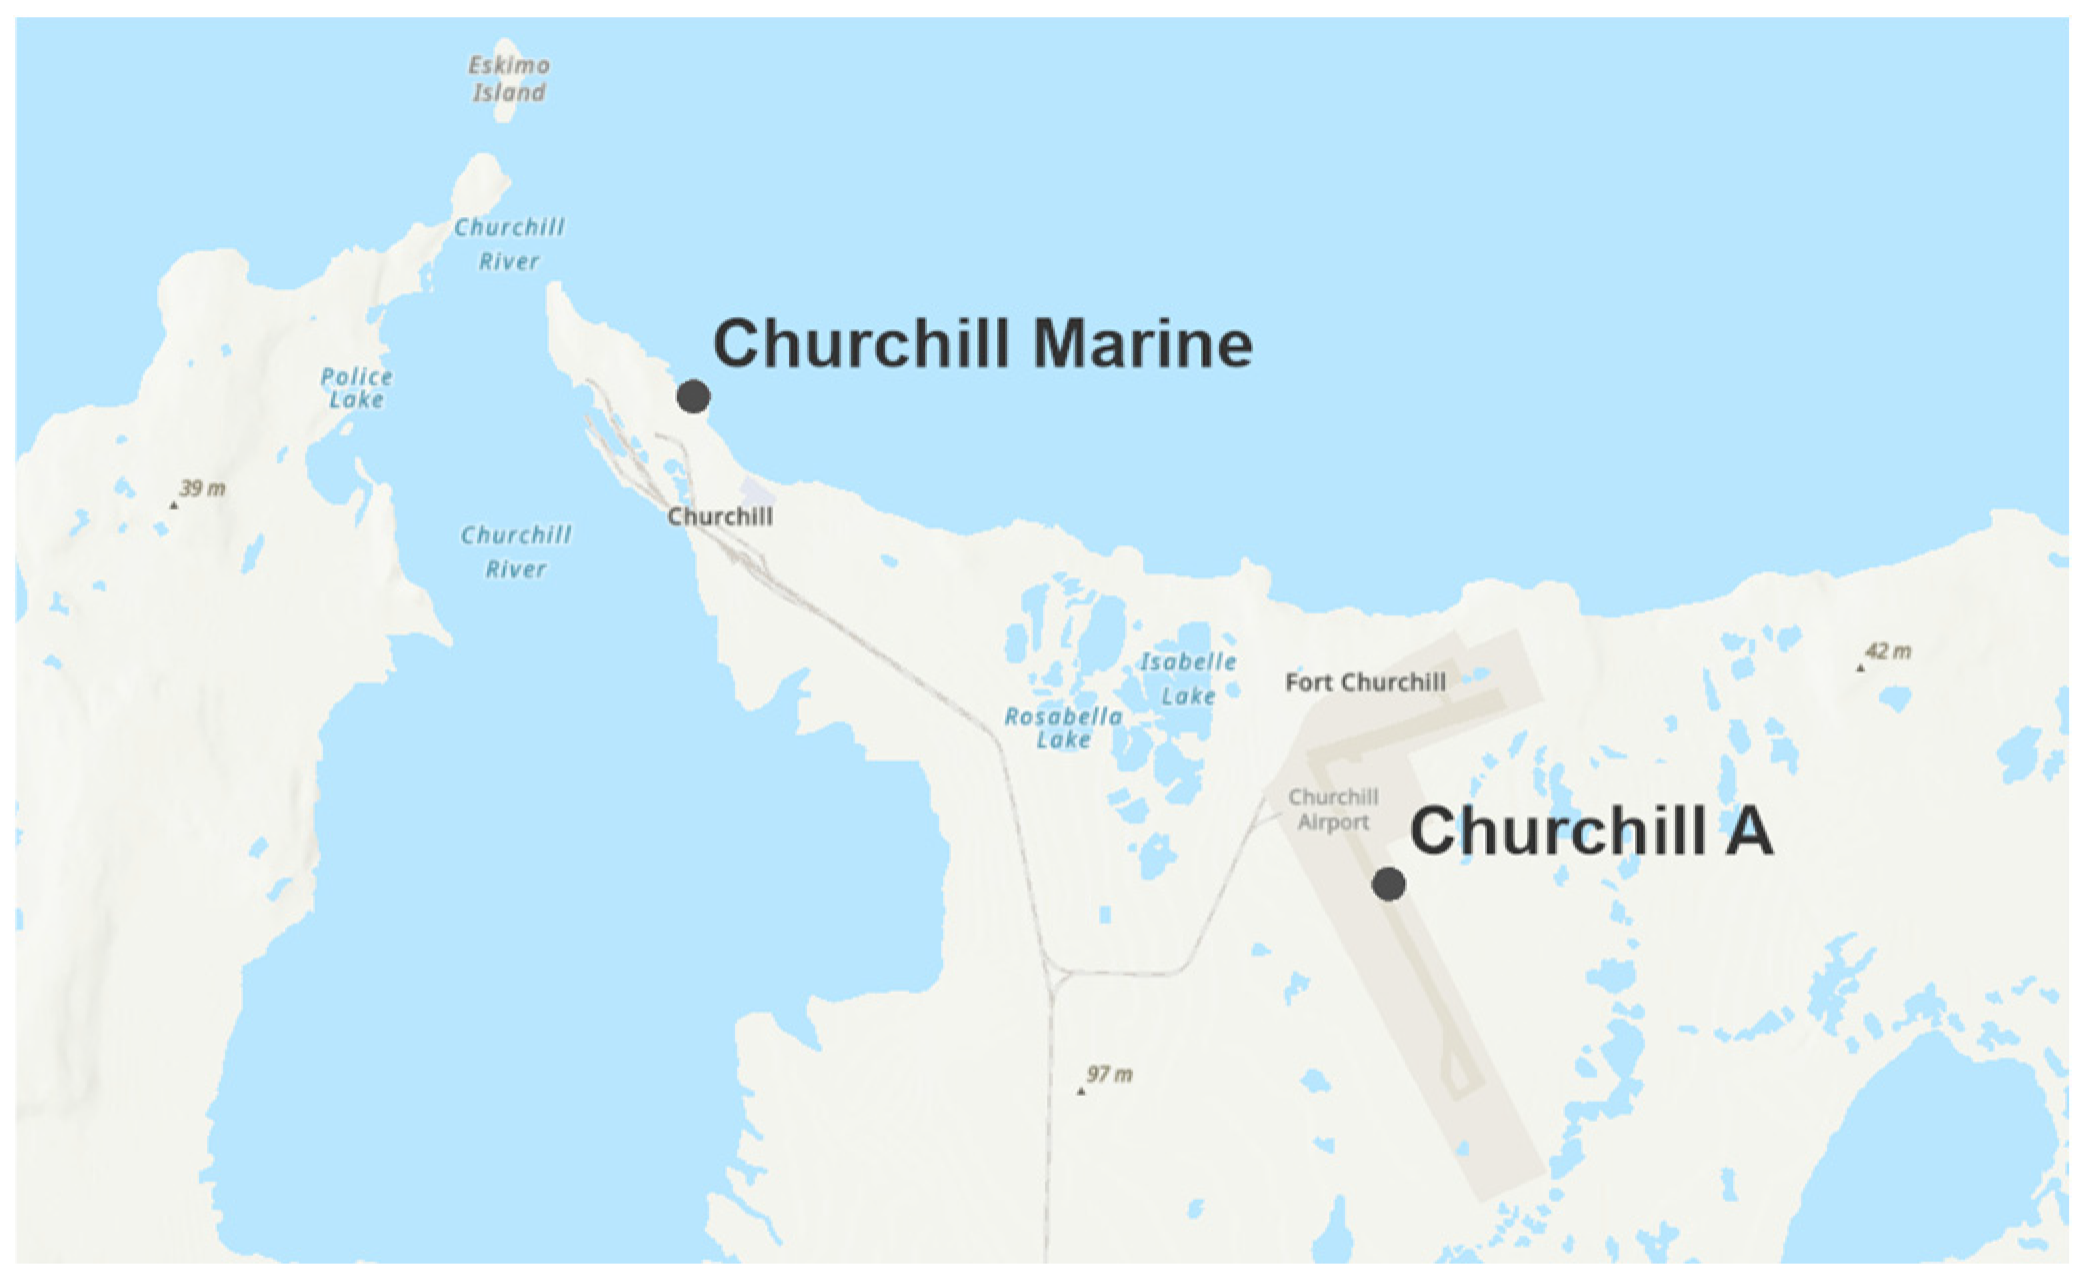
A marine classification also occurred for the two Churchill, Manitoba stations (Figure 10). As noted above, the marine nature only became apparent when the “winter” months were expanded to match the timing of sea ice in Hudson Bay [30], that is, including November, March, April, and May. This was detected at both Churchill Marine and Churchill A even though the airport station was located 2 km inland. The vastness of Hudson Bay and the low relief (Churchill A has an elevation of 30 m) likely accounts for the penetration of the marine influence, as was found for coastal stations for the Atlantic and Pacific Oceans [9,10] but not found for stations like Gimli and Winnipegosis which are similar distances from smaller bodies of water, as was the case for the Great Lakes [11]. This also may have application in determining the presence of sea ice in Hudson Bay, particularly for the time period prior to satellite reconnaissance (before 1971), building on other earlier attempts using temperature variation [30].

3.5. Mountain

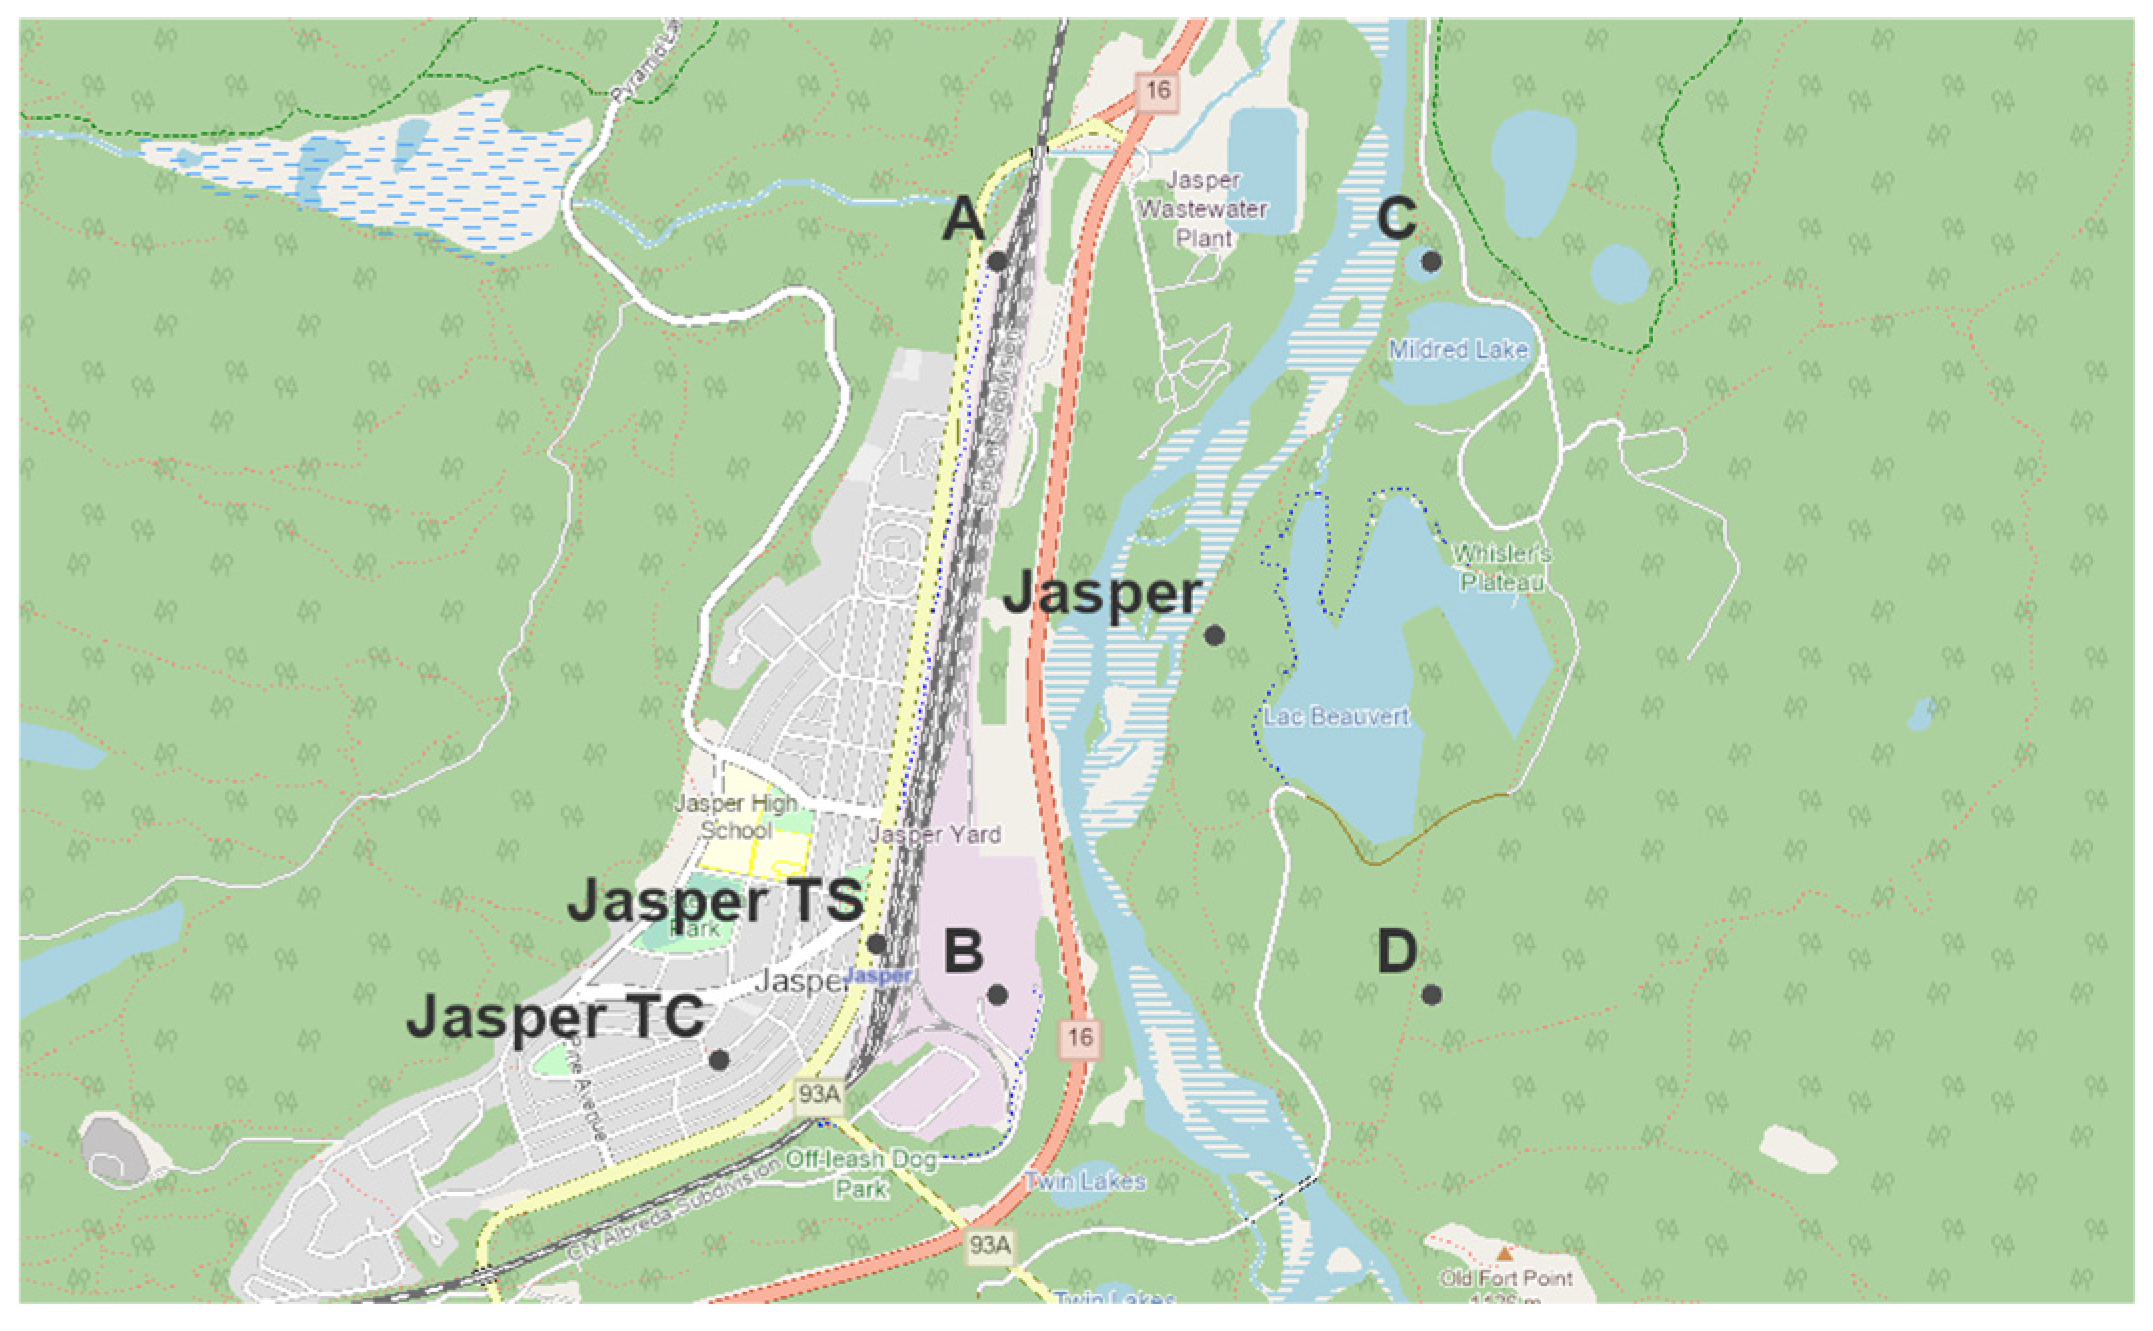
Four stations in the Rocky Mountains were part of the 31 stations studied. Of these, Rocky Mountain House A, an airport, was expected to be peri-urban and this proved to be the case. Lake Louise and Banff (Figure 11 and Figure 12) were classified as mountain, although they were at the DTDTmin 3.20 threshold. For both these locations, the stations are situated in a valley flanked by mountains, as was the case for those identified in [8] with the diurnal production of winds, which serve to erase climate memory. These orographic conditions are also in place for Jasper (Figure 13), and so it was contrary to the expectation that this station was labelled as peri-urban. The location is not an airport. Additional data are available for Jasper, a decadal analysis was performed for the 1940s to the 1980s, and RΔTmin is plotted for this time series in Figure 14. For the 1940s and 1950s, the station was below the threshold for peri-urban (<1.05) and was classified as “rural”. From the 1960s onwards, the peri-urban threshold was exceeded (1960s, 1970s, 1980s). Using the coordinates provided by the data archive, the station appears to be located to the east of the Athabasca River, whereas the town of Jasper is on the western side of the river. The coordinates provided have a precision to the nearest minute and report zero seconds, unlike many other climate stations. Assuming the coordinates were rounded off to the nearest minute, points A, B, C, D are plotted in Figure 14. This range of locations allows for the station to be located on the west bank of the Athabasca. Given that this is not an automated station and it requires daily observation and recording, location B seems the most likely (near the train station, Jasper TS, in Figure 13). The location is key to understanding the change in RΔTmin that occurred in the 1960s. In addition to the railway being near B, the Yellowhead Highway (#16) is in close proximity to both A and B. During the 1960s, the Yellowhead Highway was constructed and officially opened in 1970. Thus, Jasper may be in a similar situation to Edmonton Stony Plain in the late 1990s. The peri-urban classification is likely the result of the developing transportation infrastructure and its close proximity to the climate station. Once again, this emphasizes the importance of the location of climate stations and the ability of these metrics to detect and quantify such effects. This may form the foundation for assessing time series and assist in homogenizing temperature time series [31,32,33].

4. Discussion

In this work, a climate classification developed as a decision tree in [8] was applied to 31 climate stations in the Canadian Prairie provinces of Alberta, Saskatchewan, and Manitoba. The decision tree performed well and bodes well for application to other regions. All climate classifications were found in the Prairies: rural, urban, peri-urban, marine, island, airport, and mountain. Island climates, for the first time, were found outside of Ontario [11]. Mountain climates were found for the first time outside of British Columbia [8]. The presence of airport climates, as peri-urban climates, was affirmed consistently for all airport climate station time series examined in the Prairies. Other than the tendency for airport climates to have a stronger peri-urban signal (RΔTmin) than those not coming from an airport location, no other insights were gained, and no proposal for a metric or combination of metrics to distinguish between these two types of peri-urban climates is being brought forward.
A few misclassifications served to provide greater insights into the relevant climate type and potential areas of exploration. Churchill A, for example, had marine characteristics if the “winter” season was extended to match the seasonality of the sea ice distribution in Hudson Bay [9,30]. This leads to the interesting possibility of using the marine metric to identify the ice-free season in Hudson Bay and enable the sea ice climatology to extend before the availability of satellite reconnaissance (1971) [30].
For two locations, the unexpected peri-urban classifications (Edmonton Stony Plain, Jasper) were likely the result of the development of highway infrastructure in close proximity, clearly evident with statistically significant differences between the period pre- and post-development periods for the peri-urban metric, RΔTmin. This result emphasizes the importance of siting climate stations appropriately away from confounding influences. This leads to the potential application of these thermal metrics to the assessment of the time series consistency of the local environment for climate stations and the feasibility and perils of merging climate station records in temperature homogenization projects [32,33].

Author Contributions

Conceptualization, W.A.G. and Z.L.; methodology, W.A.G.; validation, W.A.G. and Z.L.; formal analysis, W.A.G. and Z.L.; investigation, W.A.G. and Z.L.; resources, W.A.G.; data curation, W.A.G. and Z.L.; writing—original draft preparation, W.A.G.; writing—review and editing, W.A.G. and Z.L.; supervision, W.A.G.; project administration, W.A.G.; funding acquisition, W.A.G. All authors have read and agreed to the published version of the manuscript.

Funding

This research was funded by Natural Sciences and Engineering Research Council (NSERC), RGPIN-2018-06801.

Institutional Review Board Statement

Not applicable.

Informed Consent Statement

Not applicable.

Data Availability Statement

Data used in this study are available from the Canadian Historical Climate data archived by Environment and Climate Change Canada, https://climate.weather.gc.ca/historical_data/search_historic_data_e.html (accessed 10 May 2024).

Conflicts of Interest

The authors declare no conflict of interest.

References

  1. Gough, W.A. Theoretical considerations of day-to-day temperature variability applied to Toronto and Calgary, Canada data. Theor. Appl. Climatol. 2008, 94, 97–105. [Google Scholar] [CrossRef]
  2. Karl, T.R.; Knight, R.W.; Plummer, N. Trends in high frequency climate variability in the twentieth century. Nature 1995, 377, 217–220. [Google Scholar] [CrossRef]
  3. Tam, B.Y.; Gough, W.A.; Mohsin, T. The impact of urbanization on day-to-day temperature variation. Urban Clim. 2015, 12, 1–10. [Google Scholar] [CrossRef]
  4. Bonacci, O.; Roje-Bonacci, T.; Vrsalovic, A. The day-to-day temperature variability method as a tool for urban heat island analysis: A case of Zagreb-Gric Observatory (1887–2018). Urban Clim. 2022, 45, 101281. [Google Scholar] [CrossRef]
  5. Gough, W.A. Thermal signatures of peri-urban landscapes. J. Appl. Meteorol. Climatol. 2020, 59, 1443–1452. [Google Scholar] [CrossRef]
  6. Piskala, V.; Huth, R. Asymmetry of day-to-day temperature changes and its causes. Theor. Appl. Climatol. 2020, 140, 683–690. [Google Scholar] [CrossRef]
  7. Barlag, A.-B.; Kuttler, W. The significance of country breezes in urban planning. Energy Build. 1990, 15, 291–297. [Google Scholar] [CrossRef]
  8. Gough, W.A.; Leung, A.C.W. Do airports have their own climate? Meteorology 2022, 1, 171–182. [Google Scholar] [CrossRef]
  9. Gough, W.A.; Shi, B. Impact of coastalization on day to day temperature variability along China’s east coast. J. Coast. Res. 2020, 36, 451–456. [Google Scholar] [CrossRef]
  10. Gough, W.A. Thermal metrics for identifying Canadian coastal environments. Coasts 2022, 2, 93–101. [Google Scholar] [CrossRef]
  11. Gough, W.A.; Li, Z. Detecting a midlatitude island climate signature in the Great Lakes coastal region of Ontario, Canada. Coasts 2024, 4, 454–468. [Google Scholar] [CrossRef]
  12. Wu, F.-T.; Fu, C.; Qian, Y.; Gao, Y.; Wang, S.-Y. High frequency daily temperature variability in China and its relationship to large scale circulation. Int. J. Climatol. 2017, 37, 570–582. [Google Scholar] [CrossRef]
  13. Wang, X.; Wu, G.; Qin, Y. Day-to-day temperature variability in China during the last 60 years relative to the Arctic Oscillation. Earth Space Sci. 2022, 9, e2022EA002587. [Google Scholar] [CrossRef]
  14. Bonacci, O.; Bonacci, D.; Roje-Bonacci, T. Different air temperatures changes in continental and Mediterranean regions: A case study from two Croation stations. Theor. Appl. Clim. 2021, 145, 1333–1346. [Google Scholar] [CrossRef]
  15. Li, S.-F.; Jiang, D.-B.; Lian, Y.; Yao, Y.-X. Trends in day-to-day variability of surface air temperature in China during 1961–2012. Atmos. Ocean. Sci. Lett. 2017, 10, 122–129. [Google Scholar] [CrossRef]
  16. Tong, X.; Wang, P.; Wu, S.; Luo, M. Urbanization effects on high frequency temperature variability over South China. Urban Clim. 2022, 42, 101092. [Google Scholar] [CrossRef]
  17. Zhou, X.; Wang, Q.; Yang, T. Decreases in days with sudden day-to-day temperature change in a warming world. Glob. Planet. Chang. 2020, 192, 103239. [Google Scholar] [CrossRef]
  18. Przybylak, R.; Singh, G.; Wyszynski, P.; Arazny, A.; Chmist, K. Air temperature changes in SW Greenland in the second half of the 18th century. Clim. Past 2024, 20, 1451–1470. [Google Scholar] [CrossRef]
  19. Liu, Q.; Fu, C.; Xu, Z. Revisiting two indices measuring high frequency daily variability. Int. J. Climatol. 2024, 44, 2792–2807. [Google Scholar] [CrossRef]
  20. Xu, Z.; Hu, W.; Tong, S. Temperature variability and childhood pneumonia: An ecological study. Environ. Health Glob. Access Sci. Source 2014, 13, 51. [Google Scholar] [CrossRef]
  21. Onozuka, D.; Hagihara, A. Associations of day-to-day temperature change and diurnal temperature range with out-of-hospital cardiac arrest. Eur. J. Prev. Cardiol. 2017, 24, 204–212. [Google Scholar] [CrossRef] [PubMed]
  22. Hovdahl, I. The deadly effect of day-to-day temperature variation in the United States. Environ. Res. Lett. 2022, 17, 104031. [Google Scholar] [CrossRef]
  23. Savic, S.; Arsenovic, D.; Luzanin, Z.; Milosevic, D.; Dunjic, J.; Secerov, I.; Kojic, M.; Radic, I.; Harhaji, S.; Arsic, M. Hospital admission tendencies caused by day-to-day temperature changes during summer: A case study for the city of Novi Sad (Serbia). Int. J. Biometeorol. 2023, 67, 695–704. [Google Scholar] [CrossRef] [PubMed]
  24. Liu, Q.; Tan, Z.M.; Sun, J.; Hou, Y.; Fu, C.; Wu, Z. Changing rapid weather variability increases influenza epidemic risk in a warming climate. Environ. Res. Lett. 2020, 15, 044004. [Google Scholar] [CrossRef]
  25. Guo, Y.; Barnett, A.G.; Yu, W.; Pan, X.; Ye, X.; Huang, C.; Tong, S. A large change in temperature between neighbouring days increases the risk of mortality. PLoS ONE 2011, 6, e16511. [Google Scholar] [CrossRef] [PubMed]
  26. Kotz, M.; Wenz, L.; Stechemesser, A.; Kalkuhl, M.; Levermann, A. Day-to-day temperature variability reduces economic growth. Nat. Clim. Chang. 2021, 11, 319–325. [Google Scholar] [CrossRef]
  27. Kinsenmeier, M. Temperature variability and long-run economic development. J. Environ. Econ. Manag. 2023, 121, 102840. [Google Scholar] [CrossRef]
  28. Pannell, C.W. Peri-urbanism in globalizing China: A critique. Eurasian Geogr. Econ. 2006, 47, 54–57. [Google Scholar] [CrossRef]
  29. Sorensen, A. Periurbanization as the institutionalization of place: The case of Japan. Cities 2016, 53, 134–140. [Google Scholar] [CrossRef]
  30. Hochheim, K.P.; Barber, D.G. An Update on the Ice Climatology of the Hudson Bay System. Arct. Antarct. Alp. Res. 2014, 46, 66–83. [Google Scholar]
  31. Vincent, L.A.; Wang, X.L.; Milewska, E.J.; Wan, H.; Yang, F.; Swail, V. A second generation of homogenized Canadian monthly surface air temperature for climate trend analysis. J. Geophys. Res. Atmos. 2012, 117, D18110. [Google Scholar] [CrossRef]
  32. Vincent, L.A.; Milewska, E.J.; Wang, X.L.; Hartwell, M.M. Uncertainty in homogenized daily temperature and derived indices of extremes illustrated using parallel observations in Canada. Int. J. Climatol. 2018, 38, 692–707. [Google Scholar] [CrossRef]
  33. Vincent, L.A.; Hartwell, M.M.; Wang, X.L. A third generation of homogenized temperature for trend analysis and monitoring change in Canada’s climate. Atmos. -Ocean 2020, 58, 173–191. [Google Scholar] [CrossRef]
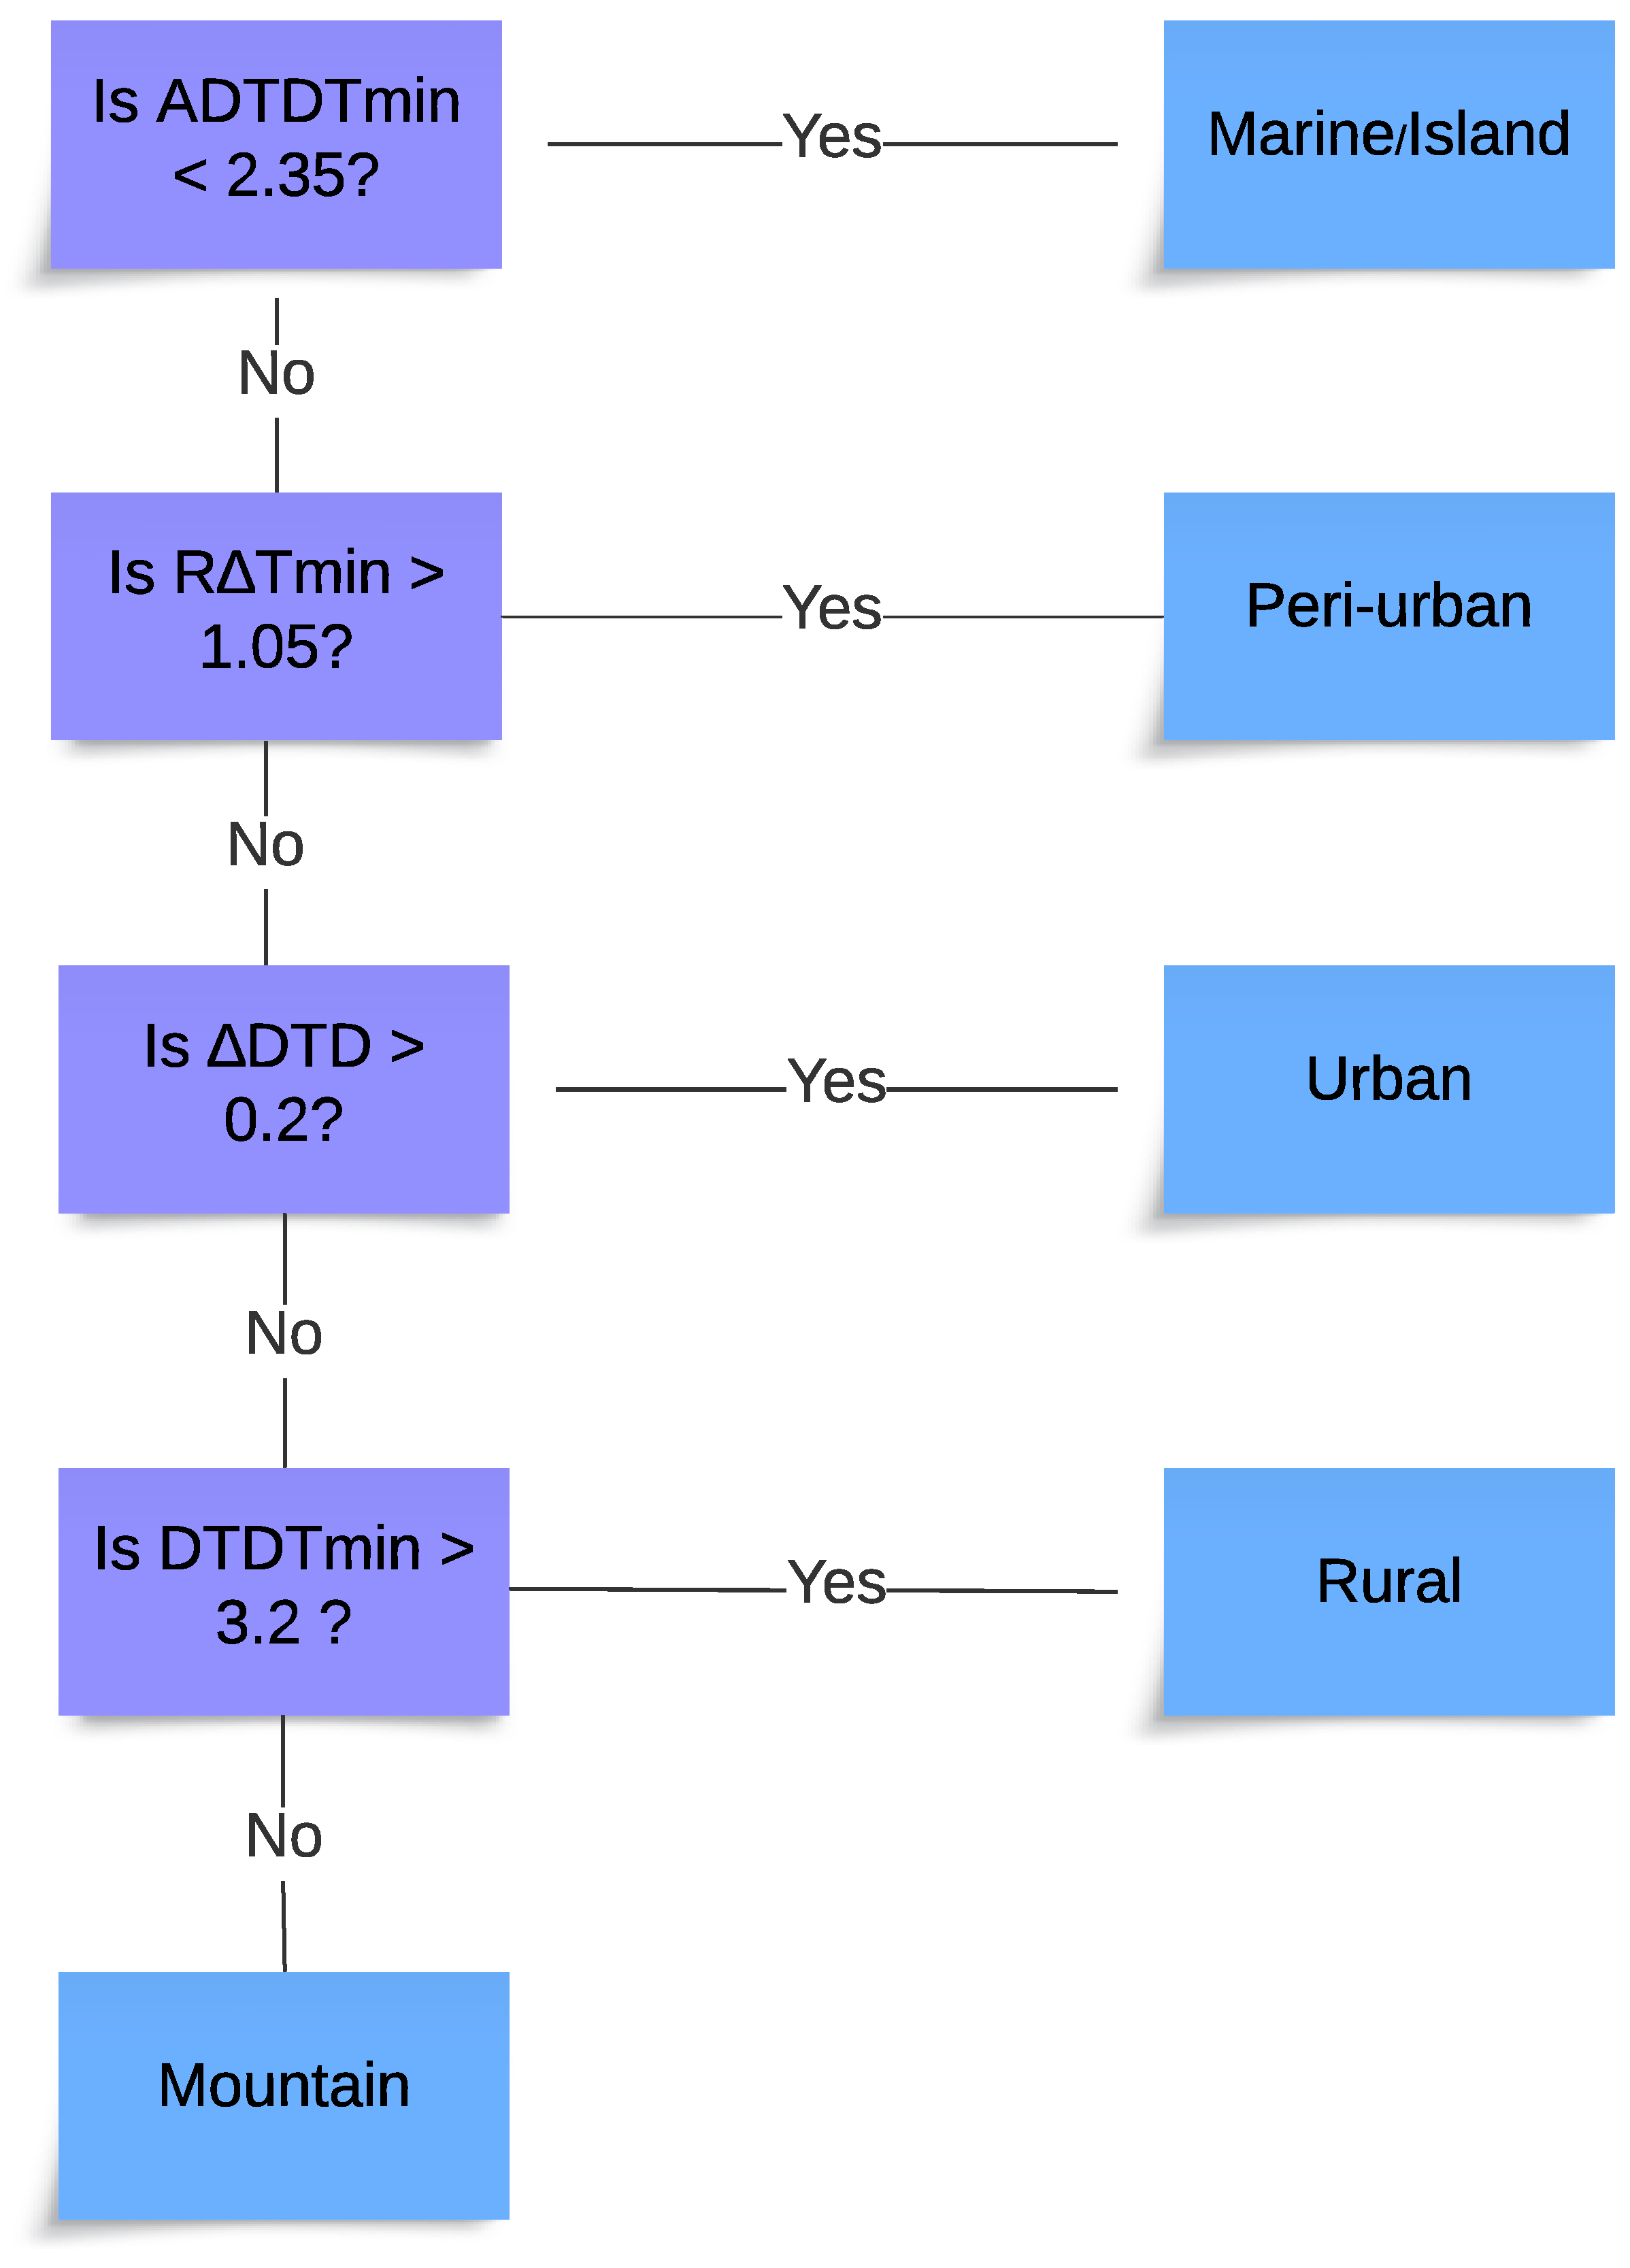
Figure 1. Thermal metrics decision tree developed in [8].
Atmosphere 15 01111 g001
Figure 2. Map of 31 Stations used in this study in the Canadian provinces of Alberta, Saskatchewan, and Manitoba.
Atmosphere 15 01111 g002
Figure 3. The 31 stations plotted by classification type (colour) and as a function of RΔTmin. Blue represents marine and island stations (dark blue for marine and lighter blue for island). Darker orange are peri-urban climates, not at airports, and lighter orange are peri-urban climates at airports. Green designates rural climates, and red denotes urban climates. Purple signifies a mountain classification.
Atmosphere 15 01111 g003
Figure 4. RΔTmin for Edmonton Stony Plain, decadal average from the 1970s to the 2010s. Blue indicates below the peri-urban threshold and red indicates above the peri-urban threshold.
Atmosphere 15 01111 g004
Figure 5. Gimli and Gimli A. Scale 1:50,000.
Atmosphere 15 01111 g005
Figure 6. Flin Flon and Flin Flon A. Scale 1:15,000.
Atmosphere 15 01111 g006
Figure 7. Regina A and Regina University. Scale 1:30,000.
Atmosphere 15 01111 g007
Figure 8. Prince Albert and Prince Albert A. Scale 1:25,000.
Atmosphere 15 01111 g008
Figure 9. Edmonton Stony Plan and Edmonton A. Scale 1:6000.
Atmosphere 15 01111 g009
Figure 10. Location of Churchill Marine and Churchill A stations. Scale 1:50,000.
Atmosphere 15 01111 g010
Figure 11. Lake Louise. Scale 1:25,000.
Atmosphere 15 01111 g011
Figure 12. Banff. Scale 1:10,000.
Atmosphere 15 01111 g012
Figure 13. Jasper. Jasper TS is the train station. Jasper TC is the town centre. “Jasper” is located at the coordinates provided by the climate data archive. The locations A, B, C, and D define the area in which, given the uncertainty in the coordinates, the station could be located. Scale 1:150,000.
Atmosphere 15 01111 g013
Figure 14. Jasper, 1941–1990, RΔTmin, decadal averaging. Red dots indicate decades above the 1.05 threshold, and blue dots indicate those below the 1.05 threshold.
Atmosphere 15 01111 g014
Table 1. List of 31 climate stations from the Canadian Prairie provinces of Alberta, Saskatchewan, and Manitoba, including latitude, longitude, elevation, and years of record (see also Figure 2). Note “A” indicates an airport. For some stations, a prediction is made on the climate classification based on known characteristics of these stations. Uncertainty in expectation is indicated with “?” for four locations: Winnipegosis, Gimli, Portage La Prairie, and Prince Albert.
StationProvinceLat (N)Long (W)ElevYearsExpected
Winnipeg AManitoba49.9297.25238.72001–2010Peri-urban
WinnipegosisManitoba51.6599.93257.61998–2003?
Island Lake AManitoba53.8394.65235.31983–1992Peri-urban
Bachelor’s IslandManitoba51.7599.9255.91997–2004Marine
George IslandManitoba52.897.63219.51971–1980Marine
GimliManitoba50.6397.02222.81994–2003?
Gimli AManitoba50.6397.05222.21961–1970Peri-urban
Churchill AManitoba58.7494.0729.32011–2020Peri-urban
Churchill MarineManitoba58.7894.1813.41938–1947Marine
Portage La PrairieManitoba49.9898.32261.21981–1990?
Flin FlonManitoba54.77101.88320.02011–2020Rural
Flin Flon AManitoba54.68101.68304.22001–2009Peri-urban
Sandy LakeManitoba50.5100.1624.81991–2000Rural
Regina ASaskatchewan50.43104.67577.61981–1990Peri-urban
Regina UniversitySaskatchewan50.42104.58573.01981–1990Urban
Yorkton ASaskatchewan51.27102.47498.31991–2000Peri-urban
Beartooth IslandSaskatchewan59.22109.7238.01995–2000Marine
EstevanSaskatchewan49.22102.97580.62012–2021Peri-urban
Prince AlbertSaskatchewan53.17105.75436.501931–1940?
Prince Albert ASaskatchewan53.22105.67428.202001–2010Peri-urban
Saskatoon ASaskatchewan52.17106.72504.11991–2000Peri-urban
Calgary AAlberta51.11114.021099.11991–2000Peri-urban
Island Lake SouthAlberta54.82113.54618.72016–2023Peri-urban
Egg IslandAlberta59.98110.44214.92013–2018Marine
BanffAlberta51.18115.571383.71981–1990Mountain
JasperAlberta52.88118.071062.21981–1990Mountain
Rocky Mountain House AAlberta52.43114.92988.21981–1990Peri-urban
CalmarAlberta53.29113.86720.01991–2000Rural
Edmonton AAlberta53.32113.58723.31994–2003Peri-urban
Edmonton Stony Plain CSAlberta53.55114.11766.32011–2020Urban
Lake LouiseAlberta51.43116.221524.01991–2000Mountain
Table 2. Results of the day-to-day temperature analysis for the thirty-one locations for the following metrics: ADTDTmin, RΔTmin, ΔDTD, and DTDTmin. Red highlighted stations show marine (island) characteristics, purple indicates an airport (peri-urban) climate, green identifies rural climates, orange indicates an urban climate, and blue is used for those with mountain characteristics. Black bolding occurring in the sixth column indicates those stations that were characterized as “?” in Table 1. These results are also presented as a function of RΔTmin in Figure 3.
LocationADTDTminRΔTminΔDTDDTDTminClassificationPredictive
Success?
Winnipeg A3.31.19−0.113.63Peri (airport)Yes
Winnipegosis3.061.070.123.39Peri
Island Lake A3.071.270.473.53Peri (airport)Yes
Bachelor’s Island1.971.070.352.37Marine (Island)Yes
George Island1.981.010.811.98Marine (Island)Yes
Gimli3.641.09−0.64.06Peri
Gimli A3.121.220.343.55Peri (airport)Yes
Churchill A1.911.231.432.69MarineNo
Churchill Marine2.31.120.993.18MarineYes
Portage La Prairie2.611.091.142.96Peri
Flin Flon3.00.970.153.44RuralYes
Flin Flon A3.281.08−0.333.73Peri (airport)Yes
Sandy Lake3.501.04−0.393.97RuralYes
Regina A2.941.130.793.33Peri (airport)Yes
Regina University3.31.030.293.83UrbanYes
Yorkton A2.881.170.423.31Peri (airport)Yes
Beartooth Island2.131.10.62.47Marine (Island)Yes
Estevan2.891.160.643.27Peri (airport)Yes
Prince Albert3.490.99−0.193.99Rural
Prince Albert A3.121.19−0.063.52Peri (airport)Yes
Saskatoon A2.981.120.193.51Peri (airport)Yes
Calgary A2.871.1413.19Peri (airport)Yes
Island Lake South3.071.270.473.53Peri (airport)Yes
Egg Island2.281.070.282.78Marine (Island)Yes
Banff2.840.98−0.193.23MountainYes
Jasper2.781.09−0.083.14PeriNo
Rocky Mountain House A2.991.070.523.42PeriYes
Calmar3.051−0.43.46RuralYes
Edmonton A2.981.110.173.27Peri (airport)Yes
Edmonton Stony Plain 2.451.080.752.85PeriNo
Lake Louise2.830.97−0.423.19MountainYes
Table 3. Airport/non-airport pairs comparison. Five pairs are aggregated and tested for statistical significance using a t-test for all four day-to-day thermal metrics, ADTDTmin, RΔTmin, ΔDTD, and DTDTmin. Bolded p value indicates statistical significance (p < 0.05).
ADTDTminRΔTminΔDTDDTDTmin
Airport 3.091.150.183.48
Non-airport3.101.040.083.62
t-test p-value0.970.020.750.57
Disclaimer/Publisher’s Note: The statements, opinions and data contained in all publications are solely those of the individual author(s) and contributor(s) and not of MDPI and/or the editor(s). MDPI and/or the editor(s) disclaim responsibility for any injury to people or property resulting from any ideas, methods, instructions or products referred to in the content.