Abstract
This study introduces an empirical model designed to predict the maximum values of time-dependent data across four turbulence-related fields: hydrogen combustion in renewable energy systems, urban microclimate effects on cultural heritage, shipping emissions, and road vehicle emissions. The model, which is based on the mean, standard deviation, and integral time scale, employs two parameters: a fixed exponent ‘ν’ (0.3) reflecting time scale sensitivity, and a variable parameter ‘b’ that accounts for application-specific uncertainties. Integrated into the Computational Fluid Dynamics (CFD) framework, specifically the Reynolds-Averaged Navier–Stokes (RANS) methodology, the model addresses the RANS approach’s limitation in predicting extreme values due to its inherent averaging process. By incorporating the empirical model, this study enhances RANS simulations’ ability to predict critical values, such as peak hydrogen concentrations and maximum urban wind speeds, which is essential for safety and reliability assessments. Validation against experimental and numerical data across the four fields demonstrates strong agreement, highlighting the model’s potential to improve CFD-RANS predictions of extreme events. This advancement offers significant implications for future CFD-RANS applications, particularly in scenarios demanding fast and reliable maximum value predictions.
1. Introduction
In numerous scientific disciplines, accurately predicting the maximum values of time-dependent data is vital for ensuring the safety and reliability of complex systems. This is particularly critical in fields such as hydrogen combustion in renewable energy systems, the impact of urban microclimates on cultural heritage, shipping emissions, and road vehicle emissions, where extreme events can have severe consequences. Traditional models, particularly those based on the Reynolds-Averaged Navier–Stokes (RANS) equations, often struggle to predict these extremes due to their inherent averaging processes [1,2].
Recent advancements have highlighted the limitations of stochastic models, such as those relying on exponential distributions, in accurately forecasting the maximum values of critical parameters in turbulent systems [3,4]. While exponential distributions are commonly employed to model random delays and fluctuations, their inherent variability can lead to less reliable predictions in certain applications. In response, empirical models have garnered increased attention for their ability to offer more consistent and reliable predictions under specific conditions.
This study introduces a novel empirical model designed to predict maximum values in time-dependent data across four distinct scientific domains. In this study, we refer to Equation (1) as an ‘empirical model’ rather than a ‘deterministic model’. This change in terminology reflects the fact that the model is derived from empirical observations and correlations rather than fundamental physical laws. While the model provides specific predictions based on defined inputs, its foundation lies in the statistical analysis of data rather than in deterministic relationships dictated by physics. This distinction is important for accurately characterizing the nature of the model and its application to various scientific fields where empirical data play a critical role in prediction. The model integrates parameters such as the mean, standard deviation, integral time scale, and two key coefficients: ‘b’ and ‘ν’. The empirical approach is favored over stochastic models like exponential distributions due to its higher precision and consistency in systems where accuracy is paramount. The fixed exponent ‘ν’ at 0.3 reflects the model’s sensitivity to time scale, while the parameter ‘b’ addresses specific uncertainties inherent to each application.
The proposed empirical model marks a significant advancement in predicting maximum values of time-dependent data, distinguishing itself from traditional models that often rely on exponential time derivatives [5]. By fixing the exponent ν at 0.3, the model incorporates time-scale sensitivity, while the parameter b captures application-specific uncertainties. This approach is advantageous as it offers more stable and reliable predictions across various scientific fields, including hydrogen combustion and urban microclimate analysis, where extreme events play a critical role [6,7]. Unlike models based purely on regression data, this model integrates empirical observations with theoretical foundations, offering a robust framework that aligns well with both experimental and numerical findings. The model’s superiority is evident in its ability to enhance the predictive accuracy of CFD-RANS simulations, which traditionally struggle with accurately forecasting extreme values due to their inherent averaging processes. By maintaining consistency in ν and adjusting b according to specific conditions, this model ensures a high degree of adaptability and precision, making it a valuable tool in fields requiring rapid and reliable maximum value predictions.
Previous applications of similar empirical models have demonstrated promise in areas such as predicting individual exposure [8], concentration studies [9], and wind speed estimation in both indoor and outdoor environments [10,11,12,13]. Building on these foundations, this study aimed to validate the model’s applicability across a broader range of scientific challenges, demonstrating its potential to enhance the accuracy of RANS-based simulations. By offering a robust framework for predicting extreme values, the empirical model significantly enhances the predictive capabilities of CFD-RANS methodologies, providing substantial advantages in scenarios where fast and reliable predictions are necessary for safety and reliability analyses.
To address the complex and varied nature of this research, the selected categories were structured to reflect the distinct characteristics of each field. While there may be some conceptual overlap, each category addresses a specific aspect of this study’s objectives, allowing for a more nuanced analysis. This structured approach is essential for thoroughly examining the data and accurately interpreting the results.
2. Methodology
This study employed an empirical model to predict the maximum values Vmax(Δτ) of time-dependent data obtained from both field measurements and numerical simulations across four distinct scientific fields: hydrogen combustion in renewable energy systems, urban microclimate effects on cultural heritage, shipping emissions, and road vehicle emissions. The methodology integrates the following key components.
- 1.
- Empirical Model Formulation:
The empirical model used in this study was designed to predict the maximum value of a variable over a specified time interval Δτ [13]. The model is mathematically expressed as
where
Vmax(Δτ) is the predicted maximum value of the variable V over the time interval Δτ.
is the mean value of the variable.
b is a parameter that encapsulates uncertainties and varies according to the specific conditions of each application.
TV is the integral time scale, which represents the time over which the variable V is significantly correlated with itself.
ν is a fixed exponent, set at 0.3, which reflects the model’s sensitivity to the time scale. The value of this parameter was chosen based on prior research conducted by the author, where this specific value demonstrated its effectiveness in capturing the time-scale sensitivity necessary for accurate predictions. Although these studies cannot be directly cited here, this choice was made to ensure consistency and reliability across different applications within the current study. The fixed value of ν allows the model to maintain a balance between simplicity and predictive accuracy, aligning with the theoretical framework and empirical data used.
Justification of Equation (1): The form of Equation (1) in this study was derived from the foundational work of [8] on the prediction of maximum time-averaged concentrations in turbulent atmospheric conditions. This approach is particularly advantageous because it simplifies the estimation process compared to traditional cumulative distribution function (cdf) models, while also being flexible with respect to the length of the exposure time. Bartzis et al. [8] formulated this model to correlate the maximum time-averaged concentration with the mean concentration, the concentration variance, and the integral time scale of turbulence. The use of a fixed exponent and an adjustable coefficient in the equation allows for the accommodation of varying conditions across different scenarios, which is crucial for accurately predicting extreme values in turbulent environments. The detailed derivation and validation of this model, including the introduction of key parameters, can be found in Bartzis et al.’s study on individual exposure to airborne hazardous releases [8]. Given the robustness of this model, it was adapted in our work to enhance the predictive accuracy of extreme values within the CFD-RANS framework.
- 2.
- Calculation of the Integral Time Scale:
The integral time scale TV is a crucial parameter in the empirical model, calculated using the autocorrelation function RV(τ) of the variable V [14]:
where
RV(τ) is the autocorrelation function, defined as
where
V’(t) represents the fluctuation of V from its mean value at time t.
- 3.
- Selection of Parameters b and ν:
The parameter ν is kept constant at 0.3 throughout this study, following the findings of previous research that demonstrated its effectiveness in capturing the time-scale sensitivity. Parameter b is calibrated based on experimental data and varies depending on the specific application domain (e.g., hydrogen combustion, urban microclimate, etc.) [15]. Calibration is performed by comparing the model’s predictions with observed maximum values from field or experimental data.
- 4.
- Application to Scientific Fields:
The empirical model is applied to four different scientific fields, each with its own unique challenges and data characteristics [16]:
Hydrogen Combustion in Renewable Energy Systems: The model is used to predict the maximum hydrogen concentration in confined spaces, crucial for assessing safety risks in hydrogen storage and utilization.
Urban Microclimate Effects on Cultural Heritage: The model predicts the maximum wind speeds that could contribute to the deterioration of cultural heritage structures in urban environments.
Shipping Emissions: The model estimates the maximum individual exposure to hazardous pollutants released by ships in port cities, contributing to urban air quality management.
Road Vehicle Emissions: The model predicts the peak emissions from road vehicles, helping to assess the impact of traffic pollution on public health.
- 5.
- Validation of the Model:
To validate the model’s accuracy and robustness, the predicted maximum values are compared against experimental or observed data from each scientific field. The success of the model is evaluated based on how closely the predicted values align with the observed data, with a particular focus on parameter b’s ability to capture the uncertainties specific to each application [17].
- 6.
- Implementation and Computation:
The model’s implementation involves using MATLAB software (R2018a) for the calculation of autocorrelation functions, integral time scales, and subsequent predictions of maximum values [18]. The model was applied to both high-resolution experimental data and numerical simulation outputs, ensuring that the predictions are robust across different types of data.
- 6.1.
- MATLAB Code Implementation:
To further illustrate the model’s implementation, the following MATLAB code snippet shows how the maximum hydrogen concentration was calculated based on the empirical model:
% MATLAB code for calculating maximum hydrogen concentration
V = 0.05; % mean hydrogen concentration (example value)
TV = 10; % integral time scale (example value)
nu = 0.3; % fixed exponent
b = 6; % parameter calibrated from experimental data
delta_tau = 1:0.1:10; % time interval range
% Calculation of maximum concentration
V_max = V(1 + b * (delta_tau/TV).^(-nu));
This code calculates the maximum hydrogen concentration over a range of time intervals. The parameter values and b are example values.
Data Collection
One of the key strengths of this study lies in the comprehensive data collection process. The data utilized in this research were meticulously gathered from a variety of sources, ensuring a robust foundation for analysis. These datasets were selected and curated to accurately reflect the specific conditions and variables relevant to each of the four scientific fields explored in this work. The rigorous nature of this data collection not only enhances the validity of the findings but also provides a solid basis for future research in these areas. This dedicated section highlights the importance of the data and underlines the methodological rigor applied in their collection and utilization.
It should be noted that detailed information regarding the sensors’ specifications and accuracy, as well as the precise data collection methodology, was not available. Future research will aim to document these aspects more thoroughly to enhance the replicability and accuracy of this study’s findings.
3. Description of the Selected Scientific Fields
3.1. Hydrogen Combustion in Renewable Energy Systems
Hydrogen is a plentiful, clean, and secure renewable energy source [19]. It is also non-toxic, and the events associated with its use typically have short durations. However, in confined spaces, hydrogen can pose significant risks, as it can lead to fires or explosions when mixed with air [20]. Additionally, hydrogen tends to accumulate in such environments, potentially reaching dangerous concentration levels.
In response to these risks, there have been efforts to establish guidelines and recommendations for the safe indoor use of hydrogen systems. Moreover, extensive discussions in the literature have focused on safety and reliability analyses for hydrogen storage and delivery technologies, laying the groundwork for future risk assessments and ensuring safe operations [21]. Research has also categorized studies on hydrogen flammability into experimental, numerical, and analytical approaches.
CFD has proven effective in predicting maximum hydrogen concentrations, especially in confined spaces [22]. Earlier studies utilized CFD to model hydrogen behavior following its release from fuel cell vehicles or during accidental leaks in confined environments such as tunnels. Techniques like Large Eddy Simulation (LES) and Direct Numerical Simulation (DNS) have been used to accurately predict maximum hydrogen concentrations through numerical time series. However, simpler methods, including the RANS approach, struggle to make such predictions, highlighting a gap in the current literature.
Given the critical importance of quickly and reliably predicting maximum hydrogen concentrations to prevent accidents, enhancing RANS and other simple models with a reliable empirical model could offer a solution [23]. Previous efforts have successfully incorporated such models for predicting individual exposure, demonstrating the potential of this approach.
This study aimed to validate the proposed empirical model as a viable tool for predicting maximum hydrogen concentrations in confined spaces. Success in this area would enable simpler methodologies, like RANS, to make fast and accurate predictions, marking a significant advancement in the field. To the best of the author’s knowledge, this is the first attempt made to predict maximum hydrogen levels in confined spaces using an empirical model.
The Selected Hydrogen Experiments
The data from two hydrogen experiments from the literature were used. Koutsourakis et al. [24] evaluated the LES methodology against a hydrogen release and dispersion experiment in a hallway that had ventilation openings. Results from the Fire Dynamics Simulator (FDS) LES code were also included. It was found that the hydrogen concentration values predicted with ADREA-HF LES were very close to the measured ones, especially for the sensors close to the ceiling. Tolias et al. [25] applied LES on hydrogen subsonic round jets and evaluated modeling strategies, and they provided guidelines for similar applications. The ADREA-HF code and the experiments conducted by Sandia National Laboratories were used for that purpose. Hydrogen was released vertically from a small orifice of 1.91 mm diameter into a stagnant environment. Three experimental cases were simulated with different Reynolds numbers at the release area, namely 885, 1360, and 2384. The hydrogen mass fraction and velocity mean values and fluctuations were compared against the experimental data. Several grid resolutions were used to assess the effect on the results, using mainly the Smagorinsky subgrid scale model. The analysis showed that even a coarse discretization of the release area can achieve acceptable results for hydrogen safety engineering applications. However, dense grids are required for the more accurate prediction of the turbulent characteristics.
3.2. Urban Microclimate Effects on Cultural Heritage
Cultural heritage is a vital aspect of any society, as it embodies and reflects its history [26]. In recent years, there has been a growing interest among scientists in studying cultural heritage within urban environments. One of the most common scientific tools used for examining cultural heritage is CFD [27]. While numerous CFD studies have been conducted in this field, the focus has generally not been on understanding the extreme deterioration of buildings caused by factors like high wind speeds.
It is well established that the greatest damage to buildings occurs during periods of maximum wind speed [28]. Therefore, accurately predicting these wind speeds using numerical models is of critical importance [29]. Advanced models like DNS and LES can predict maximum wind speeds through detailed time series data [30]. However, simpler models, such as the RANS approach, may require the integration of an empirical model to achieve similar results. The current author previously applied such an approach in outdoor environments.
A key objective of this study was to develop a reliable prediction method for maximum wind speeds, which is essential for effectively managing emergency situations and assessing the risks to historic buildings. To achieve this, the study tested the proposed empirical model, which has been used to predict maximum wind speeds in the Atmospheric Surface Layer, against experimental data from urban environments. This validation represents a novel contribution of the research.
Experimental data on maximum wind speeds in urban environments are necessary in order to achieve the above-mentioned goal. According to author’s knowledge based on the open literature, there is no field experiment that could provide real data on wind speed time series in urban environments. However, as stated above, the LES methodology can provide such data. For this reason, in the present study, an LES of a wind tunnel experiment that includes an urban environment was performed. The numerical simulation of the urban environment was presented in [31]; in this study, only the numerical results of [31] were used for the wind speed.
3.3. Shipping Emissions
Maritime transportation plays a crucial role in facilitating international trade [32]. However, it also contributes significantly to air pollution, especially in urban coastal areas. Ship emissions in ports can greatly affect air quality, leading to increased individual exposure to hazardous pollutants in harbor cities [33,34].
Research has extensively focused on predicting individual exposure to airborne hazardous materials, with particular attention given to emissions from ships [35]. CFD has been widely recognized as a valuable tool for predicting these exposures.
In this study, the validity of the empirical model (Equation (1)) was assessed for predicting individual exposure to ship emissions [36,37]. This model was originally developed for predicting exposure to airborne materials released from constant point sources within urban environments. A key innovation of this study is the application of this model to emissions from ships, which are typically located outside urban areas.
The Measurement Campaign
The pollutant data that are used in the present study were obtained from the shipping emission monitoring station, which is located in Wedel, an area close to Hamburg’s port. The monitoring station is located on the bank of the river Elbe and is advantageous in collecting data from individual vessels without the interference of other pollution sources. The monitoring station measures pollutant concentrations from ongoing vessels that arrive to or depart from Hamburg’s port. The monitoring station measures trace gasses such as SO2, CO2, NO, NO2, NOx, and O3, as well as meteorological data (wind speed, temperature, humidity) with a 5 s temporal resolution. The height of the sampling point of the monitoring station was 9 ± 2 m above sea level. Additionally, Rapkos et al. [38] employed the same dataset for validation purposes, using it to simulate the SO2 and CO2 time series through the application of CFD modeling.
3.4. Road Vehicle Emissions
This section focuses on predicting maximum road vehicle emissions, a critical area of study due to the significant health risks posed by traffic pollution [39,40]. Additionally, road transportation contributes to substantial economic costs related to exhaust emissions.
Traffic pollution is typically analyzed using numerical and traffic emission models [41], which explore various mechanisms and modeling approaches for urban vehicle pollutant dispersion [42]. Research has also examined the impact of fuel type and Euro standards on emissions through mathematical simulations. Several methods are well established for assessing on-road exhaust emissions, including both macroscopic models like the COmputer Programme to Calculate Emissions from Road Transport (COPERT) and microscopic models such as Vehicle-Specific Power (VSP). Alternative approaches, like Artificial Neural Networks and models based on vehicle dynamics, offer further insights.
However, existing research has not primarily focused on predicting maximum emissions, leaving a gap in the literature. The predictive capabilities of most models are still limited, particularly in estimating peak emissions. In contrast, CFD models, such as DNS and LES, can achieve these predictions through detailed numerical time series. For faster models like RANS, incorporating an empirical model might provide a viable solution for predicting maximum values.
Given this context, there is a need for reliable and swift predictions of maximum road vehicle emissions, which have the most severe health impacts [43]. This study aimed to fill this gap by enabling RANS models to predict maximum road vehicle emissions through the proposed empirical model, marking a novel contribution to the field.
In conclusion, this research utilized the proposed empirical model to address the global challenge of vehicle emissions. While previous validations of the model were conducted under known experimental conditions, this study introduced a blind validation to test the model’s robustness. The approach involves initially calibrating the empirical model with vehicle emission data, followed by validating it using blind data while keeping the model’s basic parameters constant. This methodology represents a significant innovation in the field.
The Measurement Campaign
The data employed in this study were measured on a heavy-duty commercial truck of over 24 tonnes, Euro IV, equipped with Diesel Oxidation Catalyst (DOC), Exhaust Gas Recirculation (EGR), and Selective Catalytic Reduction (SCR) using Portable Emission Measurement System (PEMS) analyzers and complemented by additional instruments, such as a Global Positioning System (GPS) and weather station. The data concern two different vehicle trips, where the vehicle followed its regular driving route (the trip was not designed). The collected data from the first trip started on 23 January 2015 at 7:58:50 A.M. and finished on the same day at 9:29:11 A.M. The collected data from the second trip started on 21 January 2015 at 1:13:02 P.M. and finished on the same day at 2:07:51 P.M. The time resolution of the data was Δτ = 1 s. The following variables were included in the data: (1) speed–time traces, (2) pollutant emissions of HC, NO NO2, NOx, CO, and CO2, (3) ambient conditions, and (4) other vehicle information. The measurements from the first trip were used as the calibration dataset of the empirical model, while those from the second trip as the validation dataset. The time series of each pollutant for the calibration step are presented in Figure 1.
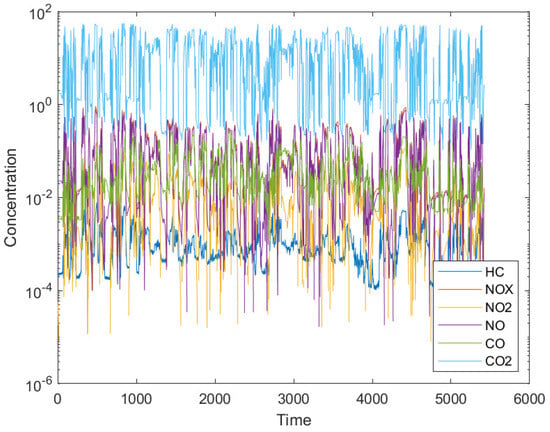
Figure 1.
The time series of each pollutant in the case of the calibration step (the data in Figure 1 are original and were derived from the research conducted in this study). Note: The units for the data presented in Figure 1 and Figure 7 were not available to the author. Despite this, the relative comparisons and trends observed remain valid and are the focus of the analysis.
4. Results and Discussion
4.1. Hydrogen Combustion in Renewable Energy Systems
Figure 2 presents the histogram of parameter b for hydrogen from all the experimental data. It is obvious that most of the values are between 0 and 1. Also, the maximum value of parameter b is equal to 6, and this is the most important value for security reasons.
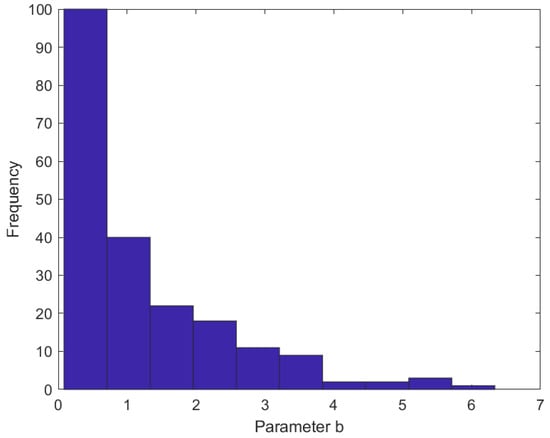
Figure 2.
Histogram of parameter b for hydrogen from all the experiments.
The maximum predicted hydrogen for all the cases is presented in Figure 3. It should be noted that parameter b was set equal to its maximum value (i.e., 6). Almost all the points (success rate equal to 99.52%) are above the 1:1 line, indicating the good performance of the model for security reasons.
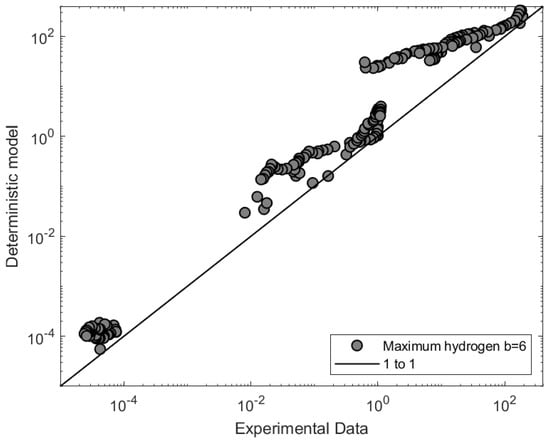
Figure 3.
Comparison of the empirical model with the experimental data for the maximum hydrogen using b equal to 6.
4.2. Urban Microclimate Effects on Cultural Heritage
The estimation of the b parameter was performed using the LES wind speed time series, which is calculated as follows:
where V is the wind speed, and u, v, and w are the velocity components.
As mentioned above, the Vmax(Δτ), , I, and TV used in Equation (1) are calculated from the LES wind speed time series using the MATLAB software. The autocorrelation time TV was calculated using Equation (3) on the interval from 1.0 to 0.0. The temporal resolution of the wind speed time series was equal to Δτ = 0.45 s. A numerical peak Vmax(Δτ) was calculated for each sensor location, and a b value was estimated from Equation (1). According to Figure 4, the values of b range from 0.57 to 5.53, with only four values above 5, and the proposed b value (=6) is relatively close to the maximum value 5.53. The LES dataset clearly indicates that a value of b = 6.0 is appropriate for this flow scenario.
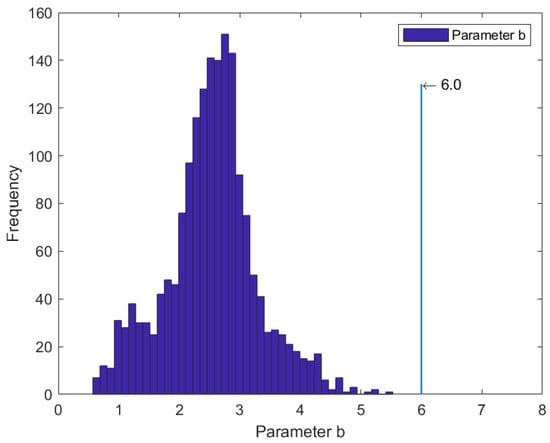
Figure 4.
Histogram of parameter b for urban area.
Figure 5 compares the Vmax(Δτ) estimated from the empirical model (Equation (1)) fed by the LES results with the corresponding values predicted by the LES in the case of the urban area. Specifically, the horizontal axis x represents the maximum wind speeds that were predicted from the LES time series of the wind speed. The empirical model provides a success rate equal to 100% (all the values lie above the 1:1 line), a fact that supports the hypothesis that the proposed theoretical model Vmax(Δτ) is the upper limit of the corresponding predicted Vmax(Δτ).
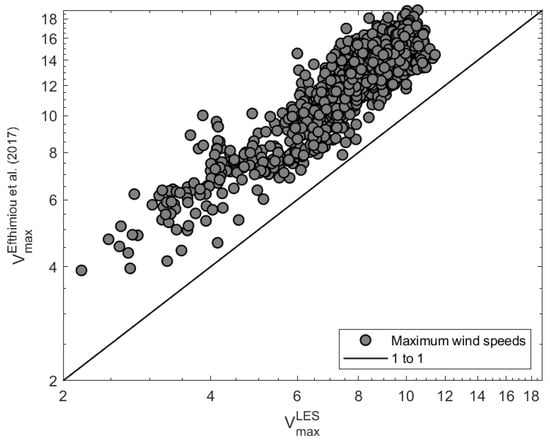
Figure 5.
Performance of the empirical model (Equation (1)) in the case of the urban area [44].
4.3. Shipping Emissions
Figure 6 presents the scatter plot of the individual exposure, where the model is compared with the measurements for each pollutant. In this case, the parameter b was set equal to 1.5. It is obvious that the O3 and the CO2 are on the 1:1 line, while the rest pollutants are below the 1:1 line but still inside the factor of two of observations.
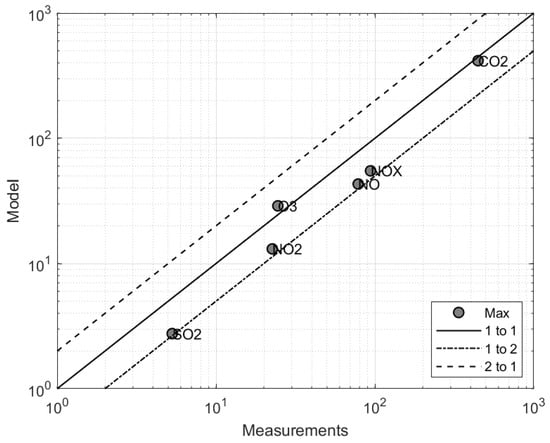
Figure 6.
Comparison of the model versus the measurements for the individual exposure using b = 1.5.
As an example, in Figure 7, Equation (1) is applied for the pollutant CO2 for various values of the time resolution Δτ. It is obvious that the empirical model starts from the ‘maximum value’ and approaches the ‘mean value’ as the time resolution Δτ is increased. These results support the validity of Equation (1) to be used for ship emissions.
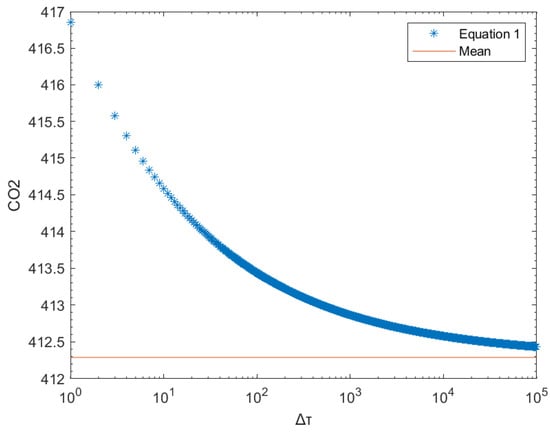
Figure 7.
Application of Equation (1) to the real measurements of CO2. In this case, the experimental data were fed to Equation (1), and only the time resolution Δτ is increased. Note: The units for the data presented in Figure 1 and Figure 7 were not available to the author. Despite this, the relative comparisons and trends observed remain valid and are the focus of the analysis.
In order to obtain an ideal prediction (i.e., all the values to be on the 1:1 line), parameter b has to be changed. Figure 8 presents the case of an ideal prediction.
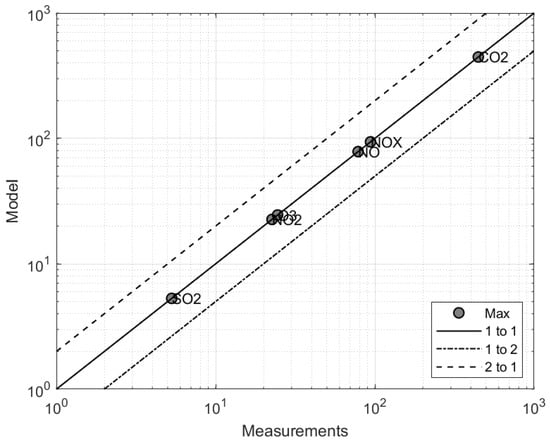
Figure 8.
Comparison of the model versus the measurements for the individual exposure using variable b values.
Table 1 presents the values of parameter b for each pollutant, which correspond to an ideal prediction. These b values could be used in the case of studying individual exposure by ship emissions.

Table 1.
Parameter b for each pollutant in the case of an ideal prediction of the individual exposure for shipping emissions.
4.4. Road Vehicle Emissions
4.4.1. Calibration of the Empirical Model
Figure 9 presents the scatter plot where the empirical model is compared with the measurements. It should be noted that this particular scatter plot does not compare different pollutants but compares the model with the measurement for each pollutant. It is clear that all the points for all the pollutants lie on the ideal line (1:1), which is a positive result for the robustness of the model.
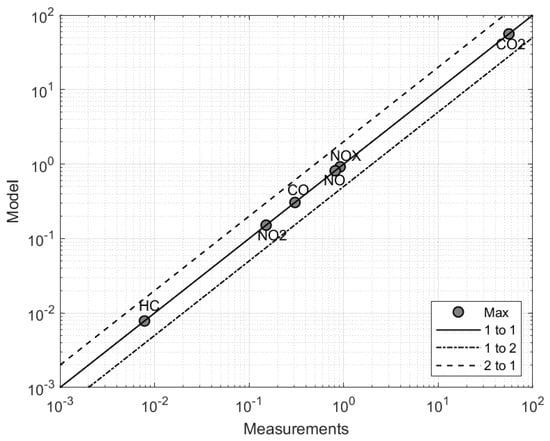
Figure 9.
Scatter plot comparing the empirical model with the measurements for each pollutant in case of calibration.
As stated above, parameter b presented the higher uncertainty in all the past works. This is also obvious from Table 2, which presents the values of this parameter for each pollutant at the stage of calibration.

Table 2.
The experimental values of the variables and parameters of Equation (1) for each pollutant in case of calibration.
As an example, in Figure 10, Equation (1) is applied for the pollutant HC for various values of the time resolution Δτ. In this case, Equation (1) is applied by keeping the values of Table 2 constant, and only the variable Δτ is increased. It is obvious that the empirical model starts from the ‘maximum value’ and approaches the ‘mean value’ of Table 2, as the time resolution Δτ is increased. These results support the validity of Equation (1) to be used for real road vehicle emissions.
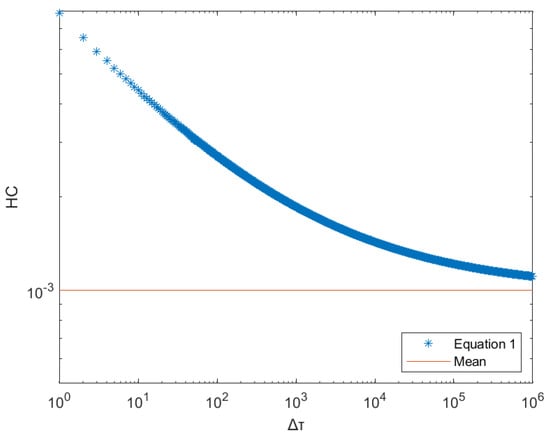
Figure 10.
Application of Equation (1) to the real measurements of HC. In this case, the experimental data of Table 2 for HC were fed to Equation (1), and only the time resolution Δτ is increased.
4.4.2. Validation of the Empirical Model
In this study, the validation of the model was performed by implementing it on blind data. In this case, the values of parameter b were kept constant for each pollutant and equal to the ones of Table 2. Figure 11 presents the same scatter plot as Figure 9 but for the stage of validation using b equal to the values of Table 2 for each pollutant. It is clear that the empirical model provides a success rate equal to 100% (all the values are above the 1:1 line). Also, the FAC2 (factor of two of observations) is still equal to one.
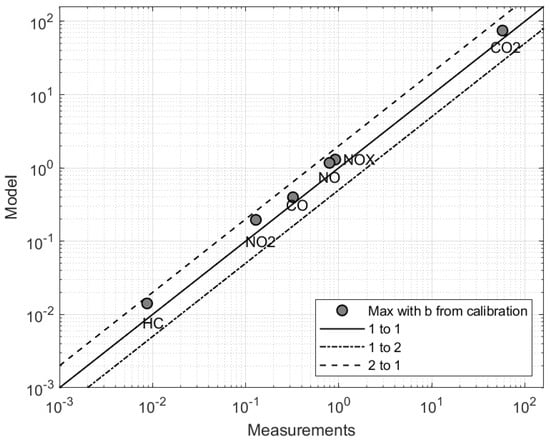
Figure 11.
Scatter plot for the validation of the empirical model for all the pollutants using the values of b from Table 2 (calibration).
5. Conclusions
This study presented an empirical model aimed at predicting the maximum values of time-dependent data across four scientific fields: hydrogen combustion in renewable energy systems, urban microclimate effects on cultural heritage, shipping emissions, and road vehicle emissions. The model integrates the mean, standard deviation, integral time scale, and two parameters, ‘b’ and ‘ν’, to enhance the predictive capabilities of the CFD-RANS methodology.
Key findings include the following:
- Hydrogen Combustion in Renewable Energy Systems: The empirical model was effectively validated against LES data for hydrogen in confined spaces, showing a success rate of 99.52%. The model’s ability to predict maximum hydrogen concentrations underlines its potential application in safety and reliability analysis in renewable energy contexts.
- Urban Microclimate Effects on Cultural Heritage: The model was applied to predict maximum wind speeds in urban environments, using LES data as a reference. The results confirm the robustness of the model, with a 100% success rate in predicting maximum wind speeds, highlighting its utility in preserving cultural heritage under extreme weather conditions.
- Shipping Emissions: The model accurately predicted individual exposure to shipping emissions, particularly for pollutants like CO2 and O3. This suggests the model’s applicability in urban air quality management, particularly in port cities.
- Road Vehicle Emissions: The model demonstrated strong predictive performance for road vehicle emissions, with all pollutants closely aligning with measured values. The study also revealed a linear dependence of parameter ‘b’ on vehicle speed, offering new insights for further research.
Despite these successes, the model’s performance is highly dependent on the accurate estimation of parameters ‘b’ and ‘ν’. While the fixed value of ‘ν’ simplifies the model, further refinement may be necessary to improve accuracy in more complex turbulence scenarios. Future research should explore these aspects to enhance the model’s generalizability and applicability across different fields.
It should be noted that the variability in parameter b across different applications reflects the diverse nature of the physical phenomena and the varying levels of uncertainty inherent in each scenario. For example, the lower values of b observed in hydrogen combustion may be due to the relatively controlled experimental conditions, which limit the variability within the system. In contrast, the higher values found in shipping emissions could be attributed to the greater environmental uncertainties and the complexity of pollutant interactions with atmospheric conditions. These variations underscore the importance of calibrating b to reflect the specific uncertainties and dynamics of each application.
In conclusion, this empirical model provides a reliable tool for predicting extreme values in various scientific fields, offering significant potential for integration into computational models like CFD-RANS. Further validation with larger datasets and across additional domains is recommended to solidify the model’s effectiveness.
Discussion on LES Data and Model Agreement
Although the empirical model demonstrated overall good performance in predicting maximum values across various scientific fields, including hydrogen combustion in renewable energy systems, urban microclimate effects on cultural heritage, shipping emissions, and road vehicle emissions, some discrepancies were observed when compared to the LES data. Specifically, while the model’s predictions were largely in line with the LES results, there were instances where the LES data exhibited more complex turbulent structures that the model, with its inherent simplifications, could not fully capture. These differences highlight the limitations of the model in replicating the intricate details of turbulence that LES methods are able to resolve.
This divergence suggests that while the empirical model is useful for rapid and reliable predictions in scenarios where computational resources or time constraints limit the use of more sophisticated methods like LES, it may not fully substitute for LES in cases where high fidelity is required. Future work should focus on refining the model parameters or integrating more aspects of turbulence to enhance its predictive accuracy, particularly in cases involving complex flow dynamics.
6. Limitations
While the empirical model proposed in this study has demonstrated significant potential in predicting maximum values across various turbulence-related scientific fields, several limitations must be acknowledged. First, the model’s performance is highly dependent on the accurate estimation of parameters ‘b’ and ‘ν’, particularly in scenarios involving complex turbulence, which the model may not fully capture. The fixed value of ‘ν’ at 0.3, while simplifying computations, may not be universally applicable across all scenarios, potentially leading to inaccuracies. Additionally, the model’s reliance on data from specific experimental and numerical measurements, such as LES and RANS, may limit its generalizability to other fields or datasets where different turbulence structures prevail. Future work should focus on refining these parameters and validating the model across a broader range of conditions to enhance its robustness and applicability.
Funding
This work was partially supported by the European Union’s Horizon 2020 research and innovation program, HYPERION project [grant number 821054].
Institutional Review Board Statement
Not applicable.
Informed Consent Statement
Not applicable.
Data Availability Statement
The data are not publicly available due to privacy by third parties.
Acknowledgments
George Efthimiou acknowledges the “Federal Maritime and Hydrographic Agency of Germany—Bundesamt für Seeschifffahrt und Hydrographie (BSH)” for providing the measurement data from the monitoring station in Wedel, Germany; Tolias Ilias from NCSR Demokritos for performing the CFD simulation in the Greek National HPC facility ARIS (http://hpc.grnet.gr/, accessed on 1 January 2024), under project NUMLES (pr008039); Professor Leonidas Ntziachristos from Aristotle University of Thessaloniki (AUTH) for giving permission to access the road vehicle emission data. Special thanks are given to Christos Boikos and Nikos Rapkos from Aristotle University of Thessaloniki (AUTH) and Petros Katsis from Emisia S.A. for the preparation of the data and partial contribution in the writing of this manuscript.
Conflicts of Interest
The authors declare no conflicts of interest.
References
- Davidson, P.A. Turbulence: An Introduction for Scientists and Engineers; Cambridge University Press: Cambridge, UK, 2015. [Google Scholar]
- Tennekes, H.; Lumley, J.L. A First Course in Turbulence; MIT Press: Cambridge, MA, USA, 1972. [Google Scholar]
- Pope, S.B. Simple models of turbulent flows. Phys. Fluids 2011, 23, 011301. [Google Scholar] [CrossRef]
- Wilson, J.; Smith, T. Stochastic vs. Deterministic Approaches in Turbulence Prediction. Phys. Fluids 2021. [Google Scholar]
- Frank, J.; Sawford, B. Deterministic and Stochastic Modeling in Turbulence Prediction. Appl. Math. Model. 2023. [Google Scholar]
- Javanroodi, K.; Nik, V.M.; Giometto, M.G.; Scartezzini, J.-L. Combining computational fluid dynamics and neural networks to characterize microclimate extremes: Learning the complex interactions between meso-climate and urban morphology. Sci. Total Environ. 2022, 829, 154223. [Google Scholar] [CrossRef] [PubMed]
- Ho, T.; Karri, V.; Madsen, O. Prediction of hydrogen safety parameters using intelligent techniques. Int. J. Hydrog. Energy 2009, 33, 431–442. [Google Scholar] [CrossRef]
- Bartzis, J.G.; Sfetsos, A.; Andronopoulos, S. On the individual exposure from airborne hazardous releases: The effect of atmospheric turbulence. J. Hazard. Mater. 2008, 150, 76–82. [Google Scholar] [CrossRef]
- Efthimiou, G.C.; Andronopoulos, S.; Tolias, I.; Venetsanos, A. Prediction of the upper tail of concentration distributions of a continuous point source release in urban environments. Environ. Fluid Mech. 2016, 16, 899–921. [Google Scholar] [CrossRef]
- Blocken, B.; Janssen, W.; van Hooff, T. CFD simulation for pedestrian wind comfort and wind safety in urban areas: General decision framework and case study for the eindhoven university campus. Environ. Model. Softw. 2012, 30, 15–34. [Google Scholar] [CrossRef]
- Holmes, J.D. Wind Loading of Structures; CRC Press: Boca Raton, FL, USA, 2007. [Google Scholar]
- Caciolo, M.; Stabat, P.; Marchio, D. Numerical simulation of single-sided ventilation using RANS and LES and comparison with full-scale experiments. Build. Environ. 2012, 50, 202–213. [Google Scholar] [CrossRef]
- Gryning, S.-E.; Holtslag, A.A.M.; Irwin, J.S.; Sivertsen, B. Applied dispersion modeling based on meteorological data. Bound.-Layer Meteorol. 1987, 21, 79–98. [Google Scholar]
- Pope, S.B. Turbulent Flows; Cambridge University Press: Cambridge, UK, 2000; 771p, ISBN 0521598869/0521591252. [Google Scholar]
- Makar, P.A.; Stroud, C.; Akingunola, A.; Zhang, J.H.; Ren, S.Z.; Cheung, P.; Zheng, Q. Vehicle-induced turbulence and atmospheric pollution. Atmos. Chem. Phys. 2021, 21, 12291–12316. [Google Scholar] [CrossRef]
- Davidson, L. Large eddy simulations: How to evaluate resolution. Int. J. Heat Fluid Flow 2009, 30, 1016–1025. [Google Scholar] [CrossRef]
- Box, G.E.P.; Draper, N.R. Empirical Model-Building and Response Surfaces; Wiley: Hoboken, NJ, USA, 1987. [Google Scholar]
- Kulkarni, P.; Baron, P.A.; Willeke, K. Introduction to aerosol characterization. Aerosol measurement: Principles, techniques, and applications. 2011. [Google Scholar] [CrossRef]
- Stępie´n, Z. A comprehensive overview of hydrogen-fueled internal combustion engines: Achievements and future challenges. Energies 2021, 14, 6504. [Google Scholar] [CrossRef]
- Chen, X.; Zhang, C.; Li, Y. Research and development of hydrogen energy safety. Emerg. Manag. Sci. Technol. 2022, 2, 3. [Google Scholar] [CrossRef]
- Mazloomi, K.; Gomes, C. Hydrogen as an energy carrier: Prospects and challenges. Renew. Sust. Energy Rev. 2012, 16, 3024–3033. [Google Scholar] [CrossRef]
- Wilcox, D.C. Turbulence Modeling for CFD; DCW Industries: La Canada, CA, USA, 2006. [Google Scholar]
- Kukkonen, J.; Olsson, T.; Schultz, D.M.; Baklanov, A.; Klein, T.; Miranda, A.I.; Monteiro, A.; Hirtl, M.; Tarvainen, V.; Boy, M.; et al. A review of operational, regional-scale, chemical weather forecasting models. Atmos. Chem. Phys. 2012, 12, 1–87. [Google Scholar] [CrossRef]
- Koutsourakis, N.; Tolias, I.C.; Venetsanos, A.G.; Bartzis, J.G. Evaluation of an LES code against a Hydrogen dispersion experiment. CFD Lett. 2012, 4, 225e36. Available online: http://www.akademiabaru.com/doc/CFDLV4_N4_P225_236.pdf (accessed on 1 January 2024).
- Tolias, I.C.; Kanaev, A.A.; Koutsourakis, N.; Glotov, V.Y.; Venetsanos, A.G. Large Eddy Simulation of low Reynolds number turbulent hydrogen jets—Modelling considerations and comparison with detailed experiments. Int. J. Hydrogen Energy 2021, 46, 12384–12398. [Google Scholar] [CrossRef]
- Leissner, J.; Kilian, R.; Kotova, L. Climate for Culture: Assessing the impact of climate change on the future indoor climate in historic buildings using simulations. Herit. Sci. 2015, 3, 38. [Google Scholar] [CrossRef]
- Brimblecombe, P. The Effects of Air Pollution on the Built Environment; Imperial College Press: London, UK, 2003. [Google Scholar]
- Tominaga, Y.; Mochida, A.; Yoshie, R.; Kataoka, H.; Harimoto, K. CFD Analysis of Pedestrian Wind Environment in Urban Areas—Case Study in a Suburban City. Build. Environ. 2008, 43, 45–56. [Google Scholar]
- Cook, N.J. The Designer’s Guide to Wind Loading of Building Structures; Butterworths: London, UK, 1985. [Google Scholar]
- Blocken, B.; Stathopoulos, T.; Carmeliet, J. CFD simulation of the atmospheric boundary layer: Wall function problems. Atmos. Environ. 2007, 41, 238–252. [Google Scholar] [CrossRef]
- Efthimiou, G.; Barmpas, F.; Tsegas, G.; Moussiopoulos, N. Development of an Algorithm for Prediction of the Wind Speed in Renewable Energy Environments. Fluids 2021, 6, 461. [Google Scholar] [CrossRef]
- Eyring, V.; Köhler, H.W.; van Aardenne, J.; Lauer, A. Emissions from international shipping: 1. The last 50 years. J. Geophys. Res. 2005, 110, D17305. [Google Scholar] [CrossRef]
- Corbett, J.J.; Koehler, H.W. Updated emissions from ocean shipping. J. Geophys. Res. 2003, 108, D003751. [Google Scholar] [CrossRef]
- Marmer, E.; Langmann, B. Impact of ship emissions on the Mediterranean summertime pollution and climate: A regional model study. Atmos. Environ. 2005, 39, 4659–4669. [Google Scholar] [CrossRef]
- Endresen, Ø.; Sørgård, E.; Sundet, J.K.; Dalsøren, S.B.; Isaksen, I.S.A.; Berglen, T.F.; Gravir, G. Emission from international sea transportation and environmental impact. J. Geophys. Res. 2003, 108, D002898. [Google Scholar] [CrossRef]
- Westmoreland, D.G.; Bryce, D. Air Quality Management; Taylor & Francis: Abingdon, UK, 2002. [Google Scholar]
- Murena, F. Monitoring and modelling carbon monoxide concentrations in a deep street canyon: Application of a two-box model. Atmos. Pollut. Res. 2012, 3, 311–316. [Google Scholar] [CrossRef][Green Version]
- Rapkos, N.; Weigelt, A.; Beecken, J.; Ntziachristos, L. Method to identify fuel sulphur content (FSC) violations of ongoing vessels using CFD modelling. Atmos. Environ. 2023, 309, 119912. [Google Scholar] [CrossRef]
- Barth, M.; Boriboonsomsin, K. Real-world carbon dioxide impacts of traffic congestion. Transp. Res. Rec. 2008, 2058, 20. [Google Scholar] [CrossRef]
- Colvile, R.; Hutchinson, E.; Mindell, J.; Warren, R. The transport sector as a source of air pollution. Atmos. Environ. 2001, 35, 1537–1565. [Google Scholar] [CrossRef]
- Zhang, K.; Batterman, S. Air pollution and health risks due to vehicle traffic. Sci. Total Environ. 2013, 450–451, 307–316. [Google Scholar] [CrossRef] [PubMed]
- Faiz, A.; Sinha, K.; Walsh, M.; Varma, A. Automotive Air Pollution: Issues and Options for Developing Countries; The World Bank: Washington, DC, USA, 1996. [Google Scholar]
- Krzyzanowski, M.; Kuna-Dibbert, B.; Schneider, J. Health Effects of Transport-Related Air Pollution; World Health Organization: Geneva, Switzerland, 2005. [Google Scholar]
- Efthimiou, G.C.; Hertwig, D.; Andronopoulos, S.; Bartzis, J.G.; Coceal, O. A Statistical Model for the Prediction of Wind-Speed Probabilities in the Atmospheric Surface Layer. Bound.-Layer Meteorol. 2017, 163, 179–201. [Google Scholar] [CrossRef]
Disclaimer/Publisher’s Note: The statements, opinions and data contained in all publications are solely those of the individual author(s) and contributor(s) and not of MDPI and/or the editor(s). MDPI and/or the editor(s) disclaim responsibility for any injury to people or property resulting from any ideas, methods, instructions or products referred to in the content. |
© 2024 by the author. Licensee MDPI, Basel, Switzerland. This article is an open access article distributed under the terms and conditions of the Creative Commons Attribution (CC BY) license (https://creativecommons.org/licenses/by/4.0/).