Article

Marine Boundary Layer Cloud Boundaries and Phase Estimation Using Airborne Radar and In Situ Measurements During the SOCRATES Campaign over Southern Ocean

1
Department of Hydrology and Atmospheric Sciences, The University of Arizona, Tucson, AZ 85721, USA
2
Environmental Science Division, Argonne National Laboratory, Lemont, IL 60439, USA
*
Author to whom correspondence should be addressed.
Atmosphere 2025, 16(10), 1195; https://doi.org/10.3390/atmos16101195
Submission received: 15 September 2025 / Revised: 13 October 2025 / Accepted: 15 October 2025 / Published: 16 October 2025
(This article belongs to the Section Atmospheric Techniques, Instruments, and Modeling)

Abstract

The Southern Ocean Clouds, Radiation, Aerosol Transport Experimental Study (SOCRATES) was an aircraft-based campaign (15 January–26 February 2018) that deployed in situ probes and remote sensors to investigate low-level clouds over the Southern Ocean (SO). A novel methodology was developed to identify cloud boundaries and classify cloud phases in single-layer, low-level marine boundary layer (MBL) clouds below 3 km using the HIAPER Cloud Radar (HCR) and in situ measurements. The cloud base and top heights derived from HCR reflectivity, Doppler velocity, and spectrum width measurements agreed well with corresponding lidar-based and in situ estimates of cloud boundaries, with mean differences below 100 m. A liquid water content–reflectivity (LWC-Z) relationship, LWC = 0.70Z0.29, was derived to retrieve the LWC and liquid water path (LWP) from HCR profiles. The cloud phase was classified using HCR measurements, temperature, and LWP, yielding 40.6% liquid, 18.3% mixed-phase, and 5.1% ice samples, along with drizzle (29.1%), rain (3.2%), and snow (3.7%) for drizzling cloud cases. The classification algorithm demonstrates good consistency with established methods. This study provides a framework for the boundary and phase detection of MBL clouds, offering insights into SO cloud microphysics and supporting future efforts in satellite retrievals and climate model evaluation.

1. Introduction

The Southern Ocean (SO) low-level clouds significantly influence the regional radiation budget (60° S latitude, encircling Antarctica). Yet global climate models (GCMs) struggle to simulate them accurately [1,2,3,4,5,6]. Despite advances in GCMs (e.g., [7,8,9,10,11]), large uncertainties persist in simulating cloud behavior, radiation, and cloud–atmosphere coupling over the SO [12,13,14,15]. These primarily arise from coarse model resolution and simplified microphysics that fail to capture mixed-phase processes, cloud structure, drizzle formation, and phase partitioning. Most GCMs underestimate the low cloud occurrence, overestimate cloud brightness, and produce precipitation that is too frequent but too weak [16,17], leading to underestimated shortwave fluxes and reduced cloud fractions and supercooled liquid water relative to the observations [6]. Low-level marine boundary layer (MBL) clouds over the SO exhibit a high prevalence of supercooled liquid water (SLW), with ~80% containing SLW across a temperature range of −40 to 0 °C [18]. Their macrophysical and microphysical properties differ significantly from subtropical MBL clouds, with dominant warm liquid clouds [19,20,21], and from Arctic mixed-phase clouds, which feature liquid tops and ice-dominated bases [22,23,24]. The phase of clouds and precipitation plays a crucial role in regulating Earth’s energy budget, modulating convective instability, and influencing surface water supply [25]. Understanding the dominant cloud phase and spatial heterogeneity of low-level SO clouds is critical for improving cloud parameterizations and refining global climate model predictions [26,27].
Identifying the cloud phase is crucial for accurately retrieving cloud macrophysical and microphysical properties, as most retrieval algorithms are phase and region-specific [28]. Various methods have been developed for classifying cloud type, phase, and hydrometeors over the SO (e.g., [6,29,30,31,32,33,34,35]) and Arctic clouds (e.g., [28,36,37,38]), each with varying performances based on retrieval methods and assumptions. Compared to ground-based measurements, aircraft in situ observations offer more reliable datasets by directly sampling cloud boundaries and interiors, thereby reducing retrieval uncertainties. Airborne radar and lidar also experience less signal attenuation than their ground-based or space-borne counterparts [39,40] due to their measurement paths typically passing through a shorter atmospheric column, reducing the cumulative effects of absorption and scattering by hydrometeors, atmospheric gases, and surface clutter. However, cloud-phase retrieval accuracy depends strongly on the observational scale, sample size, and viewing direction (of onboard sensors). Ground-based radar and lidar are well suited for detecting low-level clouds but suffer from attenuation when observing higher altitudes. In contrast, satellite sensors excel at detecting high-level clouds but often face challenges in retrieving low-level clouds due to near-surface signal attenuation [39].
The Southern Ocean Clouds, Radiation, Aerosol Transport Experimental Study (SOCRATES) provided a valuable dataset for investigating MBL clouds over the SO. In situ probes—Cloud Droplet Probe (CDP), Two-Dimensional, Stereo, Particle Imaging Probe (2D-S), and remote sensors—the 94.4 GHz (W-band) HIAPER Cloud Radar (HCR) and the 532 nm High Spectra Resolution Lidar (GV-HSRL) were deployed onboard the Gulfstream V (GV) research aircraft flown during SOCRATES. These instruments enabled direct observations of precipitation, cloud particles, and aerosols across different cloud layers, providing vertical profiles to characterize the MBL structure and the free troposphere. Previous studies utilizing SOCRATES measurements for cloud-phase classification include a multinomial logistic regression (MLR) method [6], which used in situ cloud and drizzle probe (CDP and 2D-S) measurements to estimate cloud-phase heterogeneity and frequency distributions. This method identified significant SLW and ice-phase clouds and was later refined in [33] to address the inconsistencies and gaps in phase detection by the MLR method. A fuzzy logic scheme classifying cloud hydrometeor types as a time–height profile using cloud radar–lidar data was presented in [34]. The University of Washington Ice–Liquid Discriminator (UWILD) was developed by [31], which was a random forest-based, single-particle, phase-classification method for binary 2D-S images. These methods provided crucial insights and improvements for cloud-phase classification and the spatial heterogeneity of MBL clouds over SO. However, limitations remain. Machine learning methods relying solely on in situ data may inherit measurement biases and miss warmer cloud layers above 0 °C, while fuzzy logic classification, though effective in combining radar–lidar observations, it relies on weighting functions without microphysical constraints, leading to ambiguities near phase boundaries, particularly for mixed-phase clouds.
Remote sensing provides two-dimensional vertical cloud profiles, complementing the size-resolved particle size distributions (PSDs) captured by in situ measurements. However, relying on either method alone can introduce discrepancies due to differences in measurement sensitivities, observational scales, and sampling volumes. Therefore, integrating in situ sampling with remote sensing provides significant advantages for studying atmospheric processes [41,42]. Lidar, with its shorter wavelength, resolves aerosols, ice precipitation, optically thin clouds, and cloud boundaries [41,43,44], but is easily attenuated by thicker cloud layers, such as liquid clouds [45]. Lidar measurements alone are insufficient for robust cloud-phase retrievals. In situations where collocated radar–lidar observations are unavailable, a radar-based phase detection technique offer clear advantages, as W-band cloud radars are capable of sampling the entire vertical extent of marine boundary layer cloud profiles, with the exception of very optically thin clouds. Therefore, this study focuses on developing a method solely based on radar measurements to identify cloud boundaries and phases in MBL clouds.
In this study we aim to combine in situ and radar-based measurements collected during SOCRATES to
(1)
Develop a method to identify cloud bases and top heights using HCR measurements, providing cloud boundary estimation without radiosonde or dropsonde data. We further derive an LWC-Z exponential relationship from in situ measured liquid water content (LWC) and calculated reflectivity (Z) from CDP and 2D-S probes and apply it to HCR reflectivity profiles to obtain radar-based LWC and liquid water paths (LWPs).
(2)
Present a cloud-phase estimation method for low-level clouds sampled during SOCRATES using a combination of HCR measurements, temperature profiles, and estimated LWPs, and compare the resulting phase retrievals with existing products over the SO. This simplistic approach integrates radar and in situ observations under physical microphysical constraints, addressing the limitations of probe-only classifications, remains effective where lidar retrievals are unavailable or compromised by strong signal attenuation, and offers improved physical consistency compared to empirically weighted classification methods.

2. Materials and Methods

2.1. SOCRATES In Situ and Remote Sensing Datasets

A brief overview of the SOCRATES aircraft field campaign is provided in Appendix A.1, with a list of in situ probes and radar–lidar instruments onboard the research aircraft in Table A1. This study primarily utilized the measurements from two airborne in situ probes—CDP [46,47] and 2D-S [48,49], along with remote sensors HCR [50,51,52] and GV-HSRL [53,54,55]—onboard the GV research aircraft during SOCRATES. The bulk cloud microphysical properties (LWC, particle size distribution, and number concentration) were derived from the CDP and 2D-S measurements, which were merged into a continuous dataset with size bins from 2 to 40 µm for cloud droplets and 40 to 1280 µm for drizzle particles, at 1 Hz temporal resolution for each flight. The CDP and 2D-S datasets were combined into a single size distribution following [56], with droplet number concentrations in the overlapping size bin redistributed using a gamma distribution, ensuring a complete cloud and drizzle size spectrum.
The HCR reflectivity (dBZ), Doppler velocity (Vd) (m/s), and spectrum width (WID) (m/s), along with the HSRL measured backscatter coefficient (β) (m−1sr−1) and particle depolarization ratio (PLDR), were collected at 1 Hz temporal resolution from [57]. The HSRL signals are highly sensitive to cloud droplet concentrations and can be attenuated within a few hundred meters in liquid cloud layers [40,45], resulting in fewer cloud detections compared to HCR, particularly in optically thick clouds. Estimated instantaneous uncertainties for HSRL measurements at 532 nm are 0.36 for backscatter (β) and 0.009 for depolarization (δ) [55]. The HSRL has an advantage over HCR in detecting thin cloud layers, but it attenuates strongly near cloud boundaries depending on the viewing direction and cannot penetrate the full vertical extent of the cloud layer, which the HCR can. The radar–lidar overlap is only about 11% when considering full time–height (2D) cloud profiles. Given this limitation, lidar signals are not used for phase or boundary estimation in optically thicker MBL clouds in this study. Cloud temperatures were provided by the two-dimensional ERA5 reanalysis product, which matched the vertical and temporal resolution of the HCR data [34,52,57]. The HCR dataset was further filtered to retain only nadir or zenith pointing observations, excluding all cloud samples in transition or rotational pointing directions (i.e., those not equal to ±90 degrees).

2.2. Estimating LWC-Z Relationship and LWP from In Situ Measurements

The cloud-droplet number concentration and particle size distribution from the merged CDP+2D-S dataset is used to calculate in situ reflectivity factor (Z, mm6/m3) and liquid water content (LWC, g/m3) for cloud and drizzle particles following [56,58,59], using the equations as follows:
Z = D m i n D m a x N D D 6 d D ,
L W C = ρ w π 6 D m i n D m a x N D D 3 d D ,
where ρw is the density of liquid water, D is the particle diameter measured as droplet size distribution (DSD) from the CDP+2D-S particle size bins, and N(D) is the number concentration (cm−3 µm−1) per bin. Z (mm6/m3) can further be converted to dBZ as dBZ = 10 log(Z).
Clouds are defined when LWC is greater than 0.01 g/m3 and cloud droplet number concentration (Nc) is greater than 5 cm−3 [56]. The LWC threshold ensures sufficient cloud density and number concentration while removing clear-sky conditions and aerosol noise. The number concentration of ice particles > 200 µm is very low [56], suggesting that most ice-phase particles fall below the 2D-S-defined 200 µm threshold for ice particle size distribution [49]. Consequently, particles larger than 200 µm are excluded from the selected 2D-S DSD spectra, as their inclusion can introduce significant errors in LWC estimation owing to their disproportionately large contribution to radar reflectivity (Z), which represents the sixth moment of particle size. Moreover, ice-dominated cloud regions contribute minimally to LWC but primarily exhibit higher ice water content (IWC). The LWC can be further used to compute the column-integrated liquid water path (LWP, g/m2) as a function of cloud layer thickness (Δh, meters) [60,61,62] as follows:
L W P = H b a s e H t o p L W C ( h ) · Δ h ,
A total of 62 in situ aircraft profiles (ascending and descending) were constructed from 10,135 CDP+2D-S DSD spectra at 1 Hz. From these, in situ Z, LWC, and LWP were derived (presented in Figure 1). The profiles were selected to represent uniform single-layer, low-level stratocumulus MBL clouds.
The in situ probe-measured LWC and Z are used to derive an exponential relationship of the form LWC = aZb, where a and b are intercept and slope parameters depending on cloud type [62]. The in situ Z and LWC measurements were constrained to only the 5th to 95th percentile of the dataset to minimize the influence of extreme outliers. Furthermore, a kernel density estimation (KDE) was used to estimate relative point density in the LWC-Z (log) space. Due to the noisy nature of the dataset where larger particle diameters return extremely high Z values (~D6) and relatively lower LWC values (~D3), a log–log linear regression was performed using only a subset of the dataset with high sample density to minimize measurement uncertainties. An exponential relationship, LWC = 0.70Z0.29, is hence derived (shown in Figure 2).
The statistical evaluation of the predicted LWCs derived from the LWC–Z relationship developed in this section is presented later in Section 3.1.2, where they are compared against in situ measurements. The derived LWC-Z relationship, developed following existing studies like [62,63], is specifically tuned to low-level stratocumulus clouds sampled during the SOCRATES campaign but shall ideally be applicable to similar MBL cloud cases over SO for a range of W-band reflectivity profiles between −30 to 5 dBZ. Variations in the DSD contribute to uncertainties in cloud microphysical properties, which could impact the calculated reflectivity (Z) [63]. Additionally, the presence of larger drizzling particles is a source of uncertainty in LWC-Z power-law relationships.

2.3. Classifying Low-Level Clouds over SO

2.3.1. Identifying Cloud Boundaries Using HCR Measurements

Existing methods for estimating cloud-base (Hbase) and cloud-top (Htop) heights often rely on thresholds of lidar returned power, depolarization, or backscatter (e.g., [59,64,65]), as well as in situ vertically resolved cloud LWP, LWC, and cloud-droplet number concentration (Nc). For example, Hbase in [65] was defined as the first lidar range gate where HSRL backscatter coefficient (β) exceeded 10−4 m−1sr−1. This approach is effective when the aircraft flies below cloud base with zenith-pointed sensors. Similarly, HSRL signals can capture cloud top when the aircraft flies above the cloud with sensors pointing nadir. However, lidar alone cannot simultaneously estimate both cloud-base and top heights, whereas HCR can. Although it is well known that lidar can provide more precise estimates of Hbase than radar, this becomes challenging when the aircraft flies above the cloud top—which accounts for ~80% of cases during SOCRATES [39]. Therefore, we developed a new method using HCR measurements to derive cloud base instead of HSRL in order to estimate MBL cloud boundaries (Hbase and Htop) for all samples during SOCRATES. This enables consistent cloud boundary estimation regardless of the aircraft’s altitude or pointing direction of the remote sensors.
In this study, single layered cloud profiles below 3 km were identified based on the HCR reflectivity, Doppler velocity (Vd), and Spectrum width (WID) profiles. Htop was estimated as the highest altitude where prominent HCR signals (dBZ > −50) were observed, following [65]. Hbase was estimated following a stepwise technique. Reflectivity values for cloud particles range from −50 to −11 dBZ, while drizzle particles exhibit values between −26 and 10 dBZ, based on the calculated reflectivity from the CDP and 2DS in situ measurements. Consistent with [20,66], cloud droplets are rarely observed above −15 dBZ, supporting the conclusion that their maximum reflectivity typically occurs near this threshold. Following the methodology of [20], we categorize cloud profiles into drizzling (including drizzle, virga, rain, and snow) and non-drizzling (pure cloud) cases. A cloud profile is classified as drizzling if any radar reflectivity exceeding −15 dBZ is detected in a vertical column. A key distinction from [20] is that, while drizzle at the Atmospheric Radiation Measurement (ARM) Eastern North Atlantic (ENA) site is assumed to be exclusively in the liquid phase, drizzle over the SO may occur in both liquid and ice phases [32]. For the observed low-level cloud profiles, 45.7% were identified as non-drizzling and 54.3% as drizzling (or precipitating) cloud cases in this study.
For non-drizzling cases (i.e., all reflectivity values in a column < –15 dBZ), Hbase is defined as the lowest altitude with a valid radar reflectivity return. Reflectivity above the cloud base contains contributions from both cloud droplets and drizzle drops, whereas below the cloud base, it primarily reflects the presence of drizzle alone. Near the cloud base, cloud droplets may grow into drizzle drops through collision–coalescence processes, leading to a sudden increase in radar reflectivity and Vd or WID due to the presence of larger particles and stronger downdraft. Higher WID or Vd around the cloud base indicates a greater turbulence and wider range of particle velocities observed, which correlate to potentially stronger turbulence and likely drizzle. As these drizzle drops fall below the cloud base, they may partially or fully evaporate in subsaturated conditions, causing a decrease in reflectivity with decreasing altitude (similar to the profile shown in Figure 2b of [20]). Therefore, in drizzling cloud cases (e.g., virga), Hbase is estimated along the radar viewing direction as the altitude where the dBZ and Vd (and/or WID) values exhibit a marked increase (from the top towards the surface). A threshold of Vd or WID > 0.5 m/s is used in conjunction with a local maximum gradient in dBZ values to identify the Hbase, which indicate the transition from a cloud layer dominated by small droplets to a drizzle layer characterized by larger falling particles. A special case arises when dBZ exceeds 5 near the surface, indicating strong precipitation (e.g., rain; [28]). For these profiles, the true Hbase is estimated by examining the vertical gradient of dBZ along with Vd (and/or WID) values above the first altitude where reflectivity exceeds 5 dBZ.
Cloud thickness (ΔH) is then calculated as the difference between cloud-top and cloud-base heights, ΔH = Htop − Hbase. Cloud transects with shallow vertical heights, and small horizontal extents were excluded from this study. Only single-layered, low-level clouds (<3 km) are considered in this study. Furthermore, for cases where cloud vertical columns were intersected by aircraft ascents or descents, HCR cannot reliably observe cloud top or base due to its fixed nadir or zenith-pointing configuration, which can potentially lead to bias in boundary or LWP retrieval. As a result, only fully sampled cloud profiles, that is, both cloud base and top are simultaneously observed by the radar, were considered for boundary and phase estimation.

2.3.2. Determination of Cloud Phase

To ensure reliable phase classification, we exclude segments prone to high uncertainty, such as noisy pixels or very thin layers from steep sawtooth crossings and include only complete cloud profiles (as mentioned in the previous Section 2.3.1). The empirically derived exponential relationship LWC = 0.70Z0.29 was applied to the HCR-observed reflectivity measurements to retrieve a 2D time–height LWC profile and column integrated LWP. LWP retrievals from microwave radiometers during ARM program have associated uncertainties ranging from 15 to 30 g/m2 [67], which align with the uncertainty estimates (~20 g/m2) of LWP retrievals obtained via statistical methods [68] from DSD spectra. Consequently, a threshold of 20 g/m2 is employed in this study to distinguish between liquid or mixed clouds (LWP ≥ 20 g/m2) and ice clouds (LWP < 20 g/m2).
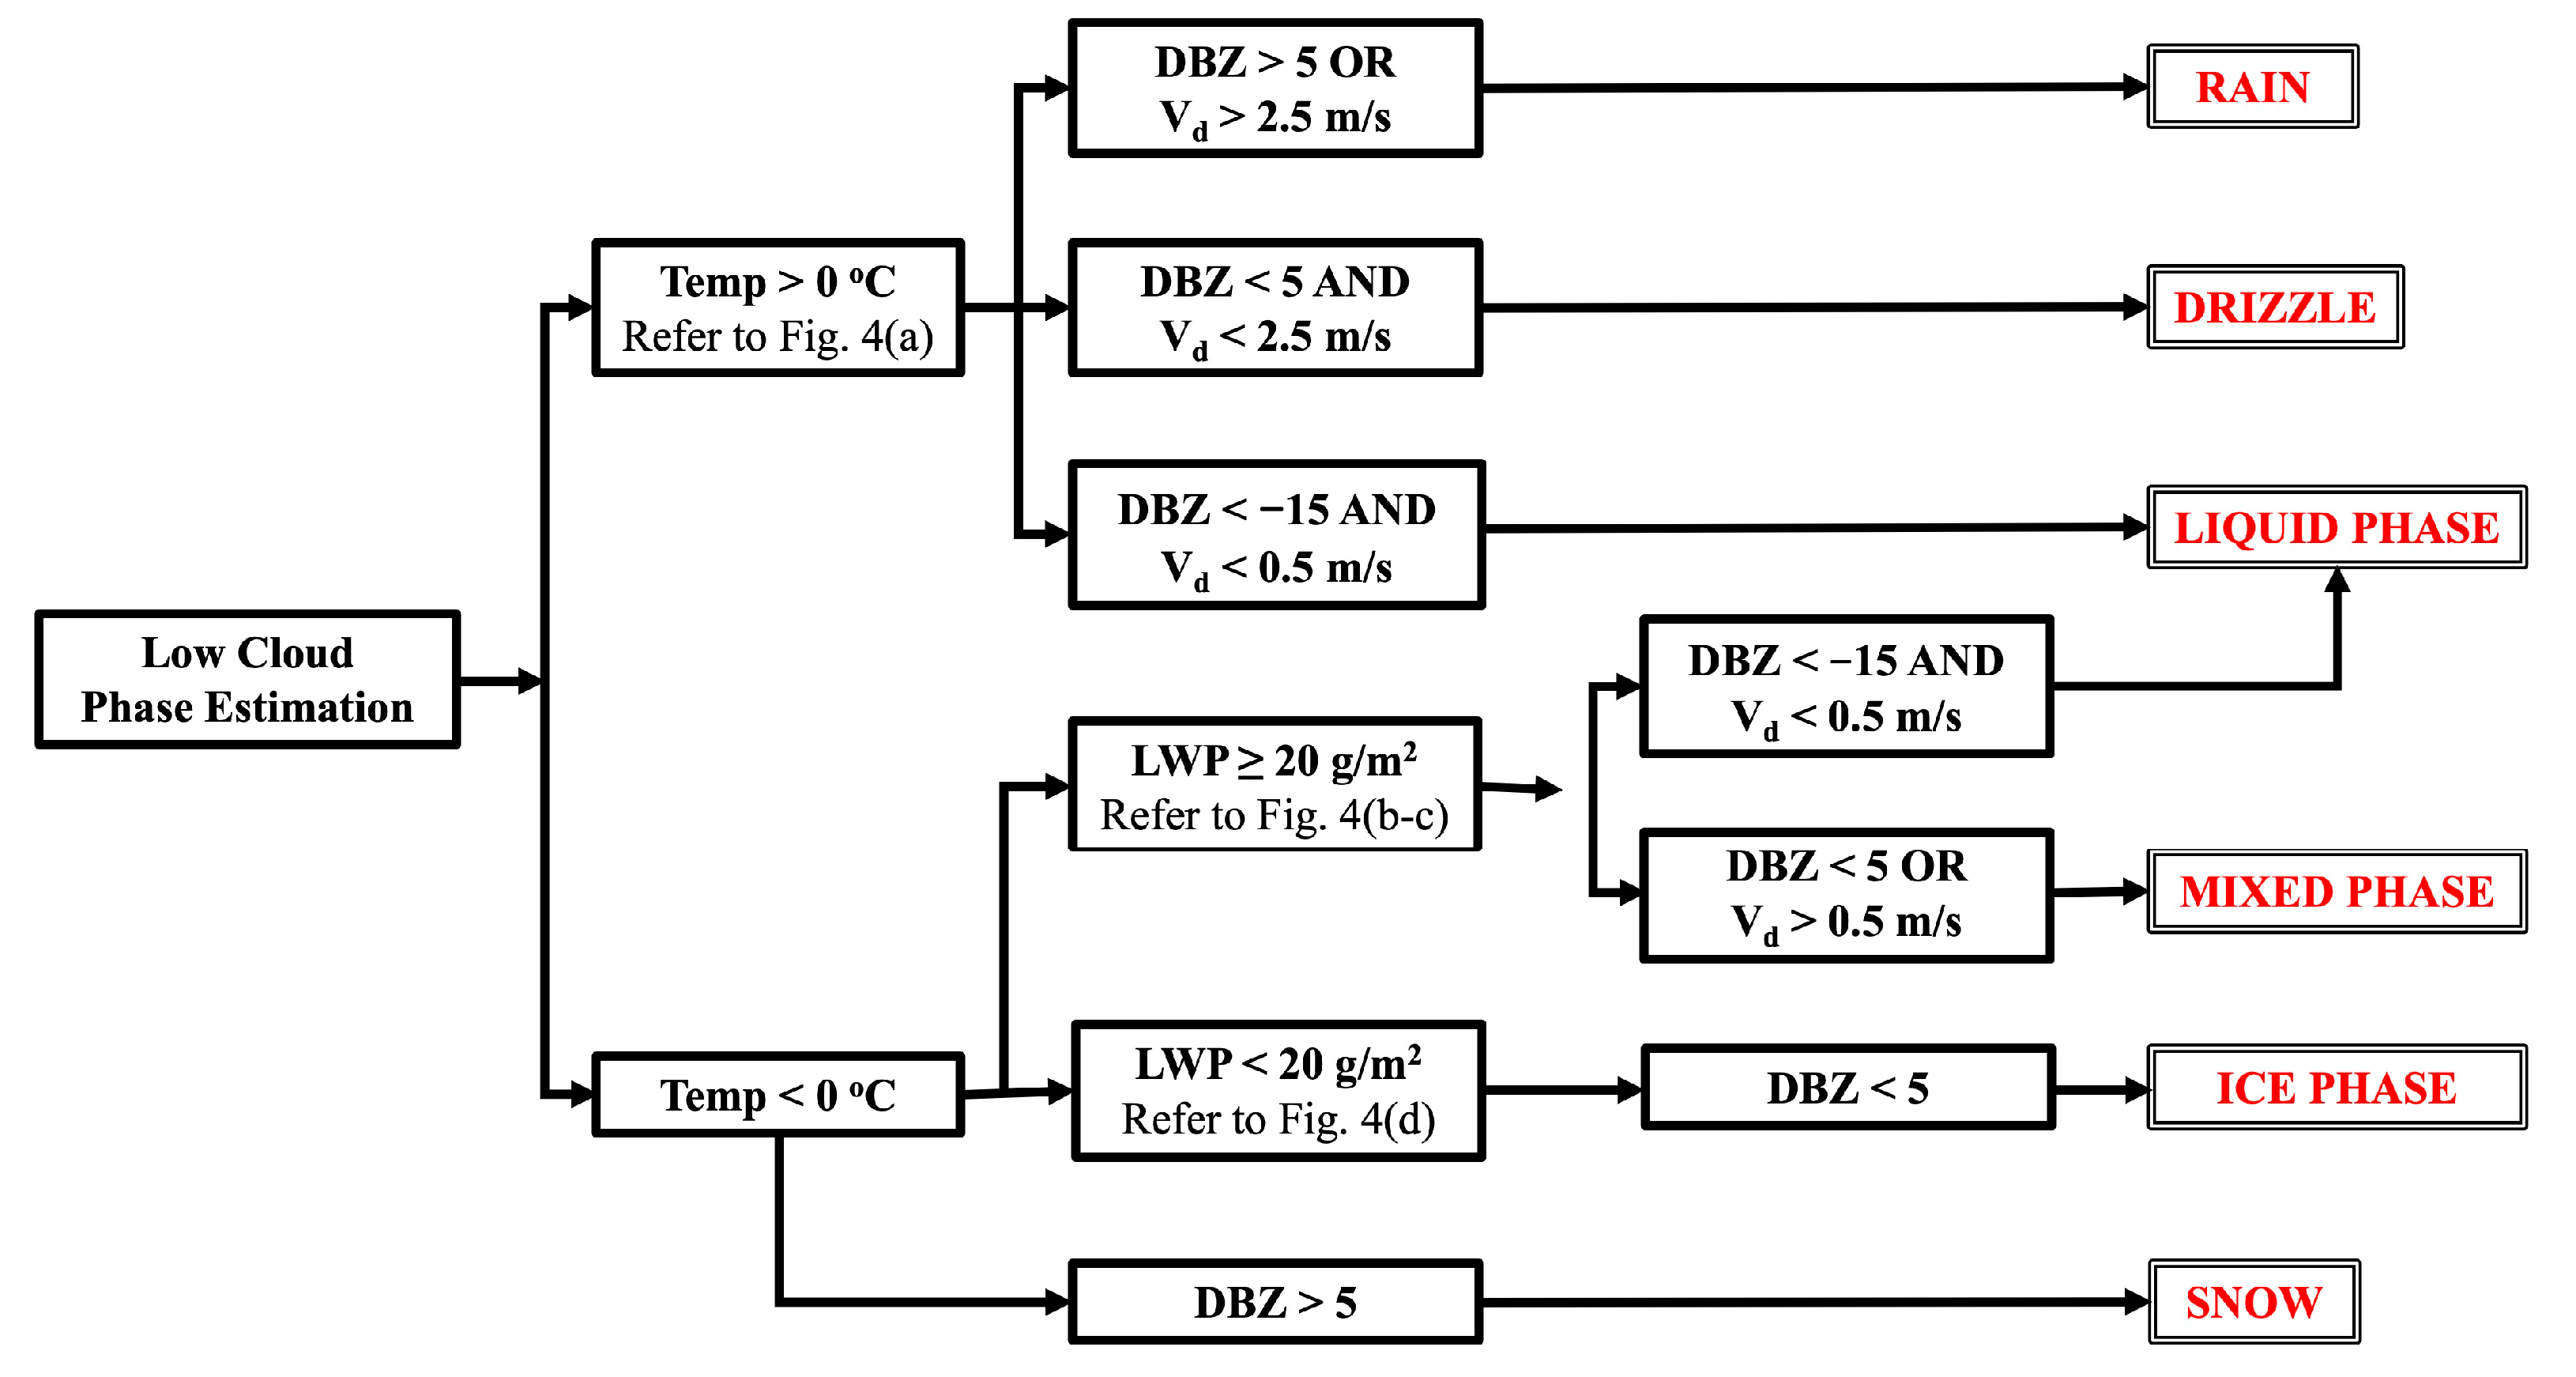
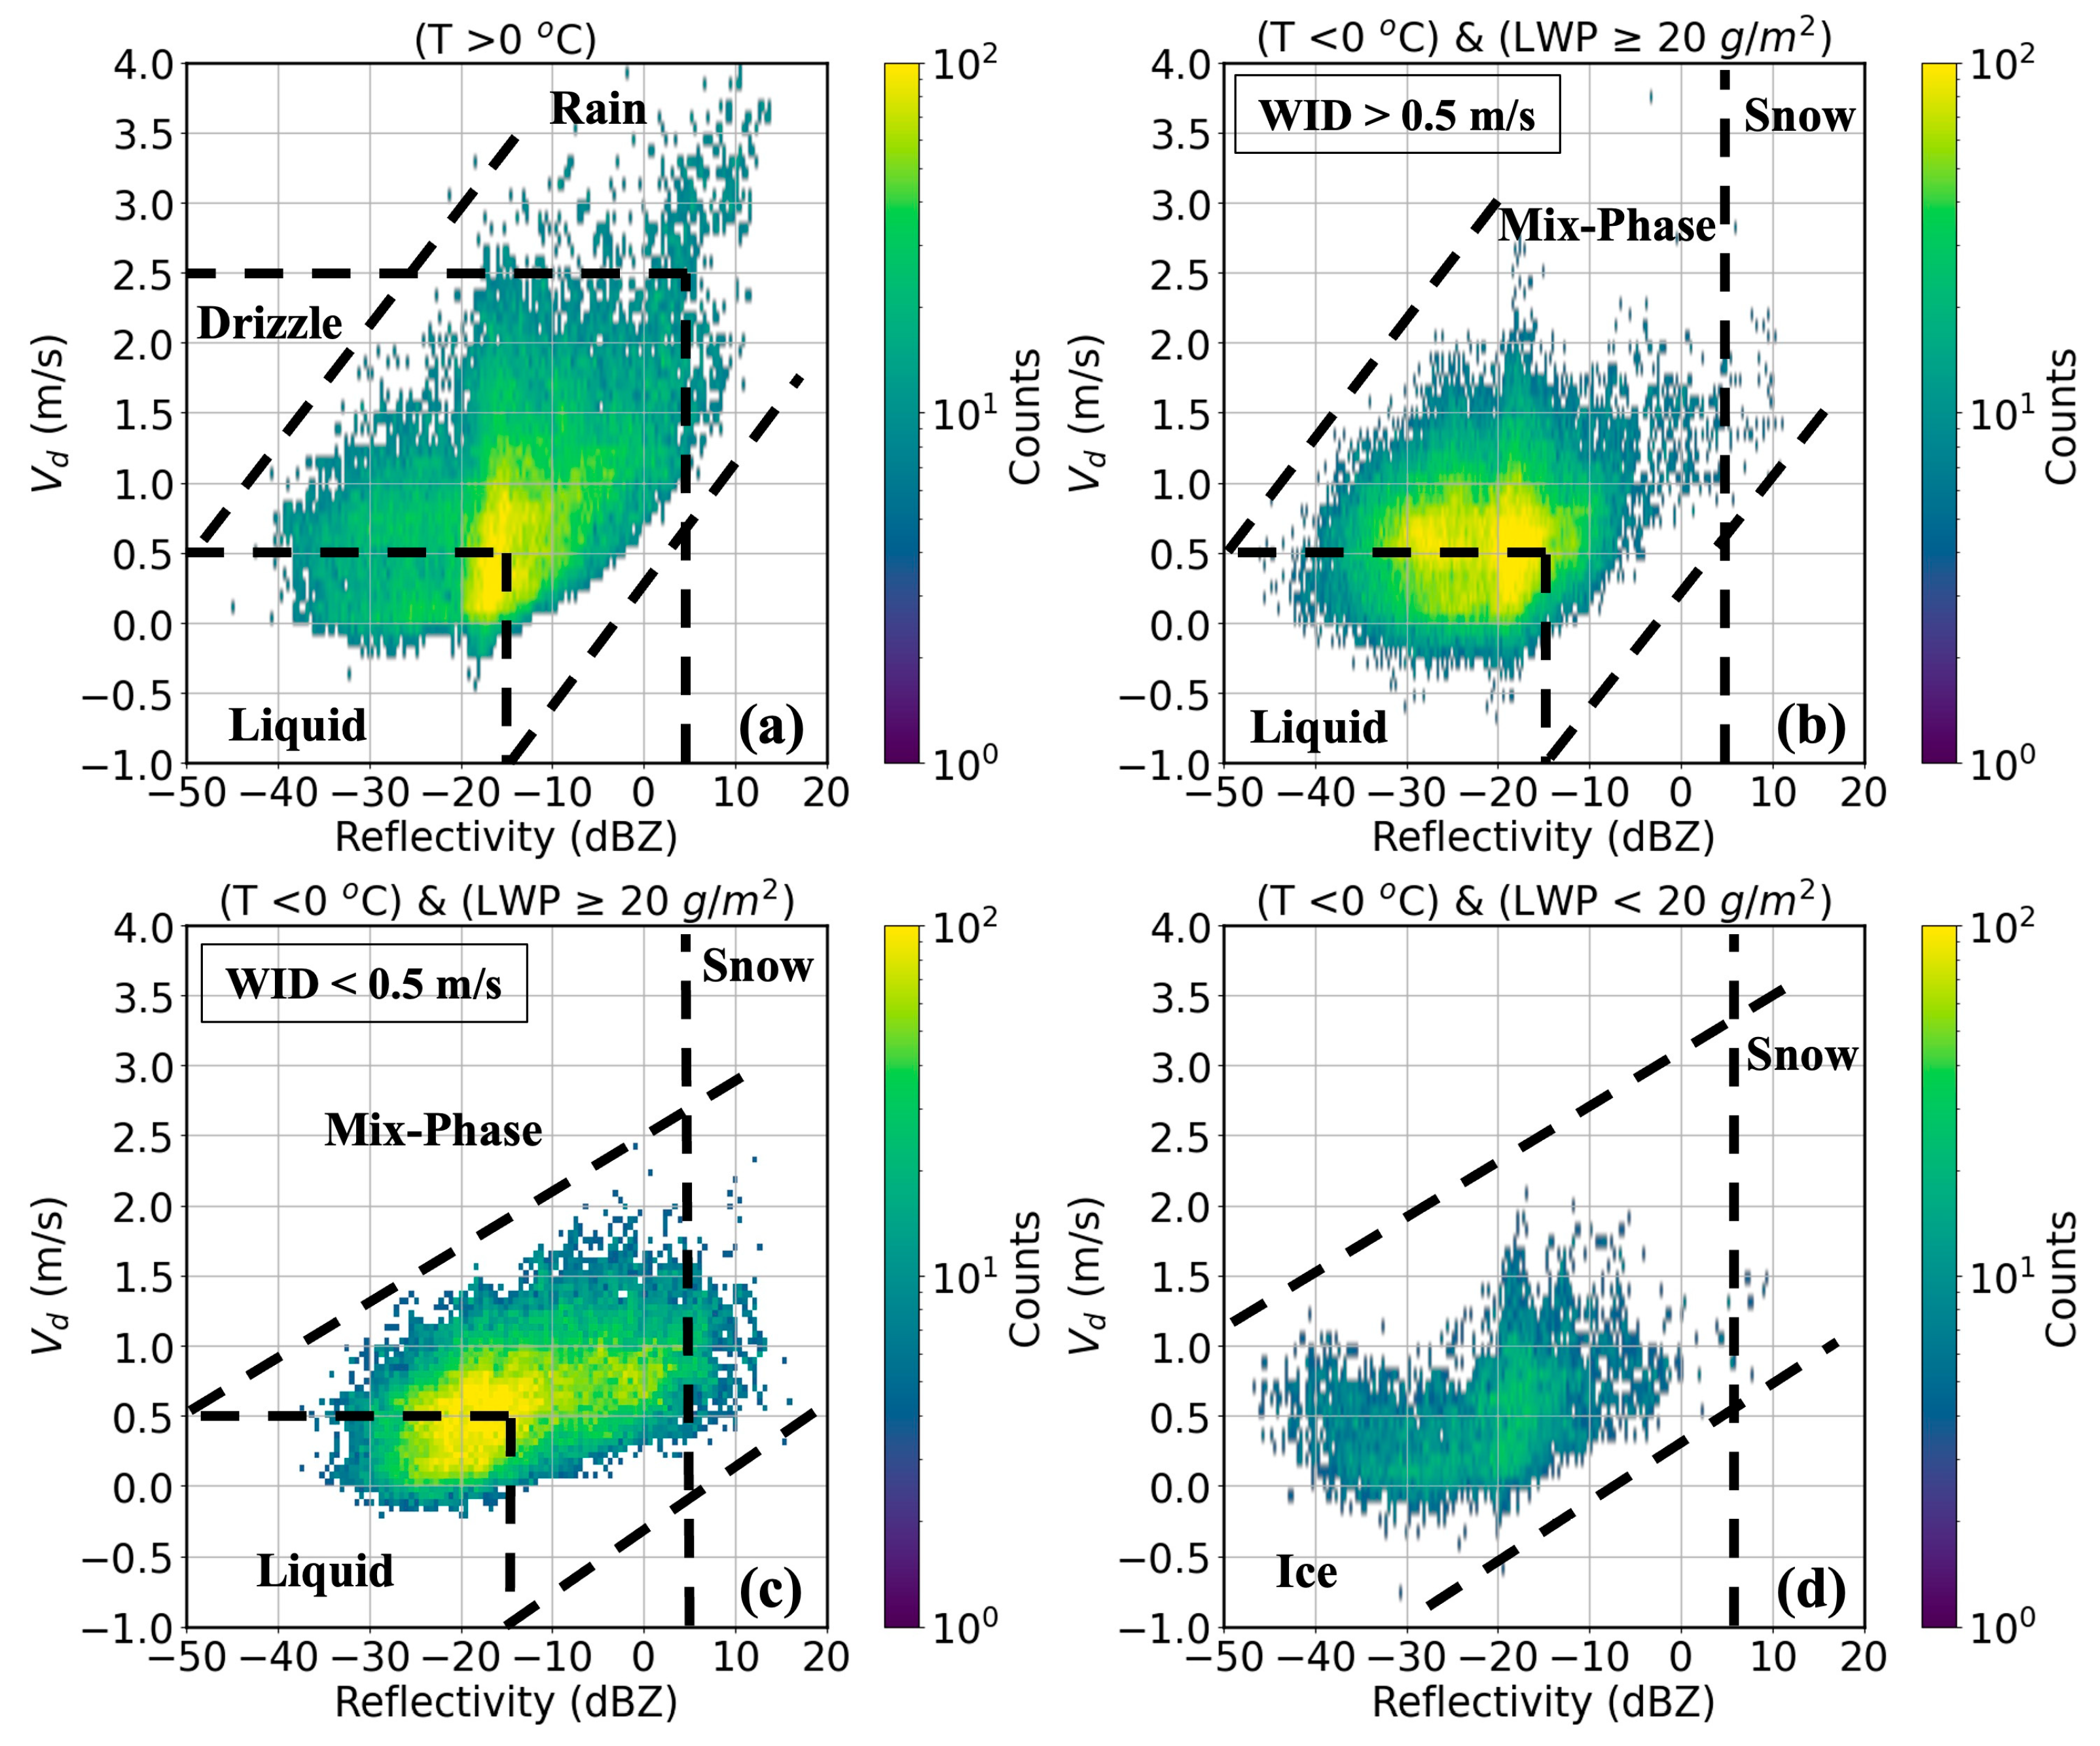
Figure 3 presents the flowchart for determining cloud phase for the classified low-level clouds (Htop < 3 km). The phase partitioning method applies a set of combined filters to classify the cloud phase in a 2D profile as liquid, mixed, or ice from cloud base to cloud top. Additional hydrometeor types, such as drizzle, rain, and snow, are identified from valid pixels below the cloud base for drizzling cloud cases. Phase classification is carried out in a stepwise manner. The cloud-phase classification in this study—based on profiles of air temperature (T), LWP, HCR reflectivity (dBZ), Doppler velocity (Vd), and Doppler spectrum width (WID), as described in Figure 3—is performed in conjunction with the bivariate histograms presented in Figure 4 for classifying liquid, mixed, ice, drizzle, rain, and snow-phase types. Because of overlapping constraints across multiple datasets, preserving the order of classification is important. Note that the bivariate histograms were generated using all valid pixels combined, with no filtering based on cloud boundaries.
Regions with strong precipitation are identified using HCR reflectivity profile (dBZ > 5, [28]) below cloud base, classified as rain in warm conditions (temperature, T ≥ 0 °C) or snow in cold conditions (T < 0 °C). For warm cloud regions, cloud liquid droplets are identified with dBZ ≤ −15 and weak updraft (Vd ≤ 0.5 m/s), drizzle drops are classified with higher reflectivity (−15 < dBZ ≤ 5, [20]) and moderate downdraft (0.5 m/s < Vd ≤ 2.5 m/s), while rain drops are categorized with extremely strong downdrafts (Vd > 2.5 m/s) and the highest reflectivity (dBZ > 5). Figure 4a presents the classification of hydrometeor types within warm cloud regions, distinguishing the categories of liquid phase clouds, drizzle, and rain. A clear linear relationship between Vd and dBZ is observed, with drizzle dominating the distribution, even in cases where dBZ < −15 and Vd > 0.5 m/s. These findings are consistent with [69], who reported a high drizzle frequency (~71.8%) in MARCUS field campaign data. Although ice and snow particles may occasionally persist briefly in layers slightly warmer than 0 °C, such occurrences are short-lived in the marine boundary layer, where frozen hydrometeors typically melt when passing through sufficiently deep warm layers, particularly at higher fall speeds.
As discussed, a threshold of LWP = 20 g/m2 is used to classify cloud phase: ice clouds (LWP < 20 g/m2) and mixed-phase or liquid clouds (LWP ≥ 20 g/m2), as illustrated in Figure 3. From adiabatic scaling, a liquid cloud would need to be extremely shallow (<100 m) to yield LWP < 20 g/m2; thus, this threshold is highly unlikely to misclassify typical liquid-dominated cloud regions (which generally have depths of ~250 m or more). The width of the Doppler spectrum (WID) serves as an indicator of cloud microphysical variability, with lower WID values suggesting homogeneous, single-phase clouds and higher WID values, indicating increased turbulence, wind shear, or mixed-phase conditions [28]. In subfreezing regions (T < 0 °C), clouds characterized by low WID and weak updrafts (Vd < 0.5 m/s) are classified as liquid, typically composed of small droplets and SLW. Mixed-phase clouds are identified when both WID and Vd exceed 0.5 m/s, indicating greater turbulence and broader hydrometeor size distributions.
Clouds with WID > 0.5 m/s and Vd < 0.5 m/s (or vice versa) are reclassified based on reflectivity as mixed-phase when dBZ > −15 and as liquid when dBZ < −15. Since radar reflectivity is proportional to the sixth power of particle diameter [44], clouds composed of small, uniform liquid droplets exhibit lower dBZ values, while mixed-phase clouds produce higher reflectivities due to the presence of larger particles. The classification of liquid and mixed-phase clouds under varying turbulence conditions is shown in Figure 4b (WID > 0.5 m/s) and Figure 4c (WID < 0.5 m/s). There is a linear Vd–dBZ relationship observed for most reflectivities, similar to that in Figure 4a, but with different slopes. The 2D distribution pattern in Figure 4c resembles that of Figure 4a, further supporting the dominance of drizzle in low clouds over the SO. Ice-phase regions (T < 0 °C and LWP < 20 g/m2) are depicted in Figure 4d, where ice is distinguished from snow in low-turbulence environments (WID < 0.5 m/s) by low reflectivity (dBZ < 5).
In regions where LWP ≥ 20 g/m2, pixels with elevated LWCs (>0.2 g/m3) are reclassified as pure liquid-phase clouds [28]. Snow classification, presented in Figure 4b–d, applies to all regions with T < 0 °C. Where both LWP > 20 g/m2 and subfreezing temperatures occur, precipitation may include supercooled (or freezing) rain in turbulent environments (WID > 0.5 m/s, Figure 4b) or rimed snow and graupel in less turbulent settings (WID < 0.5 m/s, Figure 4c). These regions are uniformly identified as snow, based on the assumption that supercooled precipitation freezes upon descent due to contact with airborne particles in downdrafts [70]. Snow generally exhibits slower terminal fall velocities than rain; however, overlap in observed Vd distributions arises from aggregation, riming, and turbulence. Using a common Vd threshold together with temperature information provides a consistent and conservative classification across the snow–rain transition.
Although the phase-classification thresholds for WID, Vd, and dBZ were specifically tuned for clouds sampled during SOCRATES, we expect them to be broadly applicable to MBL clouds over the SO. To ensure consistency, the phase-diagnostic thresholds adopted in this study were compared with values reported in previous studies (e.g., [28,32,34,35]). As noted in [28], there may be occasional cases where the applied Vd and WID thresholds may suggest a dominant mixed or liquid phase, even in the presence of significant ice hydrometeors at that altitude.

3. Results and Discussions

As stated previously, low-level clouds were the most frequently observed cloud type, accounting for ~85% of occurrences across the 15 research flights during SOCRATES. In contrast, other cloud types (>3 km) were less common and together accounted for less than 15%, reflecting the SOCRATES campaign’s sampling focus. These flights primarily sampled the cold sector of cyclones, occasionally crossing frontal systems associated with strong westerly winds over the SO. The combination of large-scale weather patterns and a cool ocean surface led to persistent cloud cover, predominantly low- and mid-level stratus and stratocumulus clouds [6,71].

3.1. Cloud Boundaries, LWC, and LWP: Results, Discussion, and Evaluation

3.1.1. HCR-Derived Cloud-Base and Top Heights (Hbase and Htop)

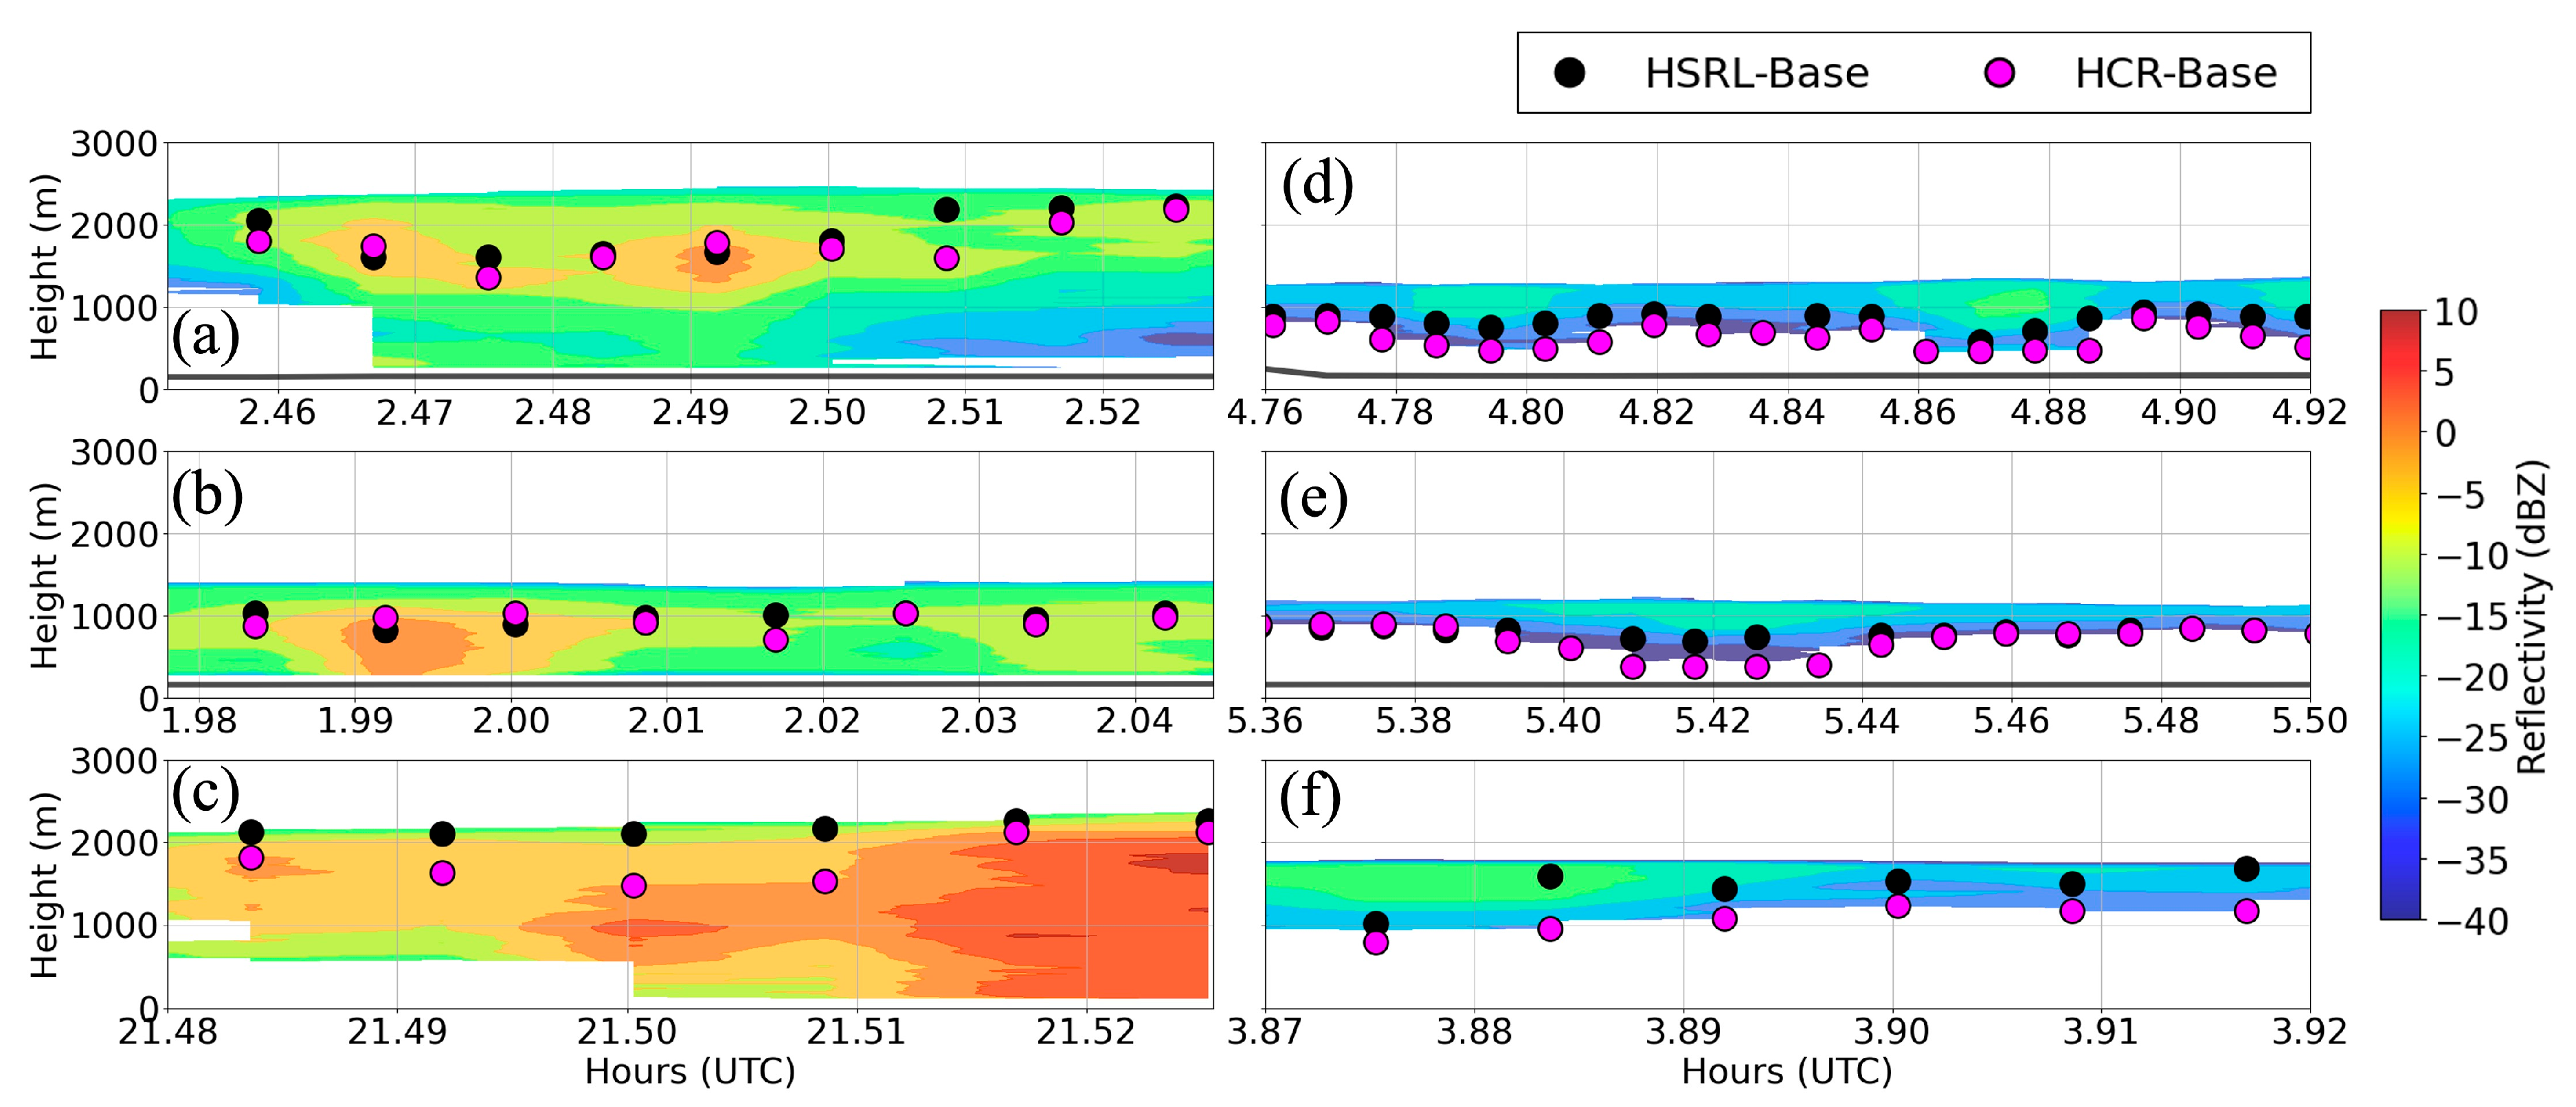
Table 1 summarizes the mean Hbase and Htop values derived from HCR measurements (Section 2.3.1) together with selected cases of retrieved cloud boundaries, shown in Figure 5. To evaluate the cloud-base estimation technique, the HCR-derived Hbase values were compared with those derived from GV-HSRL observations (HSRL-Hbase). For drizzling cases, the HSRL-Hbase was identified as the first range gate where the backscatter coefficient (β) exceeded 10−4 m−1sr−1, following [65]. Meanwhile, for non-drizzling clouds, we used a lower threshold of 10−4.5 to 10−5 for estimating HSRL-Hbase on a case-by-case basis (following [28,72,73]). These thresholds are developed based on studying the slope of the HSRL backscatter signal [72]. The signal slope in drizzle (or virga) is typically weaker than in clouds, with dense water clouds showing a steep positive slope above the virga layer, followed by strong attenuation below [73]. Furthermore, cloud cases were also segregated into looking up (where the aircraft flew below the cloud base with a zenith-pointing radar–lidar view direction) and looking down (where the aircraft flew above the cloud top with a nadir-pointing radar–lidar view direction). The looking-up cases comprised only ~20% of the total samples in SOCRATES [39], and these cases will be used as a baseline to compare the HCR- and HSRL-derived Hbase.
Figure 5 illustrates the estimated cloud boundaries with two drizzling (Figure 5a,b) and two non-drizzling cases (Figure 5d,e) for looking up, and one drizzling (Figure 5c) and non-drizzling case (Figure 5f) for looking down. To complement the HCR reflectivity profiles in Figure 5, the HSRL backscatter profiles, along with derived cloud boundaries for the same cases (as in Figure 3), are presented in Supplementary Figure S1. The comparison between HCR- and HSRL-detected Hbase are performed only for cloud profiles that were simultaneously observed by both the instruments. As demonstrated in Figure 5, both HSRL- and HCR-derived Hbase heights show a decent agreement, where HSRL-Hbase are slightly higher than the HCR-Hbase for both drizzling and non-drizzling (looking up) cases. The statistical results listed in Table 1 show that the mean HCR-Hbase for drizzling and non-drizzling cases (looking up) are 1.1 km and 0.7 km, respectively, while their corresponding HSRL-Hbase are 0.25 and 0.21 km higher than their HCR counterparts. In general, the HSRL backscatter signal exhibits its steepest slope a couple range gates above the HCR-derived Hbase, resulting in slightly higher HSRL-Hbase estimates. The Hbase difference from HCR and HSRL represents different sensitivities of radar and lidar to cloud/drizzle particle size distribution. Lidar is sensitive to the second moment of the particle size distribution, while radar is sensitive to the sixth moment. Quite often, radar-derived Hbase are lower than lidar-Hbase, especially for drizzling clouds [74]. For non-drizzling clouds, lidar may not detect the thin cloud edge near the true base due to lower particle concentrations or signal-to-noise limitations, whereas radar can detect hydrometeors near the cloud edge, including evaporating particles or low concentrations of smaller droplets.
For looking-down cases (Figure 5c,f), the HSRL signal often attenuates rapidly near the cloud top and cannot penetrate deeper into the cloud layer, preventing reliable detection of the cloud base in these cases. Therefore, for looking-down cases, the HCR- and HSRL-derived Hbase heights exhibit significant differences, as shown in Figure 5c (drizzling) and Figure 5f (non-drizzling). Lidar measurements are inherently subject to attenuation, which can obscure the cloud base detection. Table 1 also lists the mean HCR- and HSRL-derived Hbase for looking down (drizzling and non-drizzling) cases. HCR-Hbase means are 1.12 and 0.64 km for drizzling and non-drizzling (looking down) cases, while the corresponding HSRL-Hbase means are 1.7 and 0.97 km, respectively. The looking-down HCR-Hbase means mimic their looking-up counterparts, while the looking-down HSRL Hbase means are much higher than their looking-up counterparts, especially for drizzling cases.
To evaluate the HSRL- and HCR-derived Hbase (and Htop), nearby aircraft in situ measurements from selected cases during SOCRATES are used. HCR-derived cloud boundaries are specifically evaluated against the aircraft in situ measurements from sawtooth segments of SOCRATES research flights, where the aircraft intersected full cloud profiles (as defined in [65]). Since the HCR-based method identifies boundaries only for complete, non-intersected cloud profiles, the comparison was limited to the in situ estimated cloud boundaries, which are located in close proximity (or nearest adjacent) to the HCR-derived Hbase (and Htop). Valid in situ cloud samples and boundaries were identified using the combined threshold of the cloud-droplet number concentration (Nc) > 5 cm−3 and liquid water content (LWCc) > 0.01 g/m3 [75,76], similarly mentioned in Section 2.2. Drizzling samples were identified if valid drizzle samples (drizzle-drop number concentration Nd > 0.001 cm−3) existed below the cloud base [56]. A total of 29 such cases were selected, which are listed in the Supplementary Table S1 for comparison purposes, while their average Hbase and Htop are listed in Table 1. As shown in Table 1, the in situ-derived mean Hbase values are 1.18 km for drizzling cases and 0.60 km for non-drizzling cases, while the corresponding Htop values are 1.88 km and 1.87 km, respectively. These mean Hbase and Htop values agree with the HCR-derived estimates to within 100 m under both drizzling and non-drizzling conditions. The observed differences arise because the sawtooth flight paths typically span the full vertical extent of cloud layers (crossing the HCR-observable cloud boundaries), while HCR has a detection offset of ~100 m compared to in situ probes.
Finally, the SOCRATES HCR-derived Hbase and Htop are also compared against corresponding estimates by the Micropulse Lidar (MPL), ceilometer, and 95 GHz W-band ARM Cloud Radar (WACR) measurements collected during the Measurement of Aerosols, Radiation, and Clouds (MARCUS) ship-based campaign. These comparisons were conducted for low-level clouds within a spatiotemporally collocated region over the SO (Appendix A.2, and Figure A1). Figure 6 illustrates the probability distribution functions (PDFs) of HCR-derived Hbase and Htop during SOCRATES (both looking up and looking down) and from the surface-based ceilometer/MPL measurements during the MARCUS campaign for both drizzling and non-drizzling cases. The peaks of Hbase and Htop during MARCUS are around 0.8 and 1.2 km, with means of 0.93 and 1.4 km, while the HCR-derived Hbase and Htop are widely distributed, with means of 0.9 and 1.7 km, respectively. The Hbase and Htop derived from MARCUS measurements under drizzling and non-drizzling conditions (from [69]) are further classified as drizzling and non-drizzling cases, and their means are listed in Table 1. Their Hbase means for drizzling and non-drizzling cases are 0.99 and 0.87 km, which are close to the SOCRATES HCR counterparts (1.1 and 0.7 km); however, the Htop means are about 0.2 km higher than the HCR counterparts.

3.1.2. Cloud LWC and LWP

The predicted LWCs derived from the LWC–Z relationship (in Section 2.2) were evaluated against in situ CDP+2D-S measurements for the 62 profiles, yielding mean values of 0.20 g/m3 and 0.26 g/m3, respectively, with an RMSE of ≈0.03 g/m3. The corresponding predicted and in situ LWPs (93.7 g/m2 and 95.6 g/m2) showed close agreement (RMSE ≈ 12 g/m2). Applying the empirical relationship LWC = 0.70Z0.29 produced 2-D time–height LWC profiles and column-integrated LWPs exhibiting adiabatic increases from cloud-base and entrainment-driven decreases near the cloud top. The derived LWC and LWP differed from in situ estimates by ~22% and 1.9%, respectively, with mean LWP ≈ 136 g/m2 and uncertainty ≈ 20 g/m2. To assess the impact of the in situ probe’s LWC and Z measurement uncertainties on the derived coefficients (a, b) of the LWC-Z relationship, a Monte Carlo approach was used to propagate the underlying measurement errors. The LWC values was randomly perturbed within ±10%, while Z was perturbed by ±1–2 dB, which corresponds to the known HCR reflectivity uncertainty. The relationship LWC = aZb was recalculated through 100,000 Monte Carlo iterations, yielding a new distribution of a and b estimates. The uncertainties associated in the coefficients were estimated from one standard deviation of the 100,000 iterations, which reflect the propagation of the ±10% LWC and ±1–2 dB Z uncertainties. These perturbations produce typical uncertainties of around ±0.05 in a and ±0.02 in b, representing the variability in LWC-Z coefficients arising from measurement uncertainties in the underlying variables (see Figure S3 in the Supplementary). As discussed earlier, the derived LWC–Z relationship was optimized for low-level stratocumulus clouds observed during SOCRATES and is expected to be applicable to similar MBL cloud cases over the SO within the reflectivity range of −30 to 5 dBZ, though uncertainties remain due to droplet-size variability. Its applicability to other cloud regimes or regions and field campaigns would require significant recalibration using locally representative in situ data.
The cloud LWP during the MARCUS campaign [32,69,71,77,78] was retrieved using a physical-iterative algorithm applied to ship-based microwave radiometer (MWR) brightness temperature measurements at 23.8 and 31.4 GHz. Figure 6c presents the PDFs of LWPs derived from SOCRATES and MWR-retrieved LWPs from the MARCUS campaign for low-level clouds, showing similar trends between the two datasets. The mean LWPs derived from SOCRATES and MARCUS are 135.62 g/m2 and 123.96 g/m2, respectively. Overall, based on the detailed case comparisons and statistical comparisons, the HCR-derived Hbase, Htop, and LWP for low-level clouds during SOCRATES demonstrate good agreement with aircraft in situ measurements and the ship-based measurements during the MARCUS campaign within measurement uncertainties.

3.2. Results from Low-Level Cloud Phase Classification

An LWP greater than the retrieval uncertainty (≥20 g/m2) indicates the presence of liquid water (at T > 0 °C) or SLW (at T < 0 °C). Larger ice particles, being denser than liquid droplets, typically exhibiting broader WIDs and higher fall speeds [32]. A significant number of drizzle (at T > 0 °C) and mixed-phase (T < 0 °C) samples were observed near the cloud base, likely driven by elevated WID and Vd values. Mixed-phase clouds represent a complex three-phased colloidal system in which SLW droplets coexist with ice crystals, influencing both the nature of mixed-phase layers (genuinely and/or conditionally mixed) and underlying microphysical processes [38,79]. The SO clouds sampled during SOCRATES exhibited significant spatial heterogeneity, as presented in [6]. Low-level clouds generally exhibit higher temperatures than recorded aircraft temperatures due to altitude differences between flight paths and cloud boundaries. Analyzing the air temperature indicates that mode temperatures ranged between −5 °C and 0 °C for all three phases (liquid, mixed, and ice). Notably, mixed-phase clouds show a higher occurrence between −15 °C and −2.5 °C, underscoring the spatial heterogeneity of low-level stratocumulus clouds, consistent with the findings from [6,79].
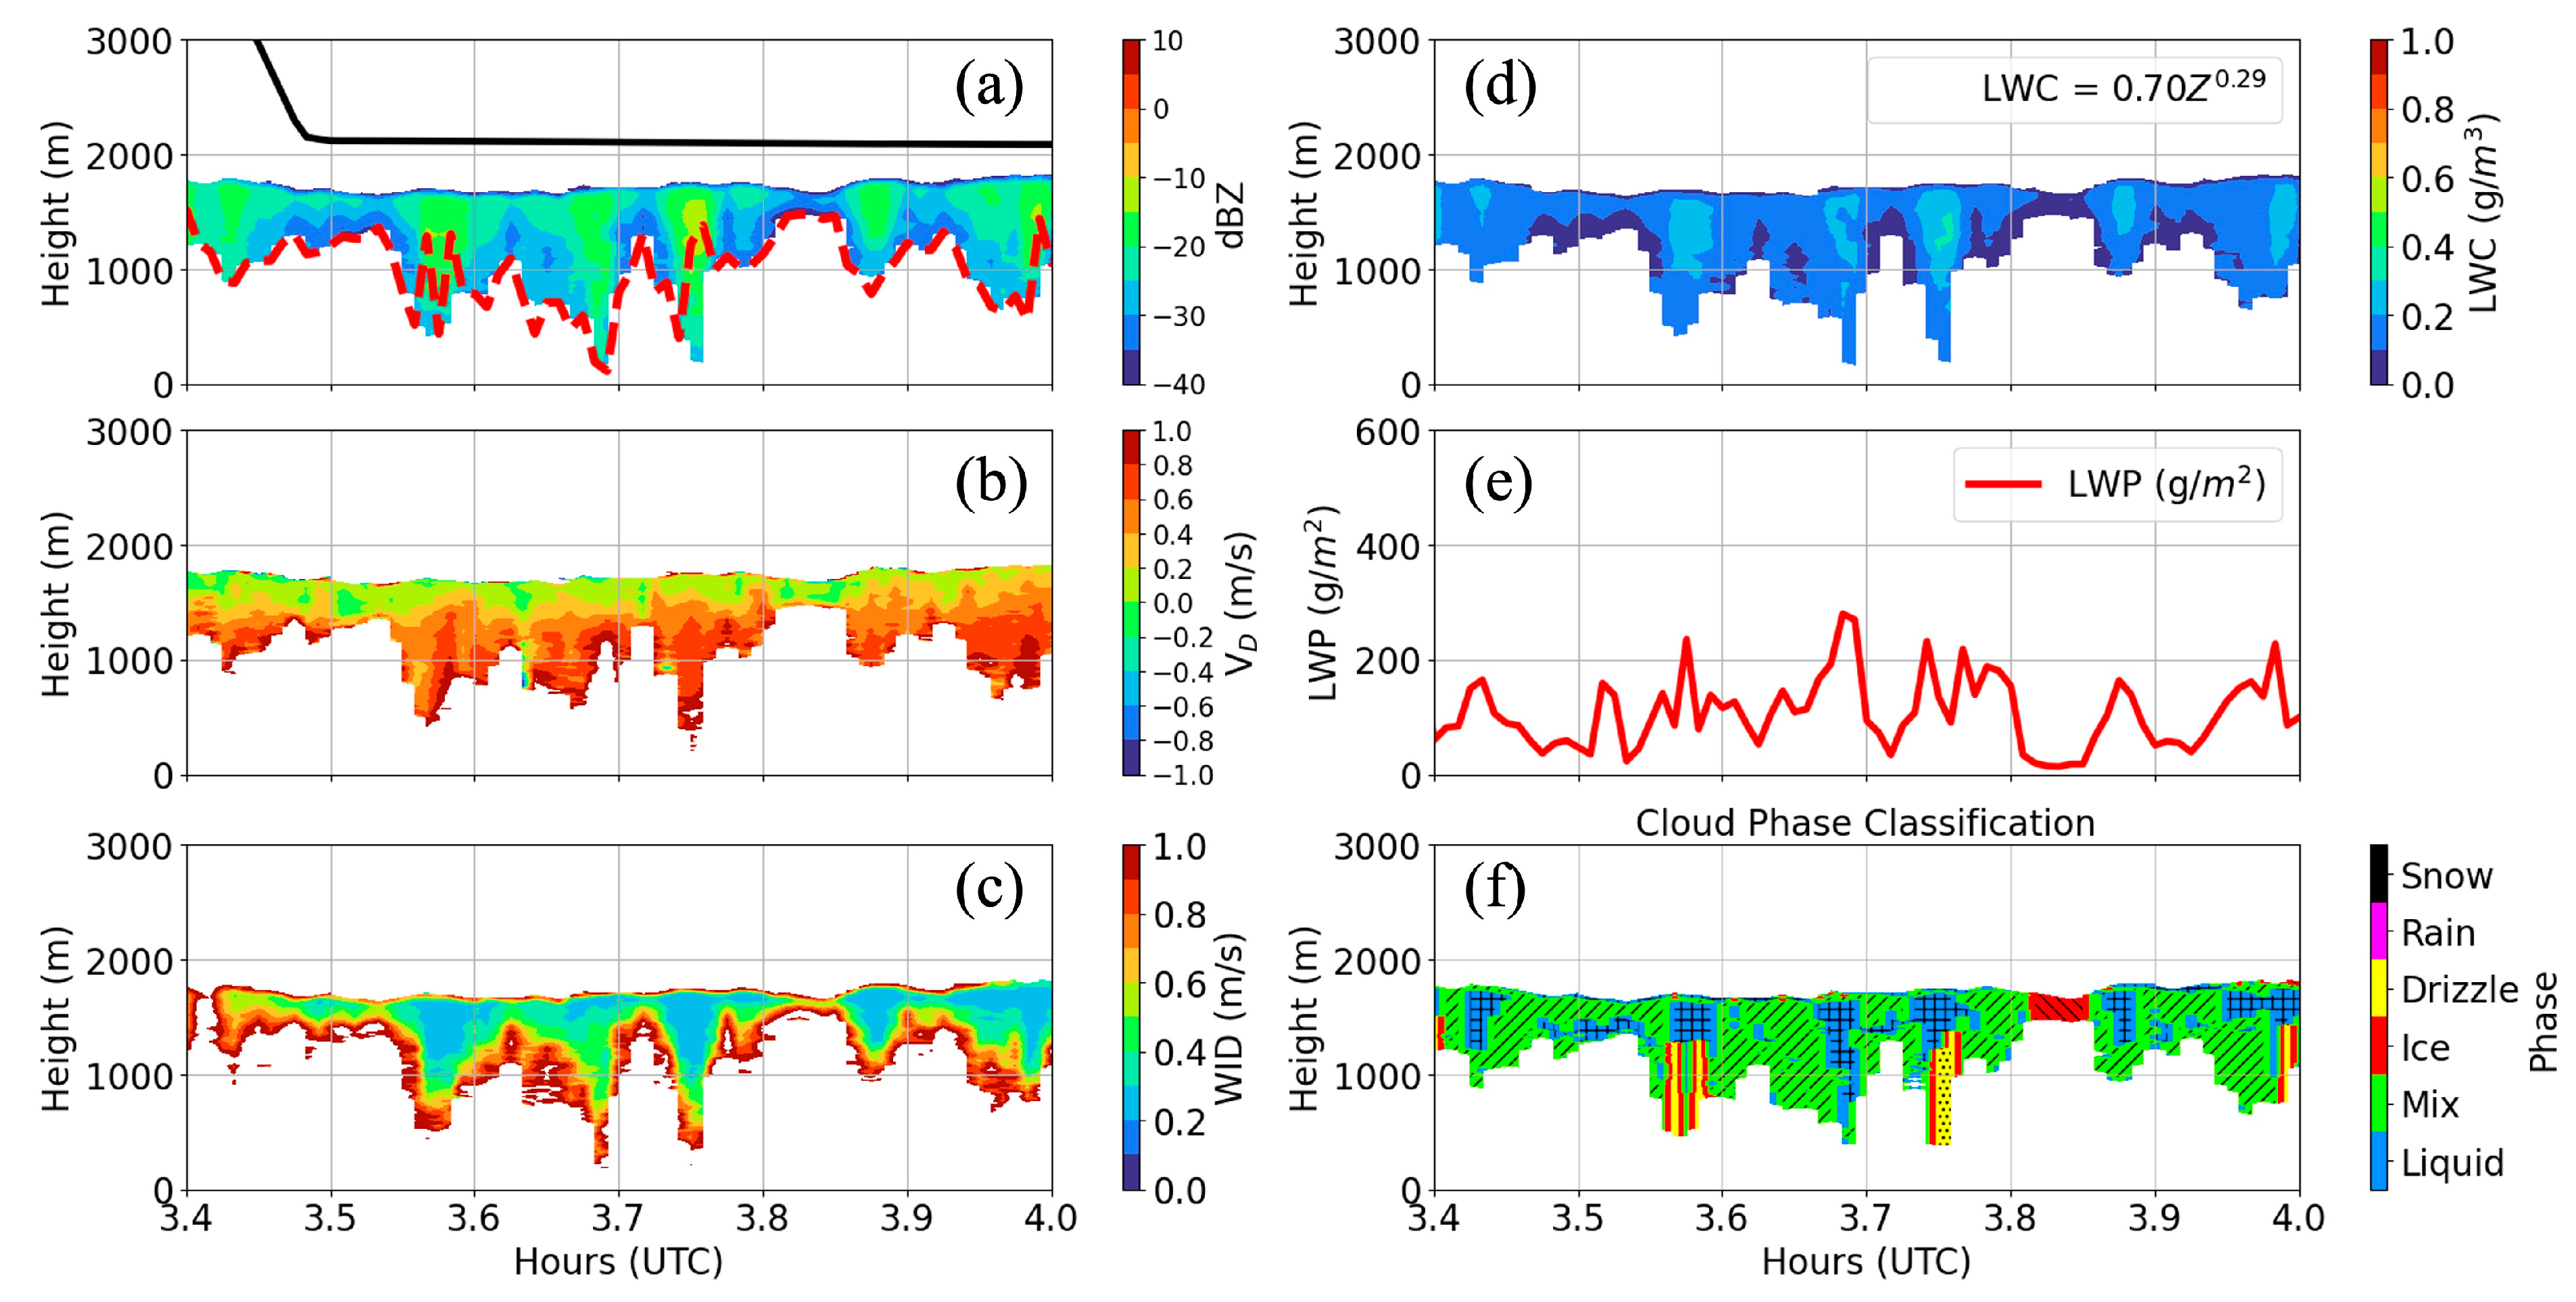
Based on a 30 s temporal averaging interval, the classification method developed in this study identified liquid-phase clouds (including SLW) as the most frequent category, accounting for 40.6% across all observed cloud samples. Mixed-phase and ice-phase clouds comprised 18.3% and 5.1%, respectively. Increasing the temporal averaging interval results in a higher proportion of mixed-phase clouds and a corresponding decrease in the occurrence of single-phase clouds. Drizzle was identified in 29.1% of the cloud cases, while rain (3.2%) and snow (3.7%) were relatively rare. The classified drizzle, rain, and snow categories correspond to only drizzling cloud cases for falling hydrometeors observed below the cloud base. Figure 7a–e illustrates the profiles for HCR-dBZ, WID, Vd, LWC, and LWP for a flight case (RF07), with Figure 7f showing the resulting classified phases. Notably, regions where mixed-phase layers overlay liquid-only columns suggest cloud-top entrainment. In these cases, the mixing of dry air into the cloud top enhances the evaporation of liquid droplets, promoting the formation of mixed-phase conditions.

3.3. Evaluation of Phase-Classification Results with Existing Methods

Cloud-phase classification is highly sensitive to observational scales, sampling strategy, and instrumentation type. The phase-classification method developed in this study (hereinafter referred to as HCR-phase) has been evaluated through comparisons with existing methodologies, grouped into three categories: (1) machine learning method based on in situ probes—multinomial logistic regression (MLR) [6,33], (2) fuzzy logic particle identification (PID) developed from airborne HCR and HRSL measurements during SOCRATES [34], and (3) ship-based radar–lidar–MWR measurements from MARCUS [32,80]. The comparative analysis aims to assess the strengths and limitations of the HCR-phase classification in the context of these existing methodologies for low-level clouds.

3.3.1. Comparison with In Situ Phase Classification (MLR)

A cloud-phase classification method using a multinomial logistic regression model trained on in situ measurements from the CDP, 2D-S, and Rosemount Icing Detector (RICE) collected during the SOCRATES campaign was presented in [6]. This model classified the cloud phase as liquid, mixed, or ice for samples at air temperatures below 0 °C. The MLR phase product was further refined in [33,81] by manually evaluating imagery from the 2D-S, 2D-C, and PHIPS (Particle Habit Imaging and Polar Scattering) probes. Among 1600 in situ samples collected below 3 km altitude, the MLR approach classified 52.3% as liquid, 9.5% as mixed-phase, and 38.2% as ice clouds. Approximately 39% of samples at temperatures above freezing (T > 0 °C) remain unclassified; including these unclassified samples during comparison would likely raise the overall fractions of liquid and mixed-phase clouds in the MLR dataset.
For comparisons with HCR-phase classification, MLR-phase product data [81] from the CDP and 2D-S probes within 100–200 m of the first valid HCR range gates were extracted. The corresponding HCR-phase data within this range from the probe measurements were manually tuned using a homogenizing box filter to identify the dominant phase across the first 2–3 nearest radar range gates and then reclassified into three broad categories: liquid, mixed, and ice. For instance, drizzle and rain were reclassified as liquid, while snow was reclassified as ice. Two main limitations constrain this comparison: (1) the spatial separation between the in situ probes and the radar observations [34], and (2) a limited number of overlapping samples. As discussed previously, HCR’s fixed nadir- or zenith-pointing configuration prevents the accurate detection of the cloud top or base during aircraft ascents or descents, as well as entire cloud profiles. Therefore, only fully sampled cloud profiles when aircraft flew either above or below the cloud layer were utilized for phase classification in this study, which excludes all sawtooth transects of aircraft tracks.
A total of 298 valid samples were identified for the MLR–HCR phase comparison, corresponding to flight segments that passed very close to or near the HCR-observed cloud boundaries. Hit rate percentages were computed following the method in [34], defined as the ratio of the number of classified phase samples in agreement between both methods (matched samples) to the total number of valid samples. As shown in Table 2a, both methods demonstrate a combined hit rate of ~60% across all phase samples, including 59% for liquid, 71% for mixed, and 48% for the ice phase. This comparison also reveals that there is a mismatch (or miss rate) of ~40% between the two methods. The MLR-phase distribution corresponding to each HCR-phase category is illustrated in Figure 8a. For MLR-classified liquid phase samples, the HCR-phase identifies 59% as liquid but 25% as mixed and 16% as ice within the range gates satisfying the spatial range criterion (~200 m). Similarly, for MLR-classified mixed-phase samples, the HCR-phase identifies 71% as mixed but 6% as liquid and 23% as ice. Finally, for MLR-identified ice-phase samples, HCR identifies 48% as ice but 37% as liquid and 15% as mixed. The specific sample count comparisons for each phase category between the HCR-phase classification and the MLR-method are summarized in the Supplementary Table S2.
A key challenge in comparing in situ probe-based phase classifications with the HCR method is the difference in observational scales and coverage. The limited number of comparable samples increases statistical variability, as reflected in the resulting overlap or hit rate of 60% between the compared methods. The MLR-phase classifiers are trained on microphysical probe data collected at the GV aircraft’s altitude and therefore cannot provide phase information across the full vertical extent of HCR-observed cloud profiles. This limitation is especially pertinent when the aircraft flew above or below the cloud layer. Furthermore, the MLR algorithm is specifically designed for classifying cloud phases under subfreezing conditions, making it most applicable to cold cloud environments. A substantial number of unclassified points—particularly those at temperatures above 0 °C—are excluded from final phase statistics, further complicating direct, one-to-one comparisons. Nevertheless, this comparison does provide a valuable approximation of how in situ measured cloud phases compare to HCR-derived cloud phases.

3.3.2. Comparisons with Fuzzy Logic Particle Identification (PID)

A fuzzy logic particle identification (PID) algorithm was developed in [34] for identifying hydrometeor particle types using a combination of HCR, HSRL, and temperature observations during the SOCRATES campaign [57]. There was a total of 11 distinct hydrometeor types identified by PID, which served as a valuable reference for validating the HCR-phase classification through a pixel-by-pixel comparison using a 30 s temporal average. To ensure consistent comparisons, PID-classified supercooled phase categories were merged with their respective parent categories (e.g., cloud liquid and supercooled cloud liquid were combined into a single cloud liquid category). Supercooled rain was, however, excluded from the comparison due to limited samples. Similarly, the ice and snow categories from the HCR-phase were grouped into a single category labeled as frozen. The large frozen and small frozen hydrometeor categories from PID were also combined into a single frozen category for consistency. This merging across both methods is because a significant proportion of large frozen hydrometeors identified by PID correspond to snow classifications in the HCR phase. This reflects the threshold-based classification scheme used in this study, which tends to categorize large ice particles with high reflectivity (dBZ) as snow below the cloud base.
Hit rates were also calculated for the comparable phase categories to quantify agreement between the two methods. As shown in Table 2b, both the HCR phase and PID exhibit substantial agreement across valid samples of 70% for all categories, including 75% hit rates for liquid, 52% for frozen, 66% for drizzle, and ~100% for rain. Of the 45,606 matched samples between two methods, there are 23,901 matched liquid, 4121 matched frozen, 16,213 matched drizzle, and 1371 matched rain samples. Figure 8b shows the distribution of PID-derived phase categories corresponding to each HCR-phase classification, based on overlapping pixels where both methods yield valid results. The raw samples (pixels) for each phase category, comparing results between the HCR-phase classification and the PID-derived hydrometeor types, are summarized in the Supplementary Table S3. For the PID-identified cloud hydrometeor category (Figure 8b and Table S3), the HCR-phase identifies 35,816 samples (~42.3%) as liquid, 17,660 (20.9%) as mixed phase, 4682 (5.5%) as frozen, 26,287 (31.1%) as drizzle, and 206 (0.2%) as rain. Note that the hit rate % (Table 2b) is computed only from overlapping samples across the matched phase categories of liquid, frozen, drizzle, and rain, while the phase partitioning comparison in Figure 8b encompasses all available phase categories from both the HCR and PID methods.
These statistics are derived from a subset of clouds with collocated pixels and do not represent the entire PID dataset. A major limitation in comparing phase classifications between the HCR phase and PID arises from the presence of supercooled liquid droplets coexisting with ice particles. The HCR phase identifies such conditions as mixed phase based on its criteria of low dBZ, Vd, and high LWP, whereas the PID algorithm does not incorporate an LWP constraint. Additionally, the HCR phase explicitly distinguishes drizzling categories (drizzle, rain, and snow) below the cloud base, while PID did not impose any cloud boundary constraints in its classification.

3.3.3. Comparison with Ship-Based Phase Classification During MARCUS

The HCR-phase classification was further evaluated through bulk comparison with phase classifications from the ship-based measurements during the MARCUS campaign, focusing on a spatiotemporally collocated region over the SO using a 5 min averaging interval (see Appendix A.2). A thermodynamic cloud-phase product (THERMOCLDPHASE) was developed in [80] using data from the U.S. DOE’s ARM Mobile Facility deployed aboard the Aurora Australis during the MARCUS campaign. This product integrates active remote sensing instruments—including the Micropulse Lidar (MPL) and W-band ARM Cloud Radar (WACR)—with passive sensors such as microwave radiometers (MWR) and radiosondes. Cloud-phase classification is based on the methodology from [28,82] and includes seven thermodynamic hydrometeor types. More recently, an improved classification approach, leveraging WACR Doppler spectra, MWR-derived LWP, and radiosonde-based temperature profiles, was presented in [32].
For a total of 1410 5 min samples, 58.6% was classified as liquid-phase, 30.7% as mixed-phase, and 10.6% as ice-phase clouds in [32]. In contrast, the thermodynamic cloud-phase product [80] identified 52.31% as liquid, 25.15% as mixed, and 22.53% as ice-phase clouds across 3435 samples. Notably, drizzling phase categories are absent in the MARCUS-based phase classifiers, as phase estimation is restricted to regions above the cloud base identified by the MPL or ceilometer. The statistical results from these two methods remain broadly consistent within the same phase categories as those identified by the HCR-phase classification for in-cloud samples (64% liquid, 28.8% mixed phase, and 7.2% ice; excluding drizzle, rain, and snow). The differences in the phase partitioning are expected given the inherent limitations in achieving perfect spatiotemporal alignment between the SOCRATES and MARCUS campaigns, as well as differences in observational scale and instrument orientations. Nevertheless, the significant statistical consistency between the airborne vs. ship (or surface)-based observations provide valuable insights into the microphysical characteristics of MBL clouds over SO.

3.4. Bulk Statistical Comparisons Between HCR Phase and the Other Methods

Table 3a,b summarizes the cloud-phase classifications from the HCR-phase algorithm, alongside results from the other methods, for bulk statistical comparison. For the SOCRATES campaign, comparisons include the MLR method [6,33,81] and the fuzzy logic PID algorithm [34]. For the MARCUS campaign, comparisons are made with WACR-MWR retrievals [32] and the Thermodynamic-Cloud Phase product [80]. The results discussed in this subsection represent the general microphysical nature and phase partitioning trends of MBL clouds over the SO.
Compared to the HCR-phase results (Table 3a, column 1), the MLR method predicts 11.8% fewer liquid-phase clouds, 19.3% fewer mixed-phase, and 31% more ice-phase clouds (Table 3a, column 2). Additionally, ~39% of the MLR samples are unclassified in the regions with T > 0 °C, which were excluded from the comparison. For the MARCUS campaign, the cloud categories identified in [32] align closely with the HCR results, underestimating liquid-phase clouds by just 5.4% and differing by only 1.9% and 3.4% in the mixed and ice phases, respectively (Table 3a, column 3). Similarly, the Thermodynamic-Cloud Phase product identifies 8.7% more ice-phase clouds but 7.2% fewer liquid and 1.6% fewer mixed-phase clouds (Table 3a, column 4). Table 3b compares the HCR-phase results with the fuzzy logic PID scheme. The PID method classifies 56.3% of the matched samples as liquid (including supercooled liquid) and 11.5% as frozen (large and small frozen hydrometeors), which is 15.7% higher in liquid and 2.7% higher in the frozen phase (ice and snow samples) occurrence than the HCR phase. Additionally, PID estimates 0.7% less drizzle and 1.3% less rain compared to the HCR phase, highlighting notable differences in hydrometeor subtype identification. The percentages are calculated for classes that are not present in both methods (e.g., Mix % and Melting %), which could explain the observed differences.
Overall, the phase-classification percentages show reasonable agreement across all methods, with the MLR method displaying the largest deviations. Mixed-phase cloud identification remains the most uncertain, particularly in regions with high spatial heterogeneity, and is strongly influenced by the observation scale (from microphysical to macrophysical). The HCR-phase method, which combines radar observations with in situ measurements, demonstrates a strong capability in detecting mixed-phase clouds due to two primary factors: (1) The integrated use of HCR reflectivity, spectral width, and Doppler velocity effectively characterizes particle size distributions, enabling clear differentiation between mixed-phase, drizzle, liquid, and ice clouds; (2) the use of a 20 g/m2 LWP threshold helps distinguish ice-dominated columns from liquid and mixed-phase cloud regions. The substantial occurrence of mixed-phase clouds over the SO has been well documented in prior studies [6,32,79,83], which also highlight the significant spatial heterogeneity of MBL clouds in this region.
The bulk phase agreement, defined as 100 − |(Phasei% from compared method) − (Phasei% from HCR-phase)|, where i represents the phase categories, was evaluated by comparing the overall phase occurrence percentages from this study against those from other methods. This metric reflects the overall similarity in phase partitioning across methods (not to be confused with pixel-by-pixel hit rates). Results show that the MLR method has the lowest agreement with the HCR phase for the ice-phase category (~69%), although it performs well for liquid clouds (~88%) and mixed phase (~81%). In contrast, the WACR-MWR and Thermodynamic-Cloud Phase methods exhibit strong agreement with the HCR phase, with >90% consistency across all three phase categories. The PID scheme also shows a high agreement (>80%) with the HCR phase for liquid, frozen, drizzle, and rain categories. As previously discussed, the underlying differences between these classification methods—in terms of sensor type, sampling strategy, and algorithm design—contribute to the observed deviations. While direct one-to-one comparisons are inherently limited by methodological differences, these analyses offer a robust foundation for evaluating phase classification accuracy and consistency across platforms.

3.5. Evaluation of HCR Phase with HSRL-Based Phase Detections

As discussed, HSRL data were excluded from the phase-classification method due to limited overlap with HCR observations and significant viewing geometry-dependent attenuation. A simplistic radar-only approach was therefore developed in this study to enable reliable phase classification in cases where lidar data are unavailable or unreliable. However, to assess the classification consistency among the different sensors, a lidar-only phase retrieval was carried out following the method in [28,32], where HSRL-PLDR was used to identify liquid (PLDR < 0.11), mixed (0.11 < PLDR < 0.15), and ice-phase (PLDR > 0.15) classes (see Figure S2 of Supplementary). Further, a radar–lidar combined phase estimation was carried, where HSRL-detected phase samples were used to fill in the gaps of the HCR-only phase. The combined phase product was used as a reference to compare the HCR- and HSRL-only configurations for liquid, mixed, and ice phases. Across all valid combined-phase samples, approximately 19% represented overlapping phase detections from HCR and HSRL, while 80% of the phase samples originated exclusively from HCR-only retrieval and 1% from HSRL-only detections. Furthermore, the HCR–HSRL combined product differed from the HCR-only retrievals by 0.9%, 0.8%, and 1.7% for liquid, mixed, and ice phases, respectively, and from the HSRL-only detections by 13.2%, 16.1%, and 29.3%. For drizzling samples, the combined phase product is identical to the HCR-only retrievals, as the lidar-based method does not classify drizzle, rain, or snow. Statistical comparisons among the combined, HCR-only, and HSRL-only phase detections are summarized in Table S4 of the Supplementary. Since the HSRL-based method adds only about a ~1% improvement to phase retrievals for MBL clouds (<3 km) over the SO, and its reliability cannot be accurately assessed without proper correction for signal attenuation and loss, the HCR-based method remains robust under most conditions, due to its broader detection capability within MBL clouds.

3.6. Sensitivity Analysis of Cloud-Boundary and Phase Classification

HCR measurements have uncertainties of ~1–2 dB in reflectivity and ~0.2 m s−1 in radial velocity [84,85]. To assess the robustness of the cloud-boundary and phase-classification methods, sensitivities were tested by perturbing dBZ by ±1–3 dB, Vd by ±0.2–0.6 m s−1, and WID by ±0.1–0.3 m s−1. These perturbations are consistent with reported HCR uncertainties and represent roughly 5–15% of typical observed measurement ranges. Htop values are insensitive to HCR perturbations, as they correspond to the highest altitude with valid radar return. For dBZ perturbations of ±1–3 dB, the mean Hbase changes by −4.8% to −12.5% (for negative dBZ changes) and +3.8% to +13.9% (for positive dBZ changes). In contrast, Vd and WID perturbations produce negligible effects (<±1%), since they uniformly affect the cloud vertical profile. These Hbase sensitivities primarily reflect drizzling clouds, as non-drizzling bases are defined by the lowest valid radar return.
For positive dBZ perturbations (+1–3 dB), the phase occurrence changes by about +11% (liquid), −17% (mixed), −5% (ice), −1.8% (drizzle), +17.6% (rain), and +34.1% (snow), with opposite trends for negative perturbations (−13%, +23%, +10%, +0.3%, −9.2%, and −31%, respectively). Higher dBZ values raise the detected Hbase and lift weak signals above the noise floor (−50 dBZ), enhancing liquid detection and shifting drizzle toward rain and snow (>5 dBZ), while lower dBZ values increase the mixed-phase occurrence and reduce rain and snow fractions. For Vd perturbations (±0.2–0.6 m s−1), phase changes corresponding to increases and decreases in Vd, respectively, are around −12.2% and +10% (liquid), +9.6% and −10.5% (mixed), −5.4% and +6.4% (drizzle), and +37.6% and −22% (rain), with negligible effects on ice and snow. Similarly, WID perturbations (±0.1–0.3 m s−1) yield modest changes—+0.6% and −1.3% (liquid), +0.5% and −1.6% (mixed), and −7.5% and +18.1% (ice) for increases and decreases in WID values, respectively, while drizzle remains nearly unchanged (<0.05%). These responses reflect the influence of enhanced turbulence and velocity dispersion at higher Vd and WID. Increased Vd variability corresponds to stronger vertical motions and shear within the radar sampling volume, which promotes phase mixing and the reclassification of uniform ice or liquid regions into mixed-phase states. Similarly, broader WIDs indicate greater variability in particle fall speeds and enhanced microphysical activity (e.g., coalescence, riming), causing more pixels to transition from stratiform ice (WID < 0.5 m/s) to liquid or mixed-phase (WID > 0.5 m/s) regimes. This response largely reflects an algorithmic threshold sensitivity, where increased WID values reclassify marginal ice pixels as liquid or mixed phase under turbulent conditions.
As previously discussed, the LWP retrieval carries an uncertainty of ~15–30 g/m2; therefore, the sensitivity of the phase-classification method was evaluated with respect to variations in the LWP threshold within the range 10–30 g/m2. As expected, lowering the LWP threshold from 20 g/m2 slightly increases the liquid and mixed-phase occurrences negligibly by ~+0.4% on average, while reducing ice-phase detections by around −5.6%, whereas raising the threshold increases ice-phase samples (~+7%) and decreases liquid and mixed-phase detections (~−0.6%). The relatively small changes in liquid and mixed-phase occurrences indicate that most samples already meet the LWP criterion for liquid-containing clouds, and threshold adjustments primarily affect marginal cases near the phase boundary. In contrast, the larger variation in ice-phase occurrence reflects the higher sensitivity of ice classification to LWP changes, as small threshold shifts can reassign a substantial fraction of mixed or transitional pixels to the ice category. No changes are observed for drizzling-phase samples, as variations in the LWP threshold have a negligible effect on the drizzle liquid water content below the cloud base. This insensitivity arises because drizzle classification in the algorithm is largely independent of LWP threshold adjustments. Note that the reported values represent mean differences averaged across all cases. Detailed statistical results from the sensitivity analysis for perturbations in dBZ, Vd, and WID values, along LWP threshold changes, are provided in Table S5a–d of the Supplementary Material.

4. Summary and Conclusions

This study presents a comprehensive methodology for identifying cloud boundaries and classifying cloud phases in single-layer MBL clouds using airborne HCR and in situ CDP and 2D-S probe measurements from the SOCRATES campaign over the SO. The HCR-based cloud boundary detection effectively identifies cloud bases and tops for both drizzling and non-drizzling cloud cases, even without sonde or ceilometer measurements. The integrated radar in situ cloud-phase classification method enables accurate phase retrieval, while statistical analyses provide new insights into the macro- and microphysical properties of different cloud types and phases. Both methodologies were evaluated against existing methods, and the key findings are summarized below:
  • HCR-derived cloud base heights (Hbase) show good agreement with HSRL-derived Hbase for both drizzling and non-drizzling cloud cases under zenith-pointed conditions, with mean differences around 0.25 km and 0.21 km, respectively. For nadir-pointing cases, strong attenuation in HSRL signals prevented a reliable Hbase estimation by lidar; however, HCR continued to provide consistent cloud-base detection. Cloud boundaries derived from in situ measurements for 29 cases coinciding with valid HCR profiles showed mean Htop and Hbase differences of less than 100 m. Furthermore, the HCR-derived Htop and Hbase during SOCRATES and the ship-based MARCUS (MPL/ceilometer/WACR) campaign over a collocated region showed close agreement, with mean differences of 0.03 km for Hbase and 0.3 km for Htop for both drizzling and non-drizzling cases.
  • In situ measured LWC and the calculated reflectivity (Z) from CDP and 2D-S in situ measurements were used to derive an empirical exponential relationship: LWC = 0.70Z0.29, which was applied to HCR-reflectivity data to retrieve LWC profiles. Using these LWC profiles and cloud thickness, LWP was estimated for each cloud category with an associated uncertainty of approximately ±20 g/m2. The mean LWP was ~135.6 g/m2 during SOCRATES, which is in close agreement with MWR-retrieved LWP during the MARCUS campaign, showing a mean difference of 11.7 g/m2.
  • The phase-classification method (HCR phase) categorized cloud profiles into liquid, mixed, and ice phases, with occurrence frequencies of 40.6%, 18.3%, and 5.1%, respectively. Additional hydrometeor types—drizzle (29.1%), rain (3.2%), and snow (3.7%)—were identified in drizzling cloud cases. The HCR-phase classifications were evaluated against four reference methods: MLR, PID, WACR-MWR, and Thermodynamic-Cloud Phase. Comparison with PID showed a 70% hit rate across overlapping phase samples, while agreement with the in situ MLR phase was 60%, limited by fewer overlapping samples and methodological differences. Furthermore, bulk statistical comparisons with MARCUS-based cloud-phase identification methods showed a strong consistency (>90%) across liquid, mixed, and ice categories. A comparison of HCR, HSRL, and combined radar–lidar phase retrievals showed that lidar contributed less than ~1% of additional detections, confirming that the radar-only method provides robust and reliable phase classification for MBL clouds over the SO.
  • Sensitivity analyses show that cloud-boundary and phase classifications are most affected by reflectivity perturbations, with smaller impacts from Doppler velocity, spectrum width, and LWP threshold changes. Overall, the methods remain robust—Hbase varies mainly in drizzling clouds, while phase fractions shift modestly, indicating a stable classification performance within typical HCR and retrieval uncertainties.
This study advances the understanding of Southern Ocean clouds by introducing robust methodologies for identifying cloud boundaries and classifying cloud phases in MBL clouds. The approaches developed here are broadly applicable to future field campaigns and research efforts aimed at characterizing MBL cloud properties in other remote maritime regions. Further work may focus on refining the cloud boundary and phase classification algorithms, incorporating additional remote sensing instruments, and assessing the implications of cloud-phase heterogeneity on aerosol–cloud–radiation interactions.

Supplementary Materials

The following supporting information can be downloaded at: https://www.mdpi.com/article/10.3390/atmos16101195/s1, Figure S1: Profiles of HSRL-backscatter coefficient along with HCR-Hbase and HSRL-Hbase from selected cases; Figure S2: Phase classification results on HSRL lidar backscatter and depolarization ratio; Figure S3: Scatterplot of LWC versus Z with the fitted power-law relationship showing uncertainty in a, and b coefficients; Table S1: Selected profiles of in situ sawtooth sections in close proximity to HCR-profiles for comparison of in situ measured cloud boundaries.; Table S2: Comparison of sample counts between HCR-phase classification and the MLR method; Table S3: Comparison of the sample (pixel counts) between HCR-phase classification and PID-identified hydrometeor phases for overlapping samples; Table S4: Comparison of phase classification results from HCR-only, HSRL-only and merged HCR-HSRL (radar-lidar) retrievals; Table S5a: Sensitivities of cloud-base detection and phase-classification retrievals to HCR-reflectivity (dBZ) uncertainty perturbations; Table S5b: Sensitivities of cloud-base detection and phase-classification retrievals to HCR-doppler velocity (Vd) uncertainty perturbations; Table S5c: Sensitivities of cloud-base detection and phase-classification retrievals to HCR-spectrum width (WID) uncertainty perturbations; Table S5d: Sensitivities of cloud-base detection and phase-classification retrievals to liquid water path (LWP) threshold differences.

Author Contributions

The idea of this study was discussed by A.D., B.X. and X.D., A.D. performed the analyses and wrote the paper. A.D., B.X., X.D. and X.Z. participated in the scientific discussions and provided substantial comments and edits on the paper. All authors have read and agreed to the published version of the manuscript.

Funding

This work was supported by the University of Arizona’s IT4IR TRIF and Provost Investigation funds. The researchers at the University of Arizona were also supported by NSF grant AGS-2031750 at the University of Arizona. The work at Argonne National Laboratory was supported by the U.S. DOE Office of Science under contract DE-AC02-06CH11357.

Data Availability Statement

All radar–lidar and in situ data from the NSF SOCRATES campaign used in this study are freely available via the EOL data archive, https://data.eol.ucar.edu/dataset/ (accessed on 15 August 2025) and the SOCRATES website, https://www.eol.ucar.edu/field_projects/socrates (accessed on 15 August 2025). The 2D-S dataset is available at https://doi.org/10.26023/8HMG-WQP3-XA0X, and CDP data at https://doi.org/10.5065/D6M32TM9. The MLR cloud-phase dataset can be found at https://doi.org/10.26023/S6WS-G5QE-H113, https://data.eol.ucar.edu/dataset/552.142 (accessed on 15 August 2025). NCAR HCR radar and GV-HSRL lidar moments data [57], including the fuzzy logic PID scheme, are available at https://doi.org/10.5065/D64J0CZS, https://data.eol.ucar.edu/dataset/552.034 (accessed on 15 August 2025). Additional datasets, including ARM MWRRET1LILJCLOU, ARSCLWACRBND1KOLLIASSHP, and THERMOCLDPHASE, for the MARCUS campaign can be accessed via the ARM data store at https://adc.arm.gov/ (accessed on 15 August 2025). The cloud base and top heights for drizzling and non-drizzling cloud cases during MARCUS can be accessed at https://doi.org/10.25422/azu.data.23748969.v1 (accessed on 15 August 2025).

Acknowledgments

The SOCRATES aircraft dataset, campaign details, and related publications are freely available at https://www.eol.ucar.edu/field_projects/socrates (accessed on 15 August 2025). We thank John D’Alessandro (University of Washington) for guidance on the MLR phase determination method, Ulrike Romatschke (NCAR) for explaining radar-lidar fuzzy logic parameters.

Conflicts of Interest

The authors declare no conflicts of interest. Further, the funders had no role in the design of the study; in the collection, analyses, or interpretation of data; in the writing of the manuscript; or in the decision to publish the results.

Abbreviations

The following abbreviations are used in this manuscript:
SOCRATESSouthern Ocean Clouds, Radiation, Aerosol Transport Experimental Study
SOSouthern Ocean
MBLMarine Boundary Layer
HCRHIAPER Cloud Radar
HSRLHigh Spectral Resolution Lidar
MPLMicropulse Lidar
MARCUSMeasurement of Aerosols, Radiation, and Clouds
LWCLiquid Water Content
LWPLiquid Water Path
SLWSupercooled Liquid Water
CDPCloud Droplet Probe
2D-STwo-Dimensional, Stereo, Particle Imaging Probe
GVGulfstream-V
PSDParticle Size Distributions
DSDDroplet Size Distribution
PLDRParticle Depolarization Ratio
MWRMicrowave Radiometer
PDFProbability Density Function
ERA5ECMWF Reanalysis v5
ECMWFEuropean Centre for Medium-Range Weather Forecasts
ZRadar Reflectivity Factor
dBZRadar Reflectivity Factor in Decibels (dB)
WIDSpectrum Width
VdDoppler Velocity
MLRMultinomial Logistic Regression
PIDParticle Identification Scheme
ARMAtmospheric Radiation Measurement
ENAEastern North Atlantic (ENA)
WACRW-band ARM Cloud Radar

Appendix A

Appendix A.1. Southern Ocean Clouds, Radiation, Aerosol, Transport Experimental Study (SOCRATES) Aircraft Field-Campaign

The Southern Ocean Clouds, Radiation, Aerosol Transport Experimental Study (SOCRATES) aircraft field campaign was conducted over the SO with a total of 15 research flights from 15 January to 26 February 2018 [71]. SOCRATES utilized the NSF/NCAR Gulfstream-V (GV) research aircraft, which operated out of Hobart, Tasmania, covering a region from 42–62° S to 133–163° W. Flight tracks targeted cold-sector boundary layer clouds, with airborne sampling of in-, below-, and above-cloud transects capturing both time-series and vertical cloud structure data using a suite of in situ and remote sensing instruments. Flights were primarily conducted from midnight to early morning. During the SOCRATES field campaign, the Cloud Droplet Probe (CDP) and two-dimensional stereo-particle imaging probe (2D-S) were utilized to measure cloud and drizzle microphysical properties, respectively. Additionally, the HCR (HIAPER Cloud Radar) and HSRL (High Spectral Resolution Lidar) were installed on the GV aircraft to detect cloud structure, phase, and boundaries [71]. The 2D-S in situ measurements serve as an additional screening for liquid and ice particles, where ice detection is only certain for particle sizes with diameters greater than 200 µm [49,56]. More instrumental details about the SOCRATES campaign can be found in McFarquhar et al. [71]
The suite of in situ probes and radar–lidar instruments onboard the SOCRATES aircraft is listed in Table A1, along with their detection limits and uncertainties. The uncertainties arising from the in situ measured cloud and drizzle particle size distributions (PSDs) are reflected in the secondary parameters like liquid and/or ice water content (LWC/IWC) and, furthermore, in liquid and/or ice water path (LWP/IWP) estimations.
Table A1. Suite of in situ and remote sensing instruments during SOCRATES.
InstrumentMeasurements and UncertaintySize Range/
Resolution
References
Cloud Droplet Probe (CDP)Size distribution and concentration of hydrometeors with a diameter between 2 and 50 µm
  • Cannot resolve non-spherical particles accurately
2–50 µm[46,47]
Two-Dimensional, Stereo, Particle Imaging Probe (2D-S)Size distribution and concentration of hydrometeors with a diameter between 10 and 1280 µm range
  • Cannot resolve for particle sizes D < 40 µm; also, ice particle detection is certain only for D > 200 µm
  • 10 µm
  • D > 40 µm for all particles
  • D > 200 µm for ice particles
[48,49,84]
HIAPER Cloud Radar (HCR)Reflectivity, Doppler velocity, spectral width, Linear Depolarization Ratio (LDR), etc.
  • Attenuates for larger particle sizes
  • 1–2 dB reflectivity uncertainty
~19 m in vertical resolution
Frequency: 94.40 GHz
[50,51,52]
High Spectral Resolution Lidar (HSRL)Backscatter coefficient, Particle Linear Depolarization Ratio (PLDR), Extinction Coefficient, etc.
  • Sensitive to optically thin cloud layers
Wavelength: 532 nm[53,54,55]

Appendix A.2. Measurements from the Measurement of Aerosols, Radiation, and Clouds over the Southern Ocean (MARCUS) Ship-Based Field Campaign and Spatial Matching with SOCRATES

The Measurement of Aerosols, Radiation, and Clouds over the Southern Ocean (MARCUS) field campaign (October 2017–March 2018) used the DOE’s ARM Mobile Facility aboard the Australian icebreaker Aurora Australis. The ship-based observations covered routes between Hobart, Tasmania, Australian Antarctic research stations and Macquarie Island [32,69,71,77,78,83]. The Southern Ocean Clouds, Radiation, Aerosol Transport Experimental Study (SOCRATES) (15 January–26 February 2018) collected in situ measurements of cloud and drizzle properties, advancing atmospheric research in the region [71].
The MARCUS campaign offered excellent in situ measurements with micropulse lidar (MPL) and ceilometer-estimated cloud base heights (arsclwacrbnd1kolliasshp [85]), along with microwave radiometer retrieved liquid water path (MWRRET1LILJCLOU [86]). These can be used to validate the retrieved LWP and cloud-base heights from this study based on SOCRATES observations. Figure A1 shows the spatial map of both the campaigns and the selected region for the comparison, which ranges from 44° S–63° S to 133° E–163° E. Data collected during the months of January, February, and March 2018 from MARCUS were used to compare with the January, February 2018 dataset of SOCRATES. The addition of March 2018 adds statistical significance to the comparison, as the majority of the ship track during Feb 2018 fell outside the selected area for comparison. This is a valid approach, as it was found in [39] that cloud cover and microphysical properties remain relatively stable over the same climatological months based on analyzing 5-year CloudSat CPR (cloud profiling radar) observations over the SO for the months of November to January (2015–2020). This period corresponded to the climatological summer in the Southern Hemisphere and closely aligned with the timeframes of the SOCRATES and MARCUS campaigns.
Figure A1. Spatial map of (a) SOCRATES campaign flight legs for the 15 research flights, (b) MARCUS ship tracks from November 2017–March 2018. The shaded region in panel (b) represents the selected region over the Southern Ocean for comparison of aircraft and ship-based measurements where both campaigns spatially overlap. MARCUS measurements only for the months of January–March 2018 were considered in this study.
Atmosphere 16 01195 g0a1
To further ensure consistent spatial resolution across the two campaigns for the comparative analysis, data were averaged over intervals corresponding to similar spatial distances covered during each observation, as per [39]. For the MARCUS campaign, with a typical cruise speed of 15 m/s, data were averaged into 5 min intervals (15 m/s × 300 s = 4500 m). For SOCRATES, with an average aircraft cruise speed of 150 m/s, data were averaged into 30 s intervals (150 m/s × 30 s = 4500 m). The chosen averaging intervals effectively align the spatial scales of MARCUS and SOCRATES, ensuring reliable comparisons of cloud fraction across platforms. Tweaking the averaging time intervals would lead to some level of fluctuation in the retrieved parameters. Although MARCUS observed thicker cloud layers with higher cloud tops than SOCRATES, the dataset was further constrained to keep only low-level clouds (<3 km) to be consistent with the objectives of this study. Constraining the dataset by specific latitude–longitude coordinates, tropospheric heights, and time periods ensures homogeneity and consistency across the two platforms, enabling precise comparisons of geographic domain, temporal trends, and vertical distribution.

References

  1. Trenberth, K.E.; Fasullo, J.T. Simulation of Present-Day and Twenty-First-Century Energy Budgets of the Southern Oceans. J. Clim. 2010, 23, 440–454. [Google Scholar] [CrossRef]
  2. McCoy, D.T.; Hartmann, D.L.; Grosvenor, D.P. Observed Southern Ocean Cloud Properties and Shortwave Reflection. Part II: Phase Changes and Low Cloud Feedback. J. Clim. 2014, 27, 8858–8868. [Google Scholar] [CrossRef]
  3. Bodas-Salcedo, A.; Hill, P.G.; Furtado, K.; Williams, K.D.; Field, P.R.; Manners, J.C.; Hyder, P.; Kato, S. Large Contribution of Supercooled Liquid Clouds to the Solar Radiation Budget of the Southern Ocean. J. Clim. 2016, 29, 4213–4228. [Google Scholar] [CrossRef]
  4. Kay, J.E.; Wall, C.; Yettella, V.; Medeiros, B.; Hannay, C.; Caldwell, P.; Bitz, C. Global Climate Impacts of Fixing the Southern Ocean Shortwave Radiation Bias in the Community Earth System Model (CESM). J. Clim. 2016, 29, 4617–4636. [Google Scholar] [CrossRef]
  5. Wang, Y.; Zhang, D.; Liu, X.; Wang, Z. Distinct Contributions of Ice Nucleation, Large-Scale Environment, and Shallow Cumulus Detrainment to Cloud Phase Partitioning with NCAR CAM5. J. Geophys. Res. Atmos. 2018, 123, 1132–1154. [Google Scholar] [CrossRef]
  6. D’Alessandro, J.J.; McFarquhar, G.M.; Wu, W.; Stith, J.L.; Jensen, J.B.; Rauber, R.M. Characterizing the Occurrence and Spatial Heterogeneity of Liquid, Ice, and Mixed Phase Low-Level Clouds Over the Southern Ocean Using in Situ Observations Acquired During SOCRATES. J. Geophys. Res. Atmos. 2021, 126, e2020JD034482. [Google Scholar] [CrossRef]
  7. Jiang, J.H.; Su, H.; Wu, L.; Zhai, C.; Schiro, K.A. Improvements in Cloud and Water Vapor Simulations Over the Tropical Oceans in CMIP6 Compared to CMIP5. Earth Space Sci. 2021, 8, e2020EA001520. [Google Scholar] [CrossRef]
  8. Li, J.-L.F.; Xu, K.-M.; Jiang, J.H.; Lee, W.-L.; Wang, L.-C.; Yu, J.-Y.; Stephens, G.; Fetzer, E.; Wang, Y.-H. An Overview of CMIP5 and CMIP6 Simulated Cloud Ice, Radiation Fields, Surface Wind Stress, Sea Surface Temperatures, and Precipitation Over Tropical and Subtropical Oceans. J. Geophys. Res. Atmos. 2020, 125, e2020JD032848. [Google Scholar] [CrossRef]
  9. Vignesh, P.P.; Jiang, J.H.; Kishore, P.; Su, H.; Smay, T.; Brighton, N.; Velicogna, I. Assessment of CMIP6 Cloud Fraction and Comparison with Satellite Observations. Earth Space Sci. 2020, 7, e2019EA000975. [Google Scholar] [CrossRef]
  10. Zelinka, M.D.; Myers, T.A.; McCoy, D.T.; Po-Chedley, S.; Caldwell, P.M.; Ceppi, P.; Klein, S.A.; Taylor, K.E. Causes of Higher Climate Sensitivity in CMIP6 Models. Geophys. Res. Lett. 2020, 47, e2019GL085782. [Google Scholar] [CrossRef]
  11. Zheng, X.; Tao, C.; Zhang, C.; Xie, S.; Zhang, Y.; Xi, B.; Dong, X. Assessment of CMIP5 and CMIP6 AMIP Simulated Clouds and Surface Shortwave Radiation Using ARM Observations over Different Climate Regions. J. Clim. 2023, 36, 8475–8495. [Google Scholar] [CrossRef]
  12. Chen, G.; Wang, W.-C.; Bao, Q.; Li, J. Evaluation of Simulated Cloud Diurnal Variation in CMIP6 Climate Models. J. Geophys. Res. Atmos. 2022, 127, e2021JD036422. [Google Scholar] [CrossRef]
  13. McCoy, I.L.; McCoy, D.T.; Wood, R.; Regayre, L.; Watson-Parris, D.; Grosvenor, D.P.; Mulcahy, J.P.; Hu, Y.; Bender, F.A.-M.; Field, P.R.; et al. The Hemispheric Contrast in Cloud Microphysical Properties Constrains Aerosol Forcing. Proc. Natl. Acad. Sci. USA 2020, 117, 18998–19006. [Google Scholar] [CrossRef] [PubMed]
  14. McCoy, I.L.; Bretherton, C.S.; Wood, R.; Twohy, C.H.; Gettelman, A.; Bardeen, C.G.; Toohey, D.W. Influences of Recent Particle Formation on Southern Ocean Aerosol Variability and Low Cloud Properties. J. Geophys. Res. Atmos. 2021, 126, e2020JD033529. [Google Scholar] [CrossRef]
  15. Wild, M. The Global Energy Balance as Represented in CMIP6 Climate Models. Clim. Dyn. 2020, 55, 553–577. [Google Scholar] [CrossRef] [PubMed]
  16. Stephens, G.L.; L’Ecuyer, T.; Forbes, R.; Gettelmen, A.; Golaz, J.-C.; Bodas-Salcedo, A.; Suzuki, K.; Gabriel, P.; Haynes, J. Dreary State of Precipitation in Global Models. J. Geophys. Res. Atmos. 2010, 115, D24211. [Google Scholar] [CrossRef]
  17. Donner, L.J.; Wyman, B.L.; Hemler, R.S.; Horowitz, L.W.; Ming, Y.; Zhao, M.; Golaz, J.-C.; Ginoux, P.; Lin, S.-J.; Schwarzkopf, M.D.; et al. The Dynamical Core, Physical Parameterizations, and Basic Simulation Characteristics of the Atmospheric Component AM3 of the GFDL Global Coupled Model CM3. J. Clim. 2011, 24, 3484–3519. [Google Scholar] [CrossRef]
  18. Hu, Y.; Rodier, S.; Xu, K.; Sun, W.; Huang, J.; Lin, B.; Zhai, P.; Josset, D. Occurrence, Liquid Water Content, and Fraction of Supercooled Water Clouds from Combined CALIOP/IIR/MODIS Measurements. J. Geophys. Res. Atmos. 2010, 115, D00H34. [Google Scholar] [CrossRef]
  19. Dong, X.; Xi, B.; Kennedy, A.; Minnis, P.; Wood, R. A 19-Month Record of Marine Aerosol–Cloud–Radiation Properties Derived from DOE ARM Mobile Facility Deployment at the Azores. Part I: Cloud Fraction and Single-Layered MBL Cloud Properties. J. Clim. 2014, 27, 3665–3682. [Google Scholar] [CrossRef]
  20. Wu, P.; Dong, X.; Xi, B.; Tian, J.; Ward, D.M. Profiles of MBL Cloud and Drizzle Microphysical Properties Retrieved From Ground-Based Observations and Validated by Aircraft In Situ Measurements Over the Azores. J. Geophys. Res. Atmos. 2020, 125, e2019JD032205. [Google Scholar] [CrossRef]
  21. Zhao, L.; Zhao, C.; Wang, Y.; Wang, Y.; Yang, Y. Evaluation of Cloud Microphysical Properties Derived From MODIS and Himawari-8 Using In Situ Aircraft Measurements Over the Southern Ocean. Earth Space Sci. 2020, 7, e2020EA001137. [Google Scholar] [CrossRef]
  22. Jackson, R.C.; McFarquhar, G.M.; Korolev, A.V.; Earle, M.E.; Liu, P.S.K.; Lawson, R.P.; Brooks, S.; Wolde, M.; Laskin, A.; Freer, M. The Dependence of Ice Microphysics on Aerosol Concentration in Arctic Mixed-Phase Stratus Clouds during ISDAC and M-PACE. J. Geophys. Res. Atmos. 2012, 117, D15207. [Google Scholar] [CrossRef]
  23. Qiu, S.; Dong, X.; Xi, B.; Li, J.-L.F. Characterizing Arctic Mixed-Phase Cloud Structure and Its Relationship with Humidity and Temperature Inversion Using ARM NSA Observations. J. Geophys. Res. Atmos. 2015, 120, 7737–7746. [Google Scholar] [CrossRef]
  24. Moser, M.; Voigt, C.; Jurkat-Witschas, T.; Hahn, V.; Mioche, G.; Jourdan, O.; Dupuy, R.; Gourbeyre, C.; Schwarzenboeck, A.; Lucke, J.; et al. Microphysical and Thermodynamic Phase Analyses of Arctic Low-Level Clouds Measured above the Sea Ice and the Open Ocean in Spring and Summer. Atmos. Chem. Phys. 2023, 23, 7257–7280. [Google Scholar] [CrossRef]
  25. Heymsfield, A.J.; Schmitt, C.; Chen, C.; Bansemer, A.; Gettelman, A.; Field, P.R.; Liu, C. Contributions of the Liquid and Ice Phases to Global Surface Precipitation: Observations and Global Climate Modeling. J. Atmos. Sci. 2020, 77, 2629–2648. [Google Scholar] [CrossRef]
  26. Zhao, X.; Liu, X.; Burrows, S.; DeMott, P.J.; Diao, M.; McFarquhar, G.M.; Patade, S.; Phillips, V.; Roberts, G.C.; Sanchez, K.J.; et al. Important Ice Processes Are Missed by the Community Earth System Model in Southern Ocean Mixed-Phase Clouds: Bridging SOCRATES Observations to Model Developments. J. Geophys. Res. Atmos. 2023, 128, e2022JD037513. [Google Scholar] [CrossRef]
  27. Liu, Y.G.; Yau, M.-K.; Shima, S.-I.; Lu, C.S.; Chen, S.S. Parameterization and Explicit Modeling of Cloud Microphysics: Approaches, Challenges, and Future Directions. Adv. Atmos. Sci. 2023, 40, 747–790. [Google Scholar] [CrossRef]
  28. Shupe, M.D. A Ground-Based Multisensor Cloud Phase Classifier. Geophys. Res. Lett. 2007, 34, L22809. [Google Scholar] [CrossRef]
  29. D’Alessandro, J.J.; Diao, M.; Wu, C.; Liu, X.; Jensen, J.B.; Stephens, B.B. Cloud Phase and Relative Humidity Distributions over the Southern Ocean in Austral Summer Based on In Situ Observations and CAM5 Simulations. J. Clim. 2019, 32, 2781–2805. [Google Scholar] [CrossRef]
  30. Zaremba, T.J.; Rauber, R.M.; McFarquhar, G.M.; Hayman, M.; Finlon, J.A.; Stechman, D.M. Phase Characterization of Cold Sector Southern Ocean Cloud Tops: Results From SOCRATES. J. Geophys. Res. Atmos. 2020, 125, e2020JD033673. [Google Scholar] [CrossRef]
  31. Atlas, R.; Mohrmann, J.; Finlon, J.; Lu, J.; Hsiao, I.; Wood, R.; Diao, M. The University of Washington Ice–Liquid Discriminator (UWILD) Improves Single-Particle Phase Classifications of Hydrometeors within Southern Ocean Clouds Using Machine Learning. Atmos. Meas. Tech. 2021, 14, 7079–7101. [Google Scholar] [CrossRef]
  32. Xi, B.; Dong, X.; Zheng, X.; Wu, P. Cloud Phase and Macrophysical Properties over the Southern Ocean during the MARCUS Field Campaign. Atmos. Meas. Tech. 2022, 15, 3761–3777. [Google Scholar] [CrossRef]
  33. Schima, J.; McFarquhar, G.; Romatschke, U.; Vivekanandan, J.; D’Alessandro, J.; Haggerty, J.; Wolff, C.; Schaefer, E.; Järvinen, E.; Schnaiter, M. Characterization of Southern Ocean Boundary Layer Clouds Using Airborne Radar, Lidar, and In Situ Cloud Data: Results From SOCRATES. J. Geophys. Res. Atmos. 2022, 127, e2022JD037277. [Google Scholar] [CrossRef]
  34. Romatschke, U.; Vivekanandan, J. Cloud and Precipitation Particle Identification Using Cloud Radar and Lidar Measurements: Retrieval Technique and Validation. Earth Space Sci. 2022, 9, e2022EA002299. [Google Scholar] [CrossRef]
  35. Desai, N.; Diao, M.; Shi, Y.; Liu, X.; Silber, I. Ship-Based Observations and Climate Model Simulations of Cloud Phase Over the Southern Ocean. J. Geophys. Res. Atmos. 2023, 128, e2023JD038581. [Google Scholar] [CrossRef]
  36. Mioche, G.; Jourdan, O.; Ceccaldi, M.; Delanoë, J. Variability of Mixed-Phase Clouds in the Arctic with a Focus on the Svalbard Region: A Study Based on Spaceborne Active Remote Sensing. Atmos. Chem. Phys. 2015, 15, 2445–2461. [Google Scholar] [CrossRef]
  37. Matus, A.V.; L’Ecuyer, T.S. The Role of Cloud Phase in Earth’s Radiation Budget. J. Geophys. Res. Atmos. 2017, 122, 2559–2578. [Google Scholar] [CrossRef]
  38. Korolev, A.; Milbrandt, J. How Are Mixed-Phase Clouds Mixed? Geophys. Res. Lett. 2022, 49, e2022GL099578. [Google Scholar] [CrossRef]
  39. Dong, X.; Das, A.; Xi, B.; Zheng, X.; Behrangi, A.; Marcovecchio, A.R.; Girone, D.J. Quantifying the Differences in Southern Ocean Clouds Observed by Radar and Lidar from Three Platforms. Geophys. Res. Lett. 2025, 52, e2024GL112079. [Google Scholar] [CrossRef]
  40. Ewald, F.; Groß, S.; Wirth, M.; Delanoë, J.; Fox, S.; Mayer, B. Why We Need Radar, Lidar, and Solar Radiance Observations to Constrain Ice Cloud Microphysics. Atmos. Meas. Tech. 2021, 14, 5029–5047. [Google Scholar] [CrossRef]
  41. Wang, Z.; French, J.; Vali, G.; Wechsler, P.; Haimov, S.; Rodi, A.; Deng, M.; Leon, D.; Snider, J.; Peng, L.; et al. Single Aircraft Integration of Remote Sensing and In Situ Sampling for the Study of Cloud Microphysics and Dynamics. Bull. Am. Meteorol. Soc. 2012, 93, 653–668. [Google Scholar] [CrossRef]
  42. Delanoë, J.; Protat, A.; Jourdan, O.; Pelon, J.; Papazzoni, M.; Dupuy, R.; Gayet, J.; Jouan, C. Comparison of Airborne In Situ, Airborne Radar–Lidar, and Spaceborne Radar–Lidar Retrievals of Polar Ice Cloud Properties Sampled during the POLARCAT Campaign. J. Atmos. Ocean. Technol. 2013, 30, 57–73. [Google Scholar] [CrossRef]
  43. McGill, M.; Hlavka, D.; Hart, W.; Scott, V.S.; Spinhirne, J.; Schmid, B. Cloud Physics Lidar: Instrument Description and Initial Measurement Results. Appl. Opt. 2002, 41, 3725–3734. [Google Scholar] [CrossRef] [PubMed]
  44. Wang, Z.; Wechsler, P.; Kuestner, W.; French, J.; Rodi, A.; Glover, B.; Burkhart, M.; Lukens, D. Wyoming Cloud Lidar: Instrument Description and Applications. Opt. Express 2009, 17, 13576. [Google Scholar] [CrossRef]
  45. Sassen, K. The Polarization Lidar Technique for Cloud Research: A Review and Current Assessment. Bull. Am. Meteorol. Soc. 1991, 72, 1848–1866. [Google Scholar] [CrossRef]
  46. Lance, S.; Brock, C.A.; Rogers, D.; Gordon, J.A. Water Droplet Calibration of the Cloud Droplet Probe (CDP) and in-Flight Performance in Liquid, Ice and Mixed-Phase Clouds during ARCPAC. Atmos. Meas. Tech. 2010, 3, 1683–1706. [Google Scholar] [CrossRef]
  47. Faber, S.; French, J.R.; Jackson, R. Laboratory and In-Flight Evaluation of Measurement Uncertainties from a Commercial Cloud Droplet Probe (CDP). Atmos. Meas. Tech. 2018, 11, 3645–3659. [Google Scholar] [CrossRef]
  48. Lawson, R.P.; O’Connor, D.; Zmarzly, P.; Weaver, K.; Baker, B.; Mo, Q.; Jonsson, H. The 2D-S (Stereo) Probe: Design and Preliminary Tests of a New Airborne, High-Speed, High-Resolution Particle Imaging Probe. J. Atmos. Ocean. Technol. 2006, 23, 1462–1477. [Google Scholar] [CrossRef]
  49. Wu, W.; McFarquhar, G. NSF/NCAR GV HIAPER 2D-S Particle Size Distribution (PSD) Product Data, Version 1.1; NSF NCAR Earth Observing Laboratory: Boulder, CO, USA, 2019. [Google Scholar] [CrossRef]
  50. NCAR/EOL HCR Team. HIAPER Cloud Radar (HCR); UCAR/NCAR Earth Observing Laboratory: Boulder, CO, USA, 2014. [Google Scholar] [CrossRef]
  51. Vivekanandan, J.; Ellis, S.; Tsai, P.; Loew, E.; Lee, W.-C.; Emmett, J.; Dixon, M.; Burghart, C.; Rauenbuehler, S. A Wing Pod-Based Millimeter Wavelength Airborne Cloud Radar. Geosci. Instrum. Methods Data Syst. 2015, 4, 161–176. [Google Scholar] [CrossRef]
  52. Romatschke, U.; Dixon, M.; Tsai, P.; Loew, E.; Vivekanandan, J.; Emmett, J.; Rilling, R. The NCAR Airborne 94-GHz Cloud Radar: Calibration and Data Processing. Data 2021, 6, 66. [Google Scholar] [CrossRef]
  53. NCAR/EOL HSRL Team. Gulfstream V High Spectral Resolution Lidar (GV-HSRL); UCAR/NCAR Earth Observing Laboratory: Boulder, CO, USA, 2012. [Google Scholar] [CrossRef]
  54. Eloranta, E.E. High Spectral Resolution Lidar. In Lidar: Range-Resolved Optical Remote Sensing of the Atmosphere; Weitkamp, C., Ed.; Springer: New York, NY, USA, 2005; pp. 143–163. ISBN 978-0-387-25101-1. [Google Scholar]
  55. Su, W.; Schuster, G.L.; Loeb, N.G.; Rogers, R.R.; Ferrare, R.A.; Hostetler, C.A.; Hair, J.W.; Obland, M.D. Aerosol and Cloud Interaction Observed from High Spectral Resolution Lidar Data. J. Geophys. Res. Atmos. 2008, 113, D24202. [Google Scholar] [CrossRef]
  56. Zheng, X.; Dong, X.; Xi, B.; Logan, T.; Wang, Y. Distinctive Aerosol–Cloud–Precipitation Interactions in Marine Boundary Layer Clouds from the ACE-ENA and SOCRATES Aircraft Field Campaigns. Atmos. Chem. Phys. 2024, 24, 10323–10347. [Google Scholar] [CrossRef]
  57. NCAR/EOL HCR Team; NCAR/EOL GV-HSRL Team. SOCRATES: NCAR HCR Radar and GV-HSRL Lidar Moments Data, Version 3.2; NSF NCAR Earth Observing Laboratory: Boulder, CO, USA, 2023. [Google Scholar] [CrossRef]
  58. Doviak, R.J.; Zrnić, D.S. 8-Precipitation Measurements. In Doppler Radar and Weather Observations, 2nd ed.; Doviak, R.J., Zrnić, D.S., Eds.; Academic Press: San Diego, CA, USA, 1993; pp. 209–279. ISBN 978-0-12-221422-6. [Google Scholar]
  59. Kang, L.; Marchand, R.; Smith, W. Evaluation of MODIS and Himawari-8 Low Clouds Retrievals Over the Southern Ocean With In Situ Measurements From the SOCRATES Campaign. Earth Space Sci. 2021, 8, e2020EA001397. [Google Scholar] [CrossRef]
  60. Dong, X.; Mace, G.G. Profiles of Low-Level Stratus Cloud Microphysics Deduced from Ground-Based Measurements. J. Atmos. Ocean. Technol. 2003, 20, 42–53. [Google Scholar] [CrossRef]
  61. Mioche, G.; Jourdan, O.; Delanoë, J.; Gourbeyre, C.; Febvre, G.; Dupuy, R.; Monier, M.; Szczap, F.; Schwarzenboeck, A.; Gayet, J.-F. Vertical Distribution of Microphysical Properties of Arctic Springtime Low-Level Mixed-Phase Clouds over the Greenland and Norwegian Seas. Atmos. Chem. Phys. 2017, 17, 12845–12869. [Google Scholar] [CrossRef]
  62. Oh, S.-B.; Lee, Y.H.; Jeong, J.-H.; Kim, Y.-H.; Joo, S. Estimation of the Liquid Water Content and Z–LWC Relationship Using Ka-Band Cloud Radar and a Microwave Radiometer. Meteorol. Appl. 2018, 25, 423–434. [Google Scholar] [CrossRef]
  63. Vivekanandan, J.; Ghate, V.P.; Jensen, J.B.; Ellis, S.M.; Schwartz, M.C. A Technique for Estimating Liquid Droplet Diameter and Liquid Water Content in Stratocumulus Clouds Using Radar and Lidar Measurements. J. Atmos. Ocean. Technol. 2020, 37, 2145–2161. [Google Scholar] [CrossRef]
  64. Intrieri, J.M.; Shupe, M.D.; Uttal, T.; McCarty, B.J. An Annual Cycle of Arctic Cloud Characteristics Observed by Radar and Lidar at SHEBA. J. Geophys. Res. Ocean. 2002, 107, SHE 5-1–SHE 5-15. [Google Scholar] [CrossRef]
  65. Kang, L.; Marchand, R.T.; Wood, R. Stratocumulus Precipitation Properties Over the Southern Ocean Observed From Aircraft During the SOCRATES Campaign. J. Geophys. Res. Atmos. 2024, 129, e2023JD039831. [Google Scholar] [CrossRef]
  66. Frisch, A.S.; Fairall, C.W.; Snider, J.B. Measurement of Stratus Cloud and Drizzle Parameters in ASTEX with a Kα-Band Doppler Radar and a Microwave Radiometer. J. Atmos. Sci. 1995, 52, 2788–2799. [Google Scholar] [CrossRef]
  67. Cadeddu, M.P.; Liljegren, J.C.; Turner, D.D. The Atmospheric Radiation Measurement (ARM) Program Network of Microwave Radiometers: Instrumentation, Data, and Retrievals. Atmos. Meas. Tech. 2013, 6, 2359–2372. [Google Scholar] [CrossRef]
  68. Liljegren, J.C.; Clothiaux, E.E.; Mace, G.G.; Kato, S.; Dong, X. A New Retrieval for Cloud Liquid Water Path Using a Ground-Based Microwave Radiometer and Measurements of Cloud Temperature. J. Geophys. Res. Atmos. 2001, 106, 14485–14500. [Google Scholar] [CrossRef]
  69. Marcovecchio, A.R.; Xi, B.; Zheng, X.; Wu, P.; Dong, X.; Behrangi, A. What Are the Similarities and Differences in Marine Boundary Layer Cloud and Drizzle Microphysical Properties During the ACE-ENA and MARCUS Field Campaigns? J. Geophys. Res. Atmos. 2023, 128, e2022JD037109. [Google Scholar] [CrossRef]
  70. Brownscombe, J.L.; Hallett, J. Experimental and Field Studies of Precipitation Particles Formed by the Freezing of Supercooled Water. Q. J. R. Meteorol. Soc. 1967, 93, 455–473. [Google Scholar] [CrossRef]
  71. McFarquhar, G.M.; Bretherton, C.S.; Marchand, R.; Protat, A.; DeMott, P.J.; Alexander, S.P.; Roberts, G.C.; Twohy, C.H.; Toohey, D.; Siems, S.; et al. Observations of Clouds, Aerosols, Precipitation, and Surface Radiation over the Southern Ocean: An Overview of CAPRICORN, MARCUS, MICRE, and SOCRATES. Bull. Am. Meteorol. Soc. 2021, 102, E894–E928. [Google Scholar] [CrossRef]
  72. Wang, Z.; Sassen, K. Cloud Type and Macrophysical Property Retrieval Using Multiple Remote Sensors. J. Appl. Meteorol. Climatol. 2001, 40, 1665–1682. [Google Scholar] [CrossRef]
  73. Flynn, D.; Sivaraman, C.; Comstock, J.; Zhang, D. Micropulse Lidar Cloud Mask (MPLCMASK) Value-Added Product for the Fast-Switching Polarized Micropulse Lidar Technical Report; U.S. Department of Energy, Office of Science, Atmospheric Radiation Measurement (ARM) User Facility: Washington, DC, USA, 2020. [CrossRef]
  74. Dong, X.; Minnis, P.; Xi, B. A Climatology of Midlatitude Continental Clouds from the ARM SGP Central Facility: Part I: Low-Level Cloud Macrophysical, Microphysical, and Radiative Properties. J. Clim. 2005, 18, 1391–1410. [Google Scholar] [CrossRef]
  75. Wood, R. Drizzle in Stratiform Boundary Layer Clouds. Part I: Vertical and Horizontal Structure. J. Atmos. Sci. 2005, 62, 3011–3033. [Google Scholar] [CrossRef]
  76. Zheng, X.; Xi, B.; Dong, X.; Wu, P.; Logan, T.; Wang, Y. Environmental Effects on Aerosol–Cloud Interaction in Non-Precipitating Marine Boundary Layer (MBL) Clouds over the Eastern North Atlantic. Atmos. Chem. Phys. 2022, 22, 335–354. [Google Scholar] [CrossRef]
  77. DeMott, P.; Hill, T.; McFarquhar, G. Measurements of Aerosols, Radiation, and Clouds over the Southern Ocean (MARCUS) Ice Nucleating Particle Measurements Field Campaign Report; U.S. Department of Energy, Office of Science, Atmospheric Radiation Measurement (ARM) User Facility: Washington, DC, USA, 2018. Available online: https://www.osti.gov/servlets/purl/1489372 (accessed on 20 August 2025).
  78. McFarquhar, G.; Marchand, R.; Bretherton, C.; Alexander, S.; Protat, A.; Siems, S.; Wood, R.; DeMott, P. Measurements of Aerosols, Radiation, and Clouds over the Southern Ocean (MARCUS) Field Campaign Report; U.S. Department of Energy, Office of Science, Atmospheric Radiation Measurement (ARM) User Facility: Washington, DC, USA, 2019. Available online: https://www.osti.gov/servlets/purl/1524775 (accessed on 20 August 2025).
  79. Maciel, F.V.; Diao, M.; Yang, C.A. Partition between Supercooled Liquid Droplets and Ice Crystals in Mixed-Phase Clouds Based on Airborne in Situ Observations. Atmos. Meas. Tech. 2024, 17, 4843–4861. [Google Scholar] [CrossRef]
  80. Atmospheric Radiation Measurement (ARM) User Facility. Thermodynamic Cloud Phase (THERMOCLDPHASE), 2017-10-31 to 2018-03-24, ARM Mobile Facility (MAR) Hobart, AUS to Antarctic Coast—Resupply Ship Aurora Australis; AMF2 (M1); Zhang, D., Levin, M., Eds.; ARM Data Center: Oak Ridge, TN, USA, 2017. [Google Scholar] [CrossRef]
  81. D’Alessandro, J.; Schima, J.; McFarquhar, G. SOCRATES Cloud Phase Product, Version 1.0; NSF NCAR Earth Observing Laboratory: Boulder, CO, USA, 2022. [Google Scholar] [CrossRef]
  82. Shupe, M.D.; Uttal, T.; Matrosov, S.Y. Arctic Cloud Microphysics Retrievals from Surface-Based Remote Sensors at SHEBA. J. Appl. Meteorol. Climatol. 2005, 44, 1544–1562. [Google Scholar] [CrossRef]
  83. Mace, G.G.; Protat, A.; Benson, S. Mixed-Phase Clouds Over the Southern Ocean as Observed from Satellite and Surface Based Lidar and Radar. J. Geophys. Res. Atmos. 2021, 126, e2021JD034569. [Google Scholar] [CrossRef]
  84. Baker, B.; Mo, Q.; Lawson, R.P.; O’Connor, D.; Korolev, A. Drop Size Distributions and the Lack of Small Drops in RICO Rain Shafts. J. Appl. Meteorol. Climatol. 2009, 48, 616–623. [Google Scholar] [CrossRef]
  85. Atmospheric Radiation Measurement (ARM) User Facility. Marine W-Band ARM Cloud Radar, Active Remote Sensing of Clouds (ARSCLWACRBND1KOLLIASSHP), 2017-10-29 to 2018-03-24, ARM Mobile Facility (MAR) Hobart, AUS to Antarctic Coast—Resupply Ship Aurora Australis; AMF2 (M1); Wang, M., Johnson, K., Eds.; ARM Data Center: Oak Ridge, TN, USA, 2017. [Google Scholar] [CrossRef]
  86. Atmospheric Radiation Measurement (ARM) User Facility. MWR Retrievals (MWRRET1LILJCLOU), 2017-10-21 to 2018-03-23, ARM Mobile Facility (MAR) Hobart, AUS to Antarctic Coast—Resupply Ship Aurora Australis; AMF2 (M1); Zhang, D., Ed.; ARM Data Center: Oak Ridge, TN, USA, 2017. [Google Scholar] [CrossRef]
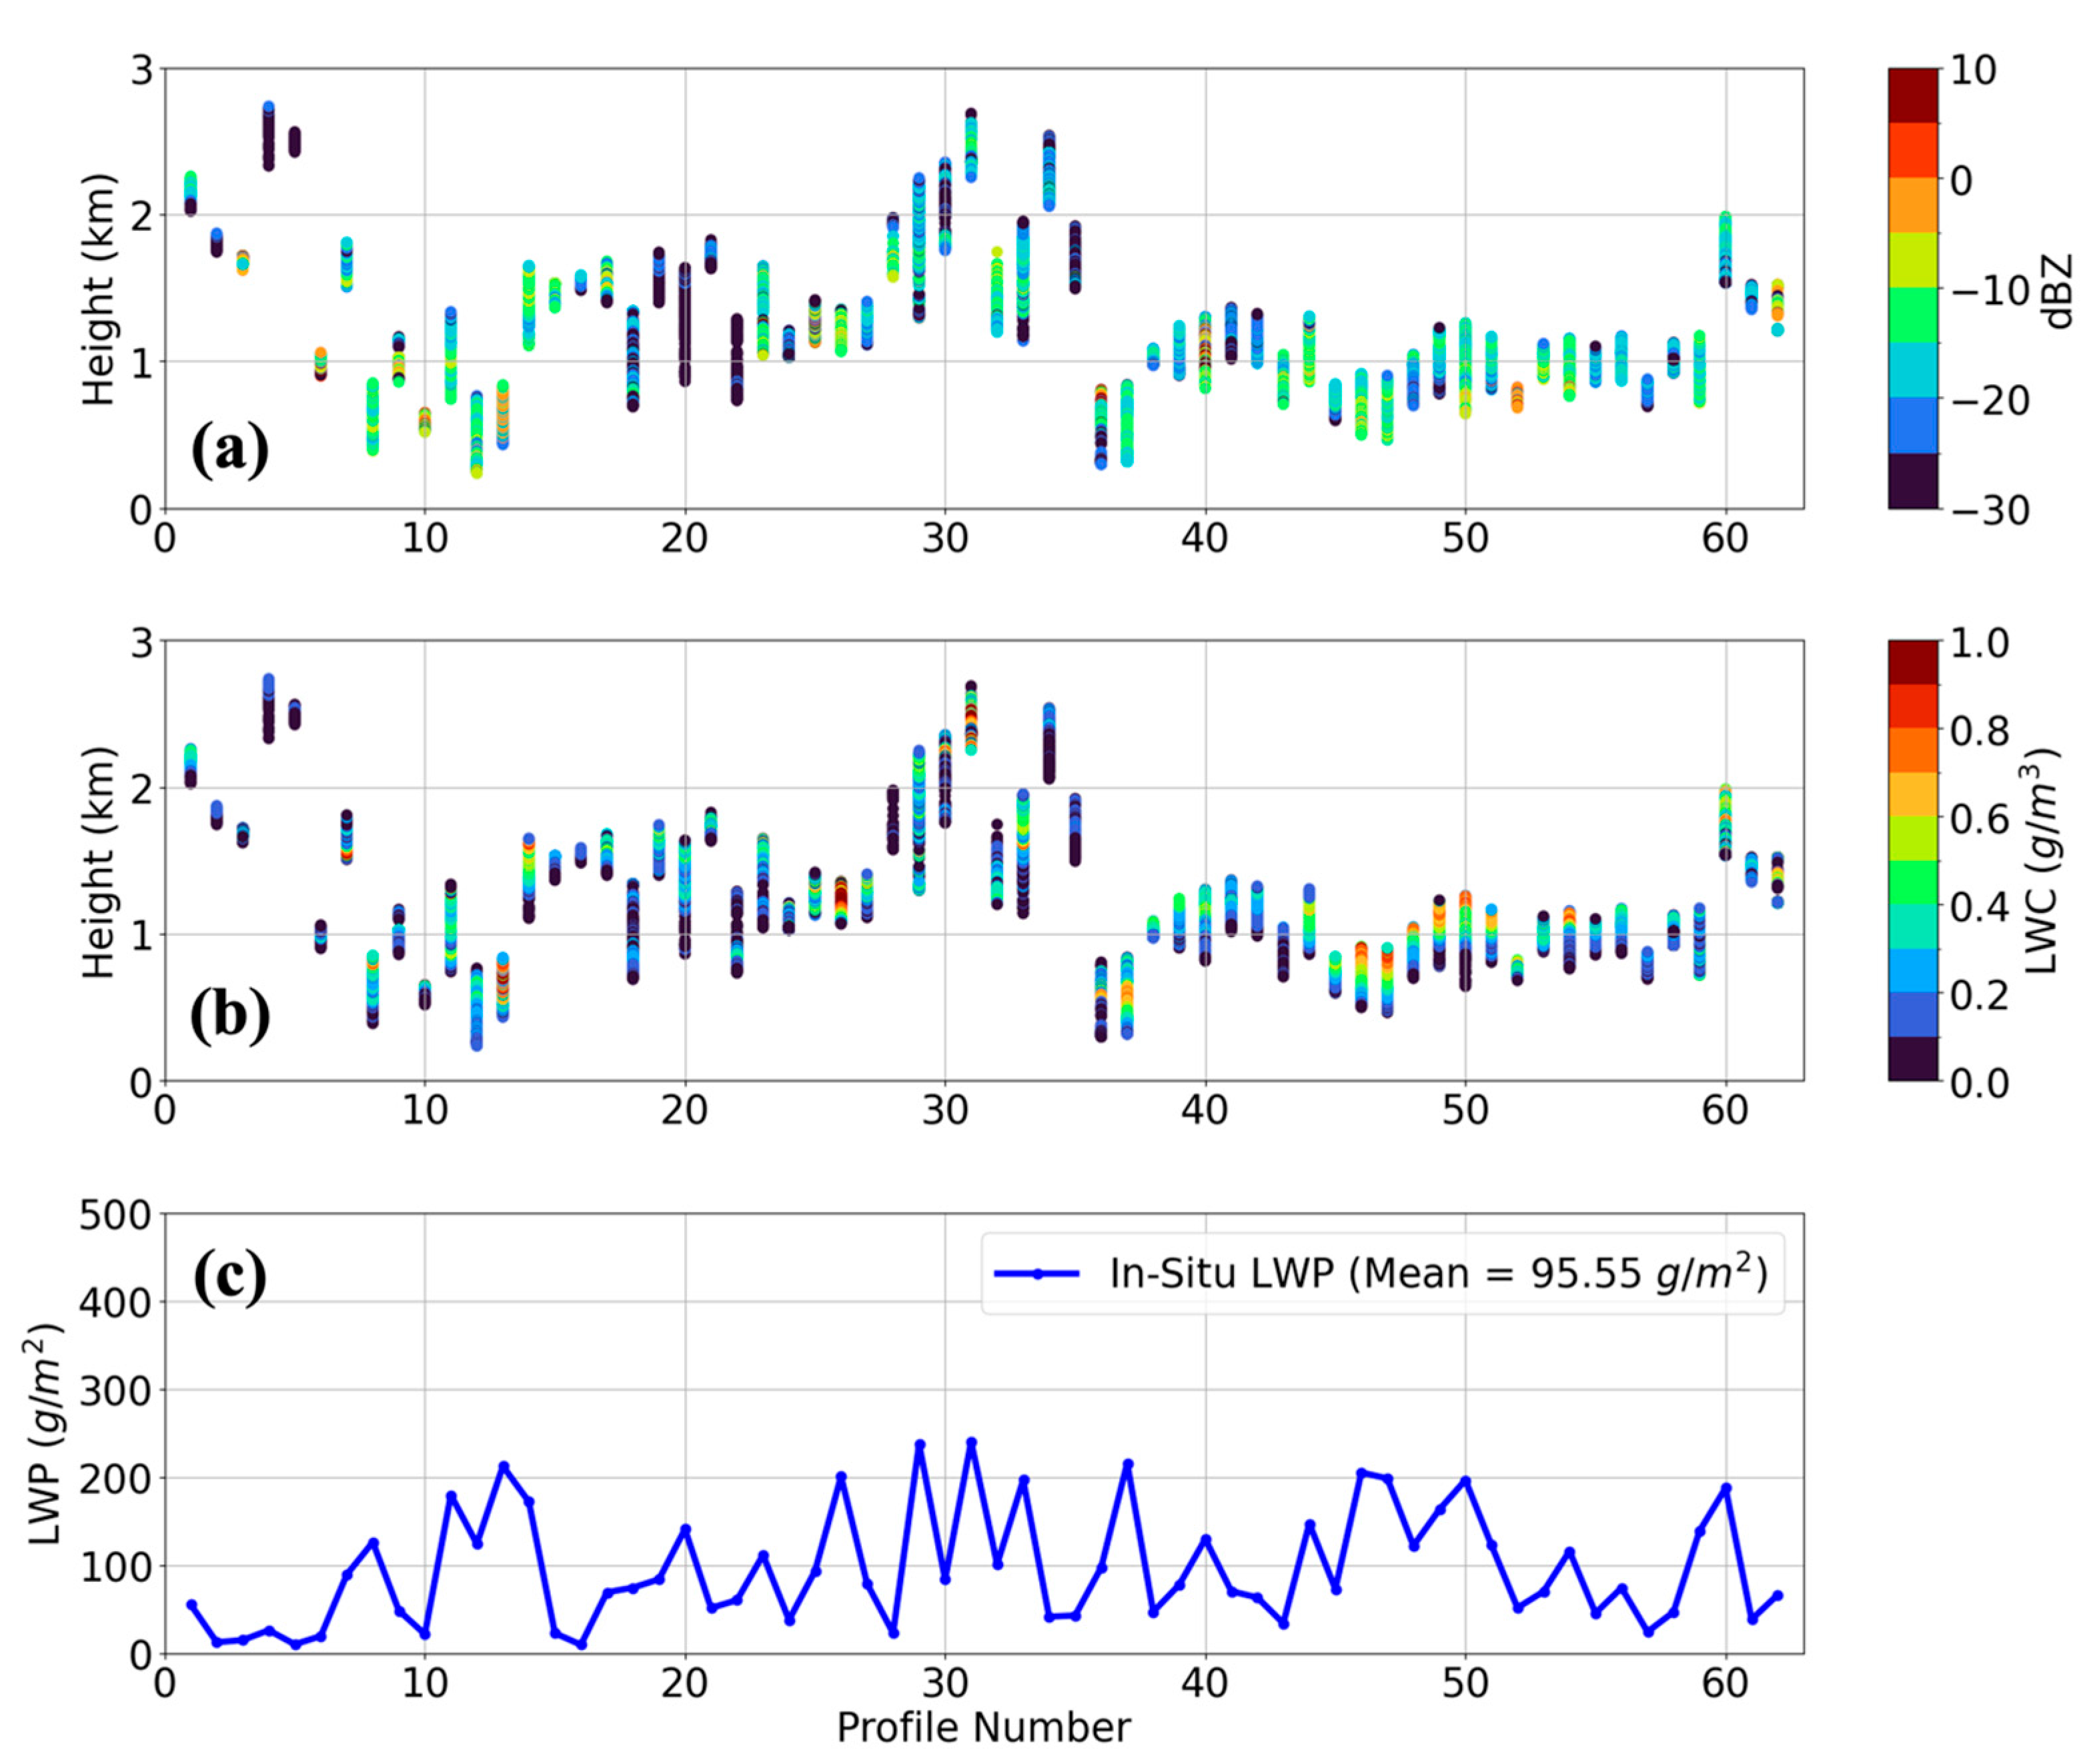
Figure 1. A total of 62 in-cloud profiles are composed from 10,135 (1 Hz) SOCRATES CDP+2D-S DSD spectra to derive in situ (a) reflectivity profiles (Z was converted to dBZ), (b) LWC (g/m3), and (c) LWP (g/m2), as per Equations (1)–(3).
Atmosphere 16 01195 g001
Figure 2. Exponential relationship between LWC-Z derived from the 10,135 in situ DSD measurements for the 62 in-cloud profiles from SOCRATES.
Atmosphere 16 01195 g002
Figure 3. Flow chart depicting the phase classification of single-layered low clouds during SOCRATES. Temperature is provided from ERA5 reanalysis air temperature product.
Atmosphere 16 01195 g003
Figure 4. (ad) Bivariate histograms of HCR reflectivity (dBZ) and Doppler velocity (Vd) for different spectrum widths (WID), LWPs, and temperatures (T), illustrating the phase classification of cloud samples. The colored bars indicate sample counts, and dashed lines mark classification thresholds. All valid pixels are included without applying cloud boundary constraints.
Atmosphere 16 01195 g004
Figure 5. Profiles of HCR reflectivity with HCR-Hbase (fuchsia) and HSRL-Hbase (black) for selected drizzling (ac) and non-drizzling (df) cases in upward and downward-looking conditions. The black line shows aircraft altitude. The Htop (not marked) lies around the upper boundary of the HCR-reflectivity profiles. Time is in decimal hours.
Atmosphere 16 01195 g005
Figure 6. Frequency histograms of (a) Hbase and (b) Htop for all cloud cases combined during SOCRATES (HCR-derived) and MARCUS (MPL/ceilometer) over the selected region. (c) LWPs derived from empirical relationships for SOCRATES are also compared with MARCUS MWR retrievals.
Atmosphere 16 01195 g006
Figure 7. A case from SOCRATES flight on 2018-01-31 (RF07) with (a) HCR reflectivity with flight altitude (black line) and HCR-derived Hbase (dashed red line), (b) Doppler velocity (Vd), (c) spectrum width (WID), (d) retrieved LWC profile, (e) LWP, and (f) classified cloud-phase categories. Textures in (f) are just for enhanced visual clarity.
Atmosphere 16 01195 g007
Figure 8. Distribution of phase partitioning for hydrometeor types identified by (a) the MLR-phase classification and (b) the PID algorithm, showing the percentage of each phase category as classified by the HCR-phase method.
Atmosphere 16 01195 g008
Table 1. Means (and standard deviation) of Hbase (and Htop) derived from different measurements under varying conditions and viewing geometry. The in situ cloud boundaries are not subject to any radar/lidar viewing direction.
Drizzling Cases
(Looking Up)
Non-Drizzling Cases
(Looking Up)
Drizzling Cases
(Looking Down)
Non-Drizzling Cases
(Looking Down)
HCR-Htop1.70 ± 0.491.45 ± 0.421.82 ± 0.531.59 ± 0.55
HCR-Hbase1.10 ± 0.510.70 ± 0.321.12 ± 0.600.64 ± 0.53
HSRL-Hbase1.35 ± 0.430.91 ± 0.381.70 ± 0.540.97 ± 0.62
In situ Hbase1.18 ± 0.510.60 ± 0.56--
In situ Htop1.88 ± 0.661.87 ± 0.42--
MARCUS-Hbase0.99 ± 0.370.87 ± 0.37--
MARCUS-Htop1.50 ± 0.441.24 ± 0.44--
All values are in kilometers (km).
Table 2. (a) Hit rates and counts of nearest samples in agreement between HCR-phase and MLR-phase classifications. (b) Hit rates and sample counts for overlapping phase categories between HCR-phase classification and the PID scheme. Miss rates can be obtained as 100 − hit rate (%).
(a) 1Combined AllLiquidMixed PhaseIce-
Hit Rate (%)60597148-
Matched Samples (Count)1761372514-
(b) 2Combined AllLiquidFrozenDrizzleRain
Hit Rate (%)70755266100
Matched Samples (Count)45,60623,901412116,2131371
1 Comparison between HCR-phase and probe-based MLR-phase product; 2 comparison between HCR-phase and fuzzy logic PID-phase product.
Table 3. (a) Comparison of HCR-phase classification with in situ phase products (MLR) and MARCUS-phase retrievals. For HCR phase, drizzle, rain, and snow categories are excluded from this comparison. (b) Comparison of HCR-phase with PID scheme. Frozen categories combine ice and snow (for HCR phase) and large frozen and small frozen (for PID).
(a)Results from SOCRATESResults from MARCUS
HCR PhaseMLRWACR-MWRThermo-Cloud Phase
Liquid %64.052.258.656.8
Mixed %28.89.530.727.2
Ice %7.238.210.615.9
(b)HCR PhasePID scheme
Liquid %40.656.3
Mix %18.3-
Melting %-1.9
Frozen %8.811.5
Drizzle %29.128.4
Rain %3.21.9
Disclaimer/Publisher’s Note: The statements, opinions and data contained in all publications are solely those of the individual author(s) and contributor(s) and not of MDPI and/or the editor(s). MDPI and/or the editor(s) disclaim responsibility for any injury to people or property resulting from any ideas, methods, instructions or products referred to in the content.