Article

The Use of Atmospheric Reanalysis Data for the Estimation of Solar Irradiation Considering the Effect of Atmospheric Aerosols over Brazil

by
Bruno Ribeiro Herdies
1,2,
Eder Paulo Vendrasco
2,*,
Dirceu Luís Herdies
2,
Celso Eduardo Lins de Oliveira
1 and
Mario Francisco Leal de Quadro
3
1
Faculty of Animal Science and Food Engineering, University of São Paulo, Pirassununga 13630, SP, Brazil
2
National Institute for Space Research, Cachoeira Paulista 12630, SP, Brazil
3
Federal Institute of Santa Catarina, Florianópolis 88020, SC, Brazil
*
Author to whom correspondence should be addressed.
Atmosphere 2025, 16(2), 124; https://doi.org/10.3390/atmos16020124
Submission received: 26 July 2024 / Revised: 23 September 2024 / Accepted: 12 October 2024 / Published: 24 January 2025
(This article belongs to the Section Aerosols)

Abstract

:
In recent years, several studies have evaluated the potential of renewable energy sources in response to climate change and high energy demand. Due to its equatorial location and significant solar and wind potential, Brazil has incorporated alternative sources into its energy matrix, driven by more efficient and economical technologies for solar energy. However, the availability of observed data is still limited, and many studies rely on satellite estimates or extrapolations of in situ observations from other regions, compromising the efficiency of new technologies. This study uses NASA MERRA-2 reanalysis data to evaluate the influence of aerosols and cloudiness on the estimate of solar irradiance in Brazil. INMET stations were chosen in regions representative of the Brazilian climate and geography, with more than 12 years of observational data. MERRA-2 includes aerosol fields that interact with the model’s radiation fields, with a spatial resolution of 0.5° and hourly temporal resolution. Variables used include shortwave radiation fluxes and aerosol optical depth. Statistical indices used in performance analysis include mean bias, mean squared error, and Pearson correlation coefficient. The stations’ diurnal solar irradiance cycles were compared with MERRA-2 reanalysis data, considering different scenarios of aerosol and cloudiness effects. The reanalysis data represented the Bauru and Santa Maria stations well, while others, such as Barreiras and Goiânia, showed underestimation. Monthly cycling was also analyzed, highlighting seasonality, with greater amplitude in Santa Maria and lower in Caicó. In some locations, such as Campo Grande, the influence of aerosols is more significant, especially during the dry months, when forest fires, mainly in the Amazon region, increase the aerosol optical depth. The results show that reanalysis estimates can be used to evaluate the temporal variability of solar irradiation in regions without observational data. In conclusion, the study was able to evaluate the temporal variability of solar irradiation in Brazil using MERRA-2 atmospheric reanalysis data, demonstrating that, although there are differences with observational data, reanalysis estimates are useful in areas without observed data, with values correlation values above 0.8 and reaching values close to 0.95. However, although small, the differences observed between measured and estimated solar irradiation are generally caused by the inability of models to adequately represent the fraction of clouds and aerosols in the atmosphere.

1. Introduction

In recent years, numerous studies have been conducted to evaluate the potential of renewable energy sources worldwide in response to the increasing impacts of climate change. Due to its equatorial location and significant solar and wind energy potential, Brazil has seen substantial changes in its energy matrix, incorporating alternative energy generation sources. This growth has been facilitated by developing more efficient and cost-effective technologies for solar energy. Despite advancements in new systems, the availability of observed data remains quite limited. Some studies rely on satellite-estimated data [1,2] or extrapolate from observations in other regions [3], undermining the efficient use of new technologies. One of the most important works in this field is the second edition of the Brazilian Solar Energy Atlas [4], which uses both observed and satellite data with the radiative transfer model BRASIL-SR [5].
Ref. [6] analyzed the capacity of two numerical mesoscale models, BRAMS (Brazilian developments on the Regional Atmospheric Modelling System) and WRF (Weather Research & Forecasting Model), to simulate solar irradiation conditions in Brazil’s northeastern region. The results show that BRAMS presented better results in the northern portion of the northeast, and WRF presented the best results in the driest months, mainly in the coastal and interior regions of the northeast. The predicted results differ from the local data, with a large interannual variability and average behavior.
Aerosols can directly interact with solar radiation through extinction, dispersion, absorption, and emission [7]. The aerosols also indirectly affect the net solar radiation at the surface due to their role in cloud formation since they can act as cloud condensation nuclei and ice nuclei [8]. The more aerosols are present in the atmosphere, the smaller the cloud droplets will be due to their competition for humidity, and the cloud lifecycle will be changed [9]. Furthermore, depending on the aerosol type, the albedo of the clouds can be modified. Therefore, it is clear that aerosols play an important role in the net solar radiation observed at the surface, and they must be taken into account in order to better understand the interaction of solar radiation and the atmosphere.
A numerical modeling study considering the effect of aerosols showed a reduction in RMSE (Root Mean Square Error) and BIAS in solar irradiation estimates, considering horizontal visibility. However, it could not adequately represent the actual atmospheric load of aerosol from biomass burning [10]. Ref. [11] analyzed the capabilities of the new version of the radiative transfer model BRASIL-SR for clear sky modeling for several Brazilian locations where large biomass fire activities can be expected. The results indicate good skill in estimating GNI (global normal irradiance) and DNI (direct normal irradiance) using the 2nd generation of the model.
Ref. [12] made a comparison between data from the MERRA (Modern-Era Retrospective Analysis for Research and Applications), and MERRA2 reanalysis [13], validated with observed solar irradiation data from surface stations in China from 1980–2014. As well as an evaluation of data with cloud cover and aerosols. The results were similar to those found by [14], with an overestimation of solar irradiation due to the problems of both reanalysis of underestimating cloudiness values, with the greatest biases in the south region and the lowest values in the east region. MERRA2 presents a reduction in biases in the north region, possibly due to the assimilation of aerosols, which has better performance than MERRA.
Recent work [15] evaluated data from the MERRA-2 reanalysis, from GMAO/NASA (Global Modeling and Assimilation Office/National Aeronautics and Space Administration), and ERA5 (fifth generation reanalysis), from ECMWF (European Centre for Medium-Range for Weather Forecasts) as an estimate for solar irradiance data, which were validated with observed global horizontal irradiance data obtained over the Indonesian region. In these studies, it was possible to observe that most of the ERA5 reanalysis data presented a positive bias compared to the observed hourly solar irradiance data, with the MERRA2 data mostly presenting a negative bias. Similar results were found for monthly values. In general, ERA5 estimates presented the best results compared to observed data.
Studies relating to the effects of aerosols are very recent. In one of these works [16], the influence of aerosols on solar energy generation was presented, making clear the decrease in the efficiency of energy generation in the presence of aerosols, especially when analyzing the period from March to October, when the highest load of aerosols occurs due to the fires that occur in the north and central-west regions of Brazil.
Meteorological reanalysis uses state-of-the-art numerical modeling and data assimilation systems, where observed data for various state variables, such as surface pressure, temperature, humidity, and wind data, among others, are used to create a retrospective analysis of various atmospheric parameters. Data from multiple sources are incorporated in the data assimilation process, used to determine the state of the atmosphere at a given moment, including surface stations, ships, aircraft, radiosondes, satellite estimates, and initial atmospheric conditions from numerical weather prediction (NWP) models. Despite the potential of these studies, with high temporal and spatial resolutions (hourly and tens of kilometers, respectively), there are few records of the use of reanalysis data for Brazil in solar irradiance studies, motivating the present study.
This study uses NASA’s MERRA-2 reanalysis data to evaluate the effect of atmospheric aerosols on solar radiation fields and which component of the reanalysis, among the four that will be used in this study, best represents the various regions analyzed in the northeast, central-west, southeast, and south of Brazil. The effect of atmospheric aerosols can be considered the most important factor for the extinction of solar radiation in cloudless conditions, followed by water vapor.

2. Materials and Methods

This section defines the observed data used as a reference and the reanalysis data validated for estimating solar irradiation in different Brazilian regions. The evaluation methods used for this validation will also be defined.

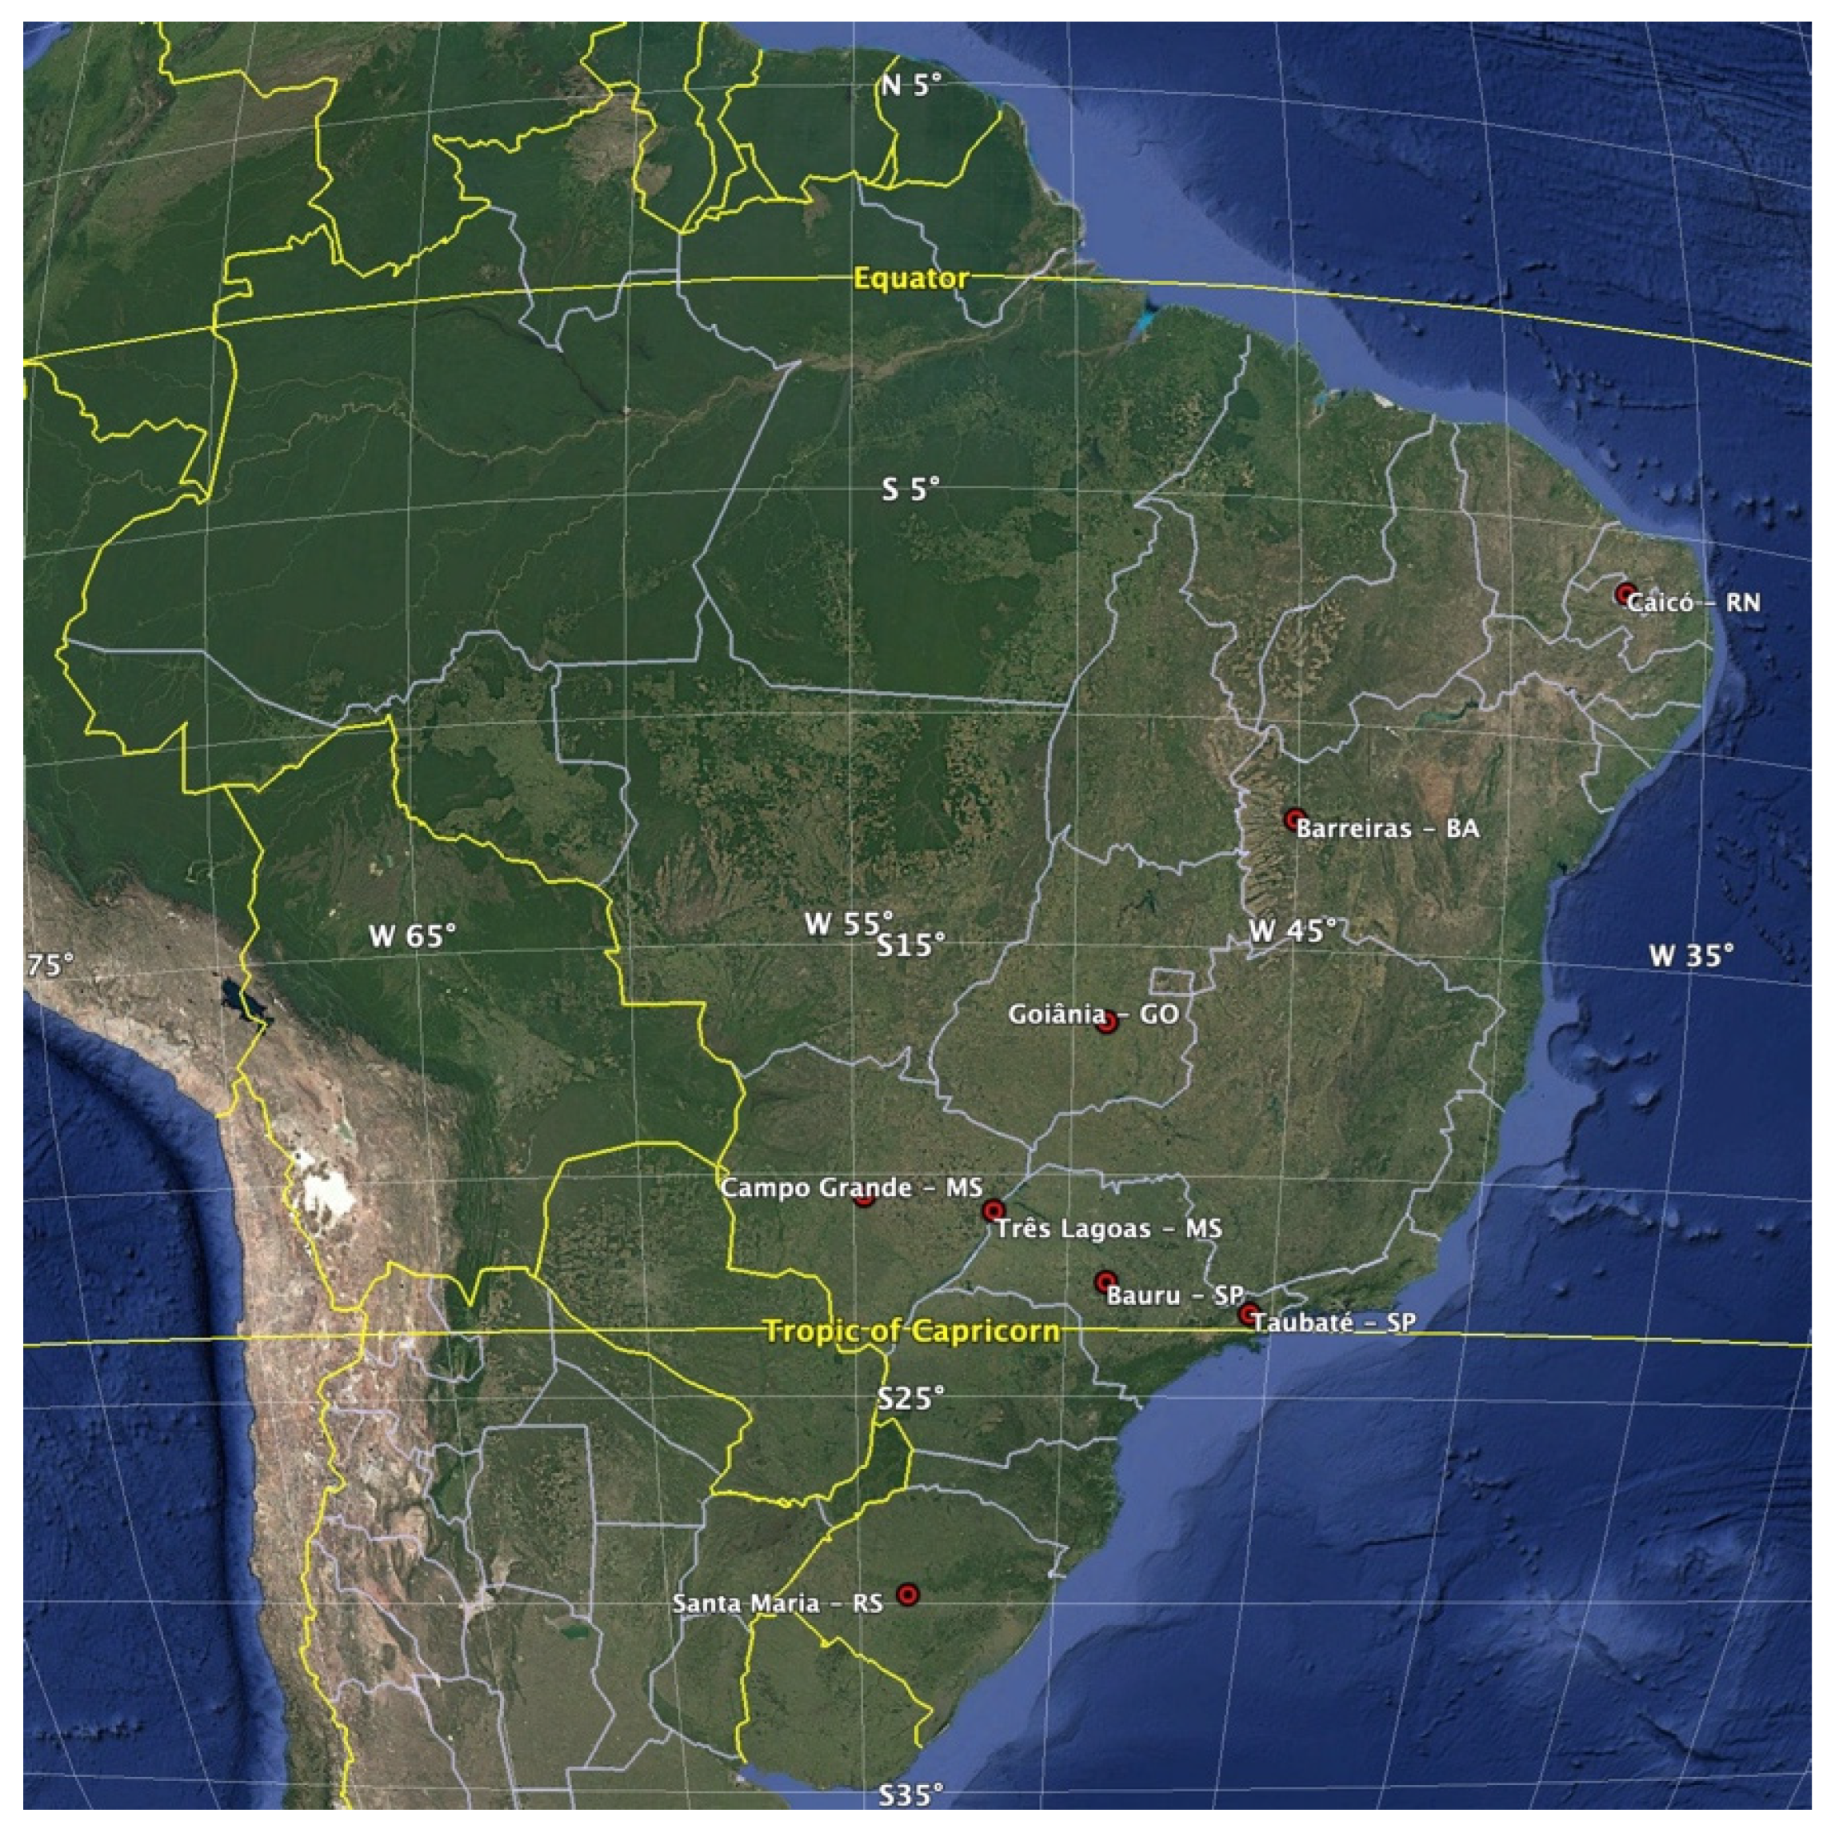
2.1. Study Region and Observational Data

The study area includes locations in the northeast, southeast, central-west, and south of Brazil. The observed data set was chosen from stations with solar irradiation measurements using observational data (2001–2019) collected by INMET (National Institute of Meteorology), and the choice was made according to its climatic representativeness and geographic area of Brazil (Figure 1).
Initially, a description of the climate of each station will be carried out. The town of Caicó, in the State of Rio Grande do Norte, due to its location close to the equator and its well-defined precipitation regime, with little precipitation during most of the year, with the maximum in March, with an average of 99 mm, and minimum rainfall between the months of August and November, when the average total for the four months reaches a cumulative 12 mm, the annual average is 377 mm. Campo Grande, in the state of Mato Grosso do Sul, in the central region of South America (Figure 1), has a more homogeneous distribution of precipitation, with an annual average of 1573 mm, where the maximum observed occurs in January, with 234 mm, and the minimum precipitation is recorded in July, with 30 mm. Taubaté, in the state of São Paulo, is located between the Mantiqueira and Serra do Mar mountains, with an average yearly rainfall of 1592 mm, with a maximum of 299 mm in January and a minimum of 30 mm in June. The climate in Barreiras, in the state of Bahia, is tropical, with winters drier than summers. The average annual temperature is 25.7 °C, and the average annual rainfall is 863 mm. The highest rainfall occurs in November, with an average of 154 mm, while July is the driest month, with 0 mm. The climate in Santa Maria, in the state of Rio Grande do Sul, is hot and temperate, with significant rainfall throughout the year, even in the driest month. The average temperature is 19.0 °C, and the average annual rainfall is 1838 mm. August is the driest month, with 123 mm, while October is the wettest, with an average of 215 mm. Featuring a tropical climate, Goiânia, located in the state of Goiás, has a summer with significantly higher rainfall than the winter. The average annual temperature is 23.4 °C, with an average rainfall of 1270 mm. July is the driest month, with just 2 mm of precipitation, while January is the wettest, with an average of 226 mm. In the state of São Paulo, Bauru has a tropical climate, with summers that are rainier than winters and an average annual rainfall of 1357 mm. Summer extends from January to December. July is the driest month, with 30 mm of precipitation, while January records the highest precipitation, with an average of 259 mm. Três Lagoas, located in Mato Grosso do Sul, has a tropical climate characterized by rainier summers than winters, with an average annual rainfall of 1340 mm. Summer occurs from January to December, with July being the driest month, with 18 mm of precipitation, while January records the highest average, with 240 mm [17].
The stations were chosen for having more than 12 years of data (Table 1) and considered a representative set for the present study.
The data was validated using basic quality control, eliminating spurious data and series with large data gaps. The procedure was implemented based on a set of methods that include the combination of different analyses (identification of duplication, delimitation of solar elevation, demarcation of physically possible lower and upper limits) for application in data acquired with hourly frequency, with a focus on identifying errors and uncertainties in the measurements. Duplicate data, measurements obtained at low elevation angles, and values that violated the physically possible lower and upper limits were eliminated from the data set used in the present study.

2.2. Reanalysis MERRA-2

The reanalysis dataset used in this study is the second generation of the Modern-Era Retrospective Analysis for Research and Applications (MERRA-2) by NASA’s Global Modeling and Assimilation Office (GMAO). Unlike any previous long-term atmospheric reanalysis, MERRA-2 includes online aerosol fields that interact with the model’s radiation fields, representing both direct and semi-direct aerosol effects [13]. The spatial resolution of MERRA-2 data is 0.5°, or approximately 50 km, with hourly temporal resolution. MERRA-2 incorporates aerosol data assimilation, where meteorological observations are assimilated within a global assimilation system. The system uses GEOS-5 (Goddard Earth Observing System, version 5.12.4) and the GSI (Gridded Statistical Interpolation) data assimilation system. The model includes the Finite Volume dynamical core with horizontal discretization on a cubed-sphere grid, with an approximate resolution of 0.5° × 0.625° and 72 vertical levels [13].
The variables used are Surface Net Downward Shortwave Flux (SWGNT), Surface Net Downward Shortwave Flux assuming no aerosol (SWGNTCLN), Surface Net Downward Shortwave Flux assuming clear sky (SWGNTCLR), and Surface Net Downward Shortwave Flux assuming clear sky and no aerosol (SWGNTCLRCLN). Aerosol Optical Depth (AOD) data, also from MERRA-2 [18], are utilized to compare and evaluate the direct influence of aerosols. Bilinear interpolation estimates the downward shortwave flux from MERRA-2 at the INMET ‘s surface stations.

2.3. Statistical Analysis

In the performance analysis of the reanalysis, the following statistical indices will be used: MBE is the mean bias error (Equation (1)), RMSE is the root mean square error (Equation (2)), and r is the correlation coefficient of Pearson (Equation (3)) [19]. These indices will generate Taylor diagrams for each location [20]. It is important to note that the model data will be interpolated to the surface station locations for individual evaluation.
M B E = 1 N i = 1 n ( x i y i )
R M S E = 1 N i = 1 n ( x i y i ) 2
r = i = 1 n [ x i x ¯ y i y ¯ ] .   i = 1 n ( x i x ¯ ) 2 i = 1 n ( y i y ¯ ) 2
where x represents the estimated model value, y is the observed value of the irradiation data, N is the number of discrete points, and x ¯ and y ¯ are the corresponding mean.
The dataset for this study will consist of data from surface meteorological stations, specifically radiometric data on solar irradiation, from stations available in various regions of Brazil (Table 1). The classifications of solar irradiance according to the way it reaches the Earth’s surface are shown in Figure 2. Extraterrestrial irradiance refers to the radiant energy incident on the top of the Earth’s atmosphere. Global horizontal irradiance (beam radiation) is the shortwave radiation resulting from the sum of direct and diffuse irradiance and is the most commonly used component to estimate the efficiency of a photovoltaic system. Direct horizontal irradiance refers to the rate of solar energy coming directly from the Sun that falls on a horizontal surface, and diffuse irradiance refers to the incidence of solar radiation deflected and interfered with by atmospheric agents (pollution, clouds, particulate matter).

3. Results and Discussion
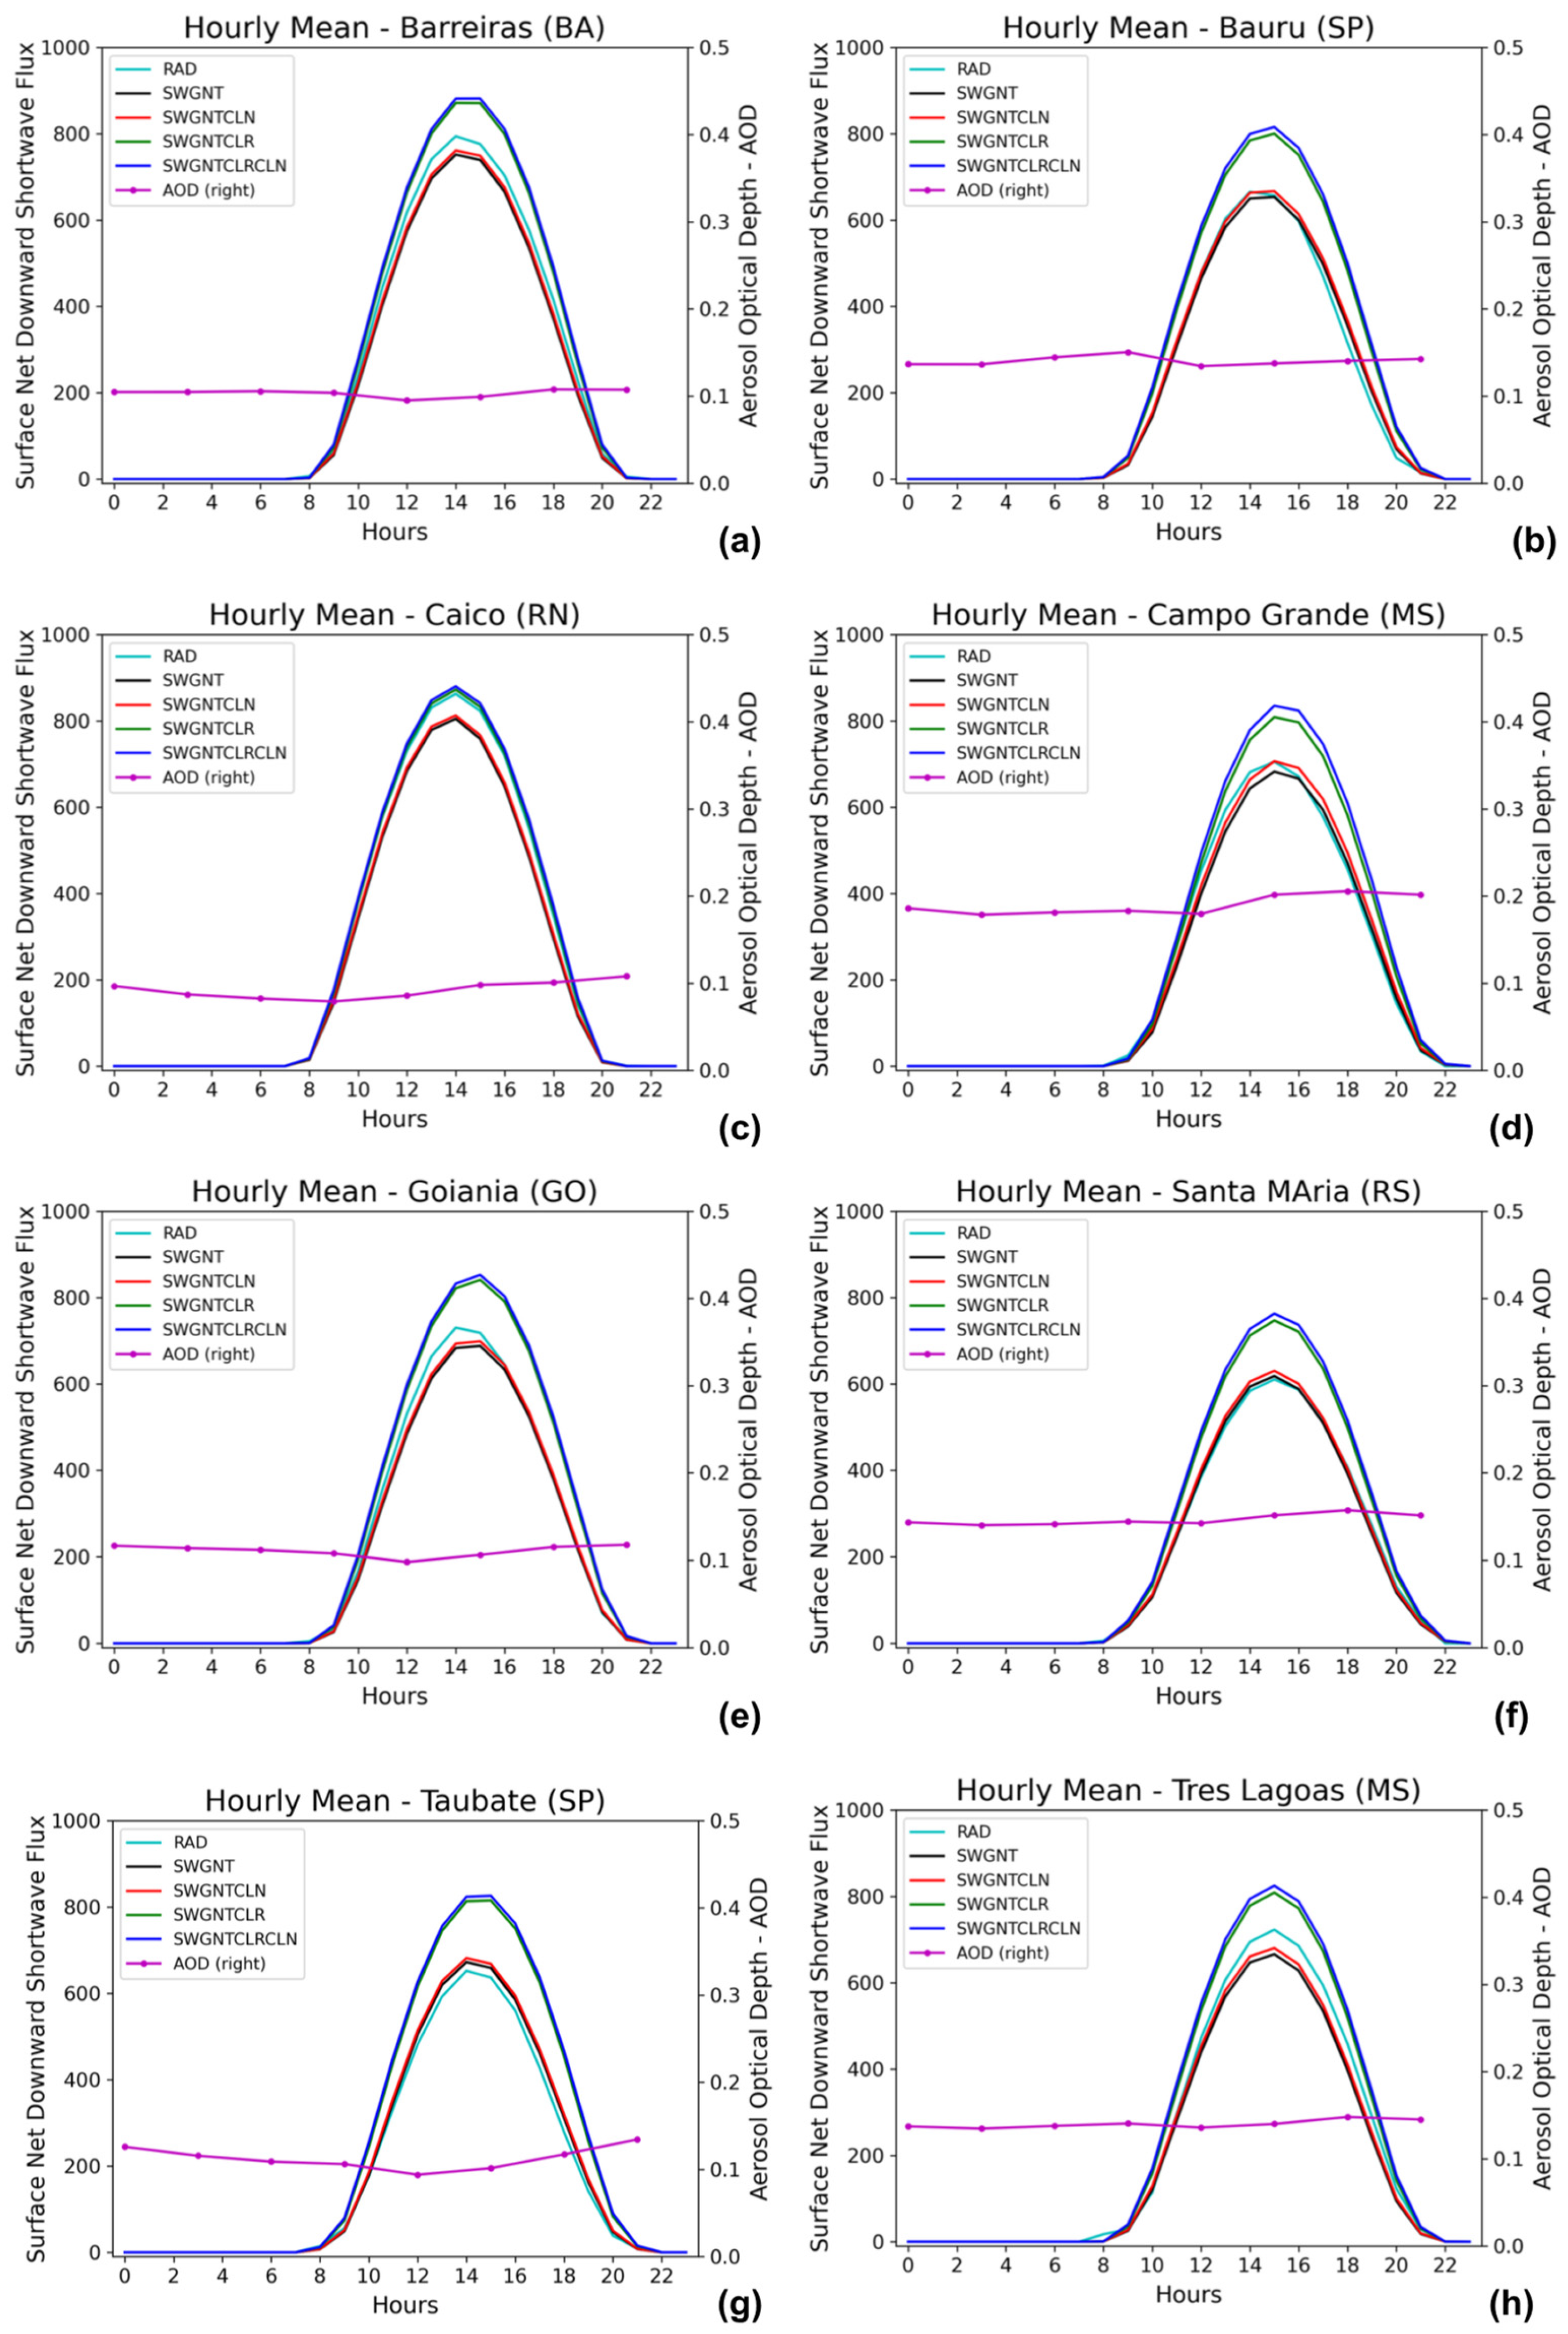
The following sections present a more detailed analysis of the comparison of the observed data from INMET and the four components of the MERRA-2 reanalysis, as well as the diurnal, monthly cycle, and time series of the data used.

3.1. Diurnal Cycle

Several studies point to the use of renewable energy, mainly solar and wind, as one of the most promising paths for society as a whole, from a social, economic, and political point of view [21,22]. However, the knowledge and feasibility of using renewable energy requires knowledge of the specific characteristics of each region. The diurnal cycle is one of these components, in which the understanding refers to the efficient use of solar energy in a given region, and in most cases, climatological information is used, which covers a very large spatial area and does not represent the local details of the region.
Figure 3 presents the diurnal solar irradiance cycle of eight INMET stations (RAD) presented in Figure 1 and Table 1, which were compared with data from the MERRA-2 reanalysis, where there are four components, SWGNT which considers the effect of aerosols and of cloudiness, SWGNTCLN where the impact of aerosols is disregarded, SWGNTCLR where the effect of cloudiness is not taken into account, considering clear sky and SWGNTCLNCLR where the effects of aerosols or cloudiness are not considered.
The Bauru (Figure 3b) and Santa Maria (Figure 3f) stations are well represented by the reanalysis data, considering the effects of aerosols and cloudiness, considering the SWGNT variable. The diurnal cycle component is underestimated by the reanalysis, considering the effect of aerosols and cloudiness (SWGNT) in the locations of Barreiras (Figure 3a), Goiania (Figure 3e), and Três Lagoas (Figure 3h). The overestimation occurs in the locality of Taubaté (Figure 3g). However, the most surprising results of the diurnal cycle are observed in Caicó (Figure 3c), where the best representation of solar irradiance is made by the reanalysis component that disregards the effects of cloudiness and aerosols (SWCLNCLR). Caicó is located very close to the equator, in a semi-arid region in northeast Brazil with low rainfall, 377 mm annually. In this region, pollution is minimal, with very low AOD values, generally with a diurnal cycle below 0.1 and cloudiness, and the model can disregard these effects. Interestingly, in this location, the results of the reanalysis with and without the effect of cloudiness present the smallest differences between the eight stations analyzed, showing that despite the underestimation of solar irradiance, the model manages to capture the low effect of cloudiness in the region. Another interesting result occurs in Campo Grande (Figure 3d), where the effect of aerosols is the most significant in the reanalysis results, where the biggest differences appear when the effects of aerosols are considered. In this location, the observed solar irradiance is close to the result when the effect of aerosols is disregarded, and the diurnal cycle of AOD is the most pronounced of all, reaching values around 0.2.
The highest average values of daytime solar irradiance are observed in Caicó (RN), followed by Barreiras (BA), with a peak of around 800 W/m2 in both locations. The lowest values are observed in Santa Maria (RS), around 600 W/m2, the station located furthest south of all the stations.

3.2. Monthly Mean

An important point that needs to be considered in the availability of solar irradiation is its annual component, where the effects of seasonality and the different seasons of the year are considered. Seasonality is very pronounced in the locality of Santa Maria (Figure 4f), which is located around 30° S, where well-defined maximums are observed in the summer (November–February) and minimums in the winter months (June and July), reaching values below 50% of the maximum observed. The locality of Caicó (Figure 4c), the closest to the Equator, also presents a seasonality, but much less pronounced, where the difference between maximum and minimum approaches 20%, with the maximum observed during the spring months, and the minimum at the beginning of winter. In the locations of Barreiras (Figure 4a) and Goiania (Figure 4e), only the maximum is well defined, with a peak at the beginning of spring, showing a greater regularity in annual solar irradiation. September is the month with the most hours of sunshine per day, which is well represented in the simulations. The other stations have a similar cycle to Santa Maria, although less pronounced, with the minimum in winter and the maximum in summer.
Taubaté (Figure 4g) presents a classic behavior where the reanalysis results, considering the sky with clouds and aerosols (SWGNT), are close to what was observed. In the annual cycle, a slight underestimation can be observed during the month of February and a slight overestimation during the winter and spring months. The behavior of the solar irradiation field generated by the model shows very similar behavior when cloudiness and aerosol are considered, as well as clear skies and no aerosol, with the biggest differences in the month of September, where the AOD also presents a peak, possibly associated with the fires in the region and the influence of transport from the fires in the Amazon region [16]. The biggest differences are observed when considering clear skies (SWGNTCLR), that is, without any cloud cover, and clear skies without aerosols (SWGNTCLRCLN). Practically all other stations show similar behavior.
The annual cycle that draws the most attention is that of the Caicó (Figure 4c) and Campo Grande (Figure 4d) stations. That of Caicó due to the fact that its monthly values are very similar to the values from the MERRA-2 reanalysis without the effects of cloudiness and aerosols (SWGNTCLRCLN), that is, the values that consider these two effects underestimate solar irradiation in practically all months, except in June and July, where the observed irradiation values are better defined when these effects are considered (SWGNT), and in the months of August–September where there is an approximation between the two components of the reanalysis SWGNT and SWGNTCLRCLN. It is interesting to note that the model approximates the values in the second half of the year, neglecting the effects of cloudiness and aerosols, yet underestimating the values observed in November. Considering clear skies and no aerosol, this behavior of proximity between the observed values and the model results may be associated with the region’s low precipitation and low cloud cover. Analyzing the model results, from July onwards, it is possible to observe the proximity of all values considering clear skies since it is a very dry period, with quarterly rainfall below 15 mm. In Campo Grande (Figure 4d), what appears well defined is the effect of aerosols in September, when the highest peak of AOD occurs, which comes close to 0.5, and there is a drop in the observed values, and can also be observed in the SWGNTCLN component (without the effects of aerosols) which presents the greatest difference with SWGNT. This difference between the two components is the greatest of all locations, followed by Três Lagoas (Figure 4h) and Bauru (Figure 4b), during September, the month that has the greatest influence of the Amazonian fires (Figure 5), due to the northerly flow, which is transported by the Low-Level Jet [23], which transports humidity and the pollution plume from the fires to the south and southeast regions of Brazil [24].
It is important to highlight that the Campo Grande region (Figure 4d) is under the strong influence of the pollution plume from the fires in the Amazon region (Figure 5), which occurs during the dry months (July, August, and September), influencing observed values of solar irradiation. This is the season where the impact of aerosols on the model results becomes very clear, especially in the dry season, with a significant increase in AOD values during the months of August–October. It is also possible to observe that the pollution plume mainly affects the region of Mato Grosso and Mato Grosso do Sul, as well as the west of São Paulo and Rio Grande do Sul [25,26].

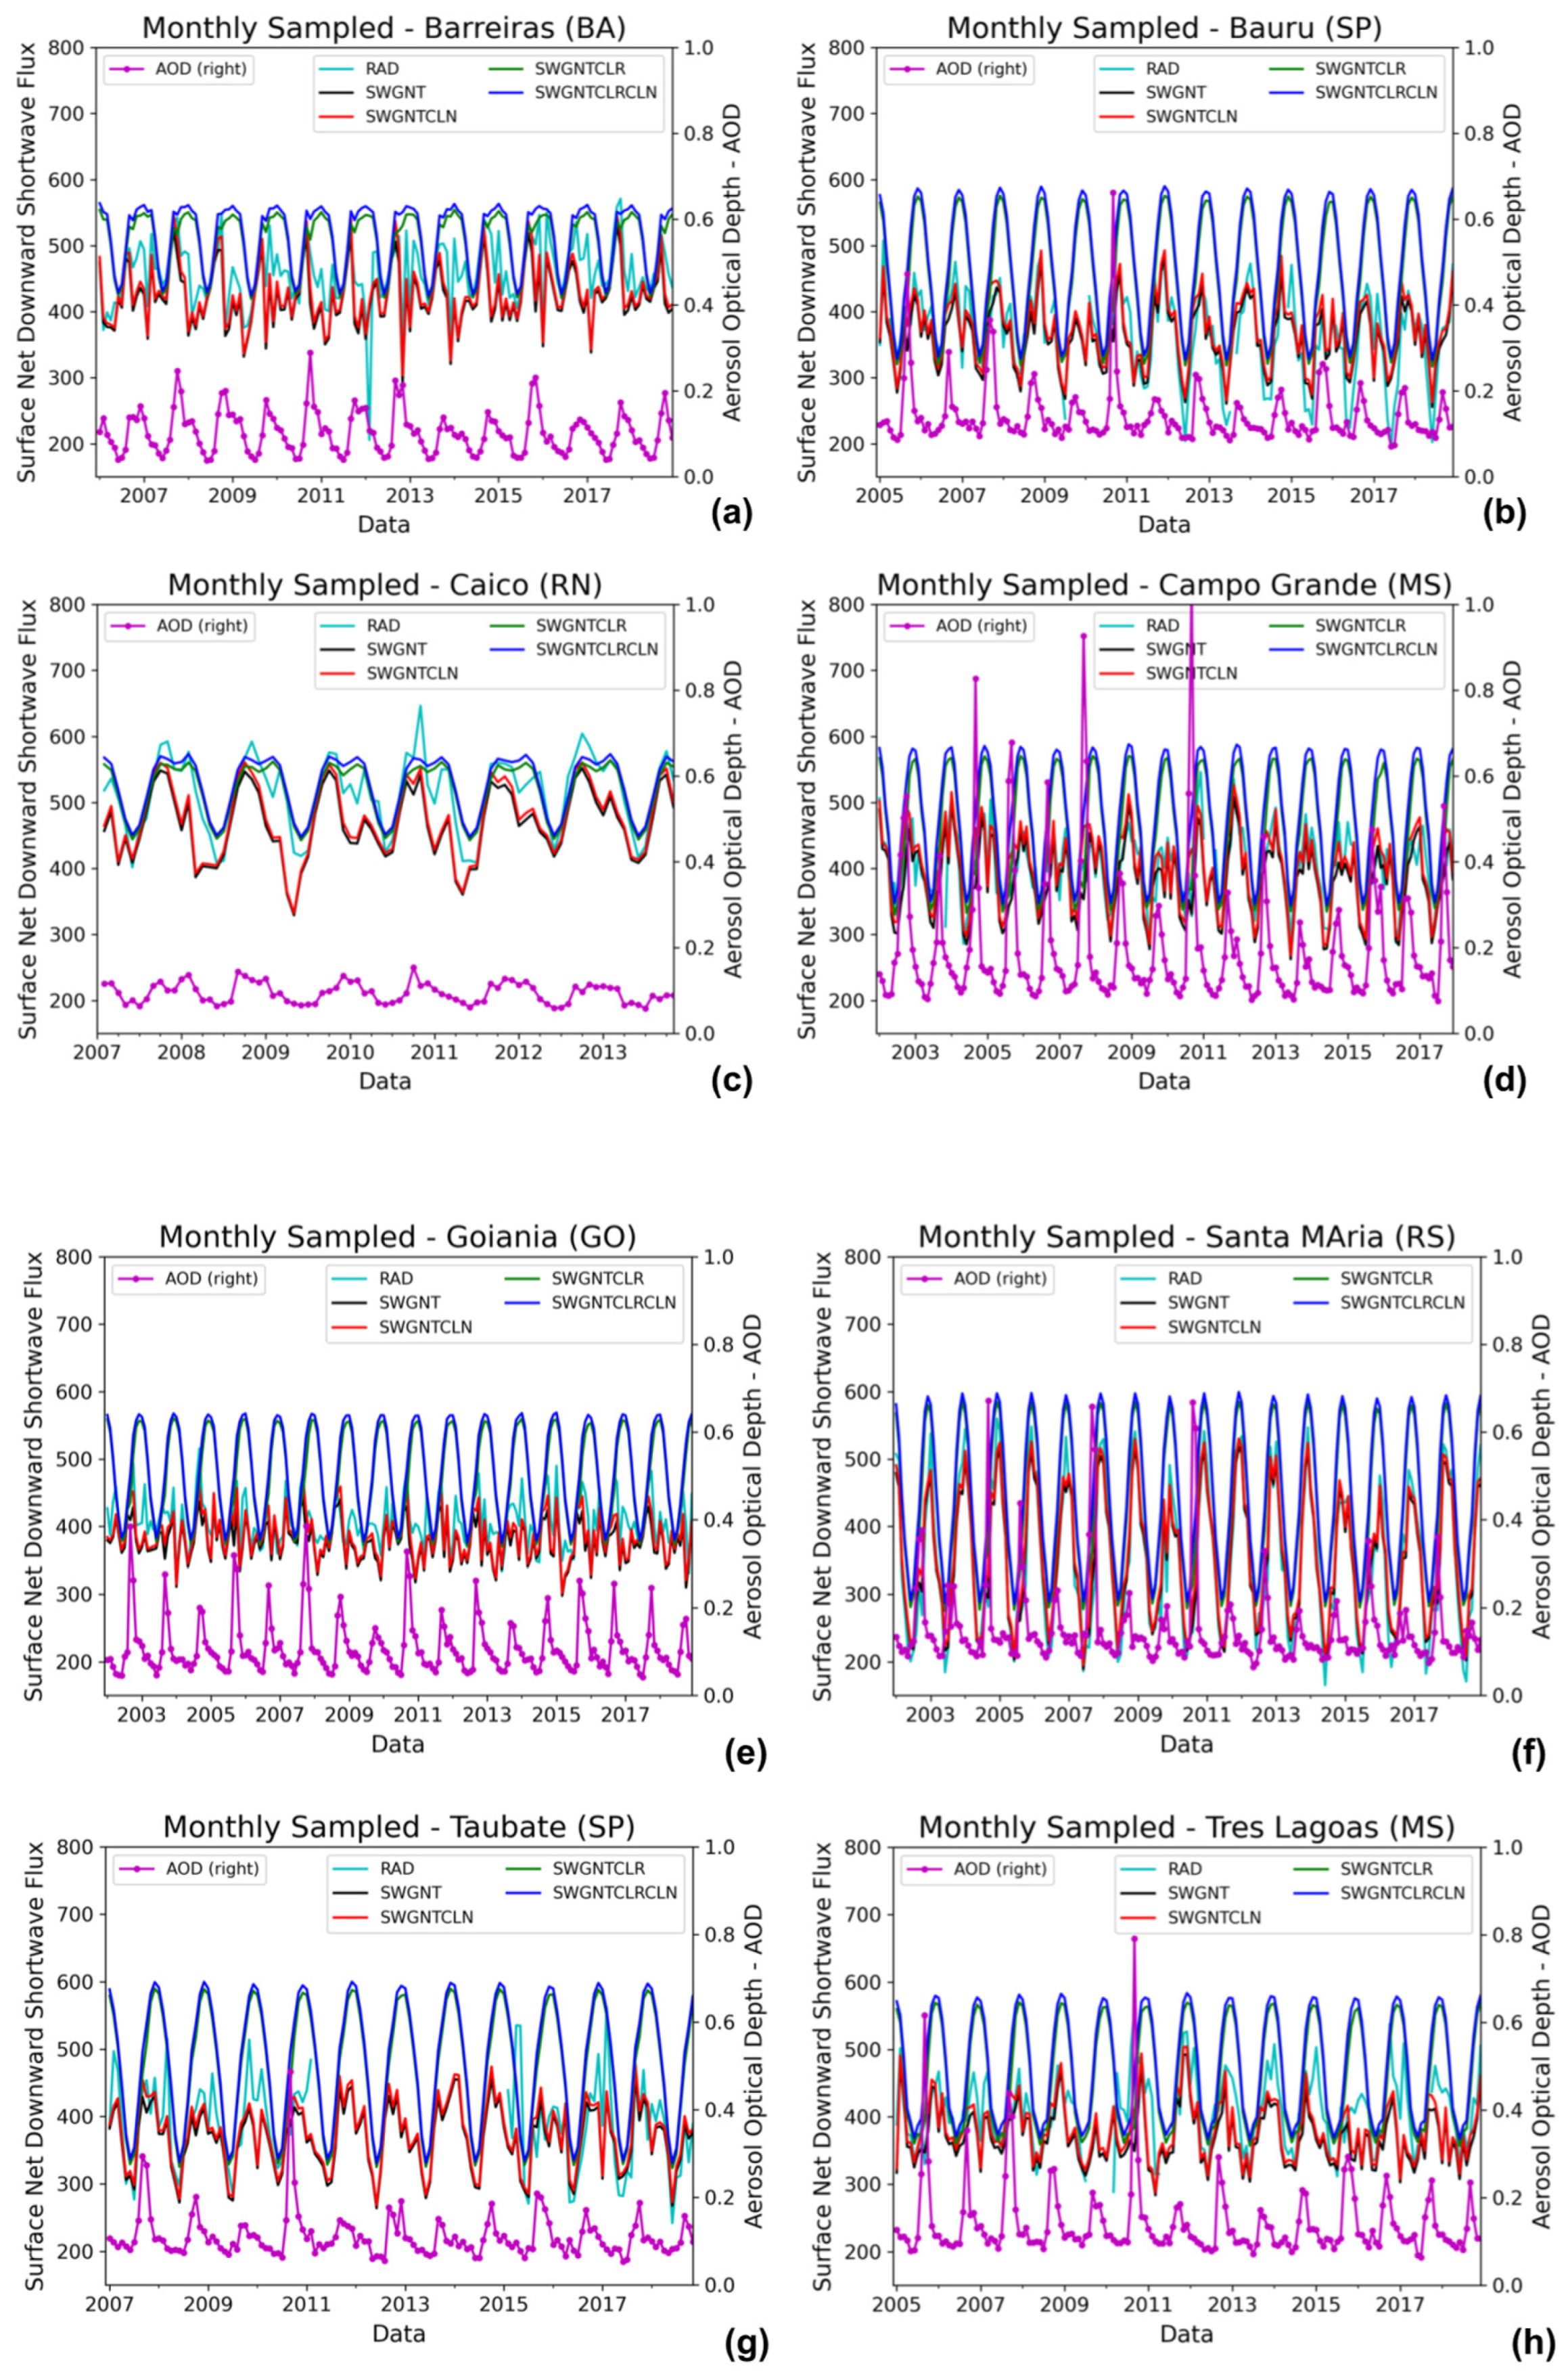
3.3. Monthly Sampled

Figure 6 presents the time series of observed solar irradiation data and the MERRA-2 reanalysis data, the four components of incoming downward solar irradiation, and AOD for the eight stations shown in Figure 1.
The first analysis that grabs attention is the AOD values, which are very pronounced at the stations of Campo Grande (Figure 6d), Santa Maria (Figure 6f), Três Lagoas (Figure 6h), and Bauru (Figure 6b), with special attention to the year 2010, which was a very dry year and with high rates of fires in the Amazon region [27], influencing several regions of South America. The highest peaks of maximum AOD occurred in 2004, 2007, and 2010. The years in which the drop in solar irradiation was observed during this period are evident and associated with the maximum AOD peak that occurred in September in the three locations. On the other end, AOD data can be seen with very low values in Caicó (Figure 6c) and Barreiras (Figure 6a), generally below 0.2, regions that were not affected by the high observed values of pollution in 2010 in other locations. Making clear the lack of influence of aerosols in these two locations.
A more detailed analysis shows that similar to the analyses of the diurnal and monthly cycle, the Caicó station (Figure 6c) is very well represented by the solar irradiance of the MERRA-2 reanalysis that considers clear skies (SWGNTCLR), and the effects of aerosols are secondary. During the months of June to September, there is an agreement in the model variables that considers cloudiness and does not consider it (clear sky), which is well represented when the observed values of solar irradiance are considered. A similar situation can be observed in the Barreiras region (Figure 6a).
The highest amplitude between the maximum and minimum solar irradiance is observed at the Santa Maria station (Figure 6f), with peaks that reach more than 500 W/m2 in summer and close to 200 W/m2 in winter due to the influence of cloudiness and values of minimum solar irradiance. One of the locations with the lowest amplitude is Caicó (Figure 6c), with maximums around 600 W/m2 and minimums above 400 W/m2. Solar irradiance values are generally well represented by the component considering the effects of cloudiness and aerosols, with some exceptions.

3.4. Taylor Plot

Figure 7 presents the results for the eight stations, presented in Figure 1, considering the Taylor Diagram, which summarizes the standard deviation and correlation coefficient values according to the reference values, which are the observed data of INMET stations.
The results obtained using the Taylor Plot (Figure 7) summarize the good performance of the MERRA-2 reanalysis in comparison with the observed solar irradiance data series from INMET stations. Figure 7a illustrates the results with a Taylor diagram, showing that the highest correlation and lowest standard deviation occur at the Caicó station, with values close to 0.95 correlation. Here, the series that best represents the observed values is the one that considers clear sky and no aerosols, as this region has lower precipitation and cloudiness rates, along with a lower volume of aerosols. Following Caicó, the Santa Maria (Figure 7f) and Barreiras (Figure 7a) stations are also well represented by the MERRA-2 data (SWGNT and SWGNTCLN), with values of correlation over 0.9. The stations at Campo Grande, Três Lagoas, and Taubaté (Figure 7d, Figure 7h, and Figure 7g, respectively) exhibit similar standard deviation and correlation coefficient values, all above 0.8, which can be considered a high correlation. The statistical analysis of the results obtained indicates a statistically significant relationship between observed irradiance in all the stations (Table 1) and all MERRA-2 reanalysis variables, with a statistically significant correlation at the 99% confidence level based on a t-test.
The results presented in Figure 7 demonstrate the quality of the MERRA-2 reanalysis data. The best results are obtained from the variables that consider the effect of aerosols and cloudiness, except for the Caicó station, which is better represented by the variable that considers clear skies and the absence of the effect of aerosols.

4. Conclusions

The observational data from eight INMET stations from different regions of Brazil (Figure 1) were compared with estimates from MERRA-2 reanalysis data, where cloud coverage and aerosol effects were considered separately for the reanalysis data. Different behavior was observed for the eight stations, with the most notable station being Caicó, which had low precipitation and no pollution, showing estimated values closer to clear skies and without the effect of aerosol. The Campo Grande station, as well as the Três Lagoas station, showed behavior with periods of values close to expected when considering all sky as well, and a second period with behavior closer to clear sky data and a big influence from aerosol associated with the wildfires in the Amazon region (Figure 2). The station of Santa Maria, the highest latitude of all stations, shows the biggest influence of seasonality with a high amplitude between the summer and winter time, and a big influence from the Amazon fires, with the same peak of AOD as the station of Campo Grande. Like the other stations, the Taubaté station exhibited regular behavior with values close to expected, considering cloud influence and aerosol. The other stations show similar behavior to Taubate, with the best results when considering aerosol and cloud cover.
Analyzing the results using the Taylor diagram was essential for verifying the quality of the reanalysis data when compared with observed solar irradiance data. All results showed correlations greater than 0.8 and, in some cases, close to 0.93, which can be considered excellent results. The best result was for the northeast region of Brazil, where the correlations were the highest, without the influence of aerosols and less influence of cloudiness, which is in line with [4], which characterizes the northeast as the region with the greatest available solar energy potential in Brazil. The central-west region was where the greatest influences of aerosols were observed, in the locations of Campo Grande and Três Lagoas, with a similar result, but of lower intensity, in the southern region of Brazil.
The study’s objective was achieved by analyzing information that allowed the assessment and description of the temporal variability of solar irradiation in various regions of Brazil using atmospheric reanalysis data from MERRA-2. The study also demonstrated that the reanalysis incorporated the effects of aerosols in their configuration and that it is a big difference from another reanalysis. Furthermore, the study validation was successfully conducted using observed surface irradiation data. Therefore, some differences in observed solar irradiation compared to reanalysis data are generally caused by the models’ inability to represent the fraction of atmospheric clouds and aerosols. Still, they can generally be used with good agreement in all regions, especially in regions with no observational data.

Author Contributions

Conceptualization, B.R.H., C.E.L.d.O. and E.P.V.; methodology, B.R.H., E.P.V. and D.L.H.; software, B.R.H., E.P.V. and M.F.L.d.Q.; validation, B.R.H. and E.P.V.; formal analysis, B.R.H.; investigation, B.R.H.; resources, B.R.H.; writing—original draft preparation, B.R.H., D.L.H. and E.P.V.; writing—review and editing, B.R.H., E.P.V., M.F.L.d.Q., C.E.L.d.O. and D.L.H.; visualization, B.R.H.; supervision, E.P.V., C.E.L.d.O. and D.L.H.; project administration, B.R.H. and E.P.V. All authors have read and agreed to the published version of the manuscript.

Funding

The Brazilian research agencies Coordination for the Improvement of Higher Education Personnel (CAPES) Finance Code 001 and National Council for Scientific and Technological Development (CNPq) provided funding.

Data Availability Statement

The data presented in this study are available in the article.

Acknowledgments

This research was facilitated by infrastructure support from the National Institute for Space Research (INPE), Cachoeira Paulista, SP 12630, Brazil, and the Faculty of Animal Science and Food Engineering (FZEA), University of São Paulo (USP), Pirassununga, SP 13630, Brazil.

Conflicts of Interest

The authors declare no conflicts of interest.

References

  1. Martins, F.R.; Pereira, E.B.; Abreu, S.L. Satellite-derived solar resource maps for Brazil under SWERA Project. Sol. Energy 2007, 81, 517–528. [Google Scholar] [CrossRef]
  2. Viana, T.S.; Rüther, R.; Martins, F.R.; Pereira, E.B. Assessing the potential of concentrating solar photovoltaic generation in Brazil with satellite-derived direct normal irradiation. Sol. Energy 2011, 85, 486–495. [Google Scholar] [CrossRef]
  3. Tiba, C. Atlas Solarimétrico do Brasil; UFPE: Recife, Brazil, 2000; 111p. [Google Scholar]
  4. Pereira, E.B.; Martins, F.R.; Gonçalves, A.R.; Costa, R.S.; Lima, F.J.L.; Ruther, R.; Abreu, S.L.; Tiepolo, G.M.; Pereira, S.V.; Souza, J.G. Atlas Brasileiro de Energia Solar, 2nd ed.; INPE, Ed.; Instituto Nacional de Pesquisas Espaciais: São Jose dos Campos, Brazil, 2017. [Google Scholar]
  5. Pereira, E.B.; Abreu, S.L.; Stuhlmann, R.R.; Colle, S. Survey of The Incident Solar Radiation in Brazil by use of Meteosat Satellite Data. Sol. Energy 1996, 57, 125–132. [Google Scholar] [CrossRef]
  6. Lima, F.J.L.; Martins, F.R.; Costa, R.S.; Gonçalves, A.R.; Souza, J.G.; Pereira, S.V.; Luiz, E.W.; Pes, M.P.; Pereira, E.B. Intercomparação de modelos numéricos para estimativa da irradiação solar em parte do Nordeste brasileiro. Rev. Bras. Energ. Sol. 2018, 9, 79–88. (In Portuguese) [Google Scholar]
  7. Bellouin, N.; Yu, H. Aerosol–Radiation Interactions. In Aerosols and Climate; Carslaw, K.S., Ed.; Elsevier: Oxford, UK, 2022; pp. 445–487. ISBN 9780128197660. [Google Scholar]
  8. Albrecht, B.A. Aerosols, Cloud Microphysics, and Fractional Cloudiness. Science 1989, 245, 1227–1230. [Google Scholar] [CrossRef]
  9. Liu, S.; Chen, M.; Zhuang, Q. Aerosol effects on global land surface energy fluxes during 2003–2010. Geophys. Res. Lett. 2014, 41, 7875–7881. [Google Scholar] [CrossRef]
  10. Costa, R.S.; Martins, F.R.; Pereira, E.B. Atmospheric aerosol influence on the Brazilian solar energy assessment: Experiments with different horizontal visibility bases in radiative transfer model. Renew. Energy 2016, 90, 120–135. [Google Scholar] [CrossRef]
  11. Casagrande, M.S.G.; Martins, F.R.; Rosário, N.E.; Lima, F.J.L.; Gonçalves, A.R.; Costa, R.S.; Zarzur, M.; Pes, M.P.; Pereira, E.B. Numerical Assessment of Downward Incoming Solar Irradiance in Smoke Influenced Regions—A Case Study in Brazilian Amazon and Cerrado. Remote Sens. 2021, 13, 4527. [Google Scholar] [CrossRef]
  12. Feng, F.; Wang, K.C. Merging satellite retrievals and reanalyses to produce global long-term and consistent surface incident solar radiation datasets. Remote Sens. 2018, 10, 115. [Google Scholar] [CrossRef]
  13. Gelaro, R.; McCarty, W.; Suárez, M.J.; Todling, R.; Molod, A.; Takacs, L.; Randles, C.A.; Darmenov, A.; Bosilovich, M.G.; Reichle, R.; et al. The Modern-Era Retrospective Analysis for Research and Applications, Version 2 (MERRA-2). J. Clim. 2017, 30, 5419–5454. [Google Scholar] [CrossRef]
  14. Boilley, A.; Wald, L. Comparison between meteorological re-analyses from ERA-Interim and MERRA and measurements of daily solar irradiation at surface. Renew. Energy 2015, 75 (Suppl. C), 135–143. [Google Scholar] [CrossRef]
  15. Sianturi, Y.; Marjuki, M.; Sartika, K. Evaluation of ERA5 and MERRA2 reanalyses to estimate solar irradiance using ground observations over Indonesia region. AIP Conf. Proc. 2020, 2223, 020002. [Google Scholar] [CrossRef]
  16. Silveira, C.R.; Luiz, G.C.; Barbosa, G.A.S.; Sousa, L.G.C. Aerosol Influence on Photovoltaic Solar Energy Generation for the State of Goiás (Brazil). Int. Arch. Photogramm. Remote Sens. Spat. Inf. Sci. 2020, 42, 413–418. [Google Scholar] [CrossRef]
  17. INMET. Instituto Nacional de Meteorologia (INMET). Normais Climatológicas do Brasil de 1991–2020. Disponível em. 2024. Available online: https://clima.inmet.gov.br/NormaisClimatologicas (accessed on 1 February 2024). (In Portuguese)
  18. Global Modeling and Data Assimilation Office (GMAO) (2015), inst3_3d_asm_Cp: MERRA-2 3D IAI State, Meteorology Instantaneous 3-Hourly (p = coord, 0.625x0.5L42), Version 5.12.4; Goddard Space Flight Center Distributed Archive Center (GSFC DAAC): Greenbelt, MD, USA, 2023. [CrossRef]
  19. Wilks, D.S. Statistical Methods in the Atmospheric Sciences; Elsevier: Amsterdam, The Netherlands, 2019; p. 840. [Google Scholar]
  20. Taylor, K.E. Summarizing multiple aspects of model performance in a single diagram. J. Geophys. Res. Atmos. 2001, 106, 7183–7192. [Google Scholar] [CrossRef]
  21. Farghali, M.; Osman, A.I.; Chen, Z.; Abdelhaleem, A.; Ihara, I.; Mohamed, I.M.A.; Yap, P.-S.; Rooney, D.W. Social, environmental, and economic consequences of integrating renewable energies in the electricity sector: A review. Environ. Chem. Lett. 2023, 21, 1381–1418. [Google Scholar] [CrossRef]
  22. Jaiswal, K.K.; Chowdhury, C.R.; Yadav, D.; Verma, R.; Dutta, S.; Jaiswal, K.S.; Sangmesh, B.; Karuppasamy, K.S.K. Renewable and sustainable clean energy development and impact on social, economic, and environmental health. Energy Nexus 2022, 7, 100118. [Google Scholar] [CrossRef]
  23. Vara Vela, A.L.; Herdies, D.L.; Alvim, D.S.; Vendrasco, E.P.; Figueroa, S.N.; Pendharkar, J.; Fernandez, J.P.R. A new predictive framework for Amazon forest fire smoke dispersion over South America. Bull. Am. Meteorol. Soc. 2021, 21, E1700–E1713. [Google Scholar] [CrossRef]
  24. Herdies, D.L.; Kousky, V.; Ebisuzaki, W. The Impact of High-resolution SALLJEX Data on a Global NCEP Analysis. J. Clim. 2007, 20, 5765–5783. [Google Scholar] [CrossRef]
  25. Rosario, N.E.; Sena, E.T.; Yamasoe, M.A. South American 2020 regional smoke plume: Intercomparison with previous years, impact on solar radiation, and the role of Pantanal biomass burning season. Atmos. Chem. Phys. V 2022, 22, 15021–15033. [Google Scholar] [CrossRef]
  26. Alves, N.d.O.; Vessoni, A.T.; Quinet, A.; Fortunato, R.S.; Kajitani, G.S.; Peixoto, M.S.; Hacon, S.d.S.; Artaxo, P.; Saldiva, P.; Menck, C.F.M.; et al. Biomass burning in the Amazon region causes DNA damage and cell death in human lung cells. Sci. Rep. 2017, 7, 10937. [Google Scholar] [CrossRef]
  27. Marengo, J.A.; Tomasella, J.; Alves, L.M.; Soares, W.R.; Rodriguez, D.A. The drought of 2010 in the context of historical droughts in the Amazon region. Geophys. Res. Lett. 2011, 38, L12703. [Google Scholar] [CrossRef]
Figure 1. Location of the INMET stations used in this study. Stations include Caicó, Campo Grande, Três Lagoas, Taubaté, Bauru, Santa Maria, Barreiras, and Goiânia.
Atmosphere 16 00124 g001
Figure 2. Components of Solar Irradiance.
Atmosphere 16 00124 g002
Figure 3. The average daily pattern of solar irradiance (RAD) over the stations (light green line), respectively. The solar irradiance estimates from the MERRA-2 reanalysis SWGNT (black line), SWGNTCLN (red line), SWGNTCLR (dark green), SWGNTCLRCLN (blue line) and Aerosol Optical Depth-AOD (pink line); (a) Barreiras station; (b) Bauru station; (c) Caicó station; (d) Campo Grande station; (e) Goiânia station; (f) Santa Maria station; (g) Taubaté station; (h) Três Lagoas station. Units are in W/m2.
Atmosphere 16 00124 g003
Figure 4. The monthly average pattern of solar irradiance (RAD) over the stations (light green line), respectively. The solar irradiance estimates from the MERRA-2 reanalysis SWGNT (black line), SWGNTCLN (red line), SWGNTCLR (dark green), SWGNTCLRCLN (blue line) and Aerosol Optical Depth-AOD (pink line); (a) Barreiras station; (b) Bauru station; (c) Caicó station; (d) Campo Grande station; (e) Goiânia station; (f) Santa Maria station; (g) Taubaté station; (h) Três Lagoas station. Units are in W/m2.
Atmosphere 16 00124 g004
Figure 5. Aerosol Optical Depth (AOD) for September 2019 and 2020, Aqua and Terra. https://giovanni.gsfc.nasa.gov/giovanni/, accessed on 3 June 2024).
Atmosphere 16 00124 g005
Figure 6. The monthly sample of solar irradiance (RAD) over the stations (light green line), respectively. The solar irradiance estimates from the MERRA-2 reanalysis SWGNT (black line), SWGNTCLN (red line), SWGNTCLR (dark green), SWGNTCLRCLN (blue line) and Aerosol Optical Depth-AOD (pink line); (a) Barreiras station; (b) Bauru station; (c) Caicó station; (d) Campo Grande station; (e) Goiânia station; (f) Santa Maria station; (g) Taubaté station; (h) Três Lagoas station. Units are in W/m2.
Atmosphere 16 00124 g006
Figure 7. Taylor diagrams for the annual mean correlation and standard deviation of the stations: (a) Barreiras station; (b) Bauru station; (c) Caicó station; (d) Campo Grande station; (e) Goiânia station; (f) Santa Maria station; (g) Taubaté station; (h) Três Lagoas station; using observed solar irradiation as a reference.
Atmosphere 16 00124 g007
Table 1. Information of INMET surface stations with hourly solar irradiation data.
StationsLatitudeLongitudeLevelPeriod of Data
Barreiras, BA−12.13°−45.03°474 mJan. 2002 to Dec. 2018
Bauru, SP−22.36°−49.03°636 mJan. 2002 to Dec. 2018
Caicó, RN−6.47°−37.09°171.3 mJan. 2007 to Dec. 2019
Campo Grande, MS−20.45°−54.72°528.5 mOct. 2001 to Dec. 2019
Goiânia, GO−16.64°−49.22°727 mJan. 2002 to Dec. 2018
Santa Maria, RS−29.72°−53.72°103 mJan. 2002 to Dec. 2018
Taubaté, SP−23.04°−45.52°582.3 mDec. 2006 to Dec. 2019
Três Lagoas, MS−20.79°−51.72°329 mJan. 2002 to Dec. 2018
Disclaimer/Publisher’s Note: The statements, opinions and data contained in all publications are solely those of the individual author(s) and contributor(s) and not of MDPI and/or the editor(s). MDPI and/or the editor(s) disclaim responsibility for any injury to people or property resulting from any ideas, methods, instructions or products referred to in the content.

