Article

Effect of Synchronization Between Millihertz Geomagnetic Field Variations and Human Heart Rate Oscillations During Strong Magnetic Storms

by
Tatiana A. Zenchenko
1,2,*,
Natalia I. Khorseva
3,
Tamara K. Breus
2,
Andrey V. Drozdov
4 and
Olga Y. Seraya
1
1
Institute of Theoretical and Experimental Biophysics of Russian Academy of Sciences, 142290 Pushchino, Moscow Region, Russia
2
Space Research Institute, Russian Academy of Sciences, 117997 Moscow, Russia
3
Emanuel Institute of Biochemical Physics, Russian Academy of Sciences, 119334 Moscow, Russia
4
Institute for Analytical Instrumentation of RAS, 198095 St. Petersburg, Russia
*
Author to whom correspondence should be addressed.
Atmosphere 2025, 16(2), 219; https://doi.org/10.3390/atmos16020219
Submission received: 23 January 2025 / Revised: 10 February 2025 / Accepted: 13 February 2025 / Published: 15 February 2025

Abstract

:
Protecting people with various diseases from the adverse effects of space weather factors requires an understanding of their effects on healthy people who participate in heliobiological research as a ‘control group’. This study aimed to investigate the effect of human heart-rate synchronization with variations in the geomagnetic field of the ULF frequency range (1–5 mHz) (“biogeosynchronization effect”). We analyzed 61 electrocardiogram recordings of 100 min that were obtained on 24–27 September 2023, 10–13 May 2024 and 10–13 October 2024 from two female volunteers in good health. The biogeosynchronization effect was observed in 69% of cases. The probability of its occurrence correlates with the Dst index (correlation coefficient Rs = 0.313, p = 0.014); there is no correlation with the amplitude of the ULF oscillations. It has been shown that biogeosynchronization is mainly manifested during the recovery phase of magnetic storms, provided that at this time, the geomagnetic ULF oscillations are in phase at large distances along the observation meridian (Rs = 0.531, p < 0.00001). These results confirm that geomagnetic variations in the ULF range serve as a rhythm sensor for a healthy body under normal conditions. Being a “case study”, our results require further verification on large volumes of data in different geomagnetic conditions.

1. Introduction

Space weather phenomena are an important environmental factor affecting living organisms. The most relevant manifestation of their effects is an increase in the number of various diseases and even cases of sudden death during extreme space weather events (planetary magnetic storms (MS), increased intensity of ultraviolet flux or neutron component of cosmic galactic rays, etc.) [1,2,3,4,5,6,7,8,9,10,11,12].
On the one hand, such extreme space weather events increase the risk of an exacerbation of chronic diseases, manifested in an increase in the number of calls to emergency services [4,5,12,13]. On the other hand, when such events occur during the recovery of patients after exacerbations of diseases or operations, they can significantly complicate the dynamics of recovery [14,15,16,17,18].
The effect of this group of external factors is also manifested in an unfavorable mass change in the values of various physiological indices of the body. The largest amount of such evidence concerns the cardiovascular system indicators: blood pressure [19,20]; heart rate (HR) [4,21,22,23]; and heart rate variability (HRV) [4,24,25,26,27].
Clinical cosmobiology is a field of research that studies the various medical manifestations of the effects of space weather factors [28,29]; the investigation of their time-spectral features on various time scales is called chronobiology [4,30].
However, a more detailed analysis of the resulting phenomenological picture of the effects of space weather factors on humans reveals a number of aspects that are currently well confirmed but have no explanation.
If we denote changes in medical and biological indices during MS compared to geomagnetically quiet conditions by the term “biotropy”, we can say that even MS that are similar in origin and in their main parameters have different biotropies. For example, at the population level, a significant increase in the exacerbation of various diseases is observed not only during MS, but also during periods when Kp-index values are close to zero (periods of “magnetic silence”) [5,28,31,32,33]; observation statistics show that a relatively moderate MS with a maximum Kp = 6–7 leads to an even greater increase in morbidity than the strongest MS [34]; there is a pronounced dependence of the degree of MS biotropy on the season [7,10,15,35] and on the current values of meteorological factors [15,36,37,38].
Thus, the dependence of medical morbidity statistics on the level of geomagnetic activity (GMA) has been observed by many researchers. However, this dependence is not monotonous and depends on many additional factors, both external (exogenous) and internal (endogenous). The system of solar–biosphere connections is thus extremely multi-parametric. As a result, current attempts to construct a self-consistent, detailed phenomenological picture of solar–biosphere connections are still inconclusive, despite a very large, accumulated body of evidence on the biotropic effects of space weather factors.
However, such a phenomenological picture is necessary, because it provides experts with the ability to assess the applicability of population conclusions of clinical cosmobiology to each specific patient.
Exogenous (geophysical) factors influencing the biotropic characteristics of space weather extremes include the seasons mentioned above and the current state of the Earth’s weather (atmospheric pressure and temperature). The phase of the solar activity cycle [4,39], the average level of geomagnetic disturbance [40], and the phase of the daily geomagnetic variation [41,42] have been shown to be equally important. Almost certainly, other, similar factors exist that are currently unidentified.
“A significant difficulty of biogeomagnetics is to determine those characteristics of solar and geomagnetic activity with the greatest effect on human health” [22]. This issue remains the subject of scientific debate. Not only are GMA considered as possible acting factors; ultraviolet radiation [8,11] and the Forbush effect decrease [2] and sharp increases in the intensity of the secondary component of neutron radiation caused by galactic cosmic rays have been observed [29]. It is important to consider which of the numerical characteristics of these physical factors are best suited to describe and assess their ecological role.
The internal (endogenous) factors significantly affecting the magnitude of the heliobiological effect include a person’s anamnestic data, including, as follows: age and gender [5,7,15]; emotional state [43,44]; and the general level of adaptation of the autonomic nervous system [45]. We believe that this list is not exhaustive.
Another difficulty is that many heliobiological studies compare the possible reactions of patients with various diseases with those of a group of ‘practically healthy people’, assuming that the latter are unaffected by space weather factors. However, it is already known that this last statement is incorrect. Healthy people do respond to space weather [19,21,24,25,43,45,46,47]; these responses are highly individual and can vary greatly in amplitude, time lag, and even in terms of response signs [40,45,48]. Furthermore, individual responsiveness can vary depending on the state of the environment [40] and the individual’s current functional state [45].
Taken together, these facts suggest that the responsiveness of the human body to variations in space weather factors (as well as to variations in atmospheric factors) is an evolutionarily determined property that, in particular, performs the functions of a rhythm sensor [49]. MS and other extreme space weather phenomena disrupt the interaction between biological and geophysical rhythms [4,46]. For a significant number of people with disruptions in various systems, this leads to an exacerbation of disease, deterioration of health and, in some cases, sudden death.
The development of a system of preventive measures and protection of patients with various health problems from the adverse effects of such extreme space weather phenomena is an important medical and ecological task of modern clinical cosmobiology. The study of the characteristics of healthy human reactions to space weather factors is one of the basic aspects of solving this problem.
The severe MS that occurred in May and October 2024 led us to the idea of identifying possible key features of MS that determine their biotropism in relation to healthy humans. This problem could be solved by assessing the degree of synchronization between human HR and geomagnetic field (GMF) variations [50].
Heart rate and heart rate variability are among the most popular classes of physiological parameters for the study of the biological effects of space weather. This is due to a combination of several reasons. First, different HRV parameters reflect characteristics of the cardiovascular and autonomic nervous systems that are important for the well-being of the body. Second, HRV parameters are sensitive to space weather. Finally, there are cheap, non-invasive methods to measure HRV parameters, which opens up the possibility of obtaining large arrays of biomedical observations.
There are two generally accepted standard protocols for measuring HRV [51]: long-term 24 h Holter monitoring, measured on an outpatient basis, and short-term (5 min) monitoring that measures HRV parameters at rest.
The entire spectrum of heartbeat variations is divided into the following four frequency bands: high frequency (HF, 0.15–0.4 Hz); low frequency (LF, 0.04–0.15 Hz); very-low frequency (VLF, 0.0033–0.04 Hz), and ultra-low frequency (ULF, <0.0033 Hz or periods >5.6 min).
According to [52,53]:
The HF (0.15 to 0.4 Hz) band reflects parasympathetic or vagal activity and is often called the respiratory band because it corresponds to HR changes associated with the respiratory cycle. The LF (0.04 to 0.15 Hz) band is called the “baroreceptor band” or “mid-frequency band” because it primarily reflects baroreceptor activity at rest.
The VLF band (0.0033–0.04 Hz or 25–300 s) is less well understood than the first two bands. Long-term regulatory mechanisms and ANS activity associated with thermoregulation, the renin-angiotensin system and other hormonal factors may contribute to this band. There is also evidence that the VLF rhythm is an intracardiac rhythm generated by the heart itself and is fundamental to health and well-being [52].
In the frequency band of 0.003 to 0.02 Hz of the VLF range, synchronization of many of the body’s own oscillatory processes is observed in for example, the coincidence of the integral maxima of the spectral power of the heart rate and in the parameters of gas exchange and ventilation [54]. A significant phase synchronization was also detected between forearm skin blood-flow oscillations and finger-pad tissue blood volume oscillations in the frequency band of 0.0095–0.1 Hz [55].
The ULF range falls below 0.0033 Hz (or more than 5.6 min); assessing its characteristics requires recordings much longer than the standard 5 min. However, when HRV is recorded on an ambulatory basis, as in the case of Holter monitoring, the number of noisy HRV factors is added to various physical and mental exertions, as well as to weather conditions, environmental parameters in the room, and a number of other factors [56].
An analysis of 24 h recordings showed that the ULF range also includes rhythms with significant power [52]. In particular, internal rhythms of autonomous HR modulation can be clearly observed on a scale of about 50 min, which persist in both the day and night [57]. In addition to circadian oscillations, other, very slow, regulatory processes, such as body temperature regulation, metabolism and the renin-angiotensin system, are thought to be sources of ULF power; however, the clinical significance of these rhythms is unknown [52].
In this frequency range, we observed synchronous oscillations of cortisol and free triiodothyronine levels over periods of 7–8 and 15–17 min in the blood of healthy volunteers, and over periods of 7, 13, and 25–30 min in the spectra of the level of stable metabolites of nitric oxide NOx; the rhythms of NOx level oscillations in the blood have been shown to determine the dynamics of heart rate variations to the greatest extent [58].
Changes in the spectral power of HRV ranges have long been known as a prognostic characteristic. In a group of post-infarction patients, HR variability had the strongest correlation with mortality among all measured Holter variables [59]. Low HRV has been associated with emotional dysregulation, worse cognitive performance, and transversal psychopathological conditions [60]. When the relative contribution of different HPV frequency ranges was examined in detail, the strongest associations with all-cause mortality, cardiac death, and arrhythmic death were shown by power values in the low-frequency ranges, VLF and ULF [61]. Low power in the VLF range was associated with high levels of inflammation markers in the blood of patients with coronary artery disease [62].
Similarly, the pattern of changes in HRV parameters during geomagnetic disturbances indicates a deterioration in overall health. A sharp decrease in HRV is also part of the symptom picture of magnetic storm-associated myocardial infarction [4,63,64]. Observational studies show that on the day of geomagnetic disturbance, the heart rate increases, the SDNN heart rate variability index decreases by approximately 23% compared to quiet days, and there is also a decrease in the total spectral power of the heart rate, and, primarily, in the power of the VLF and ULF components of the spectrum [4,64,65,66]. During geomagnetically quiet periods, the daily activity of the autonomic nervous system responds to changes in geomagnetic and solar activity; this connection is disrupted during moments of geomagnetic disturbances [67].
Laboratory experiments showed a significant decrease in HRV in rabbits during a magnetic storm, indicating, according to the authors, involvement of the baroreflex mechanism into the observed effect [68].
A simulated magnetic storm showed an effect on low-frequency components of HRV, which is consistent with the results of observational studies [47,69]. At the same time, the effect of artificial magnetic fields (MF) on human HRV parameters depended on the MF characteristics and could lead to both an increase and a decrease in stress levels, depending on field parameters [70]. An experiment on the effect of MF with frequencies of f1 = 1.67 mHz and f2 = 1.11 mHz on healthy volunteers at rest showed LF/HF and VLF to be the most changed HRV parameters [71]. Thus, laboratory studies confirmed the general direction of changes in HRV parameters during magnetic storms found in observational studies.
In fact, the effect of the MF variations’ impact on the parameters of the HRV appears in two different ways: in the form of a significant shift in the average value of the physiological parameters (as shown above); and, without a shift in the average, in the form of “biogeophysical synchronization”, i.e., an adjustment of the frequencies of an individual’s biological process oscillations to oscillations in the natural EMF with similar frequencies.
The synchronization effect has been observed by various researchers over a very wide range of frequencies, from microwave frequencies [72] to oscillations in cosmic rhythms with decades-long periods [4,11,73].
If the change in the average values of biological parameters (and HRV in particular) during magnetic disturbances points to the negative role of such extreme space weather phenomena, then synchronization can rather be considered as a neutral or even positive phenomenon [74]; the disappearance of the synchronization effect points to disturbances in the body’s adaptive resources [43,44,75,76].
In the hertz range, this effect was registered for processes in the human brain [77] during synchronization with the first mode of Schumann resonances (8 Hz), as well as for variations in the human HR and the range of geomagnetic Pc1 pulsations (continuous pulsations, 0.5–2 Hz) [43,44].
In the millihertz frequency range, the biogeosynchronization effect appears in the form of a similarity between the spectra of variations in synchronous time series of the GMF and HR vectors, measured for approximately 100–120 min with a frequency of one per minute [50]. The boundary parameters of the experiment enabled us to determine, with good accuracy, the spectral components of time series in the range of 4–40 min. The left part of this range (4–17 min) corresponds to the range of geomagnetic Pc5-6 pulsations [78,79,80].
Geomagnetic pulsations in the frequency range ~2–7 mHz are among the most typical oscillations in the Earth’s magnetic field. In the morning sector of the magnetosphere, they are quasi-sinusoidal Pc5 pulsations; in the evening and night sectors they are pulsed bursts of Pi3 pulsations [79].
During periods of disturbed GMA, such as during substorms and MS, giant magnetic pulsations, called Pc6 pulsations, are observed, with periods ranging from ~600–900 s. (1–1.6 mHz) [80]. Their amplitude can reach hundreds of nanotesla. Some daytime Pc5 pulsations are believed to be driven directly by solar wind pressure fluctuations [81]. In some cases, Pc5 pulsations can have a frequency and amplitude dependence on the geographic latitude of the recording site, while others can be independent of the geographic latitude of observation [79,82].
The aim of this work was to study the characteristics of the manifestation of the effect of human HR synchronization with variations in the GMF in the ULF frequency range during different the phases of three magnetic storms in 2023–2024.

2. Materials and Methods

2.1. Collection of Experimental Data

Previously, researchers discovered notable differences in the manifestation of the biogeosynchronization phenomenon among study participants [43,44,48]. To minimize potential errors resulting from individual variability, we implemented an experimental design involving two female participants, aged 54 and 64, who lived in the central latitudes of Russia. They were considered to be in good health and susceptible to GMF variations, as demonstrated by preliminary observations.
The participants were screened for cardiovascular diseases (primarily heart-rhythm disorders), diabetes, and bad health habits. Exclusion criteria included severe fatigue, stress, infectious diseases, and coffee consumption within four hours before measurement. Measurements were taken at rest in a supine position and in a state of quiet wakefulness. No conversations, sudden movements, or changes in body position were permitted during electrocardiogram (ECG) recordings.
To record and process the ECG signal, we used technical and software tools developed by Medical Computer Systems LLC. The ECG R-to-R intervals from each recording were transformed into a time sequence of HR values per minute, consisting of n =100 points each. A detailed description of the procedure for biological measurements can be found in [83].

2.2. Geomagnetic Data

Volunteer A made sixteen ECG R-to-R recordings in the Leningrad region (59°52 N/29°33 E) between 24 and 27 September 2023. At the end of 24 September, the disturbance was followed by a major MS (G2, duration = 15 h) according to the Boulder data and a moderate MS (G1, duration = 28 h) according to the IZMIRAN data. On 26 September, a minor MS (G1, duration = 12 h) was also recorded by Boulder and a 6 h substorm of G1 intensity was recorded by IZMIRAN. The source of both disturbances was the double solar filament ejection that occurred on 22 September (https://www.izmiran.ru/services/saf/archive/ru/2024/, accessed on 2 December 2024).
In the period from 10 to 14 May 2024, volunteers A and B conducted 22 ECG R-to-R recordings in the Moscow region (55°45′ N/37°36′ E). On 10 May, an interplanetary shock wave was followed by a sudden MS. On 10–12 May, extreme levels of geomagnetic disturbances were reached (G5, duration = 45 h, according to Boulder data) and (G5, duration = 48 h, according to the IZMIRAN data) due to the successive impacts of numerous coronal mass ejections (CMEs) (https://www.izmiran.ru/services/saf/archive/ru/2024/, accessed on 2 December 2024). The features of this MS in May 2024 (Dst = −403 nT) are analyzed in detail in [84].
In the period 10–13 October 2024, volunteers A and B conducted 23 ECG R-to-R recordings in the Moscow region (55°45′ N/37°36′ E). In the period 10–12 October, the CMEs from the X1.8 flare of 09.10/0156 caused a strong MS (G5, duration = 27 h, according to Boulder data) and (G5, duration = 33 h, according to IZMIRAN data). On 12 October, the combined impact of the CME and the high-speed flow from the negative high-latitude coronal hole in the northern hemisphere caused a minor MS (G1, duration = 12 h, according to Boulder data) and substorms (G0, duration = 6 h, according to IZMIRAN data) were observed (https://www.izmiran.ru/services/saf/archive/ru/2024/, accessed on 2 December 2024).
Data on one-minute values of the horizontal H-component of the GMF vector at the Troitsk (Moscow) station, Russia (MOS, 55°45′ N/37°36′ E) were obtained from the IZMIRAN website (https://forecast.izmiran.ru/, accessed on 2 December 2024). Data from the Nurmijarvi, Finland (NUR, 60°50′ N/24°60′ E) and Surlari, Romania (SUA, 44°70′ N/26°30′ E) stations were obtained from the INTERMAGNET website (International Real-time Magnetic Observatory Network, https://intermagnet.org/, accessed on 2 December 2024). Hourly values of the Dst index (https://wdc.kugi.kyoto-u.ac.jp/dst_realtime/index.html, accessed on 2 December 2024) were used to estimate the phases of the MS.

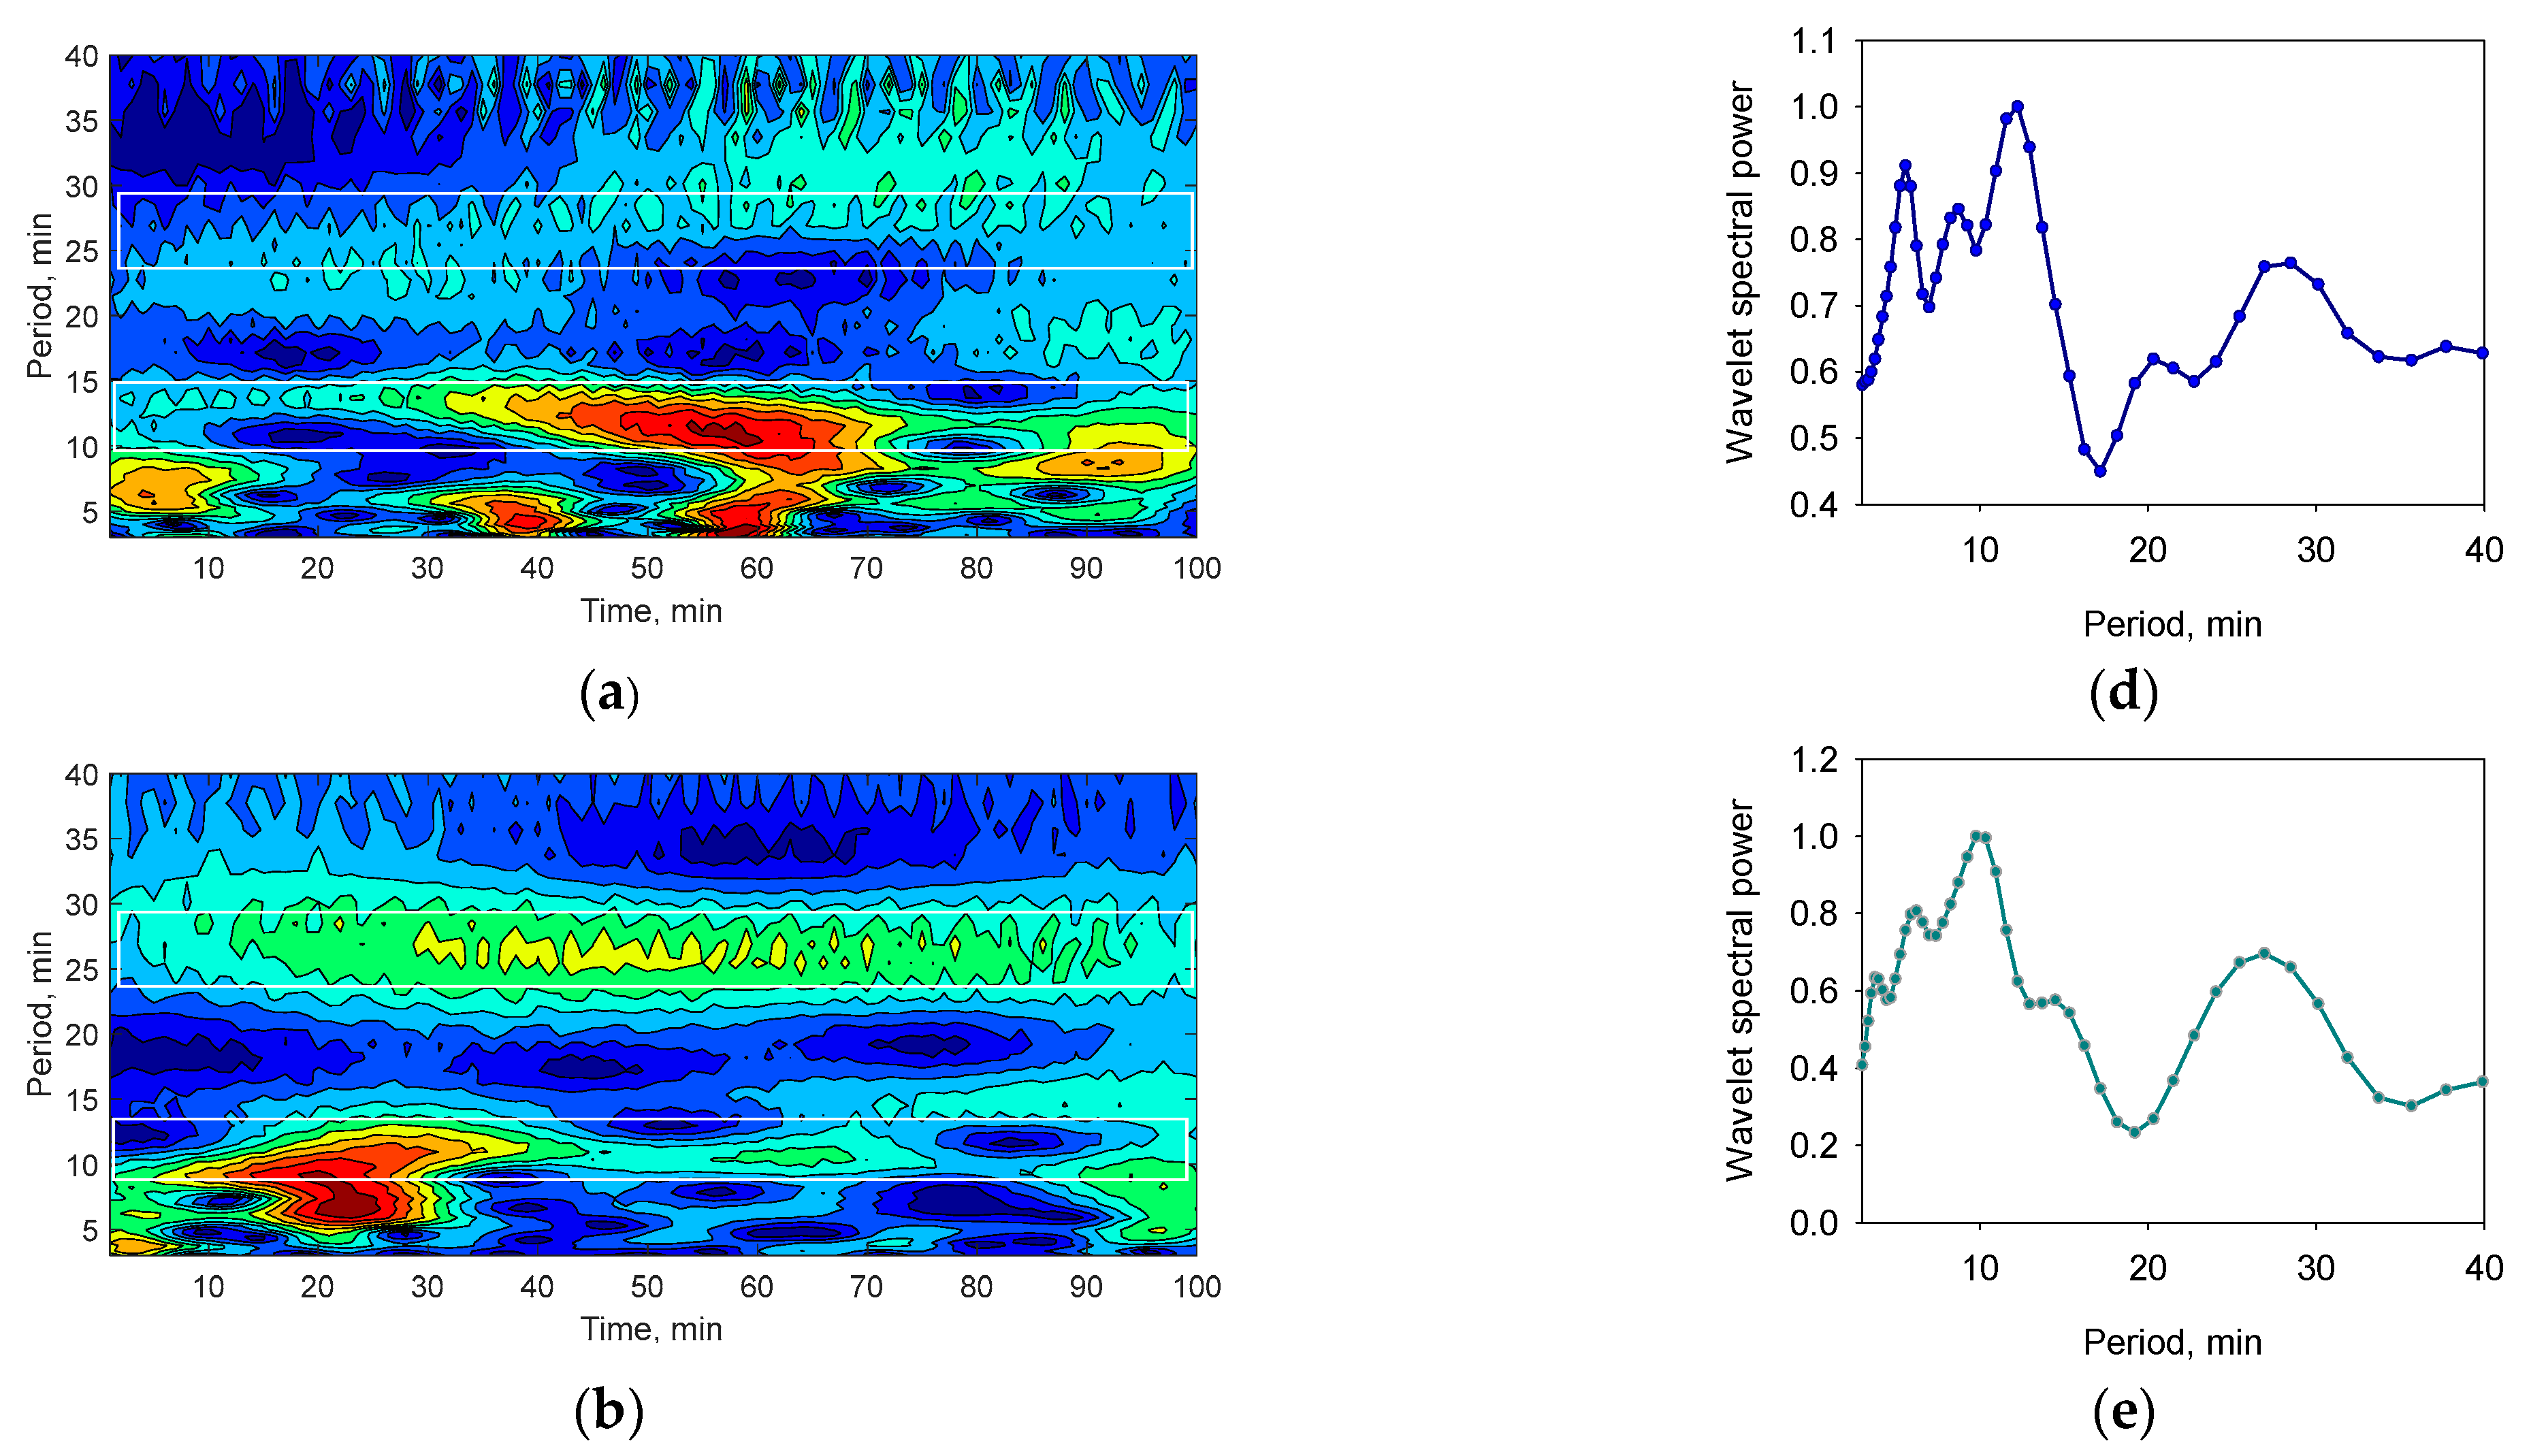
2.3. Analysis Procedure

Calculations were performed in the MATLAB R2018a software environment using built-in functions and custom applications. At the preliminary stage, trends and low-frequency fluctuations were excluded from the geophysical and biological time series, which could be due to internal reasons for each process; however, at the same time, these would have contributed to the value of the indicators of their statistical relationship. For this purpose, each 100 min segment of the series was filtered using a bandpass filter with a Blackman–Harris window and values for the lower and upper cut-off frequencies of Fl = 0.02–0.08 and Fr = 0.9995 of the Nyquist frequency, respectively. The lower limit was selected based on the requirement that the maximum amplitudes in the frequency ranges of 5–20 min and 20–40 min are comparable in magnitude.
Wavelet analysis. We used the wavelet-transform method with the basic complex Morlet function because it provides a good frequency resolution [85]. We used the built-in Matlab “cwt” function, as follows: WT = cwt(X) returns the continuous wavelet transform (cwt) of X. If X is real-valued (as is in our case), then WT is a 2-D matrix where each row corresponds to one scale.
The algorithm for calculating the scalar quantity characterizing the degree of similarity of the wavelet transform spectra included the following steps:
1.
The wavelet transformation of a 100-point segment of the HR series, within the tested periods of T = 3, …, 50 min, produces a 2-D matrix of wavelet coefficients (W(HR)s) of size i × 100, where i ranges from 1 to 50. It is worth noting that the association between i and T is monotonous but non-linear;
2.
We calculated the arithmetic mean of the values in each row i (i = 1, …, 50) of the wavelet matrix W(HR) and obtained the average values of the amplitudes of each period for 100 min of the experiment (vector [g], size 1 × 50). Then, we normalized the vector [g] to its maximum value to facilitate a comparison of their shapes. For the series of geomagnetic H-component vector, we similarly computed the matrix and vector [h];
3.
As a scalar quantity characterizing the degree of similarity/difference between the spectra of the HR and H GMF series, we calculated the values Q = (g,h)/|g|∙|h|. The Q parameter’s mathematical meaning equates to the cosine of the angle between [g] and [h] or their correlation coefficient, which has values ranging from −1 to 1. However, neighboring values of these vectors are not autonomous; hence, conventional algorithms for measuring statistical significance cannot apply to them. Therefore, we chose the limit of the Q parameter value that would indicate co-directionality between two vectors and similarity in the corresponding spectra empirically, i.e., at the Q ≥ 0.4 level.
Correlation analysis methods were also used. In the first case, Pearson’s correlation coefficient (Rp) was chosen as a measure of the similarity of two geophysical time series from different stations. Since all the time series in this study were 100 points long, the comparison of Rp values in different experiments was made simply by their value, without assessing the level of statistical significance p, which is not only unnecessary but also inapplicable in this situation.
In the second case, the Spearman rank correlation coefficient (Rs) was used to assess the statistical relationship between the values of the geophysical parameters and the Q values obtained in each of the experiments, with a confidence level of p < 0.05.

3. Results

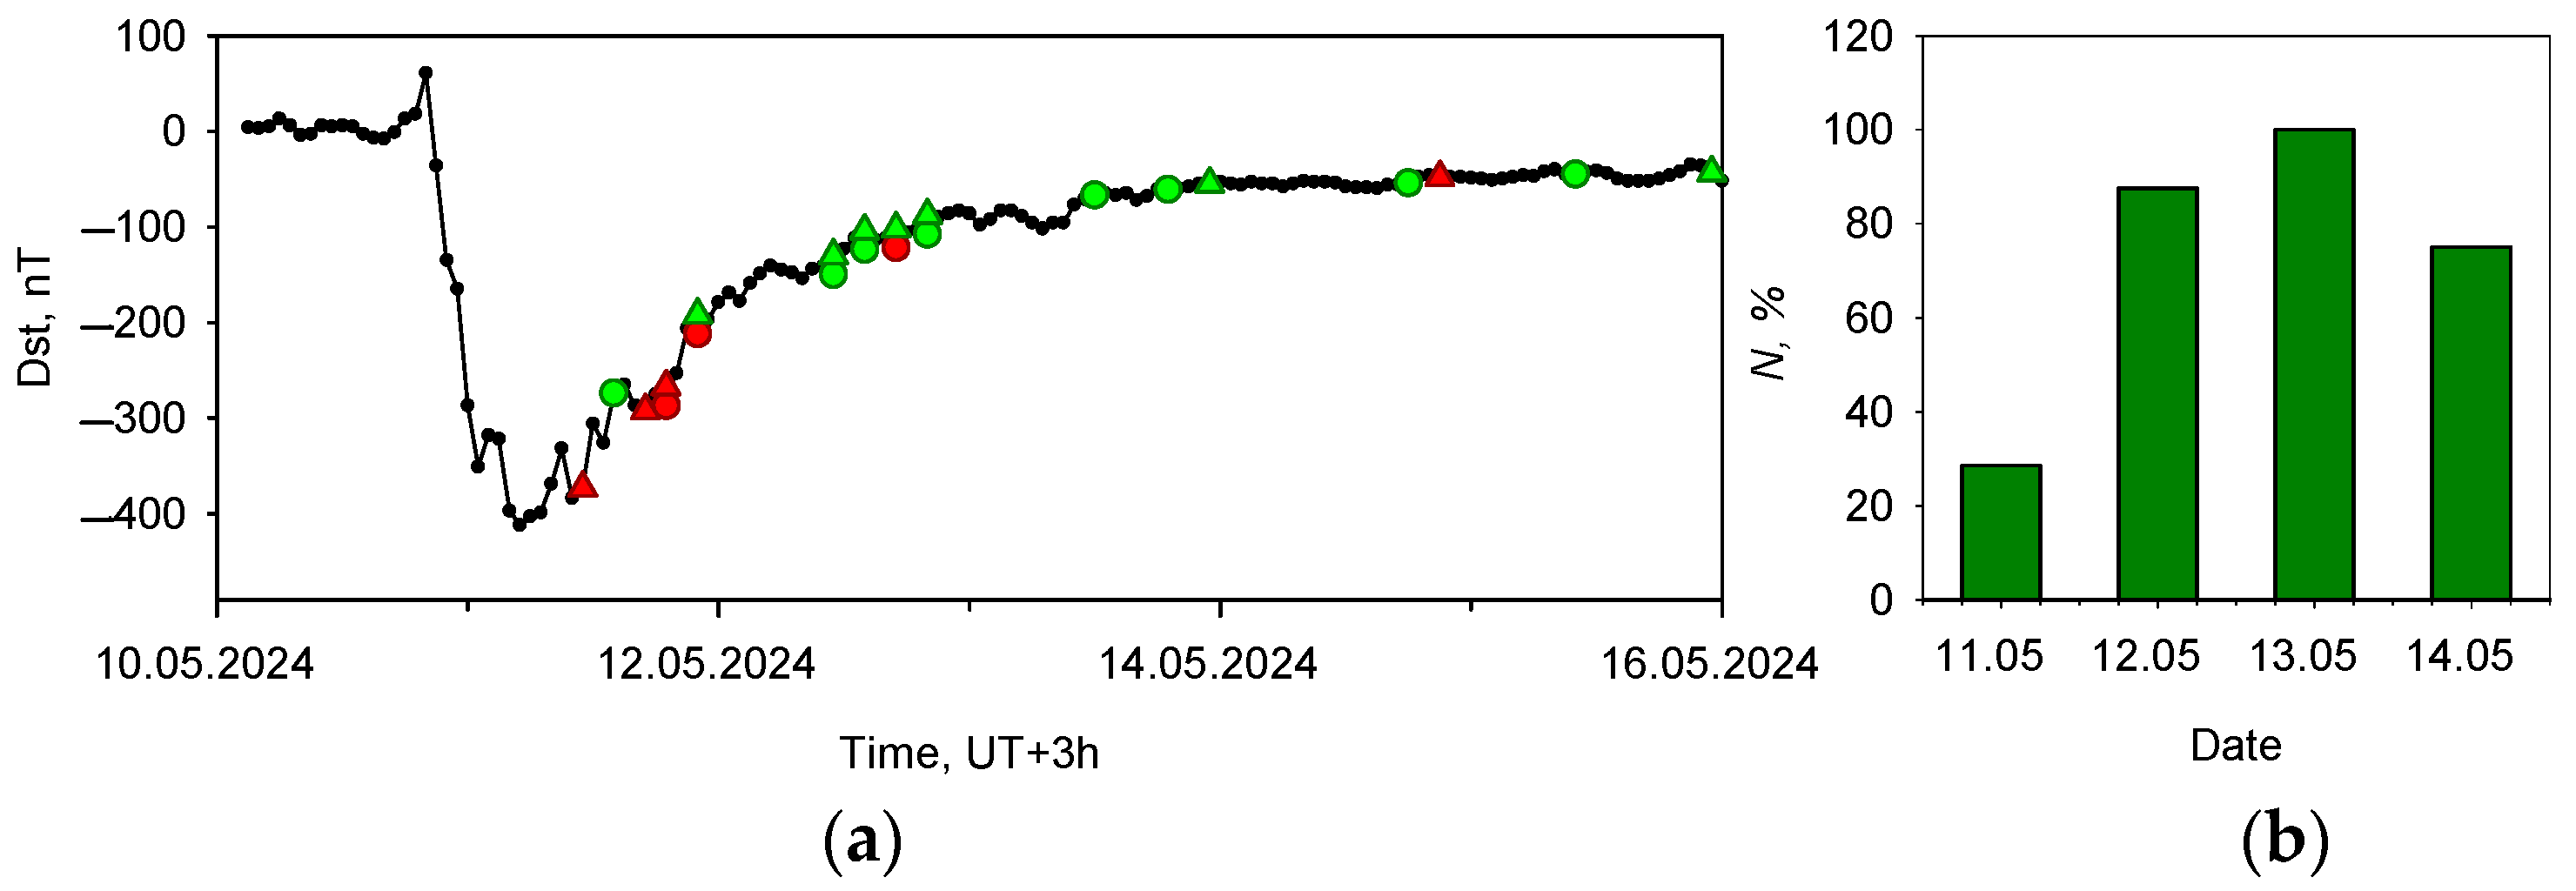
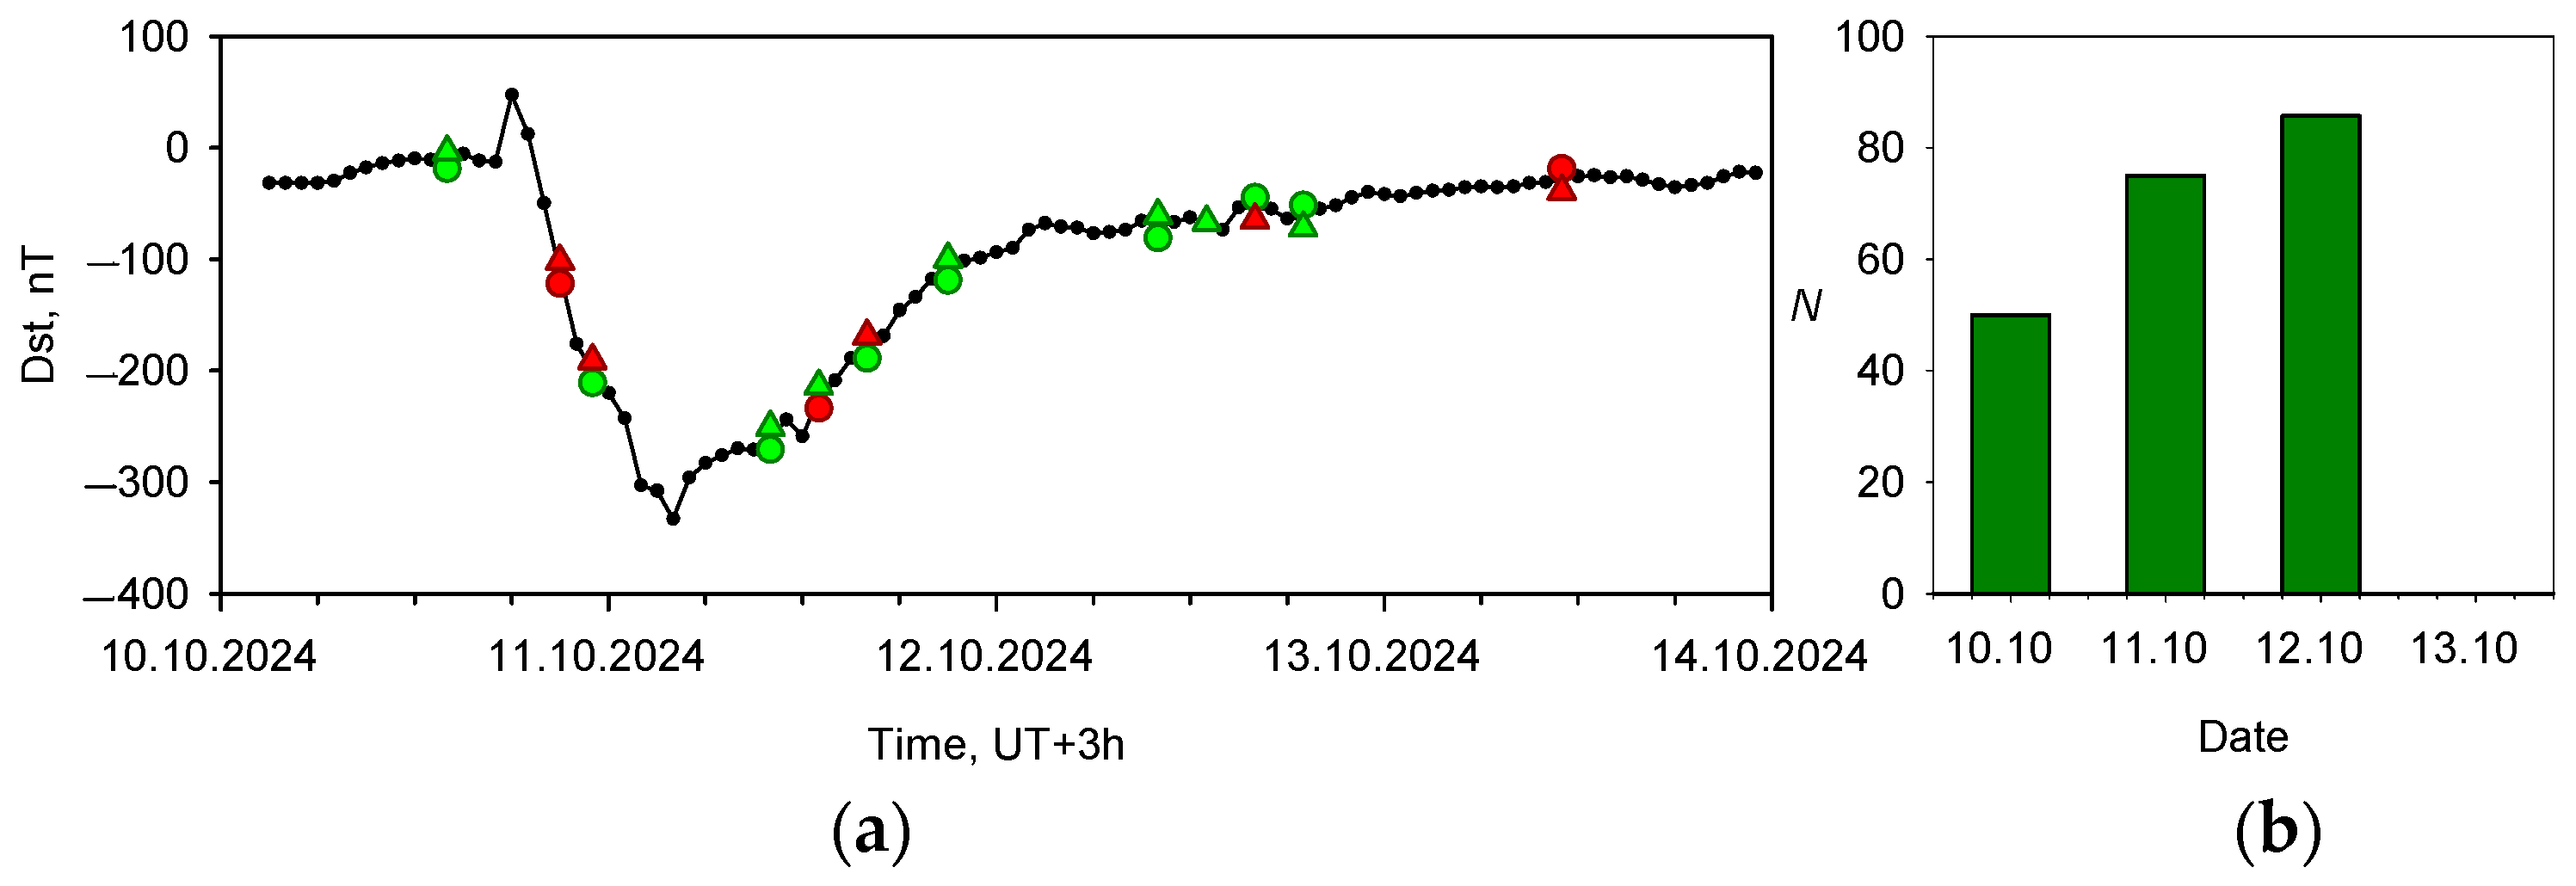
3.1. The Dst Index Dynamics During the Observation Intervals

Figure 1, Figure 2 and Figure 3a show the time variations of the Dst index in three intervals of biological measurements: Figure 1a—24–27 September 2023; Figure 2a—10–15 May 2024; and Figure 3a—10–13 October 2024. Figure 1, Figure 2 and Figure 3b show the distributions by date of the relative number of cases in which the synchronization effect was observed.
In September 2023, ECG measurements were performed by Volunteer A in the Leningrad region. In May and October 2024, measurements were performed by both volunteers, who stayed in the Moscow region, but at different locations, both at a distance of about 70 km from the Troitsk geophysical station (IZMIRAN). During three series of experiments, 61 ECG R-to-R recordings were made; the biogeophysical synchronization effect was observed in 42 recordings (69%).
The distribution of red and green dots in Figure 1, Figure 2 and Figure 3a and the values of the bars in Figure 1, Figure 2 and Figure 3b show that the results of the biogeosynchronization effect observations are not the same on different days.
For example, in May 2024 (Figure 2a), the measurements started on 11 May, after the Dst minimum had already been passed, and continued with varying levels of intensity for four days, 11–15 May. At the same time, on 11 May, both volunteers conducted seven ECG recordings in total; only two of these records showed the synchronization effect (29%). On 12 May, eight records were made, seven of which showed a synchronization effect (88%). On 13 May, the result was 100%. Finally, on 14–15 May there were four records, three of which showed a synchronization effect (75%). Other series of observations provide similar pictures: the percentage of synchronizations on the day of the MS onset and during its main phase was lower than that in the recovery phase.
However, at this point, the cases considered can only be interpreted as case studies and the detected regularities as trends.

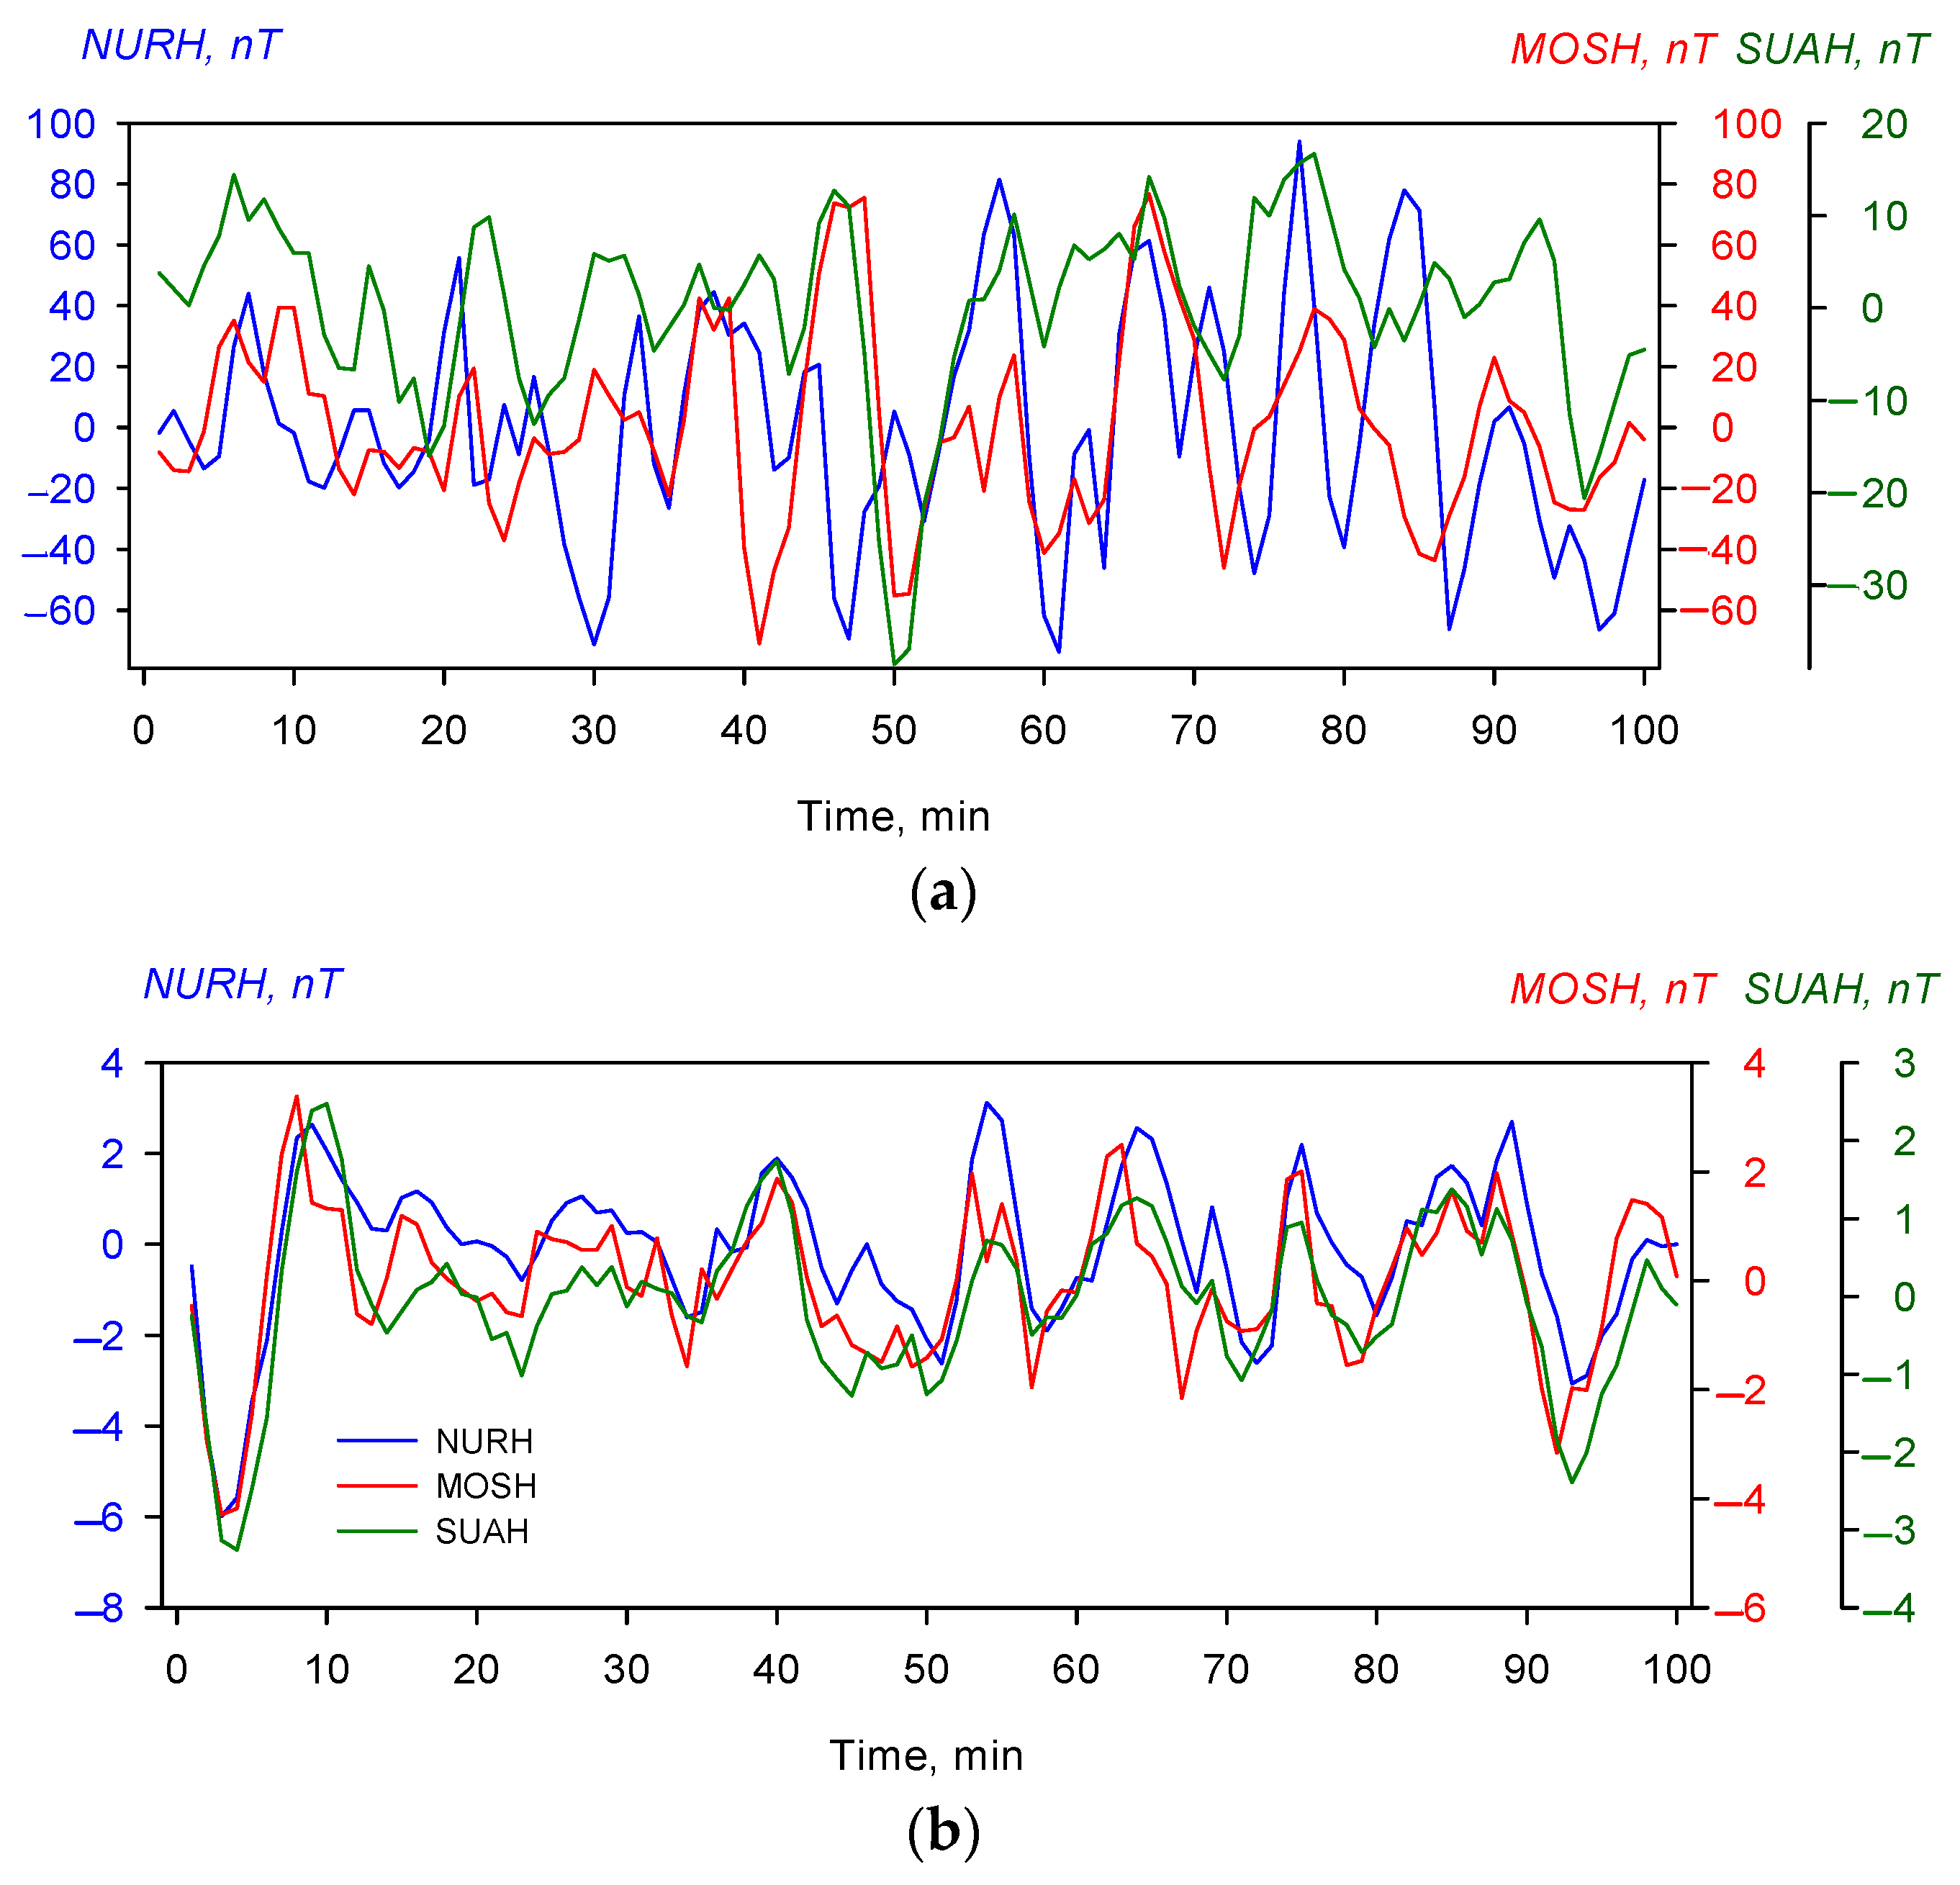
3.2. Synchronicity of Geomagnetic Variations According to Data from Different Stations

Within the framework of testing the techniques used in the analysis of the biogeosynchronization effect, for 45 measurements carried out in the vicinity of Moscow in 2024, we compared the results obtained using geomagnetic data for the H-component of the GMF at the nearest IZMIRAN station (MOS, 55°45′ N/37°36′ E, 70 km from the measurement site) and two remote stations: Nurmijärvi, Finland (NUR, 60°50′ N/24°60′ E, 930 km from Moscow) and Surlari, Romania (SUA, 44°70′ N/26°30′ E, 1400 km from Moscow). The first is to the far north of Moscow, the second is to the far south; at the same time, both are the closest in longitude to the coordinates of Moscow out of all the stations presented in the INTERMAGNET network (the difference in longitude is 10–13°).
The study indicated that if the synchronization effect was observed in an experiment using data from the MOS station, it was very likely to be observed using data from the two remote stations, NUR and SUA. Conclusions about the presence/absence of the biogeosynchronization effect using geophysical data from different stations were in agreement in 86.7% of the cases.
A detailed analysis of each specific case showed that in the experiments where the biogeosynchronization effect was observed, the courses of the time series of minute values of the GMF H-component tracked in the records of three selected geophysical stations were largely consistent in phase and amplitude (Figure 4b). In the cases when oscillations were observed but lacked phase coordination (Figure 4a), or when no oscillations were observed (Figure 4c), no biogeosynchronization effect was detected. We assume that these two phenomena—the existence of phase synchrony between variations in the ULF range at different geographic latitudes and the presence of the same frequencies in the spectra of the HR series—are somehow related.
It was necessary to numerically verify the statistical validity of this assumption. At the initial stage of testing this hypothesis, we had no clear idea which of the frequency–amplitude parameters of similarity/difference between series of geomagnetic variations according to data from different stations could be important for the occurrence of the biogeosynchronization effect. Therefore, at this stage, the maximum range of its oscillation amplitude (Ampl = Hmax − Hmin, nT) was used as a numerical characteristic of each time series of the geomagnetic variations of the H-component. The correlation coefficient between two geophysical series, Rp, was chosen as a characteristic of their similarity. We plan to find a more accurate parameter in the future.
Figure 4a–c shows examples of the time series of the synchronous variations of the GMF H-component according to the data of three geophysical stations (NUR, MOS and SUA) during the following three experiments: (a) Experiment 11 May 2024, 16:37 UT + 3 h, Dst = −292 nT; (b) Experiment 12 October 2024, 10:00 UT + 3 h, Dst = −71 nT; and (c) Experiment 13 October 2024, 11:00 UT + 3 h, Dst = −29 nT. The data are given after applying a bandpass filter with boundaries Fl = 0.075 and Fr = 0.9995 from the Nyquist frequency.
Figure 4a shows the dynamics of the GMF H-component during the experiment on 11 May 2024. The following results show that ULF oscillations are present and have a large amplitude: at the NUR station, Ampl(NUR) = 167 nT; at the MOS station, Ampl(MOS) = 147 nT; and at the SUA station Ampl(SUA) = 55 nT. The correlation coefficients Rp between the time series shown in the graph are as follows: Rp(NUR-MOS) = 0.168; Rp(MOS-SUA) = 0.482; and Rp(NUR-SUA) = 0.174.
In Figure 4b, a certain similarity can be observed between the courses of these curves. Not only is the presence of quasi-periodic oscillations evident, but also the proximity of the temporal positions of their extremes according to the three curves. About nine oscillation cycles fit into a series of 100 points, whose duration remains approximately constant over an observation interval of more than 1.5 h. The amplitudes for the different stations are as follows: Ampl(NUR) = 9.1 nT; Ampl(MOS) = 7.7 nT; and Ampl(SUA) = 5.7 nT. The correlation coefficients for pairwise comparisons of the filtered components are as follows: Rp(NUR-MOS) = 0.829; Rp(MOS-SUA) = 0.821; and Rp(NUR-SUA) = 0.875. These are significantly higher than in the situation shown in Figure 4a and are practically equal to each other.
In Figure 4c, no regular oscillations are observed, only low-amplitude, high-frequency noise close to the data sampling frequency (Ampl (NUR) = 3.0 nT, Ampl(MOS) = 3.7 nT, Ampl(SUA) = 1.4 nT). There is some synchronicity between these at the level of minute variations; therefore, the correlation coefficients between the stations have sufficiently high values, as follows: Rp(NUR-MOS) = 0.558; Rp(MOS-SUA) = 0.500; and Rp(NUR-SUA) = 0.670. However, there is no reason to note the presence of quasi-periodic ULF oscillations in this case.
For the experiments shown in Figure 4a,c, the biogeosynchronization effect was not detected. The results of the analysis of this effect during the experiment in Figure 4b are shown in Figure 5. Figure 5a–c shows examples of wavelet spectra during the same experiment as in Figure 4b of the time series for, respectively: (a) the HR of Volunteer A; (b) the HR of Volunteer B; and (c) the MOSH. Figure 5d–f shows the corresponding vectors of the ordinate averaged wavelet spectra [g] (for the HR series) and [h] (for the H-component series).
It is evident that all three spectra have two main oscillation periods, a more pronounced one of 10–11 min and a less precisely localized one of 25–28 min. The Q value for the pair of vectors [g] and [h] is Q = 0.510 for Volunteer A and Q = 0.537 for Volunteer B. As will be seen from the results presented below, all the Q values obtained in this experiment belong to the average range of values.
In the biological series, the peaks in Figure 5d,e are also visible in the high-frequency range, corresponding to oscillation periods of 5–8 min. However, in this case, they are located in the region of poor resolution with the chosen analysis parameters, although they are of particular interest. In order to study them, it is necessary to change the analysis parameters, and in particular, to change the data sampling frequency from 1 min to 30 or 15 s, which will be the subject of further research.
Thus, in the experiment on 12 October 2024, 10:00 (UT + 3 h), close sets of oscillation frequencies were observed in the spectra of geomagnetic variations according to the data of three geophysical stations and in the HR spectra of two volunteers located in different places in the Moscow region. A similar situation can be observed in a considerable number of experiments of the series in October 2024. Unfortunately, it was only at the beginning of this series that it became clear that the exact synchronous start of the ECG recordings of two volunteers provided additional possibilities for analyzing the effect. Until then, the biological measurements had been taken on the same days, but the start times had been approximated. Therefore, in the previous series of experiments, we can discuss the proximity of the oscillation spectra of the H-component GMF at three stations and a synchronous HR time series of one of the volunteers.

3.3. Biogeosynchronization Effect and the Parameters of the Geomagnetic Environment

In each of the 61 ECG recording experiments, in addition to the Dst index as an indicator of the GMA level, we compared several numerical characteristics of the current geomagnetic environment, namely, the maximum observed amplitudes of variations in the H-component of the GMF at three stations (denoted as Ampl(NUR), Ampl(MOS), Ampl(SUA)), as well as the correlation coefficients between geomagnetic variations in the H-component according to data from different stations (Rp(NUR-MOS), Rp(MOS-SUA), and Rp(NUR-SUA)). Since these indicators largely duplicate each other, in order to unify the results, the values of the oscillation amplitude at the Nurviyarvi station (Ampl(NUR)) and the correlation coefficient of the time series at the Nurmiyarvi and Surlari stations, Rp(NUR-SUA), were chosen as a single parameter for all experiments of all three series. Other options for choosing the geophysical characteristics Ampl and Rp (for other stations) provided statistical analysis results very close to those given below.
There is a strong dependence between the samples of Dst index and the Ampl(NUR) and Rp(NUR-SUA) values corresponding to each specific experiment. Since the distributions of the sample values do not fulfill the criterion of normality of the distributions, the rank correlation coefficient was used in this case. The correlation coefficient between the samples of the Dst and Ampl values was Rs = −0.659 (p = 10−8), and that between Dst and Rp(NUR-SUA) was Rs = 0.468, (p = 10−3.8). Thus, in this sample of experiments, low values of Dst correspond to large values of the amplitude of the GMF vector variations and small values of the correlation coefficient Rp between the time series of the H-component at distant stations.
Figure 6 shows scatter plots of the dependencies between the Q values for the whole sample of experiments and the corresponding values of the following three characteristics of the geomagnetic environment: Rp(NUR-SUA) (Figure 6a); Ampl(NUR) (Figure 6b); and the Dst index (Figure 6c). In addition, to assess the stability of the dependencies from Figure 6, the full sample of experiments was divided into non-overlapping subsets in two ways (first, separately for each of the volunteers, and second, separately for three observation intervals) with an assessment of the correlation relationship for each of the subsets.
Table 1 shows the results of the correlation analysis (the values of the rank correlation coefficient Rs, and the levels of their statistical significance p) for the entire sample of experiments (All), for the experiments of Volunteer A, the experiments of Volunteer B, and also, separately, for the three observation intervals. The second line shows the number of cases included in each sample.
The analysis of Figure 6 and Table 1 shows that The analysis of Figure 6 and Table 1 shows that the observed level of biogeophysical synchronization Q in different experiments is higher the higher the correlation coefficient Rp between the time series of the H-component based on data from distant stations. The correlation for 61 experiments is Rs = 0.531 (p = 10−5), which is much higher than for the other two characteristics of the geomagnetic situation considered. For the parameter Ampl, the correlation is not statistically significant (p = 0.1); for the correlation of the pair of parameters, Q–Dst index, the significance level is p = 0.014.
The result of assessing the statistical relationship between the Q and Rp is also the most stable, in that it is reproduced independently, and statistically significantly, for four of the five sample subsets of experiments (separately for each volunteer, and separately for the series of experiments in May and October 2024). The dependencies in the pairs of parameters Q-Ampl and Q-Dst are less stable and less pronounced. For the Dst indicator, a statistically significant correlation is observed only for two sample subsets; for Ampl, no significant correlations were found.

4. Discussion

The study analyzed 61 ECG records of two female volunteers made during three intervals of high geomagnetic activity in September 2023 (MS G2 and G1), May 2024 (MS G5 and G2) and October 2024 (MS G5 and G1). The following observations were made:
1.
The spectra of variations in the HR and H-component in the GMF series coincided in 42 out of 61 of the experiments considered (69%). This value of the frequency of effect occurrence is much higher than the average value that we obtained earlier for the total sample of experiments for all the years of observations (more than 600 ECG records from 10 volunteers, over 12 years, in several geographic locations) [83,86]. In all three observation intervals, the highest percentage of synchronization cases corresponded to the MS recovery phase, i.e., the first and second days after the global maximum of the magnetic storm; however, in none of the cases could the strong magnetic storm be considered as isolated. We can assume that the high value of the frequency of the effect occurrence obtained in this study can be explained by the parameters of the geomagnetic situation during the observations, which practically did not include moments of quiet GMF. Earlier, when analyzing a sample of 508 ECG records, we found that the frequency of the biogeosynchronization effect occurrence did not depend on the GMA level estimated by the daily value of the Kp-index [83]. However, the same Kp level can correspond to the main phase of the MS, the recovery phase, and to a short-term disturbance such as a substorm. Our new results show that the Kp-index used in our previous paper to describe the geomagnetic situation was apparently not specific enough to analyze the effect under study;
2.
At some points in time, the observed phases of the oscillations of the H-component of the GMF in the ULF range coincided with an accuracy of 1 min at distances of up to 1700 km (the distance between the Nurmijarvi and Surlari). This coincidence is sufficient for the conclusions arising from the data of the MOS station to coincide with similar conclusions for stations significantly remote in latitude in almost 90% of the experiments considered. If further research confirms the validity of this observation with respect to certain geophysical situations, this fact may have methodological significance for further studies of the effect of biogeosynchronization in the ULF range;
3.
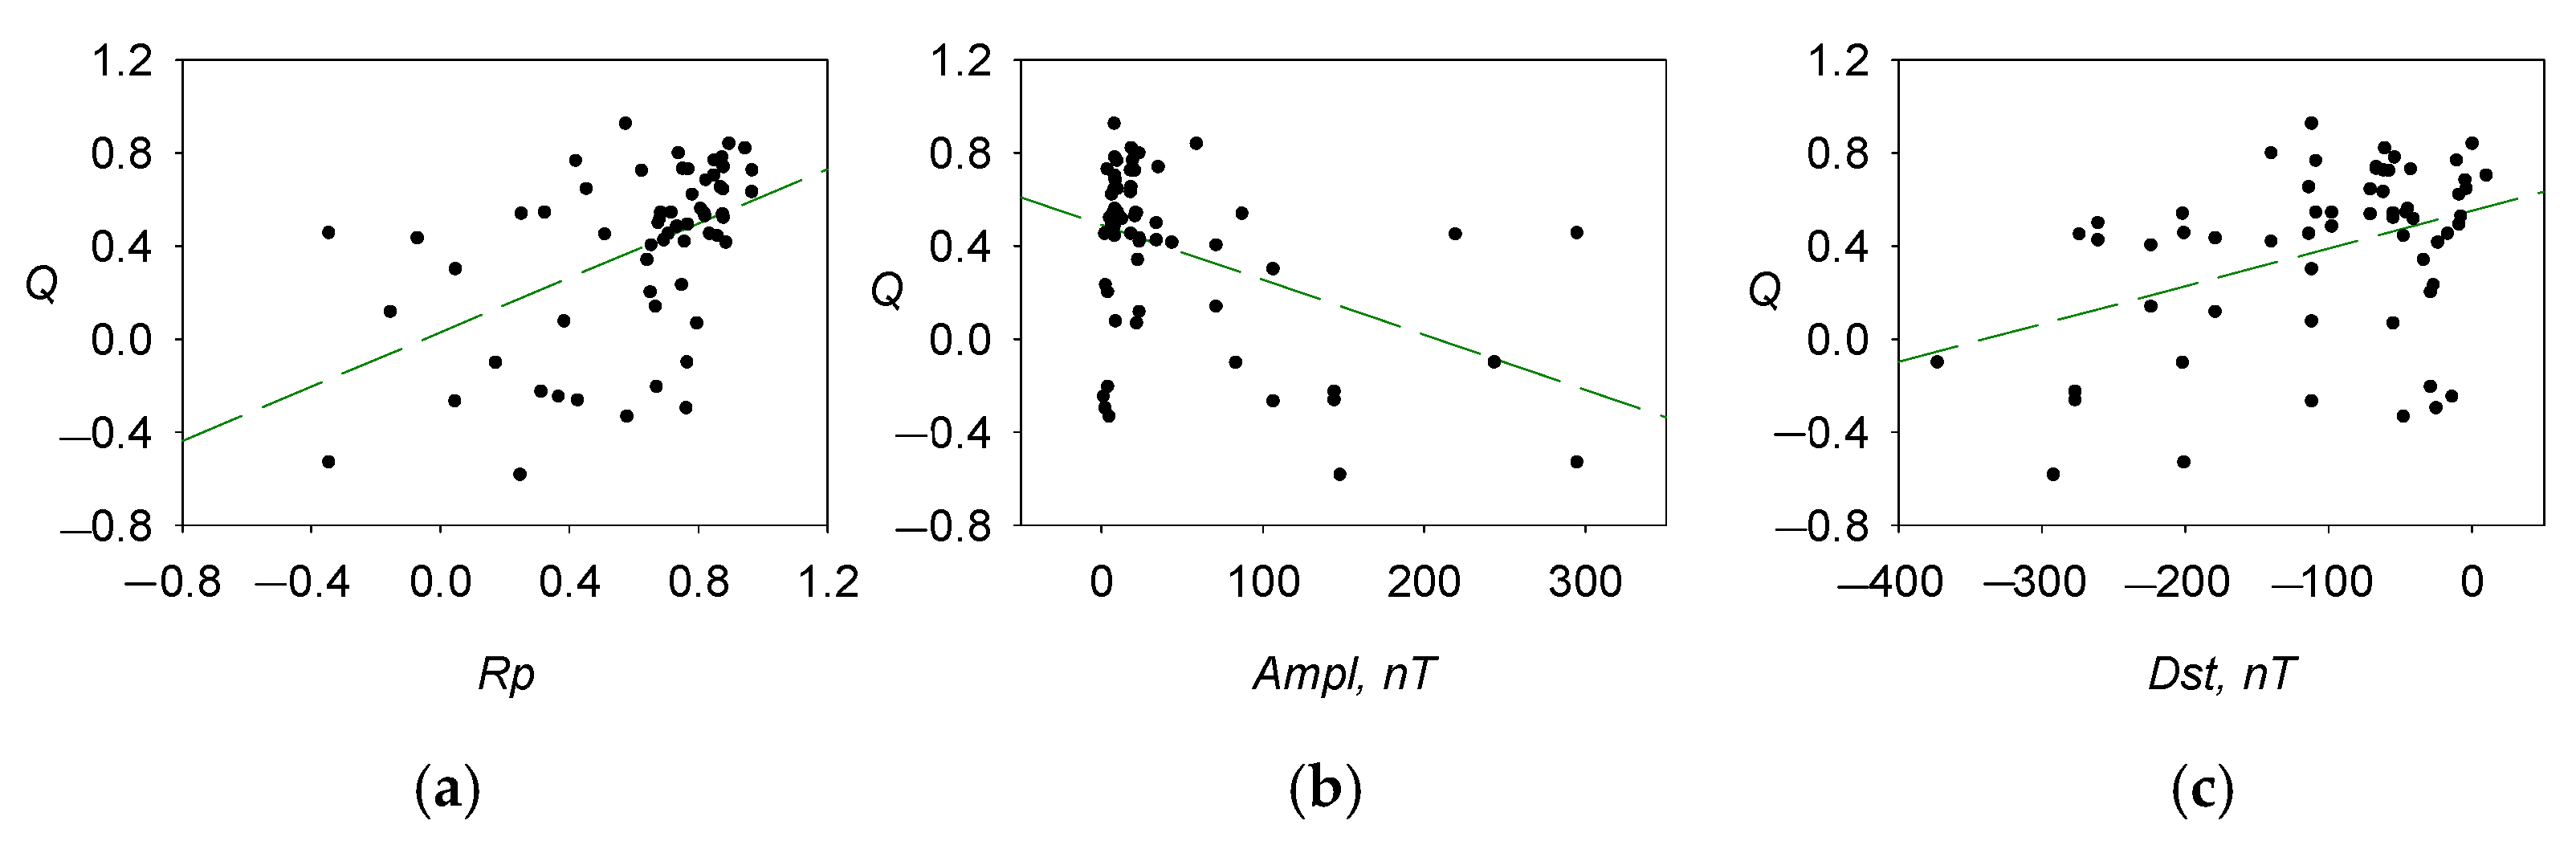
A close correlation was found between the pairs of geomagnetic environment characteristics considered: Dst-Rp(NUR-SUA) and Dst-Ampl (NUR) were positive in the first case and negative in the second. The results obtained show the importance of taking into account the correlation between these geomagnetic features in further heliobiological studies; this may explain why some studies observe a dependence of the biogeosynchronization effect on the general GMA level during the measurement period [77];
4.
The higher the correlation coefficient Rp between the time series of the H-component according to the data of distant stations, the higher the observed level of biogeophysical synchronization Q in different experiments at that time (Rs = 0.531, p < 0.00001). This was much higher than correlations observed with the other two considered characteristics of the geomagnetic environment. In the pair of Q-Ampl indicators, the correlation was statistically insignificant (p = 0.1), in the Q-Dst index, the significance level was p = 0.014. Given the correlation between these characteristics of the geomagnetic environment, we can assume that the correlation found between Q and the Dst index is indirect.
It is necessary to take into account that the results obtained in this study are based on the analysis of a relatively small experimental sample applicable to rather specific geophysical conditions. It is also necessary to remember that the heliobiological effect is largely time-dependent and may look different during other MS events, even those at similar levels of intensity. Therefore, all the above conclusions require further verification and clarification on much larger samples of observations.
The following factors need to be verified:
1.
The database of the ECG records that we previously collected (more than 600 records) allow for additional analyses of manifestations of the biogeosynchronization effect in terms of the coincidences of oscillation phases and the amplitudes of ULF variations;
2.
It is necessary to verify to what extent the conclusions on the nature of the correlations between the Dst, Rp, Ampl indices and a number of other geomagnetic indices obtained here are maintained or modified in different geomagnetic situations including, as follows: (a) during periods of “magnetic silence” (extremely low GMA levels); (b) during average GMA levels (Kp = 1–3) without pronounced geomagnetic disturbances; and (c) during other strong MS events of different classes, such as G3-G5 MS, etc.
Assuming that the conclusions of this study are confirmed, several possible consequences can be proposed. The discovered effect fits, like one of the building blocks, into the possible fundamental scheme of solar–biospheric interactions that have been discussed in the literature since the 1960s [74]: On the one hand, GMF variations are controlled by solar activity; on the other hand, they are, together with the change in seasons and the diurnal cycle, important environmental factors that act as a pacemaker for a very wide range of biological rhythms. Living systems at different levels, from cells to populations, perceive normal background GMF variations as a generally favorable environmental factor and respond by adjusting their own endogenous rhythms. At certain moments, this globality of habitual variations disappears, such as, for example, during an untimely magnetic storm [42] or during periods of “magnetic silence” (in the sense discussed, these situations are equivalent). At these moments, a living system responds to changes through its intrinsic adaptation mechanism. It is known that, in such situations, humans develop an adaptive stress response (the most easily detectable symptoms are changes in the mean values of HR and BP and a decrease in HR variability). In a situation where adaptive mechanisms fail, catastrophic consequences, such as serious illness and death, can occur.
It was shown that in a group of patients diagnosed with arterial hypertension, the probability of observing the biogeosynchronization effect was significantly lower than in apparently healthy controls. This fact also aligns with the hypothesis that the biogeosynchronization effect is a form of normal adaptation of the body to environmental factors and disappears when the adaptation mechanisms, in particular, the baroreflex mechanism, break down [76].
Some experimental data also show that the addition of an alternating magnetic field with parameters close to those in nature can help some humans, animals and plants to cope with artificially created stress [87,88]; the presence of oscillations in the ULF range in the magnetosphere were shown to have a positive effect on mental illness statistics [89].
If the phase synchronicity of geomagnetic variations in the ULF range at large distances along the meridian is a greater biotropic factor than their amplitude and the general level of the GMA, then this conclusion is in good agreement with the effects of the influence of Schumann resonances [90] and long-term rhythms of solar activity on living systems, which are widely discussed in the research literature [4,11,73].
As rightly noted in [91]: “One of the main challenges facing scientists today is to clarify the molecular pathways of transforming the perceived magnetic impact into registered biological effects. All resonance-like models were developed using experimental results at the cellular, organismal, and even population levels. A network of signaling pathways and molecular interactions between the putative primary targets and biological effects remain unknown. These pathways and the intracellular environment of magnetosensitive molecules can play a crucial role in the occurrence of magnetobiological effects”.
A similar methodological problem exists in clinical cosmobiology; the effect of a natural factor on a specific target in the body and the recorded population response are separated by a large “black box” of as yet unknown processes of response development.
Perhaps, thanks to the study of the biogeosynchronization effect, we have been able to identify (and present for further study) one of the hitherto unknown ecological functions of ULF oscillations of the GMF.
Pc5 pulsations are most often observed during the recovery phase of an MS, but not in all cases: “It was found that the development of a “daytime polar substorm”, i.e., a negative magnetic bay in the daytime sector of the polar latitudes, leads to an abrupt cessation of the generation of Pc5 geomagnetic pulsations in the whole range of latitudes where these oscillations were recorded before the appearance of the daytime bay” [78].
Magnetic storms caused by CME and CIR differ not only in their origin, but also in the characteristics of the Pc5 geomagnetic pulsations observed at the Earth’s surface [79]. For example, during CIR storms, the most intense daytime Pc5 geomagnetic pulsations were observed mainly at geomagnetic latitudes above 70°, whereas during CME storms, they were observed at latitudes below 70°. In our study, the main storms were of CME origin. The oscillations we observed decreased in amplitude with decreasing observation latitudes, similar to the findings of another study [79].
However, this type of pulsation is also observed during geomagnetically quiet periods [92]; this may be the reason behind our detection of the biogeosynchronization effect at low Kp-index values [83]. The ULF index was developed to estimate the intensity of GMF oscillations in the ULF range [93]; however in terms of its physical meaning, this index is closer to another parameter of the geomagnetic environment, namely, the amplitude of the oscillations, with which we were unable to find a statistically significant relationship.
An analysis of daytime magnetospheric data in the millihertz range showed that there are certain frequencies, in particular f = 1.0, 1.5, 1.9, 2.8, 3.3 and 4.4 mHz, which are more common than other frequencies [81] within this range. The values of f = 1 mHz (16.6 min), 1.5 mHz (11.1 min) are in the same frequency range as the biogeosynchronization effect that we observed. We have previously shown that this effect has a peculiarity in its frequency distribution: synchronization is most pronounced for periods of 8–13 min [83,86]. These periods are among the most stable Pc5 periods.
However, even though we have succeeded in putting forward a likely candidate for the role of a physical agent for discussion and the first arguments in its favor have been gathered, the question of which rhythmic physiological processes in the human body can perceive these millihertz geomagnetic oscillations and be reflected in the heart rhythm is currently the subject of further research.

Limitations and Advantages of the Study

As mentioned above, the main limitation of the study is the small size of the experimental samples: (a) only two volunteers took part in the measurements; and (b) only three episodes of high GMA were analyzed, two of which are quite rare events. Therefore, the results require verification with larger experimental samples, primarily in relation to other geophysical conditions.
The advantage of the study is that the limited number of experiments enabled each one to be analyzed in detail and allowed for an indicator of the geomagnetic environment, the degree of synchronicity in the ULF variations at the remote sites, to be identified for further study. This indicator has not yet been taken into account in heliobiological studies.

5. Conclusions

The paper presents an analysis of the correlation between the dynamics of the heart rate of healthy humans and synchronous changes in the horizontal H-component of the geomagnetic field during magnetic storms on 24–27 September 2023, 10–13 May 2024, and 10–13 October 2024. The study analyzed monitoring data from two female volunteers in good health (61 ECG records in different phases of the magnetic storms).
It was found that the biogeosynchronization effect most often occurs during the MS recovery phase, in a situation when geomagnetic oscillations in the ULF range in the surface layer are in phase over large distances along the meridian of the biological measurements.
A statistically significant correlation between the level of phase synchronicity of the oscillations and the degree of expression of the biogeosynchronization effect was found; it was much closer than correlations with the current value of the Dst index or with the value of the amplitude of such variations.
We have obtained new evidence in favor of the hypothesis that geomagnetic variations in the ULF frequency range serve as a rhythm sensor for a healthy organism under normal conditions. Such a connection is apparently disrupted not only during the main phase of a magnetic storm, but also during intervals of extremely low GMA levels.
Our conclusions were drawn from a limited sample of experiments and require further verification on larger arrays of observations in different geomagnetic conditions.
The study of the reactions of healthy humans to various factors concerning space weather and pathways of the physiological reactions of living systems from the primary impact of an external factor to the formation of a response at the organism level is an urgent scientific mission. This is important for a fundamental understanding of the system of solar–biosphere connections, and in a social and practical sense, for protecting individuals with low levels of adaptation from harmful effects, since healthy subjects are usually considered as a control group in medical and environmental studies of patients with health disorders of various types.

Author Contributions

Conceptualization, T.A.Z. and T.K.B.; methodology, T.A.Z.; software, T.A.Z. and A.V.D.; validation, T.A.Z., and N.I.K.; formal analysis, T.A.Z. and A.V.D.; investigation, N.I.K., A.V.D. and O.Y.S.; resources, T.A.Z., O.Y.S. and N.I.K.; data curation, N.I.K., O.Y.S. and A.V.D.; writing—original draft preparation, review and editing, T.A.Z., A.V.D. and T.K.B.; visualization, T.A.Z. and A.V.D.; project administration, T.K.B. All authors have read and agreed to the published version of the manuscript.

Funding

The work was carried out according to the state task of ITEB RAS (the state registration number is № 075-00223-25-00), the state task “Plazma” of IKI RAS, state task of IBCP RAS (44.1. № 0084-2019-004) and state task FFZM-2022-0009 of IAI RAS (the state registration number is № 122040600002-3).

Institutional Review Board Statement

The study was conducted in accordance with the Declaration of Helsinki, and approved by the Ethics Committee Institute of Theoretical and Experimental Biophysics, Russian Academy of Sciences (protocol code 06/2012 from 1 June 2012).

Informed Consent Statement

Informed consent was obtained from all subjects involved in the study. Written informed consent has been obtained from the patients to publish this paper.

Data Availability Statement

The heart rate recording database presented in this study is available on reasonable request from the corresponding author due to privacy and ethical reasons.

Acknowledgments

The results presented in this paper rely on data collected at magnetic observatories. We thank the Pushkov Institute of Terrestrial Magnetism, Ionosphere and Radio Wave Propagation Russian Academy of Sciences, Finnish Meteorological Institute, Geological Institute of Romania and INTERMAGNET for promoting high standards of magnetic observatory practice.

Conflicts of Interest

The authors declare no conflicts of interest.

Abbreviations

The following abbreviations are used in this manuscript:
MSMagnetic Storms
GMFGeomagnetic Field
HRHeart Rate
ULFUltra-Low Frequency
PCPulsation Continuous
GMAGeomagnetic Activity
CMECoronal Mass Ejections
CIRCorotating Interaction Region

References

  1. Gnevyshev, M.N.; Novikova, K.F.; Ohl, A.I.; Tokareva, N.V. Sudden death from cardiovascular diseases and solar activity. In Influence of Solar Activity on the Atmosphere and Biosphere of the Earth; Nauka: Moscow, Russia, 1971; pp. 179–187. (In Russian) [Google Scholar]
  2. Dorman, L.I.; Iucci, N.; Ptitsyna, N.G.; Villoresi, G. Cosmic rays as indicator of space weather influence on frequency of infract myocardial, brain strokes, car and train accidents. In Proceedings of the 27th International Cosmic Ray Conference, Hamburg, Germany, 7–15 August 2001; p. 3511. [Google Scholar]
  3. Villoresi, G.; Breus, T.K.; Dorman, L.I.; Iuchi, N. Effect of interplanetary and geomagnetic disturbances on the increase in number of clinically serious medical pathologies (myocardial infarct and stroke). Biofizika 1995, 40, 983–993. [Google Scholar] [PubMed]
  4. Cornelissen, G.; Halberg, F.; Breus, T.; Syitkina, E.; Baevsky, R.; Weydahl, A.; Watanabe, Y.; Otsuka, K.; Siegelova, J.; Fiser, B.; et al. Non-photic solar assotiations of heart rate variability and myocardial infarction. J. Atmos. Sol.-Terr. Phys. 2002, 64, 707–720. [Google Scholar] [CrossRef]
  5. Stoupel, E.; Domarkiene, S.; Radishauskas, R.; Abramson, E. Sudden cardiac death and geomagnetic activity: Links to age, gender and agony time. J. Basic Clin. Physiol. Pharmacol. 2002, 13, 11–21. [Google Scholar] [CrossRef] [PubMed]
  6. Dimitrova, S.; Stoilova, I.; Georgieva, K.; Taseva, T.; Jordanova, M.; Maslarov, D. Solar and geomagnetic activity and acute myocardial infarction morbidity and mortality. Fundam Space Res. 2009, 3, 161–165. [Google Scholar]
  7. Mendoza, B.; de la Pena, S.S. Solar activity and human health at middle and low geomagnetic latitudes in Central America. Adv. Space Res. 2010, 46, 449–459. [Google Scholar] [CrossRef]
  8. Lowell, W.E.; Davis, G.E., Jr. The effect of solar cycles on human lifespan in the 50 United states: Variation in light affects the human genome. Med. Hypotheses 2010, 75, 17–25. [Google Scholar] [CrossRef]
  9. Vieira, C.L.Z.; Janot-Pacheco, E.; Lage, C.; Pacini, A.; Koutrakis, P.; Cury, P.R.; Shaodan, H.; Pereira, L.A.; Saldiva, P.H.N. Long-term association between the intensity of cosmic rays and mortality rates in the city of Sao Paulo. Environ. Res. Lett. 2018, 13, 24009. [Google Scholar] [CrossRef]
  10. Vieira, C.L.Z.; Alvares, D.; Blomberg, A.; Schwartz, J.; Coull, B.; Huang, S.; Koutrakis, P. Geomagnetic disturbances driven by solar activity enhance total and cardiovascular mortality risk in 263 U.S. cities. Environ. Health 2019, 18, 83. [Google Scholar] [CrossRef]
  11. Davis, G.E., Jr.; Davis, M.J.; Lowell, W.E. The effect of ultraviolet radiation on the incidence and severity of major mental illness using birth month, birth year, and sunspot data. Heliyon 2022, 8, e09197. [Google Scholar] [CrossRef]
  12. Qammar, N.W.; Petronaitis, D.; Jokimaitis, A.; Ragulskis, M.; Smalinskas, V.; Žiubrytė, G.; Jaruševičius, G.; Vainoras, A.; McCraty, R. Long Observation Window Reveals the Relationship between the Local Earth Magnetic Field and Acute Myocardial Infarction. Atmosphere 2023, 14, 1234. [Google Scholar] [CrossRef]
  13. Vencloviene, J.; Babarskiene, R.; Slapikas, R.; Sakalyte, G. The association between phenomena on the sun, geomagnetic activity, meteorological variables, and cardiovascular characteristic of patients with myocardial infarction. Int. J. Biometeorol. 2013, 57, 797–804. [Google Scholar] [CrossRef] [PubMed]
  14. Katsavrias, C.; Preka-Papadema, P.; Moussas, X.; Apostolou, T.; Theodoropoulou, A.; Papadima, T. Helio-geomagnetic influence in cardiological cases. Adv. Space Res. 2013, 51, 96–106. [Google Scholar] [CrossRef]
  15. Stupishina, O.M.; Golovina, E.G.; Noskov, S.N.; Eremin, G.B.; Gorbanev, S.A. The Space and Terrestrial Weather Variations as Possible Factors for Ischemia Events in Saint Petersburg. Atmosphere 2022, 13, 8. [Google Scholar] [CrossRef]
  16. Vencloviene, J.; Babarskiene, R.M.; Kiznys, D. A possible association between space weather conditions and the risk of acute coronary syndrome in patients with diabetes and the metabolic syndrome. Int. J. Biometeorol. 2017, 61, 159–167. [Google Scholar] [CrossRef]
  17. Vencloviene, J.; Beresnevaite, M.; Cerkauskaite, S.; Ragaisyte, N.; Pilviniene, R.; Benetis, R. Statistical Associations between Geomagnetic Activity, Solar Wind, Cosmic Ray Intensity, and Heart Rate Variability in Patients after Open-Heart Surgery. Atmosphere 2022, 13, 1330. [Google Scholar] [CrossRef]
  18. Schiff, J.E.; Vieira, C.L.Z.; Garshick, E.; Wang, V.; Blomberg, A.; Gold, D.R.; Schwartz, J.; Tracy, S.M.; Vokonas, P.; Koutrakis, P. The role of solar and geomagnetic activity in endothelial activation and inflammation in the NAS cohort. PLoS ONE 2022, 17, e0268700. [Google Scholar] [CrossRef]
  19. Dimitrova, S. Relationship between human physiological parameters and geomagnetic variations of solar origin. Adv. Space Res. 2006, 37, 1251–1257. [Google Scholar] [CrossRef]
  20. Vencloviene, J.; Braziene, A.; Dobozinskas, P. Short-Term Changes in Weather and Space Weather Conditions and Emergency Ambulance Calls for Elevated Arterial Blood Pressure. Atmosphere 2018, 9, 114. [Google Scholar] [CrossRef]
  21. Mavromichalaki, H.; Papailiou, M.; Dimitrova, S.; Babayev, E.S.; Loucas, P. Space weather hazards and their impact on human cardio-health state parameters on Earth. Nat. Hazards 2012, 64, 1447–1459. [Google Scholar] [CrossRef]
  22. Galata, E.; Ioannidou, S.; Papailiou, M.; Mavromichalaki, H.; Paravolidakis, K.; Kouremeti, M.; Trachanas, K. Impact of space weather on human heart rate during the years 2011–2013. Astrophys. Space Sci. 2017, 362, 138. [Google Scholar] [CrossRef]
  23. Papailiou, M.; Ioannidou, S.; Tezari, A.; Lingri, D.; Konstantaki, M.; Mavromichalaki, H.; Dimitrova, S. Space weather phenomena on heart rate: A study in the Greek region. Int. J. Biometeorol. 2023, 67, 37–45. [Google Scholar] [CrossRef] [PubMed]
  24. Oinuma, S.; Kubo, Y.; Otsuka, K.; Yamanaka, T.; Murakami, S.; Matsuoka, O.; Ohkawa, S.; Cornélissen, G.; Weydahl, A.; Holmeslet, B.; et al. Graded response of heart rate variability, associated with an alteration of geomagnetic activity in a subarctic area. Biomed. Pharmacother. 2002, 56, 284–288. [Google Scholar] [CrossRef] [PubMed]
  25. Dimitrova, S.; Angelov, I.; Petrova, E. Solar and geomagnetic activity effects on heart rate variability. Nat. Hazards 2013, 69, 25–37. [Google Scholar] [CrossRef]
  26. Janashia, K.; Tvildiani, L.; Tsibadze, T.; Invia, N. Effects of the geomagnetic field time varying components compensation as evidenced by heart rate variability of healthy males. Life Sci. Space Res. 2022, 32, 38–44. [Google Scholar] [CrossRef]
  27. Vieira, C.L.Z.; Chen, K.; Garshick, E.; Liu, E.M.; Vokonas, P.; Ljungman, P.; Schwartz, J.; Koutrakis, P. Geomagnetic disturbances reduce heart rate variability in the normative aging study. Sci. Total Environ. 2022, 839, 156235. [Google Scholar] [CrossRef]
  28. Stoupel, E. Cardiac arrhythmia and geomagnetic activity. Indian Pacing Electrophysiol. J. 2006, 6, 49–53. Available online: https://www.ncbi.nlm.nih.gov/pmc/articles/PMC1501097/ (accessed on 1 December 2024).
  29. Papailiou, M.; Mavromichalaki, H.; Vassilaki, A.; Kelesidis, K.M.; Mertzanos, G.A.; Petropoulos, B. Cosmic ray variations of solar origin in relation to human physiological state during December 2006 solar extreme events. Adv. Space Res. 2009, 43, 523–529. [Google Scholar] [CrossRef]
  30. Breus, T.K.; Cornélissen, G.; Halberg, F.; Levitin, A.E. Temporal associations of life with solar and geophysical activity. Ann. Geophys. 1995, 13, 1211–1222. [Google Scholar] [CrossRef]
  31. Stoupel, E.; Kalediene, R.; Petrauskiene, J.; Starkuviene, S.; Abramson, E.; Israelevich, P.; Sulkes, J. Twenty years study of solar, geomagnetic, cosmic ray activity links with monthly deaths number (n-850304). J. Biomed. Sci. Eng. 2011, 4, 426. [Google Scholar] [CrossRef]
  32. Stoupel, E.; Babayev, E.; Abramson, E.; Sulkes, J. Days of “zero” level geomagnetic activity accompanied by the high neutron activity and dynamics of some medical events—Antipodes to geomagnetic storms. Health 2013, 5, 855–861. [Google Scholar] [CrossRef]
  33. Podolská, K. Circulatory and Nervous Diseases Mortality Patterns—Comparison of Geomagnetic Storms and Quiet Periods. Atmosphere 2022, 13, 13. [Google Scholar] [CrossRef]
  34. Gurfinkel’, I.; Kuleshova, V.P.; Oraevskiĭ, V.N. Assessment of the effect of a geomagnetic storm on the frequency of appearance of acute cardiovascular pathology. Biofizika 1998, 43, 654–658. (In Russian) [Google Scholar] [PubMed]
  35. Kleimenova, N.G.; Kozyreva, O.V.; Breus, T.K.; Rapoport, S.I. Pc1 geomagnetic pulsations as a potential hazard of the myocardial infarction. J. Atmos. Sol. Terr. Phys. 2007, 69, 1759–1764. [Google Scholar] [CrossRef]
  36. Ozheredov, V.A.; Breus, T.K.; Gurfinkel, Y.I.; Revich, B.A.; Mitrofanova, T.A. Influence of some weather factors and geomagnetic activity on the development of severe cardiological pathologies. Biophysics 2010, 55, 110–119. Available online: https://link.springer.com/article/10.1134%2FS0006350910010185 (accessed on 1 December 2024). [CrossRef]
  37. Shaposhnikov, D.; Revich, B.; Gurfinkel, Y.; Naumova, E. The influence of meteorological and geomagnetic factors on acute myocardial infarction and brain stroke in Moscow, Russia. Int. J. Biometeorol. 2013, 58, 799–808. [Google Scholar] [CrossRef]
  38. Sasonko, M.L.; Ozheredov, V.A.; Breus, T.K.; Ishkov, V.N.; Klochikhina, O.A.; Gurfinkel, Y.I. Combined influence of the local atmosphere conditions and space weather on three parameters of 24-h electrocardiogram monitoring. Int. J. Biometeorol. 2019, 63, 93–105. [Google Scholar] [CrossRef]
  39. Papailiou, M.-C.; Ioannidou, S.; Tezari, A.; Mavromichalaki, H. Geomagnetic and Cosmic Ray Activity Effect on Heart Rate during the Solar Cycle 24. Atmosphere 2024, 15, 158. [Google Scholar] [CrossRef]
  40. Zenchenko, T.A.; Poskotinova, L.V.; Rekhtina, A.G.; Zaslavskaya, R.M. Relation between Microcirculation Parameters and Pc3 Geomagnetic Pulsations. Biophysics 2010, 55, 646–651. [Google Scholar] [CrossRef]
  41. Golovanova, I.L.; Filippov, A.A.; Chebotareva, Y.V.; Urvantseva, G.A.; Krylov, V.V. Effect of a Shift in Diurnal Geomagnetic Variation on the Activity and Sensitivity of Digestive Glycosidases in Roach Underyearlings to Heavy Metals. Izv. Atmos. Ocean. Phys. 2019, 55, 1623–1628. [Google Scholar] [CrossRef]
  42. Krylov, V.V.; Kantserova, N.P.; Lysenko, L.A.; Osipova, E.A. A simulated geomagnetic storm unsynchronizes with diurnal geomagnetic variation affecting calpain activity in roach and great pond snail. Int. J. Biometeorol. 2019, 63, 241–246. [Google Scholar] [CrossRef]
  43. Timofejeva, I.; McCraty, R.; Atkinson, M.; Joffe, R.; Vainoras, A.; Alabdulgader, A.; Ragulskis, M. Identification of a Group’s Physiological Synchronization with Earth’s Magnetic Field. Int. J. Environ. Res. Public Health 2017, 14, 998. [Google Scholar] [CrossRef] [PubMed]
  44. Timofejeva, I.; McCraty, R.; Atkinson, M.; Alabdulgader, A.A.; Vainoras, A.; Landauskas, M.; Šiaučiūnaitė, V.; Ragulskis, M. Global Study of Human Heart Rhythm Synchronization with the Earth’s Time Varying Magnetic Field. Appl. Sci. 2021, 11, 2935. [Google Scholar] [CrossRef]
  45. Ramishvili, A.; Janashia, K.; Tvildiani, L. High Heart Rate Variability Causes Better Adaptation to the Impact of Geomagnetic Storms. Atmosphere 2023, 14, 1707. [Google Scholar] [CrossRef]
  46. Babayev, E.S.; Allahverdiyeva, A.A. Effects of geomagnetic activity variations on the physiological and psychological state of functionally healthy humans: Some results of Azerbaijani studies. Adv. Space Res. 2007, 40, 1941–1951. [Google Scholar] [CrossRef]
  47. Gurfinkel, Y.I.; Vasin, A.L.; Pishchalnikov, R.Y.; Sarimov, R.M.; Sasonko, M.L.; Matveeva, T.A. Geomagnetic storm under laboratory conditions: Randomized experiment. Int. J. Biometeorol. 2018, 62, 501–512. [Google Scholar] [CrossRef]
  48. Shepoval'nikov, V.N.; Soroko, S.I. Human Meteo Sensitivity; Ilim: Bishkek, Kyrgyzstan, 1992; p. 247. (In Russian) [Google Scholar]
  49. Krylov, V.V. Biological effects related to geomagnetic activity and possible mechanisms. Bioelectromagnetics 2017, 38, 497–510. [Google Scholar] [CrossRef]
  50. Zenchenko, T.A.; Medvedeva, A.A.; Khorseva, N.I.; Breus, T.K. Synchronization of human heart-rate indicators and geomagnetic field variations in the frequency range of 0.5–3.0 mHz. Izv. Atmos. Ocean. Phys. 2014, 50, 736–744. [Google Scholar] [CrossRef]
  51. Task Force of the European Society of Cardiology and the North American Society of Pacing and Electrophysiology. Heart rate variability: Standards of measurement, physiological interpretation and clinical use. Circulation 1996, 93, 1043–1065. [Google Scholar] [CrossRef]
  52. Shaffer, F.; McCraty, R.; Zerr, C. A healthy heart is not a metronome: An integrative review of the heart’s anatomy and heart rate variability. Front. Psychol. 2014, 5, 1040. [Google Scholar] [CrossRef]
  53. McCraty, R.; Shaffer, F. Heart Rate Variability: New Perspectives on Physiological Mechanisms, Assessment of Self-regulatory Capacity, and Health risk. Glob. Adv. Health Med. 2015, 4, 46–61. [Google Scholar] [CrossRef]
  54. Grishin, V.G.; Grishin, O.V.; Gultyaeva, V.V.; Zinchenko, M.I.; Uryumtsev, D.Y. Very-Low-Frequency Oscillations of Oxygen Transport in Resting Humans. Russ. J. Physiol. 2019, 105, 1154–1162. [Google Scholar] [CrossRef]
  55. Tankanag, A.V.; Grinevich, A.A.; Tikhonova, I.V.; Chemeris, N.K. An Analysis of Phase Relationships between Oscillatory Processes in the Human Cardiovascular System. Biophysics 2020, 65, 159–164. [Google Scholar] [CrossRef]
  56. Hayano, J.; Yuda, E. Assessment of autonomic function by long-term heart rate variability: Beyond the classical framework of LF and HF measurements. J. Physiol. Anthropol. 2021, 40, 21. [Google Scholar] [CrossRef] [PubMed]
  57. Stein, P.K.; Lundequam, E.J.; Clauw, D.; Freedland, K.E.; Carney, R.M.; Domitrovich, P.P. Circadian and ultradian rhythms in cardiac autonomic modulation. Conf. Proc. IEEE Eng. Med. Biol. Soc. 2006, 2006, 429–432. [Google Scholar] [CrossRef]
  58. Zenchenko, T.A.; Medvedeva, A.A.; Potolitsyna, N.N.; Parshukova, O.I.; Boiko, E.R. Correlation of the dynamics of minute-scale heart rate oscillations and biochemical parameters of the blood in healthy subjects to Pc5–6 geomagnetic pulsations. Biophysics 2015, 60, 309–316. [Google Scholar] [CrossRef]
  59. Kleiger, R.E.; Miller, J.P.; Bigger, J.T., Jr.; Moss, A.J. Decreased heart rate variability and its association with increased mortality after acute myocardial infarction. Am. J. Cardiol. 1987, 59, 256–262. [Google Scholar] [CrossRef]
  60. Cattaneo, L.A.; Franquillo, A.C.; Grecucci, A.; Beccia, L.; Caretti, V.; Dadomo, H. Is Low Heart Rate Variability Associated with Emotional Dysregulation, Psychopathological Dimensions, and Prefrontal Dysfunctions? An Integrative View. J. Pers. Med. 2021, 11, 872. [Google Scholar] [CrossRef]
  61. Bigger, J.T., Jr.; Fleiss, J.L.; Steinman, R.C.; Rolnitzky, L.M.; Kleiger, R.E.; Rottman, J.N. Frequency domain measures of heart period variability and mortality after myocardial infarction. Circulation 1992, 85, 164–171. [Google Scholar] [CrossRef]
  62. Carney, R.M.; Freedland, K.E.; Stein, P.K.; Miller, G.E.; Steinmeyer, B.; Rich, M.W.; Duntley, S.P. Heart rate variability and markers of inflammation and coagulation in depressed patients with coronary heart disease. J. Psychosom. Res. 2007, 62, 463–467. [Google Scholar] [CrossRef]
  63. Rapoport, S.I.; Boldypakova, T.D.; Malinovskaia, N.K.; Oraevskiĭ, V.N.; Meshcheriakova, S.A.; Breus, T.K.; Sosnovskiĭ, A.M. Magnetic storms as a stress factor. Biofizika 1998, 43, 632–639. (In Russian) [Google Scholar]
  64. Otsuka, K.; Yamanaka, T.; Cornelissen, G.; Breus, T.; Chibisov, S.M.; Baevsky, R.; Siegelová, J.; Fiser, B.; Halberg, F. Altered chronome of heart rate variability during span of high magnetic activity. Scr. Medica 2000, 73, 111–116. [Google Scholar]
  65. Otsuka, K.; Cornélissen, G.; Weydahl, A.; Holmeslet, B.; Hansen, T.L.; Shinagawa, M.; Kubo, Y.; Nishimura, Y.; Omori, K.; Yano, S.; et al. Geomagnetic disturbance associated with decrease in heart rate variability in a subarctic area. Biomed. Pharmacother. 2001, 55, 51–56. [Google Scholar] [CrossRef] [PubMed]
  66. Otsuka, K.; Oinuma, S.; Cornélissen, G.; Weydahl, A.; Ichimaru, Y.; Kobayashi, M.; Yano, S.; Holmeslet, B.; Hansen, T.L.; Mitsutake, G.; et al. Alternating Light-Darkness-Influenced Human Electrocardiographic Magnetoreception in Association with Geomagnetic Pulsations. Biomed. Pharmacother. 2001, 55, 63–75. [Google Scholar] [CrossRef] [PubMed]
  67. Alabdulgader, A.; McCraty, R.; Atkinson, M.; Dobyns, Y.; Stolc, V.; Ragulskis, M. Long-term study of heart rate variability responses to changes in the solar and geomagnetic environment. Sci. Rep. 2018, 8, 2663. [Google Scholar] [CrossRef]
  68. Gmitrov, J.; Ohkubo, C. Geomagnetic field decreases cardiovascular variability. Electro Magnetobiol. 1999, 18, 291–303. [Google Scholar] [CrossRef]
  69. Caswell, J.M.; Singh, M.; Persinger, M.A. Simulated sudden increase in geomagnetic activity and its effect on heart rate variability: Experimental verification of correlation studies. Life Sci. Space Res. 2016, 10, 47–52. [Google Scholar] [CrossRef]
  70. Lednev, V.V.; Belova, N.A.; Ermakov, A.M.; Akimov, E.B.; Tonevitsky, A.G. Modulation of cardiac rhythm in the humans exposed to extremely weak alternating magnetic fields. Biophysics 2008, 53, 648–654. [Google Scholar] [CrossRef]
  71. Vasin, A.L.; Shafirkin, A.V.; Gurfinkel, Y.I. Effect of artificial alternating geomagnetic field in the millihertz range on the heart rate variability indices. Aviakosmicheskaya I Ekol. Meditsina 2019, 53, 62–69. (In Russian) [Google Scholar] [CrossRef]
  72. Lukyanova, S.N. Neuroeffects of Microwave EMF Range of Non-Thermal Intensity and Short Exposure. Radiat. Biology. Radioecol. 2024, 64, 244–256. [Google Scholar] [CrossRef]
  73. Halberg, F.; Cornelissen, G.; Otsuka, K.; Watanabe, Y.; Katinas, G.S.; Burioka, N.; Delyukov, A.; Gorgo, Y.; Zhao, Z.; Weydahl, A.; et al. Cross-spectrally coherent ~10,5- and 21-year biological and physical cycles, magnetic storms and myocardial infarctions. Neuroendocrinol. Lett. 2000, 21, 233–258. [Google Scholar]
  74. Presman, A.S. Electromagnetic Field and Wildlife; Nauka: Moscow, Russia, 1968; p. 310. (In Russian) [Google Scholar]
  75. McCraty, R.; Atkinson, M.; Timofejeva, I.; Joffe, R.; Vainoras, A.; Landauskas, M.; Alabdulgader, A.; Ragulskis, M. The influence of heart coherence on synchronization between human heart rate variability and geomagnetic activity. J. Complex. Health Sci. 2018, 1, 42–48. [Google Scholar] [CrossRef]
  76. Poskotinova, L.; Krivonogova, E.; Demin, D.; Zenchenko, T. Differences in the Sensitivity of the Baroreflex of Heart Rate Regulation to Local Geomagnetic Field Variations in Normotensive and Hypertensive Humans. Life 2022, 12, 1102. [Google Scholar] [CrossRef] [PubMed]
  77. Pobachenko, S.V.; Kolesnik, A.G.; Borodin, A.S.; Kalyuzhin, V.V. The contingency of parameters of human encephalograms and Schumann resonance electromagnetic fields revealed in monitoring studies. Biophysics 2006, 51, 480–483. [Google Scholar] [CrossRef]
  78. Kleimenova, N.G.; Gromova, L.I.; Gromov, S.V.; Malysheva, L.M. Large Magnetic Storm on September 7–8, 2017: High-Latitude Geomagnetic Variations and Geomagnetic Pc5 Pulsations. Geomagn. Aeron. 2018, 58, 597–606. [Google Scholar] [CrossRef]
  79. Kleimenova, N.G.; Gromova, L.I.; Gromov, S.V.; Malysheva, L.M. The Magnetic Storm of August 25–26, 2018: Dayside High Latitude Geomagnetic Variations and Pulsations. Geomagn. Aeron. 2019, 59, 660–667. [Google Scholar] [CrossRef]
  80. Tsurutani, B.T.; Zank, G.P.; Sterken, V.J.; Shibata, K.; Nagai, T.; Mannucci, A.J. Space Plasma Physics: A Review. IEEE Trans. Plasma Sci. 2023, 51, 1595–1655. [Google Scholar] [CrossRef]
  81. Viall, N.M.; Kepko, L.; Spence, H.E. Relative occurrence rates and connection of discrete frequency oscillations in the solar wind density and dayside magnetosphere. J. Geophys. Res. 2009, 114, A01201. [Google Scholar] [CrossRef]
  82. Klibanova, Y.Y.; Mishin, V.V.; Tsegmed, B.; Moiseev, A.V. Properties of daytime long-period pulsations during magnetospheric storm commencement. Geomagn. Aeron. 2016, 56, 426–440. [Google Scholar] [CrossRef]
  83. Zenchenko, T.A.; Khorseva, N.I.; Breus, T.K. Long-Term Study of the Synchronization Effect between Geomagnetic Field Variations and Minute-Scale Heart-Rate Oscillations in Healthy People. Atmosphere 2024, 15, 134. [Google Scholar] [CrossRef]
  84. Hajra, R.; Tsurutani, B.T.; Lakhina, G.S.; Lu, Q.; Du, A. Interplanetary causes and impacts of the 2024 May superstorm on the geosphere: An overview. Astrophys. J. 2024, 974, 264. [Google Scholar] [CrossRef]
  85. Smolentsev, N.K. Fundamentals of wavelet theory. In Wavelets in MATLAB; DMK Press: Moscow, Russia, 2009; p. 448. [Google Scholar]
  86. Zenchenko, T.A.; Khorseva, N.I.; Stankevich, A.A. The Effect of Synchronizing the Human Heart Rhythm with Geomagnetic Field Variations: Are There Particular Frequencies? Biophysics 2024, 69, 792–802. [Google Scholar]
  87. Elhalel, G.; Price, C.; Fixler, D.; Shainberg, A. Cardioprotection from stress conditions by weak magnetic fields in the Schumann resonance band. Sci. Rep. 2019, 9, 1645. [Google Scholar] [CrossRef] [PubMed]
  88. Grinberg, M.; Mudrilov, M.; Kozlova, E.; Sukhov, V.; Sarafanov, F.; Evtushenko, A.; Ilin, N.; Vodeneev, V.; Price, C.; Mareev, E. Effect of extremely low-frequency magnetic fields on light-induced electric reactions in wheat. Plant Signal. Behav. 2022, 17, 2021664. [Google Scholar] [CrossRef] [PubMed]
  89. Anagnostopoulos, G.; Basta, M.; Stefanakis, Z.; Vassiliadis, V.; Vgontzas, A.; Rigas, A.; Koutsomitros, S.; Baloyannis, S.; Papadopoulos, G. A study of correlation between seismicity and mental health: Crete, 2008–2010. Geomat. Nat. Hazards Risk 2013, 6, 45–75. [Google Scholar] [CrossRef]
  90. Cherry, N. Schumann Resonances, a plausible biophysical mechanism for the human health effects of Solar. Nat. Hazards 2002, 26, 279–331. [Google Scholar] [CrossRef]
  91. Krylov, V.V.; Osipova, E.A. Molecular Biological Effects of Weak Low-Frequency Magnetic Fields: Frequency–Amplitude Efficiency Windows and Possible Mechanisms. Int. J. Mol. Sci. 2023, 24, 10989. [Google Scholar] [CrossRef]
  92. Moiseev, A.V.; Baishev, D.G.; Barkova, E.S.; Du, A.; Yumoto, K. Specific features of the generation of long-periodic geomagnetic pulsations in the event on June 25, 2008. Cosmic. Res. 2015, 53, 111–118. [Google Scholar] [CrossRef]
  93. Kozyreva, O.; Pilipenko, V.; Engebretson, M.J.; Yumoto, K.; Watermann, J.; Romanova, N. In search of a new ULF wave index: Comparison of Pc5 power with dynamics of geostationary relativistic electrons. Planet. Space Sci. 2007, 55, 755–769. [Google Scholar] [CrossRef]
Figure 1. (a) Time series of Dst index on 24–27 September 2023. Green circles show experiments with Q > 0.4, red circles—Q < 0.4; and (b) distribution of the relative number of experiments with Q > 0.4 by date.
Atmosphere 16 00219 g001
Figure 2. (a) Time series of Dst index on 10–15 May 2024. Green—Q > 0.4, red—Q < 0.4. Circles—Volunteer A, triangles—Volunteer B; and (b) distribution of the relative number of experiments with Q > 0.4 by date.
Atmosphere 16 00219 g002
Figure 3. (a) Time series of Dst index on 10–13 October 2024. Green—Q > 0.4, red—Q < 0.4. Circles—Volunteer A, triangles—Volunteer B; and (b) distribution of the relative number of experiments with Q > 0.4 by date.
Atmosphere 16 00219 g003
Figure 4. Examples of time series depicting the minute values of the H-component of the GMF observed at the Nurmijarvi (NURH, blue), Mocsow (MOSH, red) and Surlary (SUAH, green) geophysical stations after application of a band-pass filter. (a)—Experiment 11 May 2024, 16:37 UT + 3 h, Dst = −292 nT. (b)—Experiment 12 October 2024, 10:00 UT + 3 h, Dst = −71 nT. (c)—Experiment 13 October 2024, 11:00 UT + 3 h, Dst = −29 nT.
Atmosphere 16 00219 g004aAtmosphere 16 00219 g004b
Figure 5. An example of the wavelet transformation of the biological and geophysical time series in the experiment 12 October 2024, begin 10:00 (UT + 3 h): (a) wavelet image of HR series of Volunteer A; (b) wavelet image of HR series of Volunteer B; (c) wavelet image of GMF vector H; and (df) vectors [g] and [h] as a result of averaging the wavelet matrices of HR and MOSH series.
Atmosphere 16 00219 g005aAtmosphere 16 00219 g005b
Figure 6. Scatter plots of the relationships between the Q values for the total sample of experiments and the parameters of the geomagnetic environment: (a) Rp(NUR-SUA); (b) Ampl(NURH); and (c) Dst index.
Atmosphere 16 00219 g006
Table 1. The pairwise correlation coefficients Q-Rp, Q-Ampl, Q-Dst, for the total sample of experiments (“All”) and five independent partial samples. Bold indicates cases where p < 0.05.
AllVol AVol B09/202305/202410/2024
n613922162223
Rs (Q-Rp)0.5310.4570.6790.2910.6250.562
p(Q-Rp)10−50.0030.00050.2730.00140.004
Rs(Q-Ampl)−0.214−0.162−0.3850.438−0.323−0.284
p(Q-Ampl)0.0980.3230.0760.0910.1330.177
Rs(Q-Dst)0.3130.3050.5340.3850.4420.136
p(Q-Dst)0.0140.0590.0100.1410.0350.525
Disclaimer/Publisher’s Note: The statements, opinions and data contained in all publications are solely those of the individual author(s) and contributor(s) and not of MDPI and/or the editor(s). MDPI and/or the editor(s) disclaim responsibility for any injury to people or property resulting from any ideas, methods, instructions or products referred to in the content.

