Article

The Impact of Farming Mitigation Measures on Ammonia Concentrations and Nitrogen Deposition in the UK

1
Ricardo Energy & Environment, 18 Blythswood Square, Glasgow G2 4BG, UK
2
Ricardo Energy & Environment, 30 Eastbourne Terrace, London W2 6LA, UK
*
Author to whom correspondence should be addressed.
Atmosphere 2025, 16(4), 353; https://doi.org/10.3390/atmos16040353
Submission received: 20 December 2024 / Revised: 7 February 2025 / Accepted: 13 March 2025 / Published: 21 March 2025
(This article belongs to the Special Issue Transport, Transformation and Mitigation of Air Pollutants)

Abstract

:
Ammonia (NH3) is an important precursor to airborne fine particulate matter (PM2.5) which causes significant health issues and can significantly impact terrestrial and aquatic ecosystems through deposition. The largest source of NH3 emissions in the UK is agriculture, including animal husbandry and NH3-based fertilizer applications. This study investigates the impact of mitigation measures targeting UK NH3 emissions from farming activities, focusing on their implications for air quality and nitrogen deposition in 2030. A series of mitigation scenarios—low2030, medium2030, and high2030—were developed through engagement with stakeholders, including farmers, advisers, and researchers, and their impact was modelled using the CMAQ air quality model. These scenarios represent varying levels of the uptake of mitigation measures compared to a baseline (base2030). The results indicate that reductions in total NH₃ emissions across the UK could reach up to 13% under the high2030 scenario (but reaching nearly 20% for some regions). These reductions can lead to significant decreases in NH₃ concentrations in some parts of the UK (up to 22%, ~1.2 µg/m3) but with a mean reduction of 8% across the UK. However, the reductions have a limited effect on fine ammonium particulate ( N H 4 + ) concentrations, achieving only modest reductions of up to 4%, with mean reductions of 1.6–1.9% due to a NH3-rich atmosphere. Consequently, the mitigation measures have minimal impact on secondary inorganic aerosol formation and PM2.5 concentrations, aligning with findings from other studies in Europe and beyond. These results suggest that addressing the primary sources of PM2.5 or other PM2.5 precursors, either alone or in combination with NH3, may be necessary for more substantial air quality improvements. In terms of nitrogen (N) deposition, reductions in NH3 emissions primarily affect NH3 dry deposition, which constitutes approximately two-thirds of reduced nitrogen deposition. Total N deposition declines by 15–18% in source regions depending on the scenario, but national average reductions remain modest (~4%). While the study emphasizes annual estimates, further analyses focusing on finer temporal scales (e.g., daily or seasonal) could provide additional insights into exposure impacts. This research highlights the need for integrated mitigation strategies addressing multiple pollutants to achieve meaningful reductions in air pollution and nitrogen deposition.

Graphical Abstract

1. Introduction

Air pollution is a global concern, affecting the environment, human health, and ecosystems. Among the atmospheric pollutants, ammonia (NH3) stands out as a potent yet often overlooked contributor.
NH3 is a gas that is emitted into the atmosphere. Most NH3 emissions in the UK come from agriculture through the spreading of manures, slurries (semi-liquid manure), and fertilisers [1]. A smaller portion of NH3 emissions stem from waste and a range of diffuse sources like synthetic fertilizers (particularly urea), and non-agricultural sources such as sewage, catalytic converters, wild animals, and industrial processes.
NH3 only stays in the atmosphere for a few hours once emitted [2,3,4,5]. However, when NH3 mixes with other gases in the atmosphere, such as nitrogen oxides (NOx) and sulphur dioxide (SO2), it can form particulate matter (PM) which can persist for several days and be transported large distances. There are major health concerns linked to exposure to fine airborne particulate matter (PM2.5), to which NH3 is an important contributor [6,7]. This PM2.5 comprises particles with a diameter lower than 2.5 µm that infiltrate our lungs and bloodstream [8,9]. Indeed, secondary PM2.5 aerosol consists of secondary organic aerosols (SOAs) related to anthropogenic and biogenic volatile organic compounds (VOCs), and also secondary inorganic aerosols (SIAs) which gather sulphate ( S O 4 2 + ) , nitrate ( N O 3 ), and ammonium ( N H 4 + ). This N H 4 + is formed through chemical reactions from NH3. NH3 also reacts with acidic compounds such as sulfuric acid (H2SO4) and nitric acid (HNO3), forming ammonium sulphate ((NH4)2SO4) and ammonium nitrate (NH4NO3), which are significant constituents of PM2.5.
Thus, NH3 plays a dual role. On the one hand, it sustains food production by providing essential nitrogen (N) for crops. On the other, it impacts the atmosphere, setting off a chain of chemical reactions that lead to the formation of PM2.5.
NH3 is not normally directly harmful to human health at typical outdoor air concentrations but is an important contributor to PM2.5 and can also have significant impacts on the natural environment, both directly and by contributing to acid and nitrogen deposition. Indeed, NH3 is known to contribute significantly to total N deposition into the environment [10,11,12]. In addition, reduced N gases and aerosols (NH3 and N H 4 + , abbreviated as RDN), act as powerful plant and microorganism nutrients when deposited into aquatic and terrestrial ecosystems. Excessive N can lead to an exceedance of N critical loads, which in turn can lead to eutrophication and the loss of ecosystem productivity and biodiversity [13,14].
Mitigating NH3 emissions is particularly important in the UK since the UK is a signatory of the United Nations Economic Commission for Europe (UNECE) Gothenburg protocol, legislated through the UK National Emission Ceilings Regulations adopted in 2018 [15]. In addition, the UK, with its diverse agricultural activities, transportation emissions, and industrial processes, is a notable region for studying the impact of NH3 on PM2.5 concentrations.
A previous review of agricultural interventions in the UK also identified a gap in the understanding of the level of the implementation of mitigation actions, the potential for future implementation, and the consequent impacts on public health [16]. This review highlighted the importance of evaluating the drivers and challenges facing farmers in introducing NH3 mitigation measures, in terms of understanding the limitations to uptake.
Given the complexity of atmospheric chemistry, numerical models, such as the atmospheric chemistry transport models (CTMs), are commonly used to simulate the processes involved and estimate the outcomes of plausible control strategies. The Community Multiscale Air Quality (CMAQ) model [17,18], developed and distributed by the US Environmental Protection Agency (EPA) is a state-of-the-science numerical air quality model with comprehensive representations of the emission, transport, formation, destruction, and deposition of many air pollutants, including NH3. Thus, the CMAQ model can be used to study the relationships between emissions such as NOx, NH3, and the wet and dry deposition of N since they simulate the main processes influencing the fate of atmospheric pollutants (turbulent dispersion, atmospheric chemistry, cloud processes, long-range transport, wet and dry deposition, etc.). Although they are no substitute for observations, CTM simulations have the advantage of estimating deposition rates for locations where there are no measurements and for processes for which measurements are difficult and/or sparse (e.g., dry deposition). They can also be used for simulating hypothetical scenarios, such as the effect of emission reduction strategies as carried out in this work.
This study considers a series of mitigation measures to understand the impact of emissions changes from farms across the UK on pollutant concentrations. The mitigation measures were modelled through scenarios which represented various levels of uptake (low–high) on farms across the UK in 2030 and were developed based on stakeholder engagement with farmers and stakeholders (i.e., farm advisers, academics, and farmer representatives) [19]. These measures are related to reducing emissions from the housing, storage, and spread of manure and slurry from the dairy, pig, and poultry sectors. This study has focused on the analysis of annual changes in NH3 concentrations and their role in PM2.5 formation and N deposition due to the uptake of different levels of intervention implementation of these farming activities. The methodology is described in Section 2. An evaluation of the NH3 and N H 4 + concentrations is presented in Section 3. Section 4 describes the changes in NH3 concentrations and N deposition due to the emissions reductions predicted in the different scenarios. Section 5 provides the conclusions and perspectives.

2. Methodology

2.1. Model Set-Up

To undertake the study, the CMAQ model version 5.4 [20] was used in this work. The chemical mechanism used for the gaseous species is the carbon bond mechanism (CB06r5) [21] combined with the aerosol mechanism using the 7th generation aerosol module (AERO7) [22].
Meteorological fields have been generated with the Weather Research and Forecast (WRF) model version 4.5. The following configuration for WRF was used: the Rapid Radiation Transfer Model Global (RRTMG) for longwave [23] and Dudhia for shortwave radiation [24], ACM2 for the PBL scheme [25,26] with the Pleim-Xiu surface layer scheme [27], the Rapid Update Cycle Land-Surface Model [28], the Kain–Fritsch (KF) cumulus parametrization scheme [29], and the Noah-modified 21-category IGBP-MODIS land use.
In the CMAQ configuration used in this study, the dry deposition of gaseous species is simulated utilizing deposition velocity and the M3Dry aerosol deposition parameterization has been used [30]. As explained in [30,31], the M3Dry dry deposition calculations performed in CMAQ are designed to maintain maximum consistency with the flux calculations performed in the WRF Pleim-Xiu land surface model. The M3Dry calculations are performed on a grid-scale basis. Dry deposition is computed by electrical resistance analogy where concentration gradients are analogous to voltage, flux is analogous to current, and deposition resistance is analogous to electrical resistance [32]. It is important to note the bidirectional NH3 surface flux was not enabled in the configuration since no development in this parameterization has been undertaken for this study.
The calculation of biogenic emissions has used an online module incorporated in CMAQ. This uses the Model of Emissions of Gases and Aerosols from Nature (MEGAN) (version 3.2) [33].
The domain design follows a nested approach involving dividing a large geographic domain into smaller, nested grids, with each grid representing a progressively finer level of detail. This hierarchical structure allows us to capture more detailed variations in emissions and meteorology. A 50 km horizontal resolution over Europe (EU50) has been selected as the outer domain while the studied domain over the UK is characterized by a 10 km horizontal resolution (UK10), as shown in Figure 1.
The selected meteorological year feeding the air quality simulation was 2019. This 2019 simulation was used for model performance evaluation. It is worth noting that 2019 can be seen as a typical meteorological year in the UK since it was not a stormier year compared to recent decades, there was no abnormal wind speed record, and it was not drastically wetter than the previous 20-year period (1% wetter than 1981–2010) [34]. Even if 2019 was the 12th warmest year for the UK in a series from 1884; it is worth noting that all the top 10 warmest years for the UK in this series are recent since they have occurred since 2002. This shows that 2019 was not an abnormal year in terms of temperature for this recent decade. The year 2019 was also the most recent UK emissions year at the beginning of the project. Since the objective of the study is to analyse the impact of mitigation measures in agriculture and not future climate conditions, no climate projections have been tested in this work.
The air quality simulation started with a spin-up period of 2 weeks. The simulations were defined as “forecast-cycling experiments”; i.e., the calculated fields have been used to initialize the successive (following-day) simulation [35] and the full year 2019 is calculated for both domains.
The initial and boundary conditions for the outer domain (EU50) are based on prescribed concentrations representative of annual background conditions provided by the US EPA [36]. Then, the CMAQ concentrations calculated within this EU50 domain were used as boundary conditions for the UK10 domain.

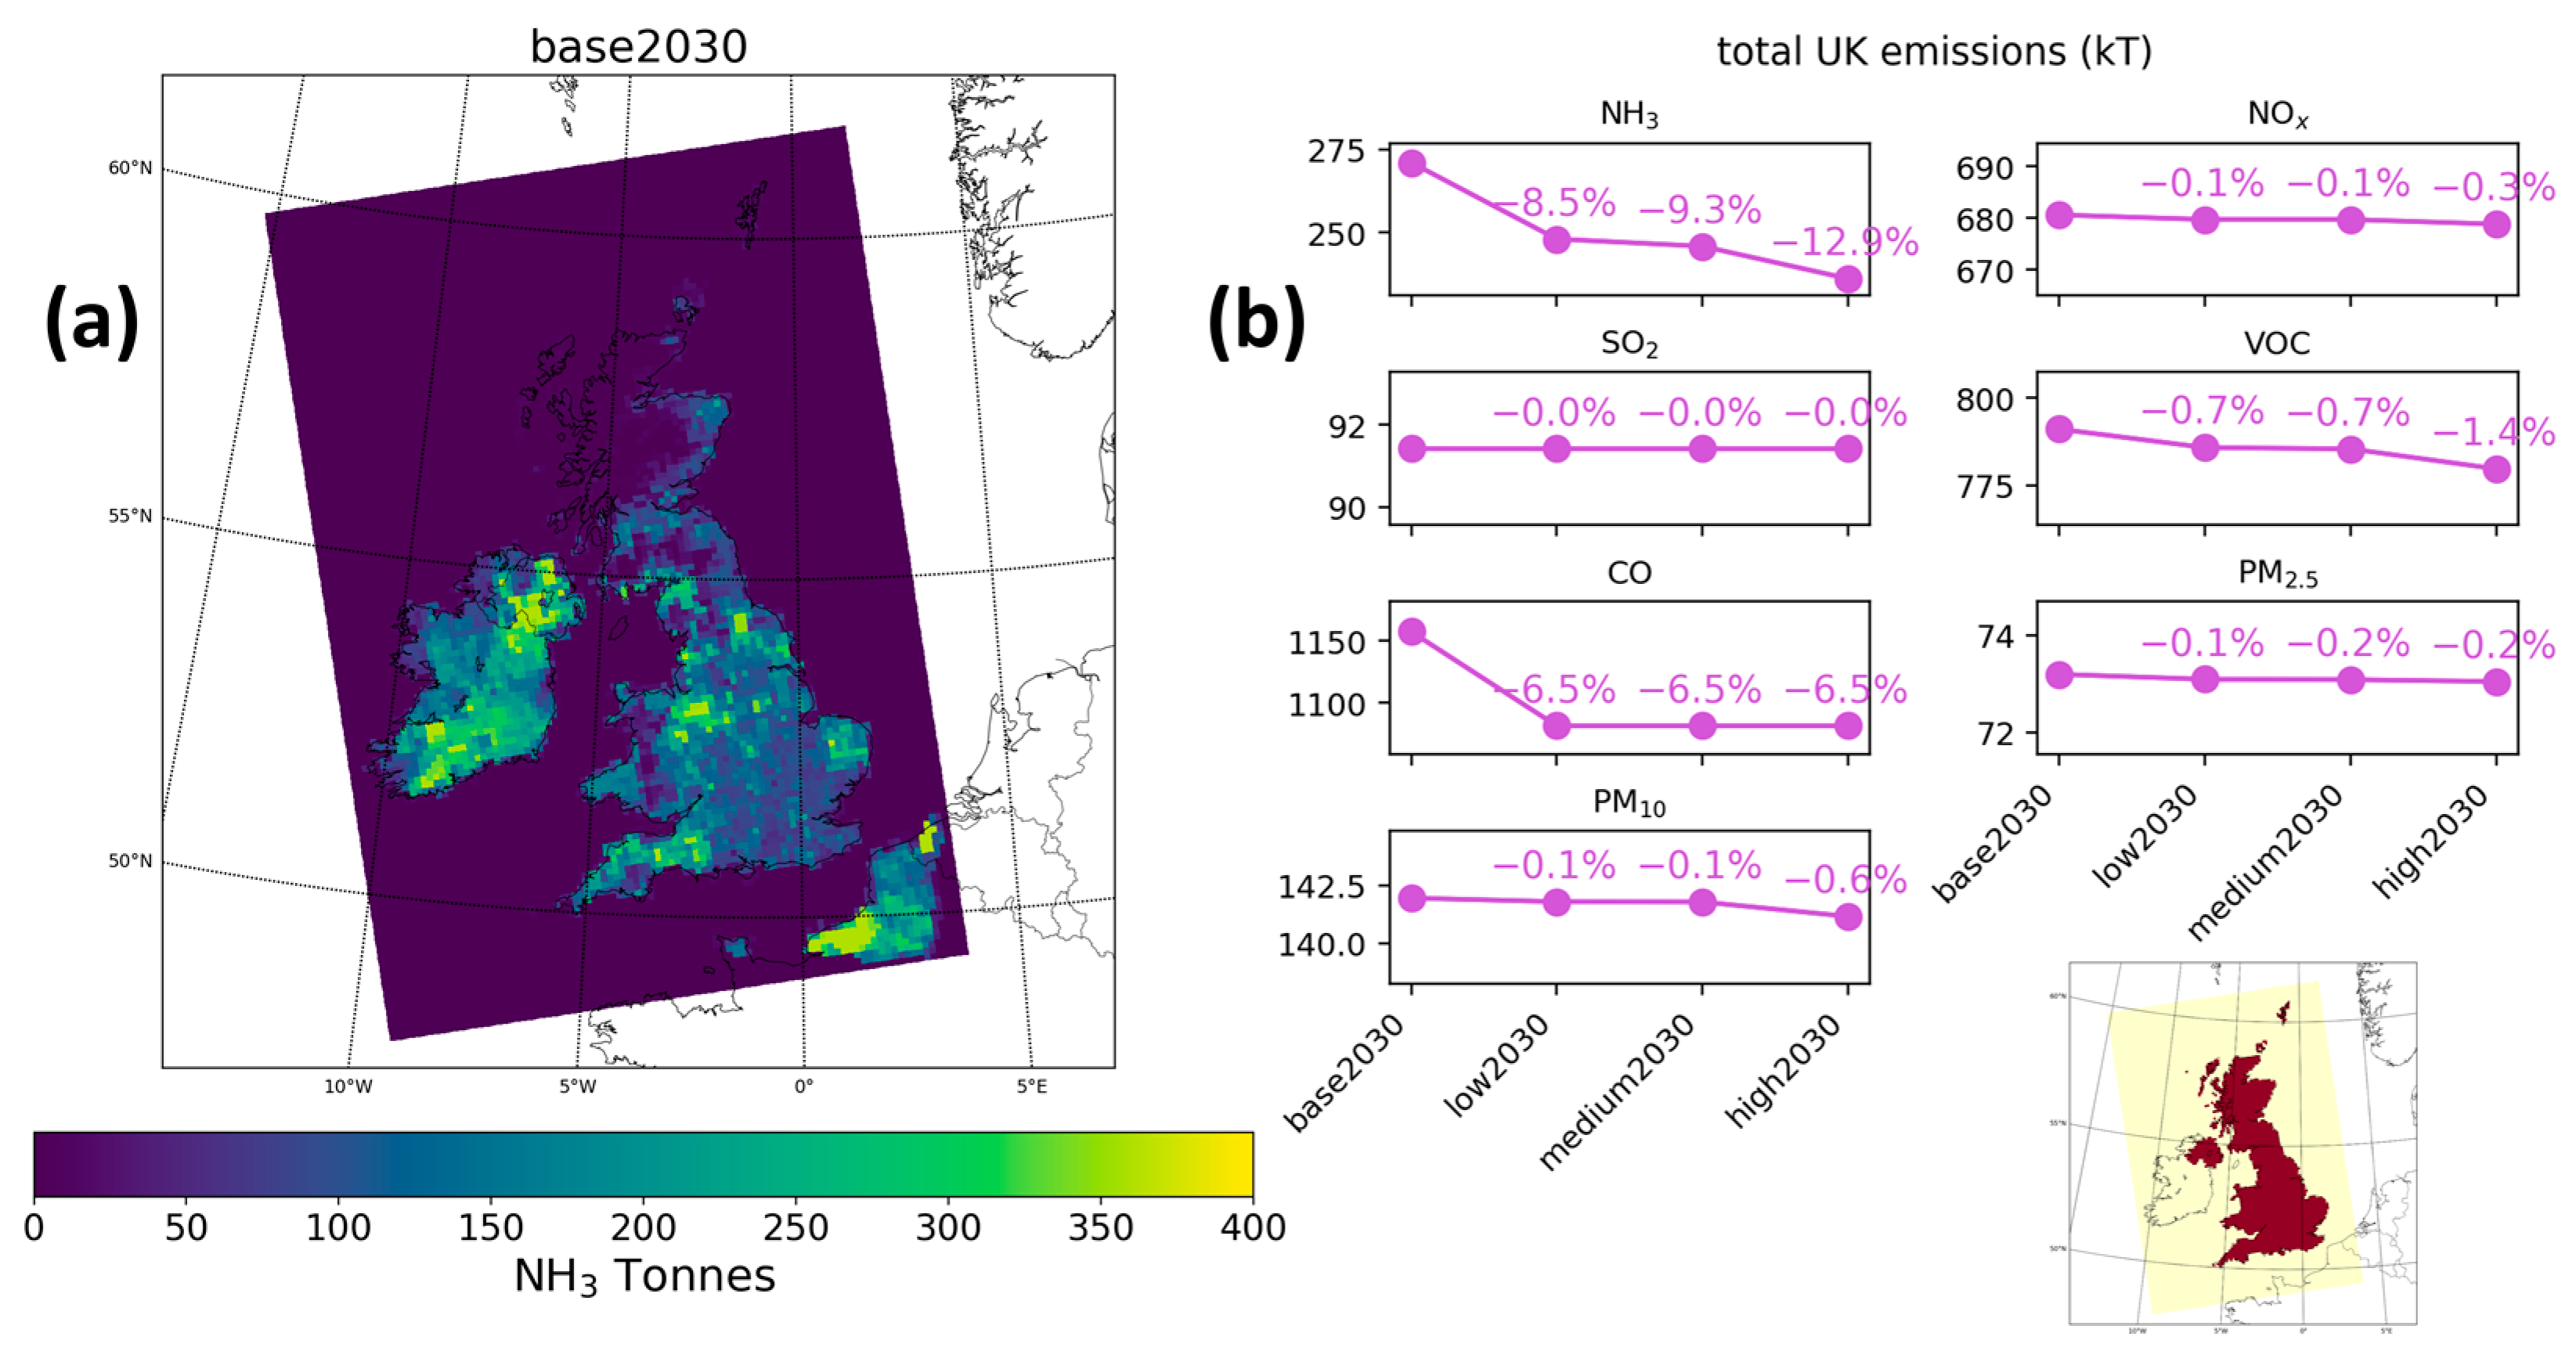
2.2. Emission Scenarios

The study focused on three future scenarios in 2030 in the UK, in addition to the baseline; thus, only the emissions used for the UK scenarios vary and all use common boundary conditions corresponding to the baseline from the EU50 domain.
The baseline 2030 future scenario for the EU50 domain was based on the European Monitoring and Evaluation Programme (EMEP) [37] gridded emissions for 2019 and scaled with the factors provided by the GAINS ECLIPSE (Greenhouse Gas and Air Pollution INteractions and Synergies—Evaluating the Climate and Air Quality Impacts of Short-Lived Pollutants) V6b Baseline CLE scenario [38]. All the UK10 emissions for the scenarios were built using the Scenario Modelling Tool [39].
The 0.1 × 0.1-degree-resolution anthropogenic data from EMEP were post-processed into 50 × 50 km to populate the EU50 domain in CMAQ. The sectoral splits defined by EMEP were used and temporally allocated to the emissions by sector. The speciation profiles required by CMAQ were also used.
Anthropogenic emissions across the UK, including from agriculture, are based on the gridded emissions from the UK National Atmospheric Emission Inventory (NAEI) for 2019 [40]. The 1 km × 1 km grids were resampled into 10 × 10 km emission grids for the UK10 domain. The 2019 large-point-source emission inventory was also used to vertically allocate the emissions in the CMAQ grid.
Except for the UK 2030 baseline, all UK scenarios included the same measures and increasing the uptake of these measures reflects an increased ambition to mitigate air pollutants across the low, medium, and high uptake scenarios. To simplify the terminology, these scenarios are hereinafter named base2030, low2030, medium2030, and high2030.
The scenarios focus on implementing mitigation measures on dairy, pig, and poultry farms. The uptake scenarios were developed through stakeholder engagement with farmers and stakeholders and the details on the design of these scenarios are described in [19]. These scenarios included 19 mitigation measures, and 2030 was selected as a realistic timeline for the practical implementation of new activities on farms. The selection of mitigation actions focused on controlling NH3 emissions and included actions related to livestock diet, livestock housing, air filtration, and the improved storage and spread of solid and liquid livestock manures as shown in [41].
The 10 × 10 km gridded NH3 emissions for base2030 used in CMAQ are shown in Figure 2a. The NH3 area sources are well highlighted by the map in Figure 2a. These source regions are mainly located in Northern Ireland, Staffordshire–West Midlands, Suffolk, Cornwall, and Devon to cite a few in the UK.
The scenarios mainly target the NH3 emissions, which are characterized by a larger decrease (in the total emissions) compared to the base2030, by 8.5%, 9.3%, and 12.9% for the low2030, medium2030, and high2030 scenario, respectively (see Figure 2b). It is worth noting that for some locations, the decreases in NH3 emissions reach up to 20%, 22%, and 24% for the low2030, medium2030, and high2030 scenarios, respectively (Figure S1). Carbon monoxide (CO) emissions are predicted to be constant for all of the scenarios and are 6.5% lower than the base2030 emissions. The other emissions (VOCs, PM10, PM2.5, SO2, and NOx) do not vary significantly. Slightly larger decreases in emissions are calculated for the high2030 scenario for VOCs and PM10, while the changes in NOx and PM2.5 remain marginal, and are null for SO2.

3. Evaluation

For the evaluation of the modelled concentrations, only NH3 measurement data from rural background measurement sites with at least 90% data capture in the year were used to avoid bias. The observations are taken from the UK AIR platform including observations of the UK Eutrophying and Acidifying Atmospheric Pollutants (UKEAP) network and from Monitor for AeRosols and Gases in Air (MARGA) instruments [42]. This represents a total of 45 stations. The CMAQ annual map and comparison with observations at the measurement sites are shown in Figure 3.
This comparison shows CMAQ fairly represents the annual mean distribution of the NH3 concentrations in 2019 (r ~0.4) with a small underestimation (MB ~0.2 µg/m3; NMB ~10%), a low mean relative error (MRE < 0.9%), and a reasonable root mean square error (RMSE ~1.6 µg/m3). These statistics are explained in Appendix A.
The result of the RMSE needs to be kept in perspective since most of the annual mean measured concentrations are relatively small except for Brompton station (with a measured concentration of 9.3 µg/m3), as shown on the map and the scatterplot. This comparison is relatively good with a somewhat coarse horizontal resolution and satisfactory especially knowing that a previous study [43] showed larger discrepancies with the same observations but using a global model with a coarser horizontal resolution (~25 km latitude × ∼31 km longitude). It is worth noting that a sensitivity simulation was undertaken by increasing the NH3 emissions by 50% since [43] suggested these emissions were underestimated by about half in comparison to satellite-derived estimates. This 50% increase was also applied by [44] for their calculation of UK PM2.5 concentrations. However, this recommendation leads to an overestimation of our modelled NH3 concentrations by ~38% (see Figure S2) and does not improve the PM2.5 simulations, as shown in [41].
The NH4+ concentrations were also evaluated. However, with the stringent criteria used for NH3, only two stations are available. Thus, a data capture of 75% was used and, for comparison, a similar evaluation of the NH3 concentrations using this new criterion is also shown. These results are presented in Figure S3, showing two groups of points, leading to an overall disagreement. However, the NH4+ concentrations from the model and the measurements remain low.
The meteorological conditions in the UK, as used in CMAQ, were well represented, as shown in the comparison with the measurements of the NOAA Integrated Surface Database (https://www.ncei.noaa.gov/products/land-based-station/integrated-surface-database, accessed on 31 January 2025) (Table S1). Despite the lower correlation in the wind direction (0.34), all parameters (wind direction, speed at 10 m, and temperature at 2 m) have a minimal bias and good IOA (0.5–0.7) (Table S1). These statistics might be further improved for future studies by using Newtonian nudging in the WRF model.

4. Analysis on Predictions

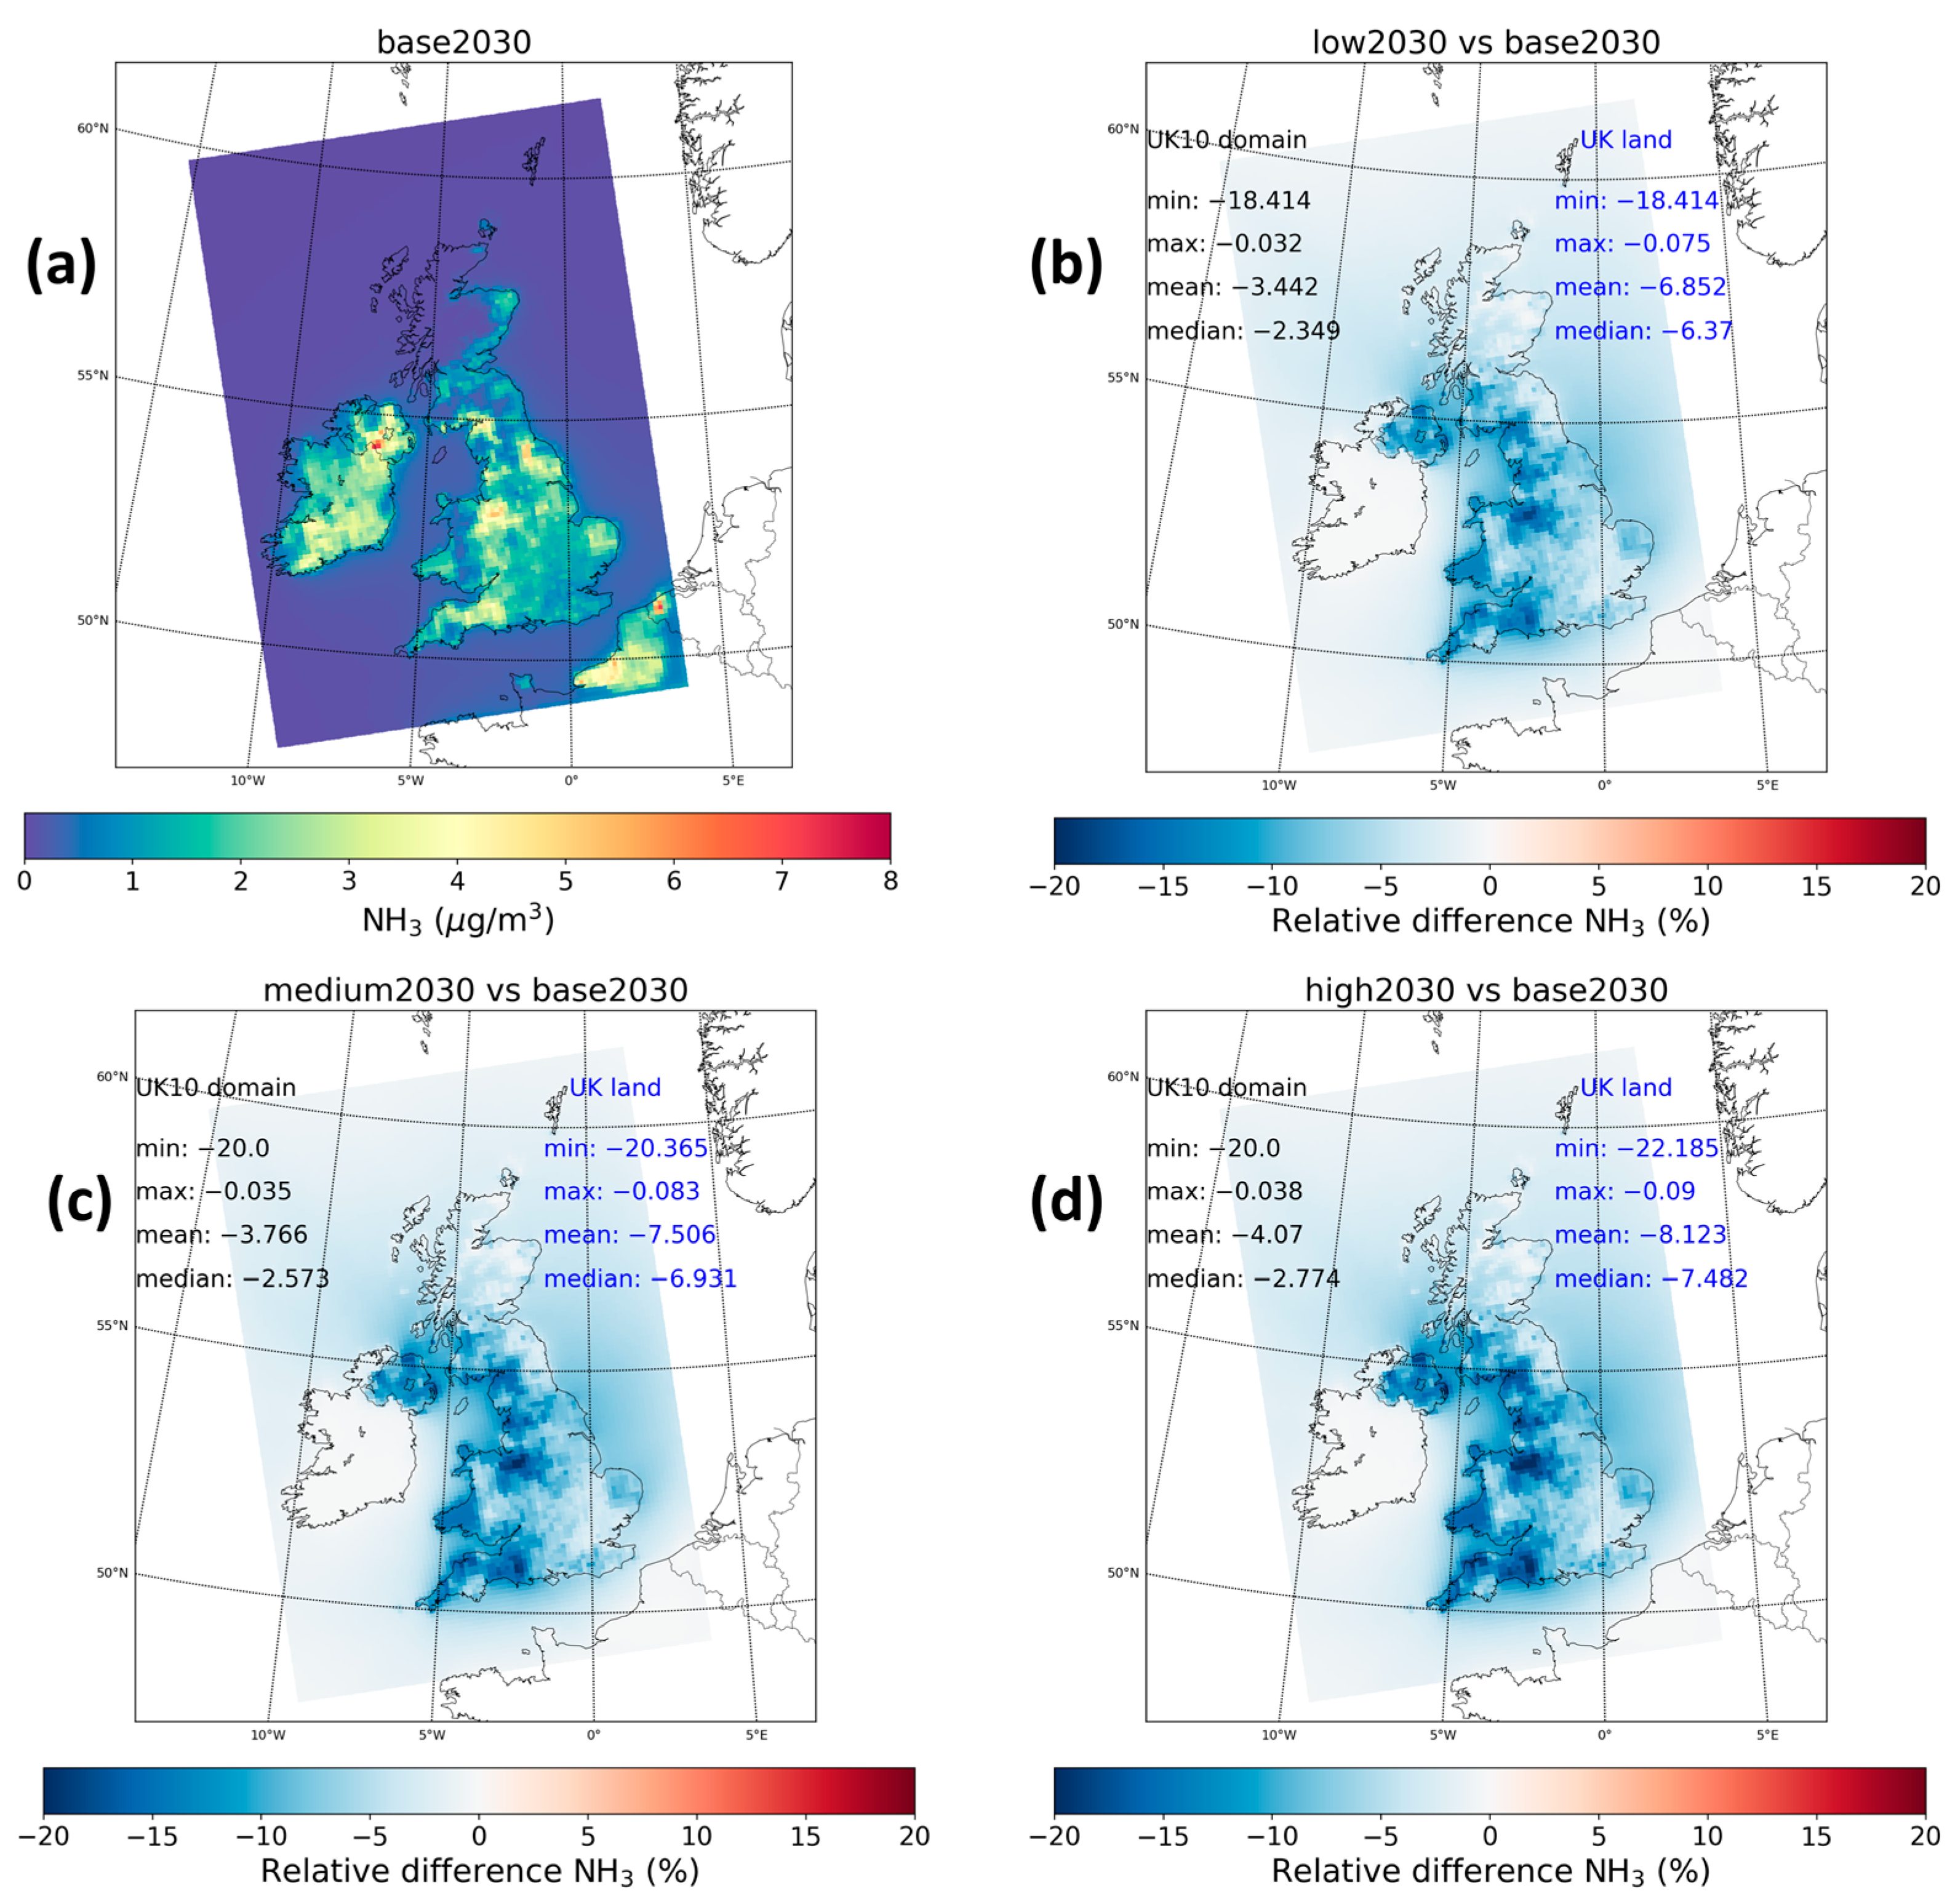
4.1. NH3 Concentrations
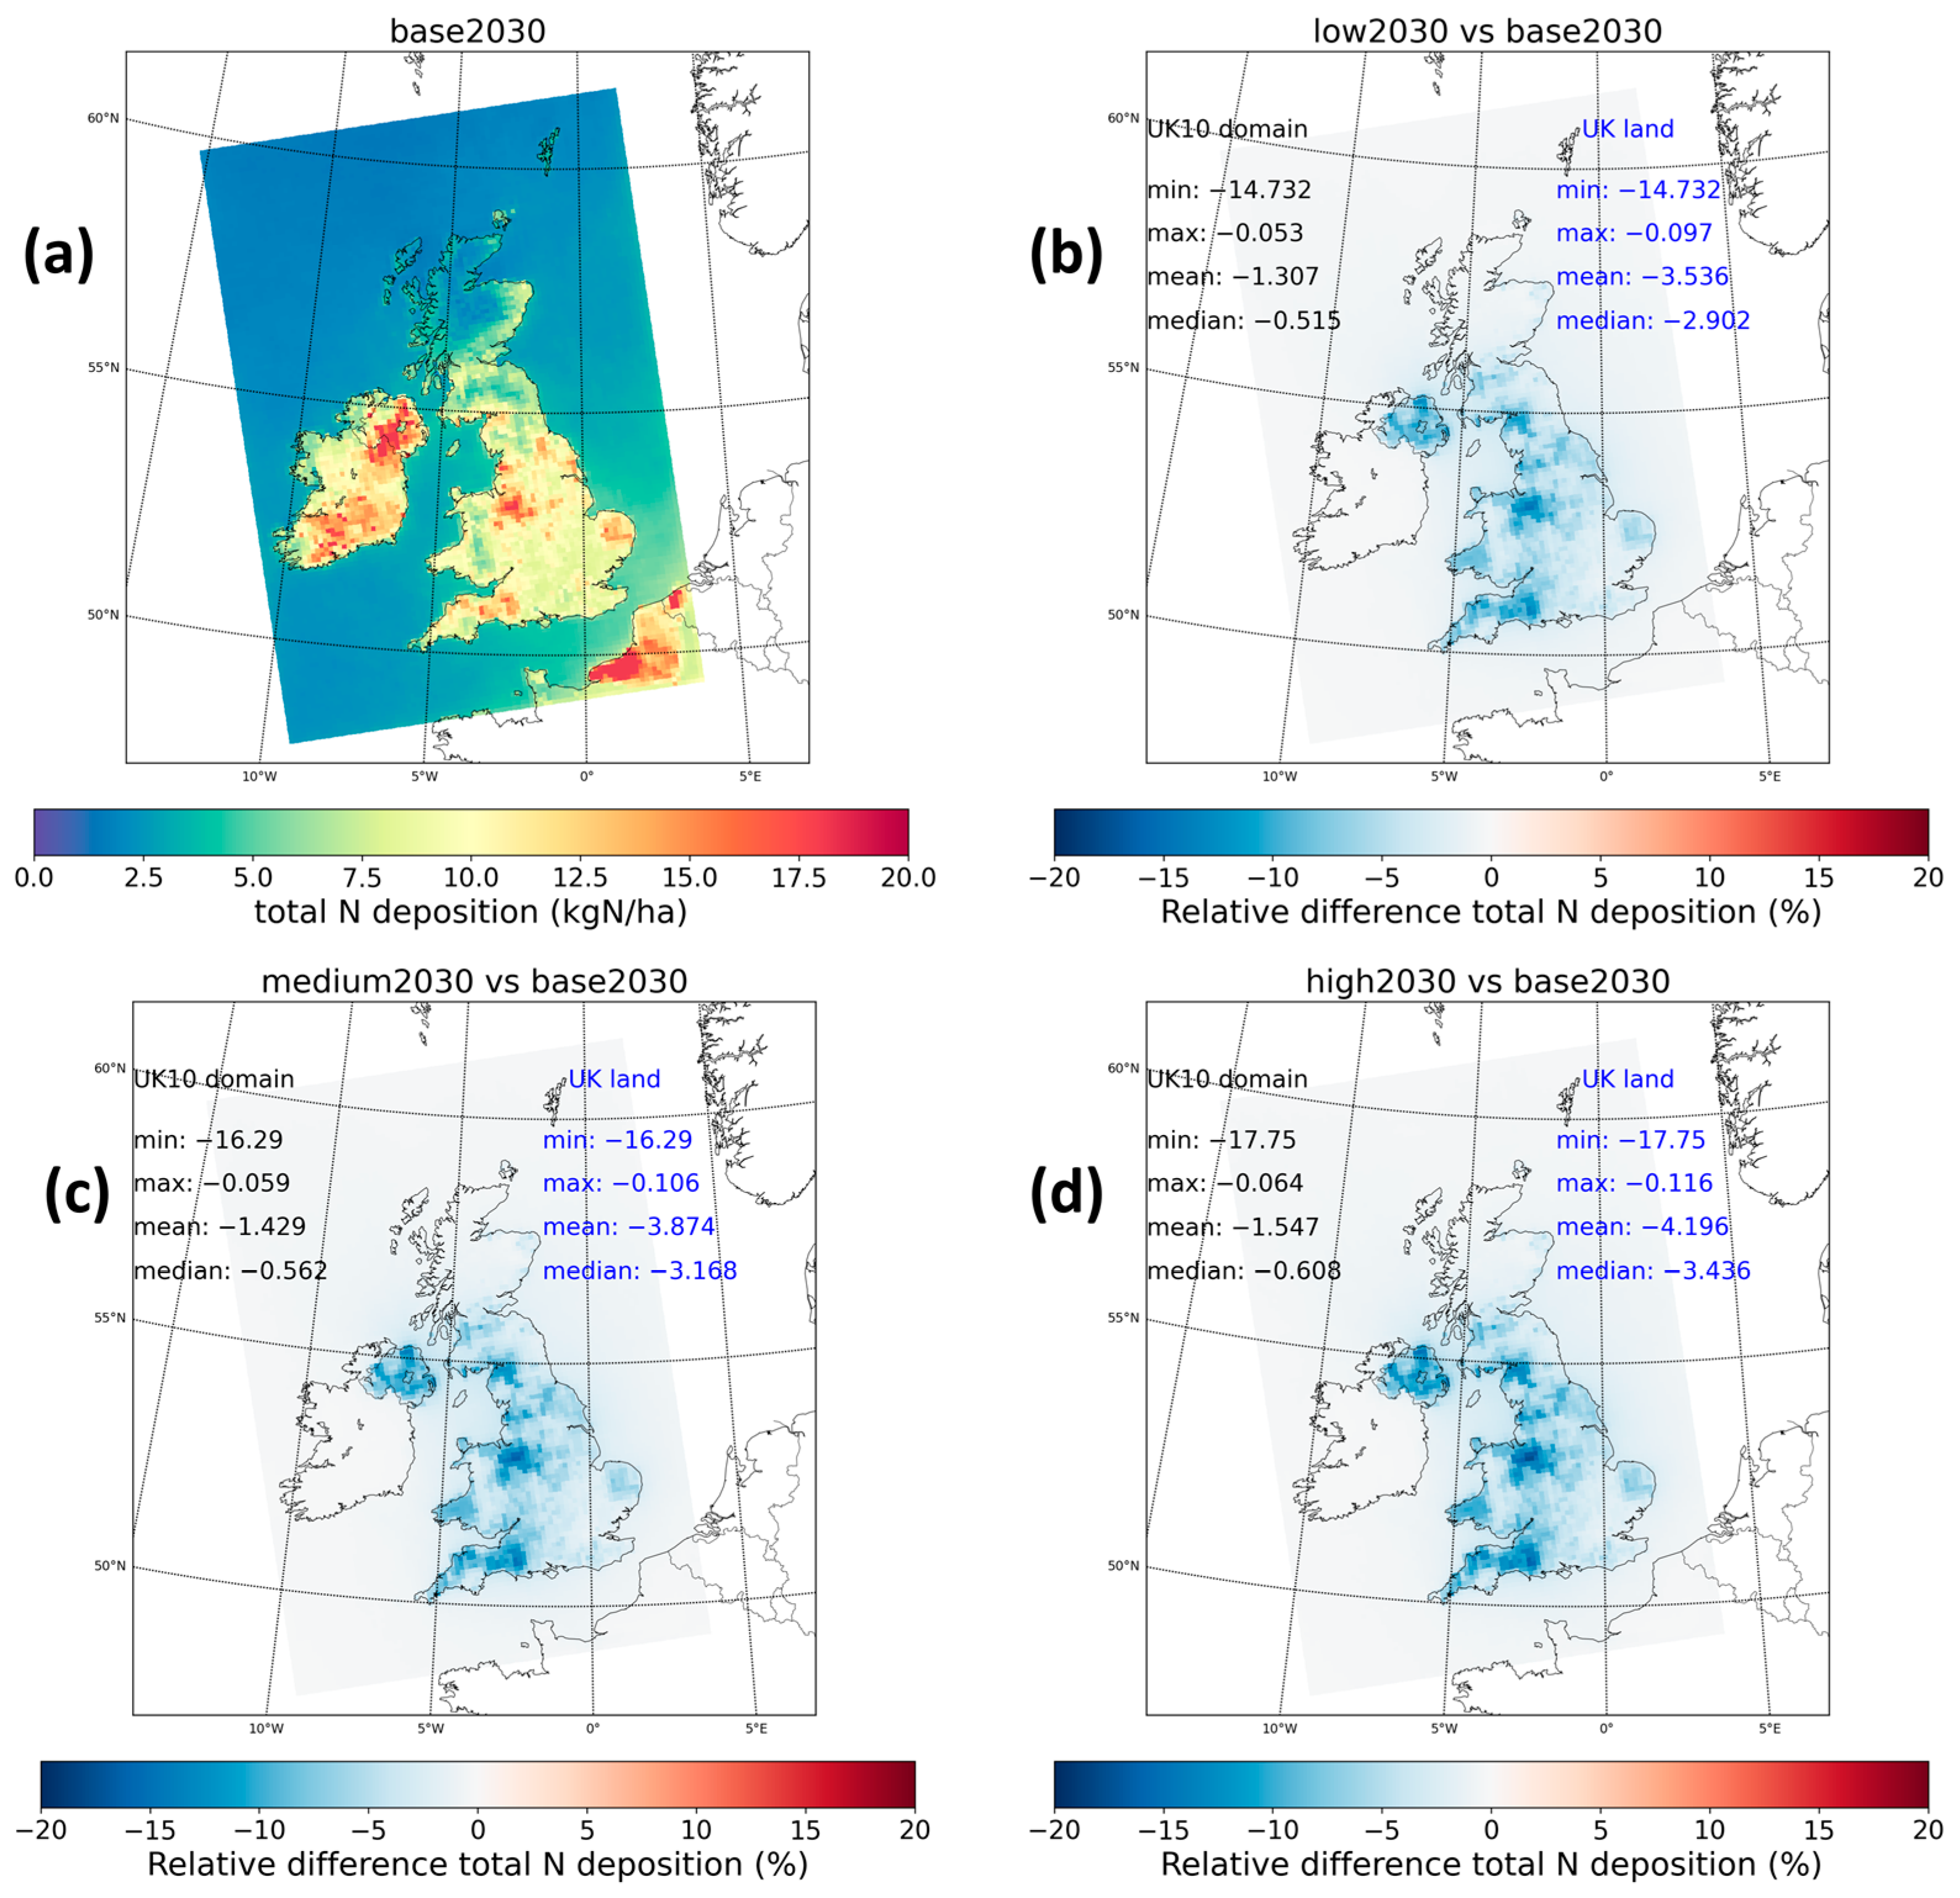
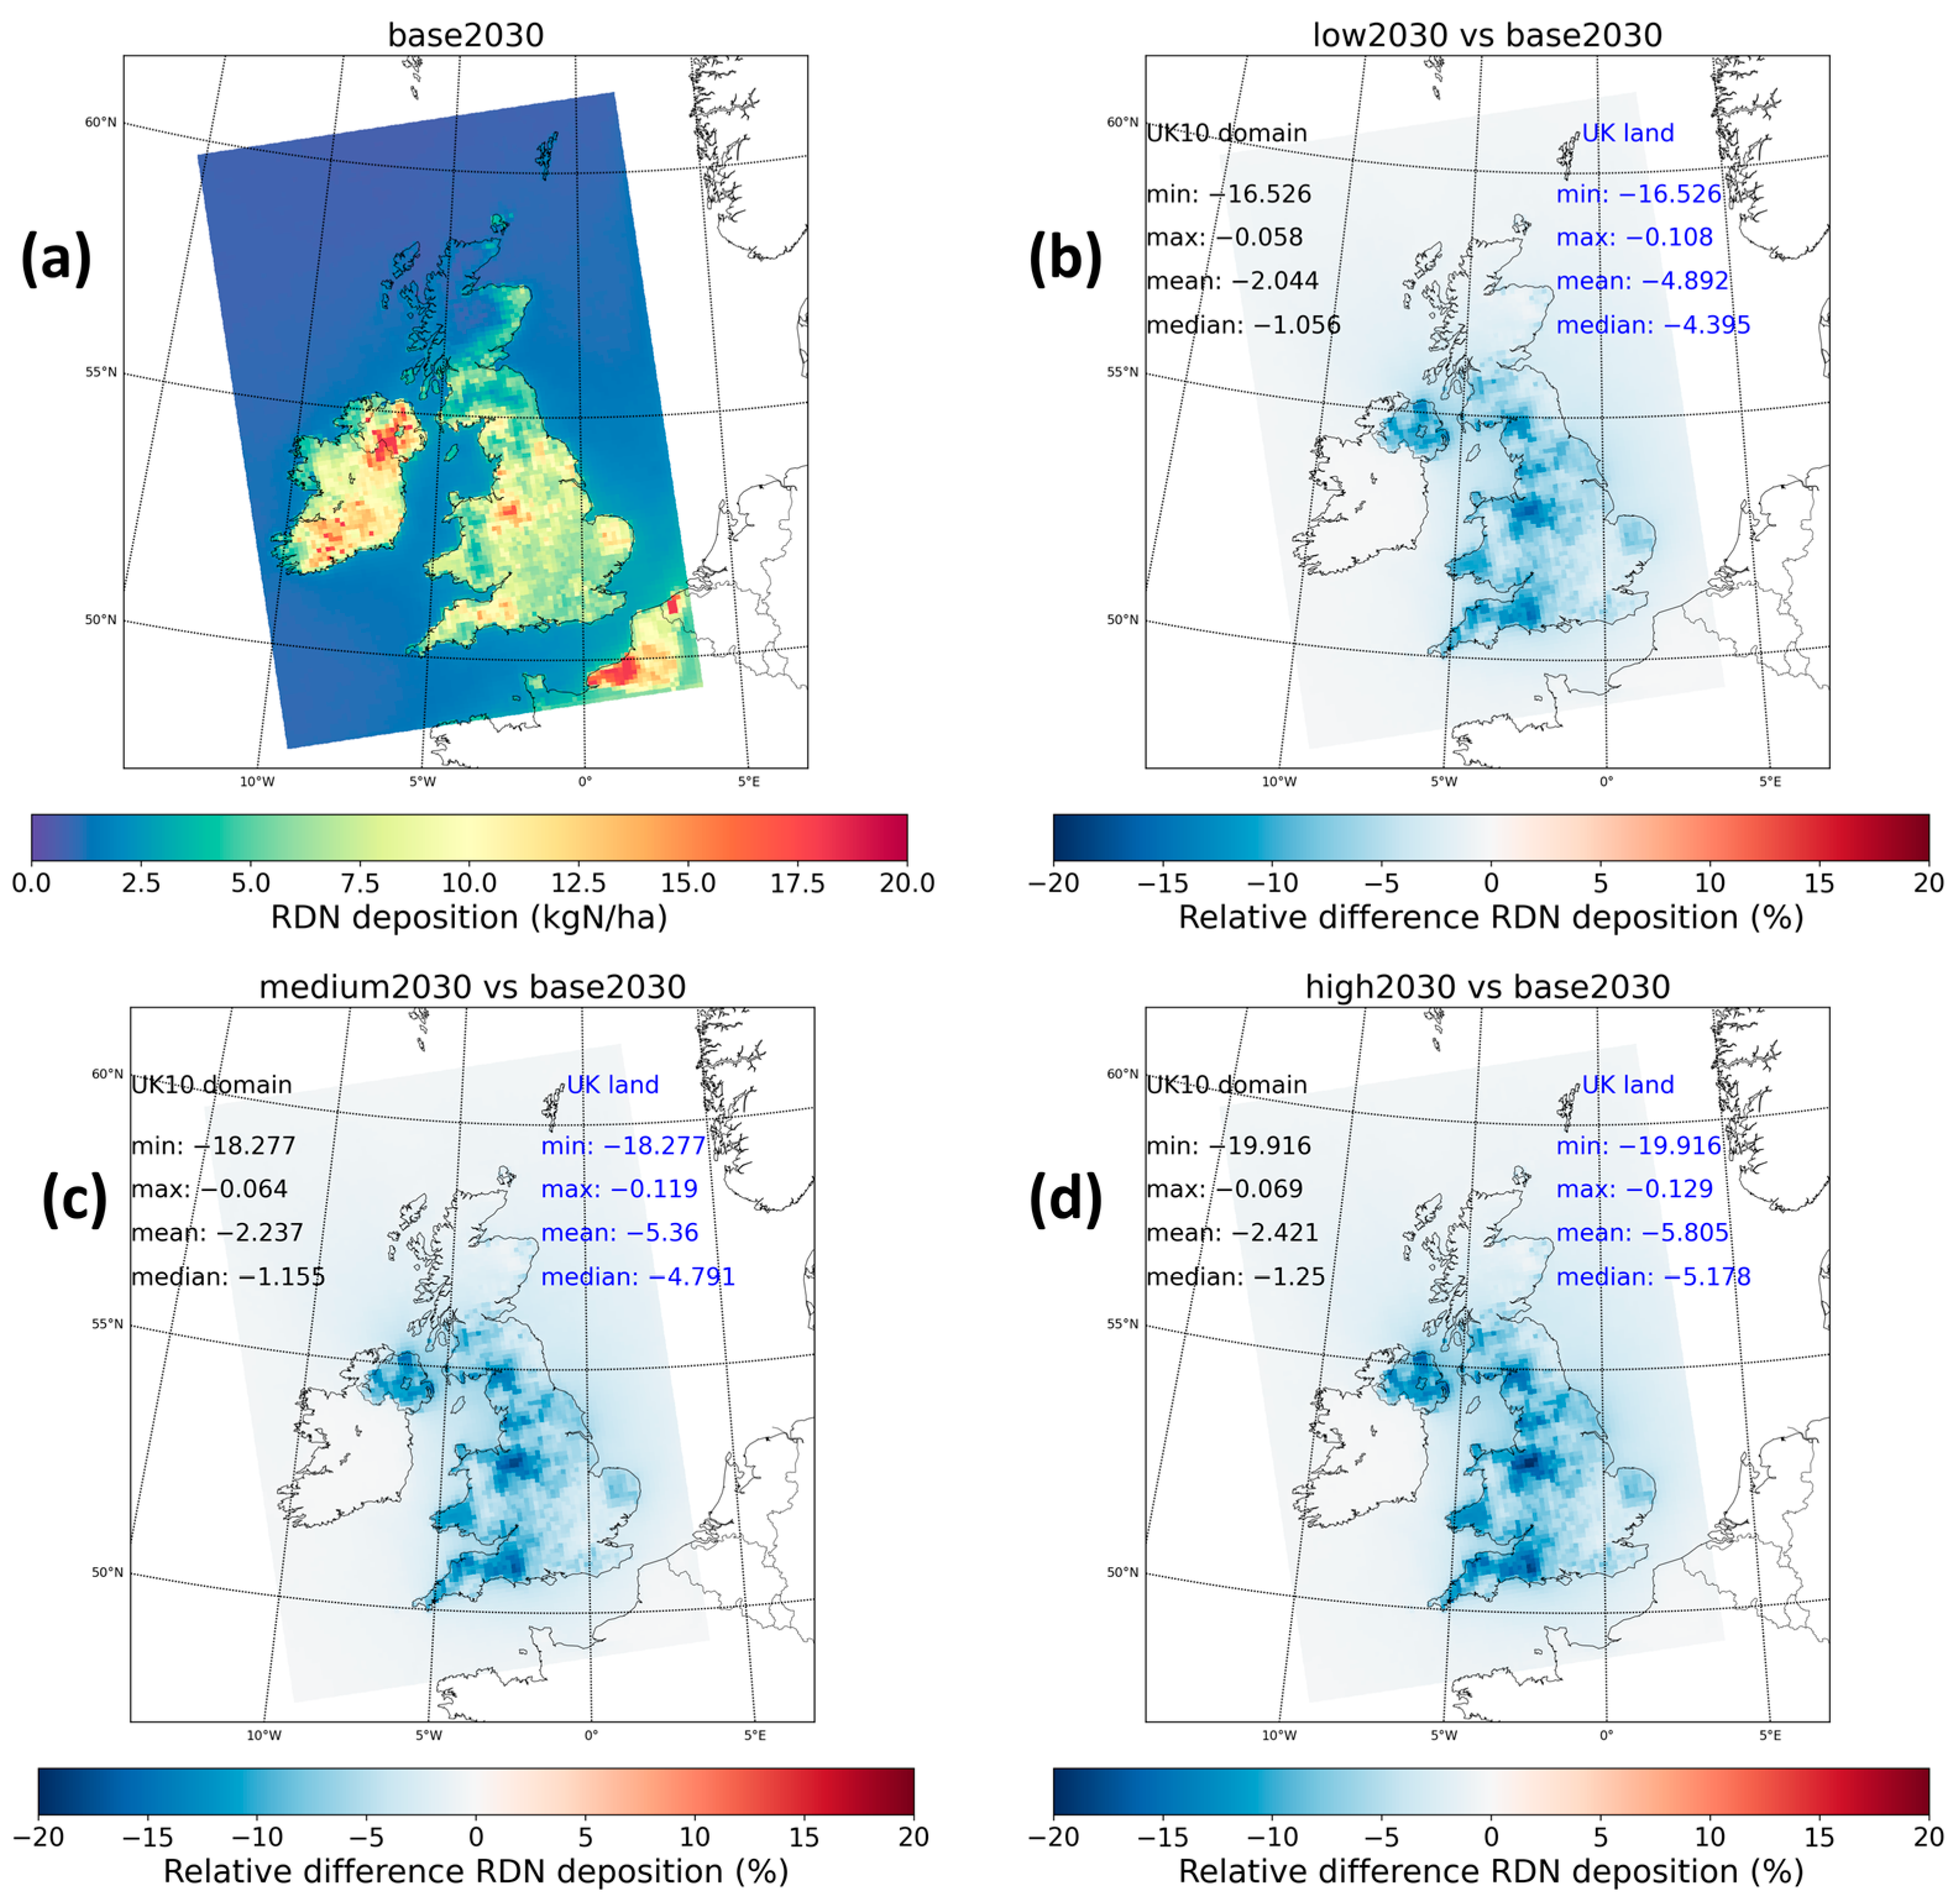
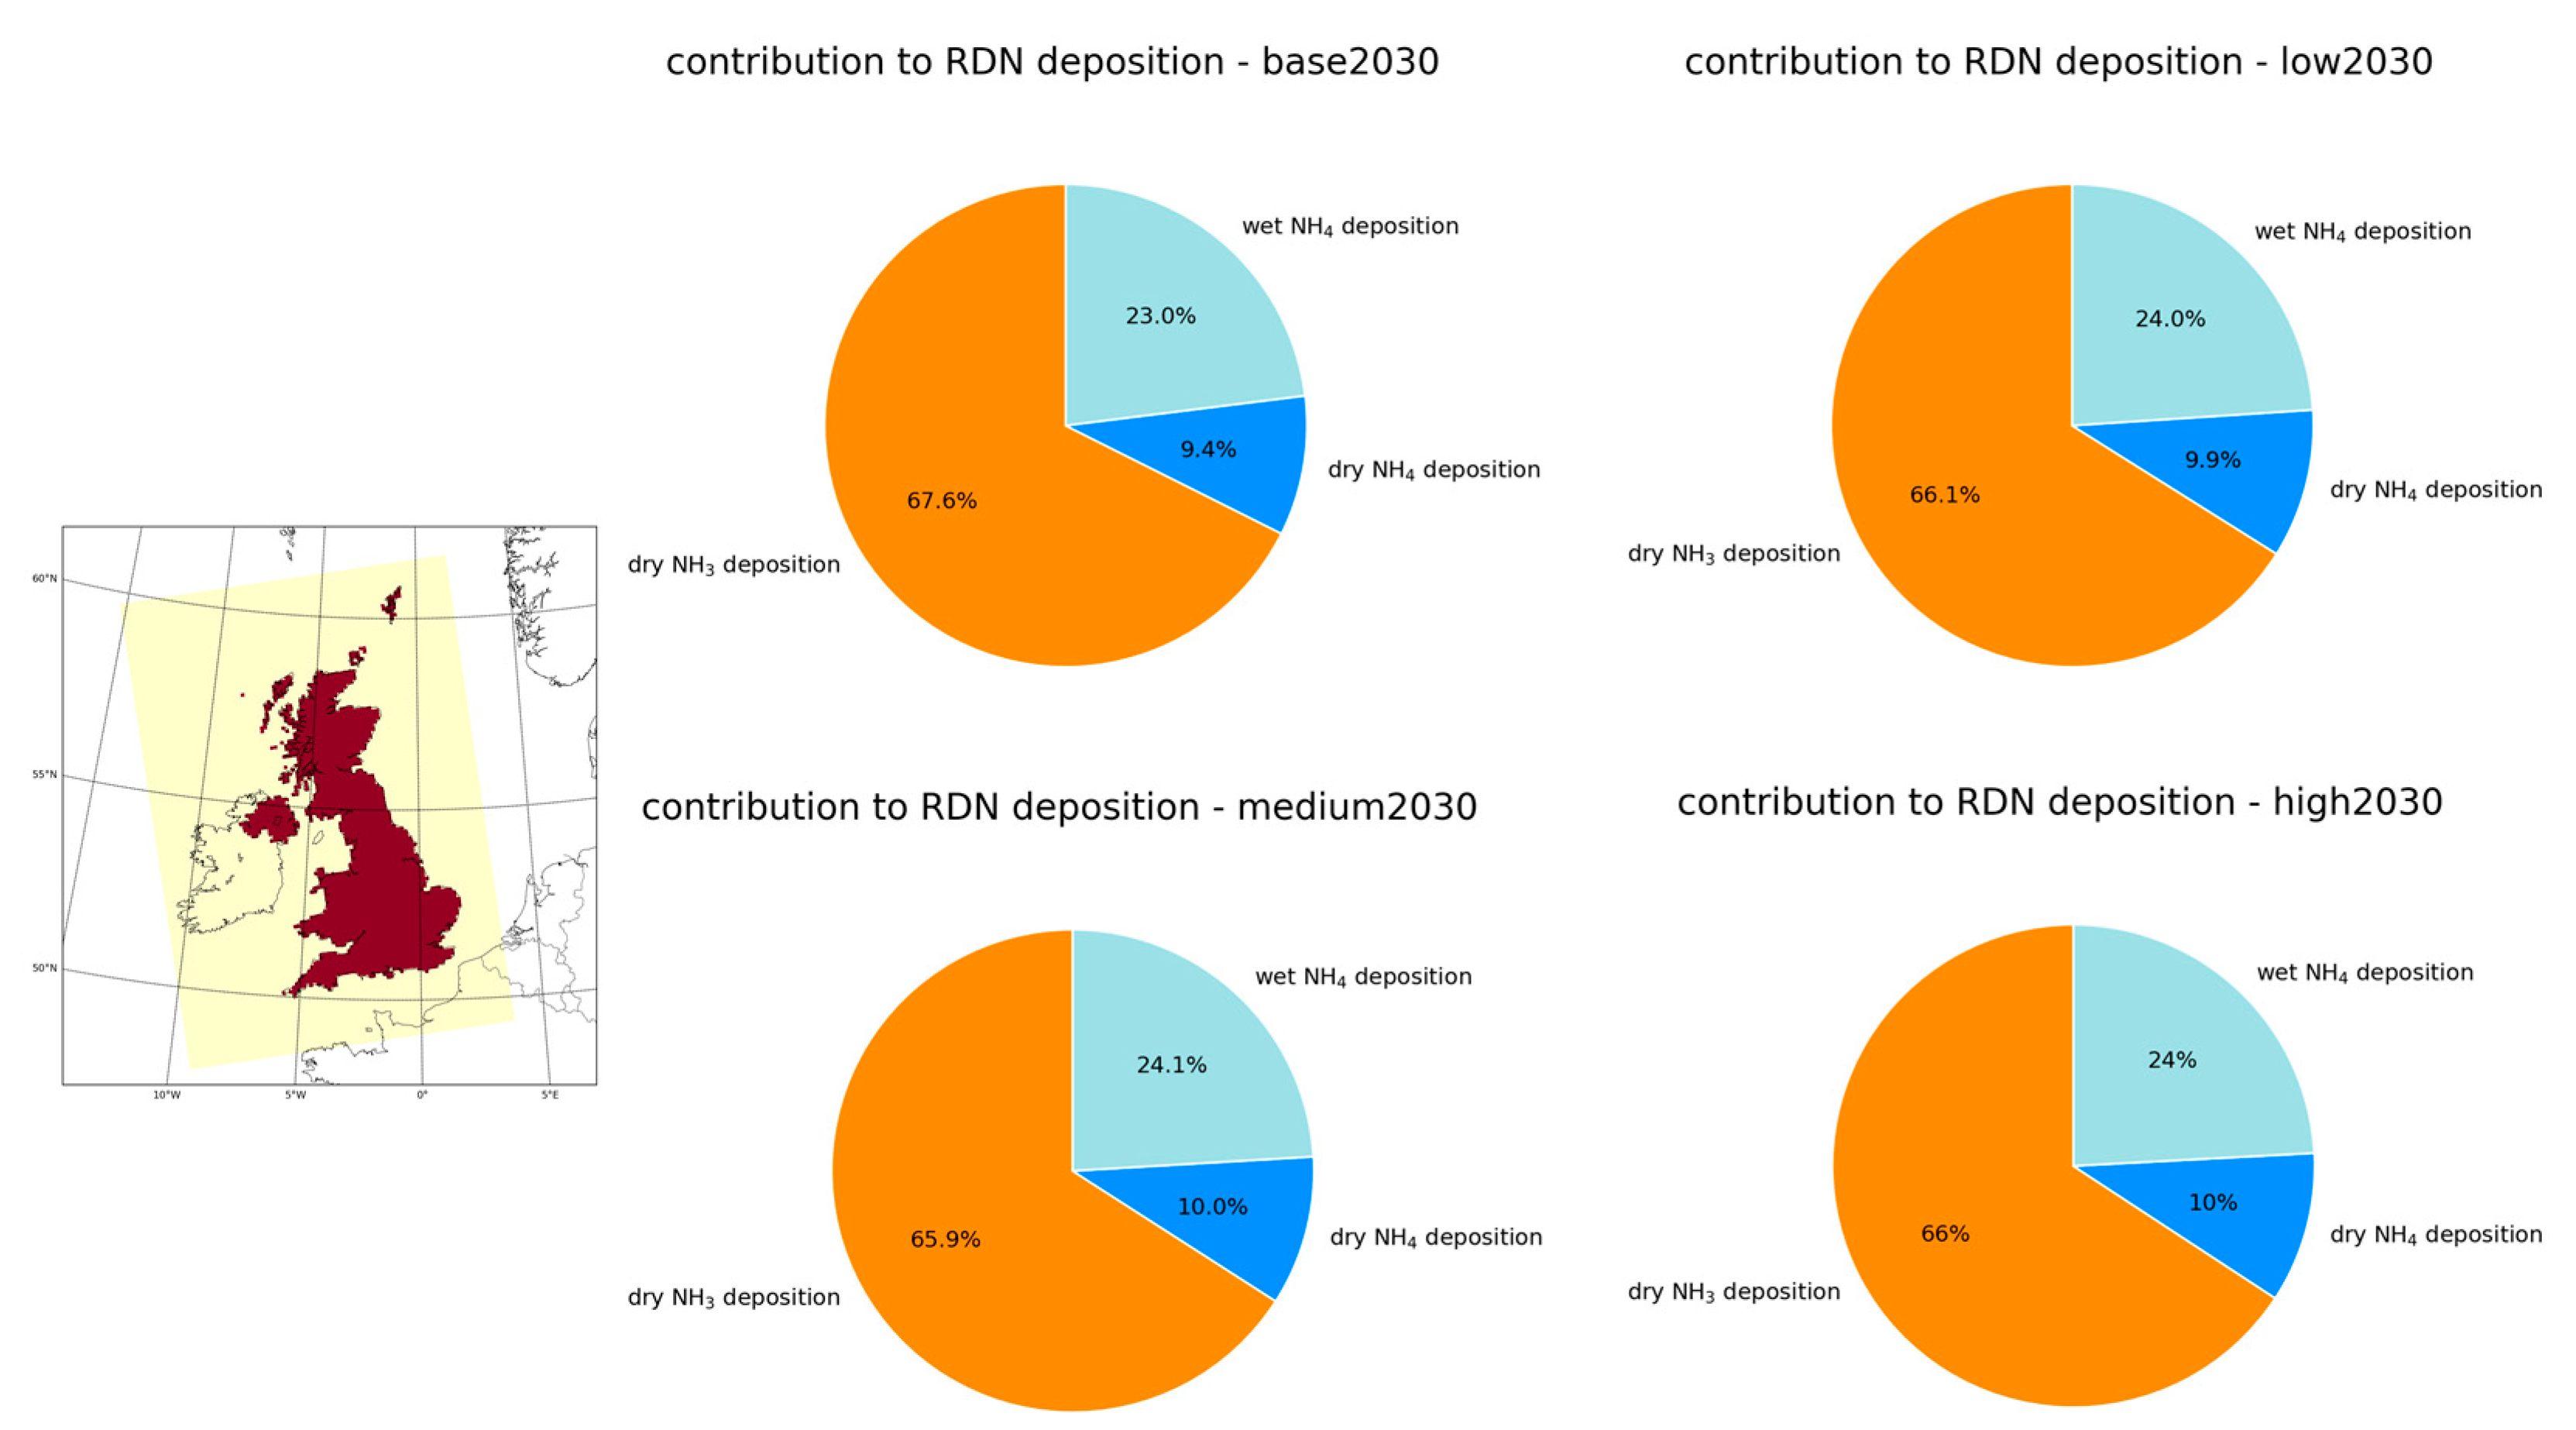
Emissions reductions in the three scenarios are effective at reducing NH3 concentrations, as shown in Figure 4, especially across the source regions. The three scenarios (low, medium, and high) present similar maximum reductions in the annual mean NH3 concentration, ranging from 18% to 22% (up to 1 and 1.2 µg/m3 reduction, respectively) in the UK, but it is clear the high2030 scenario shows the larger reduction in terms of both the mean value and the median value. The mean decrease in the annual NH3 concentration across the whole UK10 domain is always close to 4% and the median reduction is between 2 and 3%, but reaches 7–8% (mean) and nearly 7% (median) across UK land grid cells.
However, the emissions scenarios have only a minor impact in terms of reducing NH4+ (within PM2.5), as shown in Figure S4 (always up to a 4% reduction, with a mean reduction ranging only from 1.6 to 1.9% in the UK). To assess the role of NH3 in PM2.5 formation, Figure 5a shows the free ammonia (F-NHx) for the base2030 scenario.
This F-NHx is the amount of NH3 available, after neutralizing S O 4 2 + , for NH4NO3 formation mainly. This indicator reflects that the (NH4)2SO4 aerosol is the favoured form for S O 4 2 + [45]. It is expressed in a molar basis (µmole/m3) and defined as:
F-NHx = NH3 + NH4 − 2 × SO4
A positive value of this F-NHx indicates an excess of NH3 and so NH3 is not the limiting species.
To complete the analysis, Gratio is also used (Figure 5b) [46], indicating whether fine-particle nitrate formation is limited by the availability of HNO3 or NH3 and expressed in a molar basis as follows:
G ratio = F - N H x ( N O 3 + H N O 3 )
A Gratio larger than 1 indicates that HNO3 is limiting for the formation of N O 3 . A value lower than 0 indicates that NH3 is severely limiting, and a Gratio between 0 and 1 indicates NH3 is the limiting species and available for reaction with HNO3.
Similar results are calculated for the three scenarios (low, medium, and high) and are shown in Figures S5 and S6, for F-NHx and Gratio, respectively.
It is noticeable that high F-NHx concentrations (>0) and Gratio (>1) are present in the UK, especially across the source regions showing a NH3-rich chemical regime calculated within the domain (see Figure 5a,b). This confirms the findings of [14]. Their study showed that a decrease in NH3 emissions only has limited effects on mitigating SIA formation. As a consequence, the PM2.5 concentrations will only be slightly impacted by the mitigation of agricultural activities implemented in the different scenarios. Ref. [47] also found a shift in the SIA formation regime in the rural United States, making rural regions less sensitive to changes in NH3. It was also found that the potential to curb PM2.5 levels in Europe through reductions in NH3 emissions is decreasing due to an increase in NH3 compared to SOx and NOx [48]. Ref. [49] also concluded that NH3 emissions reduction is more efficient in Europe where NH3 is less abundant than where it is abundant.
Since most parts of the UK are characterized as “NH3 rich”; this indicates that whilst reducing NH3 emissions will decrease the Reduced N (RDN = NH3 + NH4+) concentration, it will have little effect on mitigating SIA as also suggested by the study conducted by [14].
This limited impact on the secondary formation of PM2.5, also suggests that PM2.5 precursors other than NH3 emissions, or even primary PM2.5 emissions, may need to be tackled to reduce annual mean PM2.5 concentrations due to farming activities. Indeed, ref. [50] also concluded that targeting acidic aerosol ( S O 4 2 +   and N O 3 ) precursor emissions of SO2 and NOx is more efficient in terms of reducing PM2.5 concentrations in the UK. Ref. [51], also focusing on the impact of UK NH3 emissions from agriculture, found that other precursors of PM2.5 should potentially reduce the overall PM2.5 load.
The role of NOx emissions in the results has not been analysed, but the minor changes in NOx emissions in the scenarios (Figure 2b) likely have a marginal impact on NH3 and NH4+. It is also worth noting that this analysis has focused on annual changes; the impact of reductions in NH3 emissions might provide a different picture if another temporal resolution, such as seasonal or monthly averages, is considered e.g., [49].

4.2. N Deposition

In addition to the reduction in NH3 concentrations, the scenarios show decreases in total N deposition (see Figure 6) in areas within the NH3 emission hotspots (see Figure 2) and which are impacted by the reductions in emissions. This reduction in total N deposition reaches a value between roughly 15 and 18%, but with a mean reduction of only 4% in the UK and around 1.3 and 1.5% in the whole domain, depending on the scenario.
This change in total N deposition is mainly due to a change in RDN deposition (Figure 7) and not in oxidised nitrogen (OXN). Indeed, this RDN is dominant in the fraction of total N deposition (Figure 8) and this RDN deposition in the UK is mainly composed of NH3 dry deposition in the different scenarios (Figure 9).
It is worth noting that CMAQ assumes that gaseous NH3 is transformed into N H 4 + when it dissolves in water, explaining why the NH3 wet deposition is not represented in the distribution of the RDN deposition in Figure 9. Figure 9 also shows that the different scenarios have a limited impact on the type of deposition since the percentages slightly vary. The scenarios show a small decrease in the NH3 dry deposition (with a ratio close to 67%) while the N H 4 + slightly increases, up to 10% for the dry deposition and 24% for the wet deposition.
The RDN deposition follows the same trend as the total N deposition, with larger decreases from the low2030 scenario to the medium2030 and high2030 scenarios, with a decrease reaching up to 17–20% depending on the scenario (with a mean between 5 and 6% in the UK and nearly 2% in the whole UK10 domain) (Figure 7). It also shows RDN is deposited closer to its sources.
Therefore, as shown by [14], gaseous NH3 dominates RDN. This indicates that, although reducing NH3 emissions over the source regions will effectively decrease RDN for the three scenarios, it will have little effect on mitigating SIA formation.
This change in total N deposition impacts biodiversity, as shown by [52]. Using these CMAQ calculations on the deposition, ref. [52] studied the economic impact of the change in biodiversity in terms of the appreciation of biodiversity, and focusing on bog, acid grassland, heathland, and dune grassland habitats. They found a larger impact for bogs in Northern Ireland for the high2030 scenario (1.20%). For acid grassland, the most impact occurred in Wales (3.12%) and for heathland, the greatest increases in biodiversity occurred in Northern Ireland (4.25%). Dune grassland experienced the greatest increase in biodiversity in England and Wales (~1.9–2%) due to this change in N deposition. A health impact assessment based on PM2.5 exposures and an economic analysis, capturing the valuation of health, productivity, and costs to the National Health Service (NHS) completed their study. Overall, ref. [52] found the mitigation measures in the different scenarios would have small positive effects on health, the economy, and ecosystems.

5. Conclusions

To study the impact of mitigation measures on farming activities in the UK, mainly tackling NH3 emissions, a series of mitigation measures were developed and the state-of-the-science air quality numerical model, CMAQ, was used.
These scenarios represented various levels of uptake (low to high) on farms across the UK in 2030 and were developed based on stakeholder engagement with farmers and stakeholders (i.e., farm advisers, academics, and farmer representatives). These scenarios were named low2030, medium2030, and high2030; compared to the baseline (base2030).
Considering this series of measures impacting emissions from farms across the UK, this study has shown a clear decline in NH3 emissions in the different scenarios in 2030 (up to ~13% reduction for the total emissions, and up to 24% for some source regions in the high2030 scenario).
Using the CMAQ model, this modelling study has highlighted reductions in NH3 emissions are effective at reducing NH3 concentrations (up to 22% for the high2030 scenario, but with a mean reduction of 8% in the UK), but are considerably less effective at reducing N H 4 + concentrations (only up to 4% reduction in all scenarios, with a mean reduction ranging only from 1.6 to 1.9% in the UK). This limited impact of NH3 emissions on N H 4 + concentrations is explained by a HNO3-limited regime in the UK, shown by high F-NHx and Gratio values over the whole UK. Since NH3 is not ‘limiting’, these NH3 emissions reductions have a small or no impact on mitigating secondary inorganic aerosol formation and thus on the PM2.5 concentrations, confirming results from other studies in Europe or other countries [14,47,48]. This also suggests that tackling other PM2.5 precursors (solely or combined) or potentially primary PM2.5 might be required to reduce their airborne concentrations [48,49]. However, this study focused on annual changes and conclusions might differ if other periods (e.g., daily, monthly, seasonal) are selected for exposure analysis.
Similarly, the changes in emissions also impact the N deposition which is mainly dominated by NH3 dry deposition (almost 2/3 of the RDN deposition). The reduction in total N deposition ranges between 15 and 18%, but with a mean reduction of only around 4% (3.5 and 4.2% from the low2030 to high2030 scenarios). This reduction in the N deposition is mainly calculated near the source regions.
Finally, further model development should be conducted to assess the results, as this study does not incorporate the bi-directional NH3 flux representation in CMAQ. This bi-directional treatment of NH3 fluxes should improve the prediction of NH3 in the air [31,53]. The modelling might also benefit from a finer spatial resolution, especially in analysing the deposition.

Supplementary Materials

The following supporting information can be downloaded at: https://www.mdpi.com/article/10.3390/atmos16040353/s1, Table S1: A comparison between annual measured meteorological variables (wind speed and wind direction at 10 m; and temperature at 2 m) with the modelled values in 2019. The values of the Pearson correlation coefficient (R), the mean bias (MB), the normalized mean bias (NMB), the mean relative error (MRE), the root mean square error (RMSE), the index of agreement (IOA), and the number of UK meteorological stations are provided. Only the stations with a data capture of 75% are used. The wind speed is in m/s, the wind direction in degrees, and the temperature in degrees Celsius; Figure S1: The spatial distribution of the relative differences in NH3 emissions at a 10 km × 10 km resolution for the low2030 (b), medium2030 (c), and high2030 (d) scenarios compared to base2030. The minimum, maximum, mean, and median relative difference values in the whole domain are provided. The relative difference is calculated as follows: ((scenario-base)/base) × 100%; Figure S2: A comparison between annual measured concentrations with the modelled values in 2019 for NH3 using an increase in NH3 emissions by 50%. Only the background stations with a data capture higher than 90% are used. Insert values are the Pearson correlation coefficient (R), the mean bias (MB), the normalized mean bias (NMB), the mean relative error (MRE), the root mean square error (RMSE), and the index of agreement (IOA). The blue line represents the linear fit and the dashed black line is the 1:1 slope; Figure S3: A comparison between annual measured concentrations and the modelled values in 2019 for NH4 (left panel) and NH3 (right panel). Only the background stations with a data capture higher than 75% are used. The insert values are the Pearson correlation coefficient (R), the mean bias (MB), the normalized mean bias (NMB), the mean relative error (MRE), the root mean square error (RMSE), and the index of agreement (IOA). The blue line represents the linear fit and the dashed black line is the 1:1 slope; Figure S4: The spatial distribution of annual mean NH4 concentrations in µg/m3 calculated by CMAQ at a 10 km × 10 km resolution for the base2030 scenario. The relative differences in the same distribution are for the low2030 (b), medium2030 (c), and high2030 (d) scenarios. The minimum, maximum, mean, and median relative difference values in the whole UK10 domain (black) and for the UK land grid cells (blue) are provided. The relative difference is calculated as follows: ((scenario-base)/base) × 100%.; Figure S5: The spatial distribution of annual mean free ammonia concentration (F-NHx in µmole/m3) at a 10 km × 10 km resolution for the low2030 (left panel), medium2030 (middle panel), and high2030 (right panel) scenarios.; Figure S6: The spatial distribution of the annual mean Gratio (µmole/m3) at a 10 km × 10 km resolution for the low2030 (left panel), medium2030 (middle panel), and high2030 (right panel) scenarios.

Author Contributions

M.P. developed the modelling methodology, undertook the meteorological and air quality modelling, validated the air quality and meteorological results, performed the formal analysis, managed the IT resources, wrote the analysis codes, and wrote the original draft; J.B. and A.L. developed the CMAQ emission processing tool; J.B. prepared and validated the CMAQ emission files; J.R. calculated the UK emissions. All authors have read and agreed to the published version of the manuscript.

Funding

This project was funded by the National Institute for Health and Care Research (NIHR) AIM-HEALTH programme under award number NIHR 129449.

Institutional Review Board Statement

Not applicable.

Informed Consent Statement

Not applicable.

Data Availability Statement

All data requests should be submitted to the corresponding author for consideration. The data are not publicly available due to confidentiality restrictions.

Acknowledgments

The authors would like to thank David Carslaw (Wolfson Atmospheric Chemistry Laboratories—University of York & Ricardo Energy Environment) for his comments as part of an internal review of the manuscript. The UKEAP and MARGA measurements are freely available on https://uk-air.defra.gov.uk/data/data_selector_service (access on 14 March 2025).

Conflicts of Interest

All author were employed by the company Ricardo Energy & Environment. All authors declare that the research was conducted in the absence of any commercial or financial relationships that could be construed as a potential conflict of interest

Appendix A. Statistics Used

The following statistics were calculated:
Pearson relation coefficient (r): The ideal score of these parameters is 1. It is a unitless variable.
Mean bias (MB): The MB provides information about the absolute bias of the model, with negative values indicating underestimation and positive values indicating overestimation by the model. The ideal score of this parameter is 0. The unit of this variable is the same as the selected variable (e.g., pollutant concentration in µg/m3).
MB = i = 1 N ( M i O i ) N
Normalised mean bias (NMB): The NMB represents the model bias relative to the reference. The ideal score of this parameter is 0 and the unit of the variable is in percent.
NMB = i = 1 N ( M i O i ) i = 1 N O i × 100 %
Root mean square error (RMSE): The RMSE considers error compensation due to opposite sign differences and encapsulates the average error produced by the model. The ideal score of this parameter is 0. The unit of this variable is the same as the selected variable (e.g., pollutant concentration in µg/m3).
RMSE = i = 1 N M i O i 2 N
Mean Relative Error (MRE): The MRE is the mean ratio of the difference between the model values and the reference (observations), on the observations. The ideal score of this parameter is 0. The unit of this variable is the same as the selected variable (e.g., pollutant concentration in µg/m3).
MRE = 1 N i = 1 N M i O i O i
Index of Agreement (IOA): An agreement value of 1 indicates a perfect match, and 0 indicates no agreement at all. It is a unitless variable.
IOA = 1 i = 1 N ( M i O i ) 2 i = 1 N ( M i O ¯   + O i O ¯   ) 2    
We used M and O as the notation to refer, respectively, to the model and the reference data (i.e., observations), and N is the number of the reference data set.

References

  1. Misselbrook, T.H.; Gilhespy, S.L.; Carswell, A.M.; Cardenas, L.M. Inventory of Ammonia Emissions from UK Agriculture 2021; Rothamsted Research: Harpenden, UK, 2023. [Google Scholar]
  2. Hauglustaine, D.A.; Balkanski, Y.; Schulz, M. A Global Model Simulation of Present and Future Nitrate Aerosols and Their Direct Radiative Forcing of Climate. Atmos. Chem. Phys. 2014, 14, 11031–11063. [Google Scholar] [CrossRef]
  3. Dammers, E.; McLinden, C.A.; Griffin, D.; Shephard, M.W.; Van Der Graaf, S.; Lutsch, E.; Schaap, M.; Gainairu-Matz, Y.; Fioletov, V.; Van Damme, M.; et al. NH3 Emissions from Large Point Sources Derived from CrIS and IASI Satellite Observations. Atmos. Chem. Phys. 2019, 19, 12261–12293. [Google Scholar] [CrossRef]
  4. Abeed, R.; Viatte, C.; Porter, W.C.; Evangeliou, N.; Clerbaux, C.; Clarisse, L.; Van Damme, M.; Coheur, P.-F.; Safieddine, S. A Roadmap to Estimating Agricultural Ammonia Volatilization over Europe Using Satellite Observations and Simulation Data. Atmos. Chem. Phys. 2023, 23, 12505–12523. [Google Scholar] [CrossRef]
  5. Xie, Y.; Wang, W.; Chen, Y.; Qian, Z.; Chen, J.; Tong, J.; Li, L.; Yue, Y.; Chen, K.; Chu, Z.; et al. NH3 Emissions and Lifetime Estimated by Satellite Observations with Differential Evolution Algorithm. Atmosphere 2024, 15, 251. [Google Scholar] [CrossRef]
  6. Gu, B.; Zhang, L.; Van Dingenen, R.; Vieno, M.; Van Grinsven, H.J.; Zhang, X.; Zhang, S.; Chen, Y.; Wang, S.; Ren, C.; et al. Abating Ammonia Is More Cost-Effective than Nitrogen Oxides for Mitigating PM2.5 Air Pollution. Science 2021, 374, 758–762. [Google Scholar] [CrossRef] [PubMed]
  7. Wyer, K.E.; Kelleghan, D.B.; Blanes-Vidal, V.; Schauberger, G.; Curran, T.P. Ammonia Emissions from Agriculture and Their Contribution to Fine Particulate Matter: A Review of Implications for Human Health. J. Environ. Manag. 2022, 323, 116285. [Google Scholar] [CrossRef]
  8. Pope, C.A.; Dockery, D.W. Health Effects of Fine Particulate Air Pollution: Lines That Connect. J. Air Waste Manag. Assoc. 2006, 56, 709–742. [Google Scholar] [CrossRef]
  9. Kim, K.-H.; Kabir, E.; Kabir, S. A Review on the Human Health Impact of Airborne Particulate Matter. Environ. Int. 2015, 74, 136–143. [Google Scholar] [CrossRef]
  10. Kharol, S.K.; Shephard, M.W.; McLinden, C.A.; Zhang, L.; Sioris, C.E.; O’Brien, J.M.; Vet, R.; Cady-Pereira, K.E.; Hare, E.; Siemons, J.; et al. Dry Deposition of Reactive Nitrogen From Satellite Observations of Ammonia and Nitrogen Dioxide Over North America. Geophys. Res. Lett. 2018, 45, 1157–1166. [Google Scholar] [CrossRef]
  11. Liu, X.; Tai, A.P.K.; Fung, K.M. Responses of Surface Ozone to Future Agricultural Ammonia Emissions and Subsequent Nitrogen Deposition through Terrestrial Ecosystem Changes. Atmos. Chem. Phys. 2021, 21, 17743–17758. [Google Scholar] [CrossRef]
  12. Ge, Y.; Vieno, M.; Stevenson, D.S.; Wind, P.; Heal, M.R. Global Sensitivities of Reactive N and S Gas and Particle Concentrations and Deposition to Precursor Emissions Reductions. Atmos. Chem. Phys. 2023, 23, 6083–6112. [Google Scholar] [CrossRef]
  13. Sun, J.; Fu, J.S.; Lynch, J.A.; Huang, K.; Gao, Y. Climate-driven Exceedance of Total (Wet + Dry) Nitrogen (N) + Sulfur (S) Deposition to Forest Soil over the Conterminous U.S. Earth’s Future 2017, 5, 560–576. [Google Scholar] [CrossRef]
  14. Ge, Y.; Vieno, M.; Stevenson, D.S.; Wind, P.; Heal, M.R. A New Assessment of Global and Regional Budgets, Fluxes, and Lifetimes of Atmospheric Reactive N and S Gases and Aerosols. Atmos. Chem. Phys. 2022, 22, 8343–8368. [Google Scholar] [CrossRef]
  15. Department for Environment Food & Rural Affairs Accredited Official Statistics, Emissions of Air Pollutants in the UK—Background. Available online: https://www.gov.uk/government/statistics/emissions-of-air-pollutants/emissions-of-air-pollutants-in-the-uk-background (accessed on 18 March 2025).
  16. Wiltshire, J.; Misselbrook, T.; Cowie, H.; Dixon, K.; Conlan, B.; Williamson, T.; Vardoulakis, S. Rapid Evidence Assessment of Interventions to Improve Ambient Air Quality: Agricultural/Rural Interventions; Public Health England: Edinburgh, UK, 2018. [Google Scholar]
  17. Byun, D.; Schere, K.L. Review of the Governing Equations, Computational Algorithms, and Other Components of the Models-3 Community Multiscale Air Quality (CMAQ) Modeling System. Appl. Mech. Rev. 2006, 59, 51–77. [Google Scholar] [CrossRef]
  18. Appel, K.W.; Bash, J.O.; Fahey, K.M.; Foley, K.M.; Gilliam, R.C.; Hogrefe, C.; Hutzell, W.T.; Kang, D.; Mathur, R.; Murphy, B.N.; et al. The Community Multiscale Air Quality (CMAQ) Model Versions 5.3 and 5.3.1: System Updates and Evaluation. Geosci. Model Dev. 2021, 14, 2867–2897. [Google Scholar] [CrossRef]
  19. Jenkins, B.; Wiltshire, J. Farmer Perceptions of the Benefits and Barriers to Ammonia Mitigation Measures. NIHR J. 2024, in press. [Google Scholar]
  20. US EPA Office of Research and Development. CMAQ 2022. Available online: https://zenodo.org/records/7218076 (accessed on 17 December 2024).
  21. Luecken, D.J.; Yarwood, G.; Hutzell, W.T. Multipollutant Modeling of Ozone, Reactive Nitrogen and HAPs across the Continental US with CMAQ-CB6. Atmos. Environ. 2019, 201, 62–72. [Google Scholar] [CrossRef]
  22. Pye, H.O.T.; Murphy, B.N.; Xu, L.; Ng, N.L.; Carlton, A.G.; Guo, H.; Weber, R.; Vasilakos, P.; Appel, K.W.; Budisulistiorini, S.H.; et al. On the Implications of Aerosol Liquid Water and Phase Separation for Organic Aerosol Mass. Atmos. Chem. Phys. 2017, 17, 343–369. [Google Scholar] [CrossRef]
  23. Iacono, M.J.; Delamere, J.S.; Mlawer, E.J.; Shephard, M.W.; Clough, S.A.; Collins, W.D. Radiative Forcing by Long-lived Greenhouse Gases: Calculations with the AER Radiative Transfer Models. J. Geophys. Res. 2008, 113, 2008JD009944. [Google Scholar] [CrossRef]
  24. Dudhia, J. Numerical Study of Convection Observed during the Winter Monsoon Experiment Using a Mesoscale Two-Dimensional Model. J. Atmos. Sci. 1989, 46, 3077–3107. [Google Scholar] [CrossRef]
  25. Pleim, J.E. A Combined Local and Nonlocal Closure Model for the Atmospheric Boundary Layer. Part II: Application and Evaluation in a Mesoscale Meteorological Model. J. Appl. Meteorol. Climatol. 2007, 46, 1396–1409. [Google Scholar] [CrossRef]
  26. Pleim, J.E. A Combined Local and Nonlocal Closure Model for the Atmospheric Boundary Layer. Part I: Model Description and Testing. J. Appl. Meteorol. Climatol. 2007, 46, 1383–1395. [Google Scholar] [CrossRef]
  27. Pleim, J.E. A Simple, Efficient Solution of Flux–Profile Relationships in the Atmospheric Surface Layer. J. Appl. Meteorol. Climatol. 2006, 45, 341–347. [Google Scholar] [CrossRef]
  28. Smirnova, T.G.; Brown, J.M.; Benjamin, S.G.; Kenyon, J.S. Modifications to the Rapid Update Cycle Land Surface Model (RUC LSM) Available in the Weather Research and Forecasting (WRF) Model. Mon. Wea. Rev. 2016, 144, 1851–1865. [Google Scholar] [CrossRef]
  29. Kain, J.S. The Kain–Fritsch Convective Parameterization: An Update. J. Appl. Meteor. 2004, 43, 170–181. [Google Scholar] [CrossRef]
  30. Hogrefe, C.; Bash, J.O.; Pleim, J.E.; Schwede, D.B.; Gilliam, R.C.; Foley, K.M.; Appel, K.W.; Mathur, R. An Analysis of CMAQ Gas-Phase Dry Deposition over North America through Grid-Scale and Land-Use-Specific Diagnostics in the Context of AQMEII4. Atmos. Chem. Phys. 2023, 23, 8119–8147. [Google Scholar] [CrossRef] [PubMed]
  31. Pleim, J.E.; Ran, L.; Appel, W.; Shephard, M.W.; Cady-Pereira, K. New Bidirectional Ammonia Flux Model in an Air Quality Model Coupled With an Agricultural Model. J. Adv. Model. Earth Syst. 2019, 11, 2934–2957. [Google Scholar] [CrossRef]
  32. Pleim, J.; Ran, L. Surface Flux Modeling for Air Quality Applications. Atmosphere 2011, 2, 271–302. [Google Scholar] [CrossRef]
  33. Guenther, A.; Jiang, X.; Shah, T.; Huang, L.; Kemball-Cook, S.; Yarwood, G. Model of Emissions of Gases and Aerosol from Nature Version 3 (MEGAN3) for Estimating Biogenic Emissions. In Air Pollution Modeling and its Application XXVI; Mensink, C., Gong, W., Hakami, A., Eds.; Springer Proceedings in Complexity; Springer International Publishing: Cham, Switzerland, 2020; pp. 187–192. ISBN 978-3-030-22054-9. [Google Scholar]
  34. Kendon, M.; McCarthy, M.; Jevrejeva, S.; Matthews, A.; Sparks, T.; Garforth, J. State of the UK Climate 2019. Int. J. Climatol. 2020, 40, 1–69. [Google Scholar] [CrossRef]
  35. Morcrette, J.-J.; Boucher, O.; Jones, L.; Salmond, D.; Bechtold, P.; Beljaars, A.; Benedetti, A.; Bonet, A.; Kaiser, J.W.; Razinger, M.; et al. Aerosol Analysis and Forecast in the European Centre for Medium-Range Weather Forecasts Integrated Forecast System: Forward Modeling. J. Geophys. Res. 2009, 114, 2008JD011235. [Google Scholar] [CrossRef]
  36. USEPA CMAQ—BCON. Available online: https://github.com/USEPA/CMAQ/tree/main/PREP/bcon (accessed on 17 December 2024).
  37. EMEP Gridded-Emissions. Available online: https://www.ceip.at/the-emep-grid/gridded-emissions (accessed on 17 December 2024).
  38. ECLIPSE V6b; Global Emission Fields of Air Pollutants and GHGs. 2019. Available online: https://Iiasa.Ac.at/Models-Tools-Data/Global-Emission-Fields-of-Air-Pollutants-and-Ghgs (accessed on 17 December 2024).
  39. Ricardo SMT: Designing a Scenario-Modelling Tool to Inform Policy on Air Pollutant Emissions. Available online: https://www.ricardo.com/en/case-studies/designing-a-scenario-modelling-tool-to-inform-policy-on-air-pollutant-emissions (accessed on 17 December 2024).
  40. Churchill, S.; Misra, A.; Brown, P.; Del Vento, S.; Karagianni, E.; Murrells, T.; Passant, N.; Richardson, J.; Richmond, B.; Smith, H.; et al. UK Informative Inventory Report (1990 to 2019); Ricardo Energy Environment: Oxfordshire, UK, 2021. [Google Scholar]
  41. Pommier, M.; Benney, R.; Bost, J.; Jenkins, B.; Richardson, J.; Rock, L.; Blythe, O.; Marshall, O.; Spence, A. Impact of Agricultural Interventions on Air Pollutants’ Emissions, and Human Exposure to PM2.5 Concentrations in the UK. NIHR J. 2024, in press. [Google Scholar]
  42. UK AIR. Available online: https://Uk-Air.Defra.Gov.Uk/Data/Data_selector_service (accessed on 20 December 2024).
  43. Marais, E.A.; Pandey, A.K.; Van Damme, M.; Clarisse, L.; Coheur, P.; Shephard, M.W.; Cady-Pereira, K.E.; Misselbrook, T.; Zhu, L.; Luo, G.; et al. UK Ammonia Emissions Estimated With Satellite Observations and GEOS-Chem. JGR Atmos. 2021, 126, e2021JD035237. [Google Scholar] [CrossRef]
  44. Kelly, J.M.; Marais, E.A.; Lu, G.; Obszynska, J.; Mace, M.; White, J.; Leigh, R.J. Diagnosing Domestic and Transboundary Sources of Fine Particulate Matter (PM2.5) in UK Cities Using GEOS-Chem. City Environ. Interact. 2023, 18, 100100. [Google Scholar] [CrossRef]
  45. Pay, M.T.; Jiménez-Guerrero, P.; Baldasano, J.M. Assessing Sensitivity Regimes of Secondary Inorganic Aerosol Formation in Europe with the CALIOPE-EU Modeling System. Atmos. Environ. 2012, 51, 146–164. [Google Scholar] [CrossRef]
  46. Ansari, A.S.; Pandis, S.N. Response of Inorganic PM to Precursor Concentrations. Environ. Sci. Technol. 1998, 32, 2706–2714. [Google Scholar] [CrossRef]
  47. Pan, D.; Mauzerall, D.L.; Wang, R.; Guo, X.; Puchalski, M.; Guo, Y.; Song, S.; Tong, D.; Sullivan, A.P.; Schichtel, B.A.; et al. Regime Shift in Secondary Inorganic Aerosol Formation and Nitrogen Deposition in the Rural United States. Nat. Geosci. 2024, 17, 617–623. [Google Scholar] [CrossRef] [PubMed]
  48. Jonson, J.E.; Fagerli, H.; Scheuschner, T.; Tsyro, S. Modelling Changes in Secondary Inorganic Aerosol Formation and Nitrogen Deposition in Europe from 2005 to 2030. Atmos. Chem. Phys. 2022, 22, 1311–1331. [Google Scholar] [CrossRef]
  49. Clappier, A.; Thunis, P.; Beekmann, M.; Putaud, J.P.; De Meij, A. Impact of SOx, NOx and NH3 Emission Reductions on PM2.5 Concentrations across Europe: Hints for Future Measure Development. Environ. Int. 2021, 156, 106699. [Google Scholar] [CrossRef]
  50. Marais, E.A.; Kelly, J.M.; Vohra, K.; Li, Y.; Lu, G.; Hina, N.; Rowe, E.C. Impact of Legislated and Best Available Emission Control Measures on UK Particulate Matter Pollution, Premature Mortality, and Nitrogen-Sensitive Habitats. GeoHealth 2023, 7, e2023GH000910. [Google Scholar] [CrossRef]
  51. Pastorino, S.; Milojevic, A.; Green, R.; Beck, R.; Carnell, E.; Colombo, P.E.; Misselbrook, T.; Miller, M.; Reis, S.; Tomlinson, S.; et al. Health Impact of Policies to Reduce Agriculture-Related Air Pollutants in the UK: The Relative Contribution of Change in PM2.5 Exposure and Diets to Morbidity and Mortality. Environ. Res. 2024, 262, 119923. [Google Scholar] [CrossRef]
  52. Mueller, W.; Carson, F.; Dubey, J.; Gutierrez, A.; O’Hare, E.; Cowie, H. Agricultural Interventions to Reduce PM2.5 in the UK: Impacts on Health and the Economy. NIHR J. 2024, in press. [Google Scholar]
  53. Fu, X.; Wang, S.X.; Ran, L.M.; Pleim, J.E.; Cooter, E.; Bash, J.O.; Benson, V.; Hao, J.M. Estimating NH3 Emissions from Agricultural Fertilizer Application in China Using the Bi-Directional CMAQ Model Coupled to an Agro-Ecosystem Model. Atmos. Chem. Phys. 2015, 15, 6637–6649. [Google Scholar] [CrossRef]
Figure 1. CMAQ nested modelling domains shown with the matplotlib shaded relief image used as an illustration. The black box corresponds to the European domain at a 50 km × 50 km horizontal resolution (EU50) and the blue box to the UK domain at a 10 km × 10 km horizontal resolution (UK10).
Atmosphere 16 00353 g001
Figure 2. The spatial distribution of the annual NH3 emissions in tonnes for the base2030 scenario at a 10 km × 10 km horizontal resolution (a). Total UK anthropogenic emissions in kT for NH3, NOx, SO2, VOC, CO, PM2.5, and PM10 used for the different scenarios. The relative differences in these total emissions for the low2030, medium2030, and high2030 scenarios compared to base2030 are given above each point. The relative difference is calculated as follows: ((scenario-base)/base) × 100%. The geographical extent of the UK is shown in red on the layered map at the bottom (b).
Atmosphere 16 00353 g002
Figure 3. (a) The spatial distribution of annual mean NH3 concentrations in µg/m3 calculated by CMAQ at a 10 km × 10 km horizontal resolution in 2019. The measured concentrations are shown by the coloured circles (a). Comparison between these annual measured concentrations with the modelled values in 2019. Only the background stations with a data capture higher than 0.9 are used. Insert values are the Pearson correlation coefficient (R), the mean bias (MB), the normalized mean bias (NMB), the mean relative error (MRE), the root mean square error (RMSE), and the index of agreement (IOA). The blue line represents the linear fit and the dashed black line is the 1:1 slope (b).
Atmosphere 16 00353 g003
Figure 4. The spatial distribution of annual mean NH3 concentrations in µg/m3 calculated by CMAQ at a 10 km × 10 km horizontal resolution for the base2030 scenario (a). The relative differences in the same distribution with the low2030 (b), medium2030 (c), and high2030 (d) scenarios. The minimum, maximum, mean, and median relative difference values in the whole UK10 domain (in black) and for the UK land grid cells (blue) are provided. The relative difference is calculated as follows: ((scenario-base)/base) × 100%.
Atmosphere 16 00353 g004
Figure 5. The spatial distribution of annual mean free NH3 concentration (F-NHx in µmole/m3) (a) and of annual mean Gratio (µmole/m3) (b) at a 10 km × 10 km resolution for the base2030 scenario. A Gratio > 1 indicates that HNO3 is limiting, a Gratio < 0 indicates that NH3 is severely limiting, a Gratio between 0 and 1 indicates NH3 is available for reaction with HNO3, but NH3 is the limiting species.
Atmosphere 16 00353 g005
Figure 6. The spatial distribution of total N deposition in kgN/ha calculated by CMAQ at a 10 km × 10 km horizontal resolution for the base2030 scenario (a). The relative differences in the same distribution with the low2030 (b), medium2030 (c), and high2030 (d) scenarios. The minimum, maximum, mean, and median relative difference values in the whole UK10 domain (black) and for the UK land grid cells (blue) are provided. The relative difference is calculated as follows: ((scenario-base)/base) × 100%.
Atmosphere 16 00353 g006
Figure 7. The spatial distribution of total RDN deposition in kgN/ha calculated by CMAQ at a 10 km × 10 km horizontal resolution for the base2030 scenario (a). The relative differences in the same distribution with the low2030 (b), medium2030 (c) and high2030 (d) scenarios. The minimum, maximum, mean, and median relative difference values in the whole UK10 domain (black) and for the UK land grid cells (blue) are provided. The relative difference is calculated as follows: ((scenario-base)/base) × 100%.
Atmosphere 16 00353 g007
Figure 8. The spatial distribution of the ratio of the reduced N deposition (RDN) relative to the total N (reduced plus oxidised N) deposition calculated by CMAQ at a 10 km × 10 km horizontal resolution for the base2030 scenario.
Atmosphere 16 00353 g008
Figure 9. The contribution to RDN deposition in percentage terms for the 4 scenarios (base2030, low2030, mdeium2030, and high2030) in the UK. The UK grid cells used for the calculation are highlighted in red on the layered map.
Atmosphere 16 00353 g009
Disclaimer/Publisher’s Note: The statements, opinions and data contained in all publications are solely those of the individual author(s) and contributor(s) and not of MDPI and/or the editor(s). MDPI and/or the editor(s) disclaim responsibility for any injury to people or property resulting from any ideas, methods, instructions or products referred to in the content.

