Abstract
This study examines the variations of elements in PM2.5 emitted from biomass burning in urban settings, which raises health concerns among urban dwellers. It specifically focused on how Sodium (Na), Calcium (Ca), Potassium (K), and Phosphorus (P) concentrations in tree combustibles affect their concentrations in PM2.5 emitted during combustion. Understanding these interactions is critical for evaluating air quality and its public health effects. Urban landscape coniferous and broad-leaf tree species combustibles (branches and leaves) were assessed, and the data were processed using Microsoft Excel, Origin Pro 2024, and R Studio. It was discovered that the species and organs had a common elemental concentration pattern (Ca > K > P > Na) in their combustibles but a different concentration pattern in the emitted PM2.5. Quantitatively, the concentrations in the combustibles varied, with Ca being the most abundant (69.85 mg/kg) and P the least (3.97 mg/kg). In PM2.5, the contrary was observed, i.e., Na (which was among the least concentrated elements in the combustibles) became prominent; the highest levels were recorded in PM2.5 from conifers (Na = 0.86 mg/kg). Among the assessed elements in PM2.5, P had the lowest concentration in all the tests, having the lowest values from broad-leaf species (P = 0.02 mg/kg). The SEM result further revealed that, quantitatively, the concentration of these elements in the combustibles does not necessarily mean that they will be in higher concentrations in the emitted PM2.5. These variations highlighted the importance of considering tree species, organ types, and elemental interactions when assessing the impacts of biomass combustion on urban air quality and human health.
1. Introduction
Air pollution in China has been a concern at both regional and global levels; PM2.5 is one of the key air pollutants [1,2]. PM2.5 is a particulate matter type that is generated during both organic and inorganic combustion processes [3]. This particulate matter type is a concern worldwide because of its potential to cause health complications when inhaled [4].
As air pollution has become prominent, especially in urban settings, there is an increasing demand and advocacy for the establishment of urban forests in order to combat climate change and air pollution [5,6]. In the quest to deal with air pollution and climate change through urban forestry, the generation of forest wastes has become inevitable [7]. One of the oldest methods used to get rid of urban forestry waste, like branches and leaves, is through burning which, in turn, releases materials back into the environment. While the burning of these waste materials are sometimes unintentional, though most often is intentional in order to keep communities clean or generate energy for houses, communities, or industries [8,9]. The burning of these wastes involves processes that are both physical and chemical, leading to a transfer of mass and heat [10]. As further explained in [10], forest biomass burning is responsible for 18% of global aggregated air pollutant emissions. One study [11] highlighted the necessity to prevent the emission of PM2.5, noting that combustion processes pose health issues by compromising the air quality which has human health implications [12,13]. Studies had proven that biomass burning increases the concentration of particulate matters in indoor and outdoor environments in both developed and developing countries [14]. The authors of [15] highlighted that PM2.5 emissions are predominant in regions where forest biomass is commonly burned.
The sources and composition of PM2.5 have also been considered by many studies, which also concluded that PM2.5 poses a risk to public health [16,17], and it magnitude is affected by its sources and composition [18]. The most studied sources of PM2.5 are inorganic sources, while biomass sources have gained less attention [19], especially in relation to combustion processes of urban landscape tree species wastes. A review [20] emphasized the effect of PM2.5 composition on its toxicity, stating that a mixture of elements in PM2.5 may be more toxic than a single element on its own. PM2.5 contain both metal and non-metal elements or compounds, some of which are highly reactive while others display only moderate reactivity. Among the commonly found elements in PM2.5 are Calcium (Ca), Potassium (K) [21], Sodium (Na), and Phosphorous (P) [22,23]. These elements are highly reactive with water and carbon, which makes them readily available to form compounds when released into the atmosphere [24,25]. These elements are absorbed and stored in plant cells and are released into the environment during biomass combustion as trace elements [26,27]. Ca and K are macro-nutrients needed by plants, which promotes their accumulation over Phosphorous and Sodium in the cells of plants. As far back in 1984, Calcium was identified as a very important element for plant health.
As trees may be planted for different purposes such as environmental cooling [28], as wind breakers [29], for ecosystem services [30], and rain water interception [31], there is a need to promote environmental hygiene through proper wastes management. In the process of keeping our surroundings clean through biomass burning, the elements in the burning plants are released back to the atmosphere. These elements, when released, affect the purity of our environments which in turn affects the lives of both humans and other living things.
This study is focused on assessing the concentrations of Na, K, P, and Ca in the combustibles (branches and leaves) and PM2.5 emitted during the combustion process of the same biomass. These are elements that plants need to grow and have been shown to be present as water-soluble ions in PM2.5 which can easily form compounds with other elements. These elements were therefore selected because of their key roles in the development and functionality of plants and also their prominent presence in PM2.5, as proven in previous studies.
The primary goals of this research were to determine: (1) the concentration differences of the elements Na, K, P, and Ca in combustibles (tree species and plant organs) and in PM2.5; (2) the relationships that exist between these elements in combustibles and their concentrations in the PM2.5 emitted during combustion; and (3) the relationships that exist among Na, K, P, and Ca within the emitted PM2.5. This will provide information that will encourage the development of new solutions to deal with urban forest litter in order to reduce its impact on urban air quality and human health.
2. Materials and Methods
2.1. Study Area
This research was carried out in Fuzhou city, Fujian Province, China, which is geographically located between 25°15′–26°39′ north latitude and 118°08′–120°31′ east longitude [32]. Topographically, Fuzhou is a mountainous city in which hills account for 72.68% of the total land area, with forest cover reaching 58.36% of the total [33]. Though the city is located in a hilly area, the center of the city lies at the bottom of a basin across which the Min River flows into the sea. In this city, the major sources of air pollutants are road transportation, factories, and biomass burning due to the expansion of the city, its increase in population, and the need for resources. The authors of [34] revealed that air pollutants were highly concentrated in the center of the city with sparse vegetation cover.
In this study, six urban landscape tree species that are common in Fuzhou urban settlements were chosen, three of which were conifers and three of which were broad-leafed urban landscape tree species. The tree species were Ficus macrocarpa, Michelia × alba, Pinus Thunbergii, Platycladus Orientalis, Araucarii cunninghamii, and Mangifera indica. These tree species are from the Moraceae, Magnoliaceae, Pinaceae, Cupressaceae, Araucariaceae, and Anacardiaceae families, respectively. These trees thrive in subtropical climates with well-drained soil and adequate water supply. Coniferous tree species often have needle-like leaves and lose water at a slower rate than most broad-leaf tree species, which have broad leaves and are more likely to lose water at a faster rate. The woody structure of these species also varies; most conifers have soft and light wood, whereas broad-leaf species are recognized for the high density and strength of their wood.
2.2. Sample Collection and Preparation
The samples were obtained in June 2024 in an urban context in Fuzhou (Figure 1) from randomly selected trees of the six tree species. Samples were collected randomly around the canopy of each selected tree. All selected trees were within the same geographical location to minimize the effect of soil nutrient concentration differences, which may affect nutrient absorption rates. To reduce the possibility of collecting samples that were heavily contaminated with industrial wastes or air pollutants from vehicular transport, the samples were collected away from industrial facilities and roads.
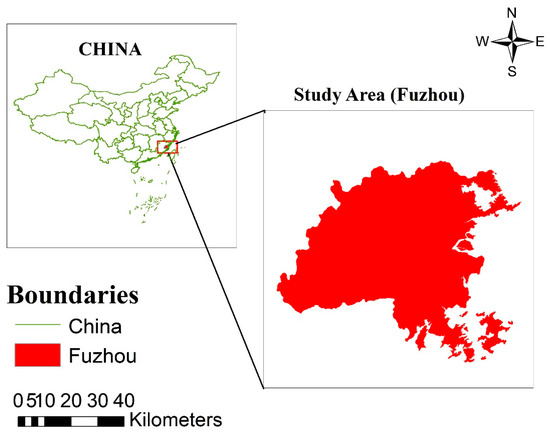
Figure 1.
The study area (Fuzhou City).
Fresh branches (≤10 mm thick and cut about 5 cm long) and leaves were randomly collected from the tree canopies and placed directly into sample bags without coming into contact with the ground in order to prevent sample contamination. The branches and leaves were analyzed, since these are crucial tree organs that are frequently generated as urban tree wastes, either by natural mechanisms or pruning. The sample bags were then firmly sealed and taken to a laboratory for processing.
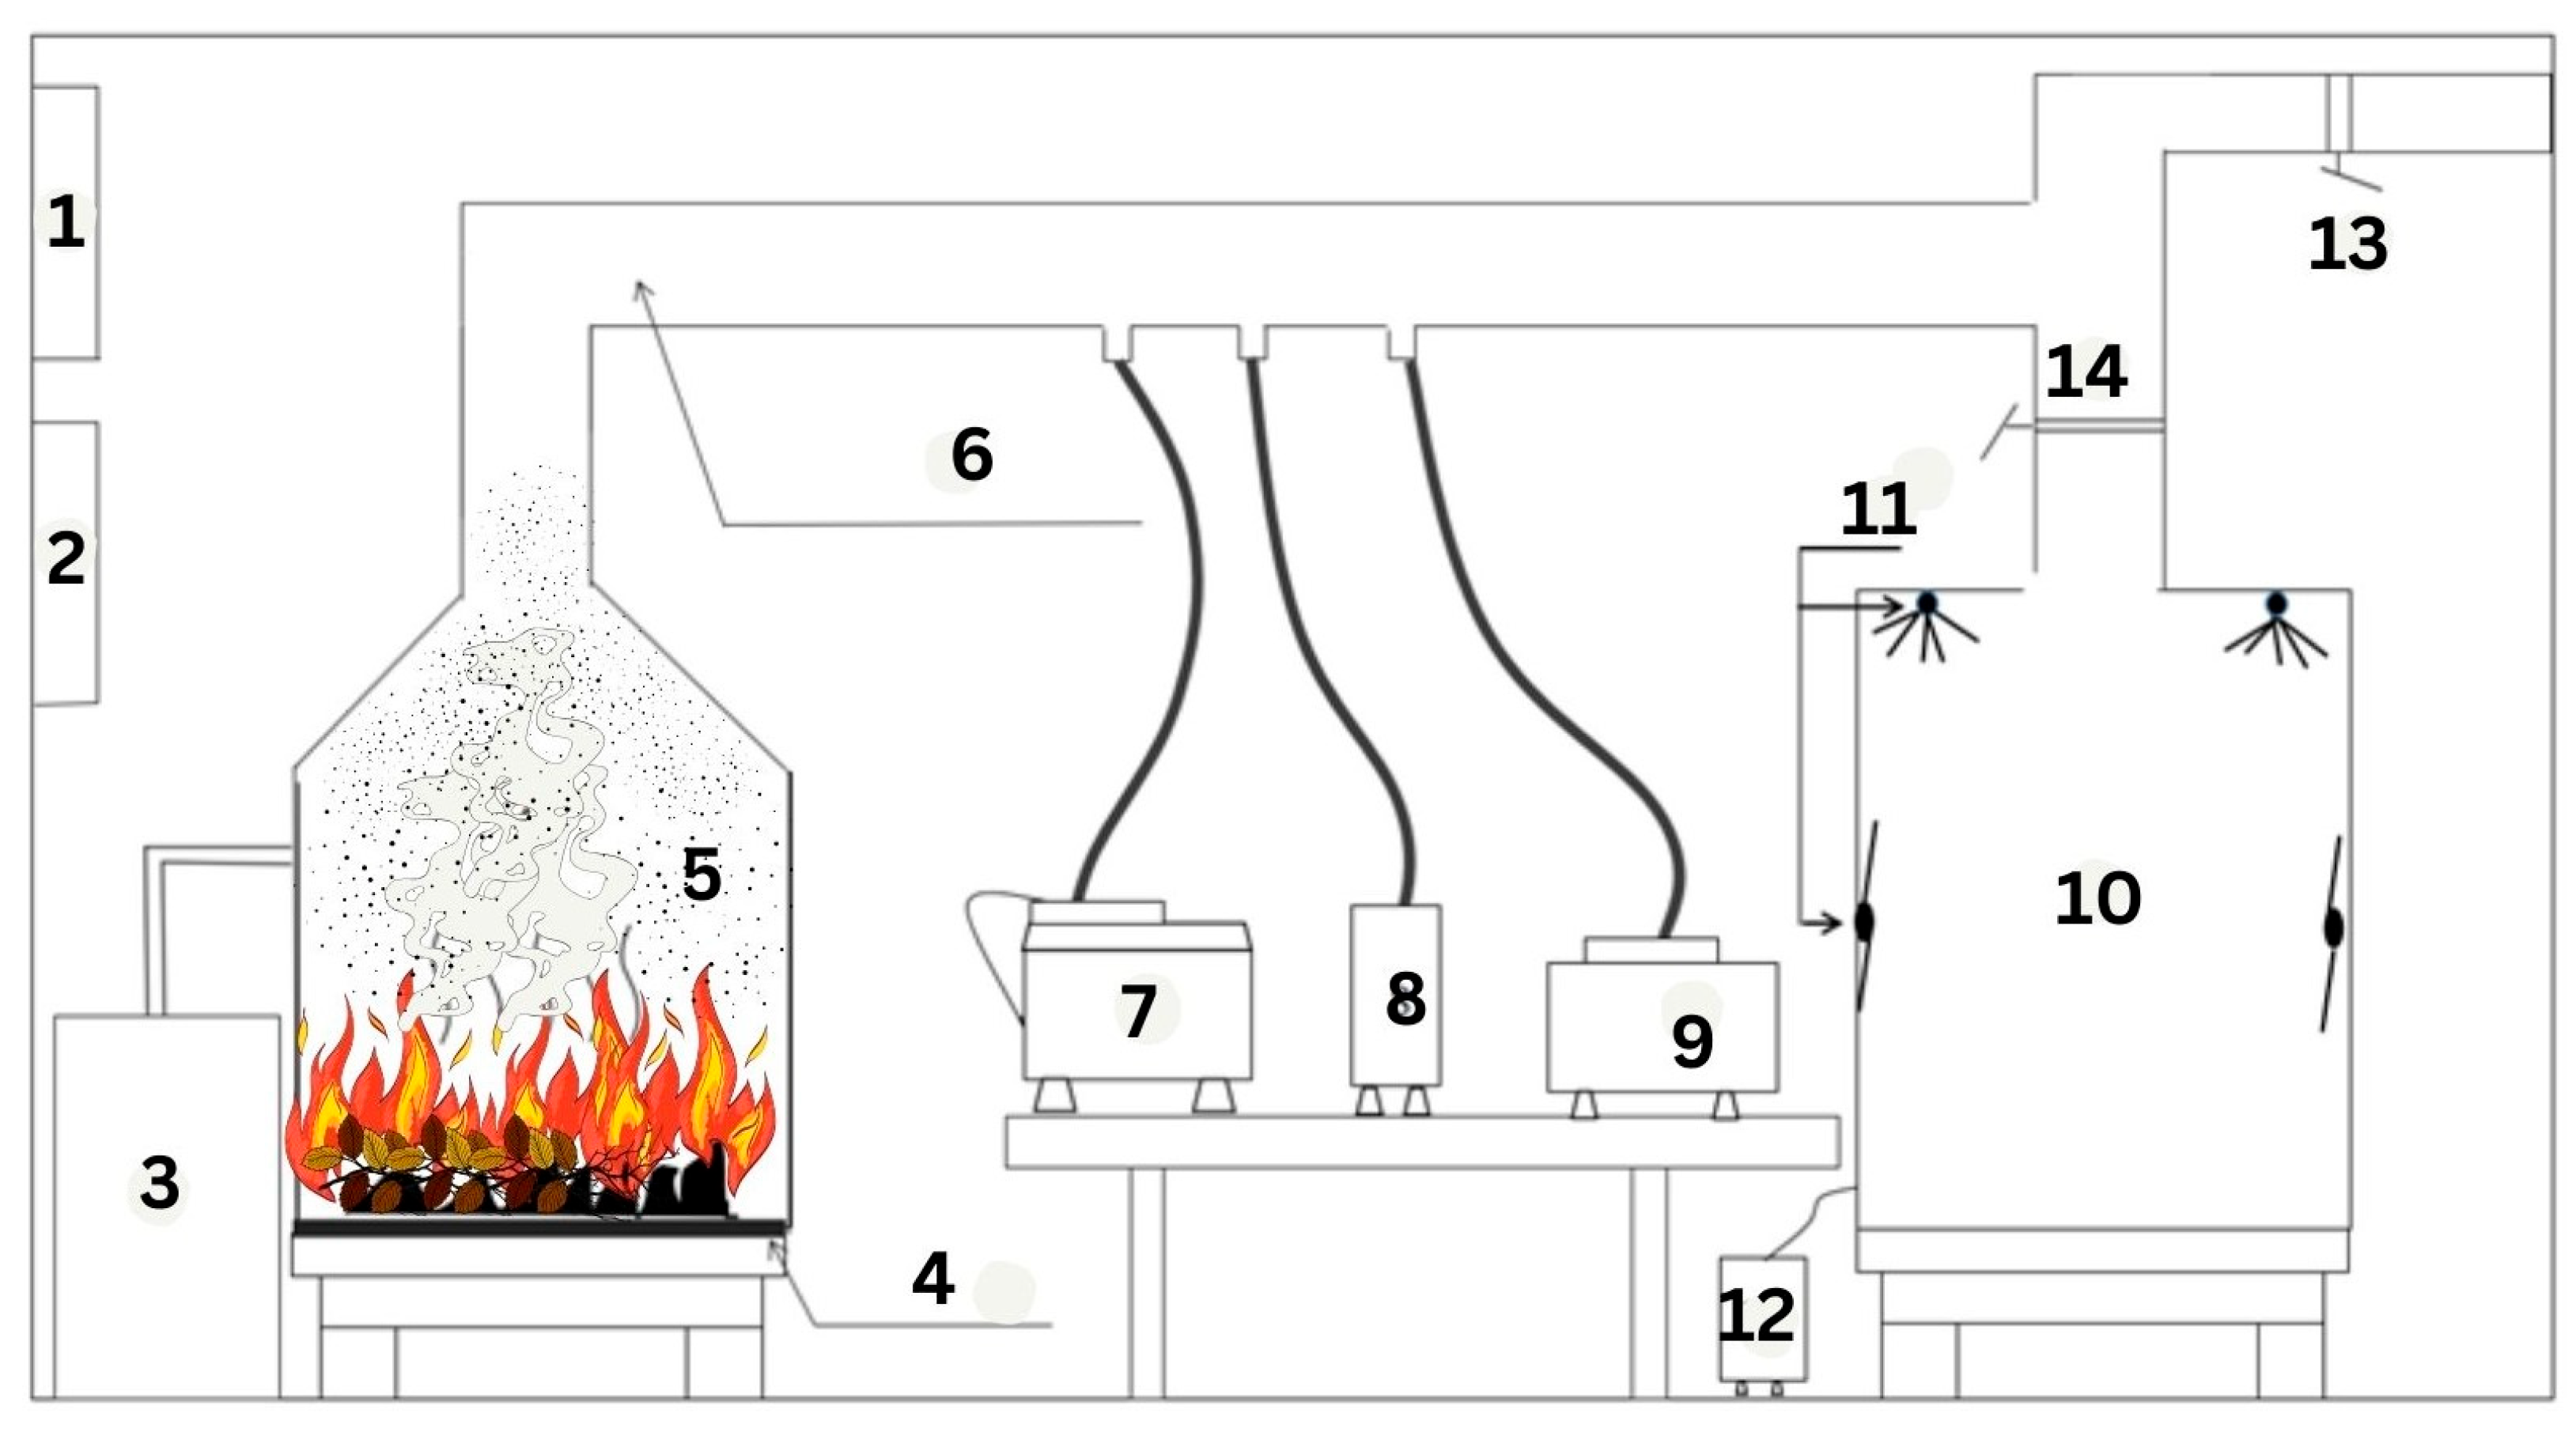
In the laboratory, the samples were dried at 80 °C in an electric blast drying oven (Shanghai Jinghong Industry Company Ltd., Shanghai, China, DHG-9240A) until consistent weights were reached. This temperature was chosen in order not to impact the status of elements (Na, K, P, and Ca) as recommended in [35]. Note that the drying temperature might have different effects on the elemental properties of the combustibles, which needs to be considered. Each set of samples was divided into two sets and tested for Na, K, P, and Ca concentrations in combustibles and PM2.5, respectively. One part was ground for elemental assessment of the combustibles, while the other was burned to capture PM2.5 samples. To ensure an effective combustion process, the branches for combustion were chopped to a length of about 5 cm; 25 g of each sample was used (scale accuracy = 0.001 g (PY-E627, China, Puyan)). The samples were burned using a biomass combustion machine (Figure 2), which was preheated to 2000 °C before each test to prevent smoldering. The combustion process was maintained by using an oxygen pump, which delivered oxygen to the combustion chamber at a rate of 20% per minute. Teflon-polytetrafluoroethylene (PTFE) membrane filters were used in a PM2.5 sampler (SKC-DPS, SKC Corporation, United States of America, 863 Valley View Road, Eighty Four, PA 15330-9613) to collect PM2.5 during the combustion process of each sample.

Figure 2.
Schematic diagram of the biomass combustion device. 1. Temperature outlet; 2. Pressure outlet; 3. Oxygen pump; 4. Heating Furnace; 5. Combustion tank; 6. Flue gas flow pipe; 7. Flue gas analyzer; 8. Particulate matter sampler; 9. Particle analyzer; 10. Smoke retention chamber; 11. Fans; 12. Electric sampler; 13–14. Exhaust valve.
2.3. Samples Testing
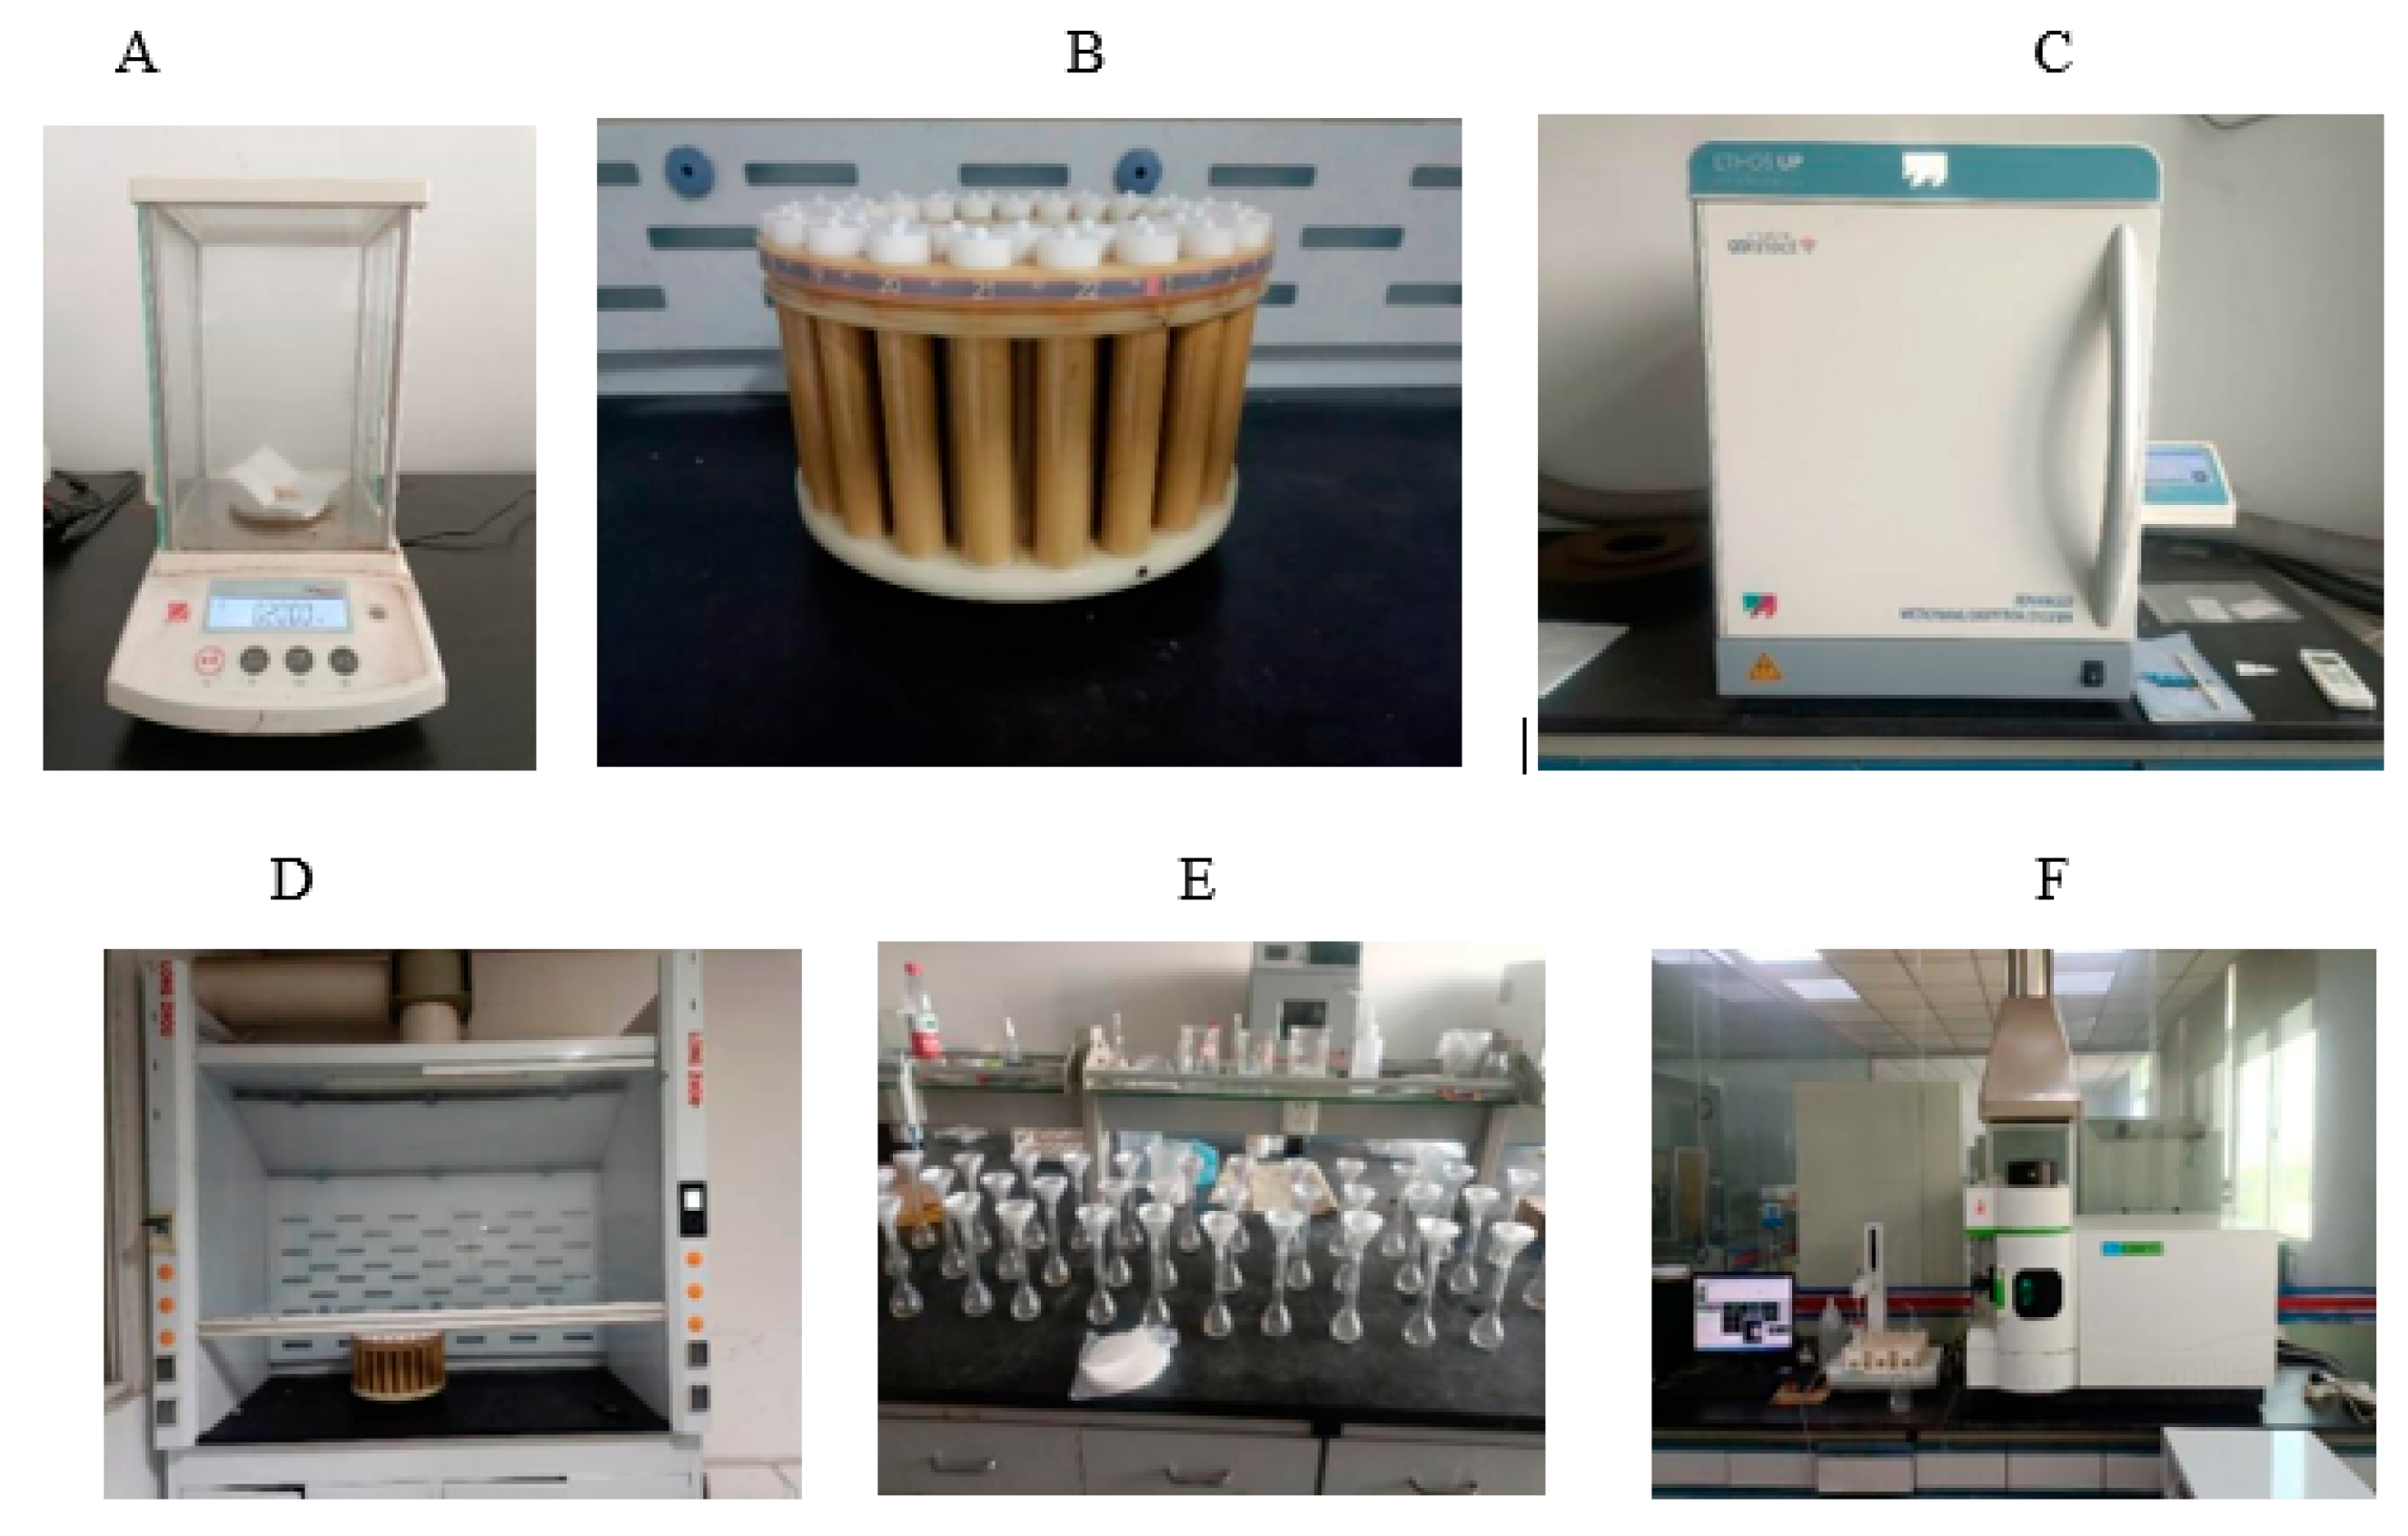
In order to assess the elemental concentrations in the combustibles, 0.2 g (Figure 3A) of each ground sample was combined with 5 ml of nitric acid (HNO3) and 10 ml of 30% hydrogen peroxide (H2O2) in a microwave digestion tube (Figure 3B). After 90 minin an Advanced Microwave Digestion System (Figure 3C), the samples spent 30 mins in a cooling chamber (Figure 3D). The samples were placed in an advanced microwave in order to extract the elements in the ground combustibles. After cooling, the solutions were filtered to separate the solvent from the solute (Figure 3E) and analyzed using an ICP-MS analyzer (Figure 3F). This analyzer was used to measure the concentrations of Na, K, P, and Ca in each of the filtered solutions. In testing the concentration of Na, K, P, and Ca in the PM2.5, each of the samples collected during the combustion process was extracted in a different vial with deionized water. The extraction was done by submerging the samples in water in an ultrasonic mechanical shaker for 90 min. Following the extraction, the solution was filtered using micro-porous membranes with a 0.45 mm pore size, and the concentrations of Na, K, P, and Ca in the solution were assessed using an ICP-MS analyzer. Each of the tests specified above was conducted three times, and the averages were used in the overall assessments of the parameters evaluated in this study.

Figure 3.
Sample preparation and elemental concentration assessments. (A) Weighing samples; (B) Samples in microwave tubes; (C) Microwaving samples; (D) Sample cooling, (E) Filtering Samples; (F) Analyzing samples using an ICPS Analyzer.
2.4. Data Analysis
R-Studio, Origin Pro 2024 version, and Excel were used to analyze the data collected for this study. Excel was used for data preparation, Origin Pro was used to create elemental concentration graphs, and R-Studio was used for pathway Structural Equation Modeling (SEM Pathway Analysis). Pathway analysis is an approach for determining the degree and path of a relationship between observable parameters. In general, structural equation modeling is used to draw conclusions about causality in observational data [36]. In order to comprehend the direction and magnitude of the elemental correlations based on their concentrations in PM2.5 and combustibles, as well as within PM2.5 itself, SEM pathway analysis was used. In the SEM analysis, the magnitude at which each of the elements assessed in the combustibles of the tree species contributed to their presence in PM2.5 was highlighted. A pathway analysis was done in which the directions of the effects were highlighted with arrows and the effects presented in numbers per unit increment.
3. Results
The assessment methods used in this study were species-based and organ-based. Coniferous and broad-leaf trees found in urban areas were the tree species evaluated in this study, and the branches and leaves were the tree organs evaluated.
3.1. Elemental Composition in Combustibles
There were differences in the concentrations of Na, K, P, and Ca in the combustibles, as well as in the concentrations of the elements evaluated among tree species and organs, as in Table 1 and Figure 4.

Table 1.
Concentration of elements in the combustibles and PM2.5 emitted during combustion.

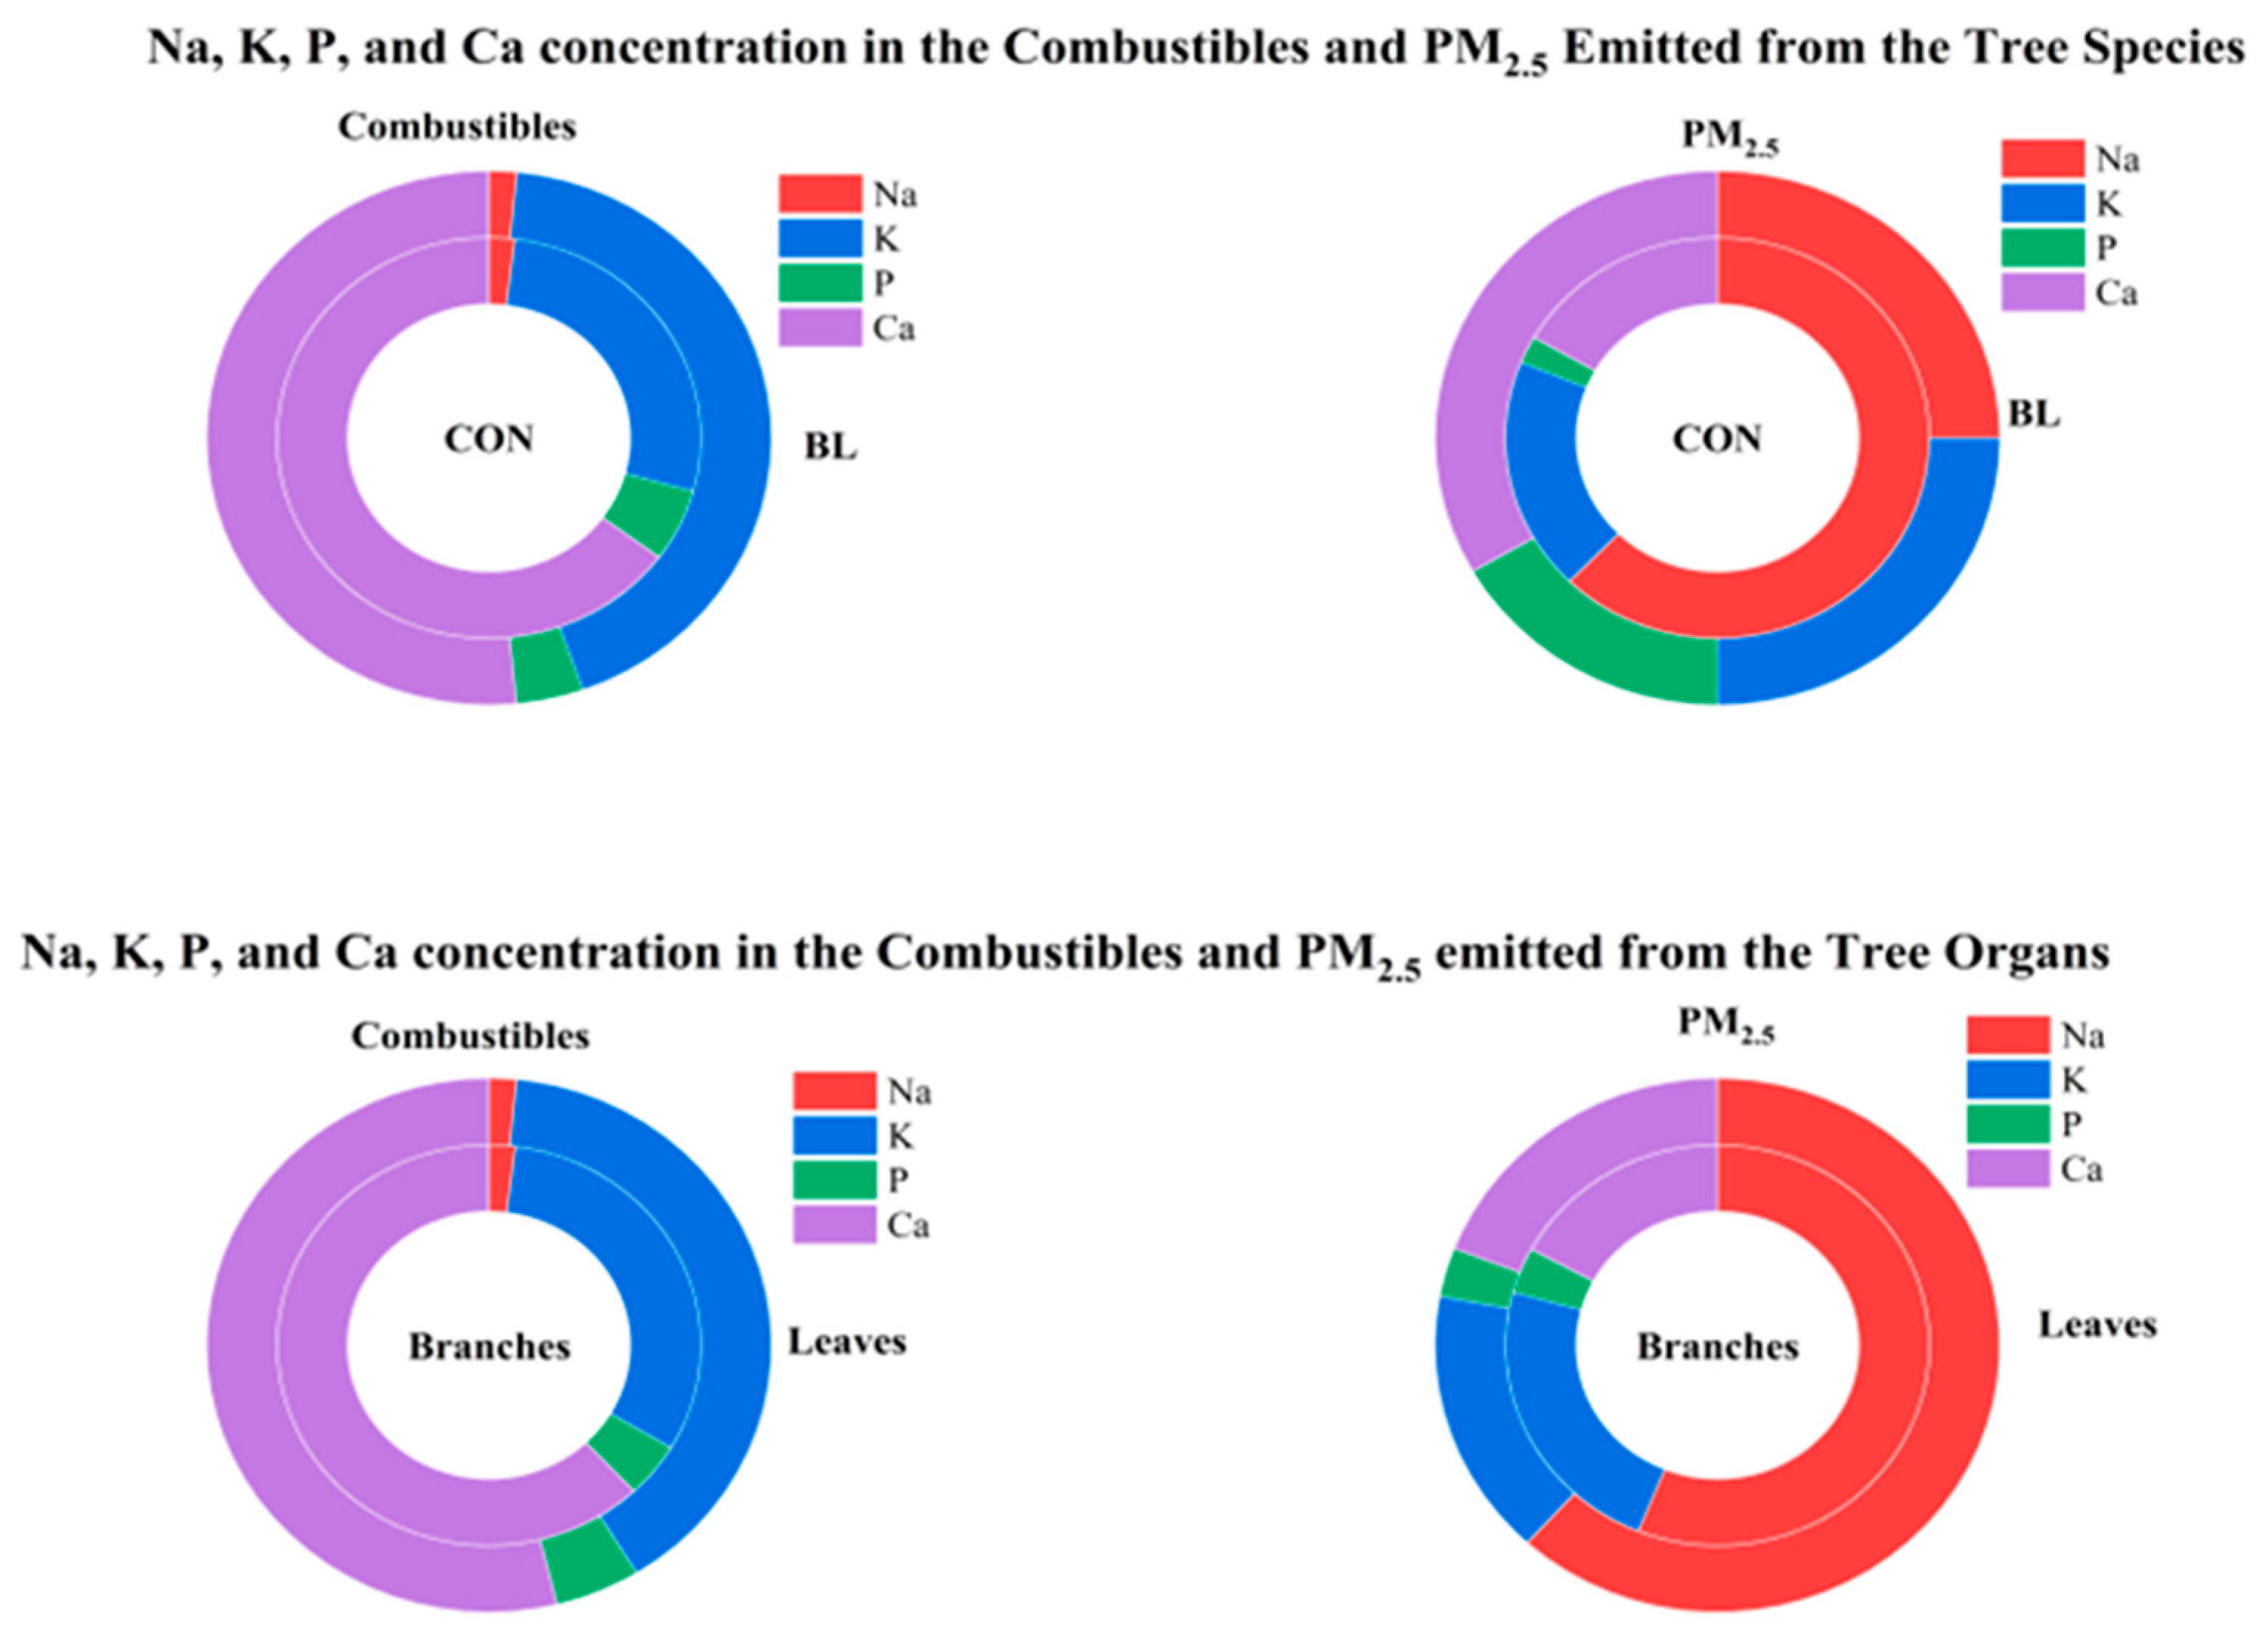
Figure 4.
Elemental concentration in the combustibles (conifers (CON), broad-leaf (BL)), i.e., branches and leaves, and in the PM2.5 emitted during combustion. Na = Sodium; K = Potassium; Ca = Calcium; P = Phosphorous; PM2.5 = Fine Particulate Matter.
The elemental concentrations of broad-leaf (BL) and conifer (CON) tree species differed, according to the data in Table 1; Figure 4. In both species, the highest concentrations were observed for Phosphorus (CON = 60.56 mg/kg and BL = 65.06 mg/kg) and Potassium (CON = 25 mg/kg and BL = 54.27 mg/kg). Sodium (CON = 1.83 mg/kg and BL = 2.00 mg/kg) and Calcium had the lowest concentrations (CON = 5.45 mg/kg and BL = 4.82 mg/kg). For all elements, the broad-leaf tree species had the highest elemental concentrations except for Phosphorus, which was more concentrated in the conifers. Despite variations in concentration levels, the conifers and broad-leaf tree species shared the same elemental concentration patterns: Ca > K > P > Na.
In comparing the elemental concentrations of the tree species and organs, there were similarities. Comparing the branches and leaves, the leaves had the highest elemental content (see Table 1, Figure 4). The concentrations of Na, K, P, and Ca in the leaves were 2.03 mg/kg, 51.41 mg/kg, 6.30 mg/kg, and 69.85 mg/kg, respectively, whereas the branches contained 1.80 mg/kg, 28.37 mg/kg, 3.97 mg/kg, and 55.78 mg/kg. Across all leaves and branches, the elemental profiles were consistent. Ca was the most abundant element, with 69.85 mg/kg in leaves and 55.78 mg/kg in branches. K was the second most concentrated element, followed by P. Na consistently had the lowest content in both organs, measuring 2.03 mg/kg in leaves and 1.8 mg/kg in branches. In both leaves and branches, the elemental concentration trends were as follows: Ca > K > P > Na.
There were significant observed variations between burning the branches and leaves of tree species together and burning them separately. When both tree species were burned together, P and Ca were found to be more concentrated in the leaves. In contrast, Na concentrations remained low in both tree-species and organ-based assessments.
3.2. Elemental Composition in PM2.5
The concentrations of the four elements (Na, K, P, and Ca) were also measured in the PM2.5 to determine the rate of emission from the same combustibles (tree species and organs).
The Na, K, P, and Ca concentrations in the PM2.5 emitted by conifers were 0.86 mg/kg, 0.26 mg/kg, 0.03 mg/kg, and 0.23 mg/kg, respectively, indicating that Na was the most concentrated element in PM2.5 and P the least. The broad-leaf tree species pattern was distinct, with Ca being highly concentrated in the PM2.5 generated (0.04 mg/kg) and P having the lowest concentration (0.02 mg/kg). In contrast, the amounts of Na and K in PM2.5 released by broad-leaf tree species were the same (0.03 mg/kg), and P continued to be the least concentrated element in the PM2.5 released from both tree species.
As shown in Table 1, the elemental concentrations in the PM2.5 emitted by burning the tree organs varied, with distinct patterns as compared to the species-based assessment. The concentration pattern of Na, K, Ca, and P in PM2.5 from the branches was as follows: Na > K > Ca > P (Na = 0.46 mg/kg, K = 0.19 mg/kg, Ca = 0.14 mg/kg, and P = 0.03 mg/kg). The elemental concentrations of PM2.5 in leaves varied, although Na (0.42 mg/kg) and P (0.02 mg/kg) remained as the elements with the highest and lowest concentrations, respectively, and Ca (0.13 mg/kg) was the second most concentrated element, followed by K (0.11 mg/kg).
3.3. Elemental Emission Efficiency
In the PM2.5 released by the tree species (Table 1), it was found that Na was efficiently emitted by both conifers (44.99%) and broad-leaf (1.5%) tree species when compared to the other elements. P was recorded to be the third most concentrated element in the PM2.5 emitted from conifers after K, with broad-leaf tree species showing a distinct pattern. Coniferous and broad-leaf tree species released 0.55% and 0.41% of their total P content, respectively. During burning, 1.02% and 0.38% of the total K and Ca concentrations in conifers and BL were released, respectively. These variations demonstrated the influence of tree species on the elemental composition of PM2.5 during biomass combustion processes in metropolitan environments.
In contrast, in the plant organ-based assessment, both branches and leaves revealed the same trend of emission efficiency (Na > Ca > K > P) but at different concentration levels. Na, K, P, and Ca each released 25.5%, 0.67%, 0.76%, and 0.25% of their observed total concentrations into the PM2.5 released by the branches during combustion. Na (20.69%) was the most concentrated in the PM2.5 emitted by the leaves, followed by P (0.32%), K (0.21%), and Ca (0.19%).
Overall, Na was more efficiently emitted during the combustion processes of both tree species (CON and BL) and plant organs (branches and leaves) than the other elements.
3.4. Structural Equation Modeling to Understand the Direction and Strength of the Underlying Relationships of the Elements
In the structural equation model (SEM) Pathway Analysis results (Figure 5 and Figure 6), the level at which the elements in the combustibles related to the concentration of the same components in PM2.5 was assessed, and the interactions of these elements were evaluated. This revealed the nature and magnitude of the correlations between Na, K, P, and Ca in the combustibles to the same elements in the emitted PM2.5. In this investigation, standardized estimates (std.all) were used to examine the direction and magnitude of the correlations among the elements, while the p-values were utilized to validate the significance of these relationships.
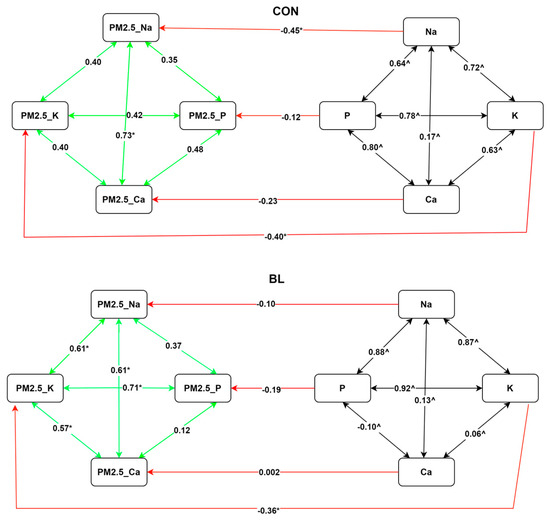
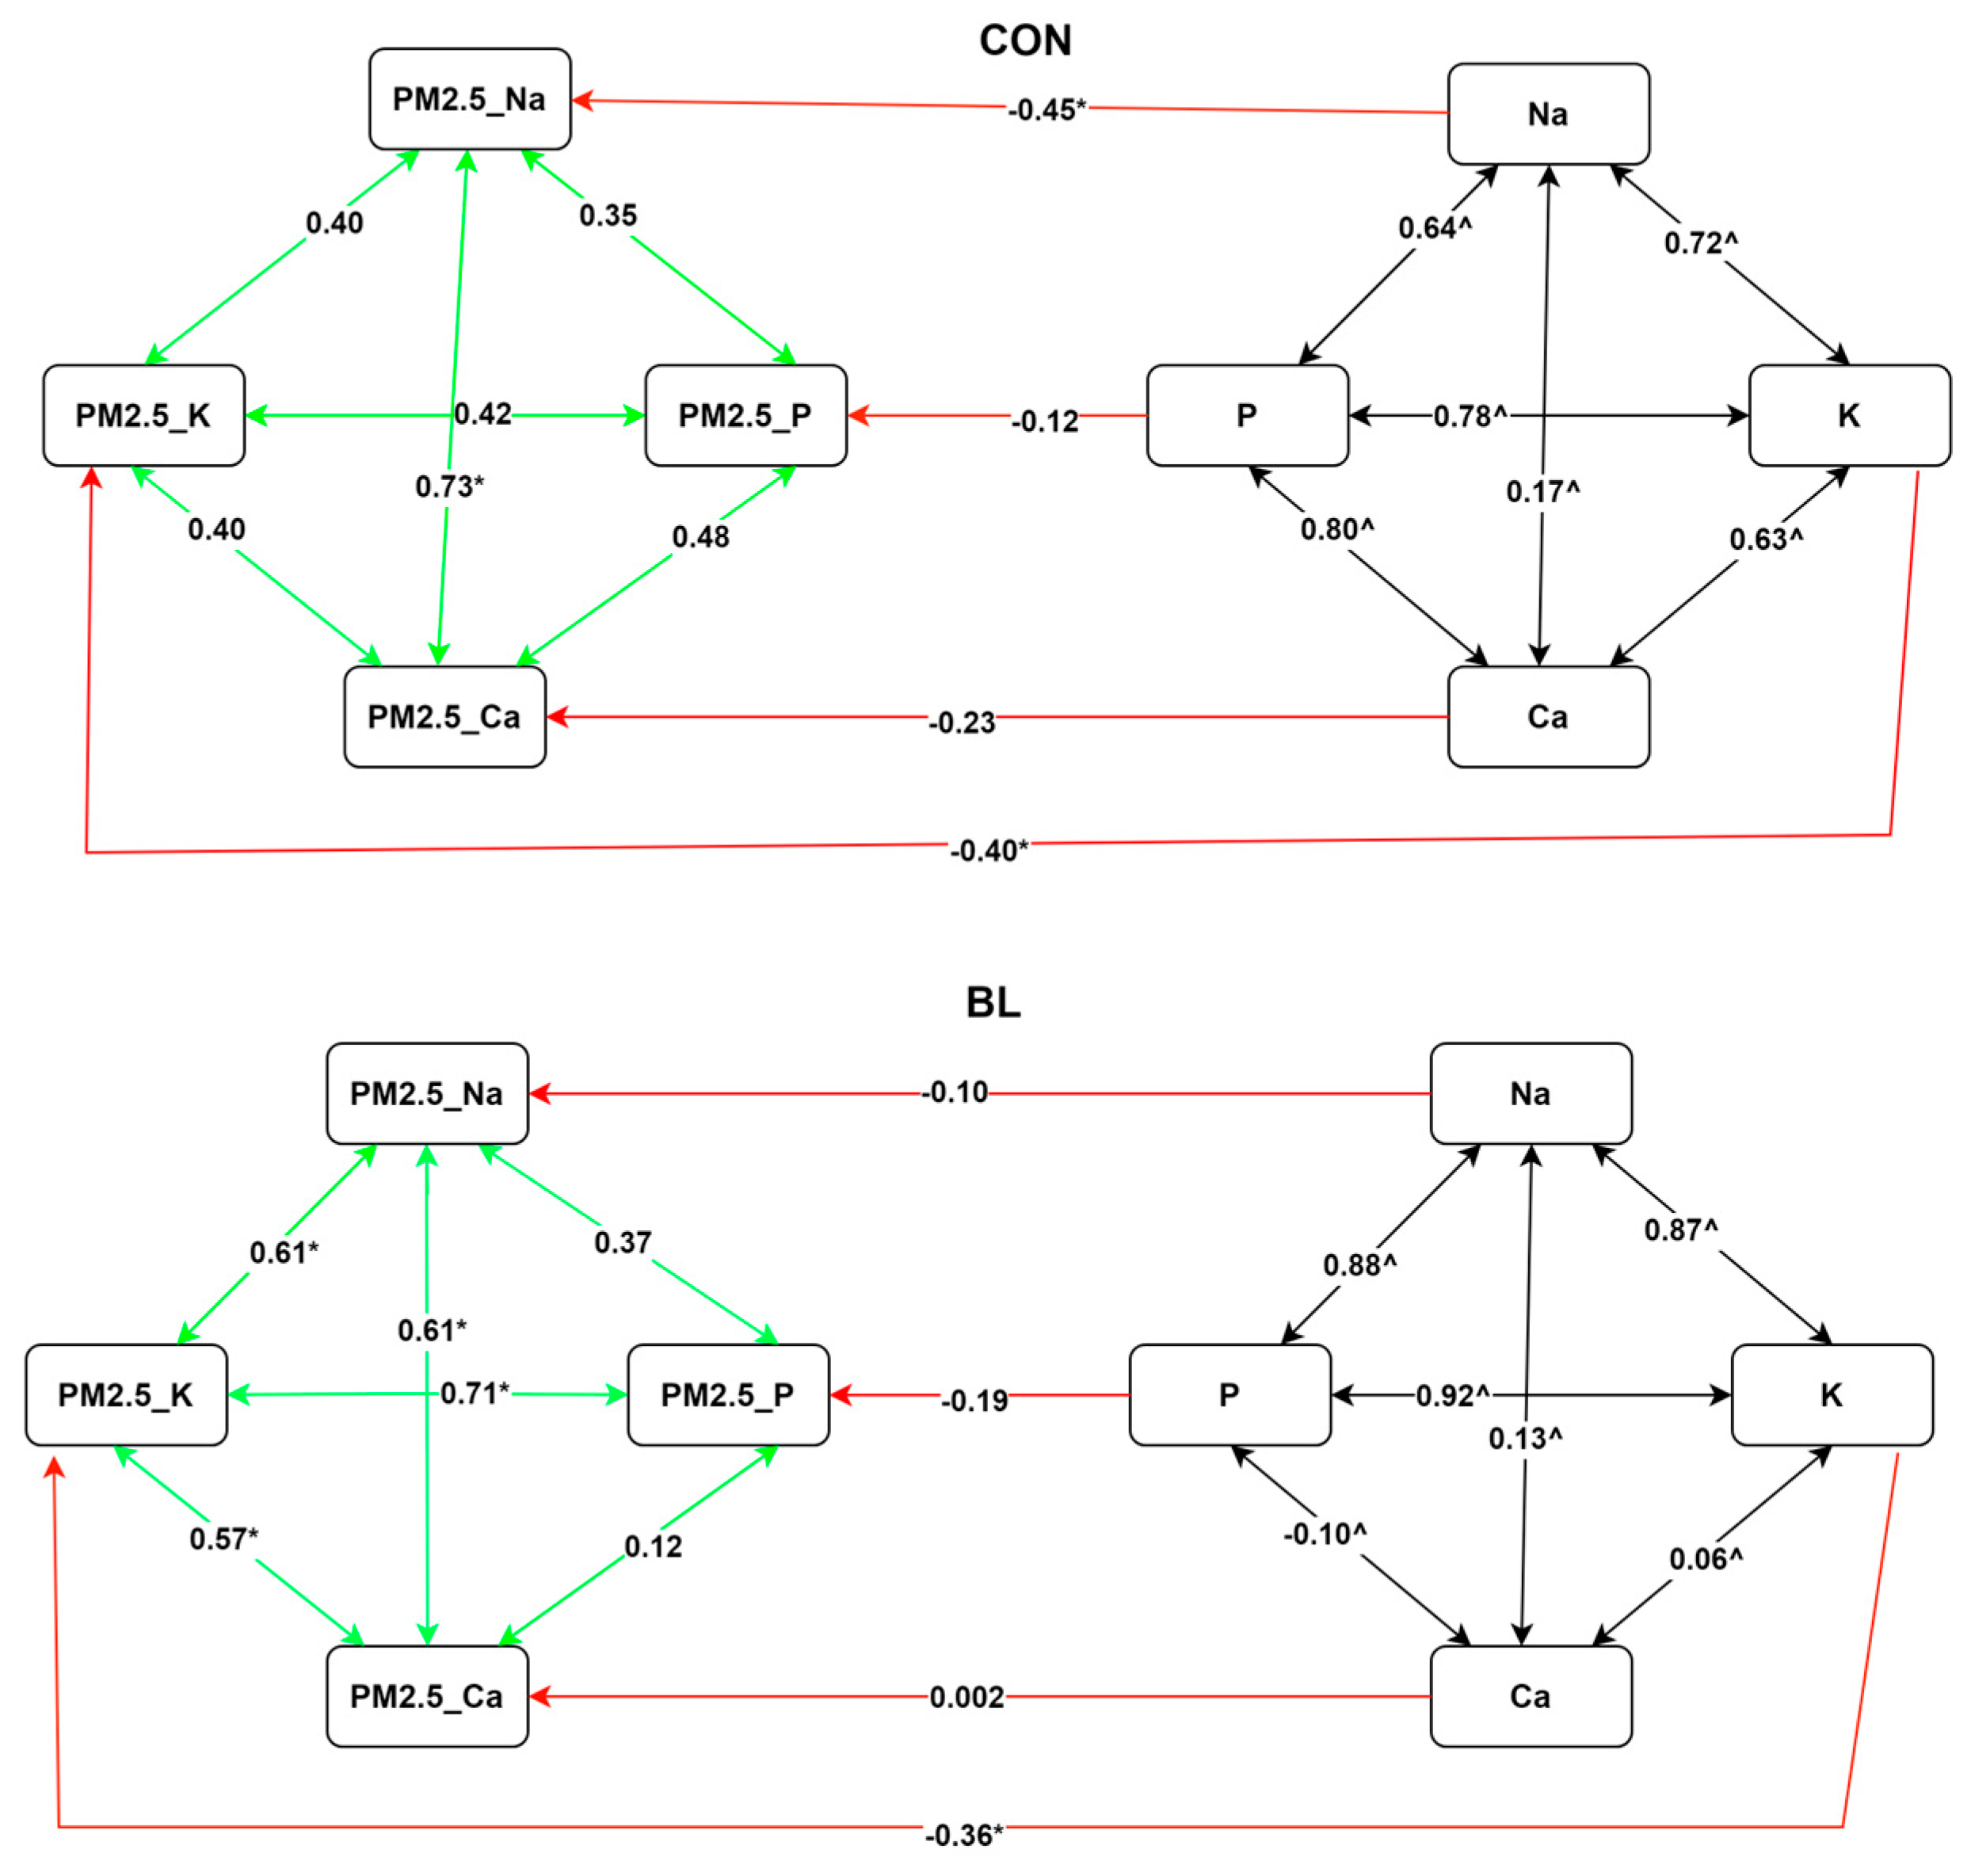
Figure 5.
Elemental correlation direction and strength for tree species (Conifers and Broad-leaf). Note: * = Statistically significant; red line means negative correlation; green line means positive correlations.
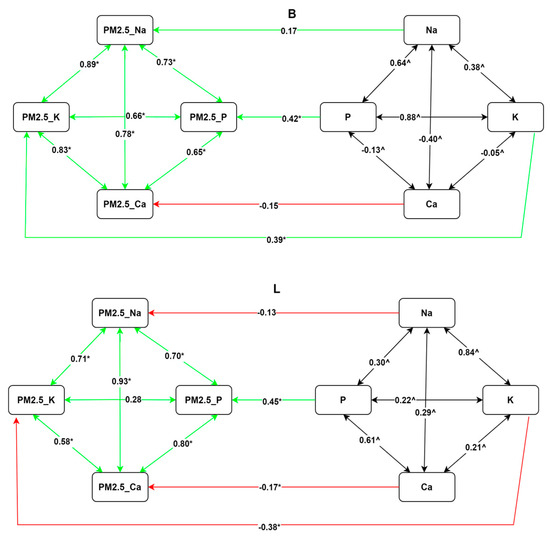
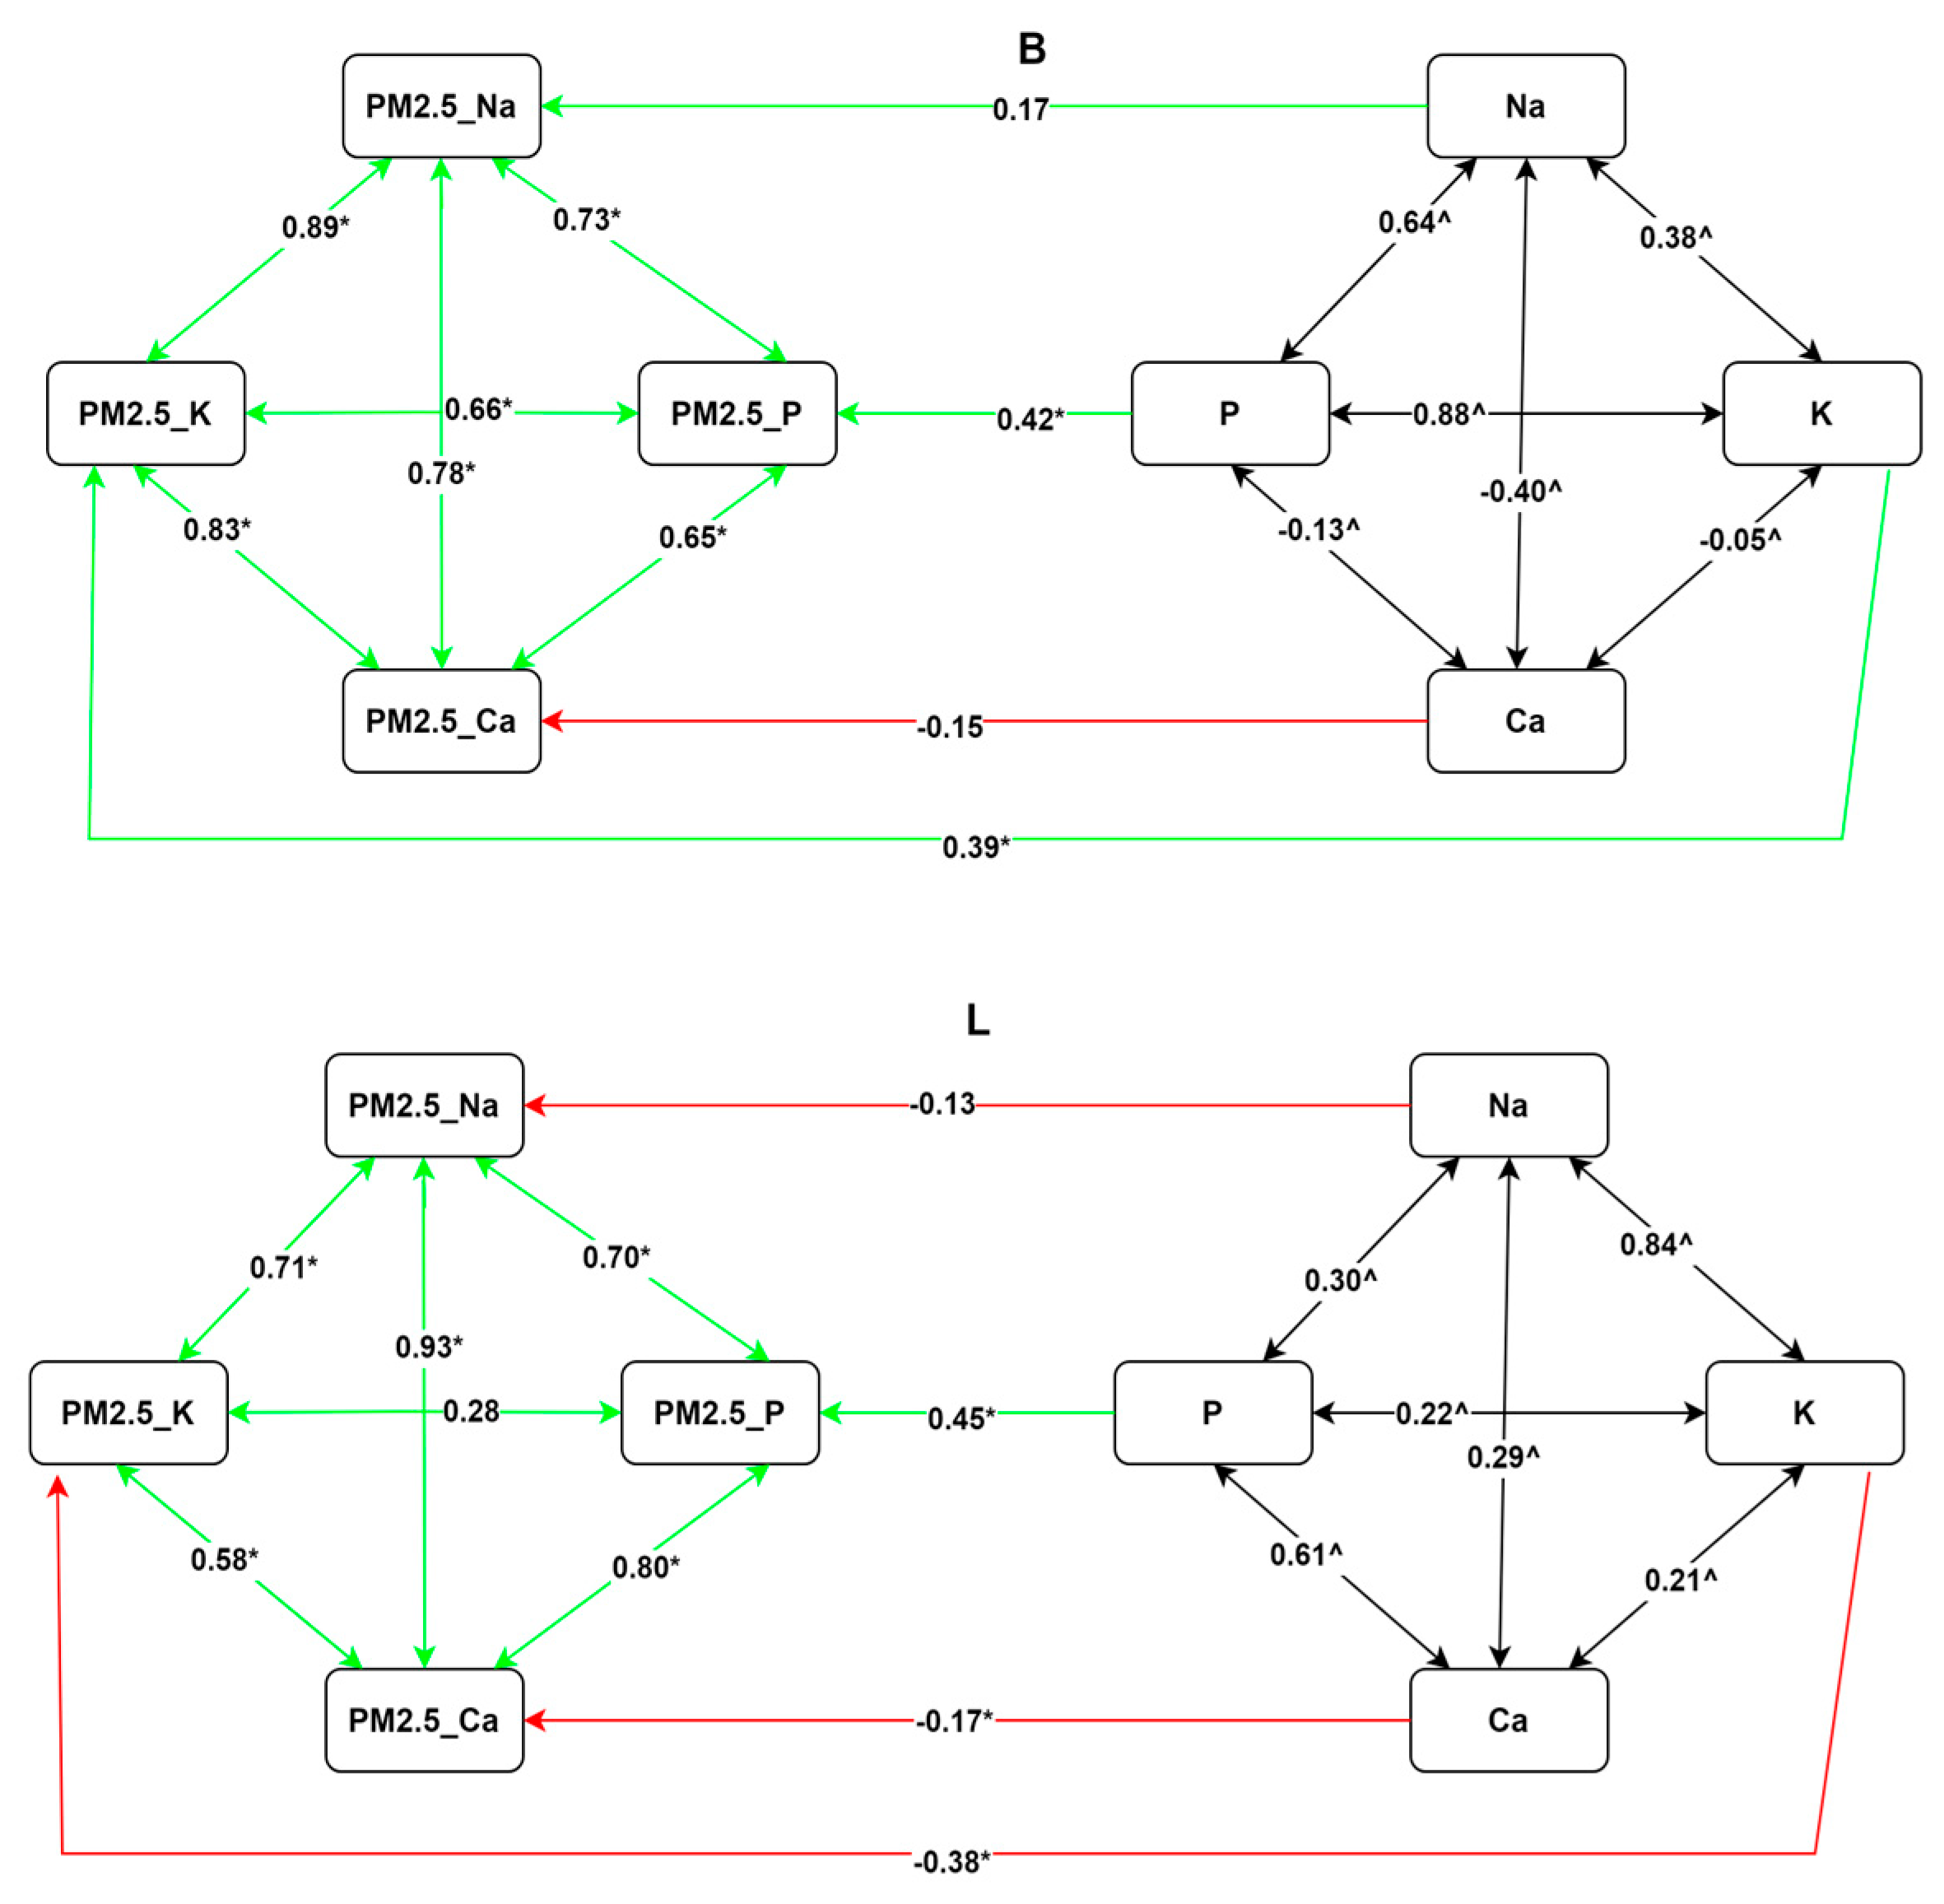
Figure 6.
Elemental relationship direction and strength for tree organs (branches and leaves). Note: * = Statistically significant; red line means negative correlation; green line means positive correlations.
3.4.1. The Relationships of Elements in the Combustibles (Tree Species and Plant Organs) with Their Concentrations in PM2.5 Emitted
The correlation detected between the elements (Na, P, K, and Ca) in conifer combustibles (CON) and their concentrations in the released PM2.5 were negative and insignificant, except for Na and K. The magnitudes of these correlations were estimated to be −0.45, −0.12, −0.23, and −0.40, respectively. Negative associations were also found between Na, P, K, and Ca in PM2.5 from broad-leaf tree species (BL) and the same elements in PM2.5, except for Ca, with a magnitude of 0.002. Apart from K, which had an estimated magnitude of −0.36, none of these relationships were statistically significant.
Different trends were observed in the relationships of elemental concentrations in combustibles and those in PM2.5 for plant organs (Figure 6). The relationships between the elements in the branches and those in the PM2.5 were positive except for Ca (−0.15), which was not statistically significant. In terms of branches emissions, P had a greater correlation magnitude (0.42) than the other elements. Na and K had a correlation magnitude of 0.17 and 0.39 per unit, except for the Na relationship, which was not statistically significant. In contrast to the branches, the leaves followed a different pattern. Only P had a positive relationship, which was also statistically significant, with an estimated magnitude of 0.45. The remaining elements exhibited negative magnitudes (Na = −0.13, Ca = −0.17 and K = −0.38), and only Na was not statistically significant. In all cases, P in combustibles had the highest positive estimated relationship magnitude with P in emitted PM2.5 from both tree species, while the highest negative estimated correlation magnitude was in the link between K in leaves and K in PM2.5.
3.4.2. Relationships Among Elements in the PM2.5 Emitted from Combustibles (Tree Species and Plant Organs)
The interactions of the elements within the PM2.5 emitted by combustibles (tree species and plant organs) were further investigated, revealing the direction and magnitude of their correlations (Figure 5 and Figure 6). In the PM2.5 from conifers (Figure 5: CON), elements positively influenced one another, but only the effects of Na on Ca (0.73) and vice versa were statistically significant. The lowest estimated elemental correlation magnitude in the PM2.5 was between Na and P (0.35), followed by K and Ca (0.40), which corresponded to our estimate for the K and Na relationship magnitude. The most influential correlation found in this study for conifers was between Na and Ca, which was assessed to have a correlation magnitude of 0.78, followed by the relationships of P with Ca (0.48) and P with K (0.42). The broad-leaf tree species showed a different pattern, with more statistically significant influential associations (Figure 5: BL). The strongest association with a higher magnitude was between K and P (0.71), followed by Na and Ca, which had the same strength as Na and K (0.61). The weakest relationship was K with Ca (0.57), following P with Na (0.37) and P with Ca (0.12).
Different relationships were observed in the PM2.5 released by plant organs (Figure 6). As observed in the PM2.5 from the branches, all the elements demonstrated statistically significant positive associations with one another. The most influential interactions of elements in the emitted PM2.5 was predicted to be 0.89 for Na with K, followed by 0.83 for K with Ca (Figure 6: B). The weakest correlation was seen between P and Ca (0.65), followed by P with K (0.66), Na with P (0.73), and Na with Ca (0.78).
The associations of elements within the PM2.5 from leaves and branches differed, with only one minor relationship between P and K (0.28) being observed, despite the fact that all relationships were positive (Figure 6: L). The most influential relationship was that of Na with Ca (0.93), followed by P with Ca (0.80), Na with K (0.71), Na with P (0.70), and K with Ca (0.58). When the Na, K, P, and Ca levels in the PM2.5 from tree organs were compared, the strongest association was found between Na and Ca from the leaves, while the weakest was between P and K from the branches.
4. Discussion
This study provides a systematic examination of the elemental composition of combustibles from coniferous and broad-leaf tree species in urban contexts, with particular emphasis on Sodium (Na), Potassium (K), Phosphorus (P), and Calcium (Ca). The findings demonstrate significant differences in the elemental concentrations of the aforementioned elements among tree species and plant organs (branches and leaves), as well as their impact on PM2.5 elemental concentration.
The study discovered that broad-leaf trees consistently had higher concentrations of Na, K, and Ca than conifers; the notable exception to this was P, which was slightly higher in conifers. This is consistent with prior studies, which found that broad-leaf tree species have higher nutrient accumulations because of their faster growth rates and leaf surface area, which enhance nutrient uptake. The authors of [37] explored the ability of conifers and broad-leaf tree species to partition nutrients, confirming our findings on elemental concentration variations between plant organs. When the organs were analyzed, the leaves had higher concentrations of all assessed elements than the branches, which is consistent with previous research [38,39]; the findings in those papers revealed that leaves, being the major site of photosynthesis, accumulate greater nutrient concentrations. The discrepancies in elemental concentrations between branches and leaves highlighted the important role that plant organs play in elemental profiling.
Our findings further revealed that Na was the most concentrated element in the PM2.5 from both conifers and broad-leaf tree species; however, conifers had a higher concentration, reflecting species-specific emission dynamics. This robustness in elemental emissions during combustion was also observed in [18], where the influence of a PM2.5 source on its elemental composition was emphasized. PM2.5 elemental concentrations differed among tree organs (branches and leaves), particularly Na and P. This demonstrated that the leaves, unlike the branches, can steadily release the elements contained within them when undergoing combustion. As underlined in [40], the outcome and pollutant toxicity differ under different burning situations (flaming and smoldering). The changes identified in this study are crucial in determining the toxicity of PM2.5; the higher and more complex the elemental concentration in the PM2.5, the more lethal it becomes. This is supported in [20], where it was observed that the composition of PM2.5 dictates its toxicity and target cells within organisms.
Based on the concentrations of elements in combustibles, the emission efficiency of the branches was higher than that of leaves. Though the concentrations of elements in the various plant organs were found to be higher in the leaves, the presence of these elements in the PM2.5 per unit concentration in the tree organs was most noticeable in the branches. At the species level, conifers stood out for their effective release of Na during combustion, despite the fact that Na was present in lower concentrations in the combustibles.
It was discovered that broad-leaf trees have higher concentrations of most elements in their combustibles but much poorer overall emission efficiency, which could be attributed to increased elemental retention in the ash. This mismatch highlighted the need to take tree species into account when assessing the impact of biomass burning on urban air quality. A determination of the elemental emission efficiency of each element revealed Na and P to be the most efficiently released elements from both tree species and organs, revealing emission dynamics among the elements present in combustibles. This is consistent with [41,42], whose authors underlined Na’s volatility during combustion processes.
SEM pathway analysis was used to better understand the interactions, directions, and magnitude that exist among elements between the combustibles and PM2.5, and also within PM2.5. As observed, the elemental concentrations in PM2.5 are linked to the concentrations of those elements in the combustibles. This study found complex associations between elemental concentrations in the combustibles and emitted PM2.5, including both positive and negative correlations. Some of the connections and magnitudes were significant, while others were not, indicating that there are underlying factors that influence the concentrations of these elements in PM2.5 [43]. The negative relationships between the elements in the combustibles and those in PM2.5 revealed that an increase in an elemental concentration in biomass does not always result in a proportional elemental increase in PM2.5. This could be linked to the complex elemental relationships observed in PM2.5, although chemical interactions among elements during combustion could also be a cause. There were more statistically significant relationships among elements in the PM2.5 from broad-leaf trees than that from conifers. The branches exhibited more positive associations among elements in the combustibles and their concentrations in PM2.5 than the leaves. This underscored the significance of species and organ-specific chemical activities during biomass combustion processes. This scenario has been observed in previous studies, which highlighted changes in elemental interactions among tree species [44] and organs [45].
It should be noted that there were elemental differences in the PM2.5 generated from different biomass burning processes. This means that different burning states might affect the release of the elements which affect the elemental composition of the PM2.5; this, in turn, dictates its toxicity and ability to target specific cells in various organisms. For example, conifers were found to emit PM2.5 with a higher concentration of Na, which indicates that people in places with a high proportion of conifer-related PM2.5 may have different health problems from people in areas dominated by broad-leaf tree species-related PM2.5.
Different element concentrations have distinct health consequences for urban dwellers. However, the exact relationship requires further studies on elemental-specific health effects.
Although this study provides valuable information regarding the elemental composition of combustibles from urban tree species and how they affect PM2.5 emissions, more studies are needed to increase the robustness and generalization of the present findings. Future research should focus on the potential implications of seasonal dynamics, combustion parameters, geographical variations, and combustibles contaminant levels. Addressing these issues would help us gain better knowledge of the complicated interactions of the elements from the combustibles to PM2.5 during combustion processes, PM2.5 composition, and potential health consequences in urban areas.
5. Conclusions
As indicated in this study, there are significant disparities in elemental concentrations among tree species, with broad-leaf trees consistently having higher levels of Na, K, and Ca than conifers, while conifers had higher levels of P. This distinction emphasizes the intrinsic chemical differences across species, aided by physiological features that facilitate nutrients accumulation. The results showed that leaves had higher concentrations of all the examined components, indicating their importance as photosynthetic and nutrients storage sites. Notably, Na was shown to be the most efficiently emitted element by both conifers and broad-leaf trees, with conifers being more efficient, showing species-specific elemental release dynamics. The diversity in PM2.5 elemental concentrations emitted from branches compared to leaves indicated differences in how these emissions are related to the concentrations in combustibles.
Furthermore, a SEM analysis revealed the intricate correlations between elemental concentrations in combustibles and the corresponding concentrations in the emitted PM2.5. It demonstrated that the concentrations of elements in combustibles were not the only factor influencing their concentrations in PM2.5, suggesting the possibility of underlying chemical interactions during biomass combustion processes. It was found that broad-leaf tree species had more statistically significant relationships between PM2.5 elemental composition than conifers, emphasizing the importance of taking into account both tree species and organs when dealing with urban biomass-based PM2.5 elemental levels.
Overall, the findings of this study showed that PM2.5 emissions from urban tree species are controlled by complex interactions between species-specific elemental compositions, organ-specific features, and element-specific behavior during combustion. These factors determine the elemental content and thus the potential toxicity and health impact of the PM2.5 emitted during biomass combustion.
According to these findings, future studies should look into the thermal degradation routes of urban tree species to better understand how they behave during burning and which ones release the most dangerous PM2.5. Also, epidemiological research will be necessary to compare the health outcomes from exposure to these emissions in order to quantify the associated health risks when burning diverse tree species in urban environments.
Author Contributions
Conceptualization, F.G., Y.M. and M.B.T.; Methodology: F.G., Y.M. and M.B.T.; Software: M.B.T. and Y.M.; Validation: Y.M., M.B.T., A.Z. and F.G.; formal analysis: F.G., M.B.T. and Y.M.; investigation: M.B.T., Y.M. and J.C.; resources, F.G.; data curation: M.B.T., J.C., P.Z., J.C. and Z.L.; writing—original draft preparation: M.B.T., Y.M., A.Z. and F.G.; writing—review and editing: M.B.T., Y.M., A.Z. and F.G.; visualization: M.B.T. and Y.M.; supervision: F.G.; project administration: F.G.; funding acquisition: F.G. All authors have read and agreed to the published version of the manuscript.
Funding
The study was financially supported by the grant from the National Natural Science Foundation of China (grant No. 32171807).
Institutional Review Board Statement
Not applicable.
Informed Consent Statement
Not applicable.
Data Availability Statement
The raw data supporting the conclusions of this article will be made available by the authors on request.
Conflicts of Interest
The authors declare no conflict of interest.
References
- Cai, S.; Wang, Y.; Zhao, B.; Wang, S.; Chang, X.; Hao, J. The impact of the “Air Pollution Prevention and Control Action Plan” on PM2.5 concentrations in Jing-Jin-Ji region during 2012–2020. Sci. Total Environ. 2017, 580, 197–209. [Google Scholar] [CrossRef] [PubMed]
- Zhang, Q.; Zheng, Y.; Tong, D.; Shao, M.; Wang, S.; Zhang, Y.; Xu, X.; Wang, J.; He, H.; Liu, W. Drivers of improved PM2.5 air quality in China from 2013 to 2017. Proc. Natl. Acad. Sci. USA 2019, 116, 24463–24469. [Google Scholar] [CrossRef] [PubMed]
- Li, X.; Cheng, T.; Shi, S.; Guo, H.; Wu, Y.; Lei, M.; Zuo, X.; Wang, W.; Han, Z. Evaluating the impacts of burning biomass on PM2.5 regional transport under various emission conditions. Sci. Total Environ. 2021, 793, 148481. [Google Scholar] [CrossRef]
- Galea, K.S.; Hurley, J.F.; Cowie, H.; Shafrir, A.L.; Sánchez Jiménez, A.; Semple, S.; Ayres, J.G.; Coggins, M. Using PM2.5 concentrations to estimate the health burden from solid fuel combustion, with application to Irish and Scottish homes. Environ. Health 2013, 12, 50. [Google Scholar] [CrossRef]
- Mitchell, M.G.E.; Devisscher, T. Strong relationships between urbanization, landscape structure, and ecosystem service multifunctionality in urban forest fragments. Landsc. Urban Plan. 2022, 228, 104548. [Google Scholar] [CrossRef]
- Nowak, D.; Heisler, G. Air quality effects of urban trees and parks. In Research Series Monograph. Ashburn, VA: National Recreation and Parks Association Research Series Monograph; National Recreation and Park Association: Ashburn, VA, USA, 2010; pp. 1–44. [Google Scholar]
- Timilsina, N.; Staudhammer, C.L.; Escobedo, F.J.; Lawrence, A. Tree biomass, wood waste yield, and carbon storage changes in an urban forest. Landsc. Urban Plan. 2014, 127, 18–27. [Google Scholar] [CrossRef]
- Nowak, D.J.; Greenfield, E.J.; Ash, R.M. Annual biomass loss and potential value of urban tree waste in the United States. Urban For. Urban Green. 2019, 46, 126469. [Google Scholar] [CrossRef]
- Khudyakova, G.I.; Danilova, D.A.; Khasanov, R.R. The use of urban wood waste as an energy resource. IOP Conf. Ser. Earth Environ. Sci. 2017, 72, 012026. [Google Scholar] [CrossRef]
- Yadav, I.; Devi, N. Biomass Burning, Regional Air Quality, and Climate Change. Encycl. Environ. Health 2019, 2, 386–391. [Google Scholar] [CrossRef]
- Corsini, E.; Marinovich, M.; Vecchi, R. Ultrafine Particles from Residential Biomass Combustion: A Review on Experimental Data and Toxicological Response. Int. J. Mol. Sci. 2019, 20, 4992. [Google Scholar] [CrossRef]
- Jiang, K.; Xing, R.; Luo, Z.; Huang, W.; Yi, F.; Men, Y.; Zhao, N.; Chang, Z.; Zhao, J.; Pan, B.; et al. Pollutant emissions from biomass burning: A review on emission characteristics, environmental impacts, and research perspectives. Particuology 2024, 85, 296–309. [Google Scholar] [CrossRef]
- Wu, J.; Kong, S.; Wu, F.; Cheng, Y.; Zheng, S.; Qin, S.; Liu, X.; Yan, Q.; Zheng, H.; Zheng, M.; et al. The moving of high emission for biomass burning in China: View from multi-year emission estimation and human-driven forces. Environ. Int. 2020, 142, 105812. [Google Scholar] [CrossRef]
- Johnston, H.J.; Mueller, W.; Steinle, S.; Vardoulakis, S.; Tantrakarnapa, K.; Loh, M.; Cherrie, J.W. How Harmful Is Particulate Matter Emitted from Biomass Burning? A Thailand Perspective. Curr. Pollut. Rep. 2019, 5, 353–377. [Google Scholar] [CrossRef]
- Simões Amaral, S.; Andrade de Carvalho, J.; Martins Costa, M.A.; Pinheiro, C. Particulate Matter Emission Factors for Biomass Combustion. Atmosphere 2016, 7, 141. [Google Scholar] [CrossRef]
- Zhang, J.; Wu, L.; Fang, X.; Li, F.; Yang, Z.; Wang, T.; Mao, H.; Wei, E. Elemental Composition and Health Risk Assessment of PM10 and PM2.5 in the Roadside Microenvironment in Tianjin, China. Aerosol Air Qual. Res. 2018, 18, 1817–1827. [Google Scholar] [CrossRef]
- Fang, J.; Gao, Y.; Zhang, M.; Jiang, Q.; Chen, C.; Gao, X.; Liu, Y.; Dong, H.; Tang, S.; Li, T. Personal PM2.5 elemental components, decline of lung function, and the role of DNA methylation on inflammation-related genes in older adults: Results and implications of the BAPE study. Environ. Sci. Technol. 2022, 56, 15990–16000. [Google Scholar] [CrossRef]
- Chatoutsidou, S.E.; Lazaridis, M. Mass concentrations and elemental analysis of PM2.5 and PM10 in a coastal Mediterranean site: A holistic approach to identify contributing sources and varying factors. Sci. Total Environ. 2022, 838, 155980. [Google Scholar]
- Saliba, N.A.; Kouyoumdjian, H.; Roumié, M. Effect of local and long-range transport emissions on the elemental composition of PM10–2.5 and PM2.5 in Beirut. Atmos. Environ. 2007, 41, 6497–6509. [Google Scholar] [CrossRef]
- Jia, Y.-Y.; Wang, Q.; Liu, T. Toxicity Research of PM2.5 Compositions In Vitro. Int. J. Environ. Res. Public Health 2017, 14, 232. [Google Scholar] [CrossRef]
- Wang, H.; Qiao, B.; Zhang, L.; Yang, F.; Jiang, X. Characteristics and sources of trace elements in PM2.5 in two megacities in Sichuan Basin of southwest China. Environ. Pollut. 2018, 242, 1577–1586. [Google Scholar] [CrossRef]
- Violaki, K.; Tsiodra, I.; Nenes, A.; Tsagkaraki, M.; Kouvarakis, G.; Zarmpas, P.; Florou, K.; Panagiotopoulos, C.; Ingall, E.; Weber, R.; et al. Water soluble reactive phosphate (SRP) in atmospheric particles over East Mediterranean: The importance of dust and biomass burning events. Sci. Total Environ. 2022, 830, 154263. [Google Scholar] [CrossRef] [PubMed]
- Ma, Y.; Tigabu, M.; Guo, X.; Zheng, W.; Guo, L.; Guo, F. Water-Soluble Inorganic Ions in Fine Particulate Emission During Forest Fires in Chinese Boreal and Subtropical Forests: An Indoor Experiment. Forests 2019, 10, 994. [Google Scholar] [CrossRef]
- de Bang, T.C.; Husted, S.; Laursen, K.H.; Persson, D.P.; Schjoerring, J.K. The molecular–physiological functions of mineral macronutrients and their consequences for deficiency symptoms in plants. New Phytol. 2021, 229, 2446–2469. [Google Scholar] [CrossRef]
- van Maarschalkerweerd, M.; Husted, S. Recent developments in fast spectroscopy for plant mineral analysis. Front. Plant Sci. 2015, 6, 169. [Google Scholar] [CrossRef]
- Chen, C.; Luo, Z.; Yu, C. Release and transformation mechanisms of trace elements during biomass combustion. J. Hazard. Mater. 2019, 380, 120857. [Google Scholar]
- Nzihou, A.; Stanmore, B. The fate of heavy metals during combustion and gasification of contaminated biomass—A brief review. J. Hazard. Mater. 2013, 256, 56–66. [Google Scholar] [CrossRef]
- Chen, X.; Zhao, P.; Hu, Y.; Ouyang, L.; Zhu, L.; Ni, G. Canopy transpiration and its cooling effect of three urban tree species in a subtropical city- Guangzhou, China. Urban For. Urban Green. 2019, 43, 126368. [Google Scholar] [CrossRef]
- Podhrázská, J.; Kučera, J.; Doubrava, D.; Doležal, P. Functions of windbreaks in the landscape ecological network and methods of their evaluation. Forests 2021, 12, 67. [Google Scholar] [CrossRef]
- Blanusa, T.; Garratt, M.; Cathcart-James, M.; Hunt, L.; Cameron, R.W. Urban hedges: A review of plant species and cultivars for ecosystem service delivery in north-west Europe. Urban For. Urban Green. 2019, 44, 126391. [Google Scholar] [CrossRef]
- Zabret, K.; Šraj, M. Rainfall interception by urban trees and their impact on potential surface runoff. CLEAN–Soil Air Water 2019, 47, 1800327. [Google Scholar] [CrossRef]
- Jin, B.; Geng, J.; Ke, S.; Pan, H. Analysis of spatial variation of street landscape greening and influencing factors: An example from Fuzhou city, China. Sci. Rep. 2023, 13, 21767. [Google Scholar] [CrossRef]
- Zheng, Z.; Lin, X.; Chen, L.; Yan, C.; Sun, T. Effects of urbanization and topography on thermal comfort during a heat wave event: A case study of Fuzhou, China. Sustain. Cities Soc. 2024, 102, 105233. [Google Scholar] [CrossRef]
- Xu, Y.; Weng, D.; Wang, S.; Ge, Q.; Hu, X.; Wang, Z.; Zhang, L. Trends in Emissions from Road Traffic in Rapidly Urbanizing Areas. Sustainability 2024, 16, 7400. [Google Scholar] [CrossRef]
- Paul, V.; Pandey, R.; Solaiyappan, M.; Mukherjee, P. Sample Collection and Digestion Methods for Elemental Analysis of Plant; ICAR—Indian Agricultural Research Institute: New Delhi, Delhi, India, 2024. [Google Scholar] [CrossRef]
- Eisenhauer, N.; Bowker, M.A.; Grace, J.B.; Powell, J.R. From patterns to causal understanding: Structural equation modeling (SEM) in soil ecology. Pedobiologia 2015, 58, 65–72. [Google Scholar] [CrossRef]
- Zhang, L.; Yajun, C.; Hao, G.-Y.; Ma, K.; Bongers, F.; Sterck, F. Conifer and broadleaved trees differ in branch allometry but maintain similar functional balances. Tree Physiol. 2020, 40, 511–519. [Google Scholar] [CrossRef]
- Vogt, K.; Dahlgren, R.; Ugolini, F.; Zabowski, D.; Moore, E.; Zasoski, R. Aluminum, Fe, Ca, Mg, K, Mn, Cu, Zn and P in above- and belowground biomass. I. Abies amabilis and Tsuga mertensiana. Biogeochemistry 1987, 4, 277–294. [Google Scholar] [CrossRef]
- Zhao, H.; He, N.; Xu, L.; Zhang, X.; Wang, Q.; Wang, B.; Yu, G. Variation in the nitrogen concentration of the leaf, branch, trunk, and root in vegetation in China. Ecol. Indic. 2019, 96, 496–504. [Google Scholar] [CrossRef]
- Kim, Y.H.; Warren, S.H.; Krantz, Q.T.; King, C.; Jaskot, R.; Preston, W.T.; George, B.J.; Hays, M.D.; Landis, M.S.; Higuchi, M.; et al. Mutagenicity and Lung Toxicity of Smoldering vs. Flaming Emissions from Various Biomass Fuels: Implications for Health Effects from Wildland Fires. Environ. Health Perspect. 2018, 126, 017011. [Google Scholar] [CrossRef]
- Neville, M.; Sarofim, A.F. The fate of sodium during pulverized coal combustion. Fuel 1985, 64, 384–390. [Google Scholar] [CrossRef]
- van Eyk, P.J.; Ashman, P.J.; Nathan, G.J. Mechanism and kinetics of sodium release from brown coal char particles during combustion. Combust. Flame 2011, 158, 2512–2523. [Google Scholar] [CrossRef]
- Tao, J.; Zhang, L.; Engling, G.; Zhang, R.; Yang, Y.; Cao, J.; Zhu, C.; Wang, Q.; Luo, L. Chemical composition of PM2.5 in an urban environment in Chengdu, China: Importance of springtime dust storms and biomass burning. Atmos. Res. 2013, 122, 270–283. [Google Scholar] [CrossRef]
- Sardans, J.; Alonso, R.; Carnicer, J.; Fernández-Martínez, M.; Vivanco, M.G.; Peñuelas, J. Factors influencing the foliar elemental composition and stoichiometry in forest trees in Spain. Perspect. Plant Ecol. Evol. Syst. 2016, 18, 52–69. [Google Scholar] [CrossRef]
- Wang, J.; Wang, J.; Wang, L.; Zhang, H.; Guo, Z.; Geoff Wang, G.; Smith, W.K.; Wu, T. Does stoichiometric homeostasis differ among tree organs and with tree age? For. Ecol. Manag. 2019, 453, 117637. [Google Scholar] [CrossRef]

Disclaimer/Publisher’s Note: The statements, opinions and data contained in all publications are solely those of the individual author(s) and contributor(s) and not of MDPI and/or the editor(s). MDPI and/or the editor(s) disclaim responsibility for any injury to people or property resulting from any ideas, methods, instructions or products referred to in the content. |
© 2025 by the authors. Licensee MDPI, Basel, Switzerland. This article is an open access article distributed under the terms and conditions of the Creative Commons Attribution (CC BY) license (https://creativecommons.org/licenses/by/4.0/).