Article

Size-Fractionated Particle Number and Mass Concentrations in Karak Governorate and Neighboring Regions in Mid-West Jordan

by
Shatha Suleiman Ali-Saleh
1,
Enas M. Al-Hourani
2,
Omar Al-Jaghbeer
3 and
Tareq Hussein
3,4,*
1
Department of Basic Sciences, National University College of Technology, Amman 11191, Jordan
2
Department of Physics, College of Science, Mu’tah University, Karak 61710, Jordan
3
Institute for Atmospheric and Earth System Research (INAR/Physics), University of Helsinki, FI-00014 Helsinki, Finland
4
Environmental and Atmospheric Research Laboratory (EARL), Department of Physics, School of Science, The University of Jordan, Amman 11942, Jordan
*
Author to whom correspondence should be addressed.
Atmosphere 2025, 16(4), 400; https://doi.org/10.3390/atmos16040400
Submission received: 5 March 2025 / Revised: 23 March 2025 / Accepted: 25 March 2025 / Published: 30 March 2025
(This article belongs to the Special Issue Exposure Assessment of Air Pollution (3rd Edition))

Abstract

:
Particle number concentration and size distribution in Jordan (in the Middle East) is still not comprehensive. In this study, a simple aerosol portable setup was used to measure size-fractioned aerosol number and mass concentrations with different particle diameter fractions (0.01–10 µm) in different regions inside Karak city and roads connecting Amman, Madaba, Karak, and Tafila, Jordan. The mean submicron particle number concentrations (PN1) in Karak governorate, Madaba, Tafila, and Amman were 2.0 × 104 cm−3, 3.7 × 104 cm−3, 4.1 × 104 cm−3 and 5.2 × 104 cm−3, respectively. On all roads leading to Karak governorate, the mean PN1 was within 1.5 × 10⁴–3.0 × 104 cm−3, except on Madaba-Karak Road which exhibited a lower mean concentration (6.4 × 103 cm−3). In the Amman–Madaba road, the PN1 was 4.0 × 104 cm−3. Inside the Karak governorate, mean PN1, PM2.5, and PM10 concentrations were 1.0 × 10⁴–3.0 × 104 cm−3, 10–15 µg m−3, and 27–200 µg m−3, respectively. Considering local roads inside Karak city, the mean concentrations were 2.0 × 104 cm−3, 12 µg m−3, and 109 µg m−3, respectively. This study highlights the important need to monitor and understand aerosol number and mass concentrations not only in the Karak governorate, which is affected by various environmental factors, but also in other surrounding regions. The results provide valuable insights into air quality and its potential impact on public health and the local environment. Future research is needed to focus on long-term PM levels monitoring, identifying key emission sources, and developing strategies to mitigate air pollution. Collaboration between policymakers, researchers, and local communities is essential to create effective environmental management plans and promote sustainable practices to improve air quality in the region.

1. Introduction

Particulate matter concentrations significantly impact human health, particularly in densely populated cities where elevated levels contribute to increased mortality rates from respiratory and cardiovascular diseases [1,2,3,4,5,6,7,8,9]. Pop et al. [4] reported that each 10 μg·m−3 of fine particle in air was related to an increased risk of all cause, cardiovascular and lung mortality of approximately 4%, 6% and 8%. Krewski et al. [7] confirmed the relation between aerosol exposure and premature mortality via cardiovascular disease and lung cancers. Chen et al. [1] concluded that UFPs play a major role in adverse impacts on human health and require further investigations in future toxicological research of air pollution.
Researchers are also interested in studying the effect of aerosols on weather, regional climate and the global environment as these particles can absorb and scatter solar radiation, which affects the radiation balance of the Earth, in addition to their indirect effect on the climate through the formation of cloud nuclei [10,11,12,13].
The issue of environmental pollution resulting from air pollution has begun to receive some attention in the Arab world. Most studies have focused on monitoring these particles, their source, spatial and temporal variation, mode of transport, optical properties and chemical composition [14,15,16,17,18,19,20,21,22,23,24,25,26,27,28,29,30,31,32,33,34,35,36,37,38,39,40,41,42,43,44].
Despite the interest of researchers in studying aerosols in Jordan recently, there is still an urgent need for more studies for the picture to become clearer and more comprehensive for all regions. In Jordan, which is a country in the Middle East, there are some studies concerning air pollution [45,46,47,48,49], in addition to several atmospheric studies concerning particle number concentrations [48,49,50,51,52,53,54,55,56,57,58,59,60,61]. Hussein et al. [48] studied the effects of a dust episode by applying short-term measurements of mass and number concentrations of submicron particles in urban and suburban atmospheres of Amman.
Also, Hussein et al. [49] have deduced the spatial and diurnal variation in Amman and Zarqa in Jordan by measuring the particle number concentrations; they found that the highest number concentrations in Amman were observed at the urban residential sites (Umm Summaq and Al-Hashmi Al-Shamali), whereas the lowest were at the sub-urban site (Shafa Badran), whereas the highest concentrations, among all locations, were observed at Hai Masoum in Zarqa. Then, the research was continued by Hussein and Betar [54]; they presented the size-fractionated particle number and mass concentrations in Amman, determined an estimate for the urban particle number size distribution and measured the geographical variation in aerosol concentrations throughout the whole of Jordan. Hussein et al. [52] created a basic mobile setup to measure aerosol concentrations for two days and covering a considerable portion of Jordan, and found that the PN, PM, and BC concentrations suggest that traffic emissions are the main sources of aerosols in cities, especially those where heavy-duty vehicles are used extensively.
The temporal change in submicron particle number concentrations was examined at an urban background location in Amman, Jordan, by Ali-Saleh et al. [53]; three time scales were the focus of the study, daily, weekly, and seasonal, and the study yielded the correlation with specific meteorological parameters. Also, Hussein et al. [55] performed long-term aerosol measurements and characterized the PNSD (0.01–10 μm) in Amman–Jordan. Hussein et al. [58] measured PM10 and PM2.5 concentrations for 11 months, over which 14 days were affected by episodes, using high volume sampling and gravimetric analysis besides air mass back-trajectory calculations.
Vilcassim and Thurston [62] identified the current discrepancy between air pollution monitoring and regulations, stressing the need to strengthen pollution mitigation policies to reduce the resulting health damage. Huang et al. [63] highlighted the relationship between long-term exposure to particulate matter and an increased risk of dementia, emphasizing the importance of continuing relevant scientific research. So, monitoring urban aerosols and establishing long continuous data sets is important to study urban aerosol dynamics such as movement, transformation, and destiny, and to study the possible health effects of aerosol particles.
This study is a continuation of our previous attempt to compare the aerosol concentrations inside major cities in mid-west Jordan [64]. It aims to create a comprehensive database of submicron particle number concentrations and fine and coarse particle mass concentrations in different parts of Karak city in Jordan and the roads leading to it from Amman, Tafila and Madaba and to compare the concentrations with the average concentrations in the surrounding cities, aiming to assess the air pollution situation in Karak.

2. Materials and Methods

A simple mobile aerosol measurement campaign was conducted in urban areas within the Karak governorate and along roads leading to Karak, in Jordan, over two days to measure mass and number concentrations.

2.1. Site Description

Jordan is located in the eastern Mediterranean region. It is a developing country with an area of about 89,000 km2 and the population reached 11 million by the end of 2021. Jordan has a diverse topography, with high mountains in the west, agricultural areas in the west region, and a vast desert/arid zone in the southeast. In the Jordan Valley, the lowest point is about 420 m below sea level, and to the south, there is a small entrance to the Red Sea in Aqaba.
The Karak governorate is in the center–west region of Jordan. The population of the governorate is about 35,000 and its area is about 3500 km2. There is an increase in the number of populated areas due to urbanization and continuous population growth, which confirms the importance of this study from the point of view of the population’s exposure to air pollution in urban areas.

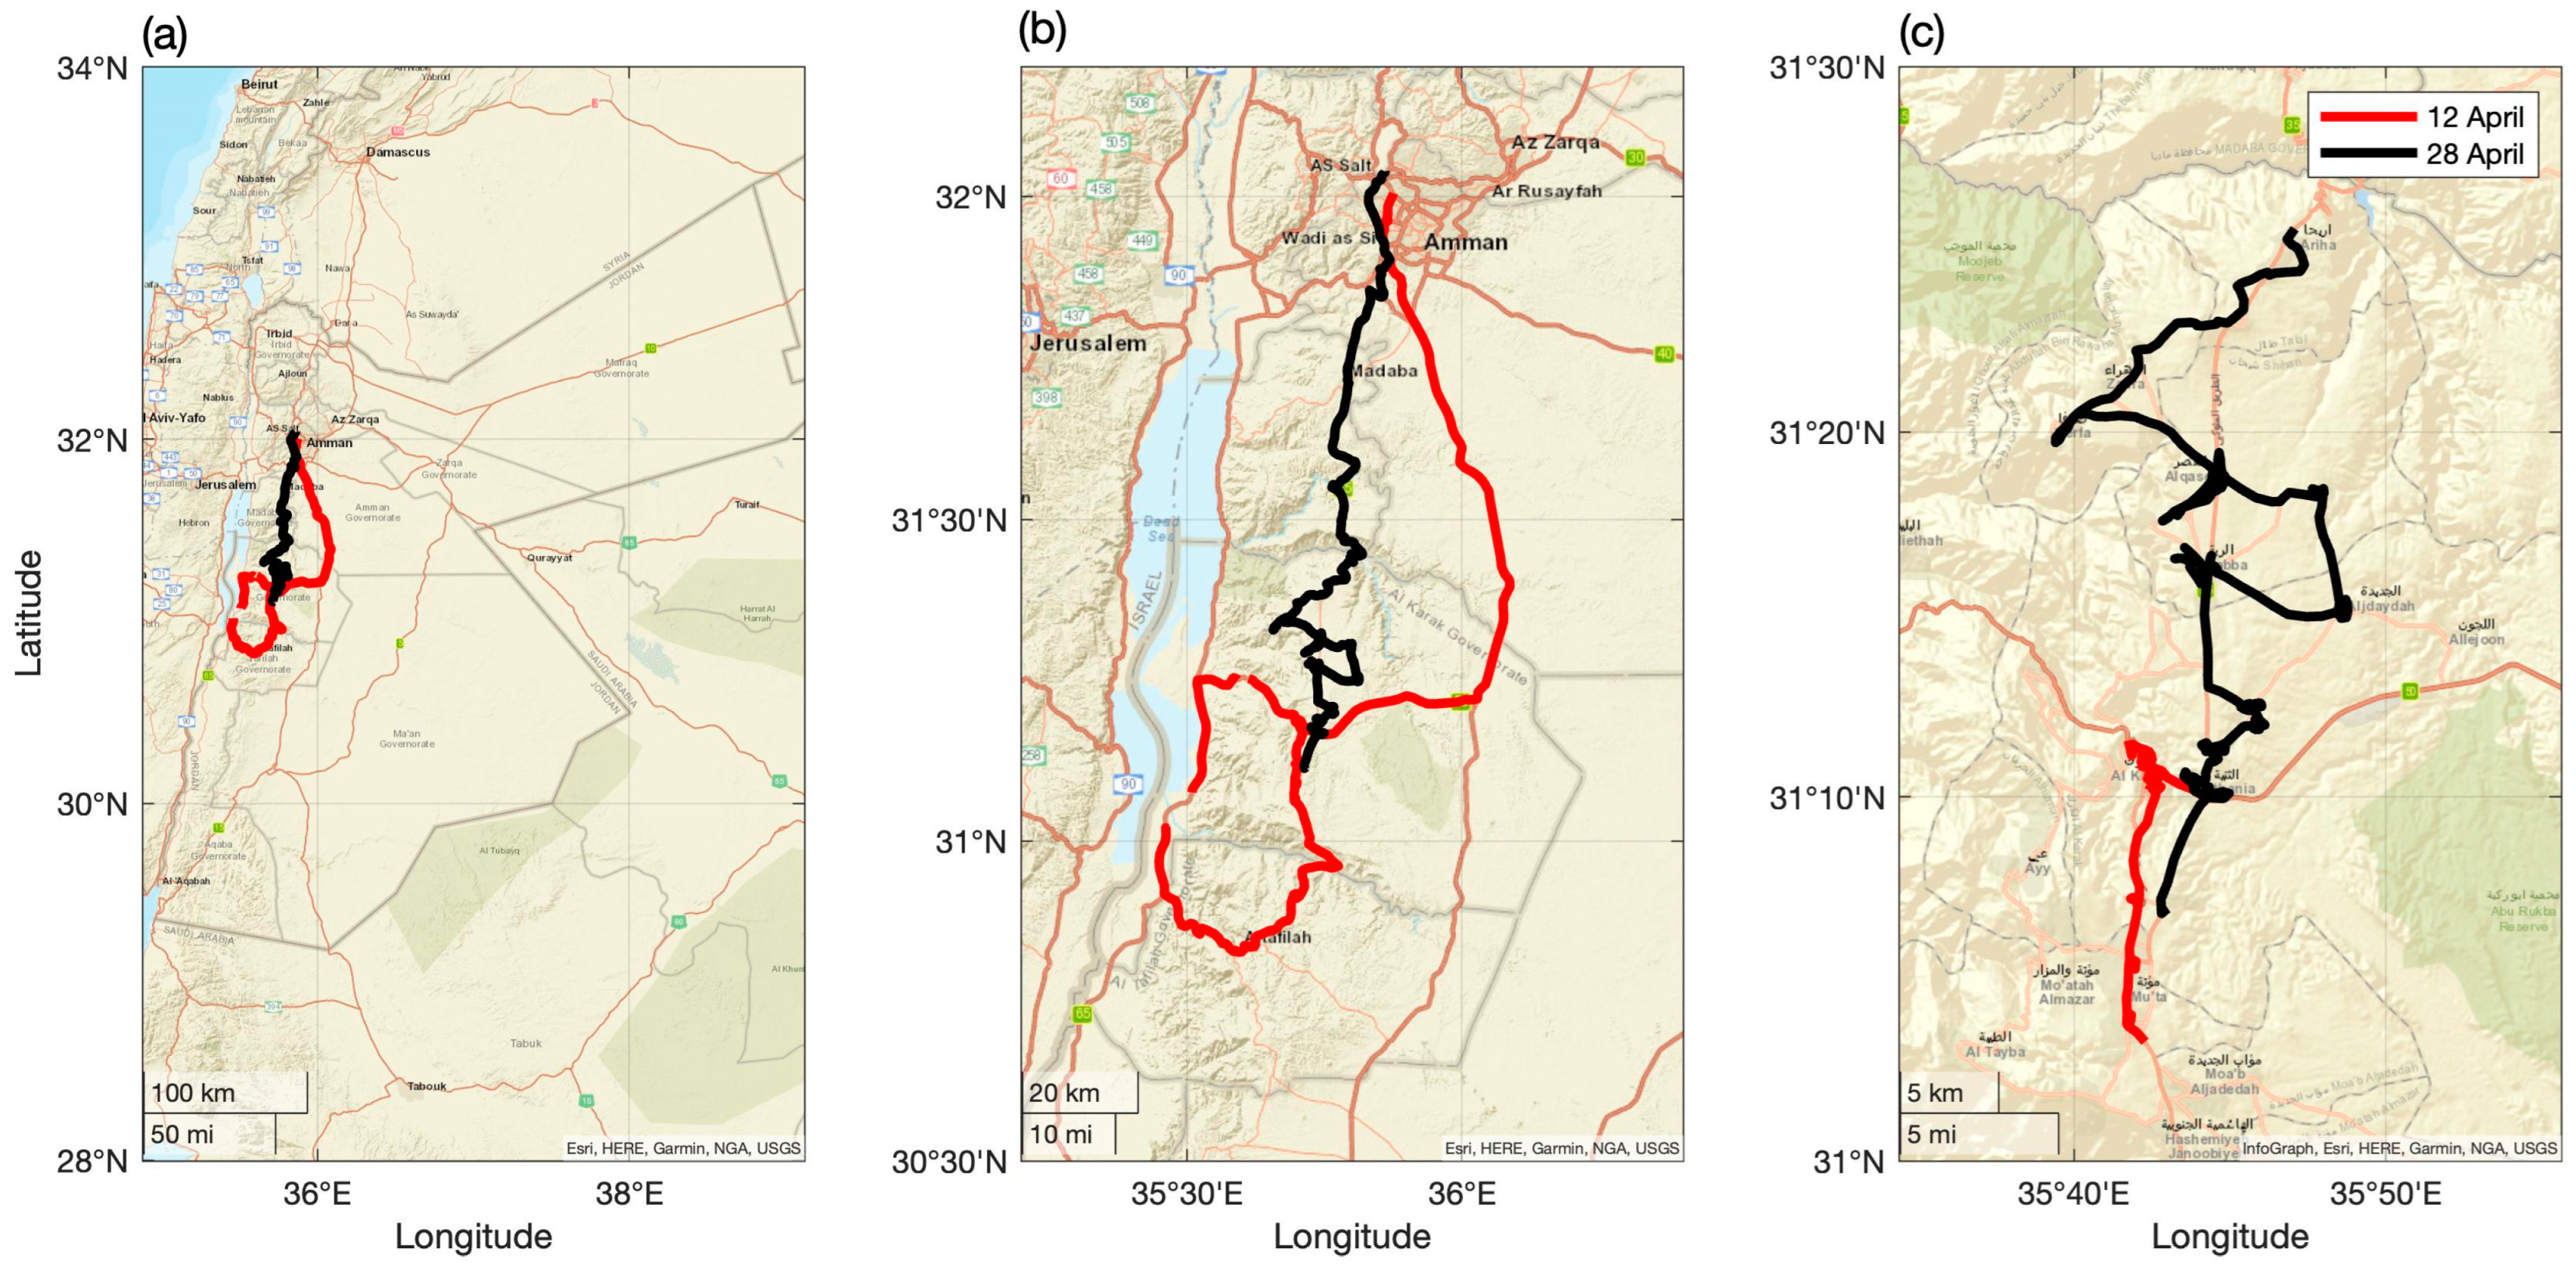
2.2. Description of the Measurement Campaign

The measurement campaign took place on 12 and 28 April 2022. Two extensive rounds of measurements were conducted in different locations in Karak governorate and the main roads between Amman, Madaba, Karak, Dead Sea, and Tafileh (Figure 1).
The first track, which took place on 12 April, started in Amman at the University of Jordan and headed south along the desert road to Karak Governorate. The route then turned west towards the Jordan Valley (Ghor Al Mazraa), which considered the lowest point on Earth at 420 m below sea level. From there, the track headed south along the Dead Sea until it reached Ghor Al Safi and Ghor Al Fifa. The route then turned east to Tafila Governorate, passing through the main street in Tafila city, before heading north to Karak Governorate. Measurements were carried out in several areas of the Karak governorate, including the city of Karak, after which the tour ended. This route spanned about 317 km.
The second track, which took place on April 28, also started in Amman at the University of Jordan and continued south to Madaba Governorate, then southward to Madaba city and on to Dheban, passing Al Wala. The track then proceeded to the Karak governorate passing Mujib Dam, where several measurements were conducted across the northern and central parts of the Karak governorate. The approximate distance traveled on this track was about 237 km.

2.3. Mobile Experimental Setup

The simple mobile experimental setup included three portable instruments: two condensation particle counters (TSI CPC 3007-2 and P-Trak 8525) and a handheld optical particle counter (TSI AeroTrak 9306-V2). A Garmin GPS (eTrex 32x) was used to record the speed and location of the mobile setup with a 1 s time resolution.
The CPC 3007-2 has a cutoff size of 10 nm, and it is able to measure total submicron particle number concentrations with diameters of up to 1 µm. The maximum detectable concentration is 105 cm−3 with 20% accuracy. The sampling flow rate in this type of CPC is 0.1 lpm (inlet flow rate 0.7 lpm). The P-Trak 8525 is a similar particle counter but with slight differences: a cutoff size about 20 nm and a maximum concentration of 5 × 105 cm−3. The P-Trak was also operated with a 1 s time resolution. The sampling flow rate in this type of P-Trak is 0.1 lpm (inlet flow rate 0.7 lpm). The cutoff size and the maximum detectable concentration in both the CPC and the P-Trak were previously validated [52]; the measured cutoff electrical mobility diameter was found to be 9 nm and 22 nm for the CPC and the P-Trak, respectively. This agrees well with the nominal cutoffs provided by the manufacturer as 10 nm and 20 nm, respectively. The measured maximum detectable concentration with both the portable CPC and the P-Trak was about 4 × 105 cm−3.
The AeroTrak was used to measure size-specific particle number concentrations within an optical diameter range of 0.3–25 µm across six channels: 0.3–0.5, 0.5–1, 1–2.5, 2.5–5, 5–10, and 10–25 µm. The sampling time resolution was 1 s at a flow rate of 2.83 L min–1.
All instruments were situated on the back seat of a car (model: Jeep Cherokee 2013). While driving, the front and the back windows were kept fully open. This guaranteed a high exchange rate between indoor and outdoor air, providing representative outdoor aerosol measurements [52]. Therefore, special inlets for the aerosol instruments were not required in this simple “mobile setup”. Before each measurement session, all devices were checked for readiness, and the instrument clocks were synchronized.
The instruments were calibrated before the measurement campaign at the manufacturer. However, to ensure they were operating properly, the routine check for the flow rate and zero test were performed before starting each day during the campaign.

2.4. Aerosol Data Handling

The raw data underwent a quality check and were then converted to a one-minute average database. Average concentrations were also calculated during different sessions:
(1)
Periods spent crossing each city;
(2)
Periods spent on the main roads between cities.
In total, the tracks took place through five cities: Amman, Al-Salt, Madaba, Tafila, and Karak. As for the main roads between cities, we traveled along eight roads: Amman–Madaba, Desert (between Amman and Qatrana), Qatrana-Karak, Madaba–Karak, Karak–Ghor, Jordan Valley (Dead Sea), Dead Sea (industrial area)–Tafila, and Tafila–Karak.
Using portable instruments with different cut-offs allowed us to obtain particle number concentrations in eight particle size fractions within the following diameter ranges (i.e., channels):
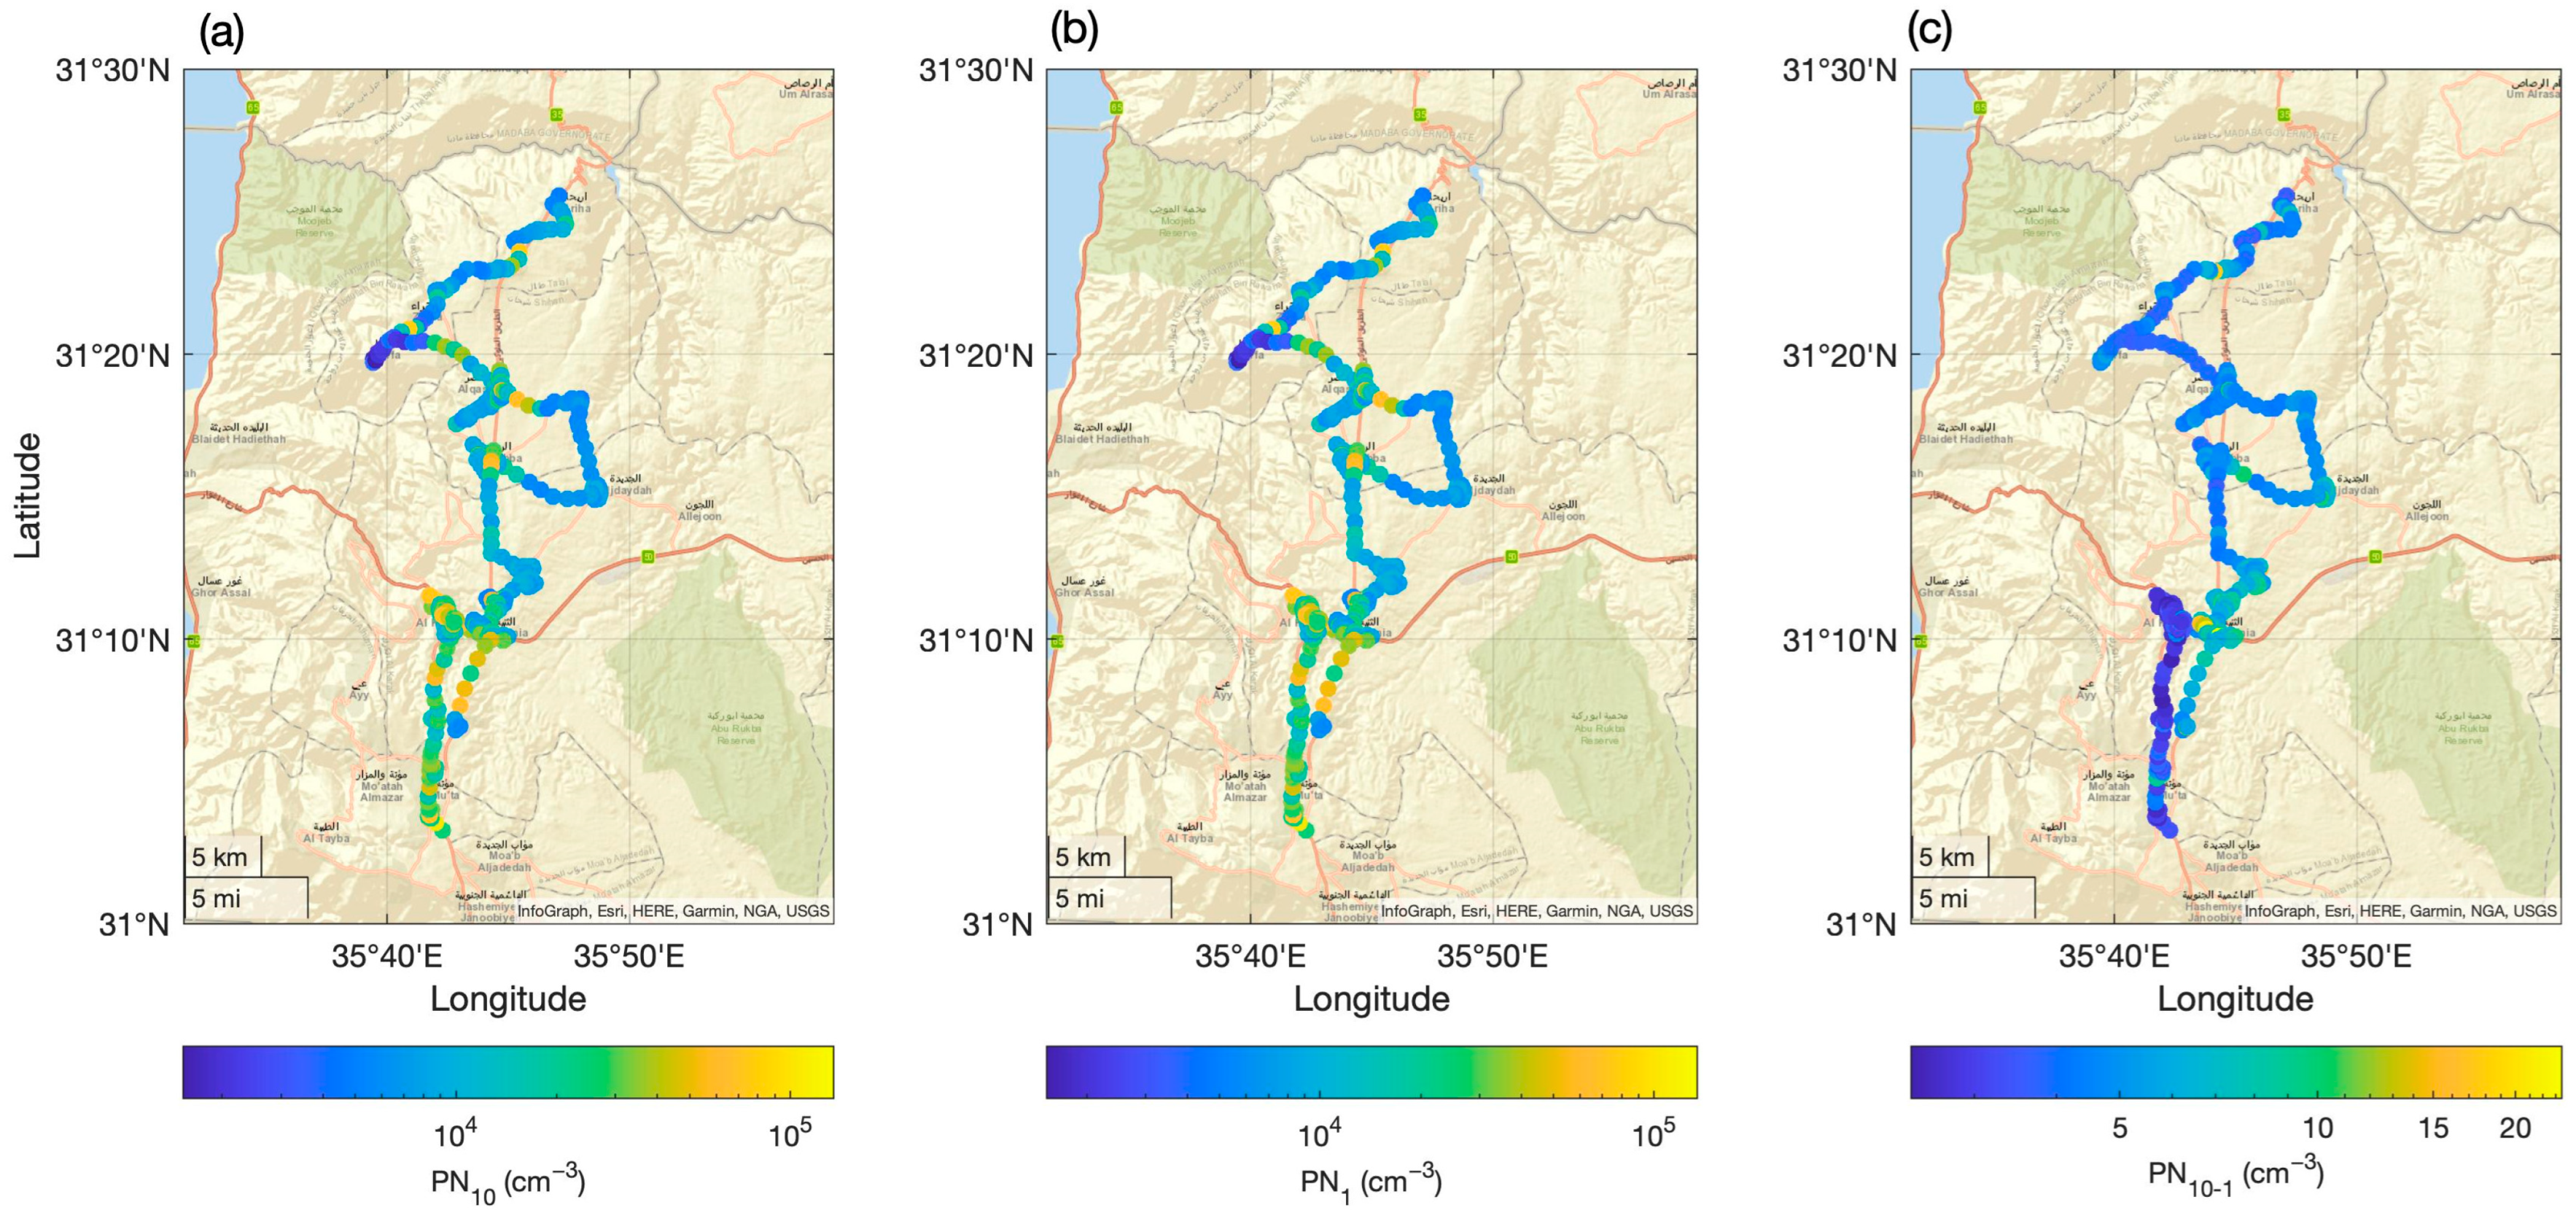
  • 10–25 nm (calculated from the difference between the concentrations measured with the CPC and the P-Trak).
  • 25–300 nm (calculated from the difference between the concentrations measured with the P-Trak and the AeroTrak).
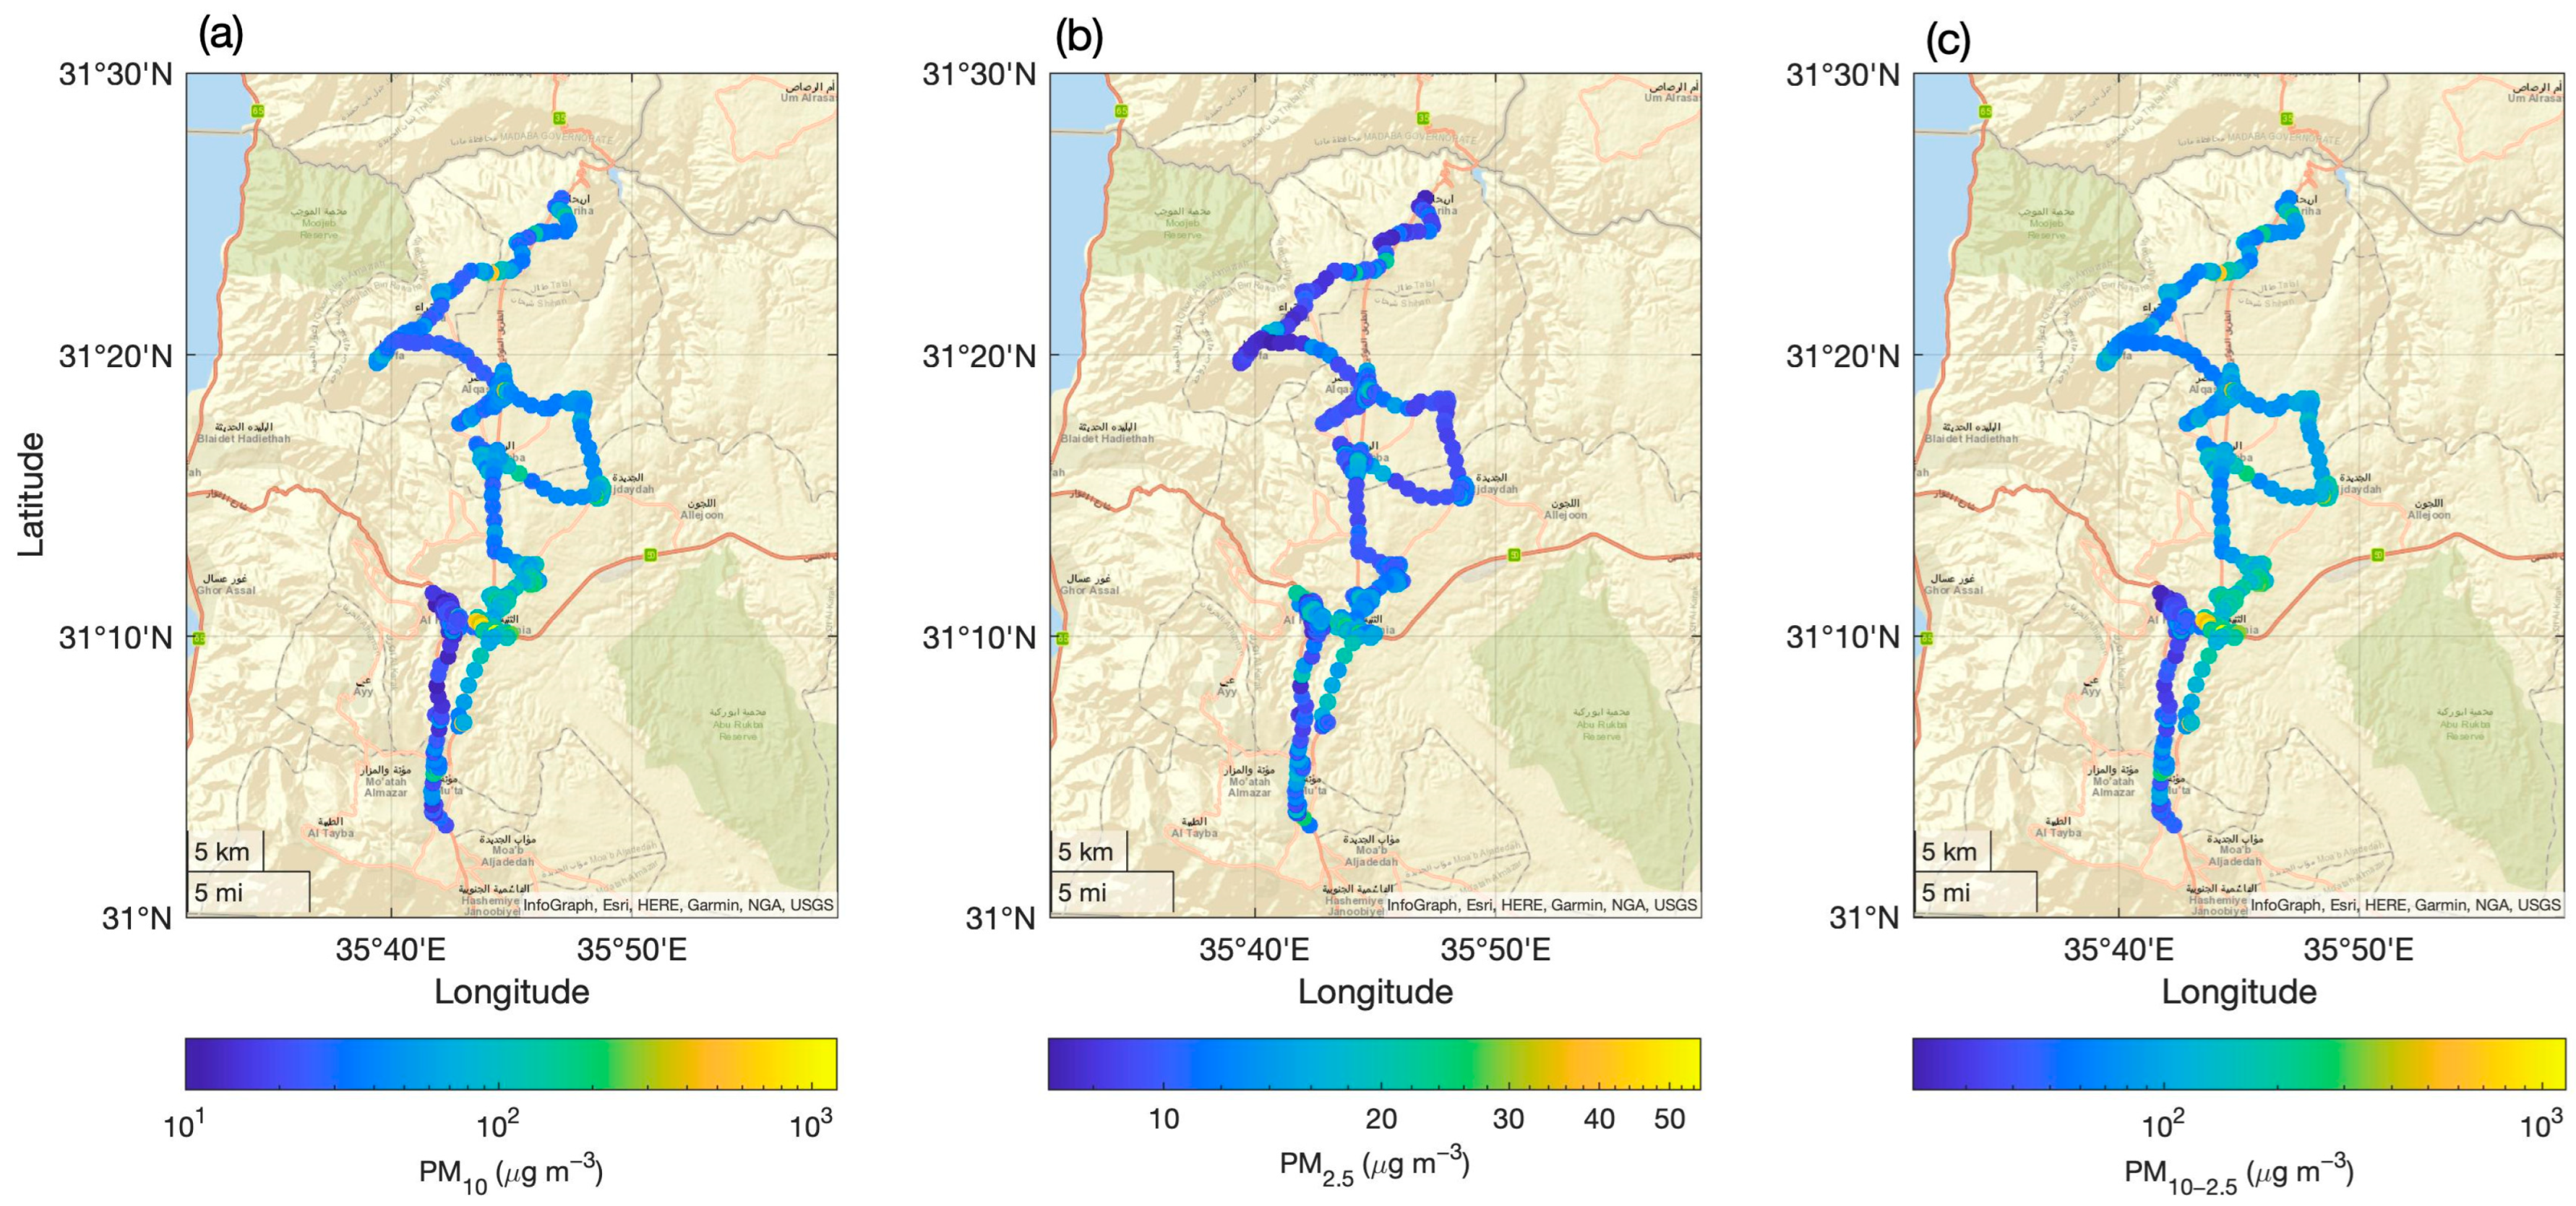
  • 0.3–0.5 µm, 0.5–1 µm, 1–2.5 µm, 2.5–5 µm, 5–10 µm, and 10–25 µm. The last six particle size channels were measured directly with the AeroTrak.
The normalized particle number size distribution ( n N 0 = d N d l o g ( D p ) ) was calculated by normalizing the particle number concentration in each channel to its corresponding particle diameter range. The normalized particle mass size distribution ( n M 0 = d M d l o g ( D p ) ) was calculated by assuming spherical particles with unit density. The particle number (PN) or mass (PM) concentration in any particle size fraction can be calculated by integration:
P N = D p 1 D p 2 n N 0 d l o g ( D p )
P M = D p 1 D p 2 n M 0 d l o g ( D p )
As such, the fine particle mass concentration (PM2.5) can be calculated by integrating the normalized particle mass size distribution up to 2.5 µm:
P M 2.5 = 0.01 2.5 n M 0 d l o g ( D p )
and the submicron particle number concentration (PN1) can be calculated by integrating the normalized particle number size distribution up to 1 µm:
P N 1 = 0.01 1 n N 0 d l o g ( D p )

2.5. Weather Conditions

For this study’s analysis, only temperature and relative humidity data collected from 12 and 28 April 2022 were included.
April, being part of the spring season, generally has moderate temperatures and variable relative humidity. These conditions guarantee accurate readings and do not lead to the failure of the devices, as high temperatures are not suitable for these devices. Sometimes, dust storms may occur during this season in several regions of Jordan, especially in the eastern and southern regions. During all measurement campaigns, relative humidity mostly ranged from 12% to 55%, and temperatures varied between 12 °C and 32 °C, with a median of 22 °C.

3. Results

3.1. Short Summary About the Concentrations in Amman, Karak, Tafila and Main Roads

The aerosol concentrations among a variety of particle fractions were measured in multiple cities and along roads in northwest Jordan, including Amman, Karak, and Tafila and roads between them. The PN1 concentration was 2.0 × 104 cm−3 in Karak, which was lower than the concentrations observed in Amman, Tafila and Madaba (5.2 × 104 cm−3, 4.1 × 104 cm−3, 3.7 × 104 cm, respectively). On most roads leading to Karak, the PN1 levels were in the range of 1.5 × 104 cm−3–3.0 × 104 cm−3. However, the highest concentration was recorded on the Amman–Madaba road (3.9 × 10⁴ cm−3), which is a desert route crowded with large trucks and lorries (heavy-duty vehicles). In contrast, the lowest concentration (6.4 × 103 cm−3) was in the road between Madaba and Karak (see Table S1).
The highest PM10–1 concentration were in Karak and Madaba (123 μg·m−3, 105 μg·m−3, respectively), while the lowest concentration, 22 μg·m−3, was observed in Amman. Tafila recorded 67 μg·m−3 (see Table S2).
The road between Amman and Madaba observed the highest mean concentration of (112 μg·m−3), whereas the Qatrana–Karak Road had the lowest PM10–1 concentration, which was 31 µg m−3. The Madaba–Karak road, Amman–Karak road and Karak–Dead sea road recorded 64 μg·m−3, 38 μg·m−3, and 37 μg·m−3, respectively (see Table S3).

3.2. Particle Number Concentrations over Different Tracks in Karak

Spatial variation in the particulate number concentrations PN10, PN1, and coarse particle PN10–1 within the Karak governorate are shown in Figure 2 below.
The mean PN1 concentration over all Karak regions considered in this study was about 2.0 × 104 cm−3, as shown in Table S1. This value is the lowest compared with other cities considered in this study; 5.2 × 104 cm−3, 4.1 × 104 cm−3, 3.7 × 104 cm−3 in Amman, Madaaba, and Tafila, respectively.
It is worth noting that the cities of Madaba and Tafilah are small cities in Jordan; so, the reason for the high concentrations of PN1 may be that the measurements were carried out on main roads where there is a lot of traffic activity and emissions associated with it.
Based on the tracks which were performed among the Karak governorate (South area of Karak, New Karak, old area of Karak, North–East area and local roads), the mean PN1 concentrations varied in the range of 1.1 × 104 cm−3–3.4 × 104 cm−3. The maximum mean value was observed in the old Karak area (3.4 × 104 cm−3), which is a densely populated area with traffic congestion during the daytime. And the minimum mean value was in the North–West region (1.1 × 104 cm−3) (see Table S4).

3.3. Particulate Mass Concentrations over Different Tracks in Karak

Spatial variations in the particulate mass concentrations PM10, PM2.5, coarse particulate matter PM10–2.5 within the Karak governorate are shown in Figure 3 below.
The PM2.5 concentration was calculated by integrating the normalized particle mass size distribution up to 2.5 µm (see Equation (4)); also, the PM10 concentration was calculated by integrating the normalized particle mass size distribution up to 10 µm, whereas PM2.5–10 was calculated from the difference between PM2.5 and PM10 concentrations (as shown in the Section 2).
Fine particle matter concentrations varied from region to region inside the Karak governorate, as shown in Table S5. They were in the range of 10–15 μg·m−3. The lowest concentration was in the Northwest area (10 µg m−3), which is nonurban area, whereas old Karak had the highest PM2.5 concentration, 15 µg m−3; this may be because Old Karak is the central region of Karak, which is considered the most urbanized compared to the other regions. It has the most traffic, and there is a heavy presence of commercial markets and many institutions, such as the military hospital and the craft city. PM2.5 concentrations are close in both the New Karak and Northeast area (about 12) µg m−3, while they are slightly higher in the southern region (13 µg m−3). The mean value of PM2.5 concentrations over all roads inside Karak was about 12 µg m−3 (Table S5 and Figure 4).
As listed in Table S6, the Northeast area and Northwest area had the highest concentrations of PM10 (200 µg m−3, 130 µg m−3, respectively), whereas Old Karak, New Karak and the South Area had the lowest PM10 concentrations (60 µg m−3, 70 µg m−3 and 80 µg m−3, respectively). The average PM10 concentration among all local roads in Karak was about 100 µg m−3 (see Figure 4).
As mentioned before, PM2.5–10 was calculated from the difference between PM10 and PM2.5, and the results are shown in Table S7 and Figure 4. The PM2.5 concentration was about 10–20% of the PM10 concentrations in all regions in Karak and roads except for Old Karak, which was about 26%, and the Northeast and Northwest areas, which were about 6% and 7.6%, respectively. It is worth mentioning here that Old Karak is considered an urbanized area, whereas the North area is nonurbanized. It can be noted that the percentage of concentrations of PM2.5 out of PM10 did not follow a specific pattern for all locations in Karak but was always lower than 25%.
Figure 4 shows a comprehensive look at all the averages of the concentrations that were measured during this study; it is possible to notice that the main roads between cities have the highest PM concentrations, while that is not the case for PN concentrations; also, it is worth noting that the North East of Kark has the highest PM10 and PN10–1 concentrations of all regions inside Karak.

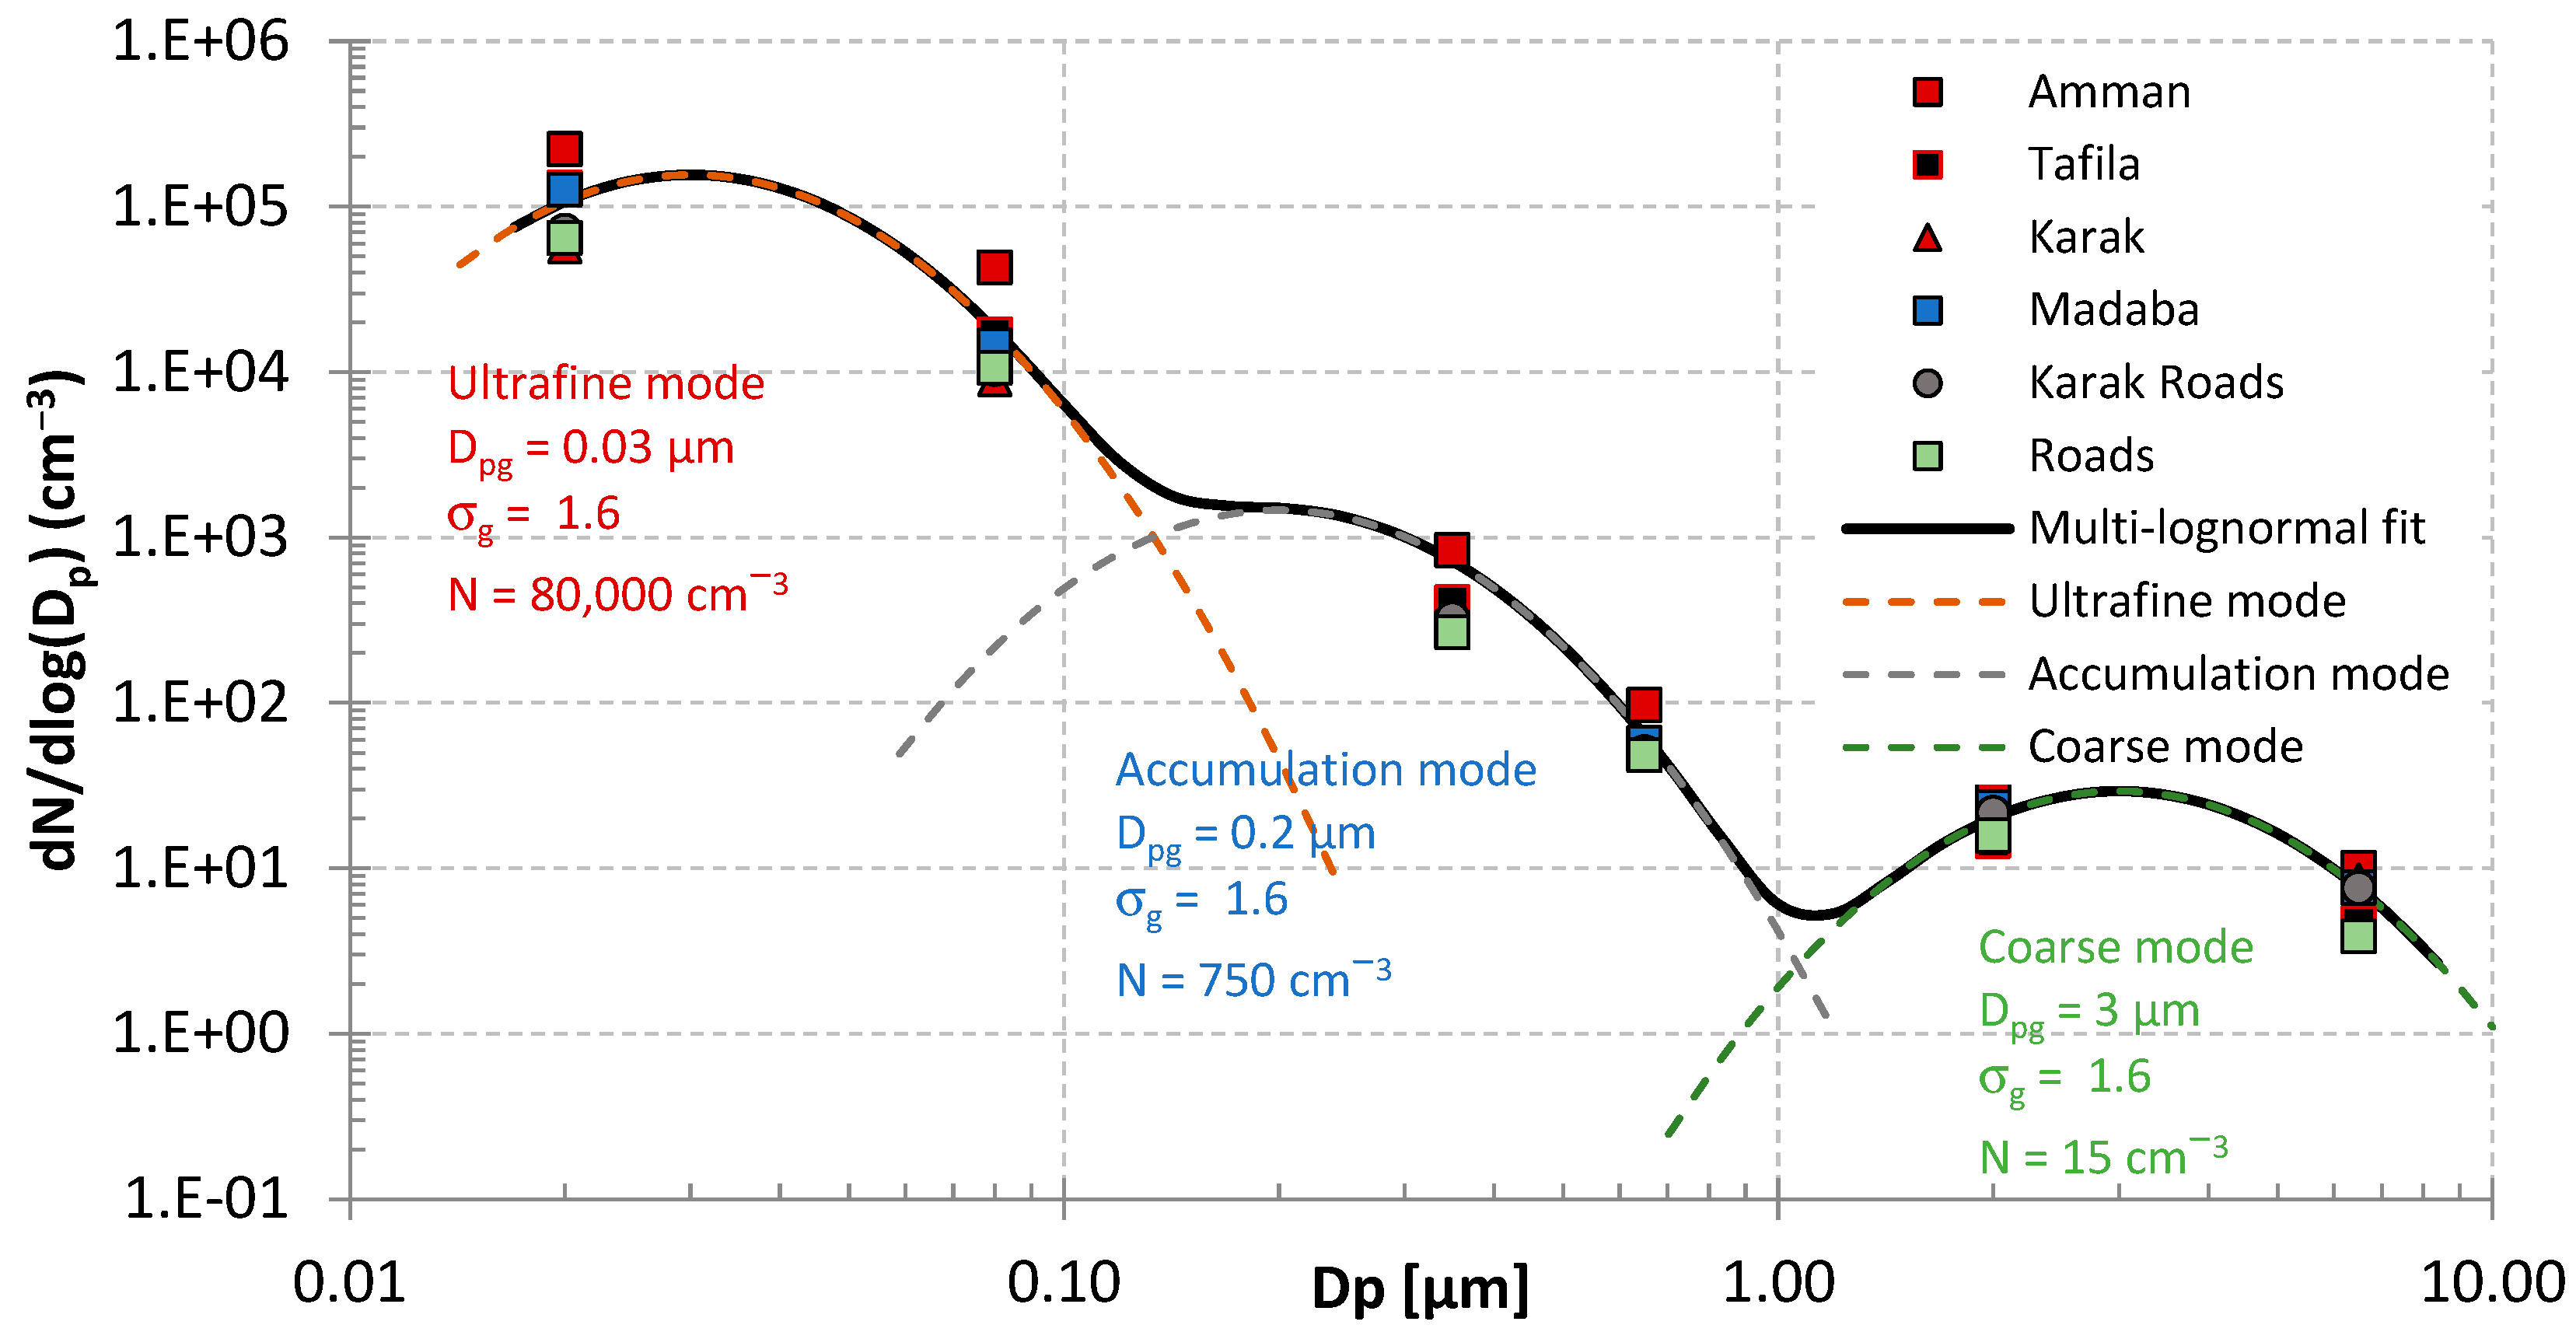
3.4. Particle Number Size Distribution (PNSD)

Aa mentioned before, using instruments with different cut-offs enabled us to measure PN concentrations across eight particle size fractions, categorized within the following diameter channels: 10–25 nm, 25–300 nm, 0.3–0.5 µm, 0.5–1 µm, 1–2.5 µm, 2.5–5 µm, 5–10 µm, and 10–25 µm.
The PN for each channel was normalized to its respective particle diameter range to obtain the normalized particle number size distribution.
Particle number size distribution was fit by assuming three main modes: an ultrafine mode, an accumulation mode, and a coarse mode [54].
Based on the optimal multi-lognormal fitting, the geometric mean diameters (Dpg) for the ultrafine, accumulation, and coarse modes were approximately 0.03 µm, 0.2 µm, and 3 µm, respectively. The corresponding mode number concentrations were 80,000 cm−3, 750 cm−3, and 15 cm−3. The total number concentration showed a minimal discrepancy between the fitted values and the measurements.
High concentrations of particle size fractions ranging from 20 to 40 nanometers in diameter are frequently linked to freshly emitted aerosols from traffic exhaust (see Figure 5 below).

4. Discussion

There are many mining activities in the Karak governorate (phosphate, cement, gypsum, potash and bromine), in addition to the spread of crushers and quarries in almost all areas of Karak. Therefore, air pollution comes from different sources, including mining activities and related industrial and traffic emissions utilized for the transportation of extracted products, in addition to small-scale industrial activities, local-scale household activities, and agricultural activities. In Jordan, sand and dust storms (SDSs), which are common during the spring and early summer, are caused by the long-distance transport of airborne dust from the Arabian Peninsula, North Africa, and the Levant. The most likely cause of local dust resuspension is an increase in construction activity.
In Jordan, submicron particle number concentrations have been reported in many urban locations and roads either through long-term or short-term campaigns [52,53,54,55,56,57,58,59,60,61,64]. If we compare the measurements that were monitored in Karak in this study with what was recorded in a previous investigations for Hussein et al. [56] where submicron particle number concentrations of PN1 were measured at two reference sites in Jordan and in Amman (University of Jordan and Zarqa), and the average values were (3.8 × 104 cm−3 and 4.2 × 104 cm−3, respectively) in the daytime, it may be concluded that Karak (2.0 × 104 cm−3 in our study) has lower PN1 concentrations than those monitored in Amman at a reference location within the University of Jordan, as well as much lower concentrations than the concentrations measured in Zarqa, in a densely populated area with traffic activity. However, the average PN1 concentrations in Amman (5.2 × 104 cm−3 in our study) were higher than 3.8 × 104 cm−3, as found previously by Hussein et al. [56]. This can be considered a logical result due to the time difference between the two studies, which is approximately six years, during which there was a noticeable increase in the number of cars in Amman due to population inflation resulting from immigration from neighboring countries, in addition to the original increase in the local population.
It seems that the concentrations in all most of Karak are almost lower than in other cities in Jordan. This can be observed by comparing the mean of the concentrations found in all of Karak with that recorded by Hussein et al. in a previous study of several cities in Amman [52]. Their study is similar to ours in that it used short-term mobile measuring tools in a car, but it included major roads and many cities throughout Jordan. They found that in cities with heavy-duty vehicles such as (Azraq, Mafraq and Ma’an), the concentrations ranged from 5.8 × 104 cm−3 to 7.1 × 104 cm−3. This is higher than the measurements we obtained in Karak (2.0 × 104 cm−3) or Amman (5.2 × 104 cm−3). However, some areas in that study obtained concentrations close to those measured in Karak, such as Petra and Al-Jafr (3.3 × 104 cm−3 and 3.8 × 104 cm−3), while there was a remote location called Safawi, where the concentrations (6.0 × 104 cm−3) were lower than in Karak. Driving in the main roads inside Amman and between Amman and Zarqa (in Jordan), the concentrations registered were 1.7 × 105 cm−3 [56]; these were significantly higher than what was recorded on Karak roads (2.3 × 105 cm−3) in the current study. The road between Amman and Al-Salt recorded about 4.0 × 104 cm−3 [64].
Some studies, whether inside Jordan or other countries, focused on the diurnal pattern of concentrations and concluded that it is characterized by two main rush hours (morning and afternoon) on workdays [53,61,65,66,67,68]. Ali-Saleh et al. detected daily patterns of the submicron aerosol concentration (i.e., Sunday–Wednesday), which was characterized by the highest concentrations (in the range of 2 × 10⁴–3.5 × 104 cm−3) during the morning traffic rush hours and an afternoon peak with intermediate concentrations (2.0 × 10⁴–2.2 × 104 cm−3) [53].
The PN1 concentrations were about 9 × 103 cm−3 during the morning and afternoon rush hours at an urban site in Brisbane (Australia) [65], and were much lower than the concentrations in Amman or Karak. Backmann et al. [69] reported that PN1 reached 3.5 × 104 cm−3 during the daytime in São Paulo (Brazil), which is higher than the concentrations in Karak but lower than the concentrations in Amman. In Helsinki (Finland), the PN1 concentrations were 1.5 × 104 cm−3, 5 × 103 cm−3 during the daytime and before the morning rush hours [67]. PN1 was also recorded in Penhagen (Denmark), and it was around 4 × 103 cm−3 during the morning traffic rush [70]. In larger cities, concentrations are expected to be even higher due to a higher population density and the much larger number of vehicles driven in the city.
PM2.5 is receiving a lot of attention because of its small diameter, as it can penetrate the lungs and blood vessels, causing serious health damage to humans, in addition to the diversity of its sources (construction sites, unpaved roads, fields, etc.)
What is worrying is that our measurements of the concentrations of PM2.5 (10 µg m−3–15 µg m−3) were higher than the primary (health-based) annual PM2.5 standard at 9.0 µg m−3; the EPA is revising the primary annual PM2.5 standard by lowering the level from 12.0 µg m−3 to 9.0 µg m−3, and this action has been effective since 6 May 2024 [71]. Although the PM2.5 concentrations in Karak exceed the EPA standards, these are still lower than what was reported in [56], where Hussein et al. performed several measurement campaigns in Amman and Zaraqa (two big cities in Jordan) and investigated size-fractionated aerosols (10 nm–10 µm), reporting that the mean PM10 and PM2.5 concentrations measured when driving in Amman city center were 71 µg m−3, 51 µg m−3, respectively, whereas they were 238 µg m−3, 126 µg m−3, respectively, in the vicinity of car repair shops in Amman. In Beirut/Lebanon; a country close to Jordan, the mean PM2.5 concentration was measured via an in-car mobile setup and it was 38 µg m−3–93 µg m−3 [72]. Hussein et al. [52] reported that PM10 concentrations were 178 µg m−3, 145 µg m−3 and 112 µg m−3, respectively, in Aqaba, Azraq and Ma’an, cities in south Jordan, and 19 µg m−3 and 29 µg m−3 in Jafr and Safawi, small cities in Jordan. It is worth noting that this study is similar to our study in that they were both conducted in Jordan and in terms of the devices used and the mobile measurement method, but its measurements were carried out in 2014, while our measurements were carried out in 2022 in Karak.

5. Conclusions

In this study, we aimed to apply a simple “mobile setup” to measure the spatial variation in aerosol concentrations in different regions inside Karak, outside the capital city Amman, and to compare these with concentrations in surrounding cities, Amman, Madaba and Tafila, as well as along roads leading to Karak from these cities. We performed an intensive measurement campaign to measure number and mass concentrations of fine and coarse particles. The measurement setup included a “mobile setup” driven on several routes.
The mean submicron particle number concentrations in Karak, Amman, Tafila and Madaba were 2.0 × 104 cm−3, 5.2 × 104 cm−3, 4.0 × 104 cm−3 and 3.7 × 104 cm−3, respectively. The PM10–1 concentrations recorded were 123 μg·m−3, 22 μg·m−3, 67 μg·m−3, and 105 μg·m−3 in Karak, Amman, Tafila and Madaba, respectively. Karak had the highest PM concentrations but the lowest PN concentrations of the cities in this study.
According to the mobile measurement, the average PN1 concentration varied considerably from a region to another in Karak. The highest mean PN1 concentration of 3.2 × 104 cm−3 was observed in the old Karak region. The lowest PN1 concentration was observed in Northwest Karak 1.1 × 104 cm−3. New Karak and Northeast of Karak recorded 2.7 × 104 cm−3, 1.3 × 104 cm−3, respectively, PN1 concentrations. The road leading to Karak from Madaba had the lowest PN1 mean concentration, of 6.4 × 103 cm−3, whereas the Amman–Madaba road showed concentrations up to 3.9 × 104 cm−3. For the Amman–Karak road, the mean PN1 concentration was 3.0 × 104 cm−3, and it was 1.6 × 104 cm−3 on both the Tafila–Karak and Qatrana–Karak roads.
The PM2.5, PM10, and PM2.5–10 concentrations were calculated. The ratios of PM2.5 to PM10 were low in less-populated areas, where these were lower than 8% in the Northeast and Northwest regions. However, these were around 26% in old Karak, which is the most populated. The ratios were in the range of 10–20% for the rest of the regions.
The highest mean of PM2.5 concentration was observed in the old Karak area, of about 15 μg·m−3, whereas the lowest mean value was 10 μg·m−3 in the Northwestern region of Karak. However, the New Karak region, Northeast of Kara and roads inside Karak recorded the same mean PM2.5 concentration, 12 μg·m−3.
The mean PM10 concentrations ranged between 27 μg·m−3 and 200 μg·m−3 for all regions inside Karak: 200 μg·m−3, 132 μg·m−3 in the Northeast and Northwest of Karak; 67 μg·m−3 and 57 μg·m−3 in New Karak and Old Karak. For local roads inside Karak city, the mean concentration of PM10 was 109 μg·m−3. Although the air concentrations are relatively low in different areas of Karak city, the overall arak air can be considered highly polluted when compared to the international standards for air cleanliness in terms of EPA, where the primary annual level is 9.0 μg·m−3.
One of the simple operations that could reduce air pollution in Karak is to pave all roads, as this, in addition to the aesthetic appearance, will reduce the emitted particles that are transmitted into the air. Such measures, which are considered essential in developed countries, are unfortunately not present in some cities in Jordan, such as Karak. It is worth noting that the problem of air pollution in Jordan, or even in the Middle East, which is considered a region of least developed countries (LDCs), is not a local problem, but a global one due to the mixing of air sources in space and time. Hence, I recommend that solutions be shared by all countries of the world so that all researchers can benefit from new measurement techniques and obtain a more accurate and comprehensive database. For future research in Karak, I strongly recommend conducting long-term measurement studies to obtain spatial and temporal variations in pollutants and study the risk of exposure to them by the city’s residents.

Supplementary Materials

The following supporting information can be downloaded at: https://www.mdpi.com/article/10.3390/atmos16040400/s1, Table S1: Mean submicron particle number concentrations in different cities and roads in Jordan (PN1 (cm−3)); Table S2: Average particulate mass concentrations (μg·m−3) in different size fractions measured across the cities.; Table S3: Average particulate mass (μg·m−3) in different size fractions measured on main roads; Table S4: Submicron particle number concentrations in Karak regions PN1 (cm−3); Table S5: Particulate mass concentrations PM2.5 in Karak regions (μg·m−3); Table S6: Average particulate mass concentrations in Karak regions PM10 (μg·m−3); Table S7: Average particulate mass concentrations in Karak regions PM10–2.5 (μg·m−3)).

Author Contributions

Conceptualization, T.H., S.S.A.-S. and E.M.A.-H.; methodology, T.H. and O.A.-J.; software, T.H. and O.A.-J.; validation, T.H., S.S.A.-S., O.A.-J. and E.M.A.-H.; formal analysis, T.H., S.S.A.-S., O.A.-J. and E.M.A.-H.; investigation, T.H., S.S.A.-S., O.A.-J. and E.M.A.-H.; resources, T.H.; data curation, T.H. and O.A.-J.; writing—original draft preparation, T.H. and S.S.A.-S.; writing—review and editing, T.H., S.S.A.-S., O.A.-J. and E.M.A.-H.; visualization, T.H. and O.A.-J.; supervision, T.H.; project administration, T.H.; funding acquisition, T.H. All authors have read and agreed to the published version of the manuscript.

Funding

Financial support was provided by the Deanship of Scientific Research (DSR), Academy of Finland via the Atmosphere and Climate Competence Center (ACCC, project No. 272041) Flagship, and the Eastern Mediterranean and Middle East Climate and Atmosphere Research (EMME-CARE, EU Horizon 2020 RI, project No. 856612).

Institutional Review Board Statement

Not applicable.

Informed Consent Statement

Not applicable.

Data Availability Statement

Data are available upon request.

Acknowledgments

This research was part of a close collaboration between the Environmental and Atmospheric Research Laboratory (EARL, University of Jordan) and the Institute for Atmospheric and Earth System Research (INAR/Physics, University of Helsinki).

Conflicts of Interest

The authors declare no conflicts of interest.

References

  1. Chen, R.; Hu, B.; Liu, Y.; Xu, J.; Yang, G.; Xu, D.; Chen, C. Beyond PM2.5: The role of ultrafine particles on adverse health effects of air pollution. Biochim. Biophys. Acta Gen. Subj. 2016, 1860, 2844–2855. [Google Scholar]
  2. Fenger, J. Urban air quality. Atoms. Environ. 1999, 33, 4877–4900. [Google Scholar]
  3. Samet, J.M.; Dominici, F.; Curriero, F.C.; Coursac, I.; Zeger, S.L. Fine particulate air pollution and mortality in 20 US cities 1987–1994. N. Engl. J. Med. 2000, 343, 1742–1749. [Google Scholar] [CrossRef] [PubMed]
  4. Pope, C.A., 3rd; Burnett, R.T.; Thun, M.J.; Calle, E.E.; Krewski, D.; Ito, K.; Thurston, G.D. Lung cancer, cardiopulmonary mortality, and long-term exposure to fine particulate air pollution. JAMA 2002, 287, 1132–1141. [Google Scholar]
  5. Curtis, J.R.; Westfall, A.O.; Allison, J.; Bijlsma, J.W.; Freeman, A.; George, V.; Kovac, S.H.; Spettell, C.M.; Saag, K.G. Population-based assessment of adverse events associated with long-term glucocorticoid use. Arthritis Care Res. 2006, 55, 420–426. [Google Scholar] [CrossRef]
  6. Vinzents, P.S.; Moller, P.; Sorensen, M.; Knudsen, L.E.; Hertel, O.; Jensen, F.P.; Schibye, B.; Loft, S. Personal exposure to ultrafine particles and oxidative DNA damage. Environ. Health Perspect. 2005, 113, 1485–1490. [Google Scholar] [PubMed]
  7. Krewski, D. Evaluating the effects of ambient air pollution on life expectancy. N. Engl. J. Med. 2009, 360, 413–441. [Google Scholar]
  8. Lepeule, J.; Laden, F.; Dockery, D.; Schwartz, J. Chronic exposure to fine particles and mortality: An extended follow-up of the Harvard six cities study from 1974 to 2009. Environ. Health Perspect. 2012, 120, 965–970. [Google Scholar] [CrossRef]
  9. Burnett, R.T.; Pop, C.A., III; Ezzati, M.; Olives, C.; Lim, S.S.; Mehta, S.; Shin, H.H.; Singh, G.; Hubbell, B.; Brauer, M.; et al. An integrate risk Function for estimating the global burden of disease attribute to ambient fine particulate matter exposure. Environ. Health Perspect. 2012, 122, 397–403. [Google Scholar]
  10. Lohmann, U.; Feichter, J. Global indirect aerosol effects: A review. Atmospheric Meas. Tech. 2005, 5, 715–737. [Google Scholar]
  11. Akinyoola, J.A.; Oluleye, A.; Gbode, I.E. A Review of Atmospheric Aerosol Impacts on Regional Extreme Weather and Climate Events. Aerosol Sci. Eng. 2024, 8, 249–274. [Google Scholar]
  12. Myhre, G.; Samset, B.H.; Schulz, M.; Balkanski, Y.; Bauer, S.; Berntsen, T.K.; Bian, H.; Bellouin, N.; Chin, M.; Diehl, T.; et al. Radiative forcing of the direct aerosol effect from AeroCom Phase II simulations. Atmos. Chem. Phys. 2013, 13, 1853–1877. [Google Scholar]
  13. Haywood, J.; Boucher, O. Estimates of the Direct and Indirect Radiative Forcing Due to Tropospheric Aerosols: A Review. Rev. Geophys. 2000, 38, 513–543. [Google Scholar]
  14. Boman, J.; Shaltout, A.A.; Abozied, A.M.; Hassan, S.K. On the elemental composition of PM2.5 in central Cairo, Egypt. X-ray Spectrom. 2013, 42, 276–283. [Google Scholar]
  15. Rushdi, A.I.; El-Mubarak, A.H.; Lijotra, L.; Al-Otaibi, M.T.; Qurban, M.A.; Al-Mutlaq, K.F.; Simoneit, B.R.T. Characteristics of organic compounds in aerosol particulate matter from Dhahran city, Saudi Arabia Arab. J. Chem. 2017, 10, S3532–S3547. [Google Scholar]
  16. Dada, L.; Mrad, R.; Siffert, S.; Saliba, N.A. Atmospheric markers of African and Arabian dust in an urban Eastern Mediterranean environment, Beirut, Lebanon. J. Aerosol Sci. 2013, 66, 187–192. [Google Scholar]
  17. Alam, K.; Trautmann, T.; Blaschke, T.; Subhan, F. Changes in aerosol optical properties due to dust storms in the Middle East and Southwest Asia. Remote. Sens. Environ. 2014, 143, 216–227. [Google Scholar]
  18. Alam, K.; Mukhtar, A.; Shahid, I.; Blaschke, T.; Majid, H.; Rahman, S.; Khan, R.; Rahman, N. Source Apportionment and Characterization of Particulate Matter (PM10) in Urban Environment of Lahore. Aerosol Air Qual. Res. 2014, 14, 1851–1861. [Google Scholar]
  19. Gherboudj, I.; Ghedira, H. Spatiotemporal assessment of dust loading over the United Arab Emirates. Int. J. Clim. 2014, 34, 3321–3335. [Google Scholar] [CrossRef]
  20. Basha, G.; Phanikumar, D.V.; Kumar, K.N.; Ouarda, T.B.; Marpu, P.R. Investigation of aerosol optical, physical, and radiative characteristics of a severe dust storm observed over UAE. Remote Sens. Environ. 2015, 169, 404–417. [Google Scholar]
  21. Saliba, N.A.; Kouyoumdjian, H.; Roumie’, M. Effect of local and long-range transport emissions on the elemental composition of PM10–2.5 and PM2.5 in Beirut. Atmos. Environ. 2007, 41, 6497–6509. [Google Scholar]
  22. Roumie, M.; Chiari, M.; Srour, A.; Sa’adeh, H.; Reslan, A.; Sultan, M.; Ahmad, M.; Calzolai, G.; Nava, S.; Zubaidi, T.; et al. Evaluation and mapping of PM2.5 atmospheric aerosols in Arasia region using PIXE and gravimetric measurements. Nuclear Instrum. Methods Phys. Res. Sect. B Beam Interact. Mater. At. 2016, 371, 381–386. [Google Scholar]
  23. Alghamdi, M.A.; Almazroui, M.; Shamy, M.; Redal, M.A.; Alkhalaf, A.K.; Hussein, M.A.; Khoder, M.I. Characterization and elemental composition of atmospheric aerosol loads during springtime dust storm in western Saudi Arabia. Aerosol Air Qual. Res. 2015, 15, 440–453. [Google Scholar]
  24. Daher, N.; Saliba, N.A.; Shihadeh, A.I.; Jaafar, M.; Baalbaki, R.; Sioutas, C. Chemical composition of size-resolved particulate matter at near-freeway and urban background sites in the greater Beirut area. Atmos. Environ. 2013, 80, 96–106. [Google Scholar]
  25. El-Araby, E.H.; Abd El-Wahab, M.; Diab, H.M.; El-Desouky, T.M.; Mohsen, M. Assessment of atmospheric heavy metal deposition in North Egypt aerosols using neutron activation analysis and optical emission inductively coupled plasma. Appl. Radiat. Isot. 2011, 69, 1506–1511. [Google Scholar]
  26. Engelbrecht, J.P.; Jayanty, R.K.M. Assessing sources of airborne mineral dust and other aerosols, in Iraq. Aeolian Res. 2013, 9, 153–160. [Google Scholar]
  27. Hamad, A.H.; Schauer, J.J.; Heo, J.; Kadhimd, A.K.H. Source apportionment of PM2.5 carbonaceous aerosol in Baghdad, Iraq. Atmos. Res. 2015, 156, 80–90. [Google Scholar] [CrossRef]
  28. Hassan, S.K.; El-Abssawy, A.A.; Abd El-Maksoud, A.S.; Abdou, M.H.; Khoder, M.I. Seasonal behaviours and weekdays/weekends differences in elemental composition of atmospheric aerosols in Cairo, Egypt. Aerosol Air Qual. Res. 2013, 13, 1552–1562. [Google Scholar]
  29. Habeebullah, T.M. An analysis of air pollution in Makkah—A view point of source identification. Environ. Asia 2013, 2, 11–17. [Google Scholar]
  30. Khodeir, M.; Shamy, M.; Alghamdi, M.; Zhong, M.; Sun, H.; Costa, M.; Chen, L.-C.; Maciejczyk, P. Source apportionment and elemental composition of PM2.5 and PM10 in Jeddah City, Saudi Arabia. Atmos. Pollut. Res. 2012, 3, 331–340. [Google Scholar]
  31. Kouyoumdjian, H.; Saliba, N.A. Mass concentration and ion composition of coarse and fine particles in an urban area in Beirut: Effect of calcium carbonate on the absorption of nitric and sulfuric acids and the depletion of chloride. Atmos. Chem. Phys. 2006, 6, 1865–1877. [Google Scholar] [CrossRef]
  32. Rushdi, A.I.; Al-Mutlaq, K.F.; Al-Otaibi, M.; El-Mubarak, A.H.; Simoneit, B.R.T. Air quality and elemental enrichment factors of aerosol particulate matter in Riyadh City, Saudi Arabia. Arab. J. Geosci. 2013, 6, 585–599. [Google Scholar]
  33. Shaltout, A.A.; Boman, J.; Al-Malawi, D.-A.R.; Shehadeh, Z.F. Elemental Composition of PM2.5 Particles Sampled in Industrial and Residential Areas of Taif, Saudi Arabia. Aerosol Air Qual. Res. 2013, 13, 1356–1364. [Google Scholar]
  34. Waked, A.; Afif, C.; Brioude, J.; Formenti, P.; Chevaillier, S.; El Haddad, I.; Doussin, J.-F.; Borbon, A.; Seigneur, C. Composition and source apportionment of organic aerosol in Beirut, Lebanon, during winter 2012. Aerosol Sci. Technol. 2013, 47, 1258–1266. [Google Scholar]
  35. Saliba, N.A.; El Jam, F.; El Tayar, G.; Obeid, W.; Roumie, M. Origin and variability of particulate matter (PM10 and PM2.5) mass concentrations over an Eastern Mediterranean city. Atmos. Res. 2010, 97, 106–114. [Google Scholar]
  36. Al-Dousari, A.; Doronzo, D.; Ahmed, M. Types, Indications and Impact Evaluation of Sand and Dust Storms Trajectories in the Arabian Gulf. Sustainability 2017, 9, 1526. [Google Scholar] [CrossRef]
  37. Doronzo, D.M.; Khalaf, E.A.; Dellino, P.; de Tullio, M.D.; Dioguardi, F.; Gurioli, L.; Mele, D.; Pascazio, G.; Sulpizio, R. Local impact of dust storms around a suburban building in arid and semi-arid regions: Numerical simulation examples from Dubai and Riyadh, Arabian Peninsula. Arab. J. Geosci. 2015, 8, 7359–7369. [Google Scholar]
  38. Jaafar, M.; Baalbaki, R.; Mrad, R.; Daher, N.; Shihadeh, A.; Sioutas, C.; Saliba, N.A. Dust episodes in Beirut and their effect on the chemical composition of coarse and fine particulate matter. Sci. Total Environ. 2014, 496, 75–83. [Google Scholar]
  39. Saeed, T.M.; Al-Dashti, H.; Spyrou, C. Aerosol’s optical and physical characteristics and direct radiative forcing during a shamal dust storm, a case study. Atmos. Chem. Phys. 2014, 14, 3751–3769. [Google Scholar]
  40. El-Askary, H.; Farouk, R.; Ichoku, C.; Kafatos, M. Transport of dust and anthropogenic aerosols across Alexandria, Egypt. Ann. Geophys. 2009, 27, 2869–2879. [Google Scholar]
  41. El-Askary, H.; Kafatos, M. Dust storm and black cloud influence on aerosol optical properties over Cairo and the Greater Delta region, Egypt. Int. J. Remote Sens. 2008, 29, 7199–7211. [Google Scholar]
  42. Reid, J.S.; Reid, E.A.; Walker, A.; Piketh, S.; Cliff, S.; Al Mandoos, A.; Tsay, S.-C.; Eck, T.F. Dynamics of southwest Asian dust particle size characteristics with implications for global dust research. J. Geophys. Res. 2008, 113, D14212. [Google Scholar] [CrossRef]
  43. Satheesh, S.K.; Deepshikha, S.; Srinivasan, J. Impact of dust aerosols on Earth–atmosphere clear-sky albedo and its short-wave radiative forcing over African and Arabian regions. Int. J. Remote Sens. 2006, 27, 1691–1706. [Google Scholar]
  44. Al-Momani, I.F.; Shatnawi, W.M. Chemical Characterization and Source Determination of Trace Elements in PM2.5 and PM10 from an Urban Area, Northern Jordan. Int. J. Environ. Monit. Anal. 2017, 5, 103–108. [Google Scholar]
  45. Jiries, A. Vehicular Contamination of Dust in Amman, Jordan. Environmentalist 2003, 23, 205–210. [Google Scholar]
  46. von Schneidemesser, E.; Zhou, J.; Stone, E.A.; Schauer, J.J.; Qasrawi, R.; Abdeen, Z.; Shpund, J.; Vanger, A.; Sharf, G.; Moise, T.; et al. Seasonal and spatial trends in the sources of fine particle organic carbon in Israel, Jordan, and Palestine. Atmos. Environ. 2010, 44, 3669–3678. [Google Scholar]
  47. Abdeen, Z.; Qasrawi, R.; Heo, J.; Wu, B.; Shpund, J.; Vanger, A.; Sharf, G.; Moise, T.; Brenner, S.; Nassar, K.; et al. Spatial and temporal variation in fine particulate matter mass and chemical composition. Sci. World J. 2014, 2014, 878704. [Google Scholar]
  48. Hussein, T.; Abu AlRuz, R.; Petäjä, T.; Junnienen, H.; Arafa, D.; Hämeri, K.; Kumala, M. Local air pollution versus short- range transported dust episodes: A comparative study for submicron particle number concentration. Aerosol Air Qual. Res. 2011, 11, 109–119. [Google Scholar]
  49. Hussein, T.; Halayka, M.; Abu Al-Ruz, R.; Abdullah, H.; Mølgaard, B.; Petäjä, T. Fine Particle Number Concentrations in Amman and Zarqa during Spring 2014. Jordan J. Phys. 2016, 9, 31–46. [Google Scholar]
  50. Tadros, M.T.Y.; Madkour, M.; El-Metwally, M. Size distribution of aerosol particles: Comparison between agricultural and industrial areas in Egypt. Renew. Energy 1999, 17, 339–354. [Google Scholar]
  51. Moustafa, M.; Mohamed, A.; Ahmed, A.-R.; Nazmy, H. Mass size distributions of elemental aerosols in industrial area. J. Adv. Res. 2015, 6, 827–832. [Google Scholar] [PubMed]
  52. Hussein, T.; Boor, B.E.; Santos, V.N.; Kangasluoma, J.; Petäjä, T.; Lihavainen, H. Mobile aerosol measurement in the eastern Mediterranean—A utilization of portable instruments. Aerosol Air Qual. Res. 2017, 17, 1875–1886. [Google Scholar]
  53. Ali-Saleh, S.; Shilbayeh, Z.; Alkattan, H.; Al-Refie, M.; Jaghbeir, O.; Hussein, T. Temporal Variations of Submicron Particle Number Concentrations at an Urban Background Site in Amman—Jordan. Jordan J. Earth Environ. Sci. 2019, 10, 37–44. [Google Scholar]
  54. Hussein, T.; Betar, A. Size-fractionated number and mass concentrations in the urban background atmosphere during spring 2014 in Amman—Jordan. Jordan J. Phys. 2017, 10, 51–60. [Google Scholar]
  55. Hussein, T.; Dada, L.; Hakala, S.; Petäjä, T.; Kulmala, M. Urban Aerosol Particle Size Characterization in Eastern Mediterranean Conditions. Atmosphere 2019, 10, 710. [Google Scholar] [CrossRef]
  56. Hussein, T.; Ali- Saleh, S.S.; dos Santos, V.N.; Abdullah, H.; Boor, B.E. Black Carbon and Particulate Matter Concentrations in Eastern Mediterranean Urban Conditions: An Assessment Based on Integrated Stationary and Mobile Observations. Atmosphere 2019, 10, 323. [Google Scholar] [CrossRef]
  57. Hussein, T.; Juwhari, H.; Al Kuisi, M.; Alkattan, H.; Lahlouh, B.; Al-Hunaiti, A. Accumulation and coarse mode aerosol concentrations and carbonaceous contents in the urban background atmosphere in Amman, Jordan. Arab. J. Geosci. 2018, 11, 617. [Google Scholar]
  58. Hussein, T.; Li, X.; Al-Dulaimi, Q.; Daour, S.; Atashi, N.; Viana, M.; Alastuey, A.; Sogacheva, L.; Arar, S.; Al-Hunaiti, A.; et al. Particulate Matter Concentrations in a Middle Eastern City—An Insight to Sand and Dust Storm Episodes. Aerosol Air Qual. Res. 2020, 20, 2780–2792. [Google Scholar]
  59. Hussein, T.; Atashi, N.; Sogacheva, L.; Hakala, S.; Dada, L.; Petaja, T.; Kulmala, M. Characterization of Urban New Particle Formation in Amman-Jordan. Atmosphere 2020, 11, 79. [Google Scholar] [CrossRef]
  60. Hussein, T.; Li, X.; Bakri, Z.; Alastuey, A.; Arar, S.; Al-Hunaiti, A.; Viana, M.; Petäjä, T. Organic and Elemental Carbon in the Urban Background in an Eastern Mediterranean City. Atmosphere 2022, 13, 197. [Google Scholar] [CrossRef]
  61. Hussein, T.; Puustinen, A.; Aalto, P.P.; Mäkelä, J.M.; Hämeri, K.; Kulmala, M. Urban aerosol number size distributions. Atmos. Chem. Phys. 2004, 4, 391–411. [Google Scholar]
  62. Vilcassim, R.; Thurston, G.D. Gaps and future directions in research on health effects of air pollution. EBioMedicine 2023, 93, 104668. [Google Scholar] [CrossRef]
  63. Huang, X.; Steinmetz, J.; Marsh, E.K.; Aravkin, A.Y.; Ashbaugh, C.; Murray, C.J.L.; Yang, F.; Ji, J.S.; Zheng, P.; Sorensen, R.J.D.; et al. A systematic review with a Burden of Proof meta-analysis of health effects of long-term ambient fine particulate matter (PM2.5) exposure on dementia. Nat. Aging 2025, 1–12. [Google Scholar] [CrossRef]
  64. Al-Hourani, E.; Ali-Saleh, S.S.; Majali, M.; Al-Jaghbeer, O.; Shniekat, A.; Al-Qenneh, M.; Hussein, T. Spatial Variations of Particulate Matter in Mid-West Jordan. Jordan J. Phys. 2024, 17, 423–436. [Google Scholar]
  65. Rahman, M.M.; Mazaheri, M.; Clifford, S.; Morawska, L. Estimate of main local sources to ambient ultrafine particle number concentrations in an urban area. Atmos. Res. 2017, 194, 178–189. [Google Scholar] [CrossRef]
  66. Goel, A.; Kumar, P. A review of fundamental drivers governing the emissions, dispersion and exposure to vehicle-emitted nanoparticles at signalised traffic intersections. Atmos. Environ. 2014, 97, 316–331. [Google Scholar]
  67. Hussein, T.; Mølgaard, B.; Hannuniemi, H.; Martikainen, J.; Järvi, L.; Wegner, T.; Ripamonti, G.; Weber, S.; Vesala, T.; Hämeri, K. Fingerprints of the urban particle number size distribution in Helsinki, Finland: Local versus regional characteristics. Boreal Environ. Res. 2014, 19, 1–20. [Google Scholar]
  68. Padro-Martinez, L.T.; Patton, A.P.; Trull, J.B.; Zamore, W.; Brugge, D.; Durant, J.L. Mobile monitoring of particle number concentration and other traffic-related air pollutants in a near-highway neighbourhood over the course of a year. Atmos. Environ. 2012, 61, 253–264. [Google Scholar]
  69. Backman, J.; Rizzo, L.V.; Hakala, J.; Nieminen, T.; Manninen, H.E.; Morais, F.; Aalto, P.P.; Siivola, E.; Carbone, S.; Hillamo, R.; et al. On the diurnal cycle of urban aerosols, black carbon and the occurrence of new particle formation events in springtime São Paulo, Brazil. Atmos. Atmos. Chem. Phys. 2012, 12, 11733–11751. [Google Scholar] [CrossRef]
  70. Mølgaard, B.; Birmili, W.; Clifford, S.; Massling, A.; Eleftheriadis, K.; Norman, M.; Vratolis, S.; Wehner, B.; Corander, J.; Hämeri, K.; et al. Evaluation of a statistical forecast model for size-fractionated urban particle number concentrations using data from five European cities. J. Aerosol Sci. 2013, 66, 96–110. [Google Scholar]
  71. EPA. Available online: https://www.epa.gov/pm-pollution/national-ambient-air-quality-standards-naaqs-pm (accessed on 27 March 2024).
  72. Abi-Esber, L.; El-Fadel, M. Indoor to outdoor air quality associations with self pollution implications inside passenger car cabins. Atmos. Environ. 2013, 81, 450–463. [Google Scholar]
Figure 1. Driving tracks for the mobile measurements made on 12 and 28 April projected on (a) map of Jordan, (b) zoomed for the northern–western region of Jordan, and (c) zoomed for the Karak governorate.
Atmosphere 16 00400 g001
Figure 2. Spatial variation in the particulate number concentrations within the Karak governorate: (a) PN10, (b) PN1, and (c) PN10–1.
Atmosphere 16 00400 g002
Figure 3. Spatial variation in the particulate mass concentrations within the Karak governorate: (a) PM10, (b) PM2.5, and (c) PM10–2.5.
Atmosphere 16 00400 g003
Figure 4. Average concentrations separated for different cities, roads, and parts within the Karak governorate. (a) Particle mass (PM2.5 and PM10) and (b) submicron particles (PN1) and coarse particles (PN10–1).
Atmosphere 16 00400 g004
Figure 5. Particle number size distributions measured in different cities and roads.
Atmosphere 16 00400 g005
Disclaimer/Publisher’s Note: The statements, opinions and data contained in all publications are solely those of the individual author(s) and contributor(s) and not of MDPI and/or the editor(s). MDPI and/or the editor(s) disclaim responsibility for any injury to people or property resulting from any ideas, methods, instructions or products referred to in the content.

