


Assessing the Impact of Ambient Noise on Outdoor Thermal Comfort on University Campuses: A Pilot Study in China’s Cold Region

Abstract
:1. Introduction
2. Methods
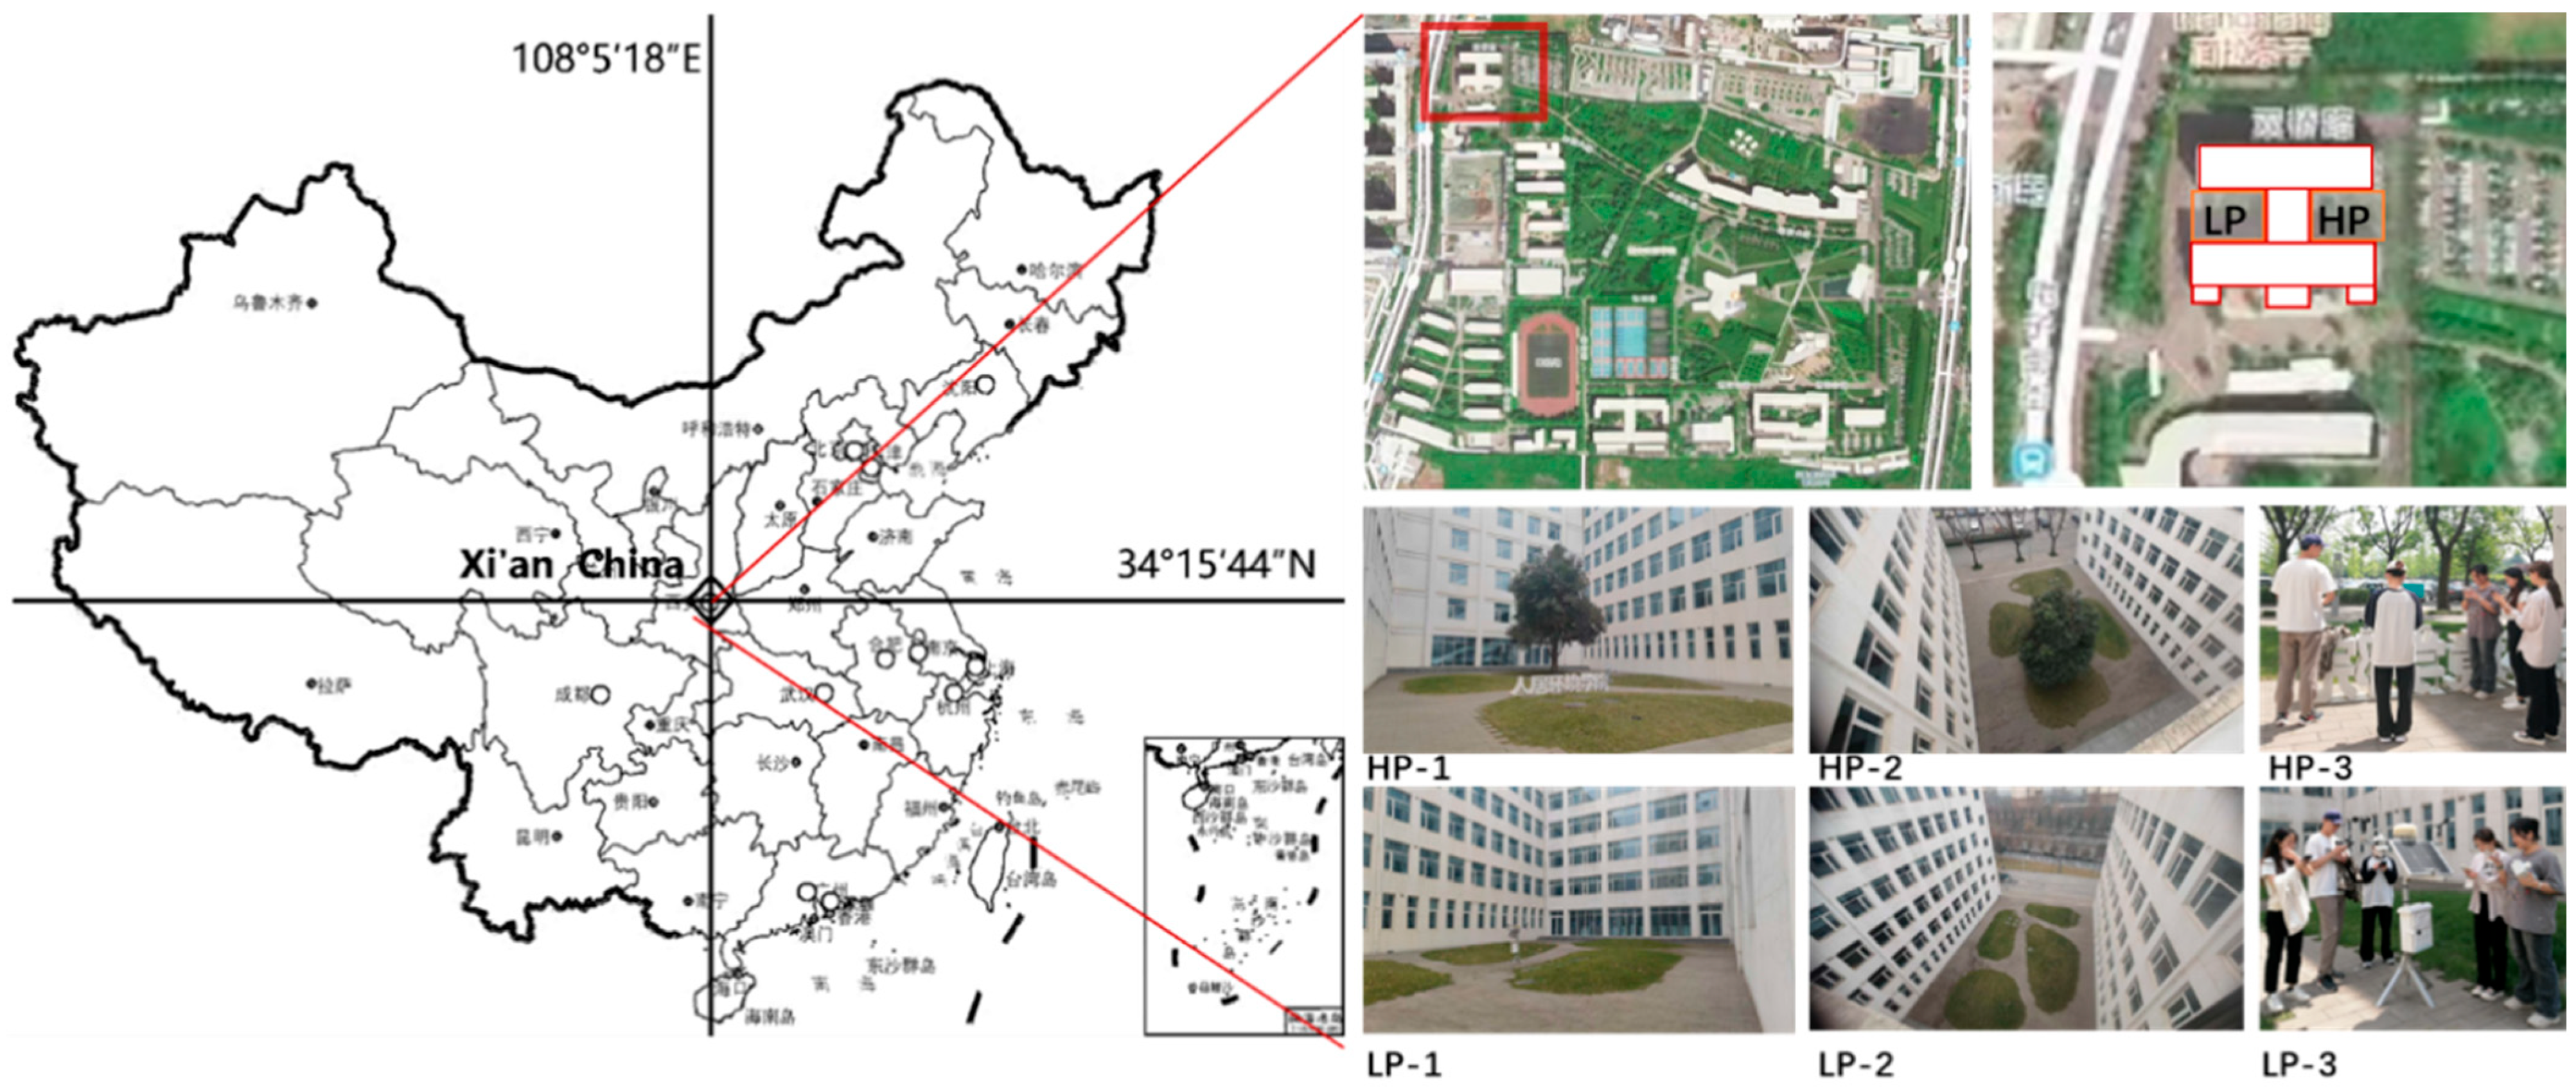
2.1. Study Sites
2.2. Experimental Design
2.2.1. Sample Size
2.2.2. Questionnaire Surveys
2.2.3. Subject Information
2.2.4. Meteorological Data Measurement
2.3. Thermal Index
3. Result
3.1. LP Survey Analysis
3.2. HP Survey Analysis
3.3. Comparative Analysis Between LP and HP
3.3.1. Comparative Analysis of Subjective Perception Under Different Noise Environments
3.3.2. Changes in TSV Under Different Noise Environments
3.3.3. Neutral Temperature
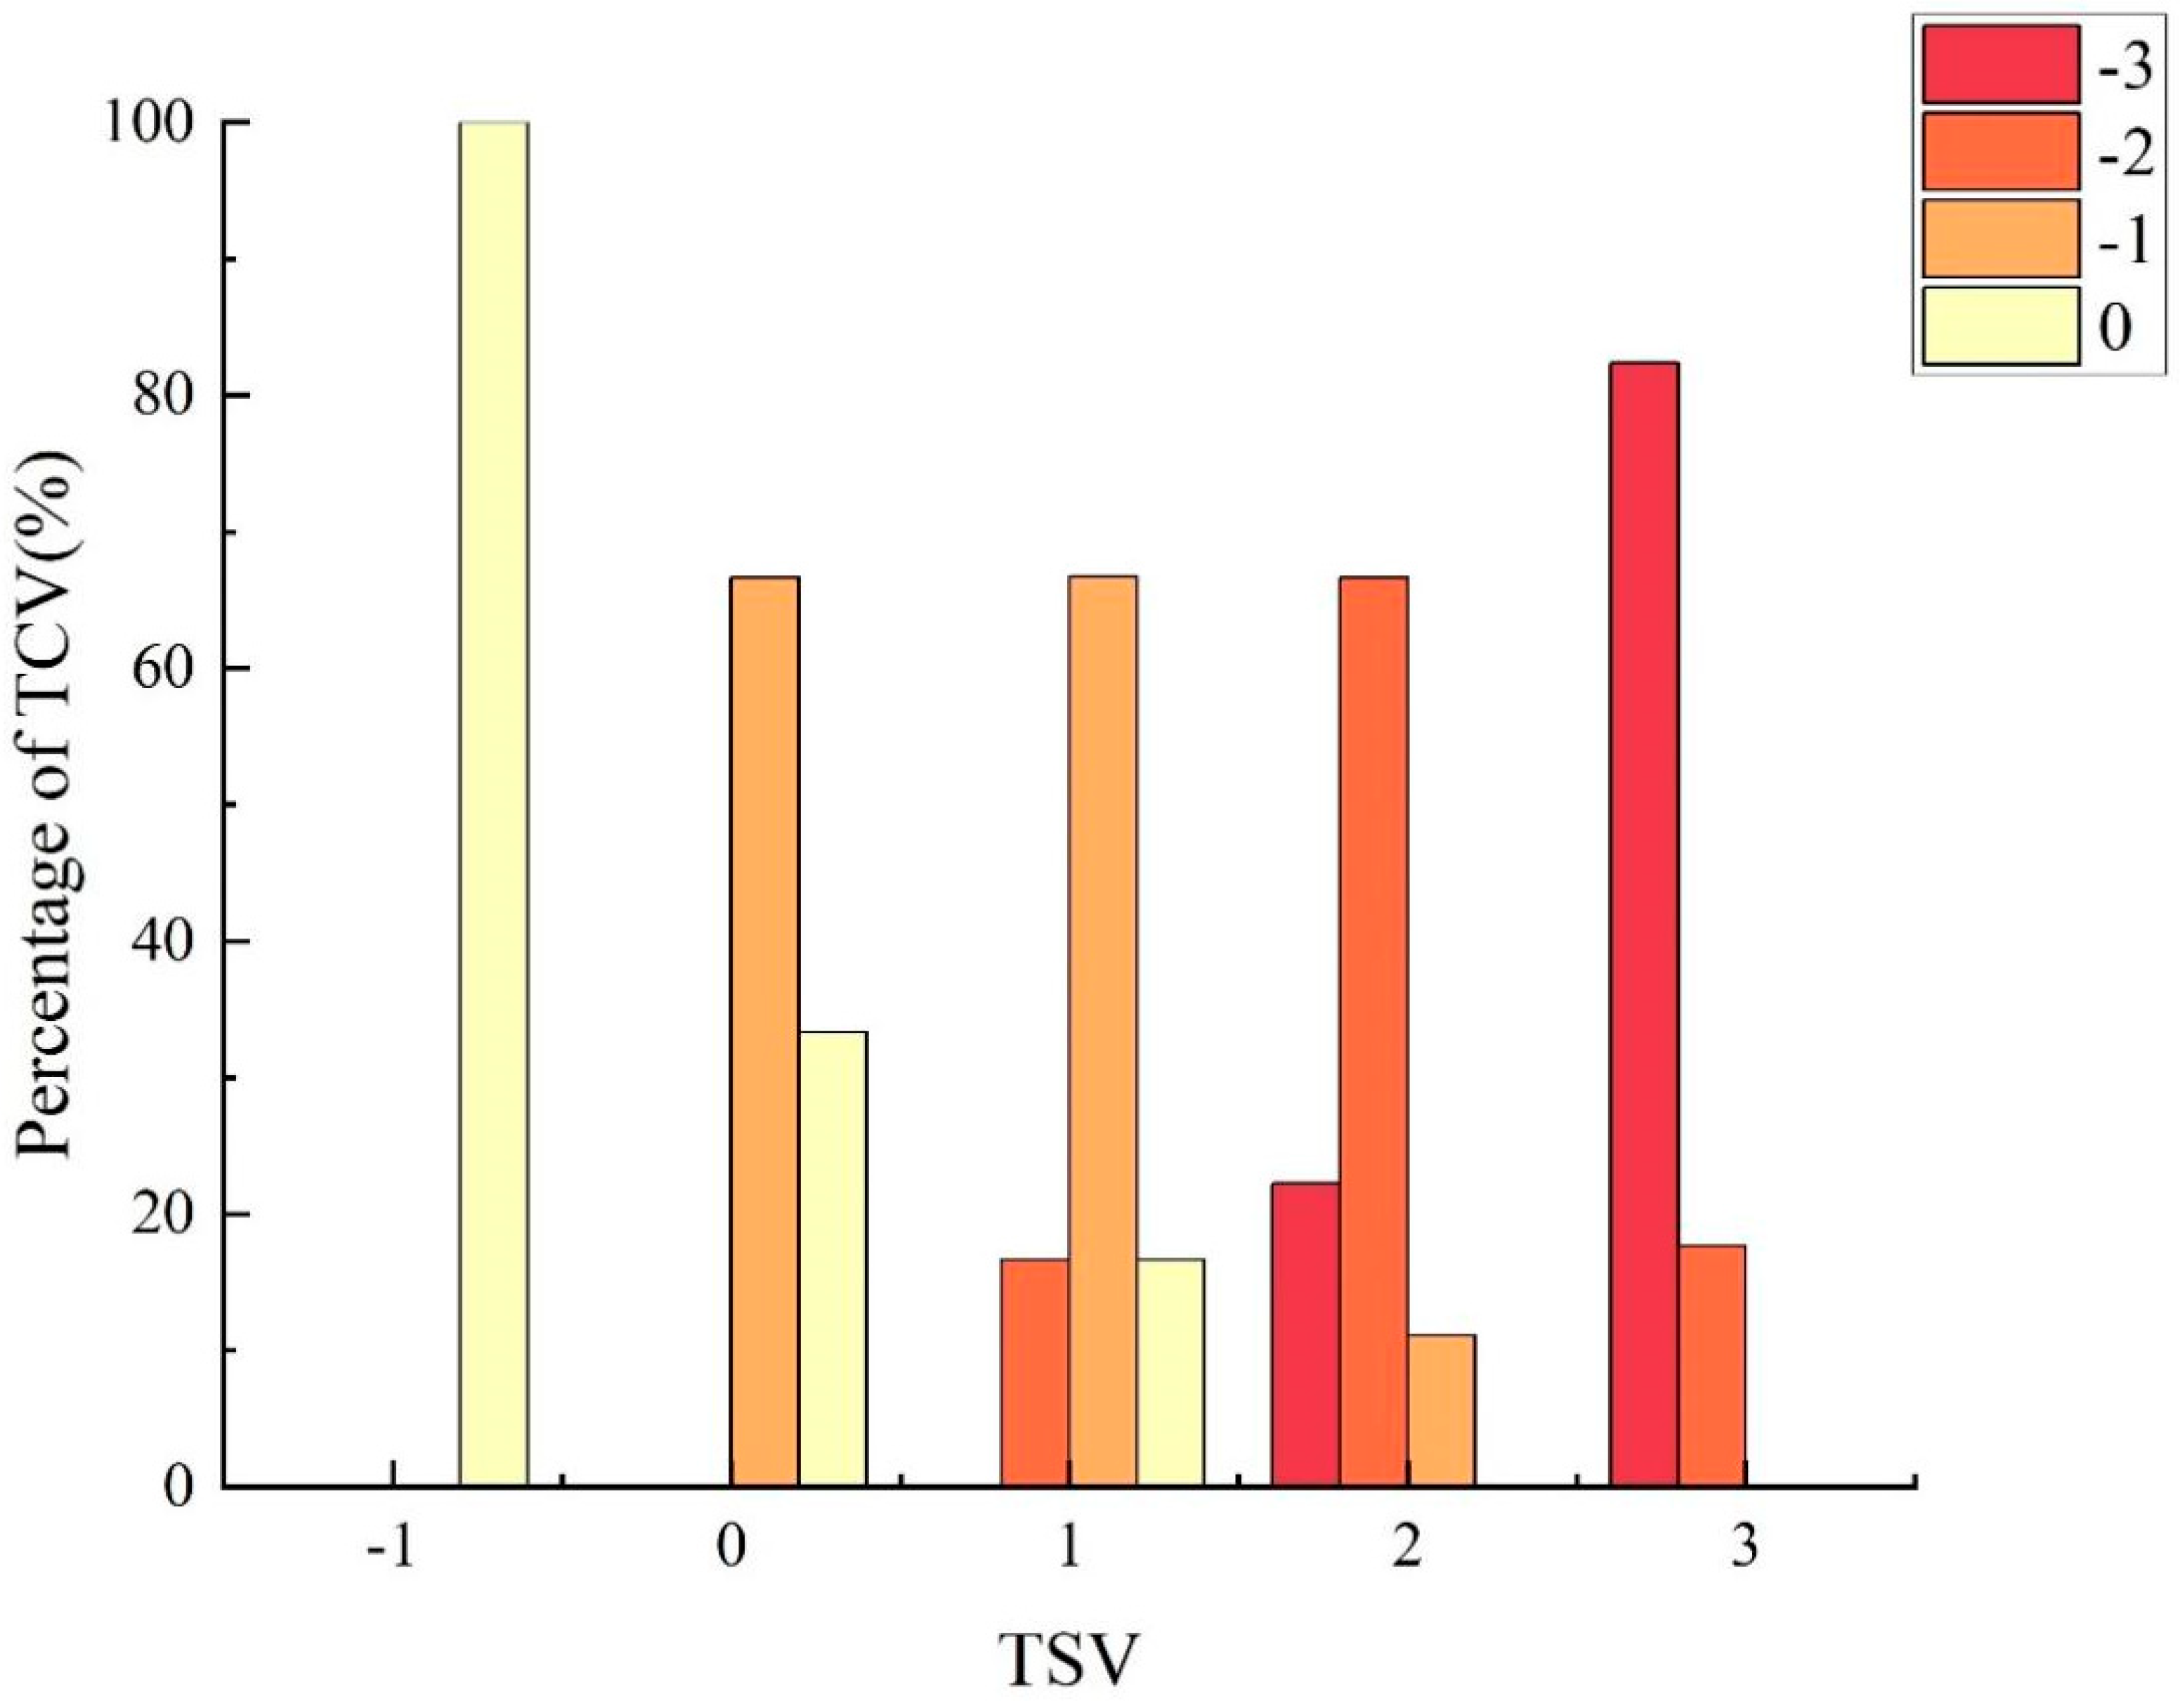
3.3.4. Relationship Between TSV and TCV Under Different Noise Environments
4. Discussion
4.1. Impact of Noise on Outdoor Thermal Comfort
4.2. TSV and TCV
4.3. Practical Implications for Campus Planning
4.4. Limitations and Future Works
5. Conclusions
- (1)
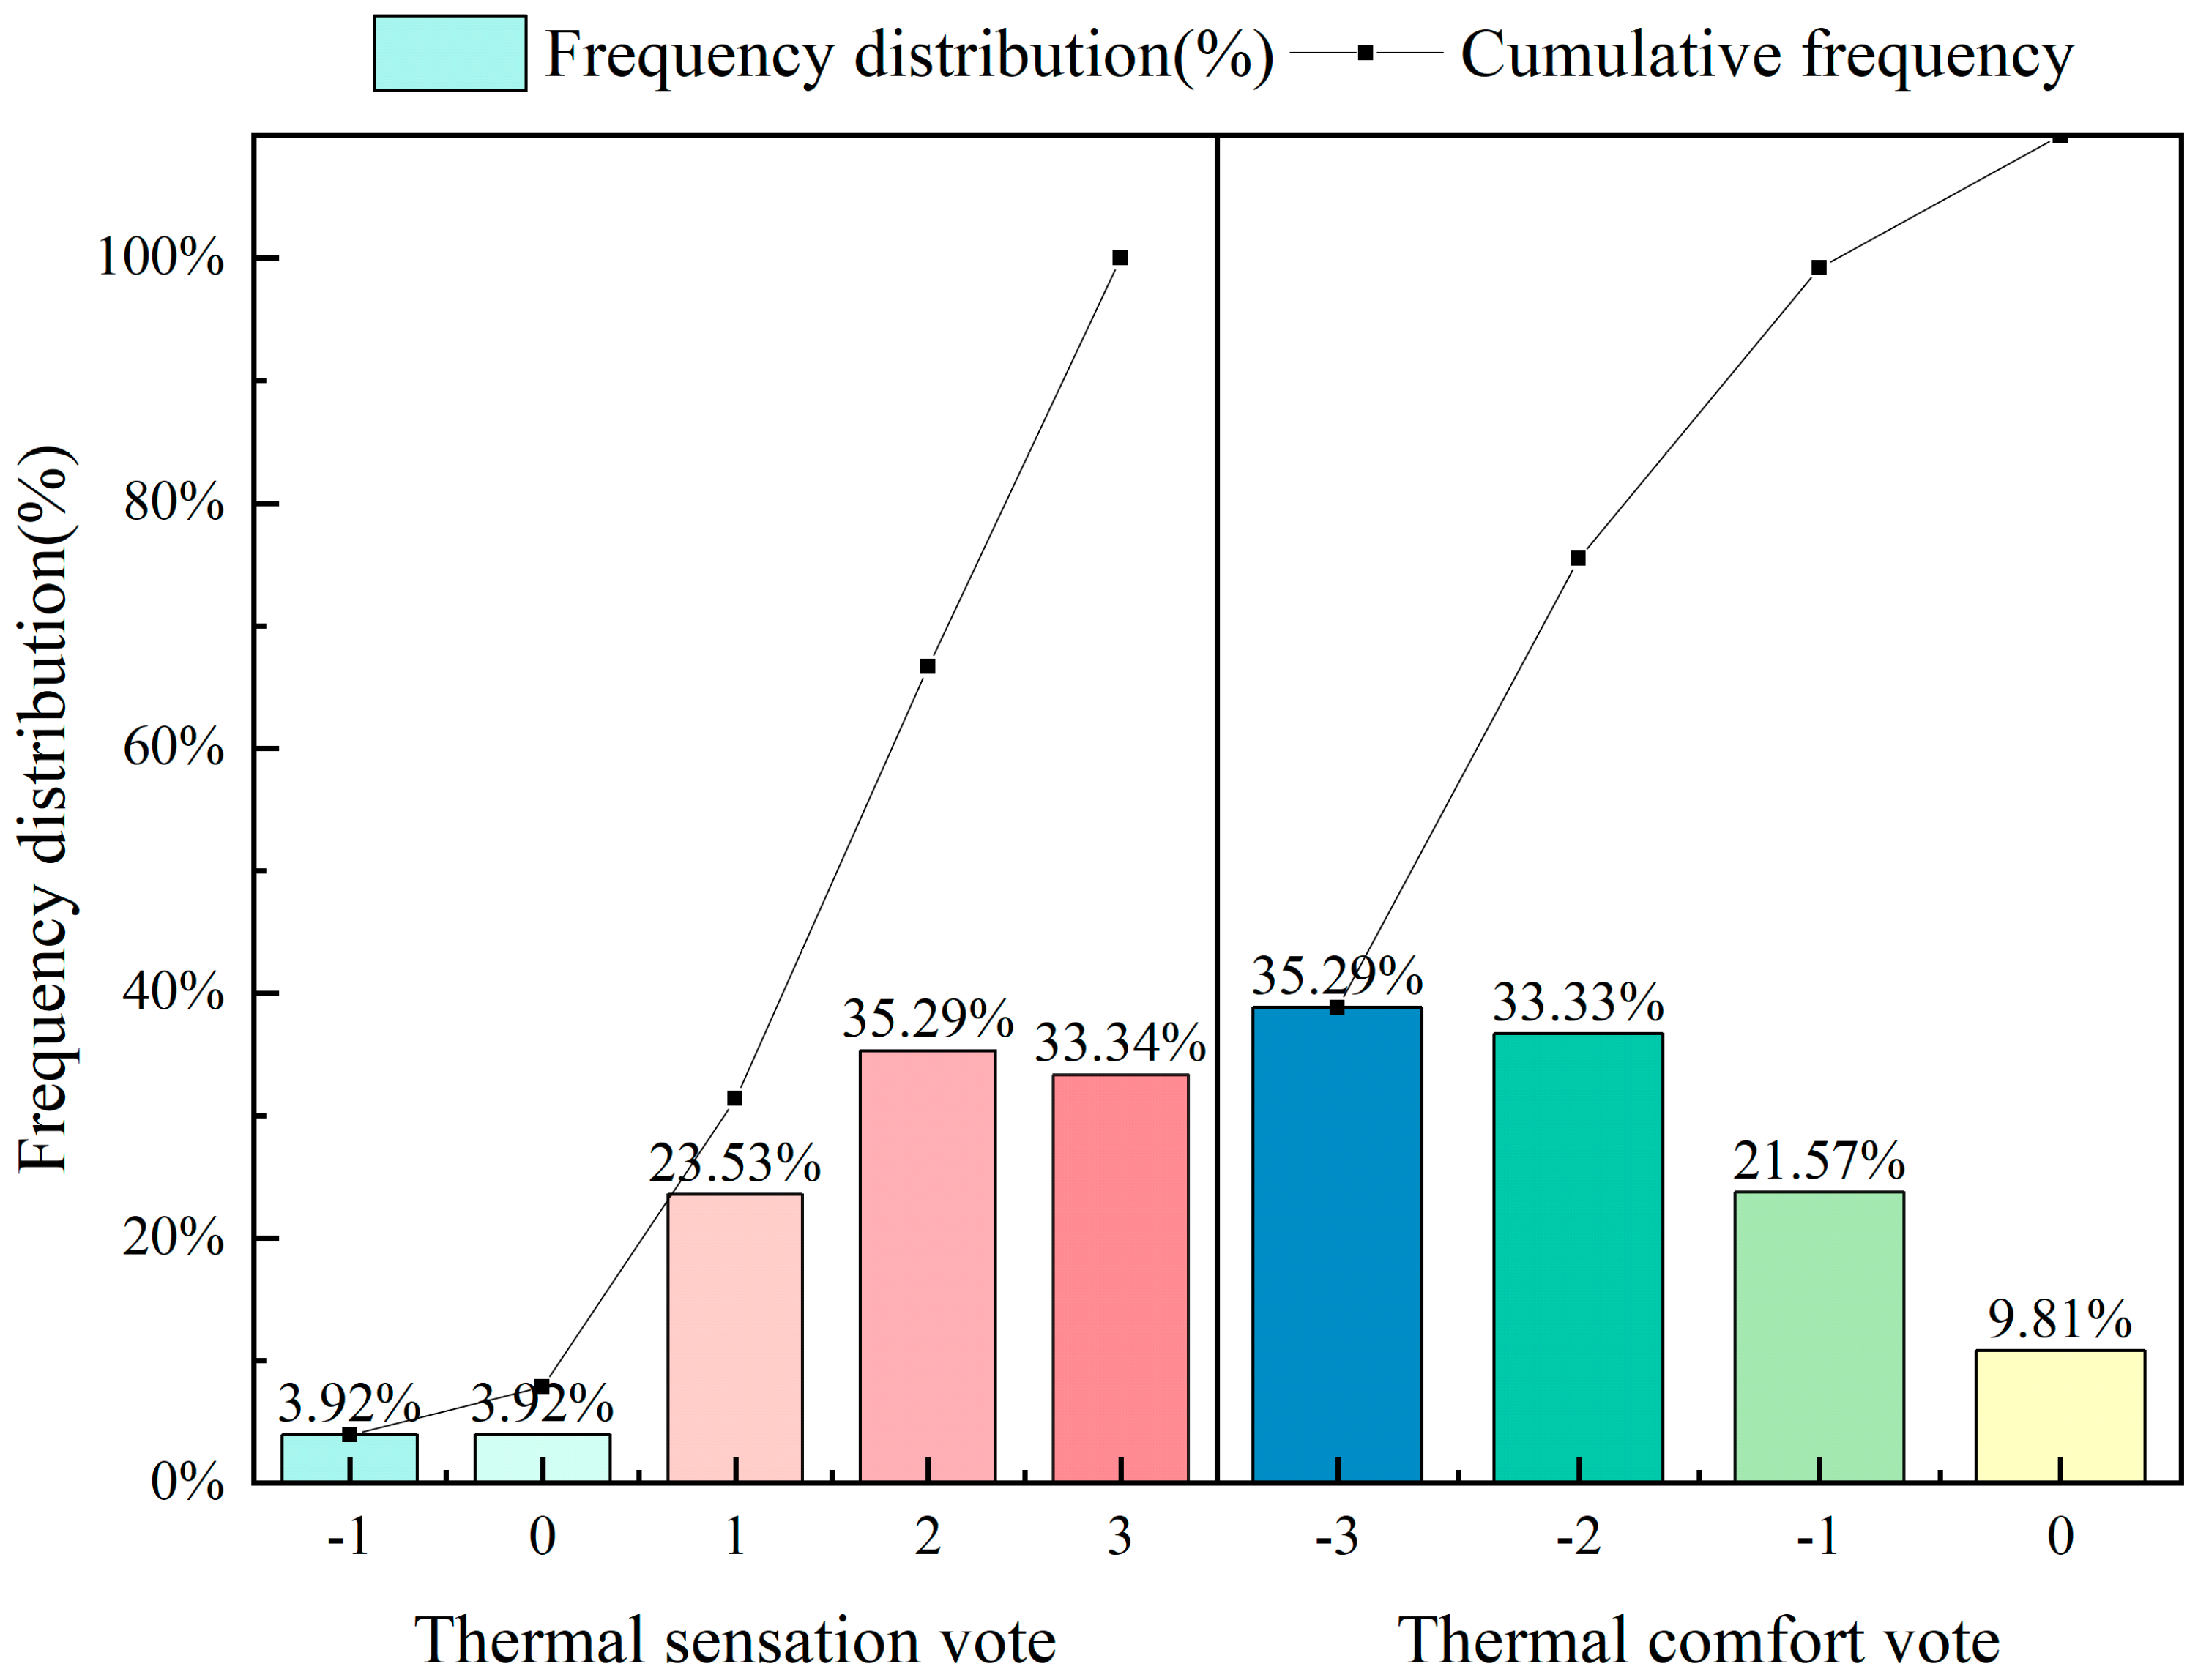
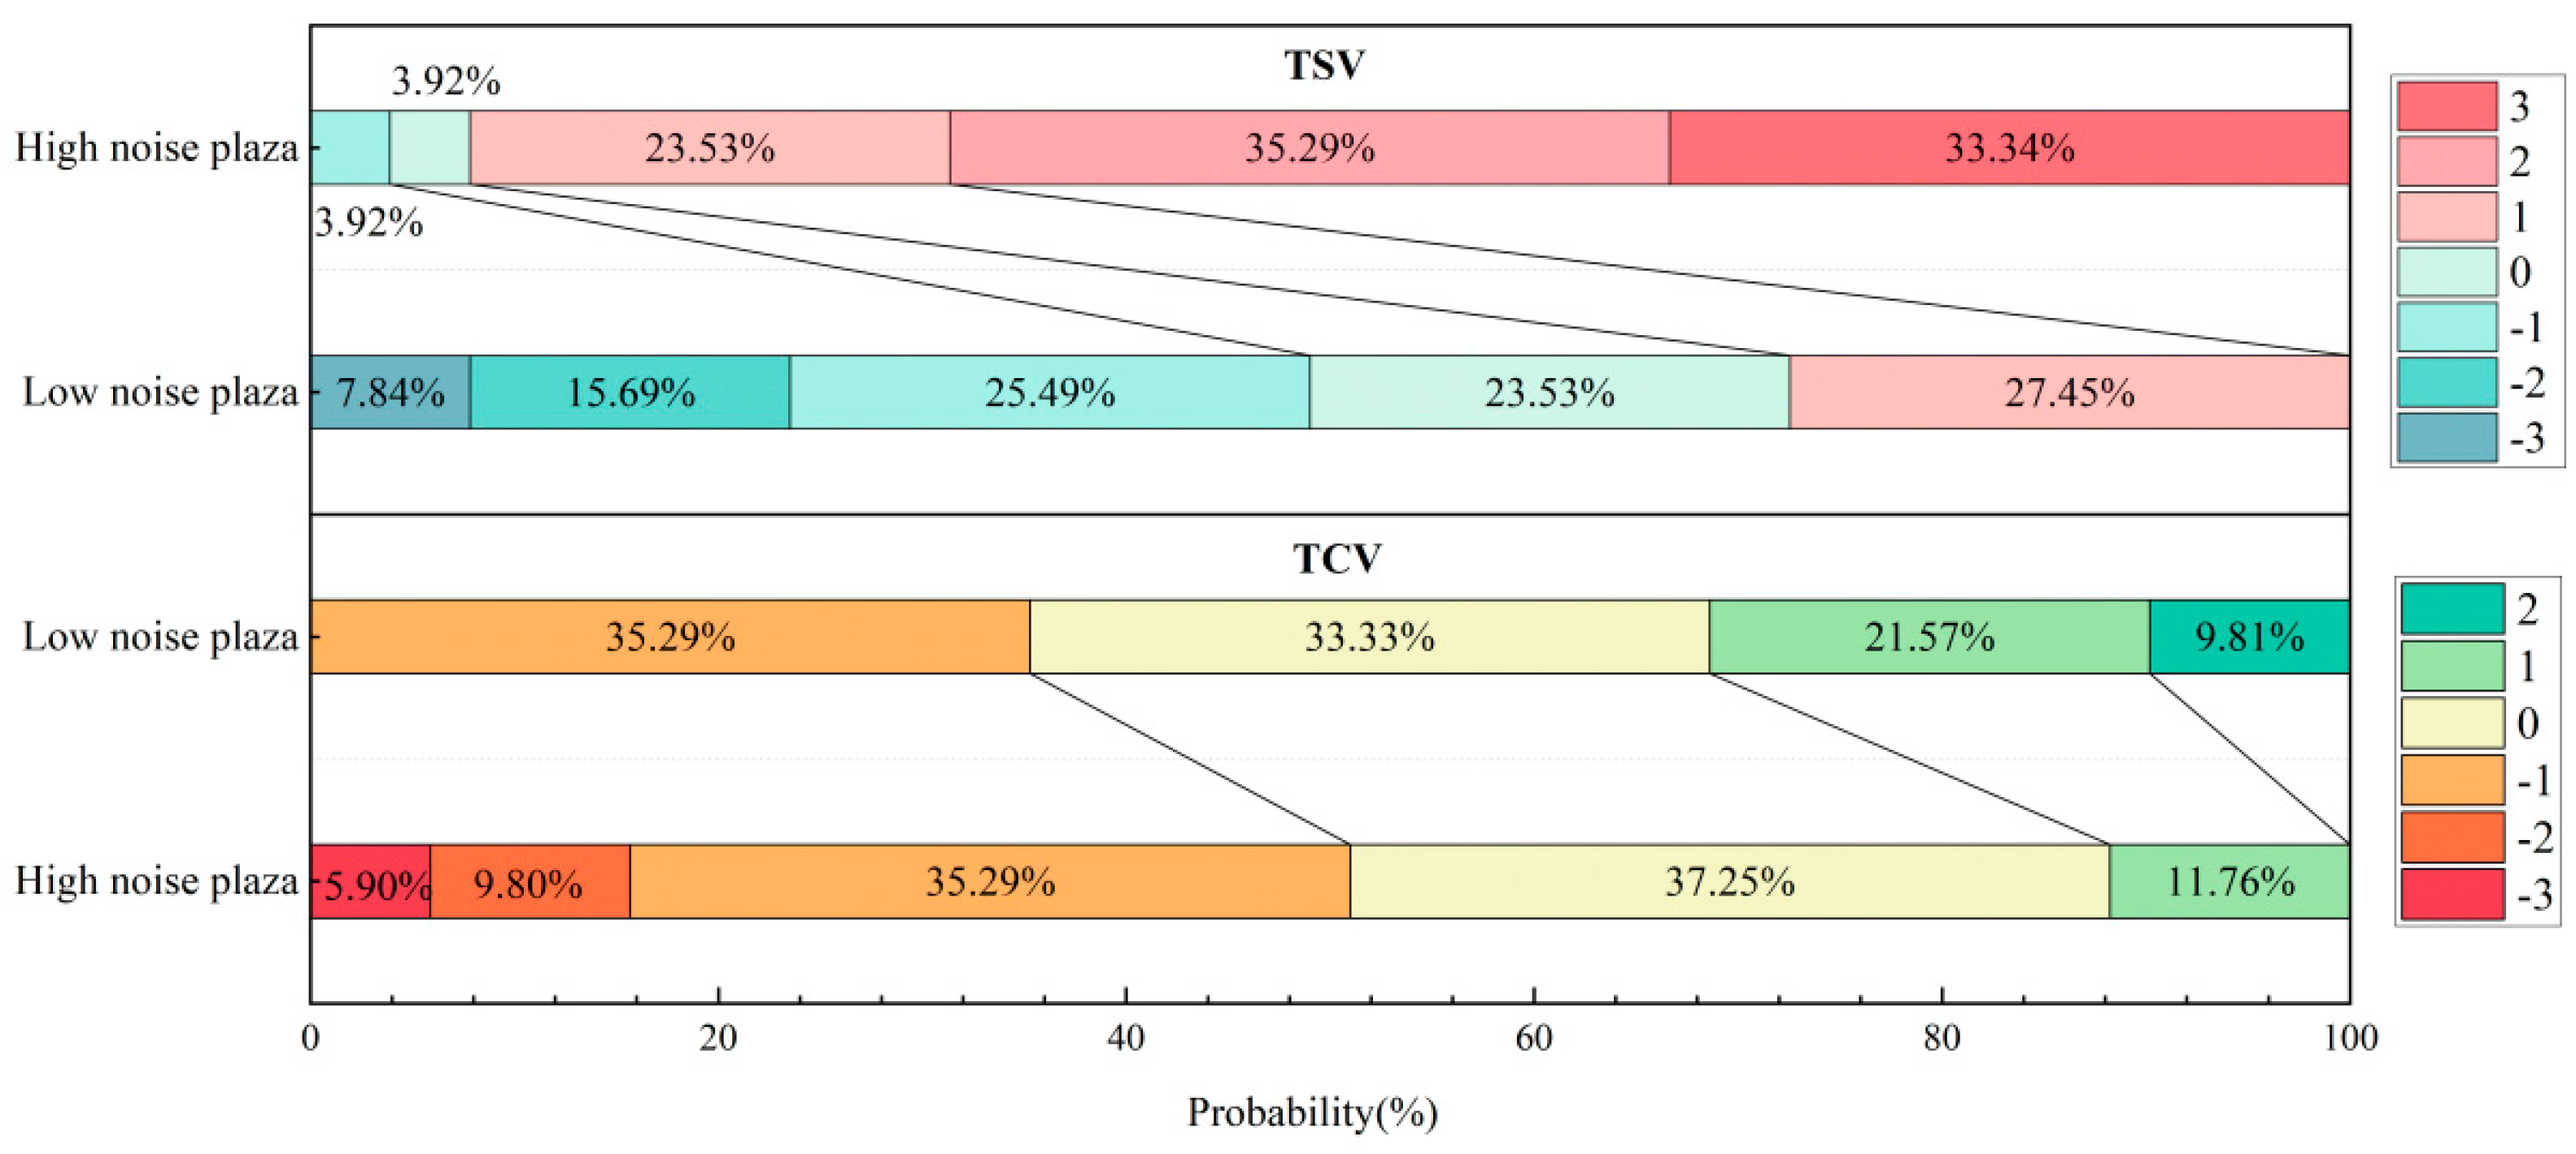
- In the temperature spectrum ranging from slightly cold to slightly warm, the preference for the LP scenario was notably higher than for the HP scenario, particularly with a 12% greater preference for neutral thermal sensation under LP conditions. Relative to LP, the HP scenario resulted in a higher frequency of reported warm sensations, with 35.29% of responses indicating a feeling of being hot—11.76% higher than under LP conditions. The proportion of respondents feeling very hot under HP conditions was 33.33%, 5.88% more than those under LP conditions.
- (2)
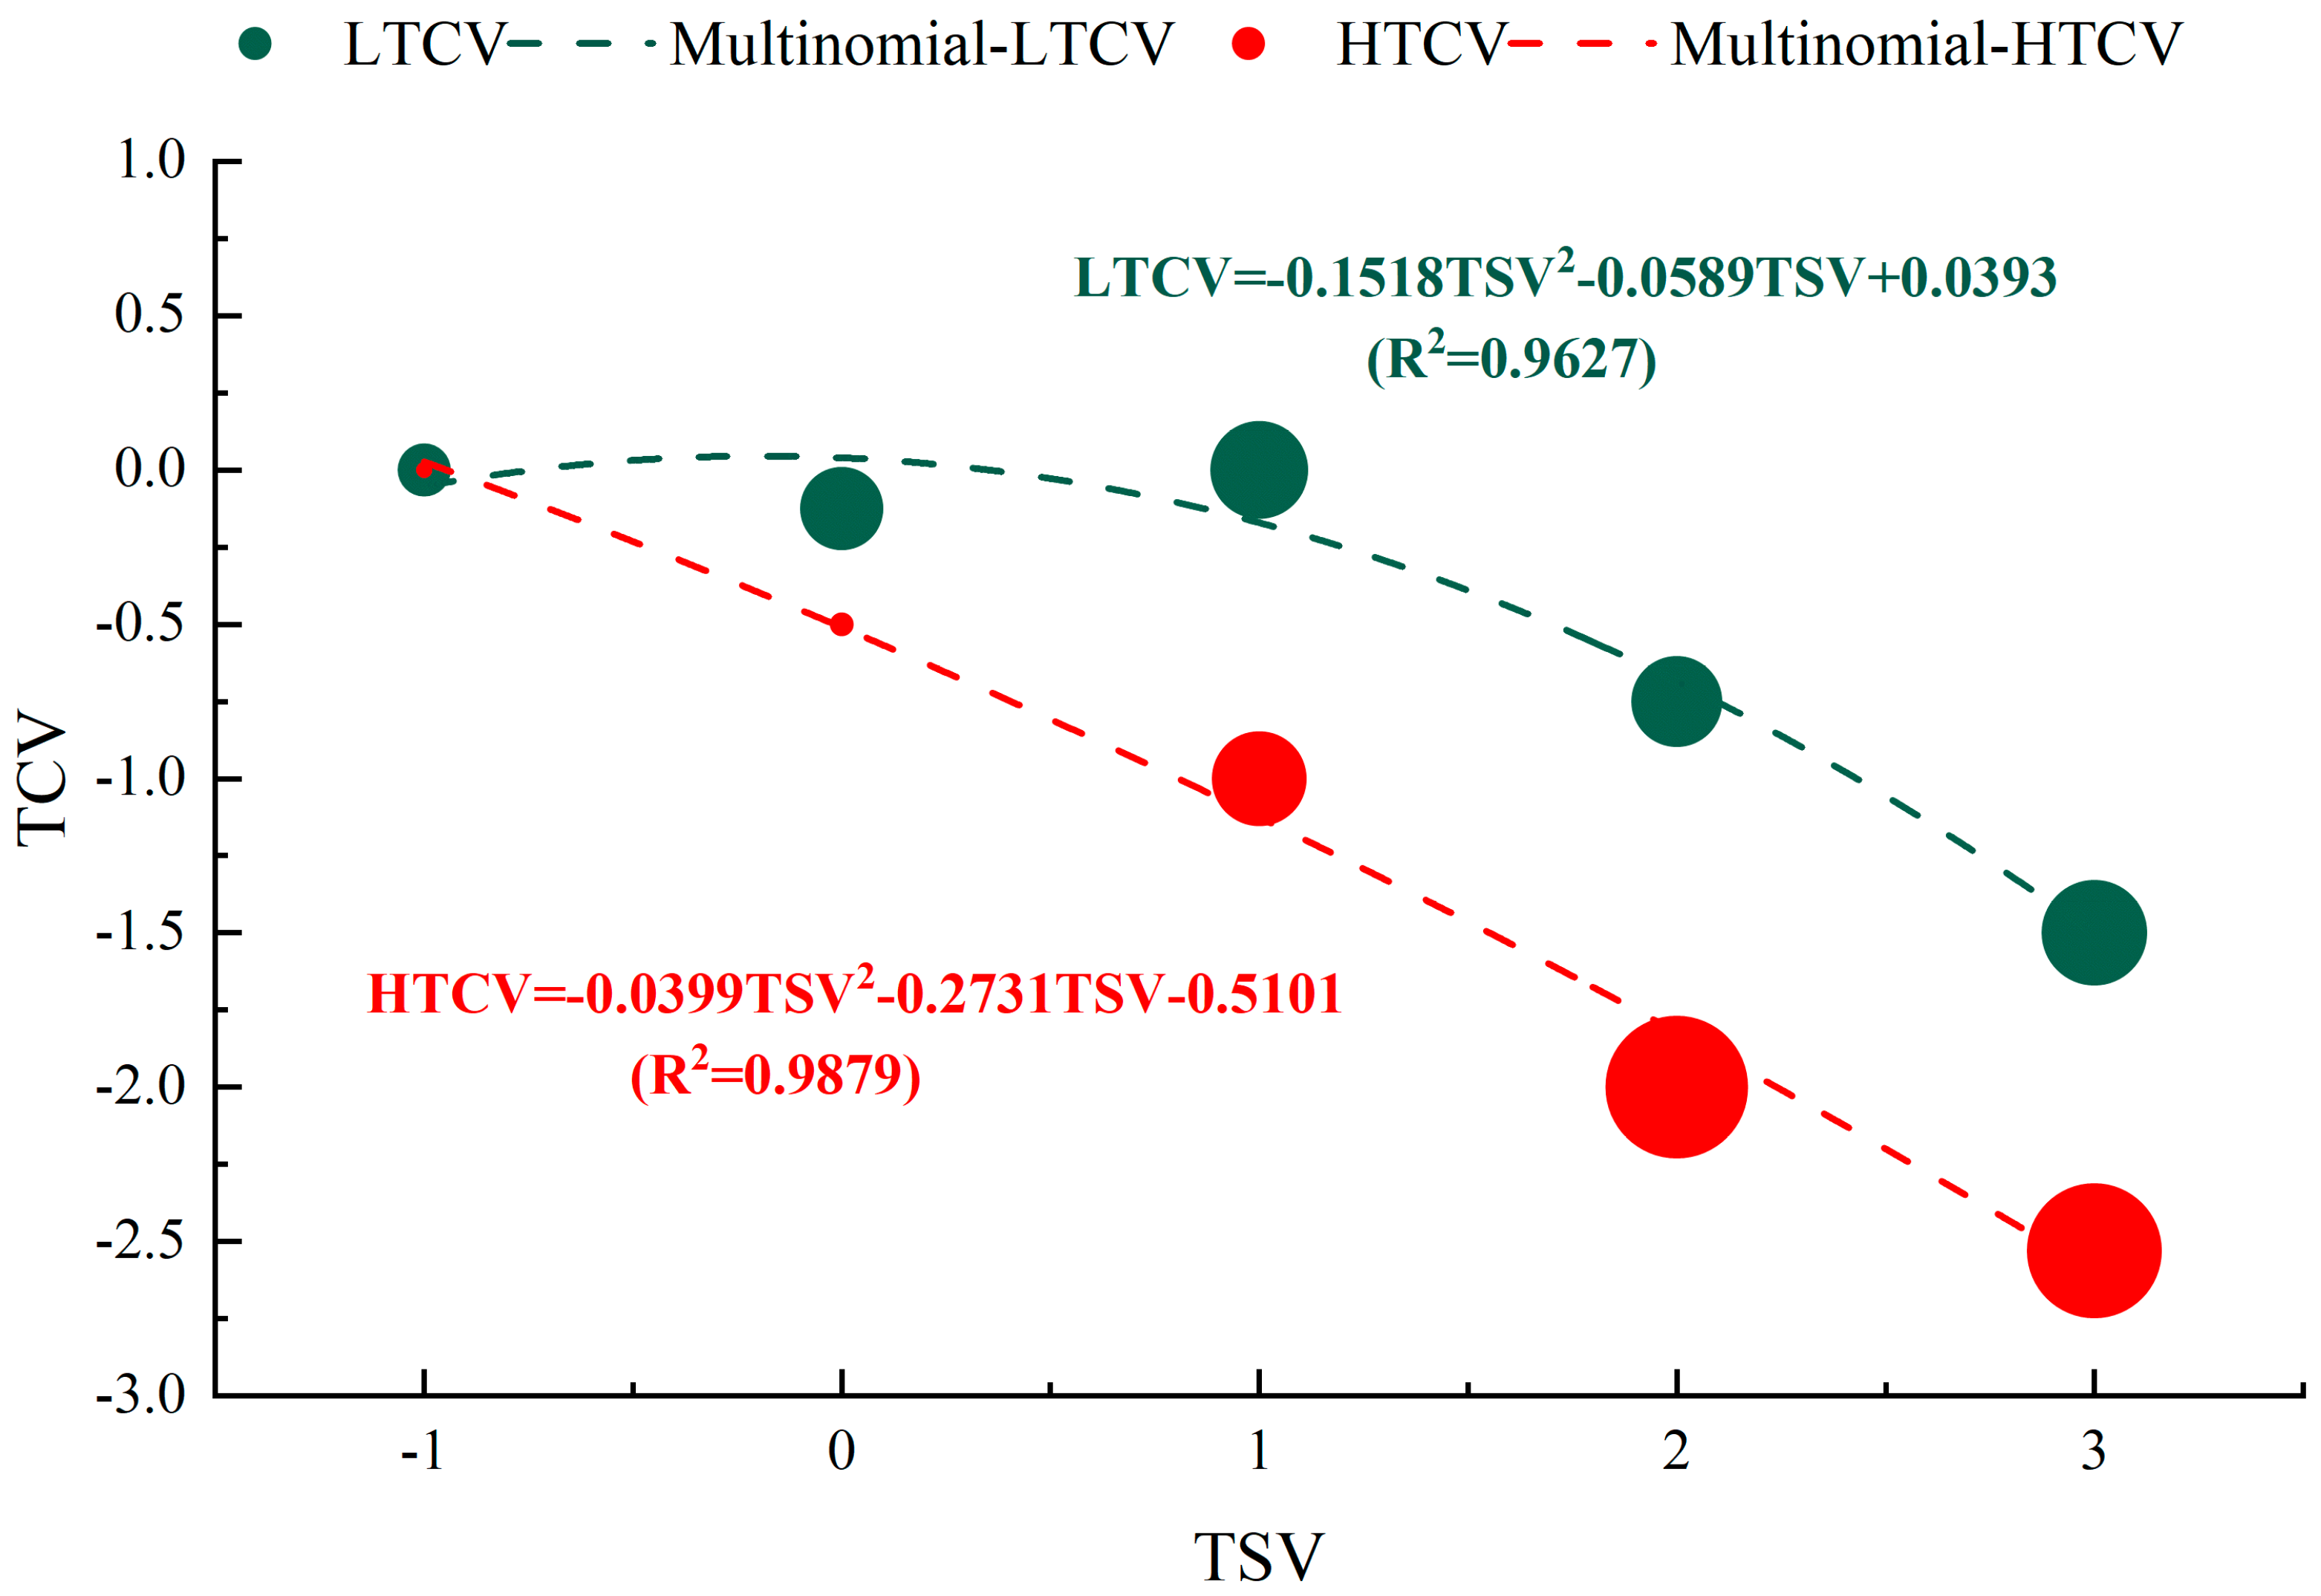
- TCV for HP ranged from −3 to 0, with the bulk, 90%, concentrated at a TCV of −2, of which 35.29% accounted for a TCV of −3. In contrast, the TCV distribution for LP spanned from −3 to 1, predominantly at 0, representing 37.25% of the votes. Unlike HP, LP conditions were perceived as slightly comfortable by 11.76% of participants, underscoring that high-decibel noise exacerbates thermal discomfort perceptions.
- (3)
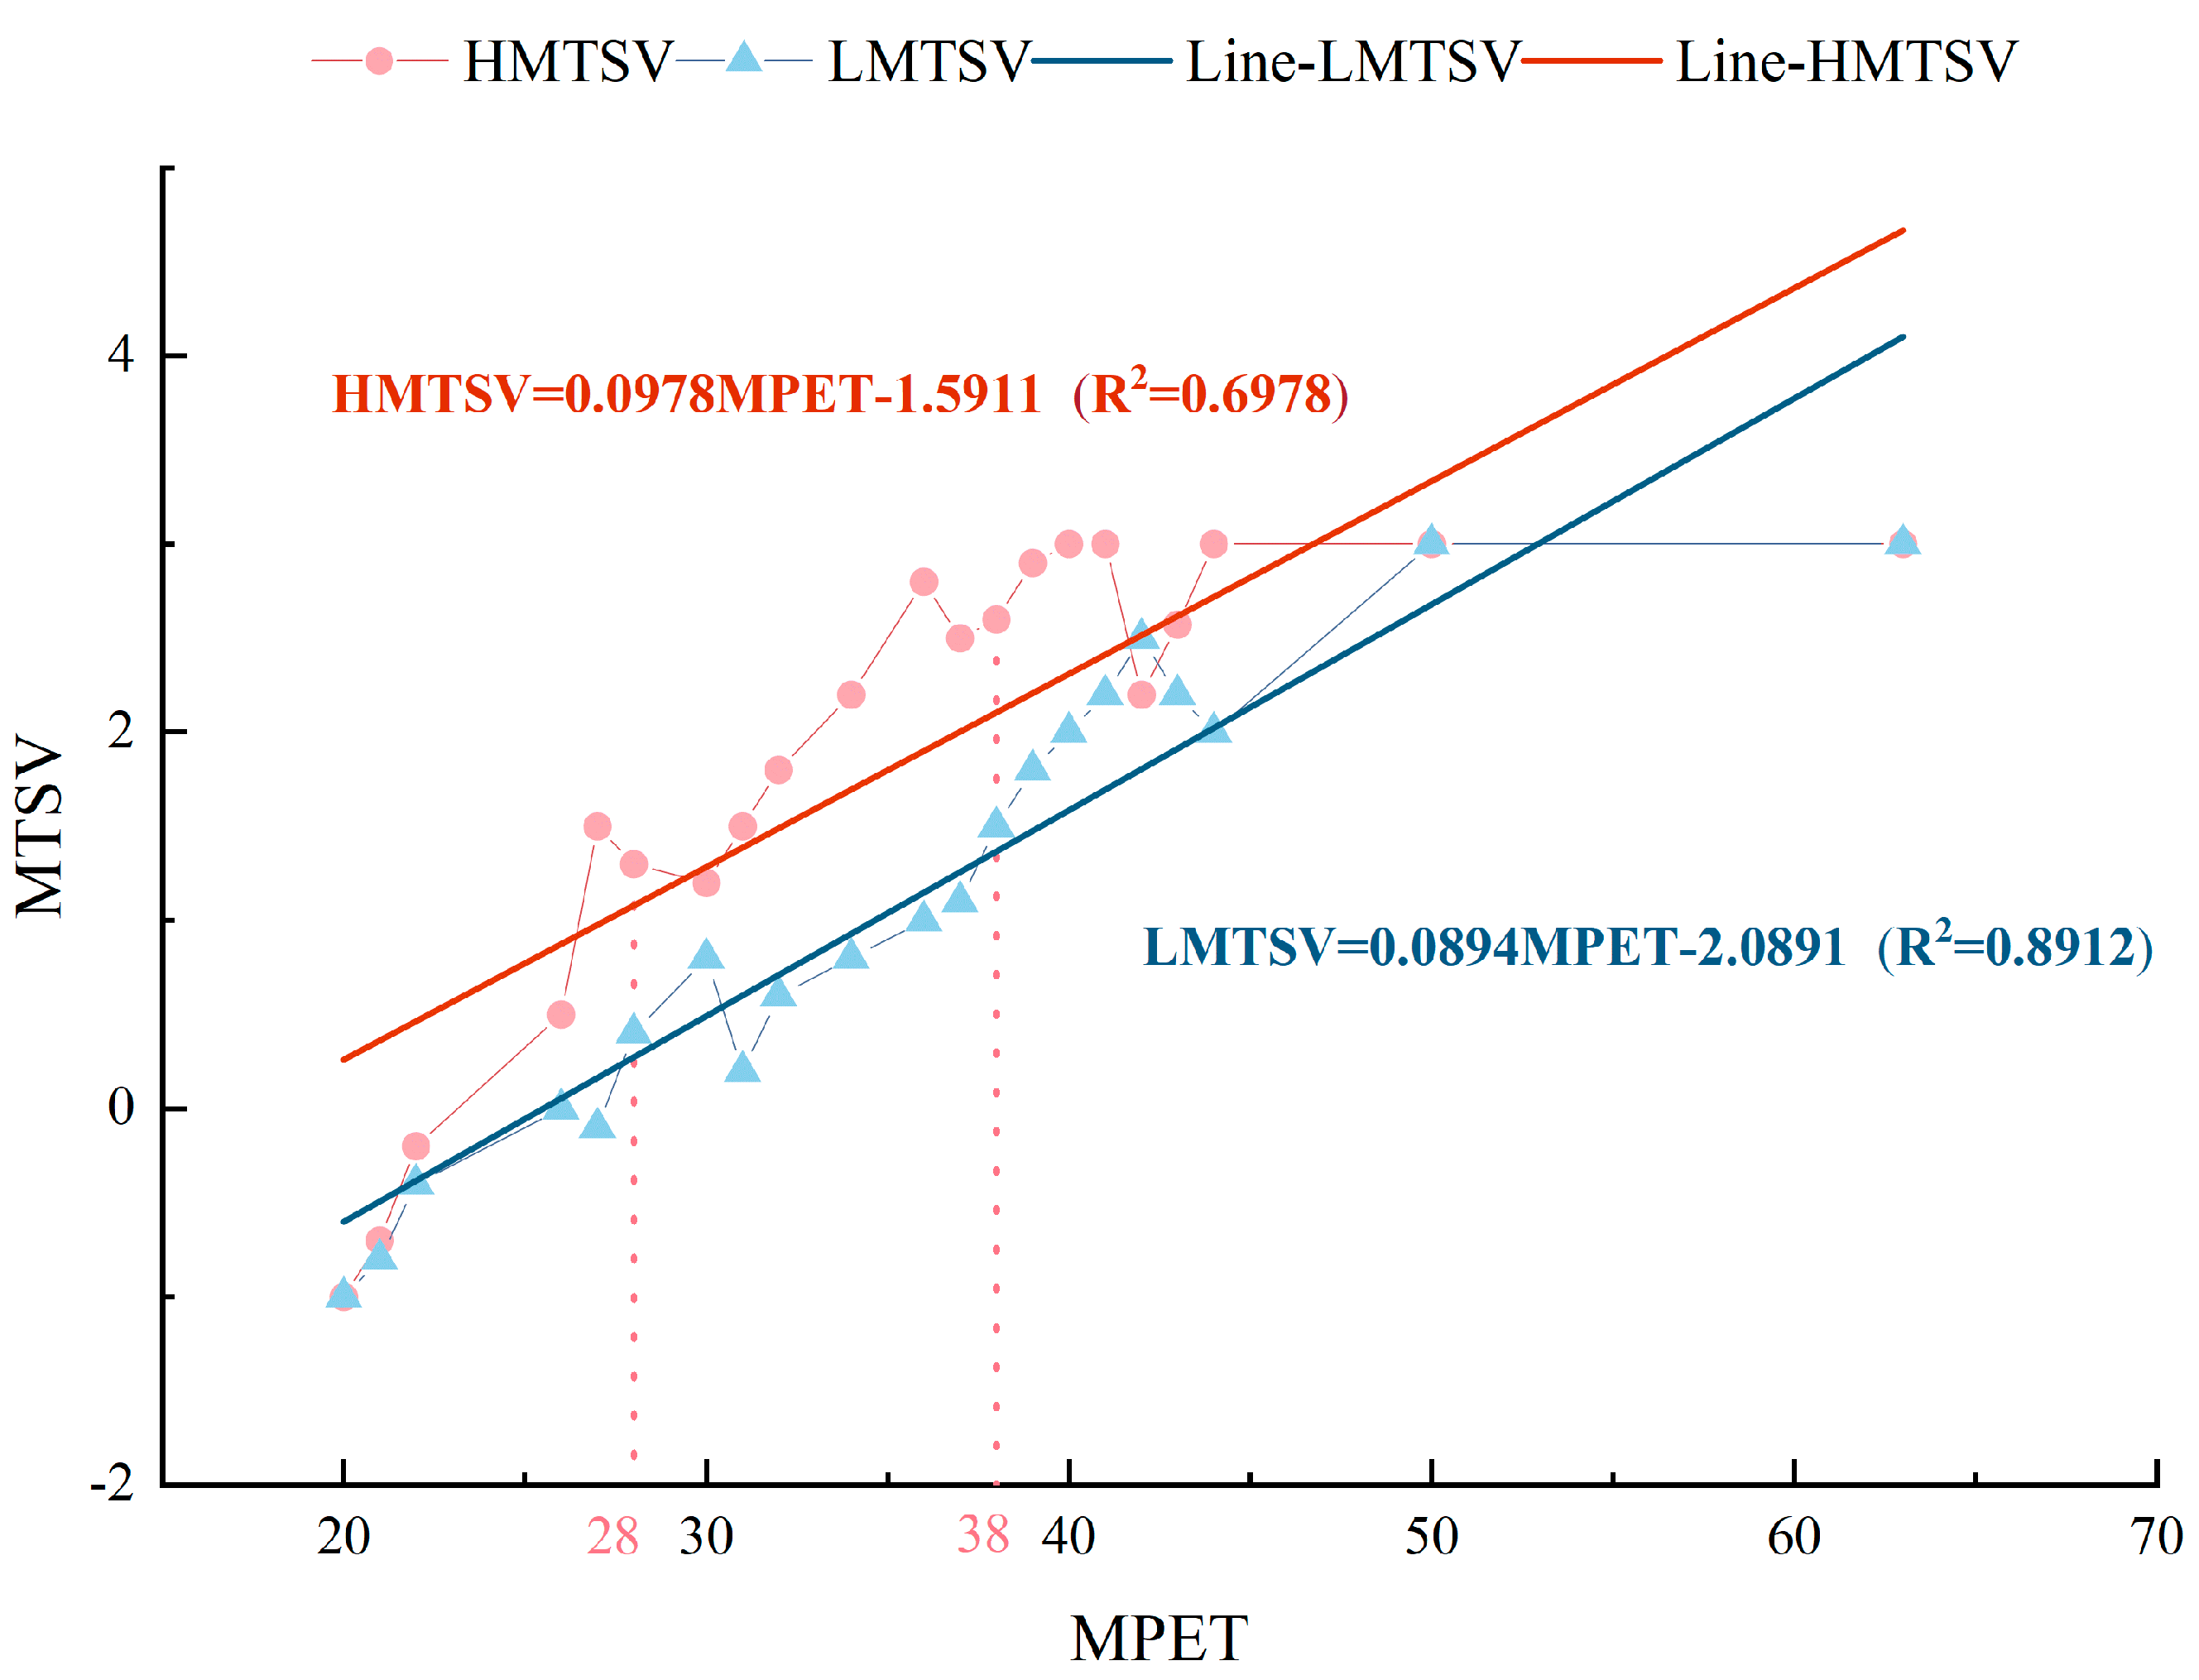
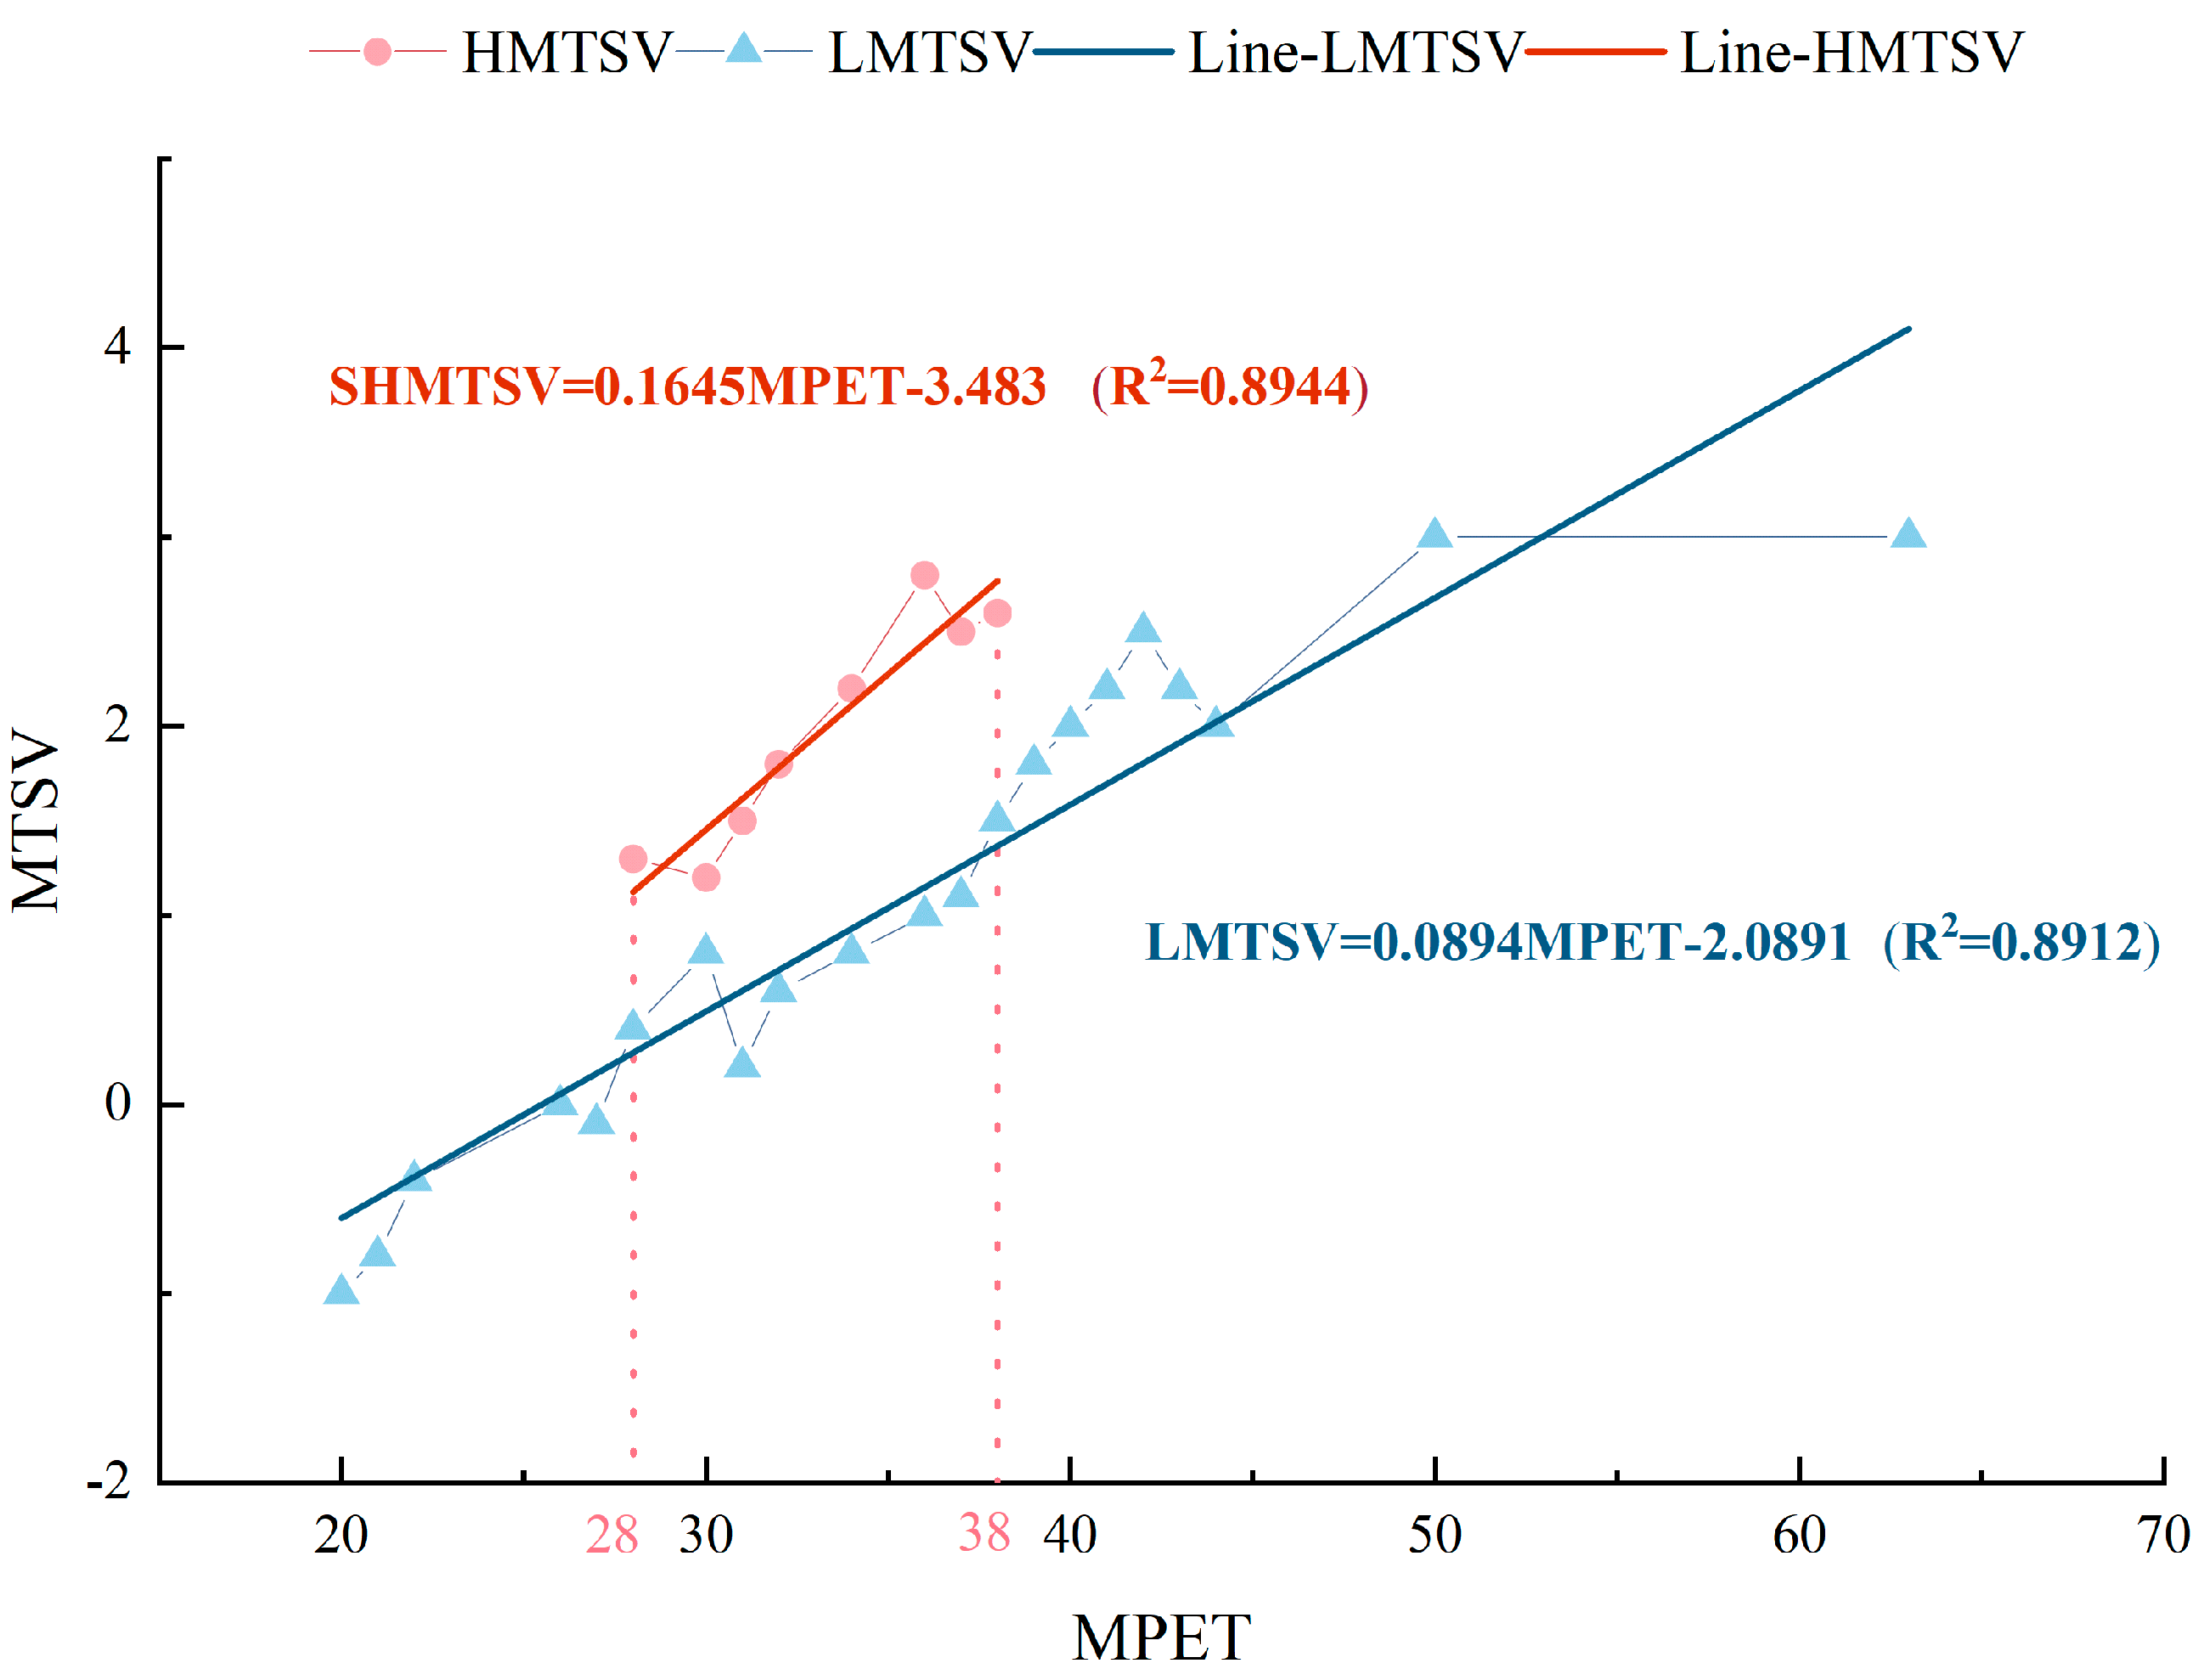
- Investigating the effects of acoustic environments on thermal comfort, it was determined that the MPET associated with high noise levels spans from 28 °C to 38 °C. The NPET in such conditions is calculated to be 21.2 °C, with an NPETR defined between 18.1 °C and 24.2 °C. Conversely, under low-noise conditions, the NPET adjusts to 23.4 °C, with the corresponding NPETR broadening from 17.8 °C to 29.0 °C. These findings underscore the influence of high-decibel noise in heightening the perception of heat, though this effect notably diminishes outside the specified temperature range, indicating a lessened impact of noise on thermal sensations at extreme temperatures.
- (4)
- Acoustic buffer zones: Campus planners should implement 15–20 m vegetative buffer zones between high-noise areas (construction sites and traffic routes) and outdoor gathering spaces. Our findings indicate that this could extend the thermal comfort range by up to 5 °C in affected areas.
- (5)
- Temporal construction policies: University administrations should establish policies restricting high-noise construction activities (>80 dB) to times when outdoor temperatures fall within 18–24 °C, the narrowed comfort range identified in our study, or provide alternative outdoor spaces for affected campus users.
Author Contributions
Funding
Institutional Review Board Statement
Informed Consent Statement
Data Availability Statement
Conflicts of Interest
Nomenclature
| Unit | ||
| HP | High-noise plaza | / |
| LP | Low-noise plaza | / |
| TCV | Thermal comfort vote | / |
| TSV | Thermal sensation vote | / |
| MTSV | Mean thermal sensation vote | / |
| LMTSV | Low-noise plaza MTSV | / |
| HMTSV | High-noise plaza MTSV | / |
| SHMTSV | Segmented HMTSV | / |
| PET | Physiologically equivalent temperature | °C |
| NPET | Neutral PET | °C |
| NPETR | Neutral PET range | °C |
| TA | Air temperature | °C |
| RH | Relative humidity | % |
| Va | Wind speed | m/s |
| G | Global radiation | W/m2 |
| DB | Decibel | dB |
References
- Pantavou, K.; Theoharatos, G.; Mavrakis, A.; Santamouris, M. Evaluating thermal comfort conditions and health responses during an extremely hot summer in Athens. Build. Environ. 2011, 46, 339–344. [Google Scholar] [CrossRef]
- Zhou, X.; Liu, Y.; Luo, M.; Zheng, S.; Yang, R.; Zhang, X. Overall and thermal comfort under different temperature, noise, and vibration exposures. Indoor Air 2022, 32, e12915. [Google Scholar] [CrossRef] [PubMed]
- Tang, T.; Zhang, Y.; Zheng, Z.; Zhou, X.; Fang, Z.; Liu, W. Detailed thermal indicators analysis based on outdoor thermal comfort indices in construction sites in South China. Build. Environ. 2021, 205, 108191. [Google Scholar] [CrossRef]
- Jin, Y.; Jin, H.; Kang, J. Effects of sound types and sound levels on subjective environmental evaluations in different seasons. Build. Environ. 2020, 183, 107215. [Google Scholar] [CrossRef]
- Mohammadzadeh, N.; Mohammadzadeh, R. The assessment of soundscape quality in historic urban parks: A case study of El-Goli Park of Tabriz, Iran. Noise Vib. Worldw. 2023, 54, 248–260. [Google Scholar] [CrossRef]
- Tsai, K.T.; Lin, Y.H. Identification of urban park activity intensity at different thermal environments and visible sky by using sound levels. Int. J. Biometeorol. 2018, 62, 1987–1994. [Google Scholar] [CrossRef]
- Lau, K.K.L.; Choi, C.Y. The influence of perceived aesthetic and acoustic quality on outdoor thermal comfort in urban environment. Build. Environ. 2021, 206, 108333. [Google Scholar] [CrossRef]
- Yin, Y.; Zhang, D.; Zhen, M.; Jing, W.; Luo, W.; Feng, W. Combined effects of the thermal-acoustic environment on subjective evaluations in outdoor public spaces. Sustain. Cities Soc. 2022, 77, 103522. [Google Scholar] [CrossRef]
- Fanger, P.O.; Breum, N.O.; Jerking, E. Can colour and noise influence man’s thermal comfort? Ergonomics 1977, 20, 11–18. [Google Scholar] [CrossRef]
- Guan, H.; Hu, S.; Lu, M.; He, M.; Mao, Z.; Liu, G. People’s subjective and physiological responses to the combined thermal-acoustic environments. Build. Environ. 2020, 172, 106709. [Google Scholar] [CrossRef]
- Yang, W.; Moon, H.J. Cross-modal effects of noise and thermal conditions on indoor environmental perception and speech recognition. Appl. Acoust. 2018, 141, 1–8. [Google Scholar]
- Yang, W.; Moon, H.J.; Kim, M.J. Combined effects of short-term noise exposure and hygrothermal conditions on indoor environmental perceptions. Indoor Built Environ. 2018, 27, 1119–1133. [Google Scholar]
- Pellerin, N.; Candas, V. Combined effects of temperature and noise on human discomfort. Physiol. Behav. 2003, 78, 99–106. [Google Scholar] [CrossRef] [PubMed]
- Pellerin, N.; Candas, V. Effects of steady-state noise and temperature conditions on environmental perception and acceptability. Indoor Air 2004, 14, 129–136. [Google Scholar]
- Wu, H.; Sun, X.; Wu, Y. Investigation of the relationships between thermal, acoustic, illuminous environments and human perceptions. J. Build. Eng. 2020, 32, 101839. [Google Scholar]
- Hwang, J.; Jeong, J.; Lee, M.; Jeong, J.; Lee, J. Establishment of outdoor thermal comfort index groups for quantifying climate impact on construction accidents. Sustain. Cities Soc. 2023, 91, 104431. [Google Scholar]
- Kumar, S.; Mathur, A.; Singh, M.K.; Rana, K.B. Adaptive thermal comfort study of workers in a mini-industrial unit during summer and winter season in a tropical country, India. Build. Environ. 2021, 197, 107874. [Google Scholar] [CrossRef]
- Buratti, C.; Belloni, E.; Merli, F.; Ricciardi, P. A new index combining thermal, acoustic, and visual comfort of moderate environments in temperate climates. Build. Environ. 2018, 139, 27–37. [Google Scholar]
- Zhou, Z.; Dong, L. Experimental investigation of the effect of surgical masks on outdoor thermal comfort in Xiamen, China. Build. Environ. 2023, 229, 109893. [Google Scholar] [CrossRef]
- Çınar, İ.; Özşen, H. Investigation of climatic conditions in underground coal mining. Min. Metall. Explor. 2020, 37, 753–760. [Google Scholar]
- Shooshtarian, S.; Lam, C.K.C.; Kenawy, I. Outdoor thermal comfort assessment: A review on thermal comfort research in Australia. Build. Environ. 2020, 177, 106917. [Google Scholar] [CrossRef]
- Kumar, P.; Sharma, A. Study on importance, procedure, and scope of outdoor thermal comfort—A review. Sustain. Cities Soc. 2020, 61, 102297. [Google Scholar] [CrossRef]
- Faul, F.; Erdfelder, E.; Buchner, A.; Lang, A.G. Statistical power analyses using G*power 3.1: Tests for correlation and regression analyses. Behav. Res. Methods 2009, 41, 1149–1160. [Google Scholar] [CrossRef] [PubMed]
- Xu, T.; Yao, R.; Du, C.; Huang, X. A method of predicting the dynamic thermal sensation under varying outdoor heat stress conditions in summer. Build.Environ. 2022, 223, 109454. [Google Scholar] [CrossRef]
- Jin, Y.; Wang, F.; Carpenter, M.; Weller, R.B.; Tabor, D.; Payne, S.R. The effect of indoor thermal and humidity condition on the oldest-old people’s comfort and skin condition in winter. Build. Environ. 2020, 174, 106790. [Google Scholar] [CrossRef]
- Höppe, P. The physiological equivalent temperature—A universal index for the biometeorological assessment of the thermal environment. Int. J. Biometeorol. 1999, 43, 71–75. [Google Scholar] [CrossRef]
- Bouyer, J.; Vinet, J.; Delpech, P.; Carré, S. Thermal comfort assessment in semi-outdoor environments: Application to comfort study in stadia. J. Wind. Eng. Ind. Aerodyn. 2007, 95, 963–976. [Google Scholar] [CrossRef]
- Matzarakis, A.; Endler, C. Climate change and thermal bioclimate in cities: Impacts and options for adaptation in Freiburg, Germany. Int. J. Biometeorol. 2010, 54, 479–483. [Google Scholar] [CrossRef]
- Matzarakis, A.; Rutz, F.; Mayer, H. Modelling radiation fluxes in simple and complex environments—Application of the RayMan model. Int. J. Biometeorol. 2007, 51, 323–334. [Google Scholar] [CrossRef]
- Du, M.; Hong, B.; Gu, C.; Li, Y.; Wang, Y. Multiple effects of visual-acoustic-thermal perceptions on the overall comfort of elderly adults in residential outdoor environments. Energy Build. 2023, 283, 112813. [Google Scholar] [CrossRef]
- Zhang, T.; Su, M.; Hong, B.; Wang, C.; Li, K. Interaction of emotional regulation and outdoor thermal perception: A pilot study in a cold region of China. Build. Environ. 2021, 198, 107870. [Google Scholar]
- Feng, W.; Jing, W.; Zhen, M.; Zhang, J.; Luo, W.; Qin, Z. The difference in thermal comfort between southern and northern Chinese living in the Xi’an cold climate region. Environ. Sci. Pollut. Res. 2023, 30, 48062–48077. [Google Scholar]
- Niu, J.; Hong, B.; Geng, Y.; Mi, J.; He, J. Summertime physiological and thermal responses among activity levels in campus outdoor spaces in a humid subtropical city. Sci. Total Environ. 2020, 728, 138757. [Google Scholar] [PubMed]
- Zhen, M.; Dong, Q.; Chen, P.; Ding, W.; Zhou, D.; Feng, W. Urban outdoor thermal comfort in western China. J. Asian Archit. Build. Eng. 2020, 20, 222–236. [Google Scholar] [CrossRef]
- Yuan, T.; Hong, B.; Qu, H.; Liu, A.; Zheng, Y. Outdoor thermal comfort in urban and rural open spaces: A comparative study in China’s cold region. Urban Clim. 2023, 49, 101501. [Google Scholar]
- He, X.; Gao, W.; Wang, R.; Yan, D. Study on outdoor thermal comfort of factory areas during winter in hot summer and cold winter zone of China. Build. Environ. 2023, 228, 109883. [Google Scholar] [CrossRef]
- An, L.; Hong, B.; Cui, X.; Geng, Y.; Ma, X. Outdoor thermal comfort during winter in China’s cold regions: A comparative study. Sci. Total Environ. 2021, 768, 144464. [Google Scholar]
- Guan, H.; Hu, S.; Liu, G.; Zhang, L. The combined effects of temperature and noise on the comfort perceptions of young people with a normal Body Mass Index. Sustain. Cities Soc. 2020, 54, 101993. [Google Scholar]
- Babisch, W. Updated exposure-response relationship between road traffic noise and coronary heart diseases: A meta-analysis. Noise Health 2014, 16, 1–9. [Google Scholar] [CrossRef]
- Münzel, T.; Schmidt, F.P.; Steven, S.; Herzog, J.; Daiber, A.; Sørensen, M. Environmental noise and the cardiovascular system. J. Am. Coll. Cardiol. 2018, 71, 688–697. [Google Scholar]
- Basner, M.; Babisch, W.; Davis, A.; Brink, M.; Clark, C.; Janssen, S.; Stansfeld, S. Auditory and non-auditory effects of noise on health. Lancet 2014, 383, 1325–1332. [Google Scholar] [CrossRef] [PubMed]
- Hancock, P.A.; Warm, J.S. A dynamic model of stress and sustained attention. Hum. Factors 1989, 31, 519–537. [Google Scholar] [CrossRef] [PubMed]
- Park, S.H.; Lee, P.J.; Jeong, J.H. Effects of noise sensitivity on psychophysiological responses to building noise. Build. Environ. 2018, 136, 302–311. [Google Scholar] [CrossRef]
- Alvarsson, J.J.; Wiens, S.; Nilsson, M.E. Stress recovery during exposure to nature sound and environmental noise. Int. J. Environ. Res. Public Health 2010, 7, 1036–1046. [Google Scholar] [CrossRef]
- Torresin, S.; Albatici, R.; Aletta, F.; Babich, F.; Oberman, T.; Kang, J. Indoor soundscape assessment: A principal components model of acoustic perception in residential buildings. Build. Environ. 2021, 182, 107152. [Google Scholar] [CrossRef]
- Frontczak, M.; Wargocki, P. Literature survey on how different factors influence human comfort in indoor environments. Build. Environ. 2011, 46, 922–937. [Google Scholar] [CrossRef]
- Oquendo-Di Cosola, V.; Olivieri, F.; Ruiz-García, L. A systematic review of the impact of green walls on urban comfort: Temperature reduction and noise attenuation. Renew. Sustain. Energy Rev. 2022, 162, 112463. [Google Scholar] [CrossRef]
- Morakinyo, T.E.; Kong, L.; Lau, K.K.L.; Yuan, C.; Ng, E. A study on the impact of shadow-cast and tree species on in-canyon and neighborhood’s thermal comfort. Build. Environ. 2017, 115, 1–17. [Google Scholar] [CrossRef]


| Gender | Age | Height (cm) | Weight (kg) | BMI | ||||||
|---|---|---|---|---|---|---|---|---|---|---|
| Min | Max | Mean | Min | Max | Mean | Min | Max | Mean | ||
| Male | 19~22 | 175 | 183 | 176 | 60 | 75 | 67.2 | 20.8 | 23.7 | 22.0 |
| Female | 19~21 | 151 | 168 | 160 | 45 | 55 | 50 | 19.1 | 23.5 | 21.3 |
| Instrument | Measuring Range | Measurement Accuracy | Work Environment |
|---|---|---|---|
| Noise detector (noise0501) | 30 db–120 db | ±0.5 db | Air temperature: −40~+60% Relative humidity: 25~90% |
| Wind speed detector (wind0501) | 0.2 m/s–10 m/s | ±0.02 m/s | −10~+50 °C |
| Black ball temperature/humidity detector | Illumination: 0~65,535 lux Humidity: −40~+125 °C Black ball: −10~+85 °C | Humidity: ±0.3 °C, ±2% RH Black ball: ±0.5 °C | / |
| Bolometer (JT2020) | Global radiation: 0~2 KW/m2 | ±5% W/m2 | / |
| Location | Meteorological Data | Max | Min | Mean | SD |
|---|---|---|---|---|---|
| HP | TA | 45.8 | 17 | 29.17 | 6.722 |
| RH | 79 | 30 | 54.286 | 10.762 | |
| Va | 1.056 | 0 | 0.371 | 0.321 | |
| G | 789 | 98 | 381.157 | 194.892 | |
| DB | 112.5 | 82.5 | 89.308 | 4.364 | |
| LP | TA | 45.8 | 17 | 28.884 | 6.554 |
| RH | 30 | 1 | 15.49 | 9.458 | |
| Va | 1.056 | 0 | 0.386 | 0.319 | |
| G | 789 | 98 | 377.667 | 200.599 | |
| DB | 54.5 | 45.5 | 50.551 | 2.561 |
| MPET | MTSV | HMTSV | LMTSV | |
|---|---|---|---|---|
| MPET | 1 (0.000 ***) | 0.884 (0.000 ***) | 0.86 (0.000 ***) | 0.876 (0.000 ***) |
| MTSV | 0.884 (0.000 ***) | 1 (0.000 ***) | 0.958 (0.000 ***) | 0.988 (0.000 ***) |
| HMTSV | 0.86 (0.000 ***) | 0.958 (0.000 ***) | 1 (0.000 ***) | 0.913 (0.000 ***) |
| LMTSV | 0.876 (0.000 ***) | 0.988 (0.000 ***) | 0.913 (0.000 ***) | 1 (0.000 ***) |
| Location | NPET | NPETR | |
|---|---|---|---|
| HP | Full range | 16.3 °C | 11.2~21.4 °C |
| Segment range | 21.2 °C | 18.1~24.2 °C | |
| LP | 23.4 °C | 17.8~29.0 °C | |
| Fitting Formula | Neutral Temperature | Thermal Acceptability Range | Climate Zone | Reference |
|---|---|---|---|---|
| 21.2 °C | 18.1~24.2 °C | Cold climate region | This research | |
| 23.4 °C | 17.8~29.0 °C | |||
| 23.8 °C | 17.6~29.9 °C | [31] | ||
| 22.1 °C | 15.9~28.4 °C | [32] | ||
| 26.1 °C | 19.8~32.1 °C | [33] | ||
| 17.4 °C | 10.0~24.7 °C | [34] | ||
| 22.3 °C | 16.6~28.0 °C | [35] | ||
| 27.3 °C | 20.4~34.3 °C |
Disclaimer/Publisher’s Note: The statements, opinions and data contained in all publications are solely those of the individual author(s) and contributor(s) and not of MDPI and/or the editor(s). MDPI and/or the editor(s) disclaim responsibility for any injury to people or property resulting from any ideas, methods, instructions or products referred to in the content. |
© 2025 by the authors. Licensee MDPI, Basel, Switzerland. This article is an open access article distributed under the terms and conditions of the Creative Commons Attribution (CC BY) license (https://creativecommons.org/licenses/by/4.0/).
Share and Cite
Ning, S.; Jing, W.; Ge, Z.; Qin, Z. Assessing the Impact of Ambient Noise on Outdoor Thermal Comfort on University Campuses: A Pilot Study in China’s Cold Region. Atmosphere 2025, 16, 410. https://doi.org/10.3390/atmos16040410
Ning S, Jing W, Ge Z, Qin Z. Assessing the Impact of Ambient Noise on Outdoor Thermal Comfort on University Campuses: A Pilot Study in China’s Cold Region. Atmosphere. 2025; 16(4):410. https://doi.org/10.3390/atmos16040410
Chicago/Turabian StyleNing, Shaobo, Wenqiang Jing, Zhemin Ge, and Zeming Qin. 2025. "Assessing the Impact of Ambient Noise on Outdoor Thermal Comfort on University Campuses: A Pilot Study in China’s Cold Region" Atmosphere 16, no. 4: 410. https://doi.org/10.3390/atmos16040410
APA StyleNing, S., Jing, W., Ge, Z., & Qin, Z. (2025). Assessing the Impact of Ambient Noise on Outdoor Thermal Comfort on University Campuses: A Pilot Study in China’s Cold Region. Atmosphere, 16(4), 410. https://doi.org/10.3390/atmos16040410