Article

Spatiotemporal Evolution of Regional Air Pollution Exposure and Health Effects Assessment in Jiangsu Province, China

1
School of Architecture, Nanjing Tech University, Nanjing 211816, China
2
Jiangsu Provincial Planning and Design Group, Nanjing 210036, China
3
College of Construction Engineering, Jiangsu Open University, Nanjing 210019, China
*
Author to whom correspondence should be addressed.
Atmosphere 2025, 16(4), 446; https://doi.org/10.3390/atmos16040446
Submission received: 7 March 2025 / Revised: 6 April 2025 / Accepted: 9 April 2025 / Published: 11 April 2025
(This article belongs to the Special Issue Air Pollution in China (3rd Edition))

Abstract

:
China’s industrialization and urbanization processes have recently accelerated, leading to the rapid expansion of urban built-up areas. Fossil fuels, such as natural gas, oil, and coal, are consumed in large quantities, resulting in the accumulation of atmospheric pollutants. Severe PM2.5 and O3 pollution poses significant human health risks, including respiratory diseases, cardiovascular and cerebrovascular diseases, and lung cancer. This study utilized data from various observation stations in Jiangsu Province, the annual statistical yearbook data, and statistical data, such as baseline mortality and socioeconomic indicators, to quantitatively analyze the concentration characteristics of PM2.5 and O3, premature deaths related to pollutant exposure, and negative health effects in Jiangsu Province from 2018 to 2023. The study examined the spatiotemporal evolution patterns of pollutant concentrations, related premature deaths, and negative health effects in various cities within Jiangsu Province under policy-driven conditions. The results show that (1) the annual average concentration of PM2.5 in Jiangsu Province decreased from 105.88 μg/m3 in 2018 to 55.04 μg/m3 in 2023, marking a reduction of 48.01%. (2) The total number of premature deaths due to long-term exposure to PM2.5 decreased by approximately 87%, whereas the total number of premature deaths due to long-term exposure to O3 increased by approximately 216%. (3) City level (2.377**) and population structure (1.068**) play an important role in the health effects of air pollution. (4) Short-term exposure to high concentrations of pollutants has a significant negative impact on the health of individuals with underlying diseases.

1. Introduction

In recent years, the problem of air pollution, which has a significant impact on human health, has become increasingly severe and has attracted widespread attention from society [1]. Atmospheric fine particulate matter (PM2.5) is a type of inhalable particulate matter with an aerodynamic equivalent diameter of less than or equal to 2.5 μm, also known as fine particulate matter or particulate matter which can enter the lungs [2,3]. Tropospheric O3 is a secondary pollutant generated by complex photochemical reactions of precursors such as nitrogen oxides (NOx), volatile organic compounds (VOCs), and carbon monoxide (CO) under sunlight. Some studies suggest that severe PM2.5 and O3 pollution can cause serious human health risks, such as respiratory diseases, cardiovascular and cerebrovascular diseases, and lung cancer [3,4]. The chemical composition of PM2.5 is complex and diverse, including inorganic ions such as elemental carbon (EC), organic carbon (OC), SO42−, NO3, O3, and NH4+, as well as crustal elements, such as Al, Si, Ca, Fe, and Ti [4]. PM2.5 originates from a wide range of sources, which can be classified into primary and secondary emissions. Among these, primary emissions refer to the fine particulate matter directly emitted from a pollution source, which undergoes complex physical transport, dry or wet deposition, aerosol growth, and collision processes in the atmosphere but does not undergo significant chemical reactions [5]. Secondary generation of PM2.5 occurs through the chemical conversion of precursors, such as SO2, NOX, NH3, and VOCs, emitted into the atmosphere [5]. To better control air pollution, the Jiangsu Provincial Government released the “Air Pollution Prevention and Control Action Plan” (APPCAP) in 2020 [5]. Since the implementation of this plan, a series of strict pollution control measures have been enforced across the country, such as optimizing the industrial structure, increasing the proportion of clean energy, and imposing restrictions on heavy-polluting vehicles [6]. The overall air quality in the country has significantly improved, and the PM2.5 concentration in the region has been effectively controlled. At the same time, the tropospheric O3 concentration index continues to rise, with an average annual increase of 1–3 parts per billion (ppb) [7,8]. Parts per billion (ppb) represents the amount of a substance contained in every billion units [8]. O3 Research shows that the spatial extent of O3 pollution is constantly expanding, and there is a trend toward earlier pollution months in the time series. In some areas, O3 pollution occurs in the spring [8].
When an individual is exposed to air pollutants at concentrations exceeding a certain threshold, specific biological reactions may occur, potentially leading to accidental death, also known as premature death [8]. There is a correlation between the dosages (i.e., concentration) of pollutants, the duration of exposure, and the resulting physiological reactions—this is known as the “exposure–response” relationship [9]. Based on the duration of exposure and its impact on population health, the effects of pollutants on human health are categorized as short-term acute or long-term chronic effects [10]. Generally, health effects that arise from exposure measured in hours or days are considered short-term effects, whereas those resulting from exposure over months or years are classified as long-term effects [11]. Long-term chronic effects reflect the negative health consequences of prolonged exposure to polluted environments, while short-term acute effects highlight the impact of brief periods of heavy pollution, particularly on individuals with underlying health conditions [12]. According to reports from global disease burden research institutions, PM2.5 and O3 are generally considered core indicators for quantifying the impact of air pollution on human health [13]. The negative health effects of air pollution exposure in a community are closely related to factors such as population density and age. Additionally, China is rapidly entering a stage of deep population aging, which may exacerbate the disease burden caused by exposure to air pollutants [14]. Currently, the common method for studying the “exposure–response” relationship between PM2.5 and O3 in academia is to quantify the relationship between population health status and air pollutant concentration through epidemiological surveys. Indicators are used to measure the corresponding relationship between changes in unit pollutant concentration and population health risks [15]. In addition, numerous studies have examined the relative risk of exposure to PM2.5, involving a wide range of time series and spatial scales [16]. The results of these epidemiological studies show high variability. Researchers have collected multiple relevant studies from databases and applied meta-analysis methods to combine the results of various studies on PM2.5 [17]. The results showed that for every 10 μg/m3 increase in daily PM2.5 concentration, the overall non-accidental mortality rate increased by 0.40%, the respiratory disease mortality rate increased by 0.75%, and the cardiovascular disease mortality rate increased by 0.63% [18].
Long-term exposure to PM2.5 and O3 pollution can cause inflammation in the cardiovascular and respiratory systems as well as stress responses in the body’s oxidative system, which also adversely affects human cardiovascular and pulmonary function [19,20]. Extensive domestic and international research has reported on the health burden caused by environmental exposure to PM2.5, with related premature deaths ranging from 960,000 to 1.52 million people [21]. In contrast, there is relatively little international research on the health risks of O3 exposure [22]; however, owing to the increasing concentration of O3 each year, the health risks associated with O3 exposure have garnered more attention [23]. Most studies assessing health burdens have focused on long-term chronic effects. However, in recent years, studies have shown that the health risks associated with short-term exposure to air pollutants cannot be ignored [24].
Previous studies have mainly focused on the health risks caused by PM2.5 [21], with less attention being paid to the health risks associated with O3 pollution. Specifically, it remains unclear whether the positive health effects brought about by a decrease in PM2.5 could potentially offset the negative health effects caused by an increase in O3 pollution. There are several short- and long-term air pollution control measures for PM2.5 and O3. Currently, there is a lack of quantitative research on the formation mechanisms of these issues. Existing research on the negative health effects of pollutant exposure is primarily based on the calculation of observed or simulated baseline pollutant concentrations. Some studies have refined the sources of pollutants, but the relationship between PM2.5, O3 concentrations, their health exposure burden, and the response of pollutants to reduction efforts requires further exploration [9]. This study explores the positive effects of the sharp decline in PM2.5 concentration on residents’ health in Jiangsu Province, China, in recent years, as well as the negative health impacts brought about by the increase in O3 concentration. By constructing a quantitative evaluation index system based on air pollution, the urban environment, and health benefits, we have proposed a mechanism that controls the regional air pollution environment and evaluated its impact on residents’ health effects.

2. Materials and Methods
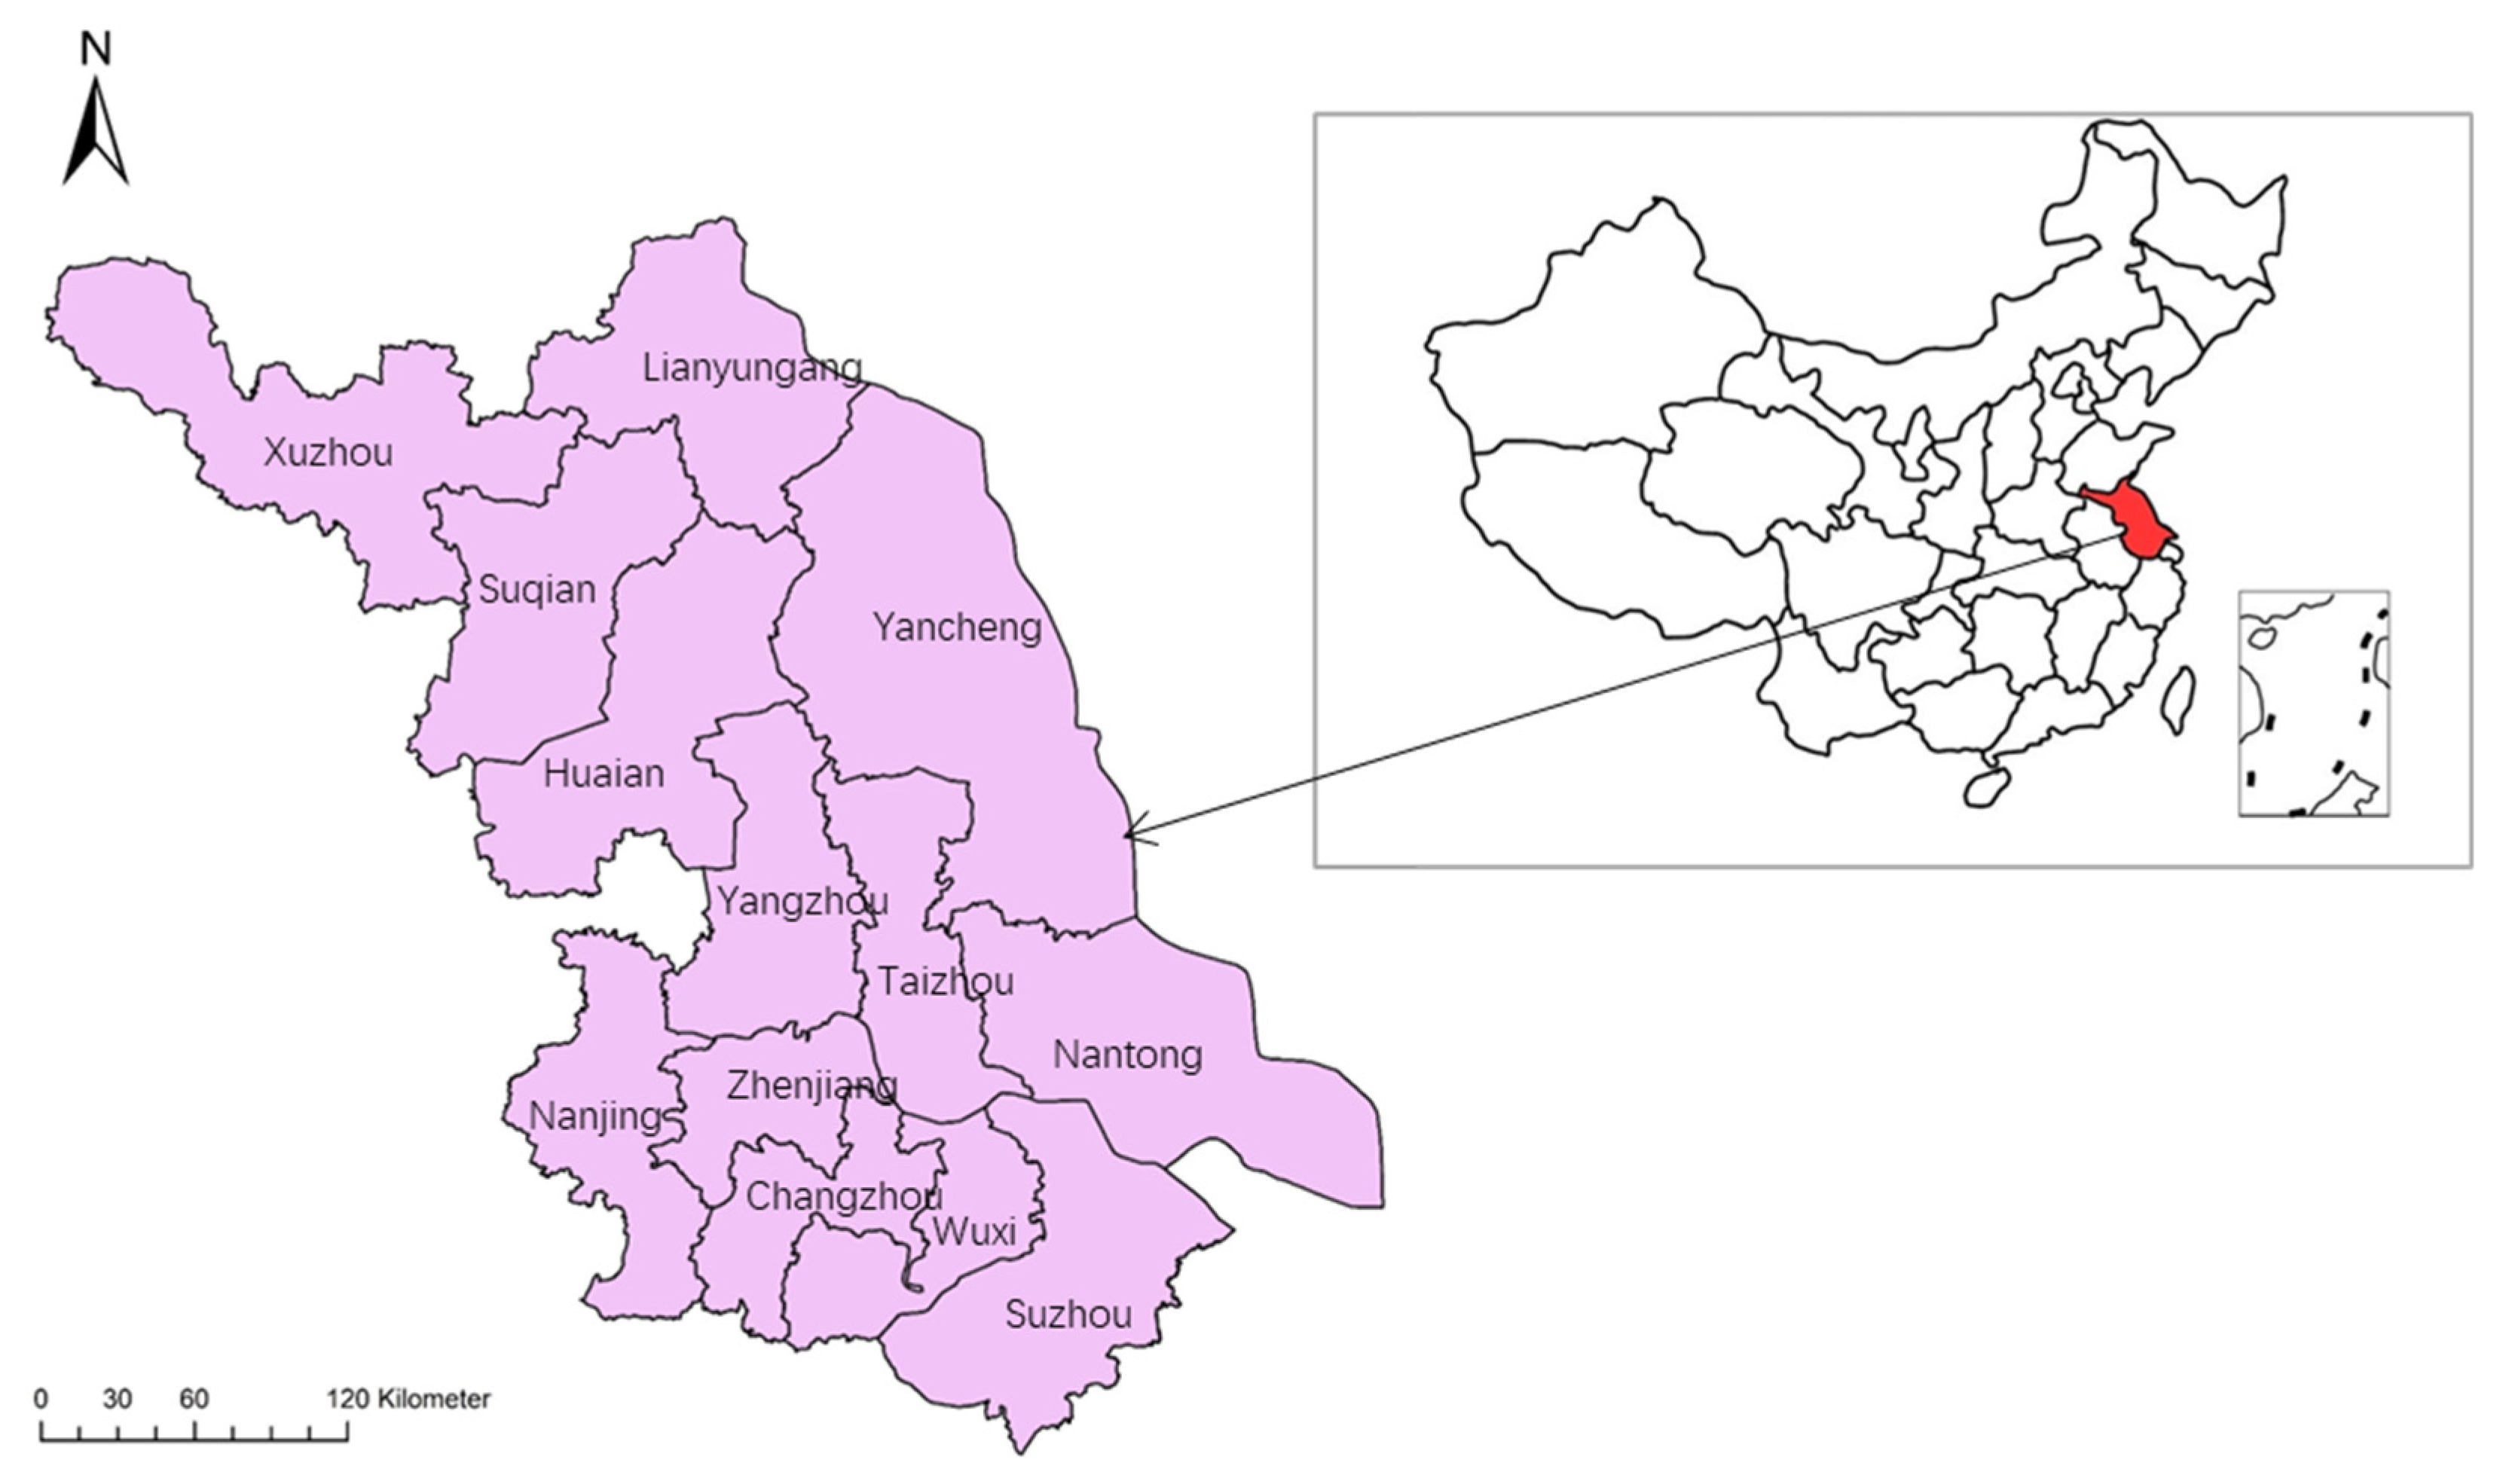
2.1. Research Scope

Jiangsu Province, a highly industrialized region in eastern China, has experienced rapid economic development, a large population, a high number of motor vehicles, frequent heavy pollution incidents, and significant anthropogenic emissions impacting the urban environment (Figure 1). As a result, it is a key area affected by air pollution [25]. Previous studies have suggested that urbanization facilitates the rapid aggregation of population, resources, and services, making life more convenient for residents [26]. However, this rapid urbanization process is also accompanied by high-intensity industrial production and transportation, which continue to increase air pollution levels in cities. On one hand, low-visibility air pollution hinders residents’ commuting behaviors, negatively affecting their physical and mental health. On the other hand, large-scale industrial production and residential energy consumption generate significant greenhouse gases, further exacerbating air pollution at the micro-urban scale [27].
We quantified the changes in pollutant concentrations following the implementation of emission reduction measures and assessed the corresponding health responses. These are vital for evaluating effective air pollution prevention and control strategies [25]. Additionally, the health burden caused by air pollution reduces labor supply and increases medical costs, negatively impacting the urban economy. Quantitatively assessing the health and economic losses from changes in PM2.5 and O3 concentrations will provide essential theoretical and data-driven support for the government to implement effective and efficient environmental control policies [26].

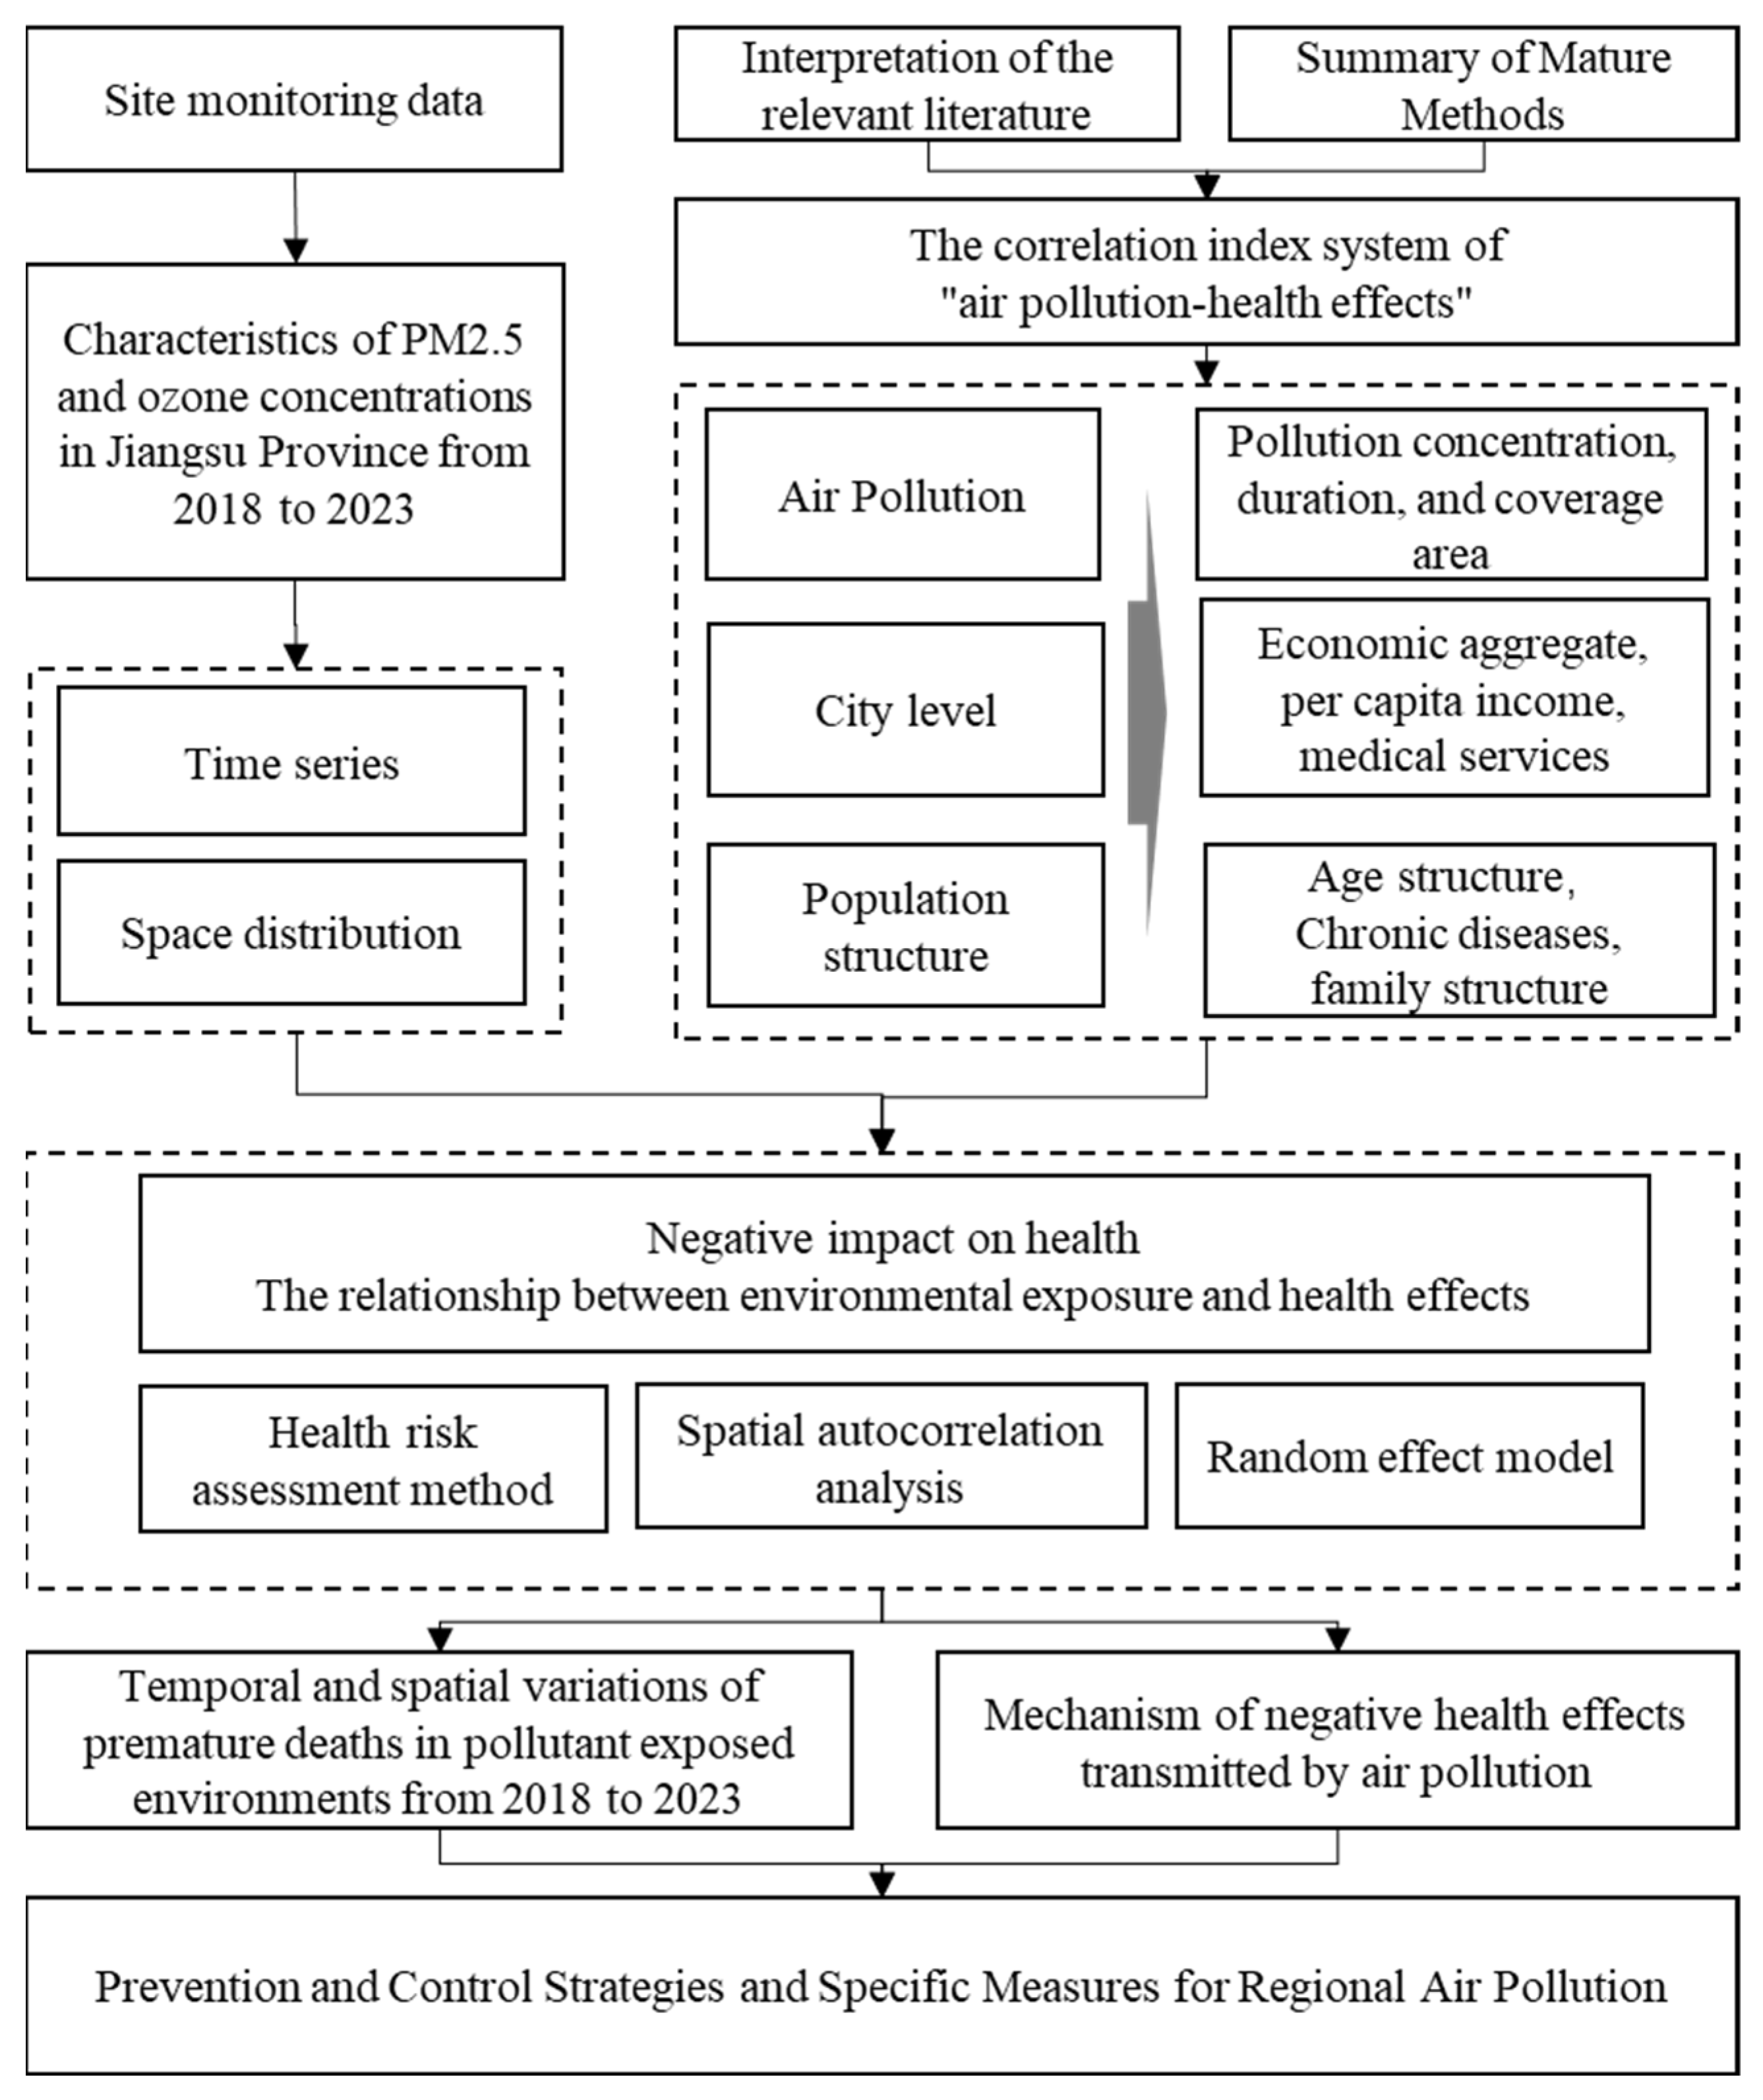
2.2. Research Framework

Based on policy-driven changes in O3 and PM2.5 concentrations in Jiangsu Province from 2018 to 2023, this study quantitatively assesses the changes in premature mortality caused by short- and long-term air pollution exposure. Additionally, this study applies the Spatial Autocorrelation Model (SAM) to fit the spatiotemporal distribution patterns of air pollutants and premature deaths in Jiangsu Province over the past 6 years. The evaluation index system for “air pollution health effects” was constructed from three aspects: air pollution characteristics, urban development characteristics, and population structure characteristics. We quantitatively evaluated the key transmission factors of health effects caused by air pollution through the random effects model (REM). We identified and extracted the interaction mechanism between regional air pollution and health effects in Jiangsu Province and targeted regional air pollution control strategies, and specific paths are proposed (Figure 2).

2.3. Variables and Indicators

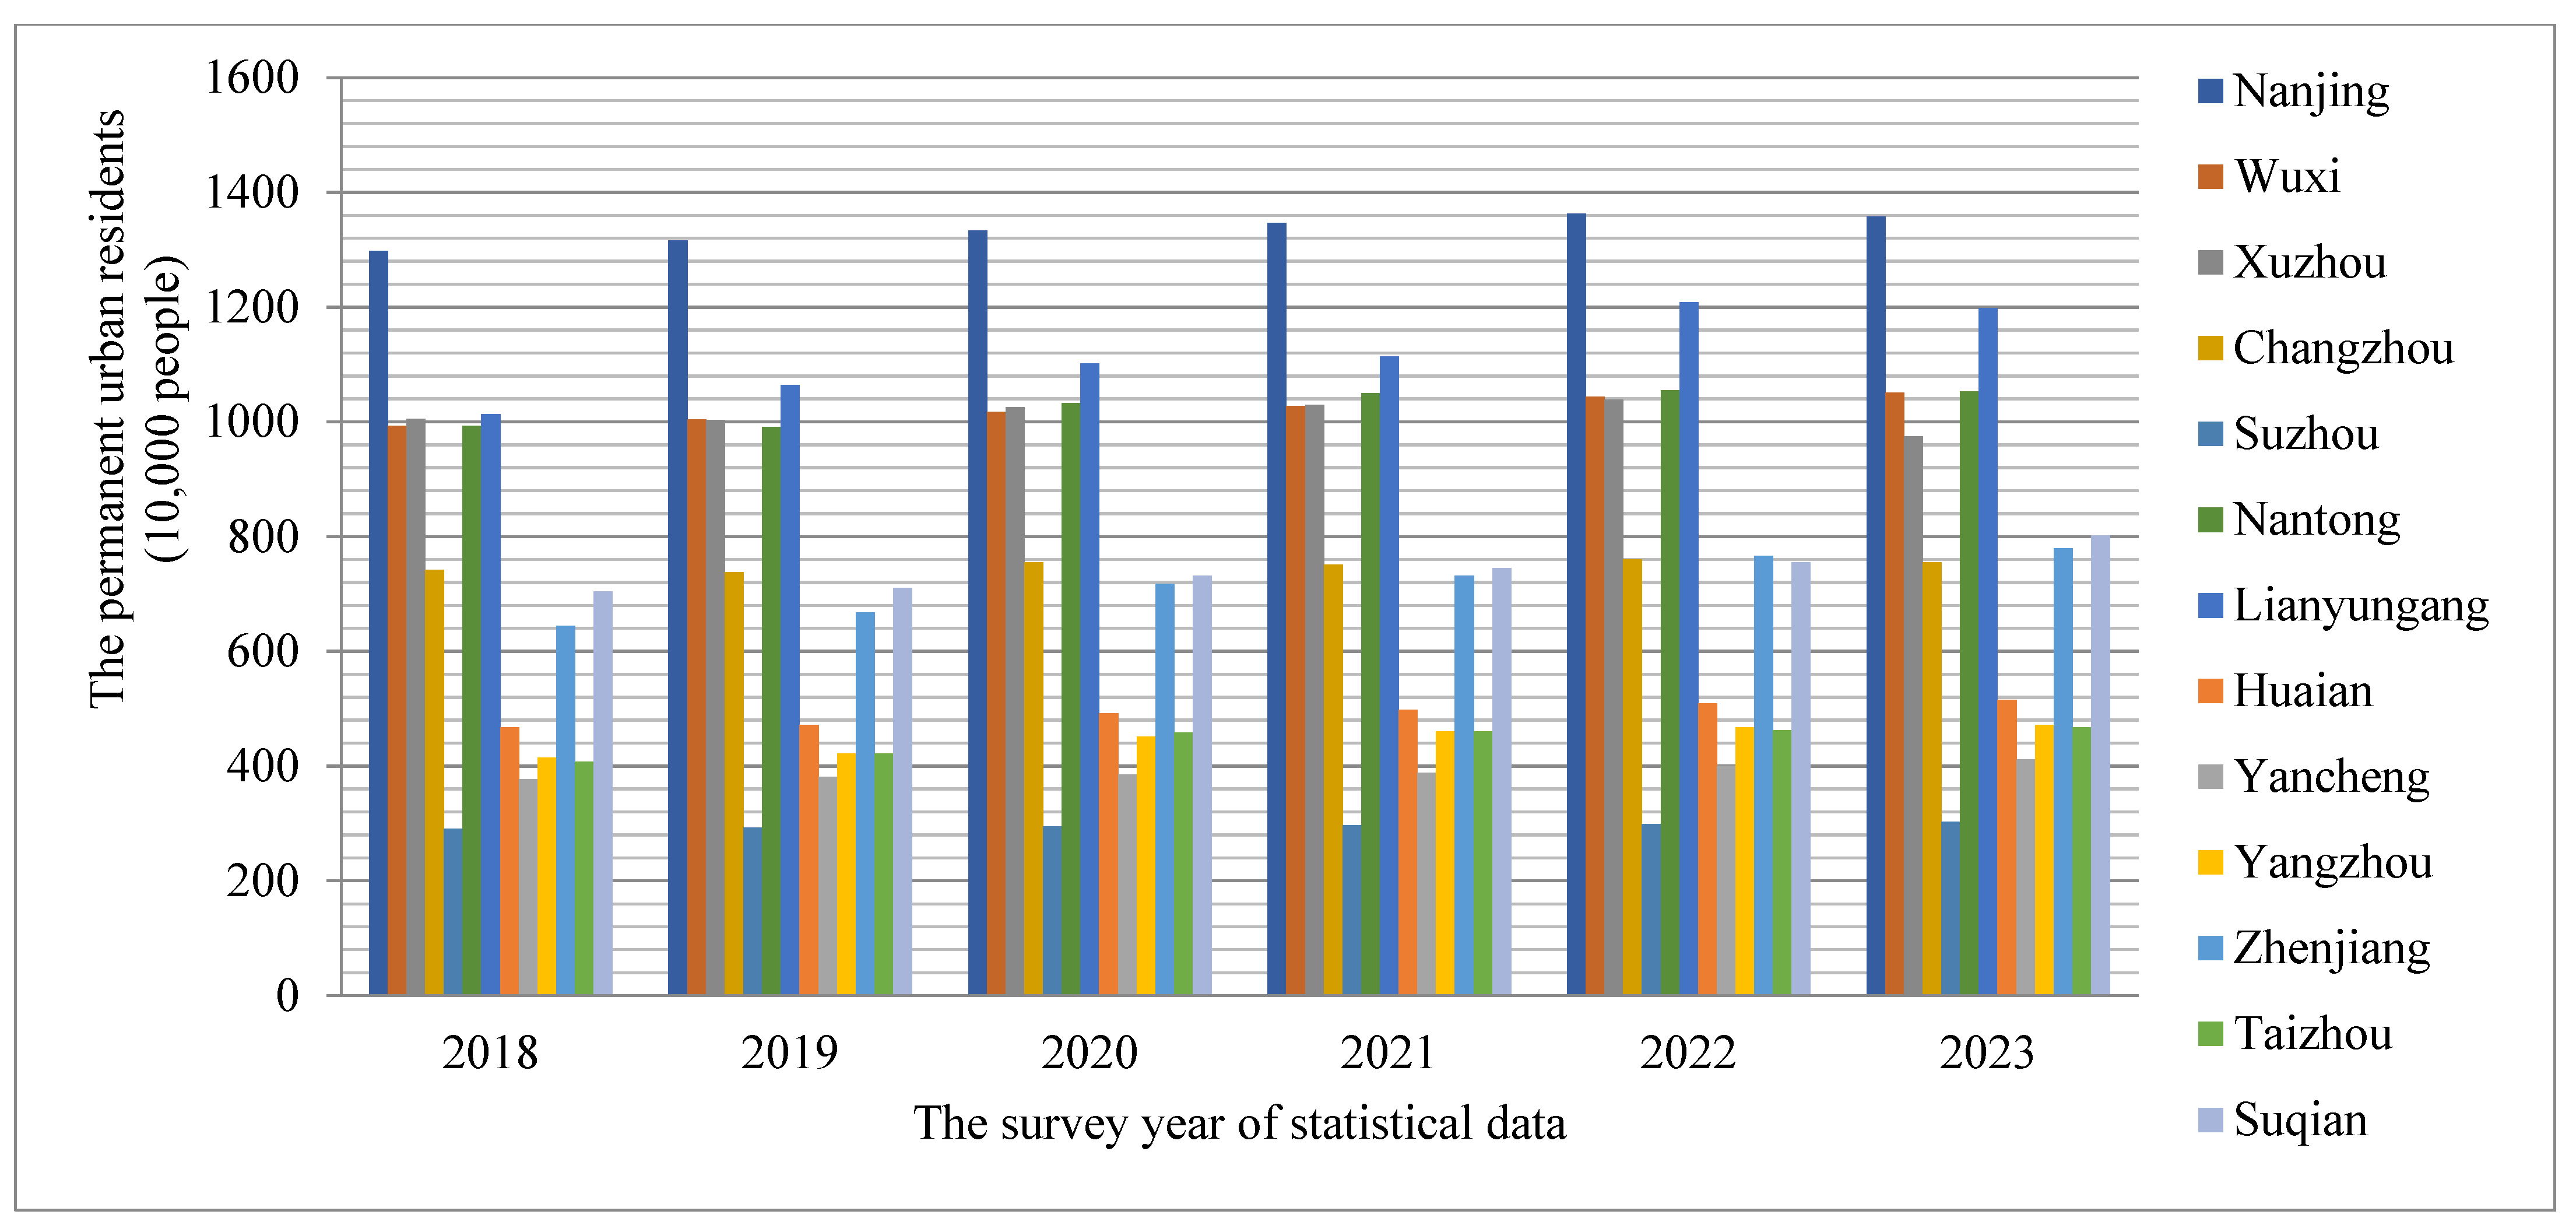
2.3.1. Statistical Yearbook Data

Baseline mortality data refer to the natural mortality rate of the population in the absence of intervention or specific events. It is an important indicator for evaluating health status, disease prevention effectiveness, or medical intervention effectiveness. This study obtained baseline mortality statistics for various cities over the years from China’s National Bureau of Statistics and the Chinese Center for Disease Control and Prevention (CDC) [16]. During the study period, the population dynamics and baseline mortality underwent noticeable changes (Figure 3). From 2018 to 2023, Jiangsu Province exhibited a linear population growth trend with a growth rate of approximately 3.28%. Simultaneously, the baseline mortality increased by 3.47% (Table 1). However, the rate of increase in mortality has slowed, suggesting that air pollution control measures have had a positive impact. This study applied the Health Impact Function (HIF) to evaluate the number of premature deaths resulting from both short-term and long-term exposure to PM2.5 and O3 pollution. Short-term health effects were assessed using the maximum daily eight-hour concentration of O3 (DMA8) and the average daily concentration of PM2.5. Long-term health effects were evaluated based on the annual average concentrations of O3 and PM2.5. Population and baseline mortality data were sourced from historical statistical yearbooks. However, this study did not account for spatial dynamic changes in population distribution or the spatial variability in baseline mortality.
In accordance with the “Technical Specifications for Environmental Air Quality Assessment (2013)” issued by the Chinese Ministry of Environmental Protection, we filtered pollutant data from each monitoring station and removed outliers to ensure high data quality [22]. For O3 monitoring, we collected data that met the standard for the average pollution concentration over an 8 h period between 8:00 a.m. and 12:00 a.m. However, if the DMA8 value exceeded the standard limit of 160 μg/m3, the data were still considered valid. For PM2.5, monitoring, a minimum of 20 effective hours of data per day was required. Additionally, PM2.5 and O3 monitoring data had to meet the following validity criteria: at least 324 valid records per year, at least 27 valid records per month, and at least 25 valid records over a two-month period. Based on these requirements, data from individual monitoring stations were optimized, and non-compliant records were removed.

2.3.2. Air Quality Data

With the continuous development of air quality monitoring and forecasting technologies in China, air monitoring stations have been established across cities at all levels to allow for real-time monitoring of the Urban Air Quality Index (AQI). The mass concentrations include six key pollutants: PM2.5, PM10, CO, NO2, O3, and SO2, as summarized in Table 2. The data used in this study were obtained from the Chinese Ministry of Ecology and Environment (http://www.cnemc.cn/, accessed on 18 July 2023). Monthly average AQI values and pollutant concentration data were collected over a 6-year period (2018–2023). Correlation analysis revealed a strong relationship between AQI and the concentrations of these pollutants. According to national standards, air quality levels are classified as follows: excellent (AQI ≤ 50), good (50 < AQI ≤ 100), mild pollution (100 < AQI ≤ 150), moderate pollution (150 < AQI ≤ 200), heavy pollution (200 < AQI ≤ 300), and severe pollution (AQI > 300). As shown in Table 2, taking Nanjing as an example, the daily average AQI in 2022 was 67.12, and air quality ranged from excellent to heavy pollution. Additionally, significant variations in AQI values were observed among monitoring stations across different cities (F = 7.338, p-value = 0.000), indicating notable differences in air pollution levels within Jiangsu Province.

2.3.3. Indicator Variable System

This study considers health effects as the dependent variable, while three dimensions—air pollution, city level, and population structure—serve as explanatory variables. Each dimension’s indicator system comprises multiple characterization variables, which together form the specific explanatory variables of the model. The correlation between these indicators is assessed using mathematical statistical models (Table 2). In selecting specific indicators, we accounted for the economic foundations and developmental stages of cities in Jiangsu Province and prioritized the operability and effectiveness of the chosen indicators. After a comprehensive evaluation, we selected indicators such as air pollution concentration, duration of air pollution, and coverage of air pollution to characterize air pollution. Total economic development, local average income, and medical service capability were utilized to reflect the city level. For population structure, we selected age structure, chronic patients, and family formation to indicate the standard of population structure. Other explanatory and dependent variables are summarized in Table 3.

2.4. Research Methods

2.4.1. Random Effects Model

Existing quantitative studies on the relationship between air pollution and residents’ health mainly used the “Concentration-Response” relationship model. This model calculates the weighted average of the process results and obtains the comprehensive concentration–death response relationship, which includes both sub effects and total effects [13,17]. The random effects model (REM) not only considers the bias within each data point but also considers the differences between each data point. The application basis of the REM is that the expected values of different results vary greatly. The weight allocation of this model is more balanced than that of the fixed effects model and will not cause significant bias in the analysis results of large sample sizes. Considering the significant heterogeneity between the PM2.5 and O3 indicators selected in this study, the random effects analysis method is applicable, and the relevant calculation equations are as follows:
F = i = 1 k W i ( Y i Y ¯ ) 2
Y ¯ = i ( y i w i ) i ( w i )
Q = i = 1 k w i y i 2 ( i = 1 k y i w i ) 2 i = 1 k w i
I 2 = Q d f Q 100 %
Among them, F represents the matrix of explanatory variables, Y ¯ represents a fixed regression coefficient vector, Wi represents the matrix of random effects, y i 2 represents the random effect value in the error term vector related to the specific group, and k is the residual term in the model. Scholars have quantified the heterogeneity between data using statistical indicators [18]. Based on the Q-value test method, it shows that the statistic Q follows a chi square distribution with d f freedom degree of k − 1. However, the results of the simple Q-test method are unstable and need to be corrected for freedom degrees to obtain a more accurate and reliable combined-effect value [18], which is calculated using Equation (4). If Q < d f , then I 2 = 0 . In our model, I 2 > 50% shows significant inter-group differences, which validates the rationality of the random effects model.
Reliability analysis evaluates the consistency and stability of the model by comparing multiple measurement results. This analysis mainly uses the Alpha analysis method and semi reliability analysis method, calculating the reliability coefficient through different methods. The reliability analysis method used in this article is Cronbach’s Alpha coefficient. We used the SPSS statistical analysis software for reliability analysis and used Cronbach’s Alpha reliability coefficient to measure the intrinsic reliability of the statistical survey data. The value of the reliability coefficient is between 0 and 1. When the coefficient is greater than 0.7, the model is considered to have strong reliability and can be used for systematic analysis; when the coefficient is between 0.5 and 0.7, it indicates that the reliability of the model is average. The Alpha reliability coefficients of each indicator are calculated separately (Table 4). From the results, the Cronbach’s Alpha values of the reliability coefficients of each factor in the statistical data are all greater than 0.7, indicating that the internal structure of the statistical data options is good. There is strong consistency among the statistical data options, and the technique of using the indicators to measure the influencing factors of residents’ healthy effects has good reliability.

2.4.2. Spatial Autocorrelation Analysis

In order to explore the spatial correlation of air pollution between cities, we used the global spatial autocorrelation index Moran’s I to quantitatively analyze the agglomeration effect of air pollution within the region. The equation for calculating Moran’s index is as follows:
M o r a n s   I = i = 1 n j = 1 n ρ i j ( Z i Z ¯ ) ( Z j Z ¯ ) F 2 i = 1 n j = 1 n ρ i j
In the equation, F 2 is the sample variance; n is the number of samples; ρ i j is the spatial weight matrix; ρ i j represents the observed values at spatial positions i and j; and X is the mean value of the attribute. The range of Moran’s index values is [−1, 1]. When it is greater than 0, it indicates the existence of positive spatial correlation, that is, the observed values of each unit around high (low) values are also high (low), showing spatial clustering characteristics. When it is less than 0, it indicates a negative correlation between spatial units, with high and low values clustered together. When it equals 0, it indicates that there is no spatial correlation, and high and low values are randomly distributed in space. The strength and significance of spatial correlation are mainly judged based on the Z-score and p-value obtained from the Monte Carlo hypothesis test results, as shown in Table 5. When the confidence level is higher, it indicates that the analyzed data tend to be spatially clustered, while when it is lower, it indicates that the data tend to be dispersed.

2.4.3. Health Risk Assessment Methods

The Health Impact Function (HIF) (as shown in Equation (6)) is widely used to assess the mortality burden caused by short- and long-term exposure to PM2.5 and O3 [21,25].
M o r t = A i P o p [ 1 1 / D D i ]  
In the equation, M o r t represents the number of premature deaths caused by negative health effects, i, due to exposure to PM2.5 or O3. A denotes the baseline mortality for health endpoint i, with data sourced from the “China Health Statistics Yearbook 2018–2023” (http://www.nhc.gov.cn, accessed on 23 July 2023). Due to the unavailability of baseline mortality data at regional and city levels, this study assumes that the baseline mortality is evenly distributed across China [26,27,28]. Pop represents to the population size exposed to air pollution, with data obtained from the “China Statistical Yearbook” and “China Urban Statistical Yearbook” published by the National Bureau of Statistics of China. DD refers to the relative risk of health endpoint i associated with exposure to PM2.5 and O3. This value is typically calculated using a log linear model, as shown in Equation (7). The model considers three health endpoints: all-cause mortality (total), cardiovascular disease mortality (CVD), and respiratory disease mortality (RD) [29,30].
D D = e x p [ β i ( B B 0 ) ]
In the above equation, β i represents the exposure response factor for health endpoint i.
D D denotes the monitored concentration of PM2.5 and O3, where long-term effects are based on annual average concentrations, while short-term effects use the DMA8 (Daily Maximum 8 h Average) values of PM2.5 and O3 (μg/m3). The data are sourced from the China Environmental Monitoring Centre (CNEMC) (http://www.cnemc.cn/sssj, accessed on 23 July 2023). B 0 refers to the concentration thresholds of PM2.5 and O3, below which health risks are considered negligible.
With the continuous advancement of epidemiological research, scholars have statistically analyzed and summarized multiple “concentration response” equations based on various exposure scenarios, including air pollution, active smoking, passive secondhand smoke inhalation, and indoor cooking fuel combustion [31]. By integrating the “Integrated Exposure Response” (IER) equation [32], previous findings at lower exposure concentrations are combined with research conducted at higher exposure concentrations using a unified equation (Equation (8)). The IER model considers four major health endpoints for adults: ischemic heart disease (IHD), chronic obstructive pulmonary disease (COPD), cerebrovascular disease (stroke), and lung cancer (LC). The exposure–response curve is expressed by the following equation:
D D = 1 + α ( 1 exp γ B B 0 δ )
In the equation, α , γ , and δ refer to the fitting parameters of health endpoint i, used to describe the relative risk curve. Table 6 shows the selection of the various health endpoint parameters.

3. Results

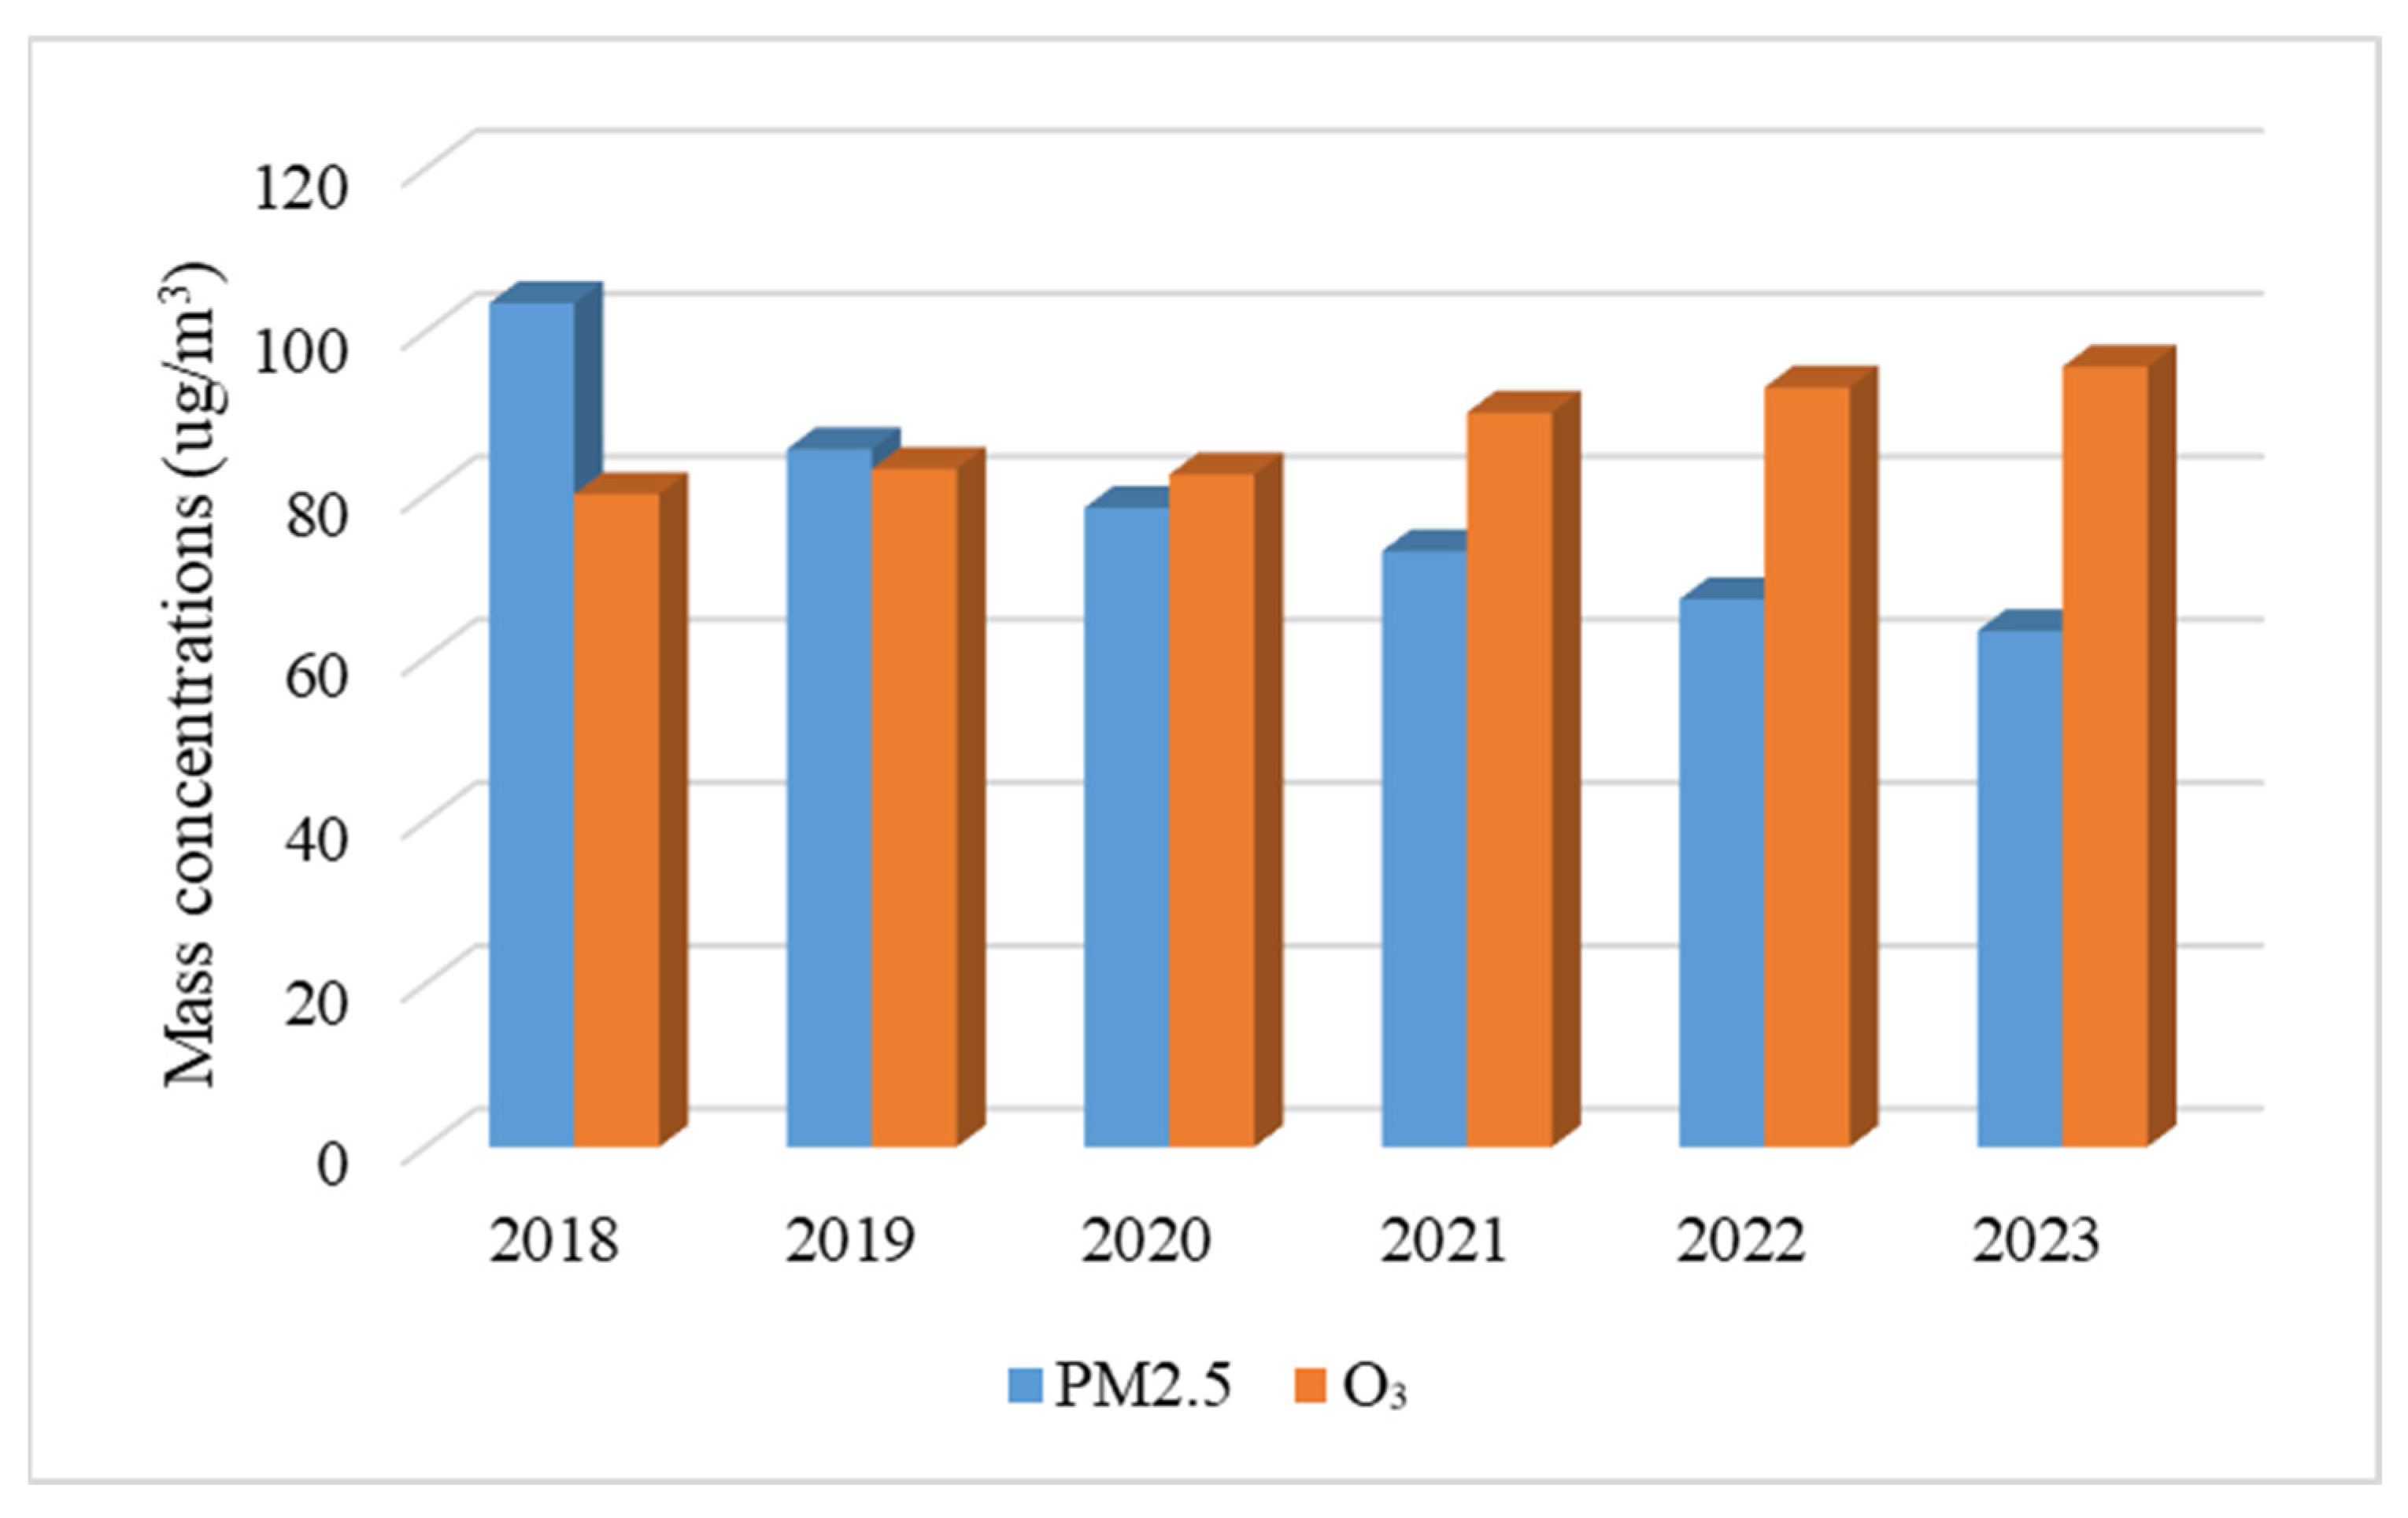
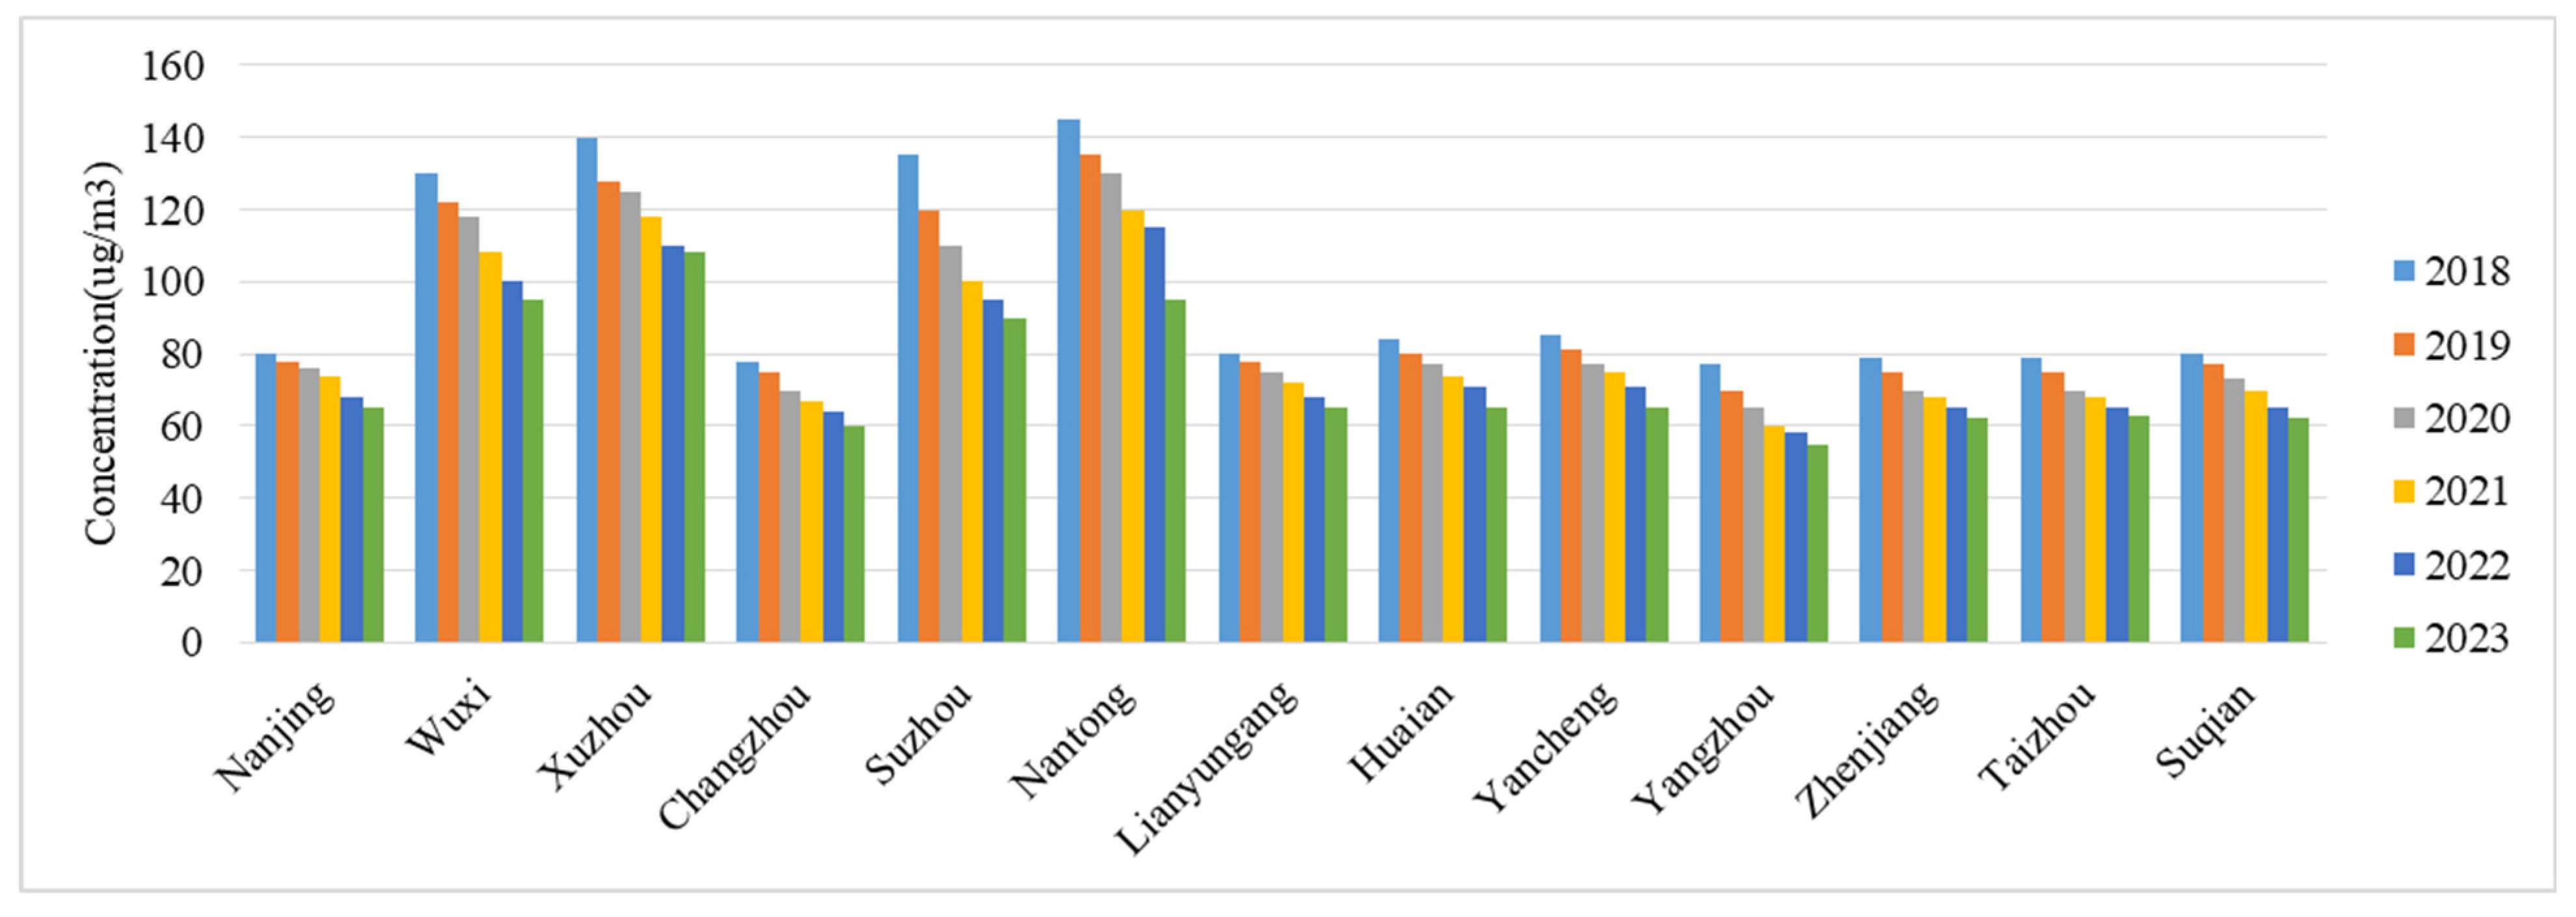
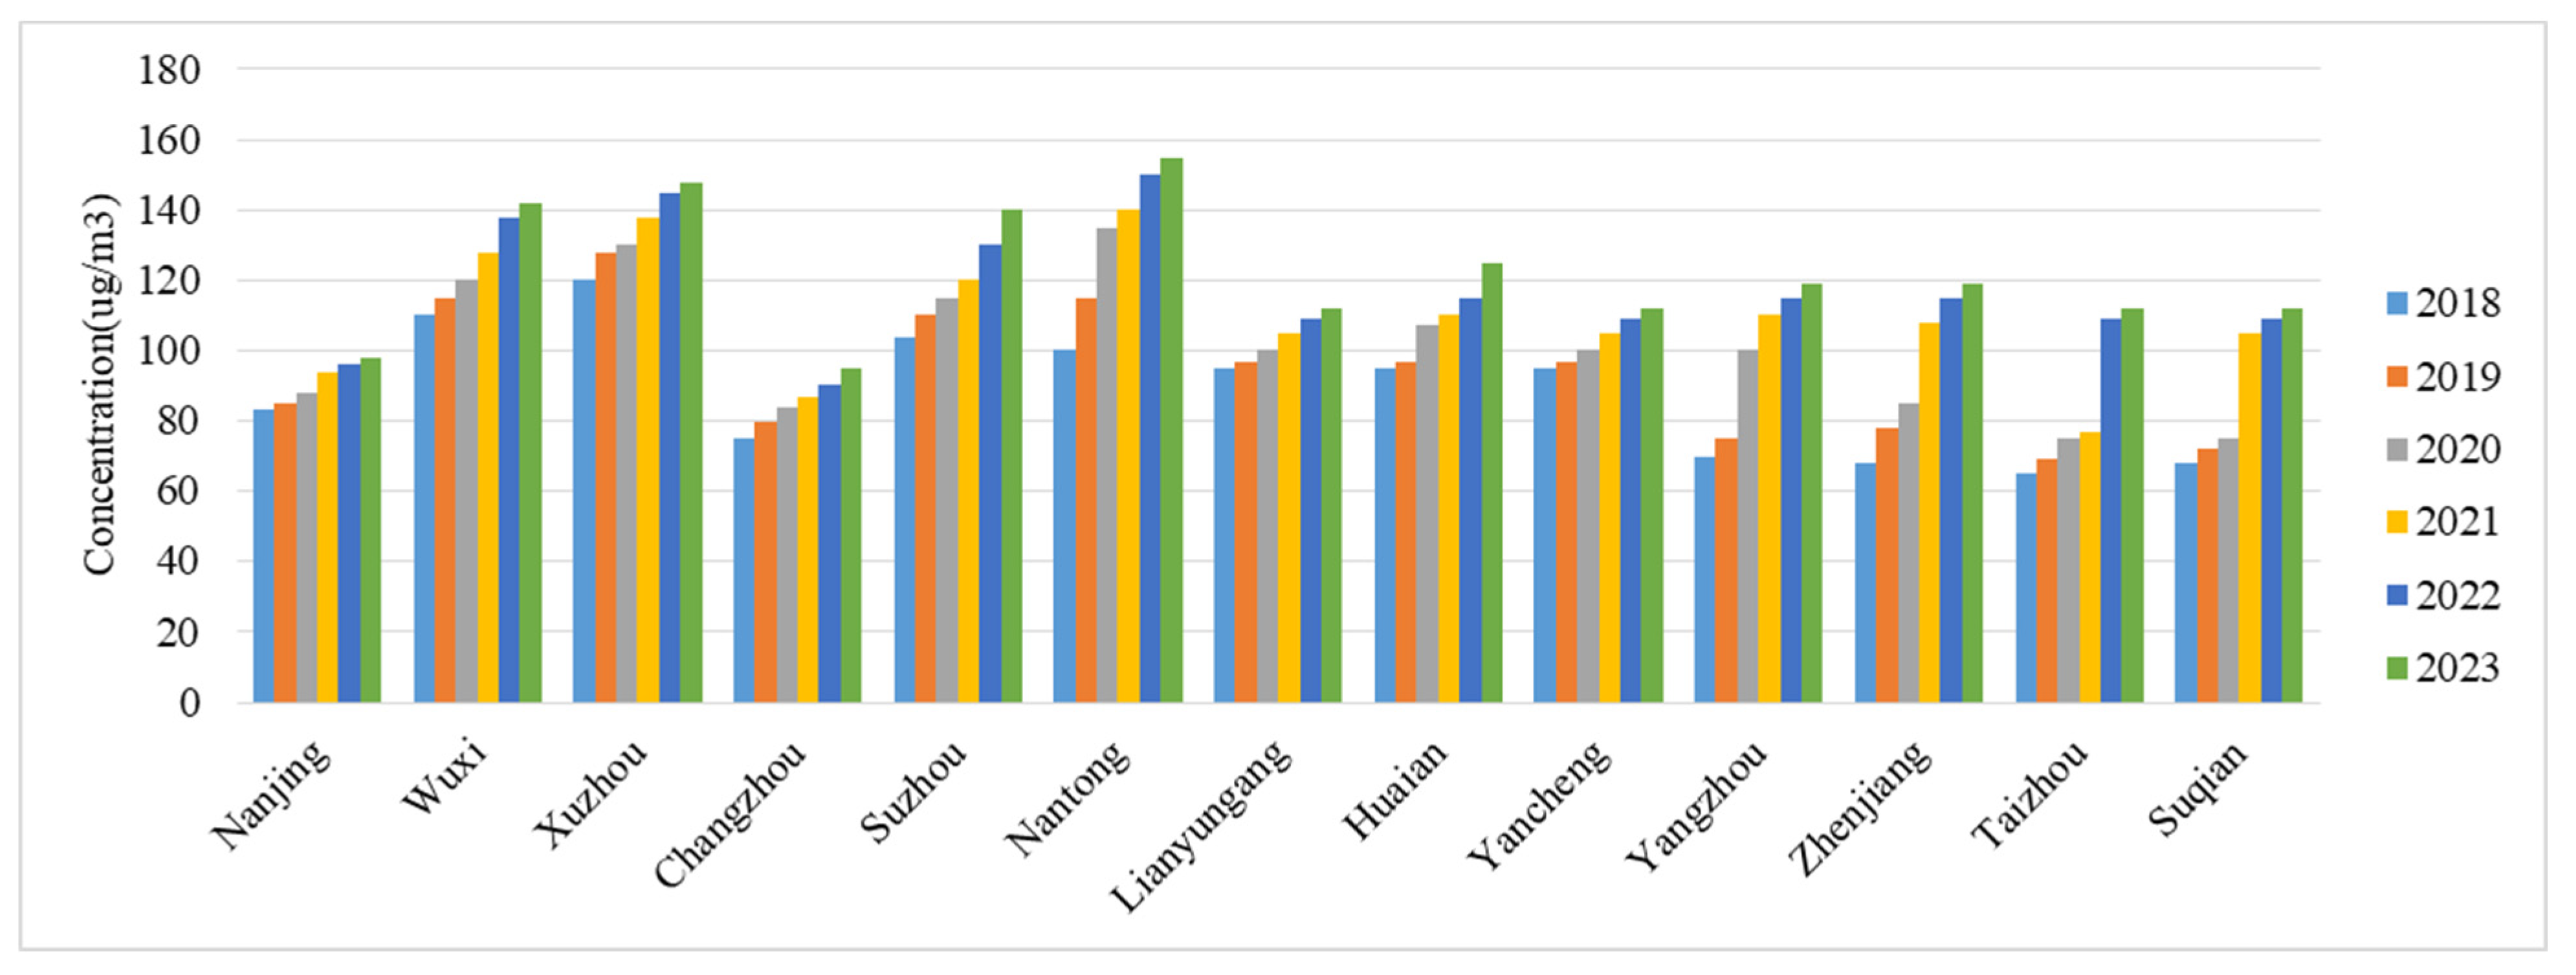
3.1. Characteristics of Changes in Atmospheric Pollutant Concentrations in Jiangsu Province from 2018 to 2023

Since the implementation of China’s Air Pollution Management Regulations in 2018, cities have enforced strict emission control measures. As a result, PM2.5 concentrations have decreased, improving residents’ living environments and reducing potential negative health effects [33]. Jiangsu Province, one of the regions with the most severe air pollution, has exhibited notable internal variations in PM2.5 and O3 concentrations, as shown in Figure 4. From 2018 to 2023, the PM2.5 concentrations in Jiangsu Province showed a noteworthy downward trend, with the average annual concentration decreasing from 105.88 μg/m3 to 55.04 μg/m3, a reduction of approximately 48.01%. Among major cities, Nanjing’s PM2.5 concentration decreased by 48.01%; Suzhou’s PM2.5 concentration decreased by 42.11%; and Xuzhou’s PM2.5 concentration decreased by 48.71%. In contrast to the declining trend of PM2.5, the annual average O3 DMA8 concentration has shown a significant increase, rising from 82.27 μg/m3 in 2018 to 107.61 μg/ m3 in 2023, representing an increase of 30.79%. Among major cities, Suzhou’s O3 concentration increased from 78.58 μg/m3 to 108.08 μg/m3, representing a growth rate of 37.54% (highest increase); Xuzhou’s O3 concentration increased by 32.20%; and Nanjing’s O3 concentration increased by 11.06% (relatively smaller growth).
The trend in PM2.5 concentration changes in various cities within Jiangsu Province is shown in Figure 5, and the characteristics of pollutant concentration changes in each city are consistent with the overall regional trends. Overall, from 2018 to 2023, the concentration of PM2.5 in the region decreased, while the concentration of O3 increased. Among various cities, Nanjing, Suzhou, and Wuxi experienced relatively severe PM2.5 pollution, with the average concentration exceeding 100 μg/m3 over the past 6 years. However, the decline in PM2.5 was also significant, with concentrations decreasing by 53.12%, 50.81%, and 56.62% from 2018 to 2023, respectively. These results indicate that Xuzhou recorded the highest PM2.5 concentration in northern Jiangsu Province. Meanwhile, the air quality in Changzhou, Yangzhou, and Taizhou was relatively good, with their annual average PM2.5 concentrations over the past 5 years meeting the national air quality standard (35 μg/m3). As shown in Figure 6, the overall O3 concentration in various cities of Jiangsu Province shows a significant upward trend, with slight differences in the increase magnitude among different cities. Before 2021, O3 concentrations in cities, such as Nanjing, Wuxi, and Suzhou, showed a slight decline, but they have been increasing annually since 2021. The largest increases in O3 concentration occurred in Xuzhou at 66.27% (2018–2023), Zhenjiang at 51.83% (2018–2023), and Suqian at 45.37% (2018–2023). Furthermore, Nanjing, Wuxi, and Suzhou simultaneously faced the issue of combined pollution of PM2.5 and O3, highlighting the need for enhanced control measures targeting both pollutants simultaneously.

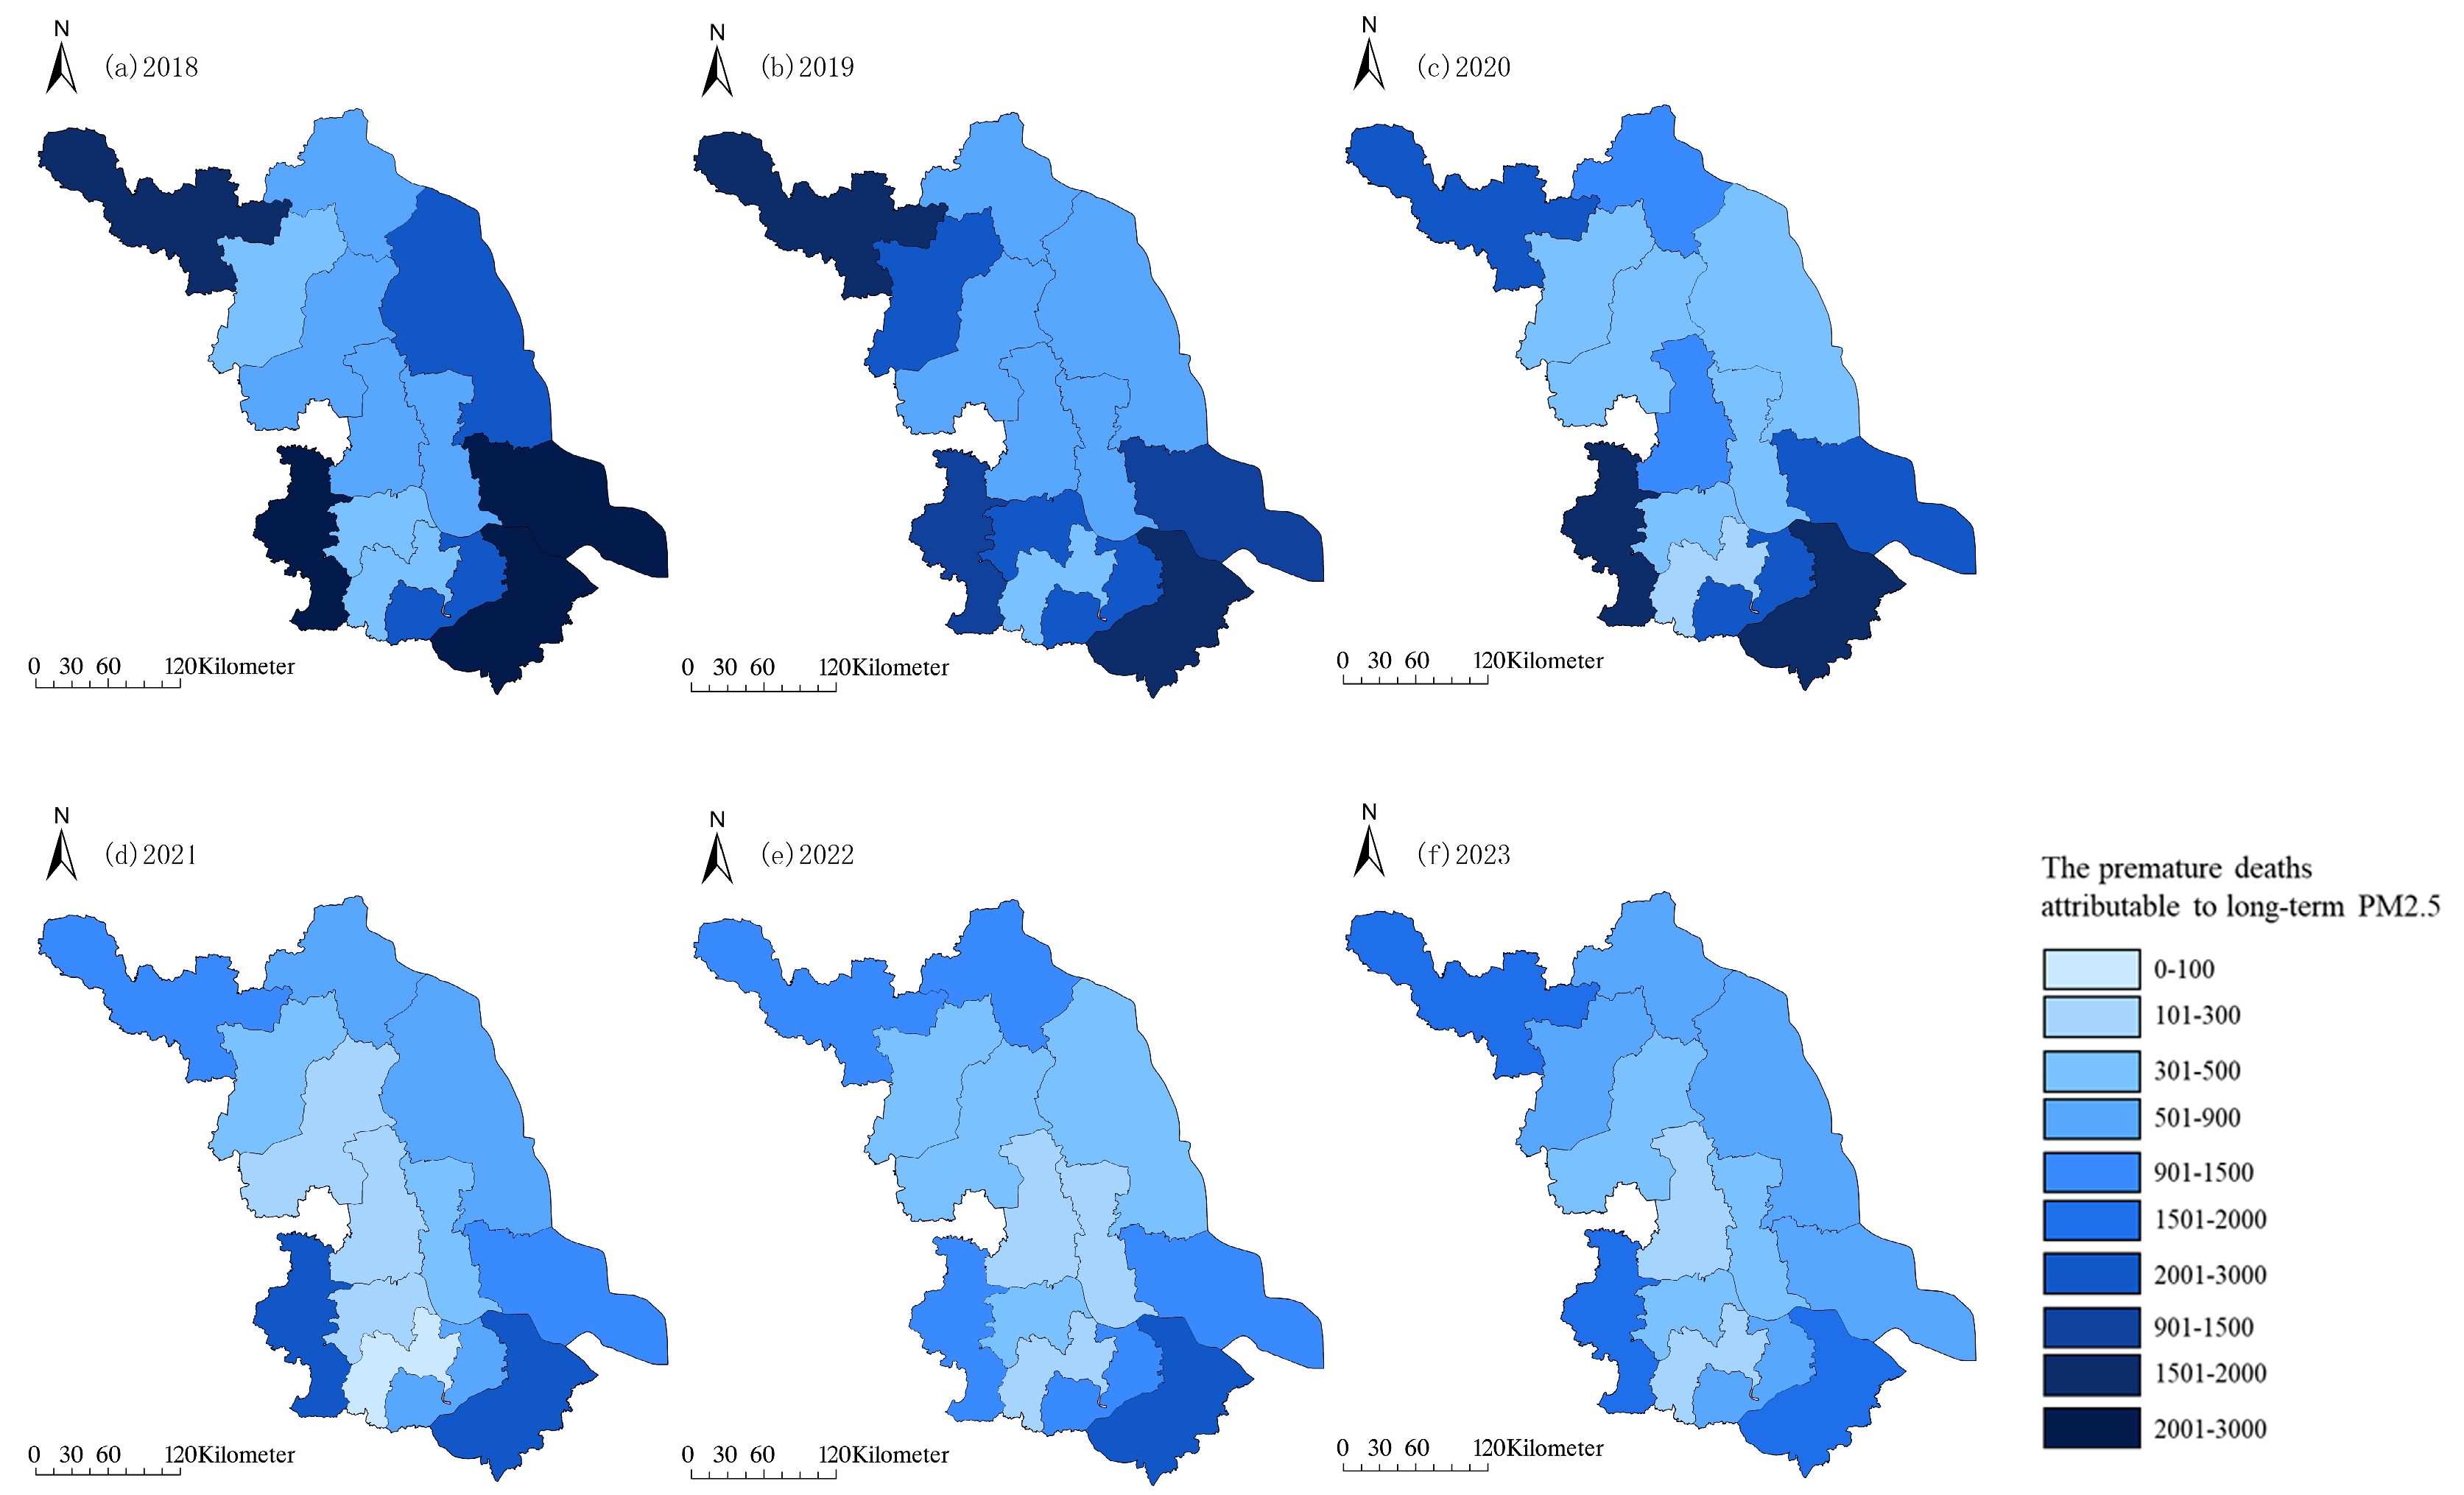
3.2. Spatial Variation Characteristics of PM2.5 and O3 Pollution in Different Years

Figure 7 illustrates the spatial distribution changes in PM2.5 and O3 concentrations from 2018 to 2023. Overall, the spatial distribution patterns of PM2.5 and O3 were similar, with heavy pollution primarily concentrated in the southern region of Jiangsu Province, particularly in Nanjing, Wuxi, Suzhou, and Xuzhou. However, in terms of long-term spatial distribution trends, while PM2.5 pollution has been effectively controlled in recent years, O3 concentrations have continued to rise annually, with an expanding pollution range. From 2018 to 2023, the annual average O3 concentration in southern Jiangsu Province consistently exceeded 100 μg/m3, significantly surpassing the O3 health risk threshold of 70 μg/m3 established in this study. Past studies have indicated that as O3 pollution worsens, its health effects become increasingly severe. In densely populated areas, elevated O3 concentrations pose a significant risk of disease and premature death [34,35,36].

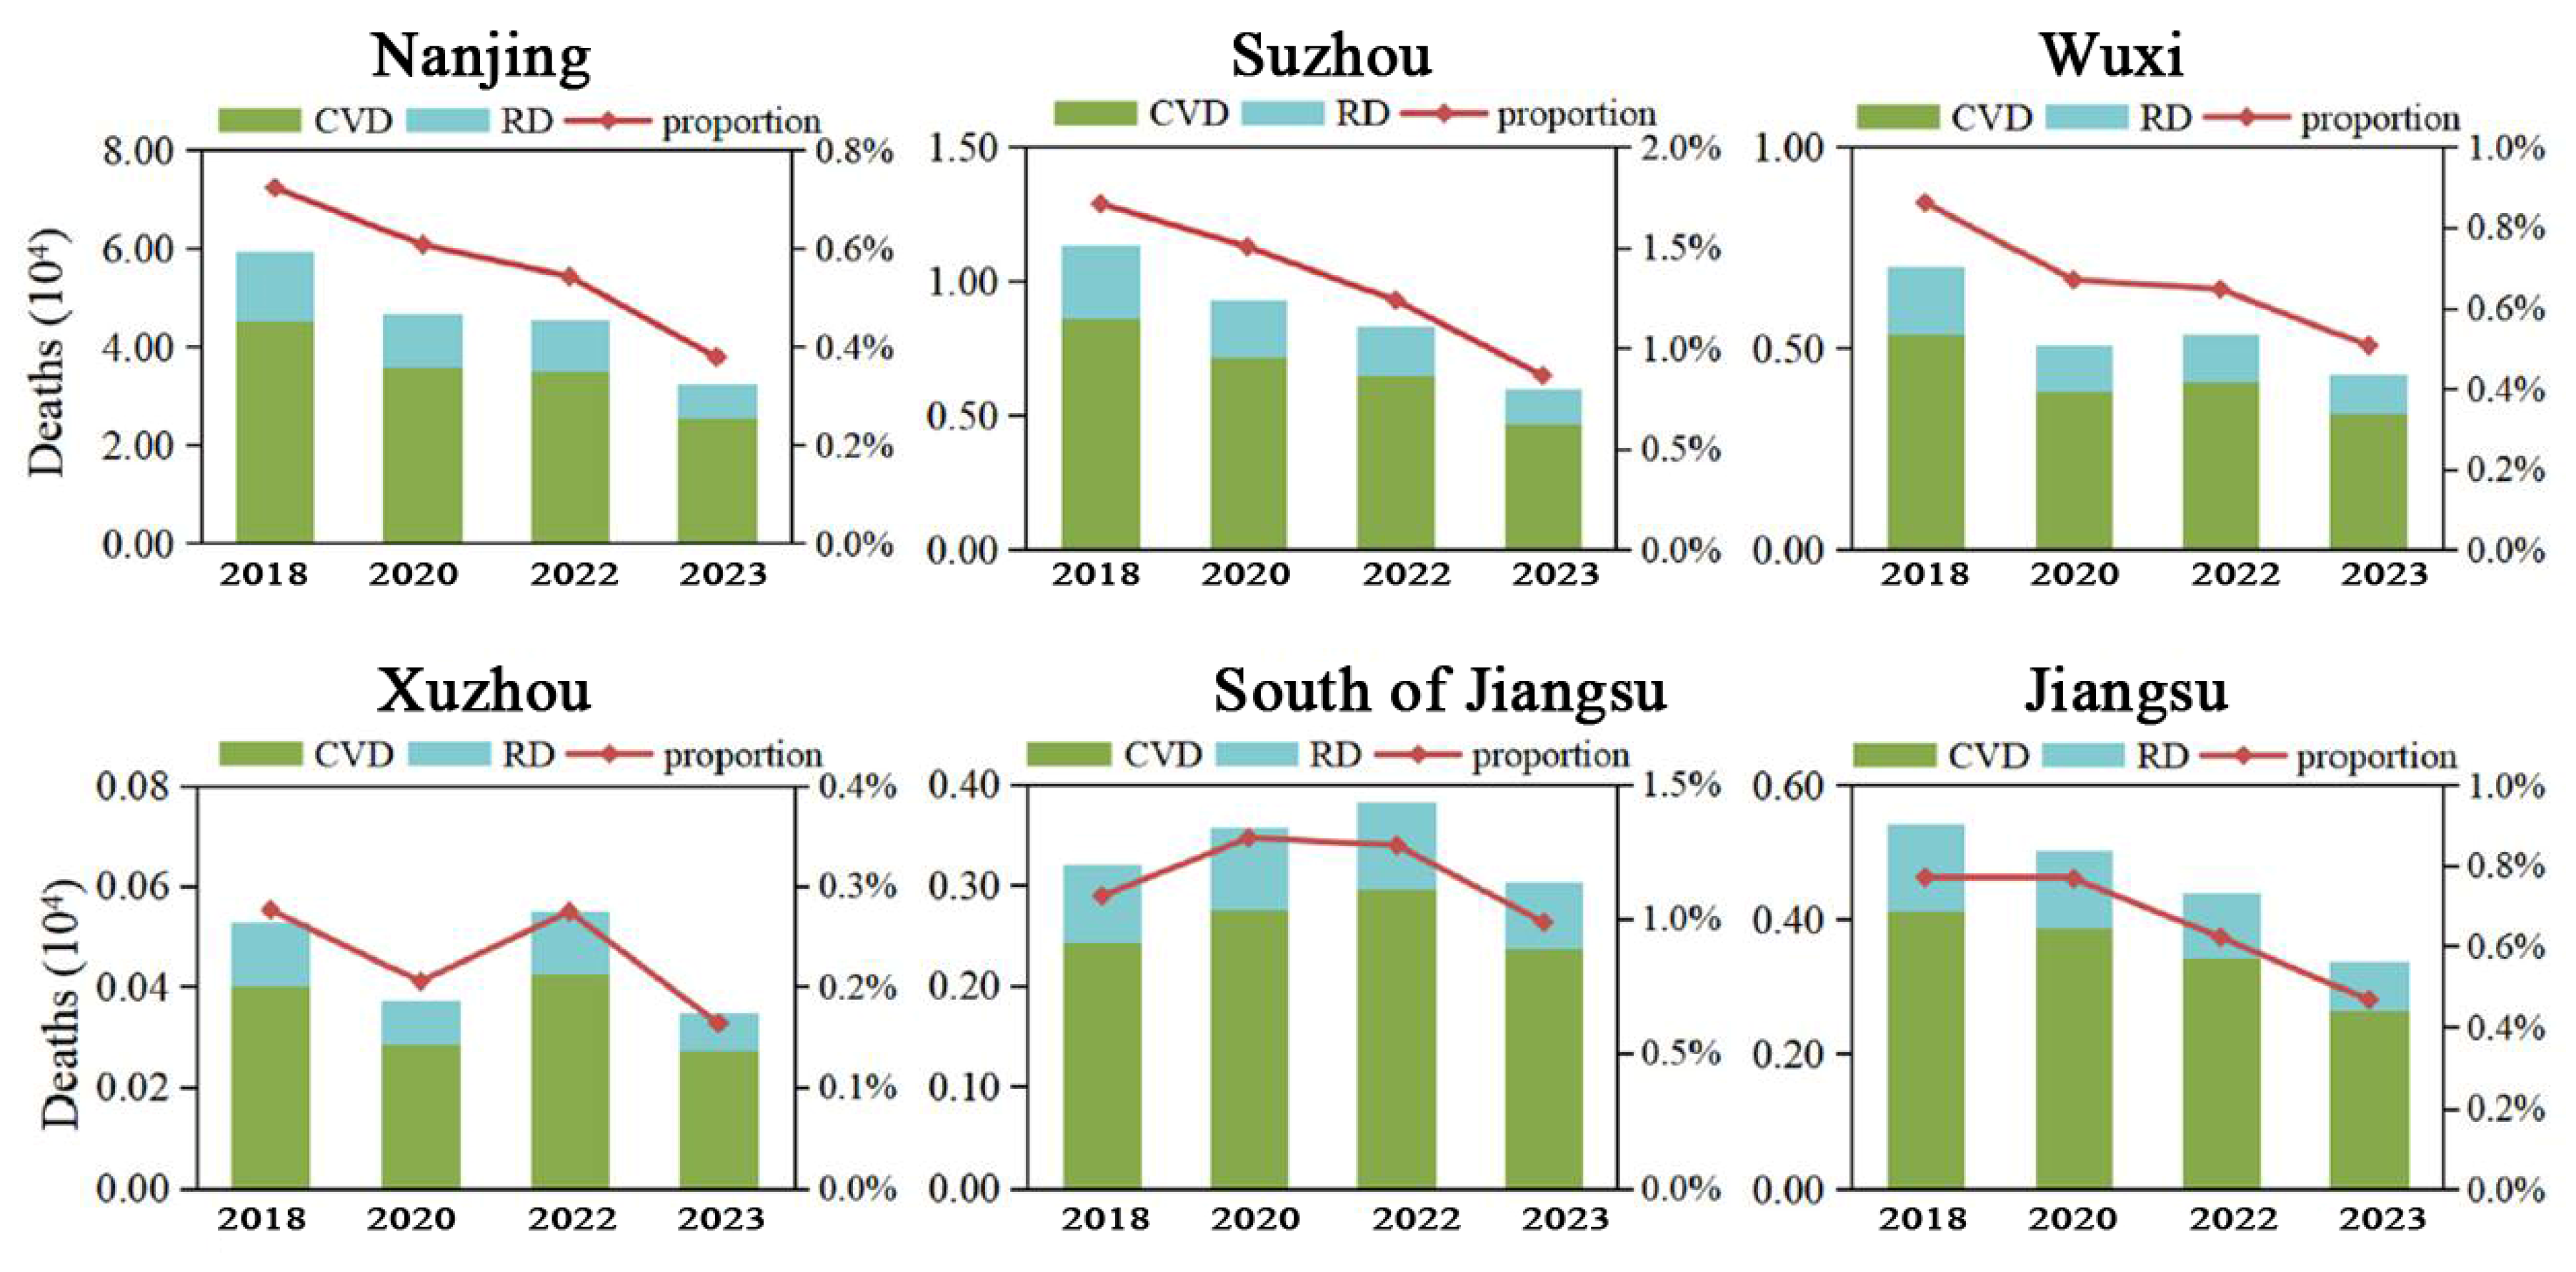
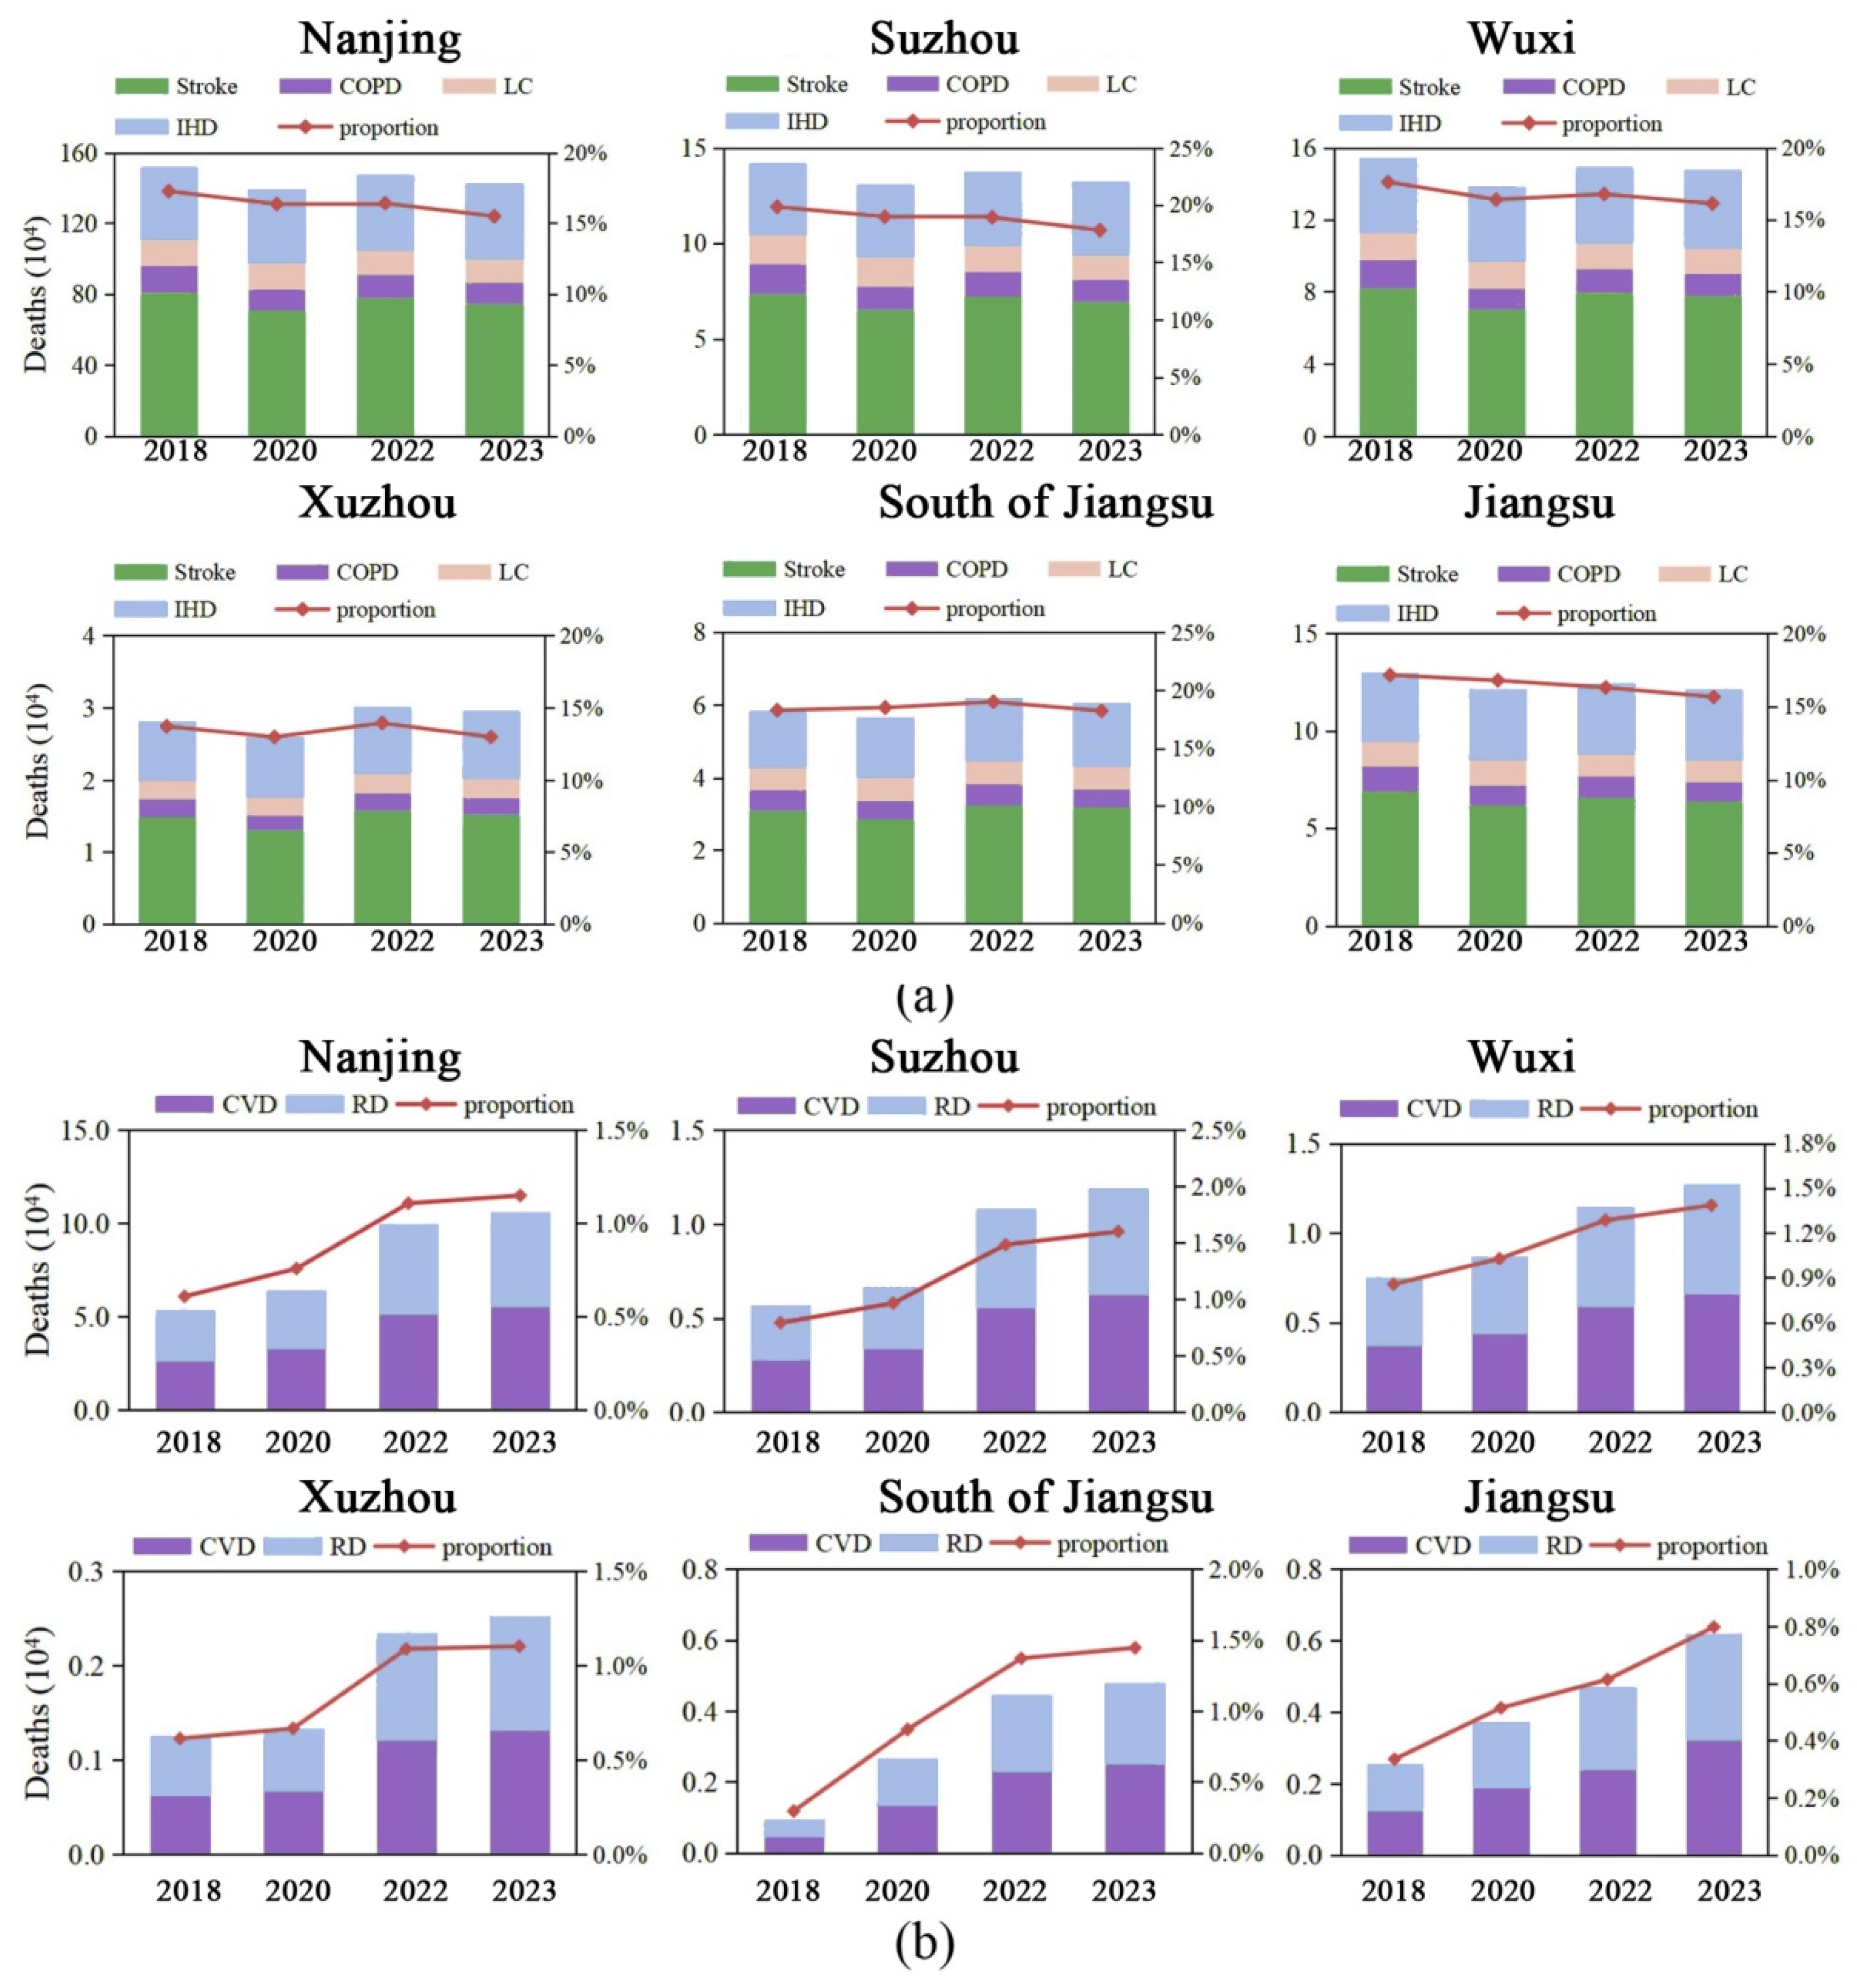
3.3. The Number of Premature Deaths Caused by Short-Term Exposure to PM2.5 Has Significantly Decreased

As shown in Figure 8, the number of premature deaths caused by short-term exposure to PM2.5 in Jiangsu Province significantly decreased from 2018 to 2023. This decline was particularly evident after the implementation of the APPCAP environmental protection policy in 2020, which led to a substantial reduction in PM2.5 concentrations and related negative health effects. The total number of premature deaths associated with short-term PM2.5 exposure in Jiangsu Province decreased from 18,998 in 2018 (accounting for 3.07% of total deaths that year) to 6746 in 2023 (1.02% of total deaths), corresponding to an overall decrease of 64.49%. Additionally, studies indicated that the health burden caused by pollutant exposure is not only strongly correlated with pollutant concentration but is also influenced by factors such as population size and baseline mortality [37].
Due to its high population size and density, Jiangsu Province experiences a higher number of premature deaths related to air pollution compared to other regions with similar pollution levels. Nanjing, Suzhou, and southern Jiangsu Province have shown a steady annual decline in PM2.5 concentrations, yet the proportion of premature deaths due to short-term PM2.5 exposure remains significant, exceeding 50% in these areas. The estimated number of premature deaths in 2023 for these regions is 1044 in Nanjing, 943 in Suzhou, and 10,265 in southern Jiangsu Province. The total number of premature deaths related to air pollution in Jiangsu Province in 2023 was 7600 in 2018, decreasing to approximately 4700 in 2023. Among these cases, cardiovascular disease deaths (CVD) are more related to short-term PM2.5 exposure than respiratory disease deaths (RD), with CVD-related premature deaths occurring at approximately three times the rate of RD-related deaths. The findings of this study indicate a higher number of premature deaths related to short-term PM2.5 exposure compared to previous studies [25], primarily due to difference in the PM2.5 threshold concentration (CQ) used for risk assessment. Some European and American studies have set the carbon monoxide (CO) threshold at 75 μg/m3, whereas this study adopts the threshold of 35 μg/m3 in accordance with China’s national environmental air quality standards.
The spatial distribution of premature deaths is illustrated in Figure 9 and closely aligns with the distribution characteristics of PM2.5. Over the years, the number of premature deaths associated with PM2.5 exposure has been decreasing annually, with southern Jiangsu Province experiencing the most significant declines in high-value areas. Among the cities in Jiangsu Province, Nanjing, Wuxi, Suzhou, and Xuzhou exhibited notable improvements in PM2.5, levels, resulting in the highest number of avoidable premature deaths due to reduced short-term exposure: Nanjing avoided 1978 deaths (68%), Wuxi avoided 1586 deaths (63%), Suzhou avoided 1871 deaths (65%), and Xuzhou avoided 1562 deaths (69%). Conversely, in environmentally cleaner cities, such as Yangzhou, Taizhou, and Changzhou, where PM2.5 concentrations are lower, the number of premature deaths attributed to PM2.5 exposure was significantly lower compared to other cities. As a result, the number of avoidable premature deaths due to pollution reduction was also relatively small.

3.4. City Level and Population Structure Play an Important Role in the Health Effects of Air Pollution

In contrast to PM2.5, the number of premature deaths caused by short-term exposure to O3 in Jiangsu Province increased annually from 2018 to 2023, with 3929, 4351, 4688, 4943, 6731, and 6929 deaths per year. These accounted for 0.64%, 0.71%, 0.73%, 0.82%, 1.00%, and 1.05% of the total number of deaths in each corresponding year (Figure 10). Compared with 2018, the number of premature deaths related to short-term O3 exposure in Jiangsu Province increased by 76.36% by 2023. Due to the significant rise in the O3 concentration in Suzhou, the growth rate of related short-term premature deaths exceeded 100%, with the proportion of deaths increasing from 0.55% to 1.04%. In the southern region of Jiangsu Province, the number of premature deaths caused by short-term exposure due to increased O3 concentrations increased by 84.26%, accounting for 73.39% of the total deaths. This trend indicates that O3 pollution may become a major health threat in the future. Among major cities, Nanjing had the lowest growth rate of premature deaths at 23.82%. However, due to the high average O3 pollution levels and large population base, the total number of premature deaths related to short-term exposure remained higher in Nanjing than in Suzhou.
Figure 11 illustrates the spatial distribution changes in premature deaths related to short-term O3 exposure in Jiangsu Province from 2018 to 2023. In 2018, O3 pollution levels were relatively mild, but Nanjing, with its large and dense population, recorded the highest number of premature deaths attributed to short-term O3 exposure. The most significant increases were observed in cities such as Suzhou and Wuxi, located in southern Jiangsu Province. Among all cities, Xuzhou, Suzhou, and Nanjing recorded the highest numbers of premature deaths due to short-term O3 exposure, primarily due to severe O3 pollution levels and high population densities. During the research period, Xuzhou City experienced the largest increase in premature deaths from short-term O3 exposure, with a total of 711 deaths—reflecting a growth rate of nearly 300%. This trend correlates with the city’s 66.27% rise in O3 concentrations over the past five years. Nanjing, Suzhou, and Wuxi followed, with, the number of premature deaths attributed to O3 exposure increasing by 146.72%, 106.39%, and 101.16%, respectively, between 2018 and 2023. In Changzhou City, the annual average O3 concentration in 2023 exceeded the 2018 level by 3.55 μg/m3, leading to a notable increase in premature deaths compared to 2018. Yangzhou City, which has a smaller population and better air quality, recorded the lowest number of premature deaths from short-term O3 exposure. Notably, 2020 is the highest annual average O3 concentration, corresponding with the peak number of premature deaths related to O3 exposure, estimated at approximately 170 individuals.
We conducted a Haussmann test on the resulting data to assess the model’s effectiveness. The results indicate a p-value of 0.031, significantly rejecting the null hypothesis at the 5% level, which supports the use of a REM. We utilized this model to perform regression analyses on the statistical data, and the similarities in coefficient and Z-Statistic results indicate the robustness of the data. The overall R2 value for both models exceeds 90%, although the inter-group R2 value of the fixed effects model is lower than the intra-group R2 value. There may be omitted explanatory variables; however, as these variables are not addressed by the economic theory presented in this study, the REM is deemed generally applicable. The F-statistic is 22.31, with a corresponding p-value of 0.031, which demonstrates significant differences in the data and passes the significance test (see Table 7).
Indicators directly related to air pollution, such as the concentration of air pollution, duration of air pollution, and coverage of air pollution, have the most substantial influence on long-term changes in health effects. Conversely, the local average income of a city does not significantly affect residents’ health effects. This finding diverges from existing research [26,27]. A potential explanation is that there are many factors associated with the average income of residents, which are jointly influenced by factors such as the total local population, labor return rate, and employment rate [28]. In addition, the indicator of urban medical service capacity in the random effects model reveals significant differences between cities, especially in the number of high-level medical institutions, with a significance level of 1%. The population structure, age structure, proportion of chronic patients, and family structure are significant at the 10% and 5% levels, respectively (Table 7). It is worth noting that the proportion of chronic patients and the family structure coefficients are positive, while the age structure coefficient is negative. This is consistent with existing research, indicating that the population health effects in different regions are positively correlated with the proportion of local chronic disease patients and family caregiving capacity and negatively correlated with age structure [29].
Studies have shown that the higher the city level, the higher the degrees of industrialization and urbanization, and the more severe the air pollution problem, which in turn has negative effects on the health of local residents. In addition, some scholars have found that the development of urban polycentricism has an “inverted U-shaped” impact on air pollution levels. In the early stage of polycentricism, the separation of work and residence in cities intensifies, energy consumption increases, and air pollution worsens. But when the degree of decentralization exceeds a certain threshold, the balance between work and residence improves, energy consumption decreases, and air pollution is reduced [18,31]. The impact of population structure (such as aging, youthfulness, etc.) on air pollution and health varies. For example, areas with higher levels of aging may be more sensitive to the health risks of air pollution, as older people are more susceptible to the negative effects of air pollution [23].
The premature mortality data regarding the relation of stroke, ischemic heart disease (IHD), chronic obstructive pulmonary disease (COPD), and lung cancer (LC) to long-term exposure to PM2.5 in Jiangsu Province from 2018 to 2023 are shown in Figure 12. Mortality due to cardiovascular disease mortality (CVD), respiratory disease mortality (RD), ischemic heart disease (IHD), chronic obstructive pulmonary disease (COPD), cerebrovascular disease (stroke), and lung cancer (LC) was analyzed. The total number of premature deaths due to long-term PM2.5 exposure in Jiangsu Province declined from 126,880 (95% CI) in 2018 to 118,900 (95% CI) in 2023, with the proportion of deaths decreasing from 20.51% to 17.99%.
The spatial variation in premature mortality caused by long-term exposure to PM2.5 is illustrated in Figure 13. The cities with the highest premature mortality rates were primarily located in southern Jiangsu Province, including Nantong, Nanjing, Suzhou, and Xuzhou.
As shown in Figure 14, the number of premature deaths related to long-term O3 exposure in various regions of Jiangsu Province increased from 2018 to 2023. The spatial variation in premature deaths was significant, and the spatial distribution pattern closely mirrored O3 concentration levels. Among the affected areas, high-value regions for premature deaths were cities such as Suzhou, Wuxi, Suzhou, and Xuzhou, with the affected range gradually expanding. Among all cities in Jiangsu Province, the annual average O3 DMA8 concentration in Nanjing (from 2018 to 2023) and Suzhou (from 2020 onward) remained below the threshold selected in this study (70 μg/m3). Therefore, these cities do not face health risks from O3 exposure. Taizhou City experienced the largest increase in premature deaths, with a growth rate of approximately 182.2%, followed by Suzhou (127.40%) and Xuzhou (131.22%). Nanjing, with its large population and high rate of O3 concentration growth, had the highest number of premature deaths due to long-term O3 exposure, increasing from 892 in 2018 to 1540 in 2023.

4. Discussion

4.1. Total Number of Premature Deaths Under Long-Term Exposure to PM2.5 Has Decreased by Approximately 87%

The indicators of premature deaths under long-term exposure show that Jiangsu Province has effectively controlled particulate matter pollution, which significantly reduced residents’ health risks. In 2020, there was a slight decline in pollution-related premature deaths in both Nanjing and Jiangsu provinces. Compared to existing statistical data, this may be attributed to the significantly lower baseline mortality in 2020 compared to other years. From 2018 to 2023, the number of premature deaths caused by long-term PM2.5 exposure in Wuxi, Nanjing, and southern Jiangsu Province declined by 4.83%, 4.80%, and 6.68%, respectively. However, during the same period, the number of premature deaths in Suzhou City slightly increased, likely due to rapid population growth. With the continuous and significant decrease in PM2.5 levels, the number and proportion of premature deaths are expected to gradually decline from 2018 to 2023. Among all health risks, stroke remains the leading cause of premature death, accounting for an average of approximately 50.85%. Other significant causes include IHD (27.36%), COPD (10.72%), and LC (11.07%). This conclusion is consistent with previous studies, which found that stroke, IHD, COPD, and LC accounted for approximately 50%, 30%, 11%, and 9% of cases, respectively [26].
Overall, while PM2.5-related premature deaths remained high, the internal spatial variation across the province was not significant. Among all cities, Nanjing, Wuxi, and Nantong experienced the largest reductions in premature deaths, with 1637, 1355, and 1092 fewer deaths, respectively. The highest declining rates were observed in Suzhou (12.93%) and Xuzhou (11.66%), indicating that pollution control measures in relatively clean areas can still yield substantial long-term health benefits. This finding aligns with international research, which has also confirmed this perspective [27].

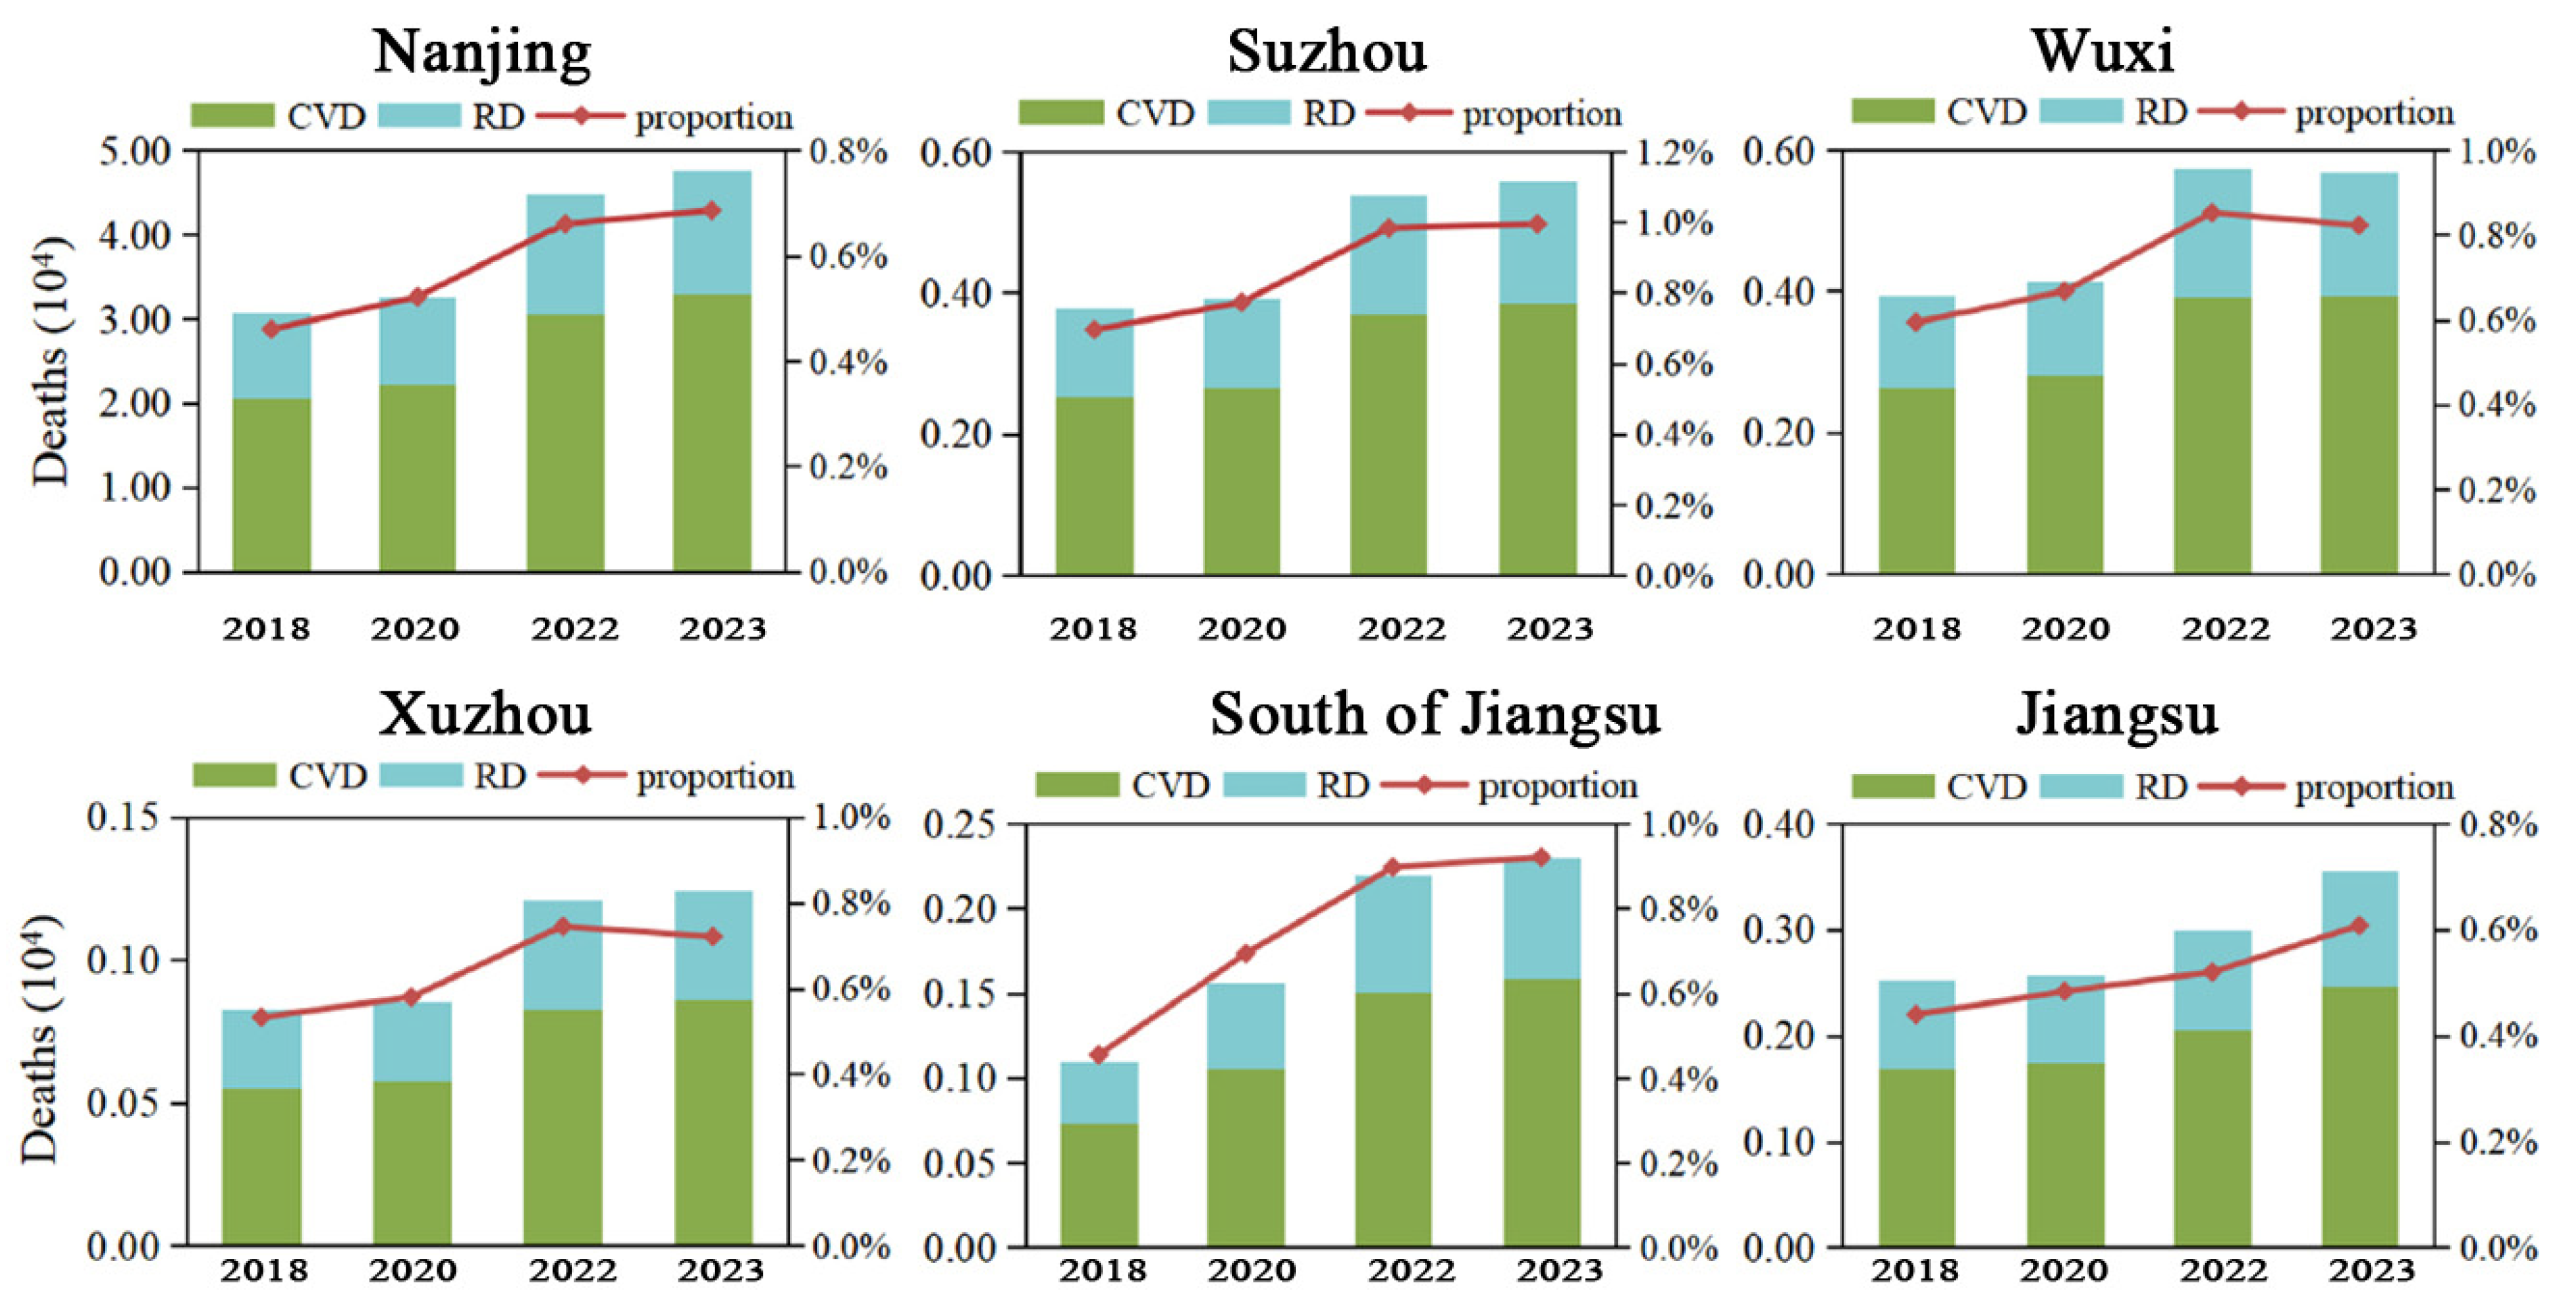
4.2. Total Number of Premature Deaths Under Long-Term Exposure to O3 Has Increased by Approximately 216%

The internal variation in premature deaths caused by long-term exposure from 2018 to 2023 followed the opposite trend of PM2.5-related deaths, showing a significant increase, as illustrated in Figure 12. The total number of premature deaths caused by long-term O3 exposure in Jiangsu Province rose from 3526 (95% CI) in 2018, accounting for 0.57% of total deaths, to 11,164 (95% CI) in 2023, accounting for 1.69%. The represents an approximate 216.62% increase in affected individuals.
From 2018 to 2023, due to the combined effects of O3 pollution, population growth, and increased baseline mortality, the number of premature deaths caused by long-term O3 exposure in Nanjing, Suzhou, and southern Jiangsu Province rose sharply, increasing by 437, 906, and 6294 premature deaths, respectively. The growth rates in Xuzhou City and Jiangsu Province were particularly significant, with increases of 366.00% and 252.29%, respectively. The proportions of premature deaths related to long-term O3 exposure in Wuxi City and Jiangsu Province are expected to rise from 0.29% and 0.53% in 2018 to 1.67% and 1.75% in 2023, respectively. In 2020, Jiangsu Province experienced severe O3 pollution, leading to an increase of approximately 886 premature deaths compared to 2018. Notably, the number of premature deaths associated with long-term O3 exposure remained significantly lower than those linked to long-term PM2.5 exposure, which may be due to differences in calculation methods. Additionally, previous studies have indicated that the negative risk (DD) associated with PM2.5 exposure is much higher than zero [28]. The relative health risks of O3 exposure are influenced by multiple factors and depend on further authoritative epidemiological research [29].

4.3. Short-Term Exposure to High Concentrations of Pollutants Has a Significant Impact on the Health of Individuals with Underlying Diseases

We focused on analyzing the changes in premature deaths related to short-term exposure among urban populations in Jiangsu Province from 2018 to 2023 under environmental exposure levels of the daily average PM2.5 concentration and maximum eight-hour average daily O3 concentration. The short-term time series results revealed the types of premature mortality risks associated with exposure to PM2.5, O3, cardiovascular disease (CVD), respiratory disease (RD), and total mortality. The parameter selection for different disease risks is presented in Table 3. Among them, for every 10 μg/m3 increase in PM2.5 concentration, the relative risk of premature death from cardiovascular disease due to short-term exposure to PM2.5 pollution is 1.0008 (95% CI: 1.0005–1.0091), the relative risk of premature death from respiratory diseases is 1.0022 (95% CI: 1.0028–1.011), and the relative risk of all-cause death is 1.001 O3 (95% CI: 1.0022–1.0059). For every 10 μg/m3 increase in O3 concentration, the relative risk of premature death from cardiovascular disease due to short-term exposure to O3 pollution is 1.0027 (95% CI: 1.001–1.0044), the relative risk of premature death from respiratory disease is 1.0051 (95% CI: 1.0042–1.0098), and the relative risk of all-cause mortality is 1.0024 O3 (95% CI: 1.0013–1.0).
Studies have shown that PM2.5 and O3 have a complex relationship as they share common precursors and interact with each other in the atmosphere. O3 provides oxidants such as DH, H2O2, and RCHO, which are required for the formation of secondary aerosols in photochemical processes. This indirectly affects the formation and growth of secondary aerosol particles in PM2.5 by influencing atmospheric oxidation characteristics [6]. Additionally, under the action of oxidants, SO2, NOX, and VOCS generate SCU2 through gas-phase, liquid-phase chemical, and heterogeneous chemical reactions with NO and substances such as O3 and secondary organic aerosols (SOA). As the O3 concentration continues to rise and atmospheric oxidation intensifies, the proportion of secondary PM2.5 will increase significantly [8]. Aerosol particles can alter their optical thickness, affecting the intensity of sunlight radiation reaching the ground. Attenuation can reduce O3 generation. However, aerosols scatter solar radiation, increasing radiation flux and intensity within the boundary layer. When aerosol concentrations rise moderately, the photolysis rate of NO2 on the aerosol surface increase, which is favorable for O3  formation [9]. Furthermore, aerosols indirectly affect the O3 concentration near the ground by influencing factors such as cloud optical thickness, effective cloud droplet radius, and cloud droplet number concentration [10].
From the spatial distribution of premature deaths caused by short-term exposure to O3 and PM2.5 pollution in 13 cities in Jiangsu Province, it is evident that in 2018, all cities except Changzhou were primarily affected by PM2.5 exposure-related health losses, placing them in the “PM2.5 health control zone”. The proportion of premature deaths caused by short-term PM2.5 exposure in this city was significantly higher than the negative health effects caused by O3. Notably, in cities such as Nanjing, Suzhou, Wuxi, and Xuzhou, the proportion of PM2.5-related premature deaths exceeded 0.02%. These cities also ranked among the most severely PM2.5-polluted cities in eastern China during this period. The industrial structure of these cities is imbalanced with high pollutant emissions per unit area, placing immense pressure on air quality. Although PM2.5 and O3 pollution in areas such as Changzhou, Yangzhou, and Taizhou are relatively mild, the negative health impacts of PM2.5 exposure remain significant. Over time, with the implementation of multiple pollutant control measures, most cities in Jiangsu Province transitioned from “PM2.5 health control zones” to “O3 health control zones”.
The health risks posed by O3 exposure have now surpassed those of PM2.5 exposure in most cities. By 2023, the proportion of premature deaths caused by O3 exposure in most cities is projected to increase significantly. Compared to 2018, the proportion of premature deaths related to PM2.5 exposure decreased from 0.03% to 0.01%, whereas the proportion of O3-related premature deaths increased from 0.007% to 0.0085%. This shift is strongly correlated with particulate matter control measures, a decline in the annual average PM2.5 concentration, and a notable increase in O3 levels. Additionally, cities such as Nanjing, Suzhou, Wuxi, and Xuzhou continue to experience significant negative health effects from PM2.5 exposure, and their air pollution characteristics remain distinct. Moving forward, efforts should be focused on strengthening the coordinated control of PM2.5 and O3 pollution to mitigate severe air quality impacts.

4.4. Long-Term Exposure Values of Pollutants Can Better Reflect the Overall Health Burden of Populations Experiencing Long-Term Exposure

In recent years, with the continuous advancement of environmental epidemiological research, scholars have developed the Integrated Exposure Response (IER) model to assess the relative risk of comprehensive exposure to PM2.5. This model integrates relative risk information from atmospheric air pollution, household cooking fuel combustion, active smoking, and passive second-hand smoke exposure. The results obtained at low exposure concentrations were combined with those at high exposure concentrations using a universal equation [15]. Researchers have updated the relevant parameters of the IER model based on the latest epidemiological findings, making it more aligned with current environmental and health conditions [16]. However, some studies suggested that the IER model may underestimate health impacts and lacks an analysis of other factors contributing to premature mortality [17]. In 2018, scholars introduced another concentration response function for long-term PM2.5 exposure, known as the Global Exposure Mortality Model (GEMM) [18]. Their research indicated that the accuracy of premature death estimated from the IER model for long-term PM2.5 exposure was approximately 61% lower than the estimates derived from the GEMM [19]. Some studies have applied both the GEMM and IER to assess the health effects of pollution transmission outside China. The results showed that, when considering the same disease types, the GEMM yielded slightly higher estimates than the IER model, although the difference was not significant [20].
Overall, short-term exposure to high pollutant concentrations has a significant impact on individuals with underlying health conditions, who are more susceptible to the effects of daily peak pollutant levels. In contrast, long-term pollutant exposure better reflects the overall health burden on a population overtime. Epidemiological studies have shown that for every 10 ppb (approximately 20 μg/m3) increase in O3 concentration, the relative risk of premature death from cardiovascular disease due to long-term O3 exposure is 1.01 (95% CI: 1.000–1.020), while the relative risk of premature death from respiratory diseases is 1.04 (95% CI: 1.013–1.067). However, for PM2.5, unlike short-term exposure studies, the updated IER equation [21] integrates data from multiple concentration ranges, making it more relevant to China’s air pollution conditions.
Some scholars have conducted comparative analyses of the exposure levels and risks of atmospheric pollution exposure levels and associated risks. The long-term distribution of pollution exposure patterns reflects the overall changes in regional air quality. Therefore, some studies employed a third-generation air quality modeling system, the Weather Research and Forecasting Community Multi scale Air Quality (WRF-CMAQ) model. The WRF model provides meteorological field data necessary for the physical and chemical transformations of atmospheric pollutants. The Meteorological Chemistry Interface Processor (MCIP) module in CMAQ converts the meteorological data obtained from the WRF simulation into the required formats and integrates it with pollutant emission source data. These data are then used in the CCTM module to simulate transmission, diffusion, chemical conversion, and dry–wet deposition, forming a comprehensive meteorological chemical transport modeling system.
Using WRF-CMAQ simulation results, combined with county-level population data, researchers estimated that in 2020, approximately 61.17% of the global population was exposed to high O3 concentrations. Among them, about 1.38 million people were exposed to pollution below 60 tons/m3, accounting for only 0.104%. These findings indicate that O3 pollution remains a serious environmental issue with widespread impacts, posing significant health risks that cannot be ignored [22]. Studies have also shown that, since the implementation of the 2023 air pollution prevention and control policy, the total number of people in mainland China living in areas that meet national air quality standards has increased by 225 million (16.9%). Additionally, changes in the short-term pollutant exposure distribution reflect the effectiveness of emergency emission control measures and trends in the frequency of heavy pollution days. Between 2018 and 2023, the frequency of PM2.5 pollution events declined by 0.219 times per year.

5. Conclusions

5.1. Key Findings

(1) There are significant spatiotemporal variations in PM2.5 and O3 pollution concentrations in Jiangsu Province. PM2.5 concentrations have significantly decreased, while O3 concentrations have increased annually. Since the implementation of the APPCAP policy, the annual average PM2.5 concentration in Jiangsu Province decreased from 105.88 μg/m3 in 2020 to 55.04 μg/m3 in 2023, a reduction of approximately 48.01%. The decreases in PM2.5 levels in Nanjing, Suzhou, and Xuzhou were close to 50%, with reductions of 48.01%, 42.11%, and 48.71%, respectively. In terms of spatial distribution, PM2.5 pollution has been well controlled, but regional O3 concentrations have increased annually, with an expanding pollution range. The spatial distribution of PM2.5 and O3 is similar, with heavy pollution mainly occurring in industrially developed cities in the southern region of Jiangsu Province (such as Nanjing, Wuxi, and Suzhou), while lower concentrations are found in central cities such as Changzhou and Yangzhou.
(2) Exposure to PM2.5 and O3 pollution has a significant impact on human health. The positive health effects of reduced PM2.5 concentrations outweigh the negative health effects of increased O3 pollution, and short-term emergency measures can significantly reduce the health burden. The number of premature deaths caused by long-term exposure to pollutants in Jiangsu Province from 2018 to 2023 is significantly higher than that caused by short-term exposure. However, the decrease in premature deaths due to short-term PM2.5 exposure (64.49%) was significantly higher than that due to long-term PM2.5 exposure (6.25%). This indicates that short-term emergency measures can effectively mitigate PM2.5 pollution and significantly reduce the health burden. Therefore, it is crucial to coordinate the control of PM2.5 and O3 pollution. Reducing the frequency of heavy pollution events and lowering long-term average concentrations are critical for protecting human health.
(3) The health burden caused by O3 exposure has increased at a higher rate compared to PM2.5. City level (2.377**) and population structure (1.068**) play an important role in the health effects under air pollution. From 2018 to 2023, the growth rate of premature deaths related to long-term O3 exposure in various cities in Jiangsu Province was 216.62%, while the growth rate for short-term exposure was 76.36%. Additionally, the health benefits of decreasing PM2.5 levels significantly outweigh the negative health effects of rising O3 concentrations. The total number of premature deaths related to short-term PM2.5 exposure in Jiangsu Province decreased from 18,998 in 2018 (accounting for 3.07% of total deaths that year) to 6746 in 2023 (1.02%), a reduction of 64.49%. In contrast, by 2023, premature deaths related to short-term O3 exposure increased by 76.36% compared to 2018.

5.2. Implications

This study did not consider factors such as population sex, age structure, or other potential social variables when calculating the health burden associated with pollutant exposure, which may have increased result uncertainty. Future research should incorporate more comprehensive and detailed baseline data to quantify health risks across different age groups and sexes. Additionally, while this study refined population distribution to a grid for city-level comparisons, it did not account for population mobility. Future studies can leverage Big Data analysis to evaluate dynamic population changes and their corresponding health risks and economic losses. Due to the limitations of epidemiological research and the “exposure response” function, this study analyzed PM2.5 and O3 as separate pollutants without considering their interrelationships. However, in reality, these two pollutants have a synergistic effect on certain diseases, requiring further in-depth research.

5.3. Limitations and Future Research Directions

This study also simulated pollutant concentration changes under various emission reduction scenarios in Jiangsu Province from 2018 to 2023 without accounting for feedback effects of pollutant concentration changes on meteorology. Future studies should conduct a quantitative analysis of anthropogenic emissions and meteorological contributions from various sectors. Building on this, a bidirectional feedback mechanism can be established to optimize predictions [37]. Furthermore, given limited computing resources and data constraints, this study did not develop localized, detailed emission-reduction scenarios. In future research, we will combine the sensitivity characteristics of PM2.5 and O3 to changes in pollutant emissions [38]. Our study can incorporate refined emission reduction plans and apply sensitivity numerical analysis methods to quantify the response surfaces of PM2.5 and O3 concentrations to precursors, as well as the resulting changes in premature mortality and health-related economic losses due to exposure [39].

Author Contributions

Conceptualisation, J.Y. and Q.J.; Data curation, Q.J. and Y.C.; Formal analysis, S.C.; Methodology, J.Y.; Visualisation, J.Y.; Writing—original draft, J.Y.; Writing—review and editing, C.X. All authors have read and agreed to the published version of the manuscript.

Funding

This research was funded by the Jiangsu Provincial Social Science Fund (Grant No. 23GLC009) and the National Natural Science Foundation of China (Grant No. 41901167).

Institutional Review Board Statement

Not applicable.

Informed Consent Statement

Not applicable.

Data Availability Statement

The data presented in this study are available on request from the corresponding author. The data are not publicly available due to the data involves the personal privacy and identity information of the investigated individuals.

Conflicts of Interest

Author Chen Xu was employed by the company Jiangsu Provincial Planning and Design Group. The remaining authors declare that the research was conducted in the absence of any commercial or financial relationships that could be construed as a potential conflict of interest. The Jiangsu Provincial Planning and Design Group had no role in the design of the study; in the collection, analyses, or interpretation of data; in the writing of the manuscript, or in the decision to publish the results.

References

  1. Chee, F.P.; Ooi, C.G.; Wong, Y.J.; Sentian, J.; Dayou, J.; Latif, M.T. Modelling climatic variable impacts on ground-level ozone in Malaysia using backward trajectory and generative additive models. Int. J. Environ. Sci. Technol. 2025, 22, 6021–6048. [Google Scholar]
  2. Miyazaki, A.; Komazawa, S.; Ogata, S. Dissolved concentration and lifetime of ozone ultrafine bubbles. J. Phys. D Appl. Phys. 2025, 58, 045207. [Google Scholar]
  3. Carlos, N.; Jacinto, R.L.; Santos, M.S. Potential of drying carrot using ozone pre-treatment: Mass transfer modeling and techno-functional properties. Food Bioprod. Process. Trans. Inst. Chem. Eng. Part C 2024, 146, 1772–1783. [Google Scholar]
  4. Dececco, A.C.; Conrad, A.R.; Floyd, A.M.; Jasper, A.W.; Hansen, N.; Dagaut, P. Tracking the reaction networks of acetaldehyde oxide and glyoxal oxide criegee intermediates in the ozone-assisted oxidation reaction of croton aldehyde. PCCP 2024, 26, 19–23. [Google Scholar]
  5. Isaacman-Vanwertz, G.; Frazier, G.; Willison, J.; Faiola, C. Missing measurements of sesquiterpene ozonolysis rates and composition limit understanding of atmospheric reactivity. Environ. Sci. Technol. ES&T 2024, 3, 58–66. [Google Scholar]
  6. He, Y.; Zhang, P.; Yang, J.; Wang, S.; Li, J. Fabrication of mno2 coating on aluminum honeycomb for fast catalytic decomposition of ozone at room temperature. J. Environ. Sci. 2023, 177, 34–43. [Google Scholar]
  7. Belz, D.C.; Woo, H.; Putcha, N.; Paulin, L.M.; Koehler, K.; Fawzy, A. Ambient ozone effects on respiratory outcomes among smokers modified by neighborhood poverty: An analysis of spiromics air. Sci. Total Environ. 2022, 38, 829. [Google Scholar]
  8. Wang, Z.T.; Yang, Y.C.; Zeng, S.S.; Arowo, M.; Zhang, X.Q.; Zheng, B.D. Treatment of organic wastewater by ozone in a continuous rotating solid foam stirrer tank. Chem. Eng. Process. Process Intensif. 2022, 174, 108866. [Google Scholar]
  9. Dedoussi, I.C.; Eastham, S.D.; Monier, E.; Barrett, S.R.H. Premature mortality related to United States cross-state air pollution. Nature 2020, 578, 261–265. [Google Scholar] [CrossRef]
  10. Feng, Z.Z.; De Marco, A.; Anav, A.; Gualtieri, M.; Sicard, P.; Tian, H.Q.; Fornasier, F.; Tao, F.L.; Guo, A.H.; Paoletti, E. Economic losses due to O3 impacts on human health, forest productivity and crop yield across China. Environ. Int. 2019, 131, 104966. [Google Scholar] [CrossRef]
  11. Gong, D.; Du, N.; Wang, L.; Deng, X.; Zhang, X.; Yang, L. Impacts of meteorological and precursor emission factors on pm2.5 and o3 from 2019 to 2022: Insights from multiple perspectives. Atmos. Res. 2025, 315, 120–129. [Google Scholar] [CrossRef]
  12. Gu, Y.; Wong, T.W.; Law, C.K.; Dong, G.H.; Ho, K.F.; Yang, Y.; Yim, S.H.L. Impacts of sectoral emissions in China and the implications: Air quality, public health, crop production, and economic costs. Environ. Res. Lett. 2018, 13, 084–096. [Google Scholar] [CrossRef]
  13. Huang, J.; Pan, X.C.; Guo, X.B.; Li, G.X. Health impact of China’s Air Pollution Prevention and Control Action Plan: An analysis of national air quality monitoring and mortality data. Lancet Planet Health 2018, 2, e313–e323. [Google Scholar] [CrossRef]
  14. Hu, W.; Zhao, Y.; Lu, N.; Wang, X.; Zheng, B.; Henze, D.K. Changing responses of pm2.5 and ozone to source emissions in the Yangtze river delta using the adjoint model. Environ. Sci. Technol. 2024, 58, 11. [Google Scholar] [CrossRef]
  15. Chen, Z.; Sun, L.; Huang, L.; Xie, Y.; Yang, S.; Sun, L. Inequality of exposure to pm2.5 and ozone among age groups and cities in Japan in 2030 and 2050. Microelectron. J. 2024, 55, 122–132. [Google Scholar] [CrossRef]
  16. Li, K.; Jacob, D.J.; Liao, H.; Shen, L.; Zhang, Q.; Bates, K.H. Anthropogenic drivers of 2013-2017 trends in summer surface O3 in China. Proc. Natl. Acad. Sci. USA 2019, 116, 422–427. [Google Scholar] [CrossRef]
  17. Li, M.; Wang, L.; Liu, J.; Gao, W.; Song, T.; Sun, Y. Exploring the regional pollution characteristics and meteorological formation mechanism of PM2.5 in North China during 2013–2017. Environ. Int. 2020, 134, 105283. [Google Scholar] [CrossRef]
  18. Liang, S.; Li, X.L.; Teng, Y.; Fu, H.C.; Chen, L.; Mao, J.; Zhang, H.; Gao, S.; Sun, Y.L.; Ma, Z.X.; et al. Estimation of health and economic benefits based on O3 exposure level with high spatial-temporal resolution by fusing satellite and station observations. Environ. Pollut. 2019, 255, 113267. [Google Scholar] [CrossRef]
  19. Lin, Y.Y.; Jiang, F.; Zhao, J.; Zhu, G.; He, X.J.; Ma, X.L.; Li, S.; Sabel, C.E.; Wang, H.K. Impacts of on premature mortality and crop yield loss across China. Atmos. Environ. 2018, 194, 41–47. [Google Scholar] [CrossRef]
  20. Liu, H.; Liu, S.; Xue, B.R.; Lv, Z.F.; Meng, Z.H.; Yang, X.F.; Xue, T.; Yu, Q.; He, K.B. Ground-level O3 pollution and its health impacts in China. Atmos. Environ. 2018, 173, 223–230. [Google Scholar] [CrossRef]
  21. Lu, X.; Hong, J.Y.; Zhang, L.; Cooper, O.R.; Schultz, M.G.; Xu, X.B.; Wang, T.; Gao, M.; Zhao, Y.H.; Zhang, Y.H. Severe surface O3 pollution in China: A global perspective. Environ. Sci. Technol. Lett. 2018, 5, 487–494. [Google Scholar] [CrossRef]
  22. Hu, Y.; Chao, K.; Zhu, Z.; Yue, J.; Qie, X.; Wang, M. A study on a health impact assessment and healthcare cost calculation of Beijing–Tianjin–Hebei residents under pm 2.5 and o 3 pollution. Sustainability 2024, 16, 1332–1339. [Google Scholar]
  23. Shu, L.; Wang, T.; Li, M.; Xie, M.; Liu, J. Optimizing emission control strategies for mitigating pm2.5 and o3 pollution: A case study in the Yangtze river delta region of eastern China. Atmos. Environ. 2024, 319, 12. [Google Scholar] [CrossRef]
  24. Maji, K.J. Substantial changes in PM2.5 pollution and corresponding premature deaths across China during 2015-2019: A model prospective. Sci. Total Environ. 2020, 729, 138838. [Google Scholar] [CrossRef]
  25. Maji, K.J.; Ye, W.F.; Arora, M.; Shiva Nagendra, S.M. PM2.5-related health and economic loss assessment for 338 Chinese cities. Environ. Int. 2018, 121, 392–394. [Google Scholar] [CrossRef]
  26. Maji, K.J.; Ye, W.F.; Arora, M.; Nagendra, S.M.S. O3 pollution in Chinese cities: Assessment of seasonal variation, health effects and economic burden. Environ. Pollut. 2019, 247, 792–801. [Google Scholar] [CrossRef]
  27. Malley, C.S.; Henze, D.K.; Kuylenstierna, J.C.I.; Vallack, H.W.; Davila, Y.; Anenberg, S.C.; Turner, M.C.; Ashmore, M.R. Updated global estimates of respiratory mortality in adults ≥30 years of age attributable to long-term O3 exposure. Environ. Health Perspect. 2017, 125, 087021. [Google Scholar] [CrossRef]
  28. Pope, C.A.; Cohen, A.J.; Burnett, R.T. Cardiovascular disease and fine particulate matter: Lessons and limitations of an integrated exposure-response approach. Circ. Res. 2018, 122, 1645–1647. [Google Scholar] [CrossRef]
  29. Kloster, M.E. Air pollution and stroke: What nurses need to know. Stroke 2024, 55, 6–11. [Google Scholar] [CrossRef]
  30. Seltzer, K.M.; Shindell, D.T.; Malley, C.S. Measurement-based assessment of health burdens from long-term O3 exposure in the United States, Europe, and China. Environ. Res. Lett. 2018, 13, 104018. [Google Scholar] [CrossRef]
  31. Cazorla, M.; Giles, D.M.; Herrera, E.; Suárez, L.; Estevan, R.; Andrade, M. Latitudinal and temporal distribution of aerosols and precipitable water vapor in the tropical andes from aeronet, sounding, and merra-2 data. Sci. Rep. 2024, 14, 67–73. [Google Scholar] [CrossRef] [PubMed]
  32. Song, C.B.; He, J.J.; Wu, L.; Jin, T.S.; Chen, X.; Li, R.P.; Ren, P.P.; Zhang, L.; Mao, H.J. Health burden attributable to ambient PM2.5 in China. Environ. Pollut. 2017, 223, 575–586. [Google Scholar] [CrossRef] [PubMed]
  33. Wu, Z.Y.; Zhang, Y.Q.; Zhang, L.M.; Huang, M.J.; Zhong, L.J.; Chen, D.H.; Wang, X.M. Trends of outdoor air pollution and the impact on premature mortality in the Pearl River Delta region of southern China during 2006–2015. Sci. Total Environ. 2019, 690, 248–260. [Google Scholar] [CrossRef] [PubMed]
  34. Xue, T.; Liu, J.; Zhang, Q.; Geng, G.N.; Zheng, Y.X.; Tong, D.; Liu, Z.; Guan, D.B.; Bo, Y.; Zhu, T.; et al. Rapid improvement of PM2.5 pollution and associated health benefits in China during 2013-2017. Sci. China Earth Sci. 2019, 62, 1847–1856. [Google Scholar] [CrossRef]
  35. Yao, M.H.; Wu, G.H.; Zhao, X.; Zhang, J.Y. Estimating health burden and economic loss attributable to short-term exposure to multiple air pollutants in China. Environ. Res. 2020, 183, 109184. [Google Scholar] [CrossRef]
  36. Yim, S.L.H.; Wang, M.Y.; Gu, Y.F.; Yang, Y.J.; Dong, G.H.; Li, Q.X. Effect of urbanization on O3 and resultant health effects in the Pearl River Delta region of China. J. Geophys. Res.—Atmos. 2019, 124, 11568–11579. [Google Scholar] [CrossRef]
  37. Chikamoto, Y.; Zhang, W.; Hipps, L.W.; Simon, R.B. Interannual variability and trends of summertime pm2.5-based air quality in the intermountain west. Environ. Res. Lett. 2023, 18, 78–83. [Google Scholar] [CrossRef]
  38. Zhai, S.X.; Jacob, D.J.; Wang, X.; Shen, L.; Li, K.; Zhang, Y.Z.; Gui, K.; Zhao, T.L.; Liao, H. Fine particulate matter (PM2.5) trends in China, 2013–2018: Separating contributions from anthropogenic emissions and meteorology. Atmos. Chem. Phys. 2019, 19, 11031–11041. [Google Scholar] [CrossRef]
  39. Zhang, N.N.; Ma, F.; Qin, C.B.; Li, Y.F. Spatiotemporal trends in PM2.5 levels from 2013 to 2017 and regional demarcations for joint prevention and control of atmospheric pollution in China. Chemosphere 2018, 210, 1176–1184. [Google Scholar] [CrossRef]
Figure 1. The location of Jiangsu Province and the study area.
Atmosphere 16 00446 g001
Figure 2. Framework of this study.
Atmosphere 16 00446 g002
Figure 3. The number of permanent urban residents in Jiangsu Province from 2018 to 2023 (unit: 10,000 people).
Atmosphere 16 00446 g003
Figure 4. Annual trends in PM2.5 and O3 mass concentrations in Jiangsu Province from 2018 to 2023.
Atmosphere 16 00446 g004
Figure 5. Trend in PM2.5 concentration changes in various cities within Jiangsu Province from 2018 to 2023.
Atmosphere 16 00446 g005
Figure 6. Trend in O3 concentration changes in various cities within Jiangsu Province from 2018 to 2023.
Atmosphere 16 00446 g006
Figure 7. Spatial distribution pattern of PM2.5 and O3 concentrations in various cities within Jiangsu Province from 2018 to 2023.
Atmosphere 16 00446 g007
Figure 8. Premature deaths attributable to short-term PM2.5 exposure from 2018 to 2023.
Atmosphere 16 00446 g008
Figure 9. Spatial distribution of premature deaths attributed to short-term PM2.5 exposure in Jiangsu Province from 2018 to 2023.
Atmosphere 16 00446 g009
Figure 10. Premature deaths attributable to short-term O3 exposure from 2018 to 2023.
Atmosphere 16 00446 g010
Figure 11. Spatial distribution of premature deaths attributed to short-term O3 exposure in Jiangsu Province from 2018 to 2023.
Atmosphere 16 00446 g011
Figure 12. Premature deaths attributable to long-term PM2.5 (a) and O3 (b) exposure from 2018 to 2023.
Atmosphere 16 00446 g012
Figure 13. Spatial distribution of premature deaths attributed to long-term PM2.5 exposure in Jiangsu Province from 2018 to 2023.
Atmosphere 16 00446 g013
Figure 14. Spatial distribution of premature deaths attributed to long-term O3 exposure in Jiangsu Province from 2018 to 2023.
Atmosphere 16 00446 g014
Table 1. Baseline mortality data for various cities in Jiangsu Province from 2018 to 2023 (unit: B0 × 10−5).
All CauseCVDRDIHDStrokeCOPDLC
2018638.39288.7676.9299.72139.3259.1842.95
2019640.12297.5377.18108.43135.8257.2344.32
2020642.26281.3778.54112.72140.2360.3246.08
2021616.18275.8969.31114.74126.7249.3348.33
2022648.39294.2373.88118.66142.0855.6747.18
2023662.52308.1872.45126.68144.5654.8648.31
Note: Cardiovascular disease (CVD) mortality rate, respiratory disease (RD) mortality rate, ischemic heart disease (IHD), chronic obstructive pulmonary disease (COPD), cerebrovascular disease (stroke), and lung cancer (LC).
Table 2. Statistical data on air quality index and various substantial pollution indicators in Nanjing.
Variable (Unit)DescriptionMean/DayVarianceMinimum ValueMaximum Value
AQI (value)Daily air quality index67.1227.7819.32123.31
PM2.5 (μg/m3)Mass concentrations of particulate matter with aerodynamic equivalent diameter less than or equal to 2.5 μm72.2822.8721.14117.91
PM10 (μg/m3)Mass concentrations of particulate matter with aerodynamic equivalent diameter less than or equal to 10 μm81.1521.3131.29109.34
CO (mg/m3)Mass concentrations of carbon monoxide 3.980.182.724.98
NO2 (μg/m3)Mass concentrations of nitrogen dioxide36.159.1828.8149.12
O3 (μg/m3)Mass concentrations of O372.2826.7239.5691.32
SO2 (mg/m3)Mass concentrations of sulfur dioxide 83.3818.7265.34178.33
Table 3. The indicator variable system included in the regression model.
Dependent VariableExplanatory VariableSecondary IndicatorVariable Interpretation (Unit)
Health effectsAir PollutionConcentration of air pollution
(PM2.5 and O3)
Annual average emissions of core indicators (μg/m3)
Duration of air pollution
(PM2.5 and O3)
Duration of high concentration of pollution per year (days)
Coverage of air pollution
(PM2.5 and O3)
Proportion of high-pollution areas in total administrative area (%)
City LevelTotal economic developmentRegional Gross Domestic Product (1 billion)
Local average incomePer-capita income level of each city (yuan)
Medical service capabilityNumber of high-level hospitals in each city (number)
Population StructureAge structureProportion of elderly people aged 60 and above (%)
Chronic patientsProportion of people with chronic diseases (%)
Family formationProportion of individuals living alone (%)
Table 4. Reliability analysis of influencing factors.
FactorCorbach’s Alpha ValueStandardized
Corbach’s Alpha Value
Air pollution concentration0.8820.901
Duration of air pollution0.8750.823
Coverage of air pollution0.7920.822
Total economic development0.7230.746
Local average income0.7030.753
Medical service capability0.6890.781
Age structure0.7520.821
Chronic patients0.7360.796
Family formation0.8130.827
Table 5. Classification of autocorrelation test statistics.
Z-Scorep-ValueConfidence Level (%)
<−1.55 or >1.55<0.190
<−1.86 or >1.86<0.0595
<−2.68 or >2.68<0.0199
Table 6. Parameters used for health risk assessment models.
Exposure TypeContaminantsMethodHealth RisksRRβC0(μg/m3)
Short-termO3Equation (7)Total1.0031 (95%CI)—10 μg/m30.0024 (95%CI)70
(WHO)
CVD1.0008 (95%CI)—10 μg/m30.0027 (95%CI)
RD1.0022 (95%CI)—10 μg/m30.0051 (95%CI)
PM2.5Total1.0052 (95%CI)—10 μg/m30.0014 (95%CI)35
(secondary
standard)
CVD1.0038 (95%CI)—10 μg/m30.0064 (95%CI)
RD1.0024 (95%CI)—10 μg/m30.0058 (95%CI)
Long-termO3Equation (8)CVD1.0139 (95%CI)—10 ppb0.0062 (95%CI)70
(WHO)
RD1.0096 (95%CI)—10 ppb0.0071 (95%CI)
PM2.5IHD0.842 (95%CI)—10 μg/m30.0058 (95%CI)6.92
Stroke1.031 (95%CI)—10 μg/m30.0051 (95%CI)8.12
COPD19.32 (95%CI)—10 μg/m30.0048 (95%CI)7.33
LC135.2 (95%CI)—10 μg/m30.0039 (95%CI)7.19
Note: 95% CI represents 95% confidence interval.
Table 7. Results of random effects models.
First Level IndicatorExplanatory VariablesRandom Effects Model
CoefficientZ-Statisticp-Value
Air PollutionConcentration of air pollution2.4773.3410.001 ***
Duration of air pollution2.3812.7650.001 ***
Coverage of air pollution1.4232.9220.001 ***
City LevelTotal economic development0.0160.9410.049 **
Local average income0.4770.2980.14
Medical service capability2.4530.3310.044 **
Population StructureAge structure−0.3614.8010.073 *
Chronic patients0.7810.9120.021 **
Family formation0.0236.2010.032 **
Constant7.0642.136/
R2Inter-group0.357
Within group0.912
Total R20.906
F-statistic22.31
Hausman test p-value0.031
Note: *, **, and *** represent significance at the 10%, 5%, and 1% levels, respectively.
Disclaimer/Publisher’s Note: The statements, opinions and data contained in all publications are solely those of the individual author(s) and contributor(s) and not of MDPI and/or the editor(s). MDPI and/or the editor(s) disclaim responsibility for any injury to people or property resulting from any ideas, methods, instructions or products referred to in the content.

