Article

An Assessment of the Impact of Climate Change on Maize Production in Northern Mexico

by
Nuria Aide López Hernández
1,*,
Aldo Rafael Martínez Sifuentes
1,
Wiktor Halecki
2,
Ramón Trucíos Caciano
1,* and
Víctor Manuel Rodríguez Moreno
1
1
National Center for Disciplinary Research in the Relationship Water, Soil, Plant, and Atmosphere, National Institute of Agricultural and Livestock Forestry Research (INIFAP CENID-RASPA), Km. 6.5 Margen Derecha Canal de Sacramento, Gomez Palacio 35079, Mexico
2
Institute of Technology and Life Sciences—National Research Institute, Falenty, Al. Hrabska 3, 05-090 Raszyn, Poland
*
Authors to whom correspondence should be addressed.
Atmosphere 2025, 16(4), 455; https://doi.org/10.3390/atmos16040455
Submission received: 18 March 2025 / Revised: 10 April 2025 / Accepted: 12 April 2025 / Published: 15 April 2025
(This article belongs to the Section Biometeorology and Bioclimatology)

Abstract

:
Maize yield is highly sensitive to climate change and extreme weather events. In some locations, it is projected to decrease due to an increase in the average growing season temperature. The present study analyzes changes in temperature and precipitation extremes in the Comarca Lagunera located in Northern Mexico, using the ETCCDI indices. We examined a 40-year period (1980–2020) using daily and monthly climate data provided by the National Meteorological Service. The climate databases were subjected to quality control, homogenization, and data filling using Climatol, and the ETCCDI indices were obtained using RClimDex software. Results indicate that the climate variable that most influences climate change in Comarca Lagunera is temperature, with increases in both maximum and minimum values. This situation is accentuating the drought in the Comarca Lagunera, which is supported by the increase in temperature-based indices. Furthermore, precipitation is the primary variable influencing the yield of rainfed maize, while maximum temperature affects the yield of irrigated maize. These results indicate that irrigation is functioning as a climate change adaptation strategy, reducing the impact of extreme weather on maize productivity, which could have a negative impact on water productivity in the study region in the short term.

1. Introduction

Climate change (CC) is one of the major challenges facing the world [1] and it is defined as significant changes in the mean values of meteorological events, such as precipitation and temperature [2], due to natural and anthropogenic activities [3]. It may be a result of factors such as greenhouse gas (GHG) emissions [4,5]. In 2019, approximately 22% of global GHG emissions came from agriculture, forestry and other land use [6]. In fact, the relationship between agriculture and CC is two-sided, because it has significantly contributed to biodiversity loss, land and water resource degradation [7] and GHG emissions. Nevertheless, at the same time, it is the sector of the economy most affected by CC [8] due to the extreme climate events, which involve periods of very high temperatures, torrential rains and droughts [9]. Thus, one of the greatest challenges is reducing the environmental impact of agriculture while ensuring food security [7].
An alternative is to increase crop productivity by adopting climate-smart agriculture (CSA) techniques [10], such as irrigation, which can lead to higher yields and resilient systems [11], especially where crop productivity is highly constrained by rainfall [12]. However, it is important to understand the challenges posed by CC on agriculture and its impact on maize production. A clearer understanding of the mechanisms of how CC affects agriculture and of the adaptation techniques could help design better agricultural and climate policies [13], mainly in developing countries where agriculture is a key sector for achieving poverty reduction and sustainable development [14].
Considering that three-quarters of the poor population depend on agriculture for their livelihoods, it is not only important but also necessary to investigate the response of agriculture to CC in developing countries [13]. It is expected to disproportionately affect agricultural production in low-latitude tropical developing countries, while some high-latitude developed countries may benefit [15]. In general, the projected impact of CC on maize yield in Mexico by 2080 is a 26% decrease compared to yield in 2020 [16].
Crop yield is highly sensitive to CC and extreme climate events [17]. Therefore, it is important to understand the effect of CC in specific regions, as it is not the same in all agricultural areas of the world, since a combination of changes in temperature and precipitation can either bring positive or negative effects on maize yields [18].
The increase in CO2 concentration has led to greater productivity of crops due to increased photosynthesis, but the increase in temperature offsets this effect by causing a rise in the respiration rate of crops and evapotranspiration, more pest infestation, change in weed flora and reduced crop duration [19]. In arid to semi-arid regions, declined crop productivity is attributed to an increase in temperature at lower latitudes [20].
In some locations, the maize yield was projected to decrease because of the CO2 increase or an increase in the mean growing season temperature [17,21,22]. Some studies show that, indirectly, heat stress will reduce both the quantity and quality of fodder maize as it reduces the protein and starch content in the grains of maize [23,24]. Conversely, other studies have found that maize yield would enhance with an increase in the shortwave solar radiation [17]. For places where the precipitation will decrease, there will be an increase in the irrigation water requirement (0.7–4.1%) and a reduction in the yield of fodder maize (~4%) [25]. Results of another study [26] suggest that even if maize were to receive all the water it needed, under a CC scenario yields would decline by 10–20% by the end of the 21st century.
Agricultural management must consider it a priority to analyze the behavior of the climate to identify the impact it has on crop productivity [27], since agricultural production and food security are expected to be significantly affected in response to global CC [28,29]. In this regard, climate indices are statistically consistent indicators of climate extremes [27], because they represent anomalies concerning climatology [30].
Focusing on the changes in temperature and precipitation extreme events, the Expert Team on Climate Change Detection and Indices (ETCCDI), sponsored by the Commission for Climatology (CCI) of the World Meteorological Organization (WMO), the Climate Predictability and Variability (CLIVAR) project, and the Joint Technical Commission for Oceanography and Marine Meteorology (JCOMM), defined a set of 27 widely used indices [31,32]. ETCCDI indices have been analyzed in several studies to detect changes in climate and trends in extremes of annual rainfall and maximum and minimum temperatures [27,31,33]. Extreme climate indices are strongly correlated with the maize yield, especially with the number of days above the temperature threshold, the maximum number of consecutive days with precipitation < 1 mm, the maximum daily highest temperature, and the number of heavy precipitation when precipitation ≥ 10 mm and ≥20 mm [17].
It is important to carry out these types of studies in Northern Mexico to increase the precision in the detection of CC and produce information that can be used to make accurate decisions concerning the implementation of relevant adaptation and mitigation measures in agriculture. Analyzing trends in CC indices in Northern Mexico is of priority importance due to its arid climate, which makes it a vulnerable region to CC, putting food security at risk.
In this regard, the purpose of this study is to analyze the trends in eight ETCCDI indices in the Comarca Lagunera (CL), located in an arid region of Coahuila and Durango states in Mexico, which makes it a vulnerable area to the effects of extreme climate events. Due to the importance of the region as a fodder maize producer, the main aim is to examine the differential impacts of climate extremes on maize yields in rainfed versus irrigated systems. The findings of this study will allow the identification of maize-producing areas with climatic vulnerability, and provide a representation of the spatio-temporal distribution of extreme temperature and precipitation events, useful for the implementation of adaptation or mitigation strategies to CC in a timely and efficient manner.

2. Materials and Methods

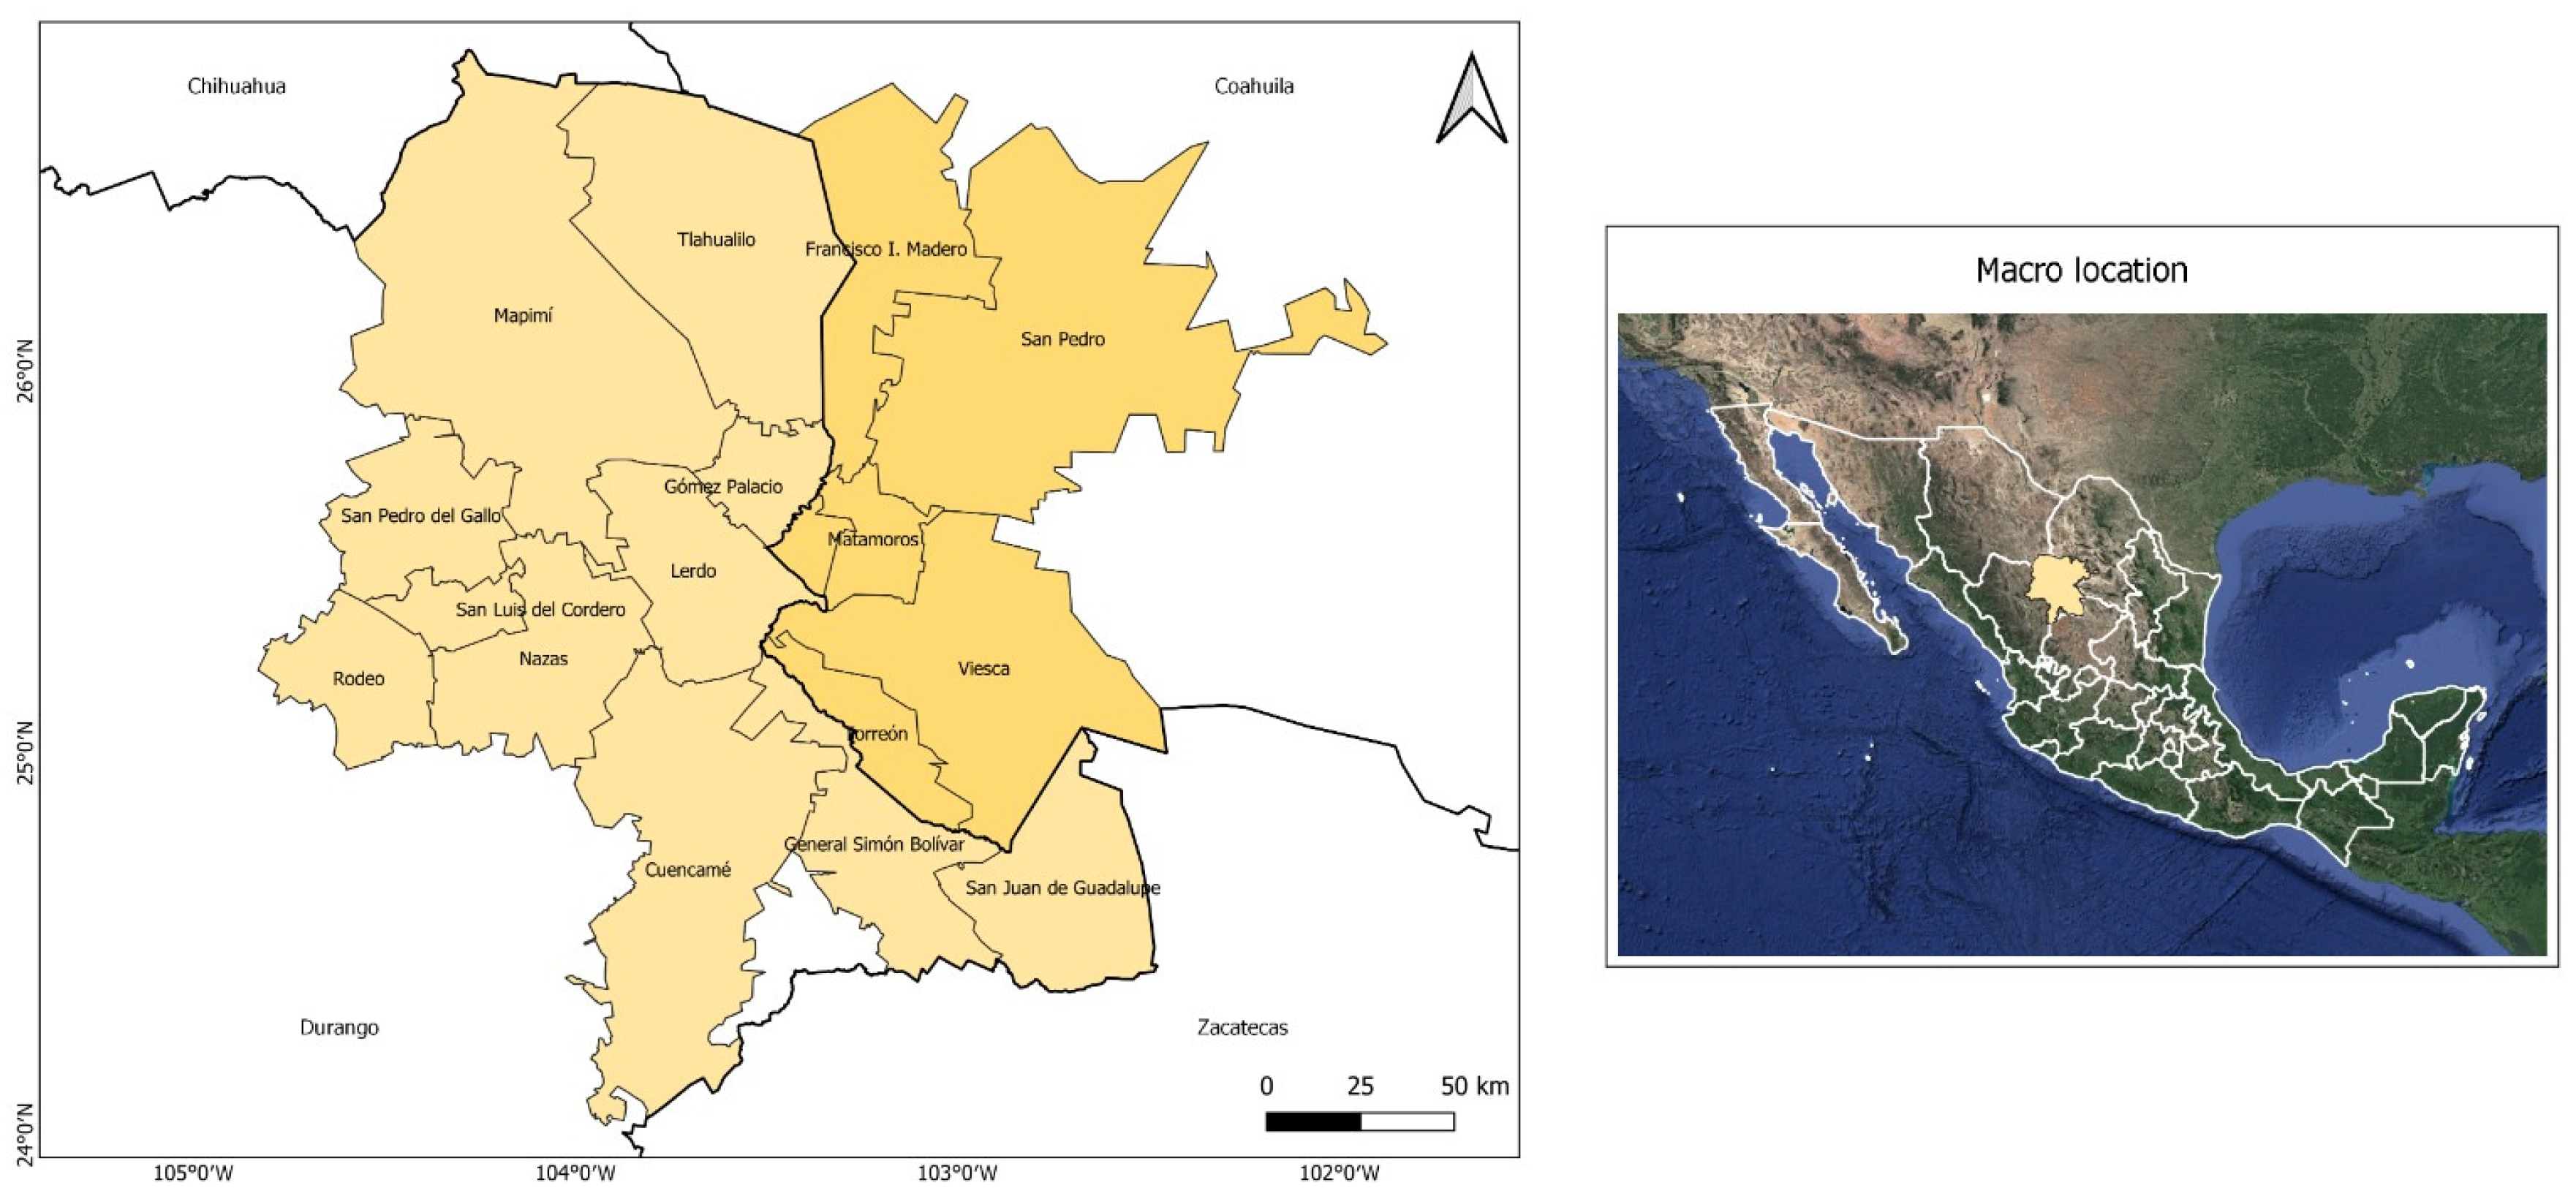
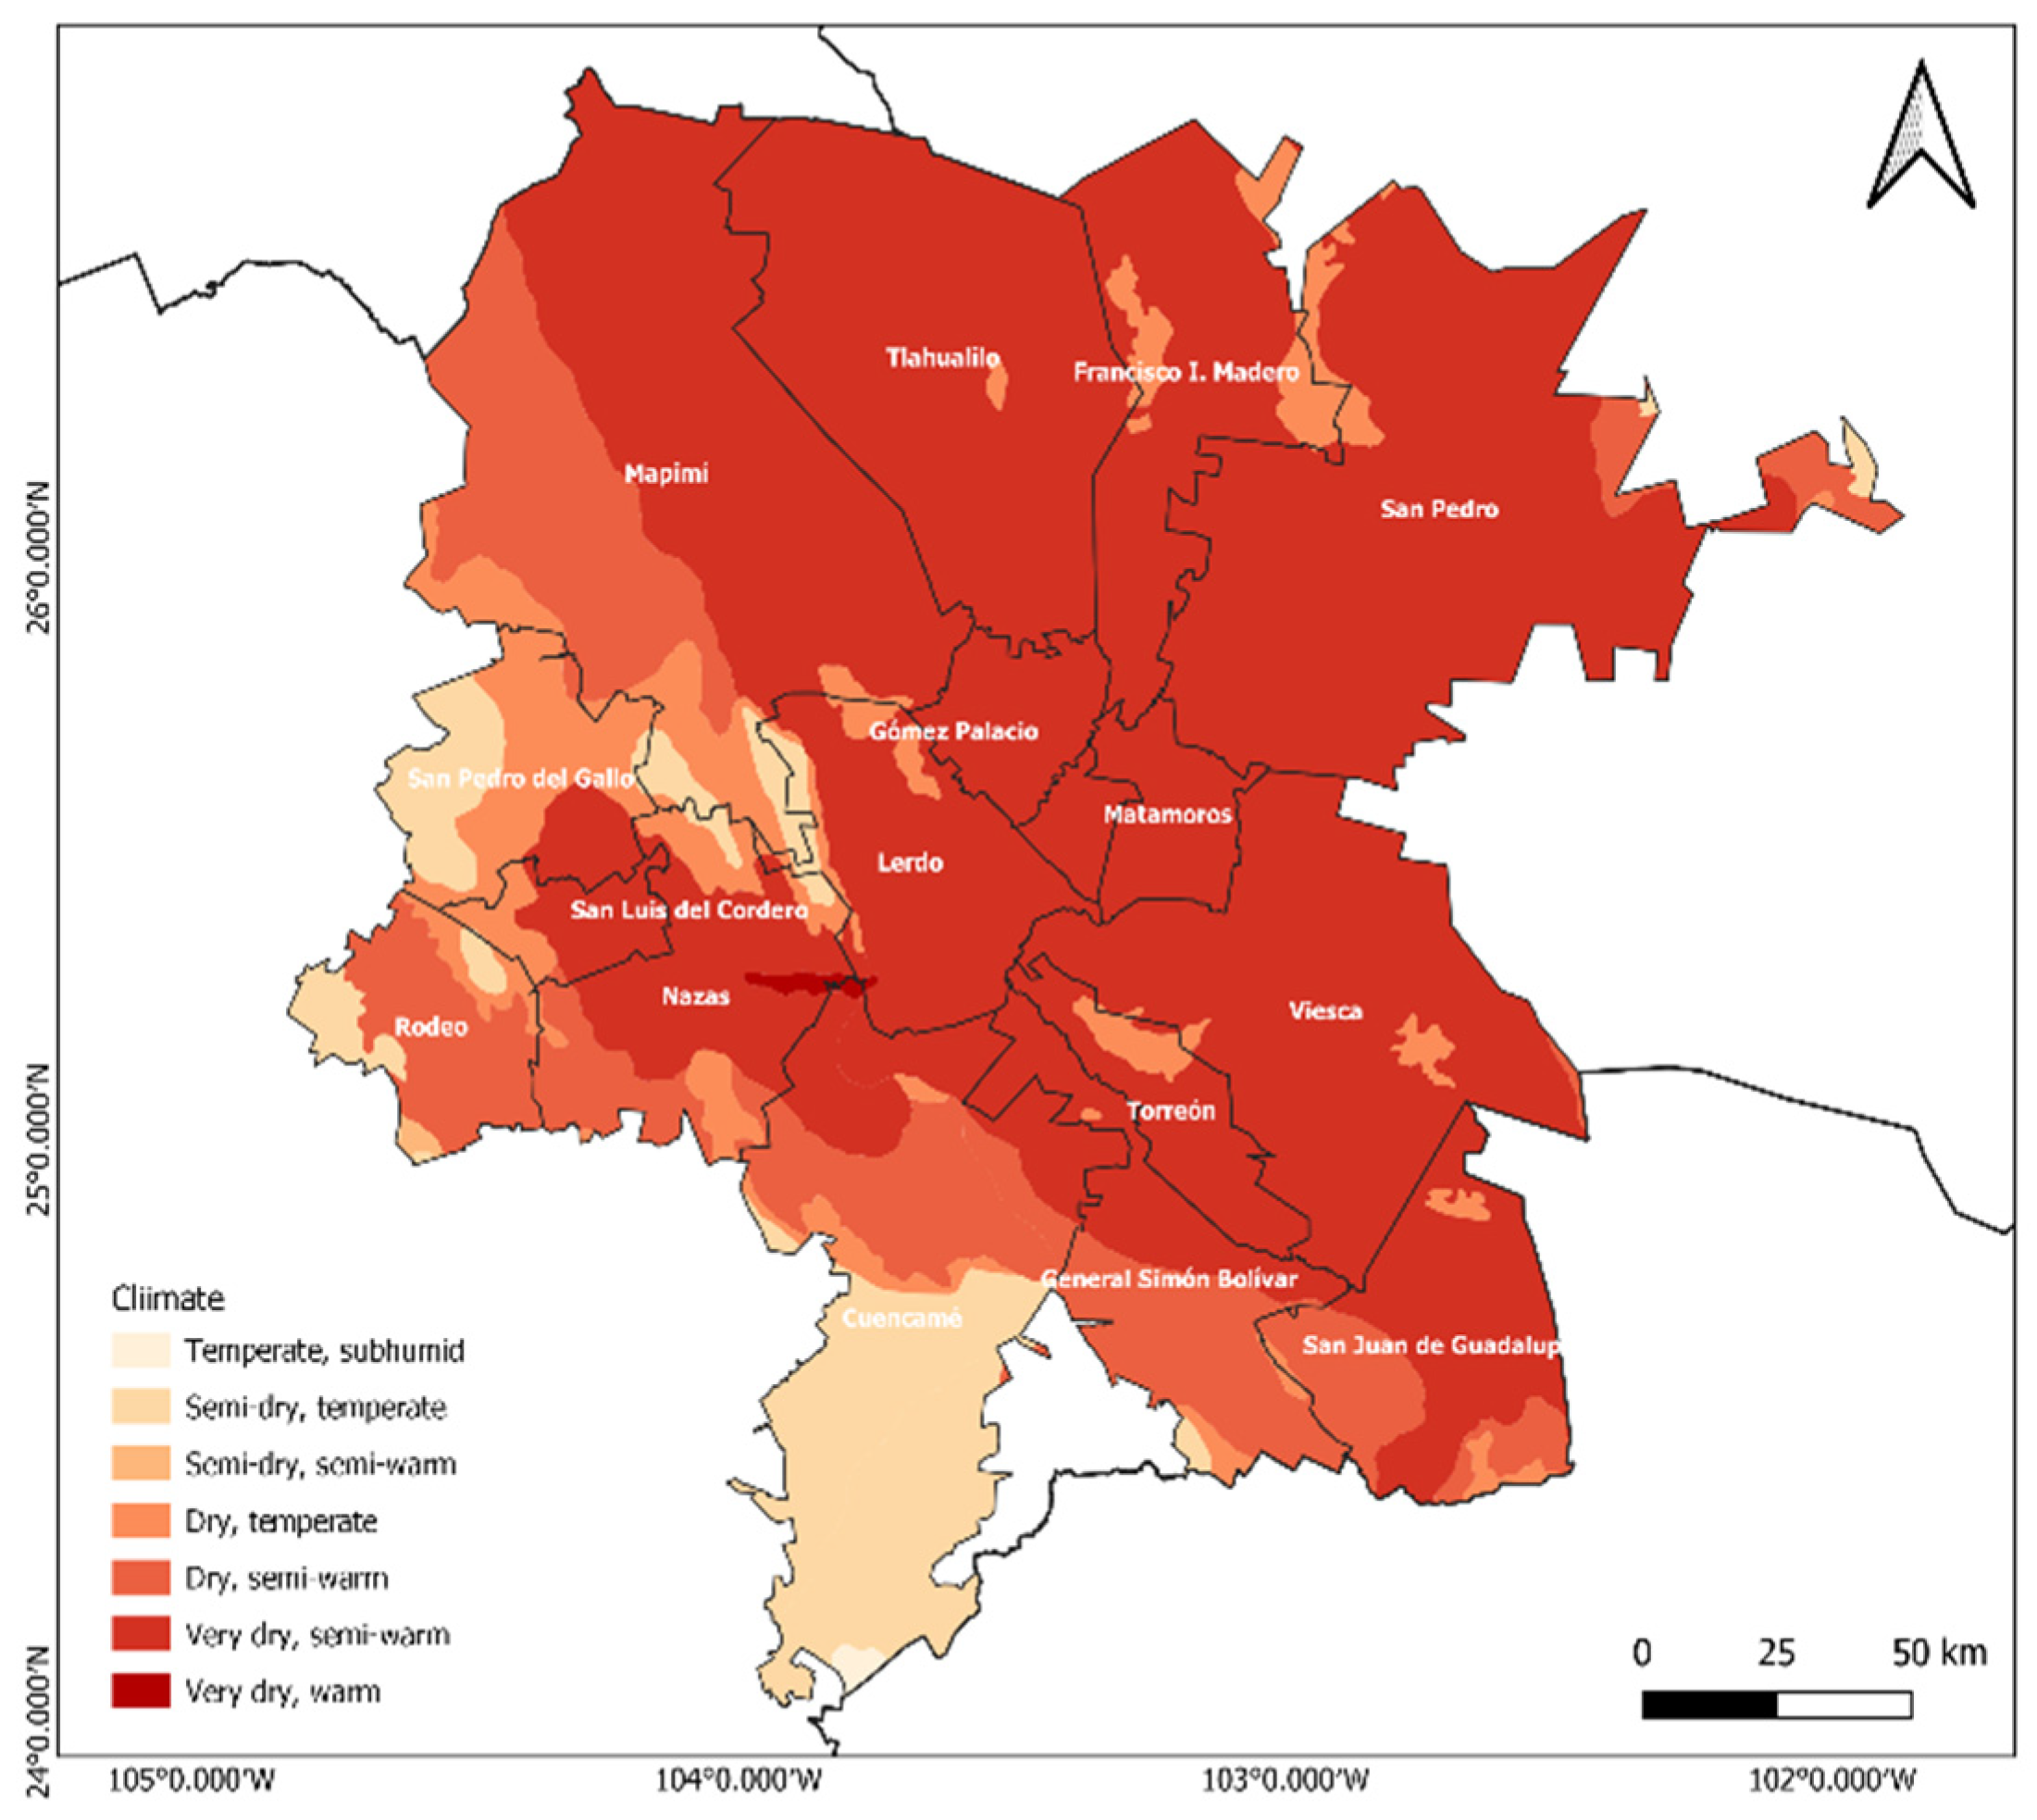
2.1. Description of Study Area

The study area corresponds to CL, located in Northern Mexico, between coordinates 24°22′ and 26°23′ latitude N and 102°22′ and 104°47′ longitude W; it has a surface area of 31,000 km2 [34]. The region is divided into 16 municipalities, 5 of them located in Coahuila de Zaragoza state: Viesca, Torreón, Francisco I. Madero, San Pedro, Matamoros; and 11 located in Durango state: San Juan de Guadalupe, Cuéncame, General Simón Boliva, Mapimí, Gómez Palacio, Nazas, Lerdo, Tlahualilo, San Pedro del Gallo, Rodeo, San Luis Cordero (Figure 1).
According to the Köppen climate classification modified by García [35], the predominant climate is BWhw (Figure 2), very arid, semi-warm, with a mean annual temperature between 18 °C and 22 °C, and average summer and winter temperatures of 31 °C and 16 °C, respectively. Average annual precipitation is 240 mm, with summer rains and winter rain percentages of 5% to 10.2% of the annual total. The precipitation is mainly concentrated from May to September and there is an annual evaporation of 2600 mm [36].
The regional topography ranges from the highest peaks that reach 3700 m above sea level (a.s.l.) to the valley plains at about ∼1050 m a.s.l. Due to the scarce rainfall and high temperatures during the summer, the region depends on groundwater resources [34]. In addition, the influence of sea surface temperature (SST) variability in Northern Mexico is affected by El Niño, which determines the intensity of the different meteorological variables.

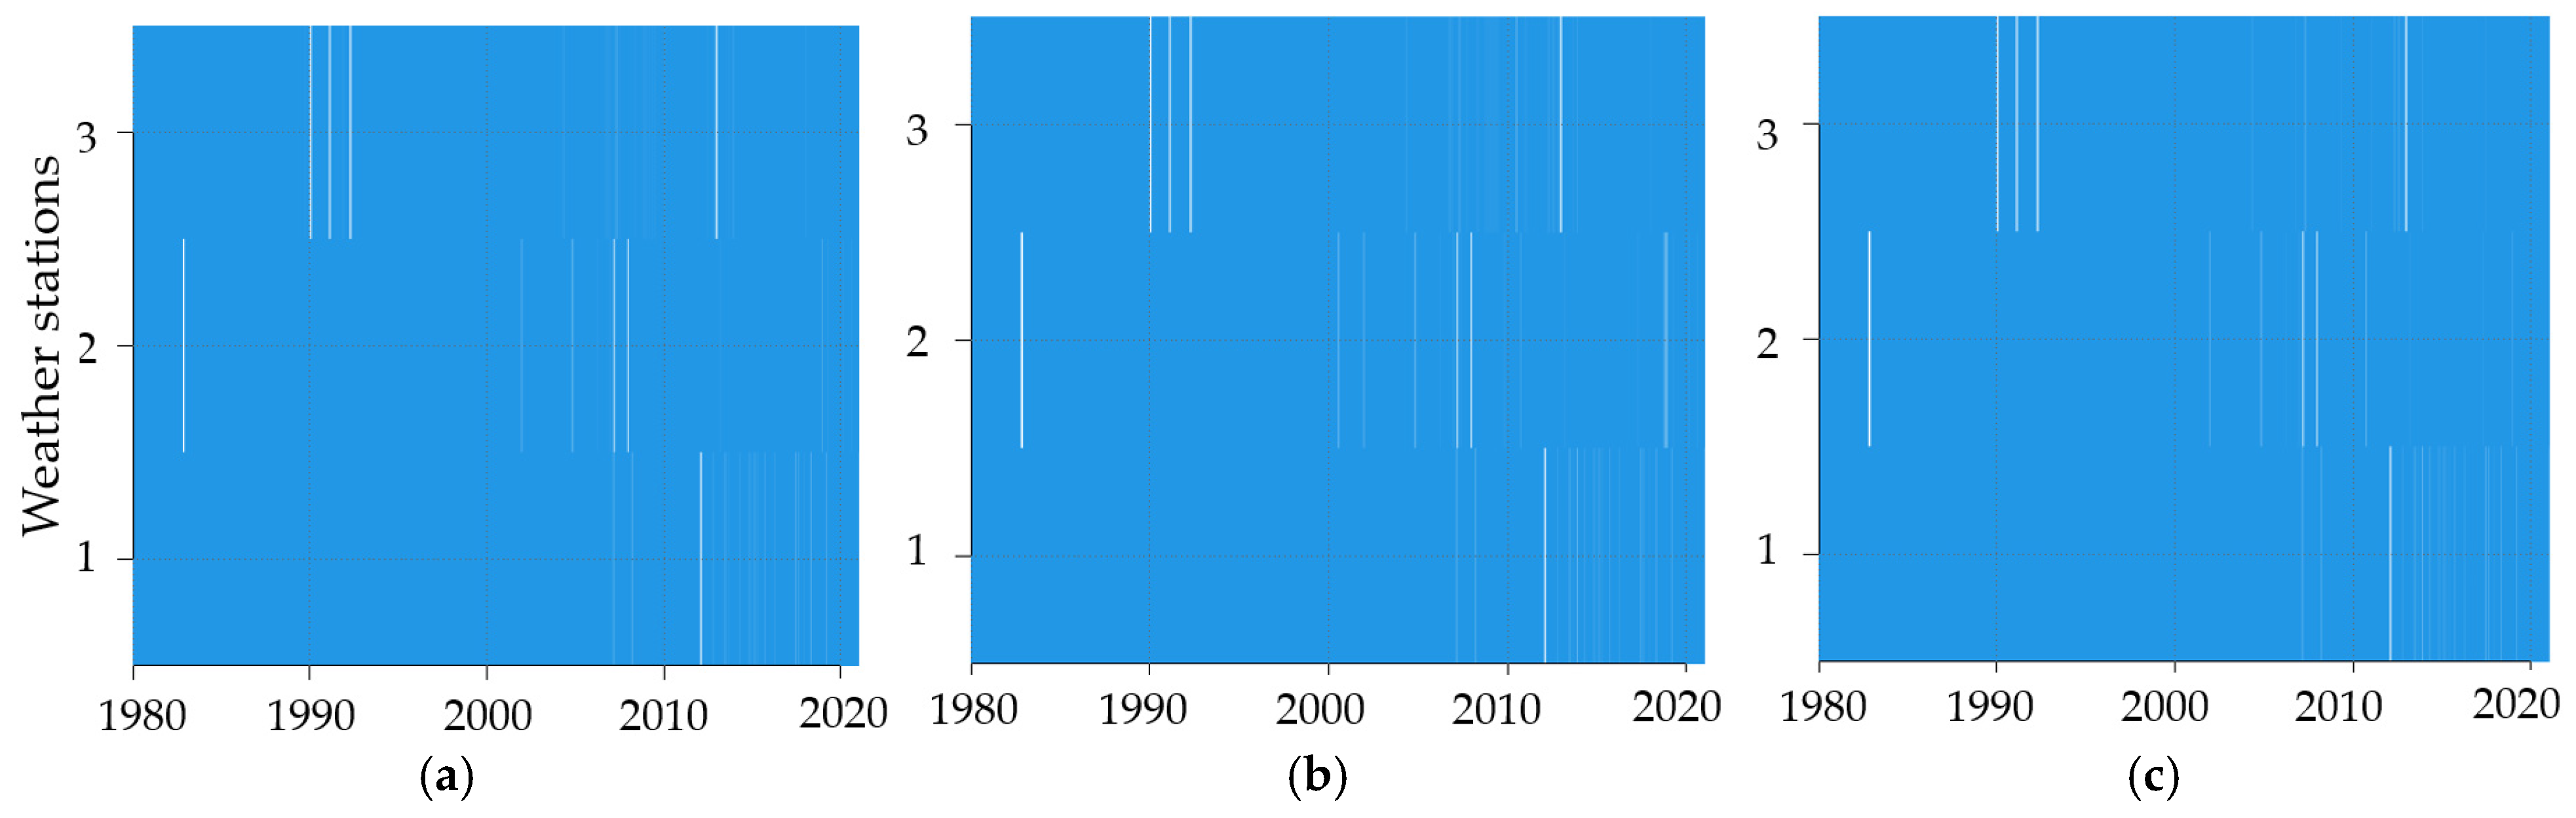
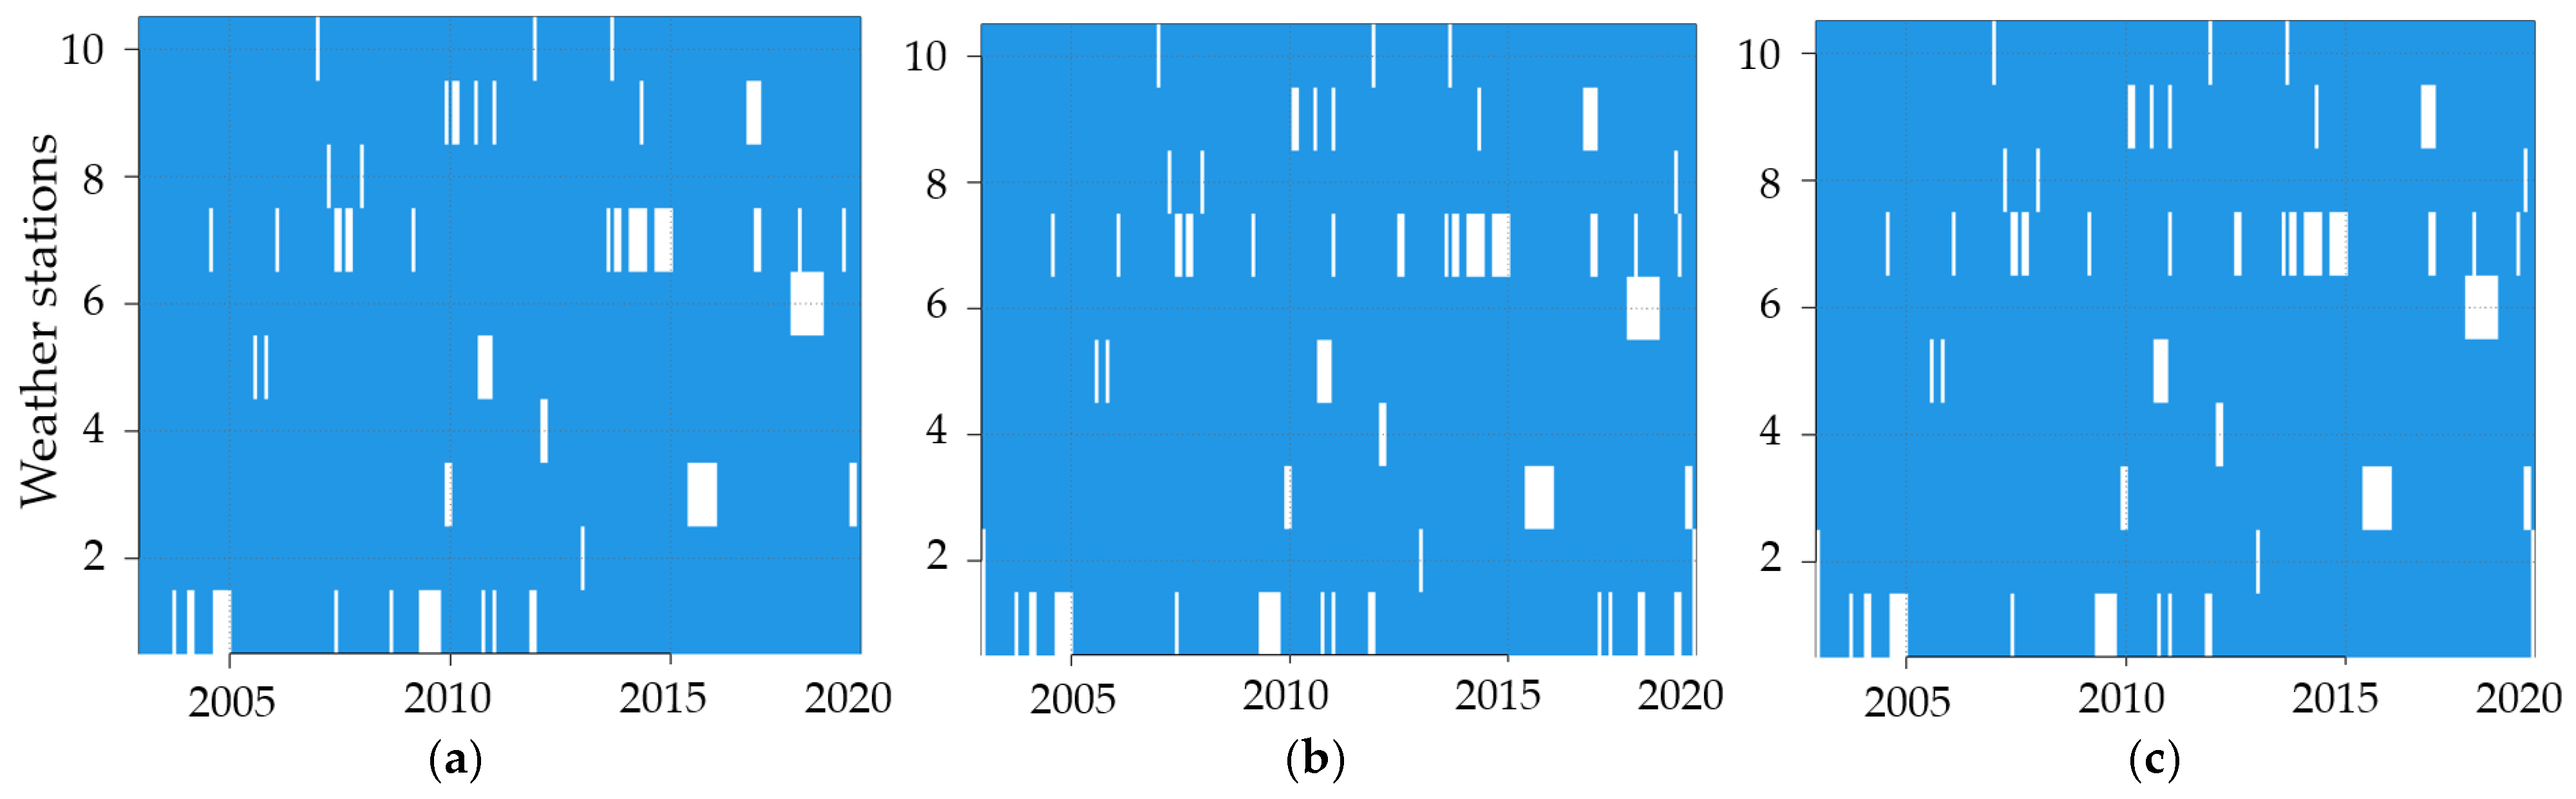
2.2. Climate Station Data Processing

The daily and monthly climate data used in this study: maximum temperature (Tmax), minimum temperature (Tmin) and precipitation (PP), was obtained from the Mexican National Meteorological Service dataset [37].
The climate stations chosen for the calculation of CC indices were as follows: San Pedro “05036” (25°45′25.2″ latitude, −102°59′45.6″ longitude and altitude of 1100 m), in Coahuila State; Ciudad Lerdo (DGE) “10108” (25°32′45.6″ latitude N, −103°31′19.2″ longitude W and altitude of 1140 m a.l.s.); and Tlahualilo “10085” (26°06′21.6″ latitude, −103°26′34.8″ longitude and altitude of 1100 m a.l.s) in Durango State. The selection of these stations was based on the principle of representing the region as closely as possible, with the additional criterion of ensuring that no more than 2% of the daily data (Tmax, Tmin, PP) were lost (Appendix A.1). The time range of daily data was from 1980 to 2020.
The climatological stations chosen to determine climate variability trends and their relationship with agricultural production were 10 (Table 1), distributed throughout the CL with the aim of being representative of the region. The selection criterion was that they did not have more than 20% missing monthly average data (Tmax, Tmin, PP) (Appendix A.2). The time range of monthly data was from 2003 to 2021.
Both daily and monthly climatic databases were analyzed with quality control, homogenization of climatological series, including missing data filling and detection and correction of outliers and shifts in the mean of the series using the Climatol package (version 4.0.0) [38] which runs in the R programming language. The homogenization of the data allows us to analyze the variability of the climatological series [39]. Climatol fills gaps in climate series and allows for the detection of anomalous values normalizing data by dividing it by its mean values, by subtracting the means or by complete standardization, in which case it is required to calculate means and standard deviations with an iterative process until none of the means change when data are rounded to their initial accuracy. Once the means become stable, all data are normalized and estimated by means of the simple expression:
y ^ = j = 1 j = n w j x j j = 1 j = n w j
where y ^ is a data item estimated from their corresponding nearest n data available at each time step, and wj is the weight assigned to them. Statistically, y ^ i = xi is a linear regression model called reduced major axis or orthogonal regression, in which the line is adjusted by minimizing the distances of the points measured perpendicular to it (type II regression).
The homogeneity test is performed by using the standard normal homogeneity test (SNHT). The more extreme 0.01% in each tail of the distribution were considered errors, and values exceeding 0.1% were suspect data. Inspection of the anomalies histogram helped in tuning these parameters by setting the number of standard deviations to be used as rejection thresholds [38].

2.3. Climate Change Indices Calculation

To obtain representative indices of the entire CL, the homogenized daily data were gridded using the dahgrid function in Climatol, which uses the inverse distance weighted (IDW) method [38], and then the indices were computed. In this case, the grid box value is an index that describes an aspect of the behavior of the daily grid box mean values. In the present study, the selected spatial resolution was 0.025°.
The CC indices calculated in this study were 10 (Table 2) of the 27 indices proposed by the ETCCDI [40], using the homogenized grid and the RClimdex (version 1.9) software [41,42]. The indices of extremes were defined by ETCCDI to reinforce the finding of possible changes in the climate within the time series of PP, Tmax and Tmin [33]. Seven indices are related to temperature (Tn90p, TNx, TN20, Tx90p, TXx, DTR, CDD) and three to precipitation (R95p, R99p, R20mm). Table 2 provides a description of the climate indices.
The functions of linear regression (LR) for these series allow achievement of the coefficient of determination (R2), and the angular coefficient of the determined straight lines (y = ax + b), which is considered the trend of this linear function and obtained through the statistical method of least squares. Fitting the series around the determined straight line, the data are considered an exclusive consequence of the intrinsic randomness of the variable under study. The trend is determined in terms of the p-value, which is considered a possible CC (high statistical significance: 0.01 < p ≤ 0.05) [33].

2.4. Trend Analysis

The Mann–Kendall (MK) nonparametric trend test was applied, as recommended by the World Meteorological Organization [43,44] to test the statistical significance of the increase or decrease in the series [45] and extreme climate indices [31,46,47,48,49]. The threshold for accepting a change as statistically significant was established at p < 0.05. Values for p below this parameter were considered to be statistically significant. The statistical analysis was performed using R Software. The MK test is defined as follows [50,51]:
S = k = 1 n = 1 j = k + 1 n sgn X j X k
with
sgn x = 1 if   x > 0 0 if   x = 0 1 if   x < 0
where, Xj and Xk represent sequential data values at times j and k, respectively. For higher n (≥10), it is assumed a normal distribution with zero mean and variance is computed as follows [52]:
σ z = n n 1 2 n + 5 j = 1 p t j t j 1 2 t j + 5 / 18
where, p is the number of the tied groups in the data set and tj is the number of data points in the jth tied group. Then the normalized test statistics Z is computed as follows:
Z = S - 1 σ if   S > 0 0 if   S = 0 S + 1 σ if   S < 0
A positive value of Z indicates an increasing or upward trend, while a negative value of Z indicates a decreasing or downward trend [45,53].
  • Sen’s slope estimator is a non-parametric procedure developed in order to estimate the magnitude (annual rate) of change or slope of trend in a time series [54]. First, the slopes of n data pair are calculated as follows:
    d m = X j X i j i   For   m = 1 , 2 , 3 , . . , n
    where, Xi and Xj are the data values at the corresponding times i and j (1 ≤ i < j ≤ n), respectively. Then the median of all those dms gives the Sen’s slope:
    β = d n + 1 z 1 2 d n Z + d n + Z Z
β gives the magnitude of the trend and its positive value indicates an upward or increasing trend while its negative value indicates a downward or decreasing trend [53].

2.5. Influence of Climate on Maize Yield

The maize yield data (t ha−1) were obtained from the Agri-Food and Fisheries Information Service (SIAP) database [55], from 2003 to 2020. The database has yield information by municipality, therefore, to obtain the average annual yield of forage maize in the CL, the accumulated value of the municipalities that constitute the region was obtained.
Linear regressions were carried out to find out if there is a relationship between the yield of forage crops and the extreme climatic conditions of the region. Finally, a trend of the climate variables and the maize yield was carried out.

3. Results

3.1. Climate Station Data Processing

Homogenization refers to the process of eliminating disturbances that are not purely climatic in the raw data records. The non-homogeneity can be caused by station relocation and instrument replacement [56]; nevertheless, one of the main problems in the climate dataset is the missing data. Incomplete information leads to distortion and bias, therefore this study follows specific guidelines to ensure data completeness; monthly datasets are regarded as reliable if they have at most five missing daily observations, and a year is considered suitable if all the moths follow the above criteria [57,58].
In this case, in the daily climate database used to calculate CC indices, there is a maximum of missing data of 332, 352 and 409, for PP, Tmin and Tmax, respectively, out of 14,976 data. The loss of data occurred mainly in the years 1983, 1990, 1991, 1992, 2008, 2012 and 2013. It is worth highlighting that more than 99% of the data from all stations were available for the study period; hence, these weather stations were considered as greatly important in terms of data availability, especially in view of the scarcity of climate information in Northern Mexico.
In the monthly database used to analyze trends in climate variability and its impact on maize yield, there is a maximum of missing data percentage of 4.58%, 4.75% and 5.05%, for PP, Tmin and Tmax, respectively. Subsequently, after the process of homogenization and estimation of data, complete daily and monthly databases without anomalies were obtained.

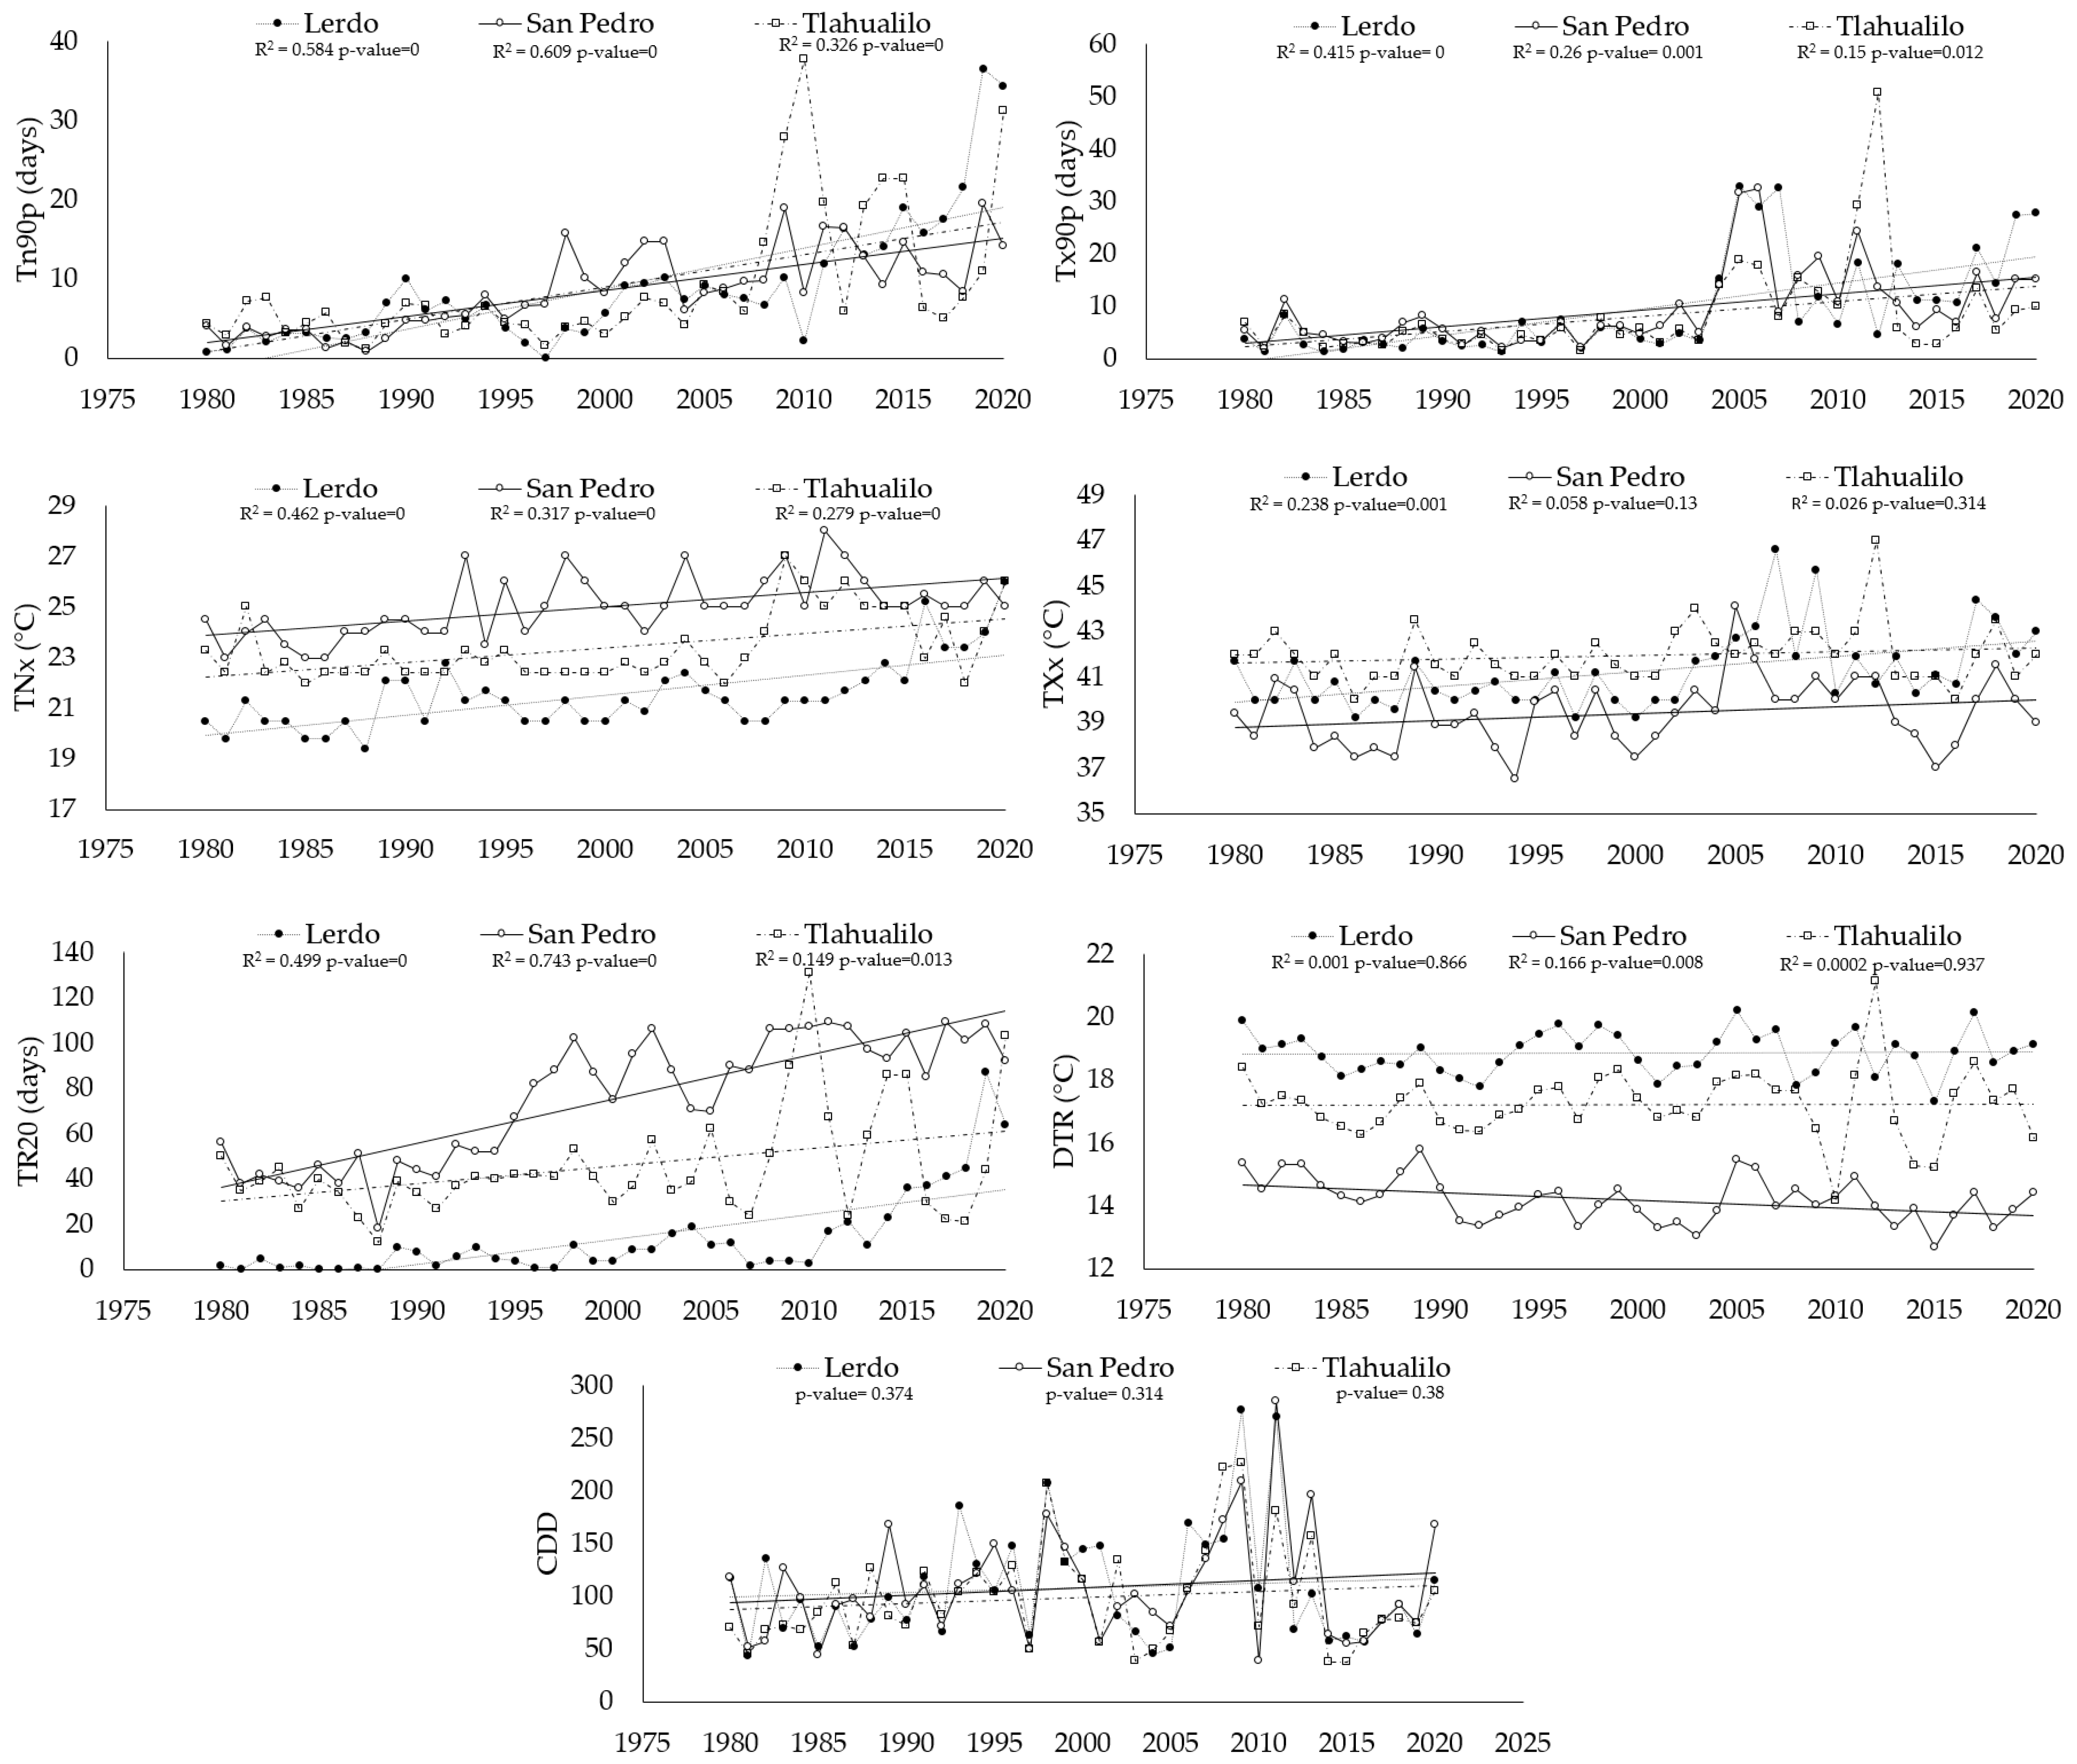
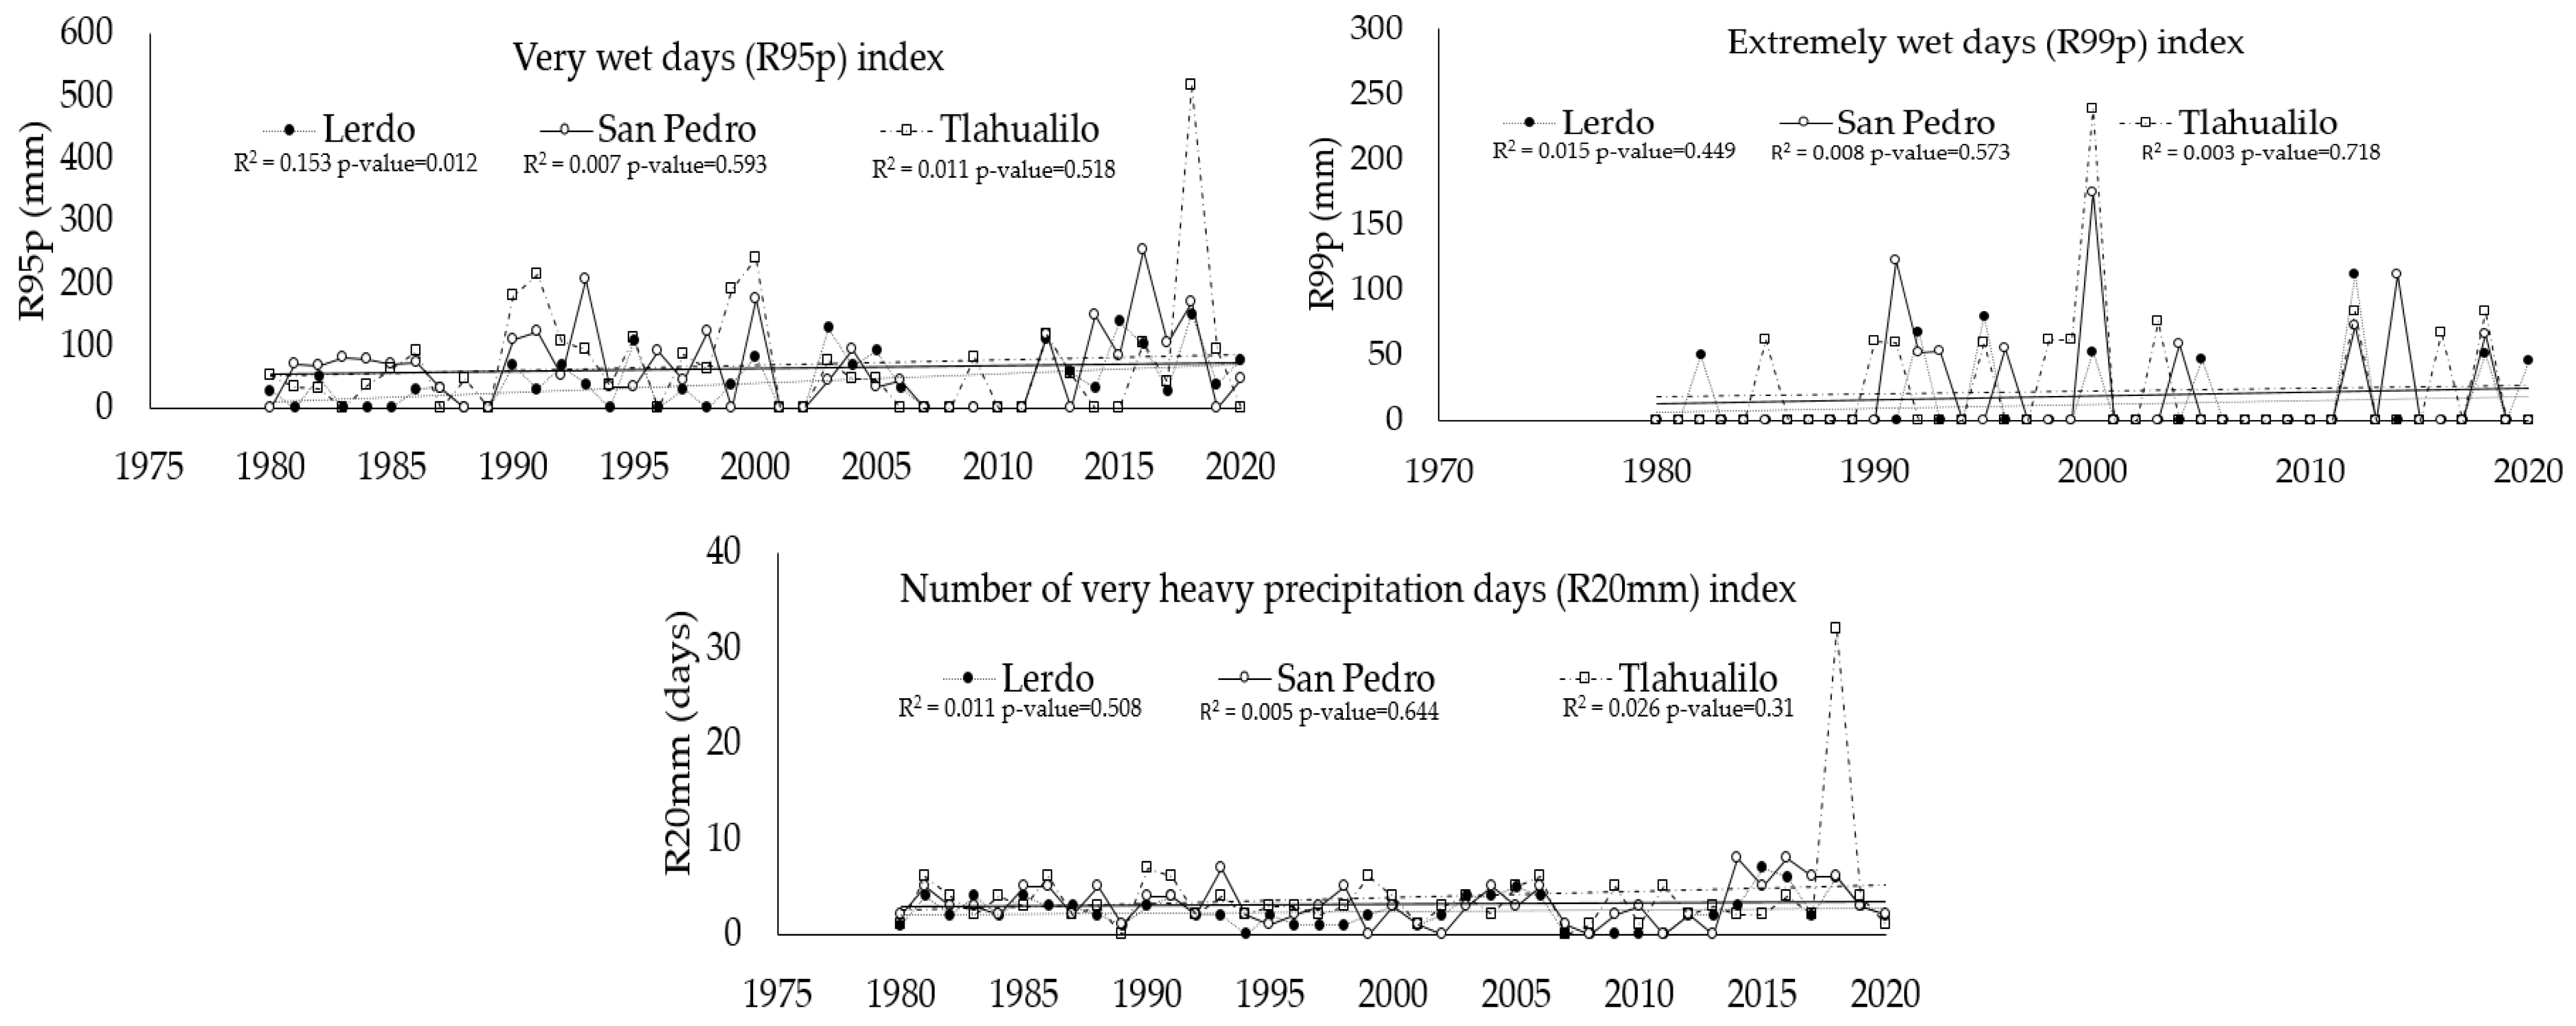
3.2. Climate Change Indices

ETCCDI indices were calculated using the homogenized data and the RClimdex software [41]; seven of the indices are related to the extreme temperature (Appendix B.1) and three are related to precipitation (Appendix B.2). The results for Z statistics of MK test and magnitude of Sen’s slope of the ETCCDI indices are shown in Table 3.
  • Indices related to temperature
It is observed that there is a significant increasing trend in Tn90p over the years throughout the CL region, with a rate of around 0.3 days year−1 (p < 0.05). The frequency of warm nights increased significantly with a rate of 0.41, 0.31 and 0.21 days year−1, for Lerdo, San Pedro and Tlahualilo, respectively. Tx90p index showed a significant increasing trend with an average rate of 0.3 days year−1 throughout the CL region (p < 0.05). During the period from 1980 to 2020, the Tx90p were 0.34, 0.25 and 0.17 days year−1 for Lerdo, San Pedro and Tlahualilo, respectively. An increase of around 10% was observed in 2004. In general, the frequency of warm nights was higher than that of warm days.
Results showed that there is a significant increasing trend in TNx with an average rate of 0.05 °C year−1 in the maximum values of minimum temperature throughout the CL region (p < 0.05). Of the three stations, Lerdo is the one with the lowest minimum temperatures, and San Pedro with the highest. During the period from 1993 to 2020, the maximum value of the average minimum temperature of San Pedro was 26 °C. The TXx index showed a significant increasing trend in Lerdo with a rate of 0.05 °C year−1 (p < 0.05). Otherwise, in San Pedro and Tlahualilo, the increasing trend is not significant. According to Hong and Ying [59], the increasing trends of TNx and TXx could indicate that the strongest warm events increased and the strongest cold events decreased.
All stations have a significant increasing trend of TR20, especially San Pedro with 1.89 days year−1, followed by Lerdo and Tlahualilo with 0.68 days year−1 and 0.46 days year−1, respectively (p < 0.05). During the period from 1980 to 2014, Lerdo remained constant and maintained a maximum of 20 days with tropical nights per year. From 2015 to 2016, it increased to 40 days and from 2017 to 2020 the average was 60 days. During the period from 1980 to 1994, in San Pedro, there was an average of 40 days per year, while from 1996 to 2020, the average was 95 days per year. In the case of Tlahualilo, from 1980 to 2019, there was an average of 40 days per year with tropical nights, but with some sharp peaks from the year 2009 onwards.
Lerdo showed a DTR from 17.1 °C to 20.2 °C, without a significant trend either increasing or decreasing (p < 0.05). In San Pedro, DTR showed a significant decreasing trend in daytime temperatures with a rate of 0.02 °C year−1 (p < 0.05), due to the shortest warming amplitude in TXx and TNx, resulting in a decrease in diurnal temperature range, and reached its lowest range in 2015. In Tlahualilo, the range of daytime temperatures oscillates between 14 °C and 21 °C; in addition, it showed a drastic decrease in 2010, but the increasing trend is not significant (p < 0.05).
An increasing trend implies that every year, the CDD is adding up in the study region. In this sense, CDD has increased with 0.31, 0.37 and 0.59 days year−1 in Lerdo, San Pedro and Tlahualilo, respectively. However, throughout the study region, it is observed that there is not a significant trend of increase in the CDD (p < 0.05). A significant increasing trend of CDD can certainly affect the livelihood of the people due to the scarcity of water [53].
  • Indices related to precipitation
Regarding the precipitation-based indices (R95p, R99p and R20 mm), R95p in Lerdo was the only one that showed a significant increasing trend with 0.02 mm year−1 (p < 0.05). The period from 2007 to 2011 stands out, with zero days with R95p, characteristic of arid and semi-arid areas such as the study region.
From the grids, the CC indices were calculated for the entire region of the CL, from 1980 to 2020 (Figure 3). It is important to highlight that the agricultural area is distributed throughout the region, but mainly in the periphery, mostly between Tlahualilo and San Pedro. In general, spatial anomaly distribution of intensity indices showed that the warming amplitudes are located in the center of the region. The spatial distribution of Tn90p and Tx90 showed that the frequency of warm nights was higher in the center of the region (Gómez Palacio and Lerdo), while that of the warm days was higher in the north (Tlahualilo). The TX90p, DTR, CDD and R99p are more frequent at high latitudes. Tlahualilo showed a higher DTR value and Lerdo a shorter one at the same longitude.

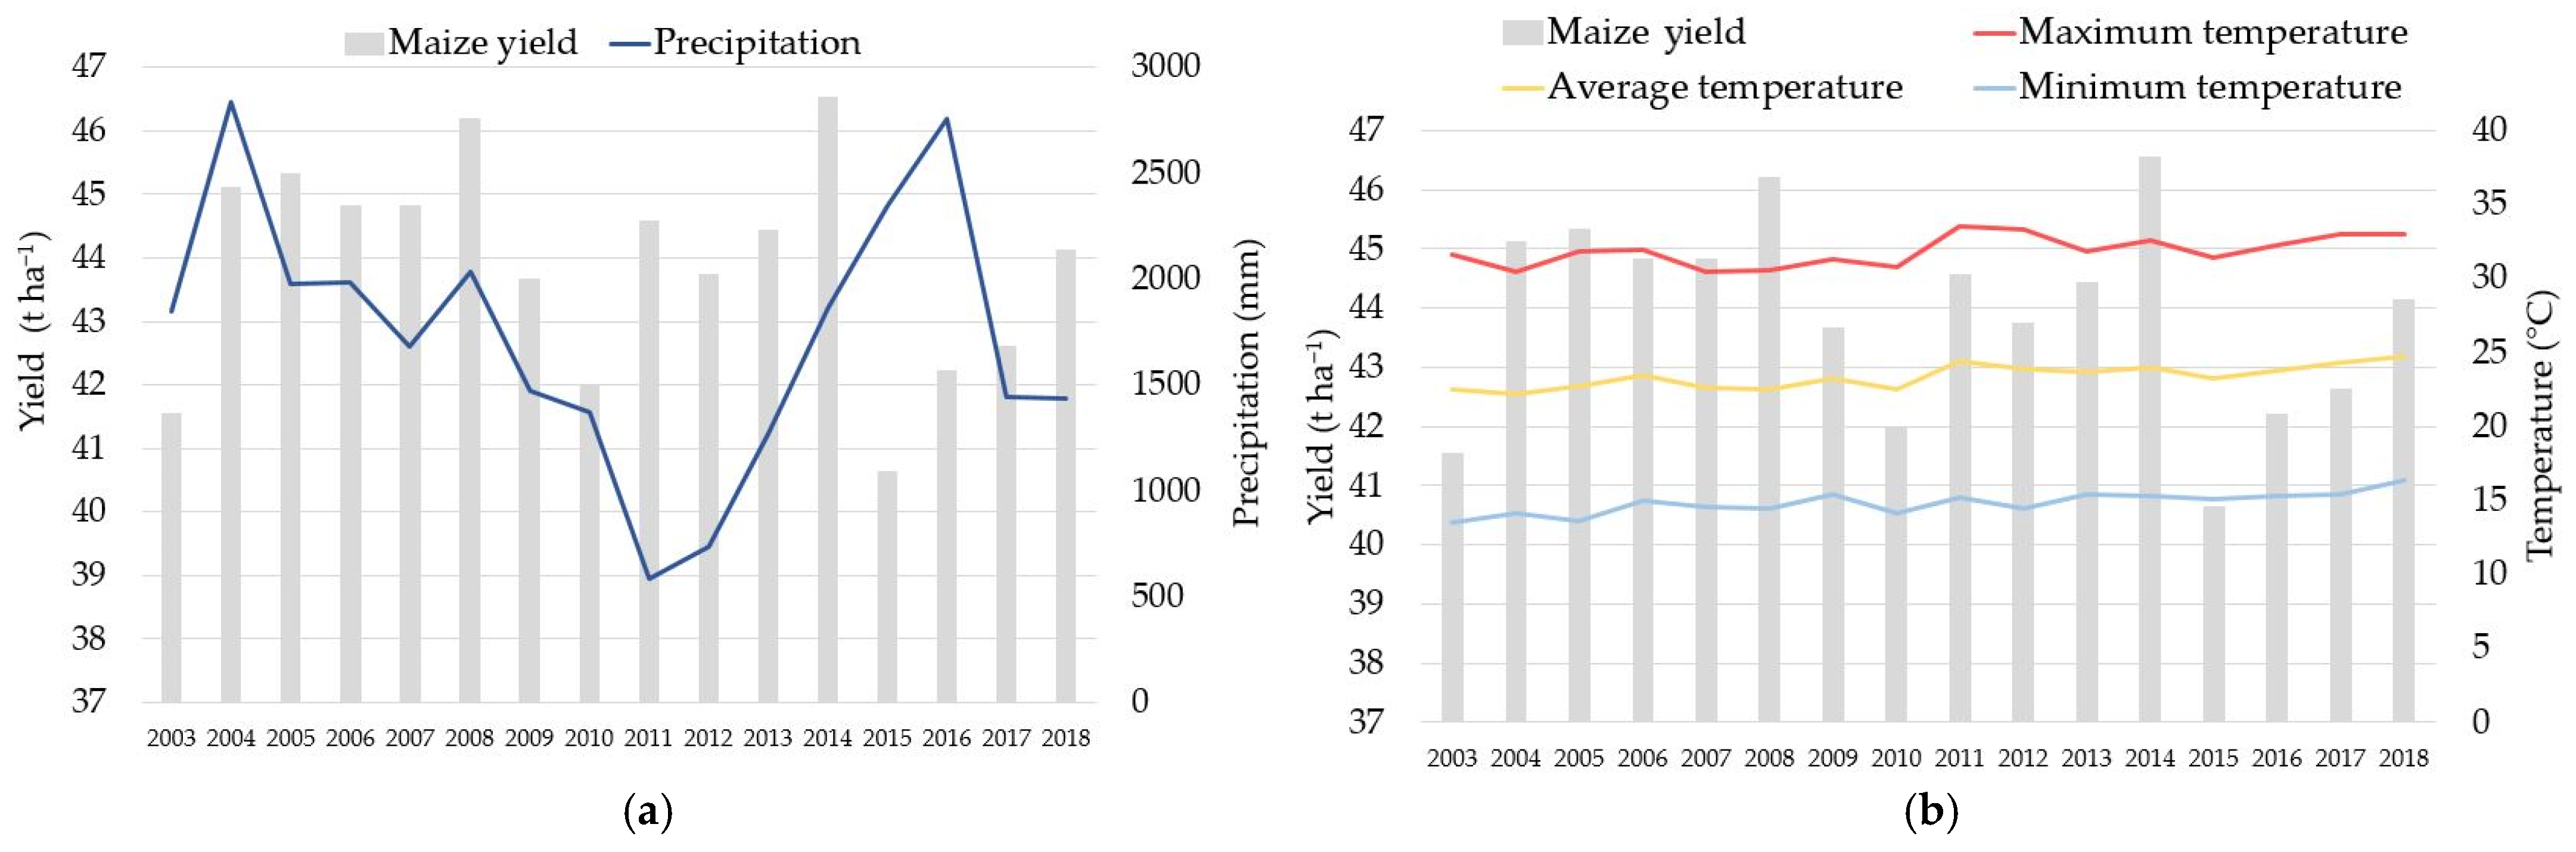
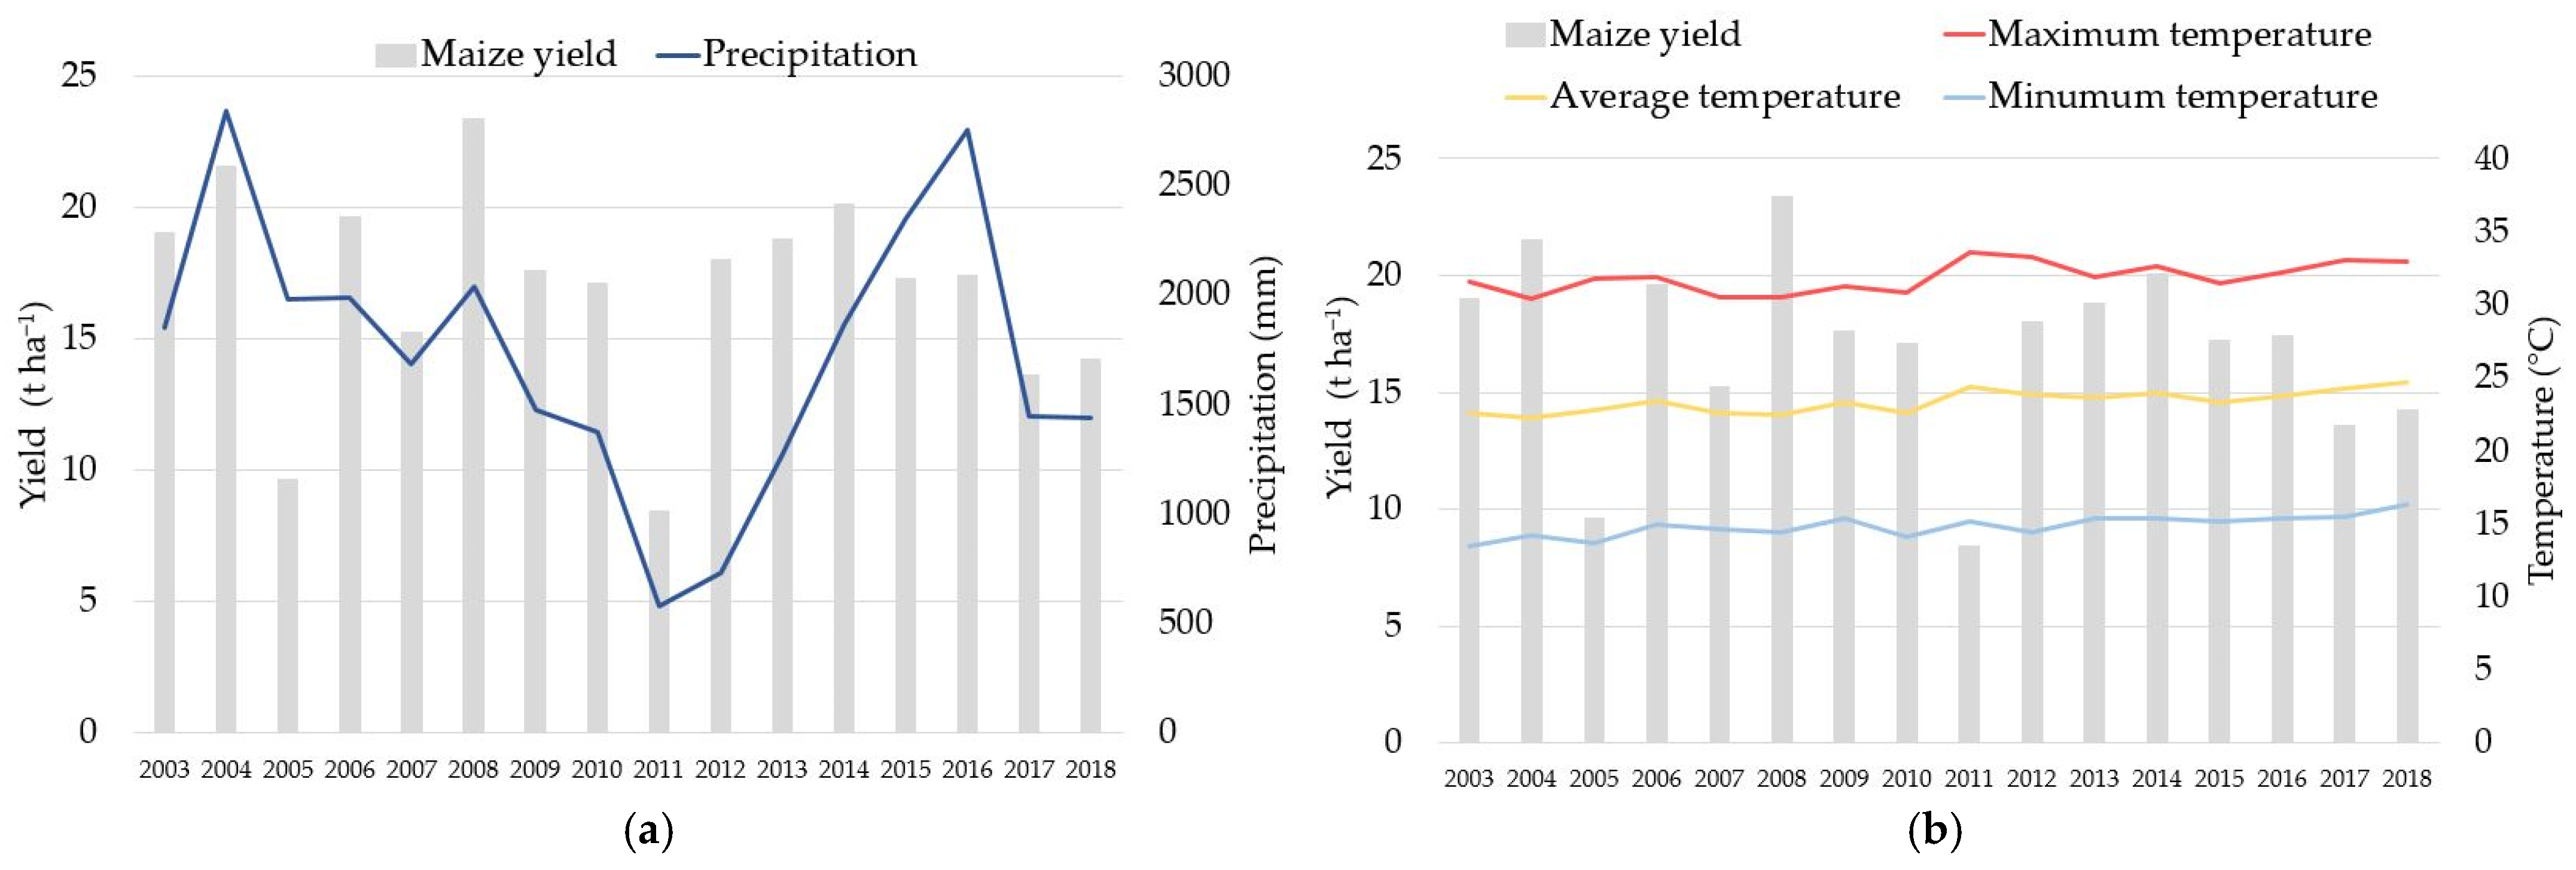
3.3. Analysis of the Influence of Climate on Maize Yield

Equations (8)–(10) show the relationship between the climatic variables (PP, Tmax and Tmin) with the yield of maize (Y) under irrigation, respectively. Equations (11)–(13) show the relationship between PP, Tmax and Tmin with the yield of maize in rainfall conditions, respectively, in the CL.
Y = −0.0002PP + 44.16,    R2 = 0.0032
Y = −0.412Tmax + 45.21,  R2 = 0.0006
Y = 0.0624Tmin + 44.16,  R2 = 0.0008
Y = 0.0029PP + 11.919,   R2 = 0.2058
Y = −1.9895Tmax + 80.33,  R2 = 0.2617
Y = −0.6233Tmin + 26.179,  R2 = 0.0138
It is observed that the relationship between maize yield and climatic variables is weak, even though the relationship with yield is greater in rainfall maize cultivation than in irrigated maize. This behavior may indicate that irrigation is an adaptation strategy to CC, which favors crop yields and makes them more resilient. Actually, irrigation is considered a strategy of CSA, which builds resilience and plant cultivars enhanced resistance to adverse environmental conditions, maintaining or increasing crop yields under stress conditions [60].
Under irrigation conditions, it is more difficult to observe a trend or influence of precipitation on the crop, because its water requirement does not depend on rainfall, but is provided by irrigation. However, the positive trend indicates that there will be a better response, expressed as yield, to greater precipitation in the study region. In the case of temperature, its relationship with yield was greater in the maize cultivated under irrigation. The graph of maximum temperatures shows that after 33 °C, yields begin to decrease, probably exceeding the temperature threshold of the maize hybrids commonly used in the region. On the other hand, the increase in minimum temperature positively influences maize yield, as well as the average temperature. This behavior may indicate that the minimum and average temperatures of the study region are within the optimal temperature ranges for the growth and development of maize.
However, it is important to consider that yields, when the crop is irrigated, are higher, which indicates that rainfed maize is much more susceptible to climate variability and change as it depends totally on the precipitation and temperatures of the region, which in the long term can put the productivity of the crop at risk. The increasing frequency and severity of extreme weather events have reduced crop productivity, posing a hazard to regional and global food security [61].
Figure 4 and Figure 5 show the behavior of climatic variables and maize yield under irrigation and rainfed conditions, respectively. It is observed that in irrigated maize, there is no considerable influence from precipitation; however, the yield of rainfed maize does show a greater influence.

4. Discussion

4.1. Climate Change Indices Trends

CC, characterized by rising temperatures and changes in precipitation, has mostly negative consequences for agriculture [62]; in fact, it is considered one of the greatest barriers to the achievement of the sustainable development goals (SDGs), particularly those focusing on no poverty and zero hunger [63]. Agriculture is the most vulnerable sector to CC [64], as it alters the suitability of growing areas and their development [65]. The changes in climatic variables such as temperature and rainfall significantly affect the yield of crops; in fact, they can explain 20–49% of the variability of the crop yield anomalies [66]. Stable production of maize is crucial for global food security; therefore, analyzing the impact of CC on maize yields can provide effective guidance to national and international economic and political decisions [67].
Despite the relevance of fodder maize cultivation to the socio-economic development of the CL, studies investigating the impacts of climate variability on crop yield in the region have not been undertaken. In the current study, we assessed the recent climate over Northern Mexico and analyzed the influence of climate variables on the maize yield, under irrigation and rainfall conditions. In this sense, the analysis of extreme events through climate indices has become increasingly important in agriculture. Climate indices are essential tools for understanding how CC is impacting various regions of the world, including Northern Mexico. These indices facilitate the monitoring of extreme phenomena such as heatwaves, droughts, intense precipitation, and air quality, which is crucial for adapting to and mitigating the effects of CC [68]. Ongoing research and analysis of these indices allow for informed decisions regarding natural resource management and the development of public policies aimed at mitigating the impacts of CC [69].
The most widely are those provided by the ETCCDI due to they are relatively simple, but statistically consistent, quantitative indicators of climate extremes, which include both temperature-related indices as well as those linked to precipitation [27]. In Humid Pampa, Argentina, one of the most productive agricultural lands around the world, the ETCCDI index suggested a trend of more annual precipitation falling on fewer [70]. In Brazil, there was found a significant increase in almost all temperature climate extreme indices, which may lead to an impact on soybean cultivation in the MATOPIBA region [71]. In Chile, the indices showed that rising temperatures could favor the production of subtropical fruit species such as cherimoyas, avocados, citrus fruits, and papayas; however, in the case of grapes, productivity could decline. This could also lead to environmental crises due to the loss of valuable water resources stored in the form of snow [72].
The climate indices related to temperature used in this study (Tn90p, Tx90p, TNx, TXx, TR20, DTR and CDD) show a clear trend towards increasing annually in Northern Mexico, reflecting the effects of CC in the region. For instance, the Tn90p index has shown a significant increase in the CL region. This phenomenon is particularly evident in locations like Lerdo, San Pedro and Tlahualilo, with annual increases ranging from 0.21 to 0.41 days. In San Pedro, a sharp increase between 1997 and 1998 stands out, rising from 6.75% to 15.73% of warm nights [73]. Moreover, the Tx90p index also exhibits an upward trend in the region, with an annual increase of 0.3 days, reaching significant peaks in years such as 2004 and between 2005 and 2006 in Lerdo and San Pedro, indicating a shift in the frequency of extreme temperature days [74]. This increase in both daytime and nighttime extreme temperatures may be linked to the intensification of warm events and a reduction in cold events, which aligns with findings from other studies in the region [75].
The TR20 index has shown a significant increase across the three analyzed stations. In San Pedro, the 1.89-day annual increase in the number of tropical nights reflects a greater persistence of nighttime heat, rising from an average of 40 nights per year during 1980–1994 to more than 95 nights between 1996 and 2020. This trend is similar in Tlahualilo, where notable peaks in tropical nights have been recorded since 2009, suggesting an intensification of warm weather and longer-lasting warm events in the region. Regarding minimum temperatures, a significant increase of 0.05 °C per year has been documented, especially in San Pedro, where maximums of 26 °C have been reached in recent decades [76].

4.2. Analysis of the Influence of Climate on Maize Yield

The effect of climatic factors on maize yield is diverse, but, generally, the temperature increase is found to reduce the yield [77]. High temperatures during flowering have a negative effect on pollen fertility, affect photosynthesis, change the amount of carbohydrate and protein synthesis, and reduce translocation into maize seeds, which negatively affects yield [78]. Increasing temperature can affect maize mainly during the grain-filling phase, since at over 33 °C, the maize yield has a negative influence on crop productivity. Increases in temperature negatively affect the maize yield, causing decrements [59]. Extreme high temperatures reduce the photosynthetic rate, chlorophyll fluorescence and dry matter traits, which cause declines in yield [79]. For maize, 34 °C is regarded as the upper base temperature for defining heat stress events and 8 °C is regarded as the lower base temperature during the growth period [80]. Moreover, the high temperature increases the likelihood of pests and diseases which damage maize crops [81].
In contrast, it is unclear how maize yield response to precipitation varies over a large spatial scale compared to the well-known temperature response, as precipitation change is more erratic with greater spatial heterogeneity [82]. The indices related to precipitation used in this studio (R95p, R99p and R20 mm) presented an insignificant increasing trend, which has also been found in other parts of Mexico [83], which may be due to an increase in intensity but not in frequency. An intense precipitation leads to decreases in maize production and could cause the cultivable land available for this crop to be reduced [84]. For instance, the R95p index (days with intense precipitation) has shown an increase in Lerdo, with a rise of 0.02 mm per year. However, the region continues to experience prolonged drought episodes, as observed between 2007 and 2011 when no days with intense precipitation were recorded. This is characteristic of the arid and semi-arid zones of Northern Mexico, which have seen a decrease in the frequency of extreme rainfall [85]. Additionally, the CDD index (consecutive dry days) also exhibits an increasing trend across all stations, which could have serious implications for water availability and agriculture, especially in a region so vulnerable to climate variability [86]. In addition, there is a greater chance that crops will adapt under scenarios of increased rather than decreased rainfall [16].
Earlier studies have found a strong interrelationship between annual rainfall and temperature variability and maize production [87]. Low negative and low to moderate positive correlations have been found between mean temperature and precipitation with the silage maize yield, respectively [88]. For instance, it has been reported that climatic parameters account for 40.8% of maize yield under drier-than-normal rainfall conditions; and, soil moisture and minimum and maximum temperatures together accounted for approximately 75% of variations of maize yield under wetter-than-normal conditions [89]. Research has shown that for every 1 °C rise in temperature, the maize yield could be reduced by around 2–3% [17,67]; for example, in the southeastern United States, the indices were used in simulation models, revealing that for each 1 °C increase in summer temperature, maize yields could decrease by 4.6% [80]. However, for every 1 mm increase in precipitation, the maize yield increases by an insignificant amount of 0.014% [67]. Besides, CC affects crop evapotranspiration (ET) and therefore the irrigation water requirement [90].
A previous study in Mexico using linear mixed models (LMMs) to analyze the relationship between maize yield and multiple climate variables in rainfed and irrigated crop areas revealed that CC will have a strongly negative impact on yield in rainfed fields, while irrigated fields will remain stable. Projections indicate that yields from rainfed fields will be reduced significantly under future scenarios [91]. These findings are consistent with the results obtained in this study, since temperature is the climatological variable that had the greatest relationship with the yield, of both irrigated and rainfed maize. While precipitation, although it does have an impact on the productivity of rainfed maize, mainly, its relationship with yield was lower.
The study region is characterized by having an arid and semi-arid climate, with low precipitation; therefore, maize production depends largely on irrigation water, which, according to the analysis of this study, has favored the maize resistance to the impact of CC. However, due to the increase in temperature, evapotranspiration in arid and semi-arid areas is expected to increase, which can increase the requirement for agricultural irrigation [92]. The resilience of the maize crop to CC is strong [67] and besides, the crop stress can be mitigated by effective management [93]. Although water is essential for maize yield, irrigation has been demonstrated to be an effective adaptation strategy [94]. Improving irrigation increases the resistance of maize to CC [95], so the impact of precipitation on maize yield can be less significant [67]. Furthermore, improvements in cultivation technology and management level can be implemented [96].
Extreme climate indices are strongly correlated with the maize yield [17]. The patterns of the selected indices provide insight into the characteristics of extreme precipitation and temperature across CL including its trend behavior. It was found positive trends indicate that extreme weather events become more frequent and severe in that region, whereas negative trends of R20 mm, for example, would indicate that extreme precipitation events become less frequent and even the mean rain becomes weaker [31].
According to the results, the minimum and maximum temperatures were projected to increase, and the same trend has been reported by other studies around the world [97,98,99]. Furthermore, the rising temperature has caused severe droughts and significant yield losses in arid and semi-arid zones [100]. It is important to highlight that dry days have been increasing in the CL, which is corroborated by the consecutive dry-day index (CDD), used to describe the lower tail of the precipitation distribution often referred to as a drought indicator [31].
Although irrigation can serve as an effective mitigation strategy, without proper use and management of natural resources, mainly water, this can become unsustainable in the long term. Water availability must be a central consideration in the development of sustainable agricultural production systems [101], particularly in arid regions, such as CL, because they are more vulnerable to CC due to the scarcity of natural resources [102].

5. Conclusions

Changes in the extreme values of temperature and precipitation in CL over the study period were identified. A significant increase in temperature was observed, according to the Tn90p, Tx90p, TNx, TXx and TR20 indices. This phenomenon is exacerbating the drought conditions, which is corroborated by the CDD index. R95p in Lerdo was the only precipitation-based index that showed a significant increasing trend with 0.02 mm year−1. Regarding the influence of temperature on maize yield, it was observed that yield decreases after 33 °C, a finding of particular relevance since the temperature of the region has been increasing. This decline is expected to have a significant impact on maize productivity in the study region. Precipitation showed a stronger relationship with rainfed maize crops than with irrigated maize crops. This observation suggests that the adoption of irrigation serves as a strategic adaptation mechanism in the face of CC, thereby mitigating the adverse effects of climate variations on agricultural productivity. Future research should address the impact of irrigation on the deterioration of natural resources, particularly water availability, and study the impact of CC on other rainfed crops, since the results of this study demonstrated that rainfed maize is more vulnerable to climatic variations.

Author Contributions

Conceptualization, N.A.L.H. and R.T.C.; methodology, N.A.L.H.; formal analysis, N.A.L.H. and W.H.; investigation, N.A.L.H., A.R.M.S. and R.T.C.; data curation, A.R.M.S.; writing—original draft preparation, N.A.L.H., W.H., R.T.C., A.R.M.S. and V.M.R.M.; writing—review and editing, N.A.L.H.; visualization, N.A.L.H. and W.H.; supervision, N.A.L.H. and A.R.M.S.; project administration, N.A.L.H. and V.M.R.M.; funding acquisition, N.A.L.H. All authors have read and agreed to the published version of the manuscript.

Funding

This research was funded by the project “Determination of the optimal irrigation depth in near real time as a climate change adaptation/mitigation strategy”, SIGI number 12494136181, the National Institute of Agricultural and Livestock Forestry Research (INIFAP).

Institutional Review Board Statement

Not applicable.

Informed Consent Statement

Not applicable.

Data Availability Statement

The data presented in this study are available on request from the corresponding author.

Acknowledgments

The authors thank the National Institute of Agricultural and Livestock Forestry Research (INIFAP) for funding the project from which this research work is derived.

Conflicts of Interest

The authors declare no conflicts of interest.

Appendix A

Appendix A.1

Figure A1. Missing daily data (white strips) of PP (a), Tmax (b) and Tmin (c) for San Pedro (1), Ciudad Lerdo DGE (2) and Tlahualilo (3) weather stations, estimated to calculate the climate change indices.
Atmosphere 16 00455 g0a1

Appendix A.2

Figure A2. Monthly missing data (white strips) of PP (a), Tmax (b) and Tmin (c) of weather stations, estimated to analyze the influence of climate on maize yield.
Atmosphere 16 00455 g0a2

Appendix B

Appendix B.1

Figure A3. Temperature-based indices in CL from 1980 to 2020.
Atmosphere 16 00455 g0a3

Appendix B.2

Figure A4. Precipitation-based indices in CL from 1980 to 2020.
Atmosphere 16 00455 g0a4

References

  1. Kopeć, P. Climate Change—The Rise of Climate-Resilient Crops. Plants 2024, 13, 490. [Google Scholar] [CrossRef]
  2. World Meteorological Organization. International Meteorological Vocabulary, 2nd ed.; WMO: Geneva, Switzerland, 1992. [Google Scholar]
  3. Kotir, J.H. Climate change and variability in Sub-Saharan Africa: A review of current and future trends and impacts on agriculture and food security. Env. Dev. Sustain. 2011, 13, 587–605. [Google Scholar] [CrossRef]
  4. Penuelas, J.; Janssens, I.A.; Ciais, P.; Obersteiner, M.; Sardans, J. Anthropogenic global shifts in biospheric N and P concentrations and ratios and their impacts on biodiversity, ecosystem productivity, food security, and human health. Glob. Chang. Biol. 2020, 26, 1962–1985. [Google Scholar] [CrossRef]
  5. Crippa, M.; Solazzo, E.; Guizzardi, D.; Monforti-Ferrario, F.; Tubiello, F.N.; Leip, A. Food systems are responsible for a third of global anthropogenic GHG emissions. Nat. Food 2021, 2, 198–209. [Google Scholar] [CrossRef]
  6. IPCC. Summary for Policymakers. In Climate Change 2023: Synthesis Report. Contribution of Working Groups I, II and III to the Sixth Assessment Report of the Intergovernmental Panel on Climate Change; Lee, H., Ed.; IPCC: Geneva, Switzerland, 2023; pp. 1–34. [Google Scholar] [CrossRef]
  7. Rosa, L. Adapting agriculture to climate change via sustainable irrigation: Biophysical potentials and feedbacks. Environ. Res. Lett. 2022, 17, 06300. [Google Scholar] [CrossRef]
  8. Gołasa, P.; Wysokiński, M.; Bieńkowska-Gołasa, W.; Gradziuk, P.; Golonko, M.; Gradziuk, B.; Siedlecka, A.; Gromada, A. Sources of greenhouse gas emissions in agriculture, with particular emphasis on emissions from energy used. Energies 2021, 14, 3784. [Google Scholar] [CrossRef]
  9. Zampieri, M.; Ceglar, A.; Dentener, F.; Toreti, A. Wheat yield loss attributable to heat waves, drought and water excess at the global, national and subnational scales. Environ. Res. Lett. 2017, 12, 064008. [Google Scholar] [CrossRef]
  10. Pretty, J. Intensification for redesigned and sustainable agricultural systems. Science 2018, 362, eaav0294. [Google Scholar] [CrossRef]
  11. Mwongera, C.; Shikuku, K.M.; Twyman, J.; Läderach, P.; Ampaire, E.; Asten, P.V.; Twomlow, S.; Winowiecki, L.A. Climate smart agriculture rapid appraisal (CSA-RA): A tool for prioritizing context-specific climate smart agriculture technologies. Agric. Syst. 2017, 151, 192–203. [Google Scholar] [CrossRef]
  12. Rosa, L.; Chiarelli, D.D.; Rulli, M.C.; Dell’Angelo, J.; D’Odorico, P. Global agricultural economic water scarcity. Sci. Adv. 2020, 6, eaaz6031. [Google Scholar] [CrossRef]
  13. Chen, S.; Gong, B. Response and adaptation of agriculture to climate change: Evidence from China. J. Dev. Econ. 2021, 148, 102557. [Google Scholar] [CrossRef]
  14. Zhang, S.; Wang, S.; Yuan, L.; Liu, X.; Gong, B. The impact of epidemics on agricultural production and forecast of COVID-19. China Agric. Econ. Rev. 2020, 12, 409–425. [Google Scholar] [CrossRef]
  15. IPCC. Climate Change 2007: Mitigation of Climate Change. Contribution of Working Group III to the Fourth Assessment Report of the Intergovernmental Panel on Climate Change; Metz, B., Davidson, O.R., Bosch, P.R., Dave, R., Meyer, L.A., Eds.; Cambridge University Press: Cambridge, UK; New York, NY, USA, 2007; pp. 3–22. [Google Scholar]
  16. Tubierllo, F.; Schimidhuber, J.; Howden, M.; Neofotis, P.G.; Park, S.; Fernandes, E.; Thapa, D. Climate change response strategies for agriculture: Challenges and opportunities for the 21st Century. In Agriculture and Rural Development Discussion Paper 42; The World Bank: Washington, DC, USA, 2008. [Google Scholar]
  17. Chen, X.; Wang, L.; Niu, Z.; Zhang, M.; Li, C.; Li, J. The effects of projected climate change and extreme climate on maize and rice in the Yangtze River Basin, China. Agric. For. Meteorol. 2020, 107867, 282–283. [Google Scholar] [CrossRef]
  18. Li, X.; Takahashi, T.; Suzuki, N.; Kaiser, H.M. The impact of climate change on maize yields in the United States and China. Agric. Syst. 2011, 104, 348–353. [Google Scholar] [CrossRef]
  19. Malhi, G.S.; Kaur, M.; Kaushik, P. Impact of Climate Change on Agriculture and Its Mitigation Strategies: A Review. Sustainability 2021, 13, 1318. [Google Scholar] [CrossRef]
  20. Chen, H.; Liang, Z.; Liu, Y.; Jiang, Q.; Xie, S. Effects of drought and flood on crop production in China across 1949–2015: Spatial heterogeneity analysis with Bayesian hierarchical modeling. Nat. Hazards 2018, 92, 525–541. [Google Scholar] [CrossRef]
  21. Ummenhofer, C.C.; Xu, H.; Twine, T.E.; Girvetz, E.H.; Mccarthy, H.R.; Chhetri, N.B.; Nicholas, K.A. How climate change affects extremes in maize and wheat yield in two cropping regions. J. Clim. 2015, 28, 4653–4687. [Google Scholar] [CrossRef]
  22. Zhang, H.; Zhou, G.; Liu, D.L.; Wang, B.; Xiao, D.; He, L. Climate-associated rice yield change in the Northeast China Plain: A simulation analysis based on CMIP5 multi-model ensemble projection. Sci. Total Environ. 2019, 666, 126–138. [Google Scholar] [CrossRef] [PubMed]
  23. Yang, H.; Gu, X.; Ding, M.; Lu, W.; Lu, D. Heat stress during grain filling affects activities of enzymes involved in grain protein and starch synthesis in waxy maize. Sci. Rep. 2018, 8, 15665. [Google Scholar] [CrossRef]
  24. Bheemanahalli, R.; Vennam, R.R.; Ramamoorthy, P.; Reddy, K.R. Effects of post-flowering heat and drought stresses on physiology, yield, and quality in maize (Zea mays L.). Plant Stress 2022, 6, 100106. [Google Scholar] [CrossRef]
  25. Mirgol, B.; Nazari, M. Possible scenarios of winter wheat yield reduction of dryland Qazvin Province, Iran, based on prediction of temperature and precipitation till the end of the century. Climate 2018, 6, 78. [Google Scholar] [CrossRef]
  26. Xu, H.; Twine, T.E.; Girvetz, E. Climate change and maize yield in Iowa. PLoS ONE 2016, 11, e0156083. [Google Scholar] [CrossRef]
  27. Chervenkov, H.; Slavov, K. ETCCDI Climate indices for assessment of the recent climate over Southeast Europe. In Advances in High Performance Computing. HPC 2019. Studies in Computational Intelligence; Dimov, I., Fidanova, S., Eds.; Springer: Cham, Switzerland, 2021; Volume 902, pp. 398–412. [Google Scholar] [CrossRef]
  28. Wiebe, K.; Robinson, S.; Cattaneo, A. Climate change, agriculture and food security: Impacts and the potential for adaptation and mitigation. In Sustainable Food Agriculture; Campanhola, C., Pandey, S., Eds.; Academic Press: Rome, Italy, 2019; pp. 55–74. [Google Scholar] [CrossRef]
  29. Horn, B.; Ferreira, C.; Kalantari, Z. Links between food trade, climate change and food security in developed countries: A case study of Sweden. Ambio 2022, 51, 943–954. [Google Scholar] [CrossRef]
  30. Silva, T.R.B.F.; Santos, C.A.C.d.; Silva, D.J.F.; Santos, C.A.G.; da Silva, R.M.; de Brito, J.I.B. Climate indices-based analysis of rainfall spatiotemporal variability in Pernambuco State, Brazil. Water 2022, 14, 2190. [Google Scholar] [CrossRef]
  31. Yu, Y.; Schneider, U.; Yang, S.; Becker, A.; Ren, Z. Evaluating the GPCC Full Data Daily Analysis Version 2018 through ETCCDI indices and comparison with station observations over mainland of China. Theor. Appl. Climatol. 2020, 142, 835–845. [Google Scholar] [CrossRef]
  32. Peterson, T.C.; Folland, C.; Gruza, G.; Hogg, W.; Mokssit, A.; Plummer, N. Report on the Activities of the Working Group on Climate Change Detection and Related Rapporteurs, 1998–2001; WCDMP (Series); World Meteorological Organization: Geneva, Switzerland, 2001. [Google Scholar]
  33. Lisboa, R.C.; de Mello, B.G.M.; Barros, G.H.; dos Santos, S.D.F.; Lins da Rocha, J.R.; de Araujo, S.M.; Herdies, D.L. Analysis of climate extremes indices over northeast Brazil from 1961 to 2014. Weather Clim. Extrem. 2020, 28, 100254. [Google Scholar] [CrossRef]
  34. Torres-Martínez, J.A.; Mora, A.; Mahlknecht, J.; Daesslé, L.W.; Cervantes-Avilés, P.A.; Ledesma-Ruiz, R. Estimation of nitrate pollution sources and transformations in groundwater of an intensive livestock-agricultural area (Comarca Lagunera), combining major ions, stable isotopes and MixSIAR model. Environ. Pollut. 2021, 269, 115445. [Google Scholar] [CrossRef]
  35. García, E. Modifications to the Köppen Climate Classification System to Adapt It to the Conditions of the Mexican Republic; UNAM: Ciudad de México, Mexico, 1973; p. 246. (In Spanish) [Google Scholar]
  36. National Institute of Statistics and Geography (INEGI). Vector Data Set of Climatic Units, Scale 1:1 000 000, Edition 2008; INEGI: Aguascalientes, Mexico, 2008. Available online: https://www.inegi.org.mx/app/biblioteca/ficha.html?upc=702825267568 (accessed on 12 January 2024). (In Spanish)
  37. National Metereological Service. Normales Climatológicas Por Estado. Available online: https://smn.conagua.gob.mx/es/ (accessed on 26 January 2024). (In Spanish)
  38. Guijarro, P.J.A. Homogenization of Climate Series with Climatol; Agencia Estatal de Meteorología (AEMET): Islas Baleares, Spain, 2018. (In Spanish)
  39. Aguilar, E.; Auer, I.; Brunet, M.; Peterson, T.C.; Wieringa, J. Guidelines on Climate Metadata and Homogenization, WCDMP-No. 53, WMO-TD No. 1186; World Meteorological Organization: Geneve, Switzerland, 2003. [Google Scholar]
  40. Expert Team on Climate Change Detection and Indices (ETCCDI). ETCCDI Climate Change Indices. Available online: https://etccdi.pacificclimate.org/ (accessed on 15 November 2023).
  41. RClimDex. Available online: https://github.com/ECCC-CDAS/RClimDex/tree/master (accessed on 30 January 2024).
  42. Zhang, X.; Feng, Y.; Chan, R. Introduction to RClimDex v1.9; Climate Reseach Division Environment Canada: Toronto, ON, Canada, 2018. Available online: https://github.com/ECCC-CDAS/RClimDex/blob/master/inst/doc/manual.pdf (accessed on 19 March 2024).
  43. Moura Cardoso do Vale, T.; Helena Constantino Spyrides, M.; De Melo Barbosa Andrade, L.; Guedes Bezerra, B.; Evangelista da Silva, P. Subsistence agriculture productivity and climate extreme events. Atmosphere 2020, 11, 1287. [Google Scholar] [CrossRef]
  44. Aditya, E.; Gusmayanti, E.; Sudrajat, J. Rainfall trend analysis using Mann-Kendall and Sen’s slope estimator test in West Kalimantan. In Proceedings of the IOP Conference Series: Earth and Environmental Science, Volume 893, 2nd International Conference on Tropical Meteorology and Atmospheric Sciences, Jakarta, Indonesia, 23–25 March 2021. [Google Scholar]
  45. Bhuyan, M.D.I.; Islam, M.M.; Bhuiyan, M.E.K. A trend analysis of temperature and rainfall to predict climate change for northwestern region of Bangladesh. Am. J. Clim. Chang. 2018, 7, 115–134. [Google Scholar] [CrossRef]
  46. Kumar, S.; Chanda, K.; Pasupuleti, S. Spatiotemporal analysis of extreme indices derived from daily precipitation and temperature for climate change detection over India. Theor. Appl. Climatol. 2020, 140, 343–357. [Google Scholar] [CrossRef]
  47. Panda, D.K.; Panigrahi, P.; Mohanty, S.; Mohanty, R.K.; Sethi, R.R. The 20th century transitions in basic and extreme monsoon rainfall indices in India: Comparison of the ETCCDI indices. Atmos. Res. 2016, 181, 220–235. [Google Scholar] [CrossRef]
  48. Vinod, D.; Mahesha, A. Large-scale atmospheric teleconnections and spatiotemporal variability of extreme rainfall indi-ces across India. J. Hydrol. 2024, 628, 130584. [Google Scholar] [CrossRef]
  49. Alavinia, S.H.; Zarei, M. Climate change trends analysis using by extreme indices of long term rainfall and temperature in South East of Iran. J. Reg. Plann. 2022, 11, 119–134. [Google Scholar] [CrossRef]
  50. Mann, H.B. Nonparametric test against trend. Econometrica 1945, 13, 245–259. [Google Scholar] [CrossRef]
  51. Kendall, M.G. Rank Correlation Methods, 4th ed.; Charles Griffin: London, UK, 1975. [Google Scholar]
  52. Partal, T.; Kahya, E. Trend analysis in Turkish precipitation data. Hydrol. Process. 2006, 20, 2011–2026. [Google Scholar] [CrossRef]
  53. Kalita, R.; Kalita, D.; Saxena, A. Trends in extreme climate indices in Cherrapunji for the period 1979 to 2020. J. Earth Syst. Sci. 2023, 132, 74. [Google Scholar] [CrossRef]
  54. Sen, P.K. Estimates of the regression coefficient based on Kendall’s tau. J. Am. Stat. Assoc. 1968, 63, e1379–e1389. [Google Scholar] [CrossRef]
  55. Statistical Yearbook of Agricultural Production of the Agri-Food and Fisheries Information Service (SIAP). Available online: https://nube.siap.gob.mx/cierreagricola/ (accessed on 15 January 2024). (In Spanish).
  56. Cao, L.; Zhu, Y.; Tang, G.; Yuan, F.; Yan, Z. Climatic warming in China according to a homogenized dataset from 2419 stations. Int. J. Climatol. 2016, 36, 4384–4392. [Google Scholar] [CrossRef]
  57. Chu, P.S.; Chen, Y.R.; Schroeder, T.A. Changes in precipitation extremes in the Hawaiian Islands in a warming climate. J. Clim. 2010, 23, 4881–4900. [Google Scholar] [CrossRef]
  58. Zafar, U.; Anjum, M.N.; Hussain, S.; Sultan, M.; Rasool, G.; Riaz, M.Z.B.; Shoaib, M.; Asif, M. Analyzing the spatiotem-poral changes in climatic extremes in cold and mountainous environment: Insights from the Himalayan Mountains of Pakistan. Atmosphere 2024, 15, 1221. [Google Scholar] [CrossRef]
  59. Yin, H.; Sun, Y. Characteristics of extreme temperature and precipitation in China in 2017 based on ETCCDI indices. Adv. Clim. Chang. Res. 2019, 9, 218–226. [Google Scholar] [CrossRef]
  60. Acevedo, M.; Pixley, K.; Zinyengere, N.; Meng, S.; Tufan, H.; Cichy, K.; Bizikova, L.; Isaacs, K.; Ghezzi-Kopel, K.; Porciello, J.A. Scoping review of adoption of climate-resilient crops by small-scale producers in low- and middle-income countries. Nat. Plants 2020, 6, 1231–1241. [Google Scholar] [CrossRef]
  61. Rivero, R.M.; Mittler, R.; Blumwald, E.; Zandalinas, S.I. Developing climate-resilient crops: Improving plant tolerance to stress combination. Plant J. 2022, 109, 373–389. [Google Scholar] [CrossRef]
  62. Zhang, L.; Zhang, Z.; Tao, F.; Luo, Y.; Cao, J.; Li, Z.; Xie, R.; Li, S. Planning maize hybrids adaptation to future climate change by integrating crop modelling with machine learning. Environ. Res. Lett. 2021, 16, 124043. [Google Scholar] [CrossRef]
  63. Nilsson, M.; Griggs, D.; Visbeck, M. Policy: Map the interactions between sustainable development goals. Nature 2016, 534, 320–322. [Google Scholar] [CrossRef] [PubMed]
  64. Mendelsohn, R. The impact of climate change on agriculture in developing countries. J. Nat. Res. Policy Res. 2009, 1, 5–19. [Google Scholar] [CrossRef]
  65. Roitsch, T.; Himanen, K.; Chawade, A.; Jaakola, L.; Nehe, A.; Alexandersson, E. Functional phenomics for improved climate resilience in Nordic agriculture. J. Exp. Bot. 2022, 73, 5111–5127. [Google Scholar] [CrossRef]
  66. Vogel, E.; Donat, M.D.; Alexander, L.; Meinshausen, M.; Ray, D.K.; Karoly, D.; Meinshausen, N.; Frieler, K. The effects of climate extremes on global agricultural yields. Environ. Res. Lett. 2019, 14, 054010. [Google Scholar] [CrossRef]
  67. Wu, J.; Zhang, J.; Ge, Z.; Xing, L.; Han, S.; Shen, C.; Kong, F. Impact of climate change on maize yield in China from 1979 to 2016. J. Integr. Agric. 2021, 20, 289–299. [Google Scholar] [CrossRef]
  68. Chakraborty, S.; Pattanayak, A.; Mandal, S.; Das, M.; Roychowdhury, R. An overview of climate change: Causes, trends and implications. In Crop Improvement in the Era of Climate Change; IK International Publishing House: New Delhi, India, 2014; pp. 1–29. [Google Scholar]
  69. IPCC. Climate Change 2021: The Physical Science Basis. Contribution of Working Group I to the Sixth Assessment Report of the Intergovernmental Panel on Climate Change; Masson-Delmotte, V., Zhai, P., Pirani, A., Connors, S.L., Péan, C., Berger, S., Caud, N., Chen, Y., Goldfarb, L., Gomis, M.I., et al., Eds.; Cambridge University Press: Cambridge, UK; New York, NY, USA, 2021; pp. 33–144. [Google Scholar] [CrossRef]
  70. Müller, G.V.; Lovino, M.A.; Sgroi, L.C. Observed and projected changes in temperature and precipitation in the Core Crop Region of the Humid Pampa, Argentina. Climate 2021, 9, 40. [Google Scholar] [CrossRef]
  71. Dos Reis, L.C.; Silva, C.M.S.E.; Bezerra, B.G.; Mutti, P.R.; Spyrides, M.H.C.; Da Silva, P.E. Analysis of Climate Extreme Indices in the MATOPIBA Region, Brazil. Pure Appl. Geophys. 2020, 177, 4457–4478. [Google Scholar] [CrossRef]
  72. Fiebig-Wittmaack, M.; Astudillo, O.; Wheaton, E.; Wittrock, V.; Perez, C.; Ibacache, A. Climatic trends and impact of climate change on agriculture in an arid Andean valley. Climatic Chang. 2012, 111, 819–833. [Google Scholar] [CrossRef]
  73. García-Cueto, O.R.; Santillán-Soto, N.; López-Velázquez, E.; Reyes-López, J.; Cruz-Sotelo, S.; Ojeda-Benítez, S. Trends of climate change indices in some Mexican cities from 1980 to 2010. Theor. Appl. Climatol. 2019, 137, 775–790. [Google Scholar] [CrossRef]
  74. Jentsch, A.; Beierkuhnlein, C. Research frontiers in climate change: Effects of extreme meteorological events on ecosystems. Comptes Rendus Geosci. 2008, 340, 621–628. [Google Scholar] [CrossRef]
  75. Gutiérrez-Ruacho, O.G.; Brito-Castillo, L.; Díaz-Castro, S.C.; Watts, C.J. Trends in rainfall and extreme temperatures in northwestern Mexico. Clim. Res. 2010, 42, 133–142. [Google Scholar] [CrossRef]
  76. Cárdenas, O.L.; Campos, M.N.; Sevilla, N.P.M.; Guerrero, R.R.; Diéguez, E.T.; Ruiz, P.Á. Hydroclimatic trends in areas with high agricultural productivity in Northern Mexico. Pol. J. Environ. Stud. 2015, 24, 1165–1180. [Google Scholar] [CrossRef]
  77. Adams, R.M.; Hurd, B.H.; Lenhart, S.; Leary, N. Effects of global climate change on agriculture: An interpretative review. Clim. Res. 1998, 11, 19–30. [Google Scholar] [CrossRef]
  78. Petrović, G.; Ivanović, T.; Knežević, D.; Radosavac, A.; Obhođaš, I.; Brzaković, T.; Golić, Z.; Radičević, T.D. Assessment of climate change impact on maize production in Serbia. Atmosphere 2023, 14, 110. [Google Scholar] [CrossRef]
  79. Siddik, M.A.; Zhang, J.; Chen, J.; Qian, H.; Jiang, Y.; Raheem, A.K.; Deng, A.; Song, Z.; Zheng, C.; Zhang, W. Responses of indica rice yield and quality to extreme high and low temperatures during the reproductive period. Eur. J. Agron. 2019, 106, 30–38. [Google Scholar] [CrossRef]
  80. Cammarano, D.; Tian, D. The effect of projected climate and climate extremes on a winter and summer crops in the southeast USA. Agric. For. Meteorol. 2018, 248, 109–118. [Google Scholar] [CrossRef]
  81. Juroszek, P.; Tiedemann, A.V. Climatic changes and the potential future importance of maize diseases: A short review. J. Plant Dis. Prot. 2013, 120, 49–56. [Google Scholar] [CrossRef]
  82. Xu, R.; Guan, K.; Zhao, L.; Peng, B.; Miao, C.; Fu, B. Divergent responses of maize yield to precipitation in the United States. Environ. Res. Lett. 2022, 17, 014016. [Google Scholar] [CrossRef]
  83. Villa-Falfán, C.; Valdés-Rodríguez, O.A.; Vázquez-Aguirre, J.L.; Salas-Martínez, F. Climate indices and their impact on maize yield in Veracruz, Mexico. Atmosphere 2023, 14, 778. [Google Scholar] [CrossRef]
  84. World Meteorological Organization. El Estado del Clima en América Latina y el Caribe 2020; WMO: Genève, Switzerland, 2021; ISBN 9789263312723. [Google Scholar]
  85. Escalante-Sandoval, C.; Nuñez-Garcia, P. Meteorological drought features in northern and northwestern parts of Mexico under different climate change scenarios. J. Arid. Land 2017, 9, 65–75. [Google Scholar] [CrossRef]
  86. Dobler-Morales, C.; Bocco, G. Social and environmental dimensions of drought in Mexico: An integrative review. Int. J. Disaster Risk Reduct. 2021, 55, 102067. [Google Scholar] [CrossRef]
  87. Aninagyei, I.; Appiah, D.O. Analysis of rainfall and temperature effects on maize and rice production in Akim Achiase, Ghana. Sch. Acad. J. Biosci. 2014, 2, 930–942. [Google Scholar] [CrossRef]
  88. Maitah, M.; Malec, K.; Maitah, K. Influence of precipitation and temperature on maize production in the Czech Republic from 2002 to 2019. Sci. Rep. 2021, 11, 10467. [Google Scholar] [CrossRef] [PubMed]
  89. Atiah, W.A.; Amekudzi, L.K.; Akum, R.A.; Quansah, E.; Antwi-Agyei, P.; Danuoe, S.K. Climate variability and impacts on maize (Zea mays) yield in Ghana, West Africa. Q. J. R. Meteorol. Soc. 2022, 148, 185–198. [Google Scholar] [CrossRef]
  90. Quiroga, S.; Iglesias, A. A comparison of the climate risks of cereal, citrus, grapevine and olive production in Spain. Agric. Syst. 2009, 101, 91–100. [Google Scholar] [CrossRef]
  91. Ureta, C.; González, E.J.; Espinosa, A.; Trueba, A.; Piñeyro-Nelson, A.; Álvarez-Buylla, E.R. Maize yield in Mexico under climate change. Agric. Syst. 2020, 177, 102697. [Google Scholar] [CrossRef]
  92. Djaman, K.; O’Neill, M.; Owen, C.K.; Smeal, D.; Koudahe, K.; West, M.; Allen, S.; Lombard, K.; Irmak, S. Crop evapotranspiration, irrigation water requirement and water productivity of maize from meteorological data under semiarid climate. Water 2018, 10, 405. [Google Scholar] [CrossRef]
  93. Molla, M.S.H.; Kumdee, O.; Wongkaew, A.; Khongchiu, P.; Worathongchai, N.; Alam, M.R.; Mahmud, A.-A.; Nakasathien, S. Potentiality of sustainable maize production under rainfed conditions in the tropics by triggering agro-physio-biochemical traits ascertained from a greenhouse. Plants 2023, 12, 4192. [Google Scholar] [CrossRef] [PubMed]
  94. Kang, S.Z.; Hao, X.M.; Du, T.S.; Tong, L.; Su, X.L.; Lu, H.N.; Li, X.L.; Huo, Z.L.; Li, S.; Ding, R.S. Improving agricultural water productivity to ensure food security in China under changing environment: From research to practice. Agric. Water Manag. 2017, 179, 5–17. [Google Scholar] [CrossRef]
  95. Zhou, L.; Turvey, C.G. Climate change, adaptation and China’s grain production. China Econ. Rev. 2014, 28, 72–89. [Google Scholar] [CrossRef]
  96. Chloupek, O.; Hrstkova, P.; Schweigert, P. Yield and its stability, crop diversity, adaptability and response to climate change, weather and fertilisation over 75 years in the Czech Republic in comparison to some European countries. Field Crop. Res. 2004, 85, 167–190. [Google Scholar] [CrossRef]
  97. Thomas, R.K.; Zhang, R.; Horowitz, L.W. Prospects for a prolonged slowdown in global warming in the early 21st century. Nat. Communities 2016, 7, 13676. [Google Scholar] [CrossRef]
  98. Mirgol, B.; Nazari, M.; Eteghadipour, M. Modelling climate change impact on irrigation water requirement and yield of winter wheat (Triticum aestivum L.), barley (Hordeum vulgare L.), and fodder maize (Zea mays L.) in the semi-arid Qazvin Plat-eau, Iran. Agriculture 2020, 10, 60. [Google Scholar] [CrossRef]
  99. Majhi, S.; Pattnayak, K.C.; Pattnayak, R. Projections of rainfall and surface temperature over Nabarangpur district using multiple CMIP5 models in RCP 4.5 and 8.5 scenarios. Int. J. Appl. Res. 2016, 2, 399–405. [Google Scholar]
  100. Andreadis, K.M.; Lettenmaier, D.P. Trends in 20th century drought over the continental United States. Geophys. Res. Lett. 2006, 33, L10403. [Google Scholar] [CrossRef]
  101. Zampieri, M.; Carmona, G.G.; Dentener, F.; Gumma, M.K.; Salomon, P.; Seguini, L.; Toreti, A. Surface Freshwater Limitation Explains Worst Rice Production Anomaly in India in 2002. Remote Sens. 2018, 10, 244. [Google Scholar] [CrossRef]
  102. Habib-ur-Rahman, M.; Ahmad, A.; Raza, A.; Hasnain, M.U.; Alharby, H.F.; Alzahrani, Y.M.; Bamagoos, A.A.; Hakeem, K.R.; Ahmad, S.; Nasim, W.; et al. Impact of climate change on agricultural production; Issues, challenges, and opportunities in Asia. Front. Plant Sci. 2022, 13, 925548. [Google Scholar] [CrossRef] [PubMed]
Figure 1. Location of the CL, Mexico.
Atmosphere 16 00455 g001
Figure 2. Types of climates of the CL, Mexico.
Atmosphere 16 00455 g002
Figure 3. Spatial trend of indices in CL from 1980 to 2020.
Atmosphere 16 00455 g003aAtmosphere 16 00455 g003b
Figure 4. Trends of precipitation (a), maximum temperature, minimum temperature, average temperature (b) and the yield of irrigated maize in the CL.
Atmosphere 16 00455 g004
Figure 5. Trends of precipitation (a), maximum temperature, minimum temperature, average temperature (b) and the yield of rainfed maize in the CL.
Atmosphere 16 00455 g005
Table 1. Weather stations used in this study.
Altitude (m a.s.l.)Latitude (°)Longitude (°)CodeNameMunicipalityState
110025.757222−102.9955565036San PedroSan PedroCoahuila
130025.116111−102.6322225004Bajío de AhuichilaViescaCoahuila
110026.4825−103.0352785159AcatitaFrancisco I. MaderoCoahuila
110026.106389−103.44277810085TlahualiloTlahualiloDurango
118826.323889−104.35111110005CeballosMapimíDurango
114025.546111−103.52194410108Ciudad Lerdo (DGE)LerdoDurango
134625.183333−104.562510098Rodeo (DGE)RodeoDurango
217524.251389−103.79555610135CuauhtémocCuencaméDurango
152524.687778−103.22638910080Simón BolívarGeneral Simón BolívarDurango
153124.631389−102.78277810099San Juan de Gpe San Juan de GuadalupeDurango
Table 2. Climate indices derived from daily rainfall data and maximum and minimum temperatures, with definitions and units, used in this study.
IDIndicator Name DefinitionUnits
TN90pWarm nights Percentage of days when TN > 90th percentile Days
TNxMax Tmin Monthly maximum value of daily minimum temp °C
TR20Tropical nights Annual count when TN (daily minimum) > 20 °C Days
TX90pWarm days Percentage of days when TX > 90th percentile Days
TXxMax Tmax Monthly maximum value of daily maximum temp °C
DTRDiurnal temperature range Monthly mean difference between TX and TN °C
CDDConsecutive dry days Maximum number of consecutive days with RR < 1 mm Days
R20Number of very heavy precipitation days Annual count of days when PRCP ≥ 20 mm Days
R95pVery wet days Annual total PRCP when RR > 95th percentile mm
R99pExtremely wet days Annual total PRCP when RR > 99th percentile mm
Table 3. Z values and Sen’s slope for ETCDDI indices of CL from 1980 to 2020.
ETCCDI IndexLerdoSan PedroTlahualilo
Z ValueSen’s SlopeZ ValueSen’s SlopeZ ValueSen’s Slope
Tn90p5.99 *0.415.80 *0.314.00 *0.21
Tx90p4.83 *0.344.03 *0.252.91 *0.17
TNx4.55 *0.074.00 *0.053.13 *0.04
TXx3.38 *0.051.700.030.730
TR205.53 *0.686.01 *1.891.710.46
DTR0.180−2.61 *−0.020.480.01
CDD0.440.310.530.370.940.59
R95p2.24 *0.8600−0.280
R99p0.6700.7600.650
R20mm0000−0.530
Values with * correspond to the trends significant at the 5% level (p < 0.05).
Disclaimer/Publisher’s Note: The statements, opinions and data contained in all publications are solely those of the individual author(s) and contributor(s) and not of MDPI and/or the editor(s). MDPI and/or the editor(s) disclaim responsibility for any injury to people or property resulting from any ideas, methods, instructions or products referred to in the content.

