
Southwest Pacific Tropical Cyclone Rapid Intensification Classification Utilizing Machine Learning

Abstract
1. Introduction
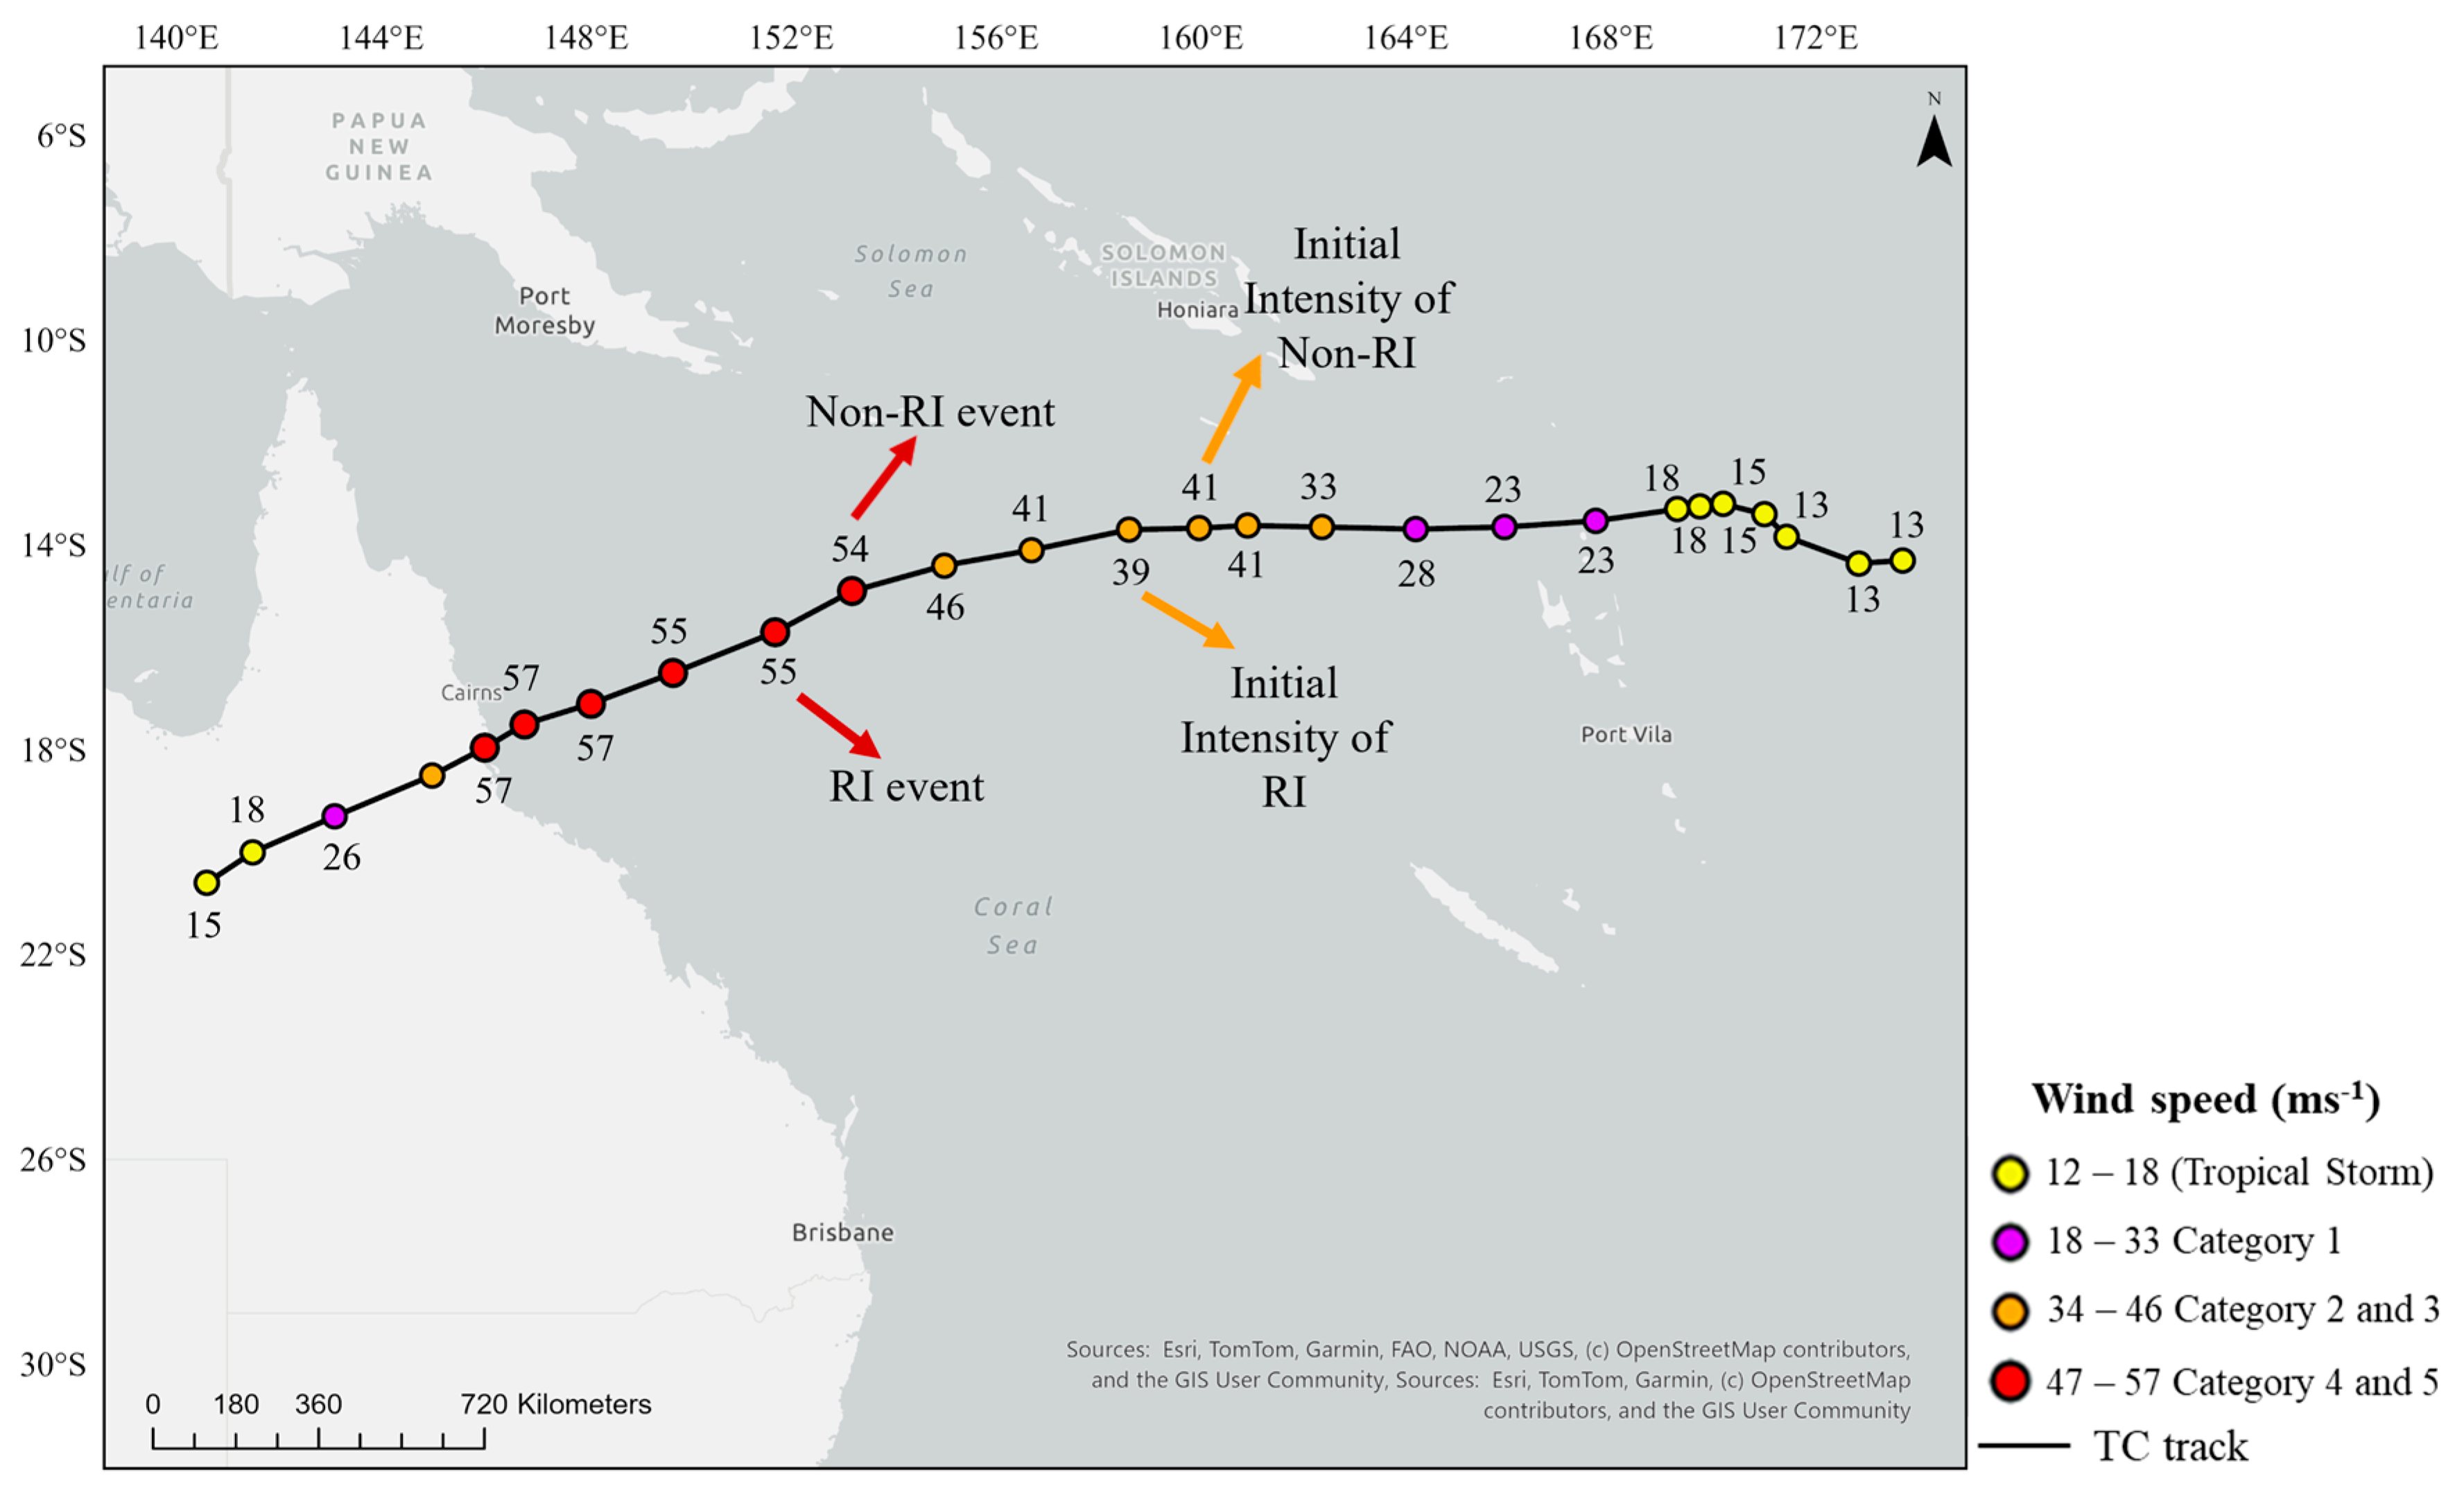
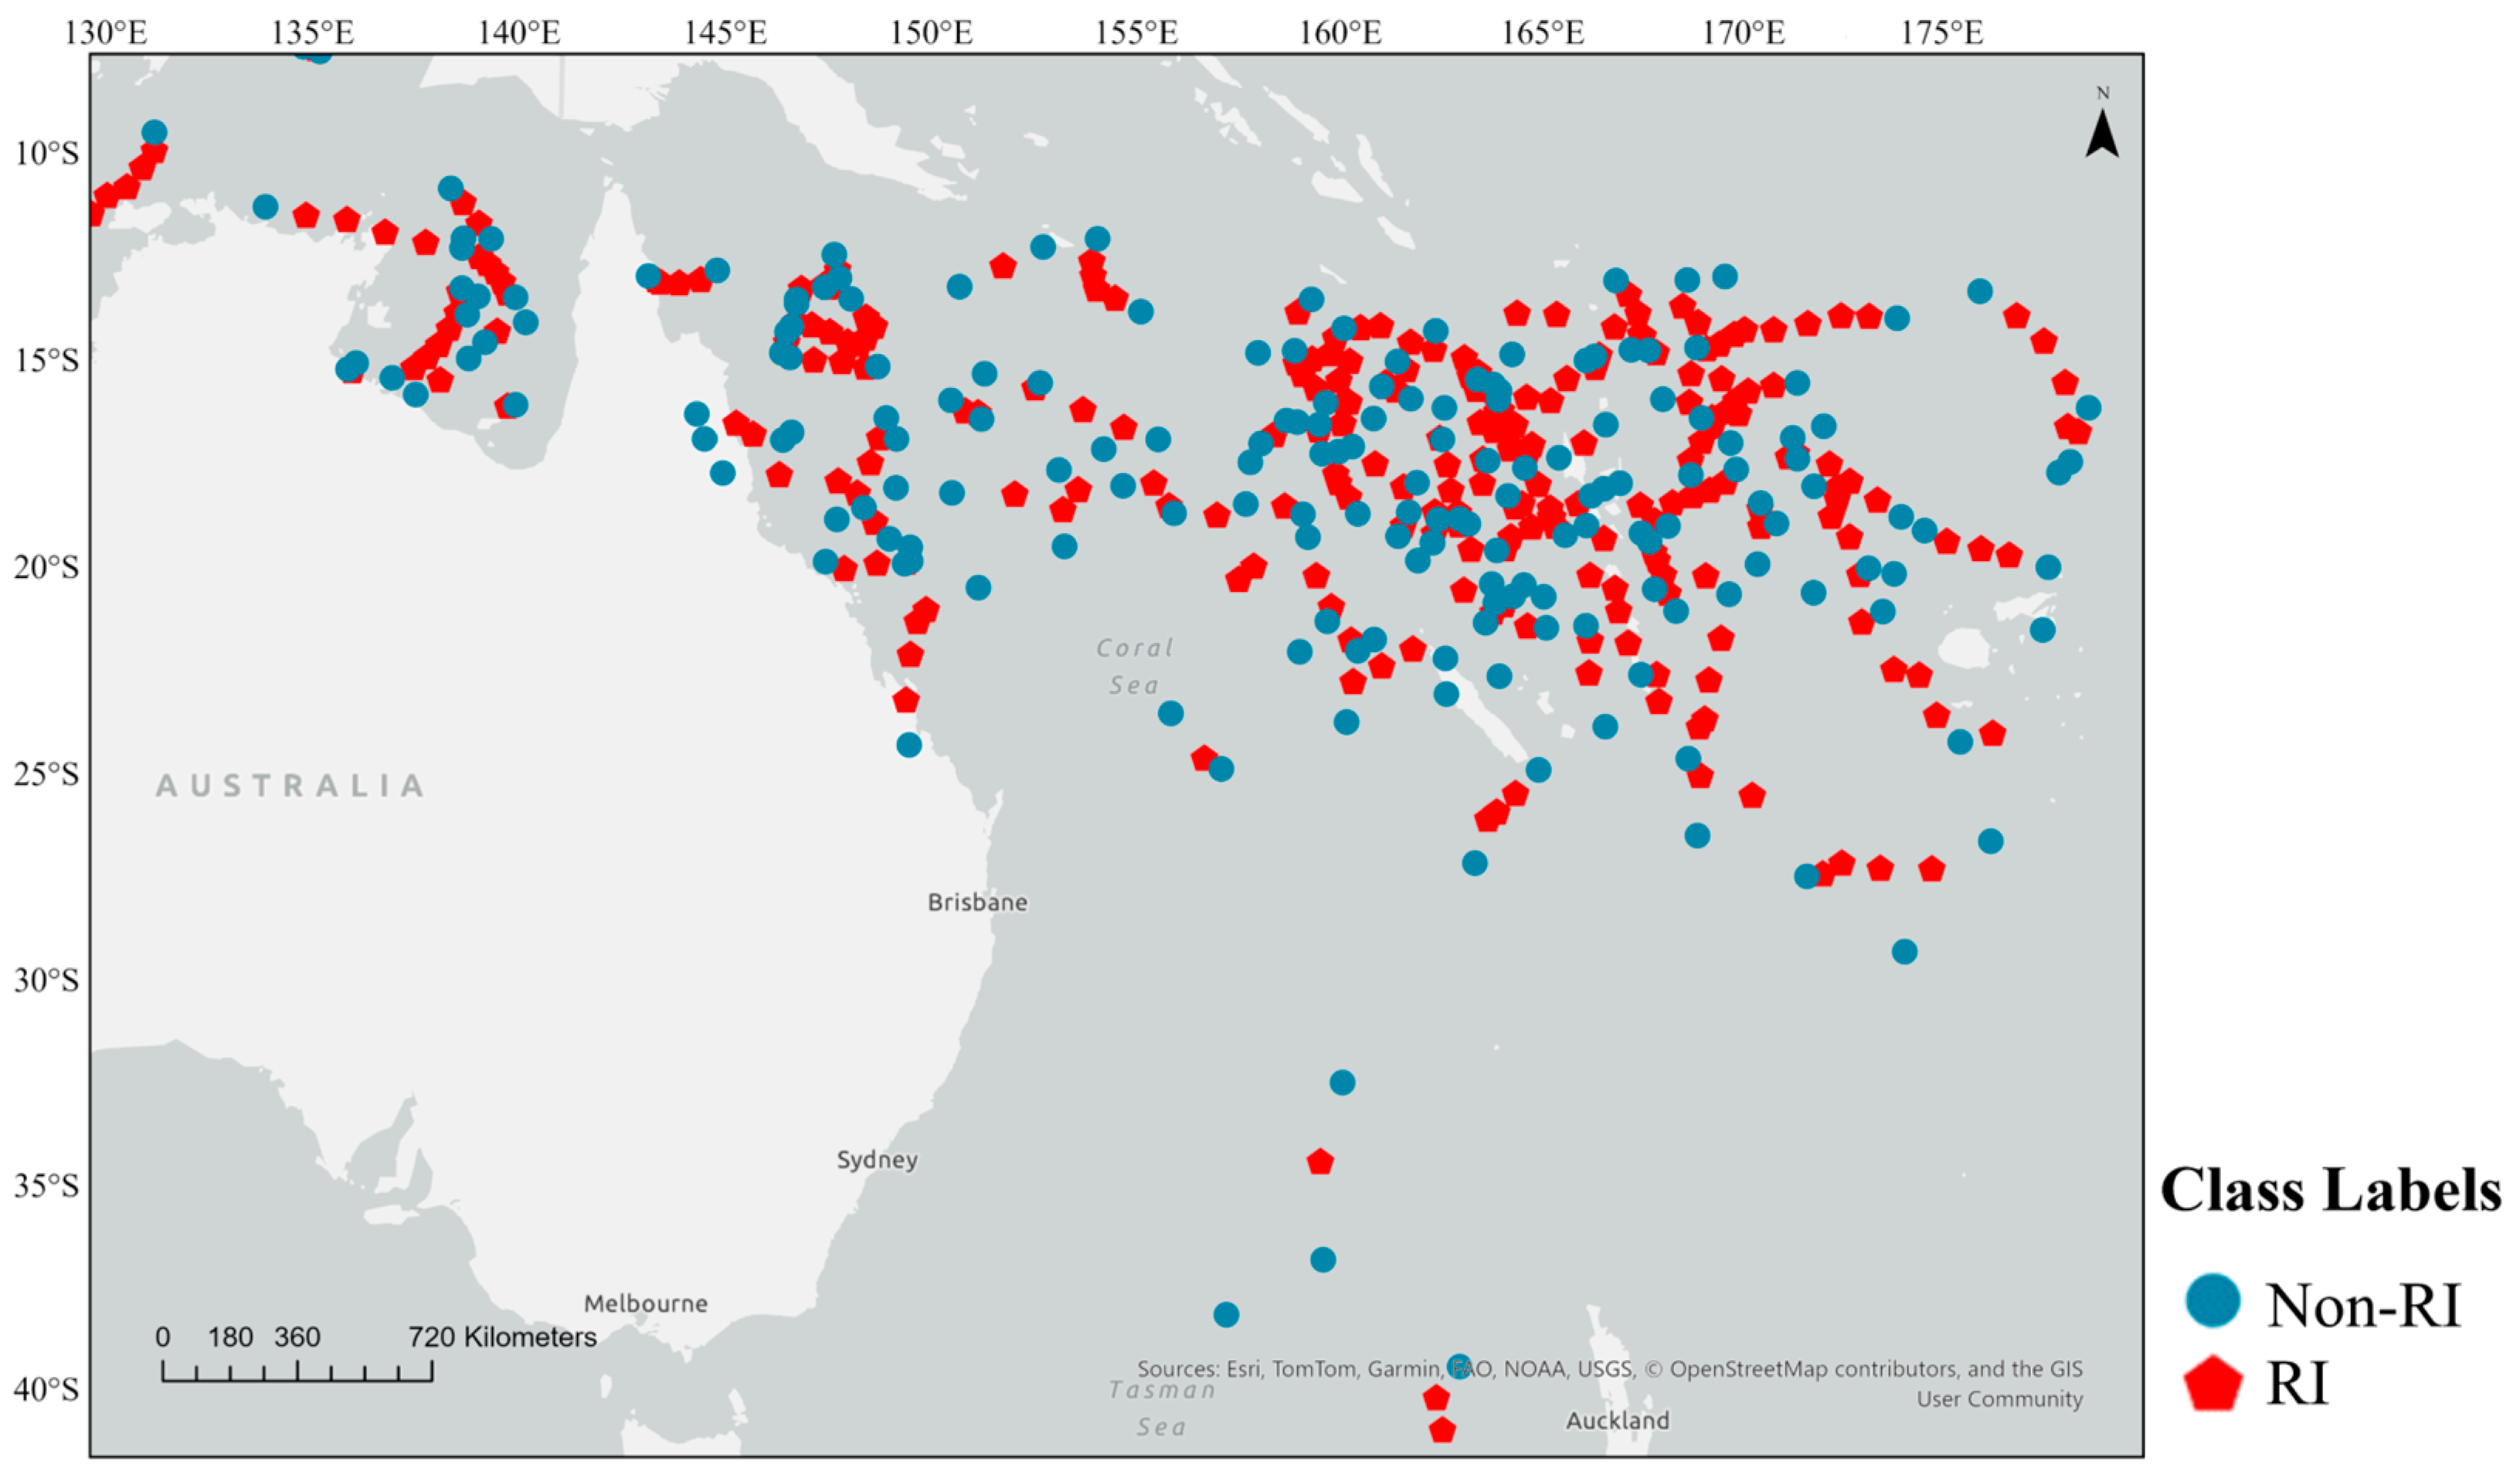
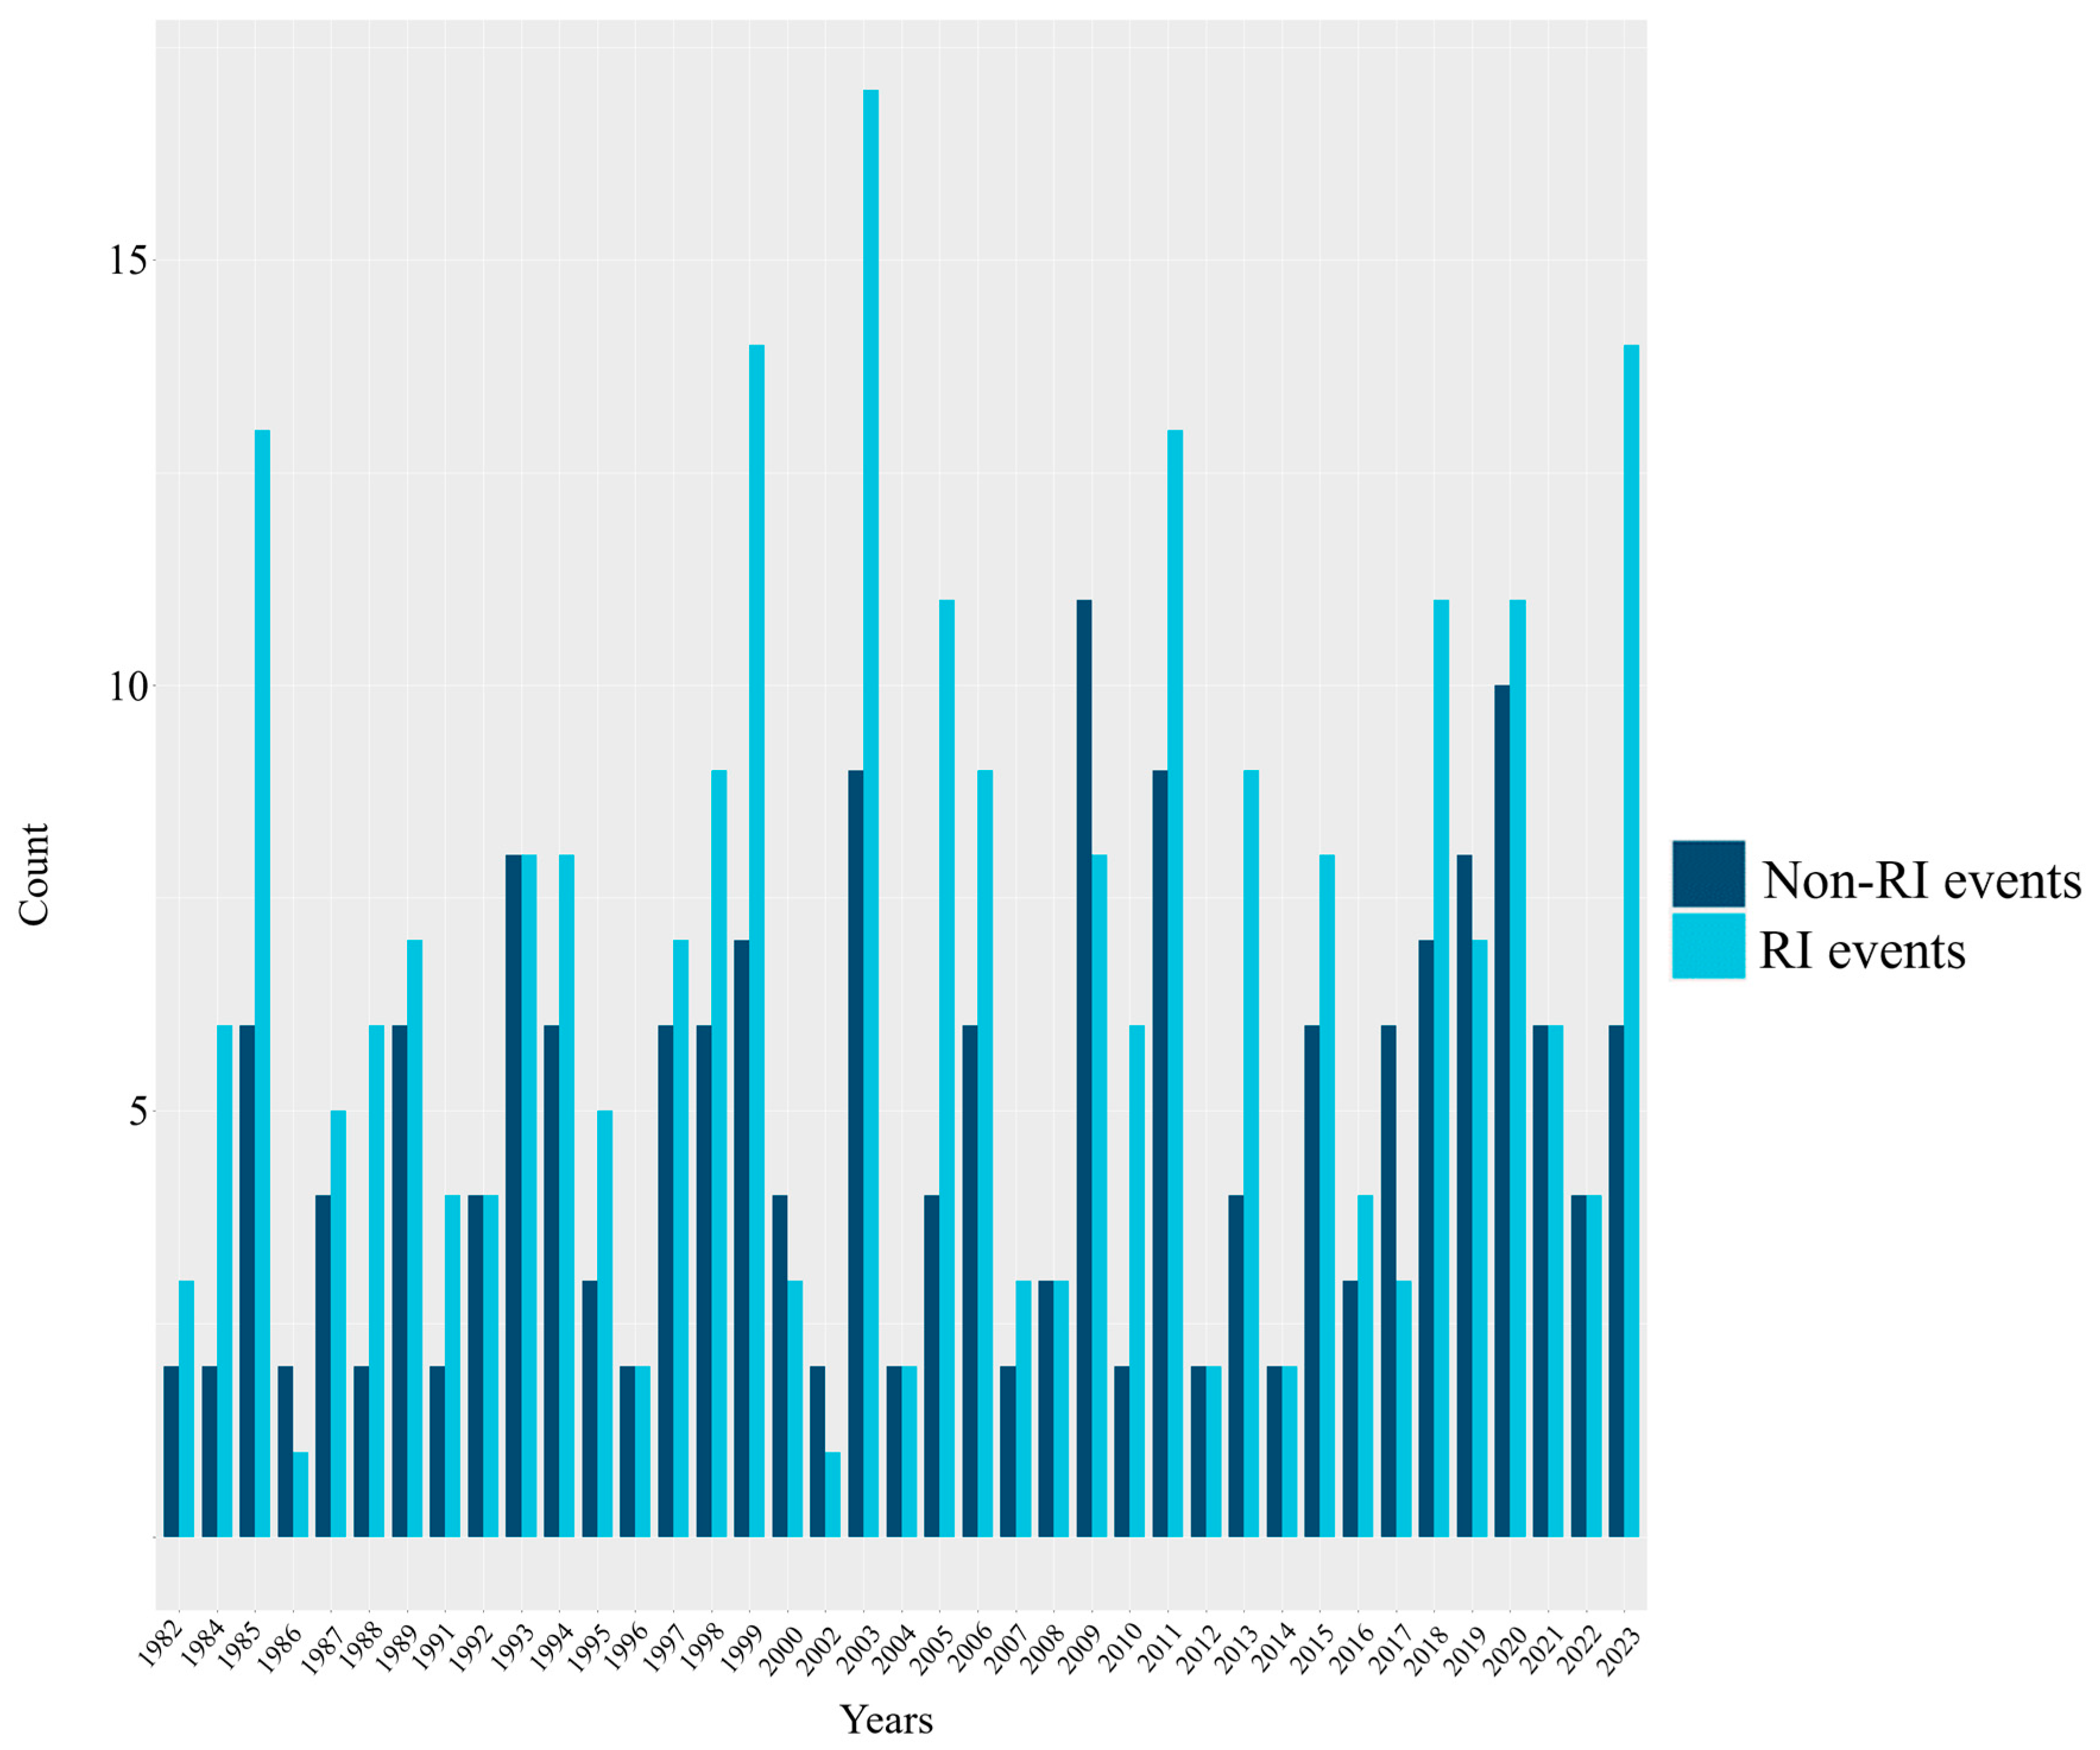
2. Data
3. Methods
3.1. Model Construction
3.2. Feature Importance
3.3. Evaluation Metrics
4. Results and Discussion
4.1. Summary Statistics of Predictors and Target Variables
4.2. Machine Learning Classifiers’ Outcome
4.2.1. Importance of Contributing Variables in Classification Decision
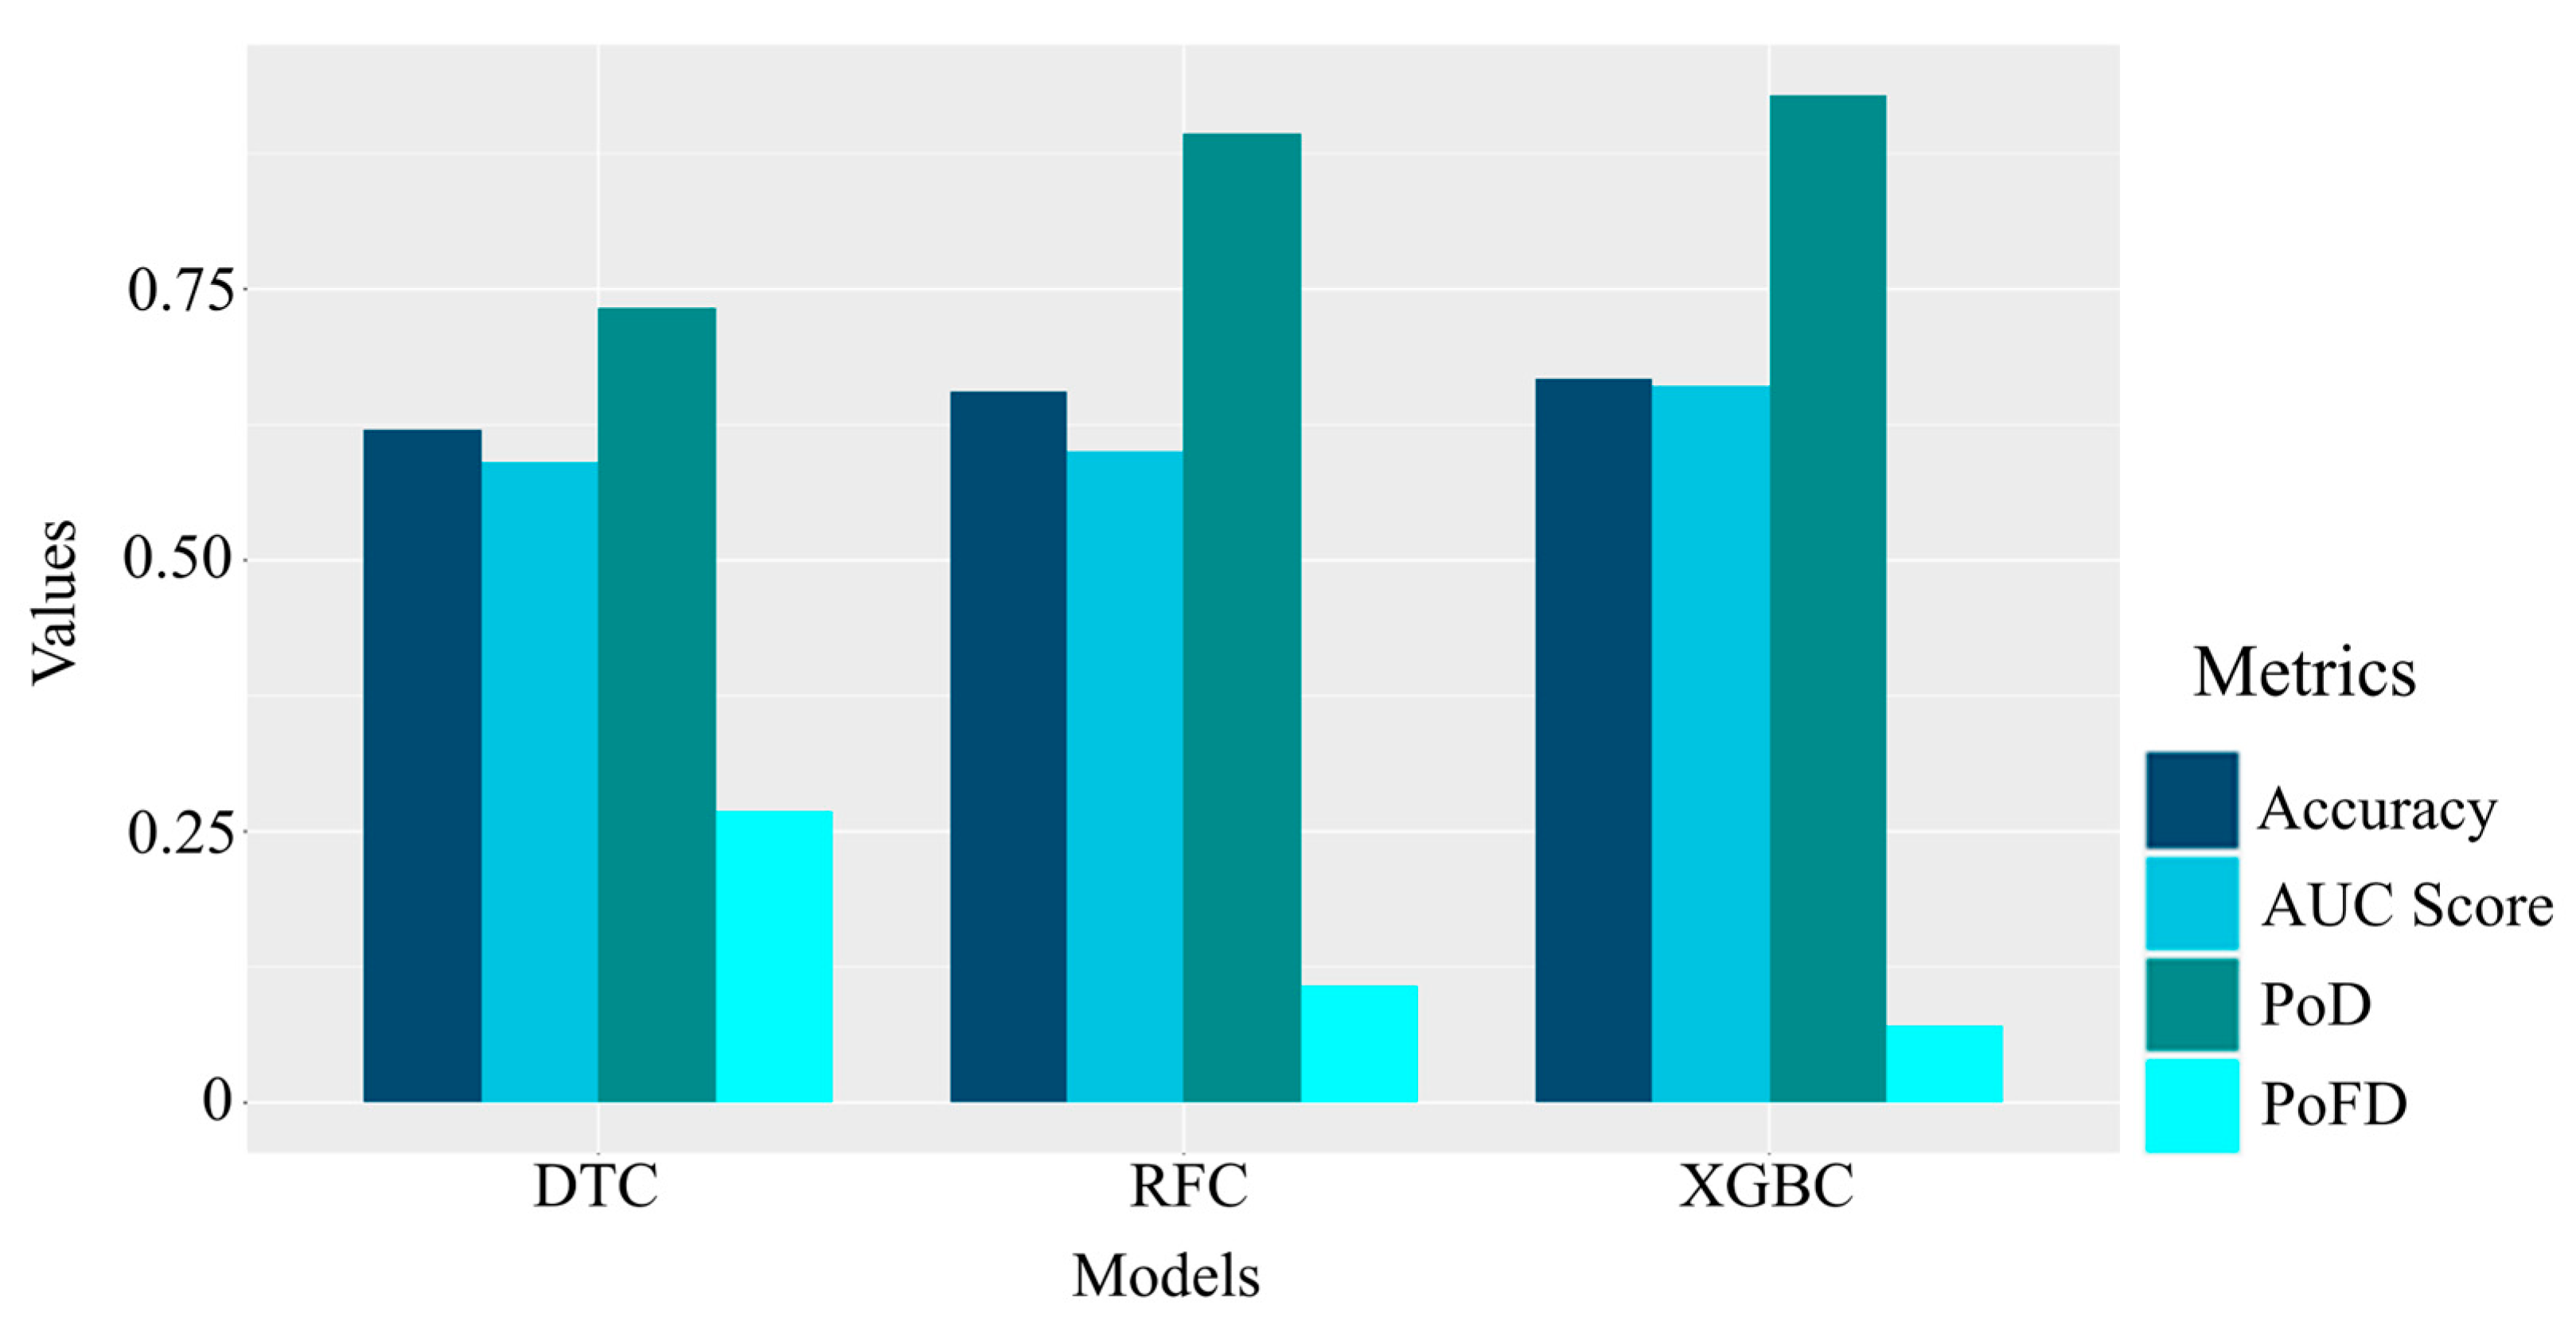
4.2.2. Classification Accuracy
5. Summary and Conclusions
Funding
Institutional Review Board Statement
Informed Consent Statement
Data Availability Statement
Acknowledgments
Conflicts of Interest
References
- Bettencourt, S.; Croad, R.; Freeman, P.; Hay, J.; Jones, R.; King, P.; Lal, P.; Mearns, A.; Miller, G.; Pswarayi-Riddihough, I. Not If but When: Adapting to Natural Hazards in the Pacific Islands Region. World Bank. 2006. Available online: https://openknowledge.worldbank.org/server/api/core/bitstreams/4902f231-fb5d-56b1-a3bb-f77ce1f45bdf/content (accessed on 8 March 2025).
- Terry, J.P.; Mcgree, S.; Raj, R. The exceptional flooding on Vanua Levu Island, Fiji, during tropical cyclone Ami in January 2003. J. Nat. Disaster Sci. 2004, 26, 27–36. [Google Scholar] [CrossRef]
- McInnes, K.; O’Grady, J.; Walsh, K.; Colberg, F. Progress towards quantifying storm surge risk in Fiji due to climate variability and change. J. Coast. Res. 2011, SI 64, 1121–1124. [Google Scholar]
- Brown, P.; Daigneault, A.; Gawith, D. Climate change and the economic impacts of flooding on Fiji. Clim. Dev. 2017, 9, 493–504. [Google Scholar] [CrossRef]
- Cangialosi, J.P.; Blake, E.; DeMaria, M.; Penny, A.; Latto, A.; Rappaport, E.; Tallapragada, V. Recent progress in tropical cyclone intensity forecasting at the National Hurricane Center. Weather. Forecast. 2020, 35, 1913–1922. [Google Scholar] [CrossRef]
- Kaplan, J.; DeMaria, M.; Knaff, J.A. A revised tropical cyclone rapid intensification index for the Atlantic and eastern North Pacific basins. Weather Forecast. 2010, 25, 220–241. [Google Scholar] [CrossRef]
- Elsberry, R.L.; Lambert, T.D.; Boothe, M.A. Accuracy of Atlantic and eastern North Pacific tropical cyclone intensity forecast guidance. Weather Forecast. 2007, 22, 747–762. [Google Scholar] [CrossRef]
- Rappaport, E.N.; Franklin, J.L.; Avila, L.A.; Baig, S.R.; Beven, J.L.; Blake, E.S.; Burr, C.A.; Jiing, J.-G.; Juckins, C.A.; Knabb, R.D. Advances and challenges at the National Hurricane Center. Weather Forecast. 2009, 24, 395–419. [Google Scholar] [CrossRef]
- Kaplan, J.; DeMaria, M. Large-scale characteristics of rapidly intensifying tropical cyclones in the North Atlantic basin. Weather Forecast. 2003, 18, 1093–1108. [Google Scholar] [CrossRef]
- Bhatia, K.; Baker, A.; Yang, W.; Vecchi, G.; Knutson, T.; Murakami, H.; Kossin, J.; Hodges, K.; Dixon, K.; Bronselaer, B. A potential explanation for the global increase in tropical cyclone rapid intensification. Nat. Commun. 2022, 13, 6626. [Google Scholar] [CrossRef]
- Lee, C.-Y.; Tippett, M.K.; Sobel, A.H.; Camargo, S.J. Rapid intensification and the bimodal distribution of tropical cyclone intensity. Nat. Commun. 2016, 7, 10625. [Google Scholar] [CrossRef]
- DeMaria, M.; Mainelli, M.; Shay, L.K.; Knaff, J.A.; Kaplan, J. Further improvements to the statistical hurricane intensity prediction scheme (SHIPS). Weather Forecast. 2005, 20, 531–543. [Google Scholar] [CrossRef]
- DeMaria, M.; Franklin, J.L.; Onderlinde, M.J.; Kaplan, J. Operational forecasting of tropical cyclone rapid intensification at the National Hurricane Center. Atmosphere 2021, 12, 683. [Google Scholar] [CrossRef]
- DeMaria, M. A simplified dynamical system for tropical cyclone intensity prediction. Mon. Weather Rev. 2009, 137, 68–82. [Google Scholar] [CrossRef]
- Wu, L.; Su, H.; Fovell, R.G.; Wang, B.; Shen, J.T.; Kahn, B.H.; Hristova-Veleva, S.M.; Lambrigtsen, B.H.; Fetzer, E.J.; Jiang, J.H. Relationship of environmental relative humidity with North Atlantic tropical cyclone intensity and intensification rate. Geophys. Res. Lett. 2012, 39. [Google Scholar] [CrossRef]
- Kaplan, J.; Rozoff, C.M.; DeMaria, M.; Sampson, C.R.; Kossin, J.P.; Velden, C.S.; Cione, J.J.; Dunion, J.P.; Knaff, J.A.; Zhang, J.A. Evaluating environmental impacts on tropical cyclone rapid intensification predictability utilizing statistical models. Weather Forecast. 2015, 30, 1374–1396. [Google Scholar] [CrossRef]
- Rozoff, C.M.; Kossin, J.P. New probabilistic forecast models for the prediction of tropical cyclone rapid intensification. Weather Forecast. 2011, 26, 677–689. [Google Scholar] [CrossRef]
- Chen, Y.; Gao, S.; Li, X.; Shen, X. Key environmental factors for rapid intensification of the South China Sea tropical cyclones. Front. Earth Sci. 2021, 8, 609727. [Google Scholar] [CrossRef]
- Guo, Y.P.; Tan, Z.M. Influence of different ENSO types on tropical cyclone rapid intensification over the western North Pacific. J. Geophys. Res. Atmos. 2021, 126, e2020JD033059. [Google Scholar] [CrossRef]
- Kang, N.-Y.; Elsner, J.B. Influence of global warming on the rapid intensification of western North Pacific tropical cyclones. Environ. Res. Lett. 2019, 14, 044027. [Google Scholar] [CrossRef]
- Kanada, S.; Wada, A. Numerical study on the extremely rapid intensification of an intense tropical cyclone: Typhoon Ida (1958). J. Atmos. Sci. 2015, 72, 4194–4217. [Google Scholar] [CrossRef]
- Rogers, R. Convective-scale structure and evolution during a high-resolution simulation of tropical cyclone rapid intensification. J. Atmos. Sci. 2010, 67, 44–70. [Google Scholar] [CrossRef]
- Li, X.; Pu, Z. Sensitivity of numerical simulation of early rapid intensification of Hurricane Emily (2005) to cloud microphysical and planetary boundary layer parameterizations. Mon. Weather Rev. 2008, 136, 4819–4838. [Google Scholar] [CrossRef]
- Kieu, C.Q.; Zhang, D.L. An analytical model for the rapid intensification of tropical cyclones. Q. J. R. Meteorol. Soc. 2009, 135, 1336–1349. [Google Scholar] [CrossRef]
- Zhang, L.; Oey, L. Young ocean waves favor the rapid intensification of tropical cyclones—A global observational analysis. Mon. Weather Rev. 2019, 147, 311–328. [Google Scholar] [CrossRef]
- Zeng, Z.; Wang, Y.; Wu, C.-C. Environmental dynamical control of tropical cyclone intensity—An observational study. Mon. Weather Rev. 2007, 135, 38–59. [Google Scholar] [CrossRef]
- Li, Y.; Tang, Y.; Wang, S.; Toumi, R.; Song, X.; Wang, Q. Recent increases in tropical cyclone rapid intensification events in global offshore regions. Nat. Commun. 2023, 14, 5167. [Google Scholar] [CrossRef] [PubMed]
- Bhatia, K.T.; Vecchi, G.A.; Knutson, T.R.; Murakami, H.; Kossin, J.; Dixon, K.W.; Whitlock, C.E. Recent increases in tropical cyclone intensification rates. Nat. Commun. 2019, 10, 635. [Google Scholar] [CrossRef] [PubMed]
- Fischer, M.S.; Tang, B.H.; Corbosiero, K.L. A climatological analysis of tropical cyclone rapid intensification in environments of upper-tropospheric troughs. Mon. Weather Rev. 2019, 147, 3693–3719. [Google Scholar] [CrossRef]
- Yang, R. A systematic classification investigation of rapid intensification of Atlantic tropical cyclones with the SHIPS database. Weather Forecast. 2016, 31, 495–513. [Google Scholar] [CrossRef]
- Mercer, A.; Grimes, A. Atlantic tropical cyclone rapid intensification probabilistic forecasts from an ensemble of machine learning methods. Procedia Comput. Sci. 2017, 114, 333–340. [Google Scholar] [CrossRef]
- Sharma, T.; Mawatwal, M.; Das, S. A Machine Learning Approach for Detecting Rapid Intensification in Tropical Cyclones. J. Indian Soc. Remote Sens. 2025, 1–14. [Google Scholar] [CrossRef]
- Mercer, A.; Grimes, A. Diagnosing tropical cyclone rapid intensification using kernel methods and reanalysis datasets. Procedia Comput. Sci. 2015, 61, 422–427. [Google Scholar] [CrossRef]
- Shaiba, H.; Hahsler, M. An experimental comparison of different classifiers for predicting tropical cyclone rapid intensification events. In Proceedings of the International Conference on Machine Learning, Electrical and Mechanical Engineering (ICMLEME2014), Dubai, United Arab Emirates, 8–9 January 2014. [Google Scholar]
- Leffler, J.W. Feasibility of Using Classification Analyses to Determine Tropical Cyclone Rapid Intensification; Biblioscholar: Columbus, OH, USA, 2004. [Google Scholar]
- Mercer, A.E.; Grimes, A.D.; Wood, K.M. Application of unsupervised learning techniques to identify Atlantic tropical cyclone rapid intensification environments. J. Appl. Meteorol. Climatol. 2021, 60, 119–138. [Google Scholar] [CrossRef]
- Wei, Y.; Yang, R.; Sun, D. Investigating tropical cyclone rapid intensification with an advanced artificial intelligence system and gridded reanalysis data. Atmosphere 2023, 14, 195. [Google Scholar] [CrossRef]
- Griffin, S.M.; Wimmers, A.; Velden, C.S. Predicting rapid intensification in North Atlantic and eastern North Pacific tropical cyclones using a convolutional neural network. Weather Forecast. 2022, 37, 1333–1355. [Google Scholar] [CrossRef]
- Wei, Y. An Advanced Artificial Intelligence System for Investigating the Tropical Cyclone Rapid Intensification. Ph.D. Thesis, George Mason University, Fairfax, VA, USA, 2020. [Google Scholar]
- Chen, B.F.; Kuo, Y.T.; Huang, T.S. A deep learning ensemble approach for predicting tropical cyclone rapid intensification. Atmos. Sci. Lett. 2023, 24, e1151. [Google Scholar] [CrossRef]
- Barnett, J. Adapting to climate change in Pacific Island countries: The problem of uncertainty. World Dev. 2001, 29, 977–993. [Google Scholar] [CrossRef]
- Connell, J. Islands at Risk?: Environments, Economies and Contemporary Change; Edward Elgar Publishing: Cheltenham, UK, 2013. [Google Scholar]
- McKenzie, E.; Prasad, B.C.; Kaloumaira, A. Economic Impact of Natural Disasters on Development in the Pacific; Pacific Islands Applied Geoscience Commission (SOPAC): Suva, Fiji, 2005. [Google Scholar]
- Mimura, N. Vulnerability of island countries in the South Pacific to sea level rise and climate change. Clim. Res. 1999, 12, 137–143. [Google Scholar] [CrossRef]
- Prescott, V. A Geography of Islands: Small Island Insularity; Taylor & Francis: Abingdon, UK, 2003. [Google Scholar] [CrossRef]
- Mataki, M.; Koshy, K.; Nair, V. Implementing Climate Change Adaptation in the Pacific Islands: Adapting to Present Climate Variability and Extreme Weather Events in Navua (Fiji). Assessments of Impacts and Adaptations to Climate Change (AIACC), FL, USA, 2006. Available online: https://unfccc.int/files/adaptation/methodologies_for/vulnerability_and_adaptation/application/pdf/assessments_of_impacts_and_adaptations_to_climate_change_in_multiple_regions_and_sectors__aiacc_.pdf (accessed on 8 March 2025).
- McBride, J.; Keenan, T. Climatology of tropical cyclone genesis in the Australian region. J. Climatol. 1982, 2, 13–33. [Google Scholar] [CrossRef]
- Lajoie, F.; Walsh, K. A diagnostic study of the intensity of three tropical cyclones in the Australian region. Part I: A synopsis of observed features of Tropical Cyclone Kathy (1984). Mon. Weather Rev. 2010, 138, 3–21. [Google Scholar] [CrossRef]
- Diamond, H. A Climatological Study of Tropical Cyclones in the Southwest Pacific Ocean Basin. Ph.D. Thesis, University of Auckland, Auckland, New Zealand, 2014. [Google Scholar]
- Knapp, K.R.; Kruk, M.C.; Levinson, D.H.; Diamond, H.J.; Neumann, C.J. The international best track archive for climate stewardship (IBTrACS) unifying tropical cyclone data. Bull. Am. Meteorol. Soc. 2010, 91, 363–376. [Google Scholar] [CrossRef]
- Ramsay, H.; Richman, M.; Leslie, L. The modulating influence of Indian Ocean Sea surface temperatures on Australian region seasonal tropical cyclone counts. J. Clim. 2017, 30, 4843–4856. [Google Scholar] [CrossRef]
- Hagen, A.B.; Strahan-Sakoskie, D.; Luckett, C. A reanalysis of the 1944–53 Atlantic hurricane seasons—The first decade of aircraft reconnaissance. J. Clim. 2012, 25, 4441–4460. [Google Scholar] [CrossRef]
- Kanamitsu, M.; Ebisuzaki, W.; Woollen, J.; Yang, S.-K.; Hnilo, J.; Fiorino, M.; Potter, G. Ncep–doe amip-ii reanalysis (r-2). Bull. Am. Meteorol. Soc. 2002, 83, 1631–1644. [Google Scholar] [CrossRef]
- Huang, B.; Thorne, P.W.; Banzon, V.F.; Boyer, T.; Chepurin, G.; Lawrimore, J.H.; Menne, M.J.; Smith, T.M.; Vose, R.S.; Zhang, H.-M. Extended reconstructed sea surface temperature, version 5 (ERSSTv5): Upgrades, validations, and intercomparisons. J. Clim. 2017, 30, 8179–8205. [Google Scholar] [CrossRef]
- Harrell, F.E., Jr.; Harrell, M.F.E., Jr. Package ‘hmisc’. CRAN2018 2019, 2019, 235–236. [Google Scholar]
- Haberlie, A.M.; Ashley, W.S. A method for identifying midlatitude mesoscale convective systems in radar mosaics. Part I: Segmentation and classification. J. Appl. Meteorol. Climatol. 2018, 57, 1575–1598. [Google Scholar] [CrossRef]
- Palamakumbure, D.; Flentje, P.; Stirling, D. Consideration of optimal pixel resolution in deriving landslide susceptibility zoning within the Sydney Basin, New South Wales, Australia. Comput. Geosci. 2015, 82, 13–22. [Google Scholar] [CrossRef]
- Breiman, L.; Friedman, J.; Olshen, R.A.; Stone, C.J. Classification and Regression Trees; Routledge: London, UK, 2017. [Google Scholar]
- Bhowmick, R.; Trepanier, J.C.; Haberlie, A.M. Southwest Pacific tropical cyclone development classification utilizing machine learning and synoptic composites. Int. J. Climatol. 2021, 42, 4187. [Google Scholar] [CrossRef]
- Breiman, L. Random forests. Mach. Learn. 2001, 45, 5–32. [Google Scholar] [CrossRef]
- Nachappa, T.G.; Piralilou, S.T.; Gholamnia, K.; Ghorbanzadeh, O.; Rahmati, O.; Blaschke, T. Flood susceptibility mapping with machine learning, multi-criteria decision analysis and ensemble using Dempster Shafer Theory. J. Hydrol. 2020, 590, 125275. [Google Scholar] [CrossRef]
- Akinci, H.; Zeybek, M. Comparing classical statistic and machine learning models in landslide susceptibility mapping in Ardanuc (Artvin), Turkey. Nat. Hazards 2021, 108, 1515–1543. [Google Scholar] [CrossRef]
- Liu, Q.; Tang, A.; Huang, Z.; Sun, L.; Han, X. Discussion on the tree-based machine learning model in the study of landslide susceptibility. Nat. Hazards 2022, 113, 887–911. [Google Scholar] [CrossRef]
- Yang, W.; Huang, X.; Fei, J.; Ding, J.; Cheng, X. Applying weighted salinity stratification to rapid intensification prediction of tropical cyclone with machine learning. Earth Space Sci. 2024, 11, e2023EA002932. [Google Scholar] [CrossRef]
- Carmona, P.; Dwekat, A.; Mardawi, Z. No more black boxes! Explaining the predictions of a machine learning XGBoost classifier algorithm in business failure. Res. Int. Bus. Financ. 2022, 61, 101649. [Google Scholar] [CrossRef]
- Wei, Y.; Yang, R.; Kinser, J.; Griva, I.; Gkountouna, O. An advanced artificial intelligence system for identifying the near-core impact features to tropical cyclone rapid intensification from the ERA-Interim data. Atmosphere 2022, 13, 643. [Google Scholar] [CrossRef]
- Wei, Y.; Yang, R. An advanced artificial intelligence system for investigating tropical cyclone rapid intensification with the SHIPS database. Atmosphere 2021, 12, 484. [Google Scholar] [CrossRef]
- Radfar, S.; Foroumandi, E.; Moftakhari, H.; Moradkhani, H.; Foltz, G.R.; Sen Gupta, A. Global predictability of marine heatwave induced rapid intensification of tropical cyclones. Earth’s Future 2024, 12, e2024EF004935. [Google Scholar] [CrossRef]
- Rodriguez-Galiano, V.F.; Ghimire, B.; Rogan, J.; Chica-Olmo, M.; Rigol-Sanchez, J.P. An assessment of the effectiveness of a random forest classifier for land-cover classification. ISPRS J. Photogramm. Remote Sens. 2012, 67, 93–104. [Google Scholar] [CrossRef]
- Menze, B.H.; Kelm, B.M.; Masuch, R.; Himmelreich, U.; Bachert, P.; Petrich, W.; Hamprecht, F.A. A comparison of random forest and its Gini importance with standard chemometric methods for the feature selection and classification of spectral data. BMC Bioinform. 2009, 10, 213. [Google Scholar] [CrossRef]
- Han, H.; Guo, X.; Yu, H. Variable selection using mean decrease accuracy and mean decrease gini based on random forest. In Proceedings of the 2016 7th IEEE International Conference on Software Engineering and Service Science (ICSESS), Beijing, China, 26–28 August 2016; pp. 219–224. [Google Scholar]
- Han, H.; Lee, S.; Im, J.; Kim, M.; Lee, M.-I.; Ahn, M.H.; Chung, S.-R. Detection of convective initiation using Meteorological Imager onboard Communication, Ocean, and Meteorological Satellite based on machine learning approaches. Remote Sens. 2015, 7, 9184–9204. [Google Scholar] [CrossRef]
- Matsuoka, D.; Nakano, M.; Sugiyama, D.; Uchida, S. Deep learning approach for detecting tropical cyclones and their precursors in the simulation by a cloud-resolving global nonhydrostatic atmospheric model. Prog. Earth Planet. Sci. 2018, 5, 80. [Google Scholar] [CrossRef]
- Lalkhen, A.G.; McCluskey, A. Clinical tests: Sensitivity and specificity. Contin. Educ. Anaesth. Crit. Care Pain 2008, 8, 221–223. [Google Scholar] [CrossRef]
- Zheng, A. Evaluating Machine Learning Models; A Beginner’s Guide to Key Concepts and Pitfalls; O’Reilly Media, Inc.: Sebastopol, CA, USA, 2015. [Google Scholar]
- Dare, R.A.; Davidson, N.E. Characteristics of tropical cyclones in the Australian region. Mon. Weather Rev. 2004, 132, 3049–3065. [Google Scholar] [CrossRef]
- Diamond, H.J.; Lorrey, A.M.; Renwick, J.A. A southwest Pacific tropical cyclone climatology and linkages to the El Niño–Southern Oscillation. J. Clim. 2013, 26, 3–25. [Google Scholar] [CrossRef]
- Maru, E.; Ito, K.; Yamada, H. Analysis of Tropical Cyclone Rapid Intensification in the Southwest Pacific Region. Weather. Mag. 2025, 103, 201–218. [Google Scholar] [CrossRef]
- Brown, J.R.; Lengaigne, M.; Lintner, B.R.; Widlansky, M.J.; van Der Wiel, K.; Dutheil, C.; Linsley, B.K.; Matthews, A.J.; Renwick, J. South Pacific Convergence Zone dynamics, variability and impacts in a changing climate. Nat. Rev. Earth Environ. 2020, 1, 530–543. [Google Scholar] [CrossRef]
- Potter, H.; DiMarco, S.F.; Knap, A.H. Tropical cyclone heat potential and the rapid intensification of Hurricane Harvey in the Texas Bight. J. Geophys. Res. Ocean. 2019, 124, 2440–2451. [Google Scholar] [CrossRef]
- Bhowmick, R.; Trepanier, J.C.; Haberlie, A.M. Classification analysis of southwest Pacific tropical cyclone intensity changes prior to landfall. Atmosphere 2023, 14, 253. [Google Scholar] [CrossRef]
- Pelling, M.; Uitto, J.I. Small Island developing states: Natural disaster vulnerability and global change. Glob. Environ. Chang. Part B Environ. Hazards 2001, 3, 49–62. [Google Scholar] [CrossRef]


| Variables | Spatial Resolution | Source |
|---|---|---|
| Longitude | Point | SPEArTC |
| Latitude | Point | SPEArTC |
| Initial intensity | Point | SPEArTC |
| Longitude_Initial intensity | Point | SPEArTC |
| Latitude_Initial intensity | Point | SPEArTC |
| SST | 2.5° × 2.5° | NOAA ERSST |
| Rhum 850 hPa | 2.5° × 2.5° | NCEP/DOE Reanalysis 2 |
| Vshear | 2.5° × 2.5° | NCEP/DOE Reanalysis 2 |
| Ushear | 2.5° × 2.5° | NCEP/DOE Reanalysis 2 |
| Prediction | |||
|---|---|---|---|
| Non-RI (0) | RI (1) | ||
| Actual | Non-RI (0) | True negative (TN) | False positive (FP) |
| RI (1) | False negative (FN) | True positive (TP) | |
| Latitude | Longitude | SST | Rhum_850 | Ushear | Vshear | Initial Intensity | Latitude Initial Intensity | Longitude Initial Intensity | |
|---|---|---|---|---|---|---|---|---|---|
| Latitude | 1 | 6 × 10⁻⁸ | 0 | 2 × 10⁻⁸ | 2 × 10⁻¹⁵ | 0 | 0.01 | 0 | 0.01 |
| Longitude | 6 × 10⁻⁸ | 1 | 0 | 1 × 10⁻⁵ | 4 × 10⁻³ | 0 | 0.16 | 0.09 | 0 |
| SST | 0 × 10−0 | 0 | 1 | 9 × 10⁻⁷ | 1 × 10⁻¹⁰ | 0.29 | 0.63 | 0 | 0.04 |
| Rhum_850 | 2 × 10⁻⁸ | 0 | 9 × 10⁻⁷ | 1 | 7 × 10⁻² | 0.11 | 0 | 0.9 | 0.13 |
| Ushear | 2 × 10⁻¹⁵ | 0 | 1 × 10⁻¹⁰ | 0.07 | 1 | 0.17 | 0.12 | 0.01 | 0.43 |
| Vshear | 6 × 10⁻³ | 0 | 3 × 10⁻¹ | 0.11 | 0.17 | 1 | 0.83 | 0.5 | 0.03 |
| Initial Intensity | 1 × 10⁻² | 0.16 | 6 × 10⁻¹ | 0 | 0.12 | 0.83 | 1 | 0.11 | 0.79 |
| Latitude Initial intensity | 0 × 10−0 | 0.09 | 4 × 10⁻¹¹ | 0.9 | 0.01 | 0.5 | 0.11 | 1 | 0.09 |
| Longitude Initial intensity | 9 × 10⁻³ | 0 | 4 × 10⁻² | 0.13 | 0.43 | 0.03 | 0.79 | 0.09 | 1 |
| Prediction | |||
|---|---|---|---|
| Non-RI (0) | RI (1) | ||
| Actual | Non-RI (0) | 13 | 18 |
| RI (1) | 15 | 41 | |
| Prediction | |||
|---|---|---|---|
| Non-RI (0) | RI (1) | ||
| Actual | Non-RI (0) | 7 | 24 |
| RI (1) | 6 | 50 | |
| Prediction | |||
|---|---|---|---|
| Non-RI (0) | RI (1) | ||
| Actual | Non-RI (0) | 6 | 25 |
| RI (1) | 4 | 52 | |
Disclaimer/Publisher’s Note: The statements, opinions and data contained in all publications are solely those of the individual author(s) and contributor(s) and not of MDPI and/or the editor(s). MDPI and/or the editor(s) disclaim responsibility for any injury to people or property resulting from any ideas, methods, instructions or products referred to in the content. |
© 2025 by the author. Licensee MDPI, Basel, Switzerland. This article is an open access article distributed under the terms and conditions of the Creative Commons Attribution (CC BY) license (https://creativecommons.org/licenses/by/4.0/).
Share and Cite
Bhowmick, R. Southwest Pacific Tropical Cyclone Rapid Intensification Classification Utilizing Machine Learning. Atmosphere 2025, 16, 456. https://doi.org/10.3390/atmos16040456
Bhowmick R. Southwest Pacific Tropical Cyclone Rapid Intensification Classification Utilizing Machine Learning. Atmosphere. 2025; 16(4):456. https://doi.org/10.3390/atmos16040456
Chicago/Turabian StyleBhowmick, Rupsa. 2025. "Southwest Pacific Tropical Cyclone Rapid Intensification Classification Utilizing Machine Learning" Atmosphere 16, no. 4: 456. https://doi.org/10.3390/atmos16040456
APA StyleBhowmick, R. (2025). Southwest Pacific Tropical Cyclone Rapid Intensification Classification Utilizing Machine Learning. Atmosphere, 16(4), 456. https://doi.org/10.3390/atmos16040456